1. Introduction
The fracture shape has a big impact on the seepage rules, oil well production, and waterflooding effect of the reservoirs [
1,
2,
3,
4], and the previous research shows that the shape characteristics of fracturing cracks of oil layers at different depths are complicated [
3,
5,
6,
7,
8]. It is generally believed that most reservoirs at a depth of 600 m have horizontal fractures, most reservoirs at a depth of 600–1200 m have complicated fractures, and reservoirs at a depth of 1000 m and more mainly have vertical fractures. At present, most reservoirs are still dominated by vertical fractures [
9].
Most of the studies in the literature mainly focused on seepage rules and numerical simulation for waterflooding in low-permeability shallow oil reservoirs with horizontal fractures [
10,
11,
12,
13]. Wang et al. [
14] researched the mechanical simulation of oil displacement in horizontal fractured reservoirs. Gao et al. [
15] studied the influencing factors and revealed the mechanism of spontaneous imbibition in the gas/oil recovery from tight reservoirs with horizontal fractures. Meng and Cai [
16] researched various boundary conditions of spontaneous imbibition, which have important effects on the imbibition rate and efficiency. Wang et al. [
17] studied the moderate water-injection technique based on the double effects of the imbibition-displacement mechanism, and the water injection development effect for the ultra-low-permeability fractured reservoirs can be improved significantly. Ghasemi et al. [
18] inferred a new scaling equation for the imbibition process in naturally fractured gas reservoirs with horizontal fractures. Babadagli and Zeidani [
19] deduced the matrix-fracture dual-media interaction equation of spontaneous imbibition in different rocks and fluids in shallow reservoirs. Arihara [
20] studied the flow process of matrix fracture in shallow oil reservoirs. Liu et al. [
21] researched the propagation law of hydraulic fractures during multi-staged horizontal well fracturing in a tight reservoir. Wang et al. [
22] inferred an efficient model for nonlinear two-phase flow in fractured low-permeability reservoirs. Vodorezov [
23] studied the estimation of horizontal-well productivity loss caused by formation damage on the basis of numerical modeling. Wang et al. [
24] developed an integrated workflow to optimize the drilling and completion parameters of horizontal wells by incorporating productivity prediction and economic evaluation. Fan et al. [
25] established a new model and developed a software module that describes the dynamic changes of fracture shape and properties based on abundant data of low permeability oilfields.
There are many problems in the waterflood development of ultra-low permeability shallow oil reservoirs, including low formation pressure and oil production, the rapid increase of water cut, and the pressure of the water well approaching fracture pressure [
26,
27,
28,
29]. Previous studies about waterflooding in horizontal fracturing cracks mainly focused on seepage rules and numerical simulation, and most of the results were obtained using performance analysis of reservoir and under ideal conditions [
30,
31,
32,
33]. However, few studies and methods discussed the waterflooding effect of horizontal fractures, water flooding and channeling rules, and optimization of waterflooding parameters. In this work, according to the waterflooding characteristics of the ultra-low permeability shallow oil reservoirs with horizontal fractures, the distribution properties and spread rules of horizontal fractures were studied, the flooding rules of oil wells with horizontal fractures were revealed, and the development mode of waterflooding at the bottom was proposed. On this basis, through nuclear magnetic resonance (NMR) online test and core flow displacement experiment, combined with numerical simulation of reservoirs, field tracer test, and other comprehensive methods, the heterogeneity of reservoirs and the limit of waterflooding parameters were optimized. The reasonable limit of waterflooding parameters was obtained. After field practice, the effect of waterflooding, oil production increase, and water lowering in the test well group were significantly improved.
2. Study Area
The study area of Yanchang Eastern Oilfield is located in the east part of the Yishan Ramp of Ordos Basin (
Figure 1). Ordos Basin is the most important energy base in China. Its annual output has been ranking first in the country’s oil and gas producing basins for many years. It plays a pivotal role in national energy security, in which Yanchang Eastern Oilfield plays an important role. Up to now, the geological oil reserves in use are 9.64 × 10
8 t, accounting for 40.5% of the produced reserves of Yanchang Oilfield, which is an important cornerstone for the sustainable and stable production of ten million tons of Yanchang Oilfield. The Yanchang Eastern Oilfield has been exploited for more than 30 years, and the remaining available reserves are small. The pressure for the oil field to maintain stable production is great.
The main target layer of the study area is the Chang 6 oil layer in the Yanchang Formation of the Triassic system. This kind of oil reservoir features a small, buried depth—the average depth of the oil reservoir of 670 m, poor physical properties-the average porosity of 7–9% and average permeability of about 0.3–0.5 mD, and relatively small pressure on the overlying vertical formation. In the process of fracturing, the artificial fractures extend along the horizontal bedding surface and the horizontal fracture system is relatively developed so that the oilfield development has the following characteristics: (1) the single well productivity is very low; (2) the output of depletion development decreases sharply with small recovery percent; (3) the reservoir is seriously heterogeneous. The permeability contrast of the Chang 6 oil layer is 112, the rush coefficient is 5.8, the coefficient of variation is 0.82, and there is a big difference in horizontal/vertical permeability. In the process of waterflooding, because of the existence of horizontal fracturing cracks, the oil wells may be flooded quickly in a short time, and the flooding is multidirectional and continuous. This leads to difficulty in governance and effective supplementation of formation energy. The average oil production of a single well is only 0.16 t, the comprehensive water cut is 72%, and a lot of crude oil (the remaining oil saturation is about 75%) is retained in the formation and cannot be effectively mobilized on a large scale.
3. Study Methodology
3.1. Seepage Characteristics of Horizontal Fractures
As shown in
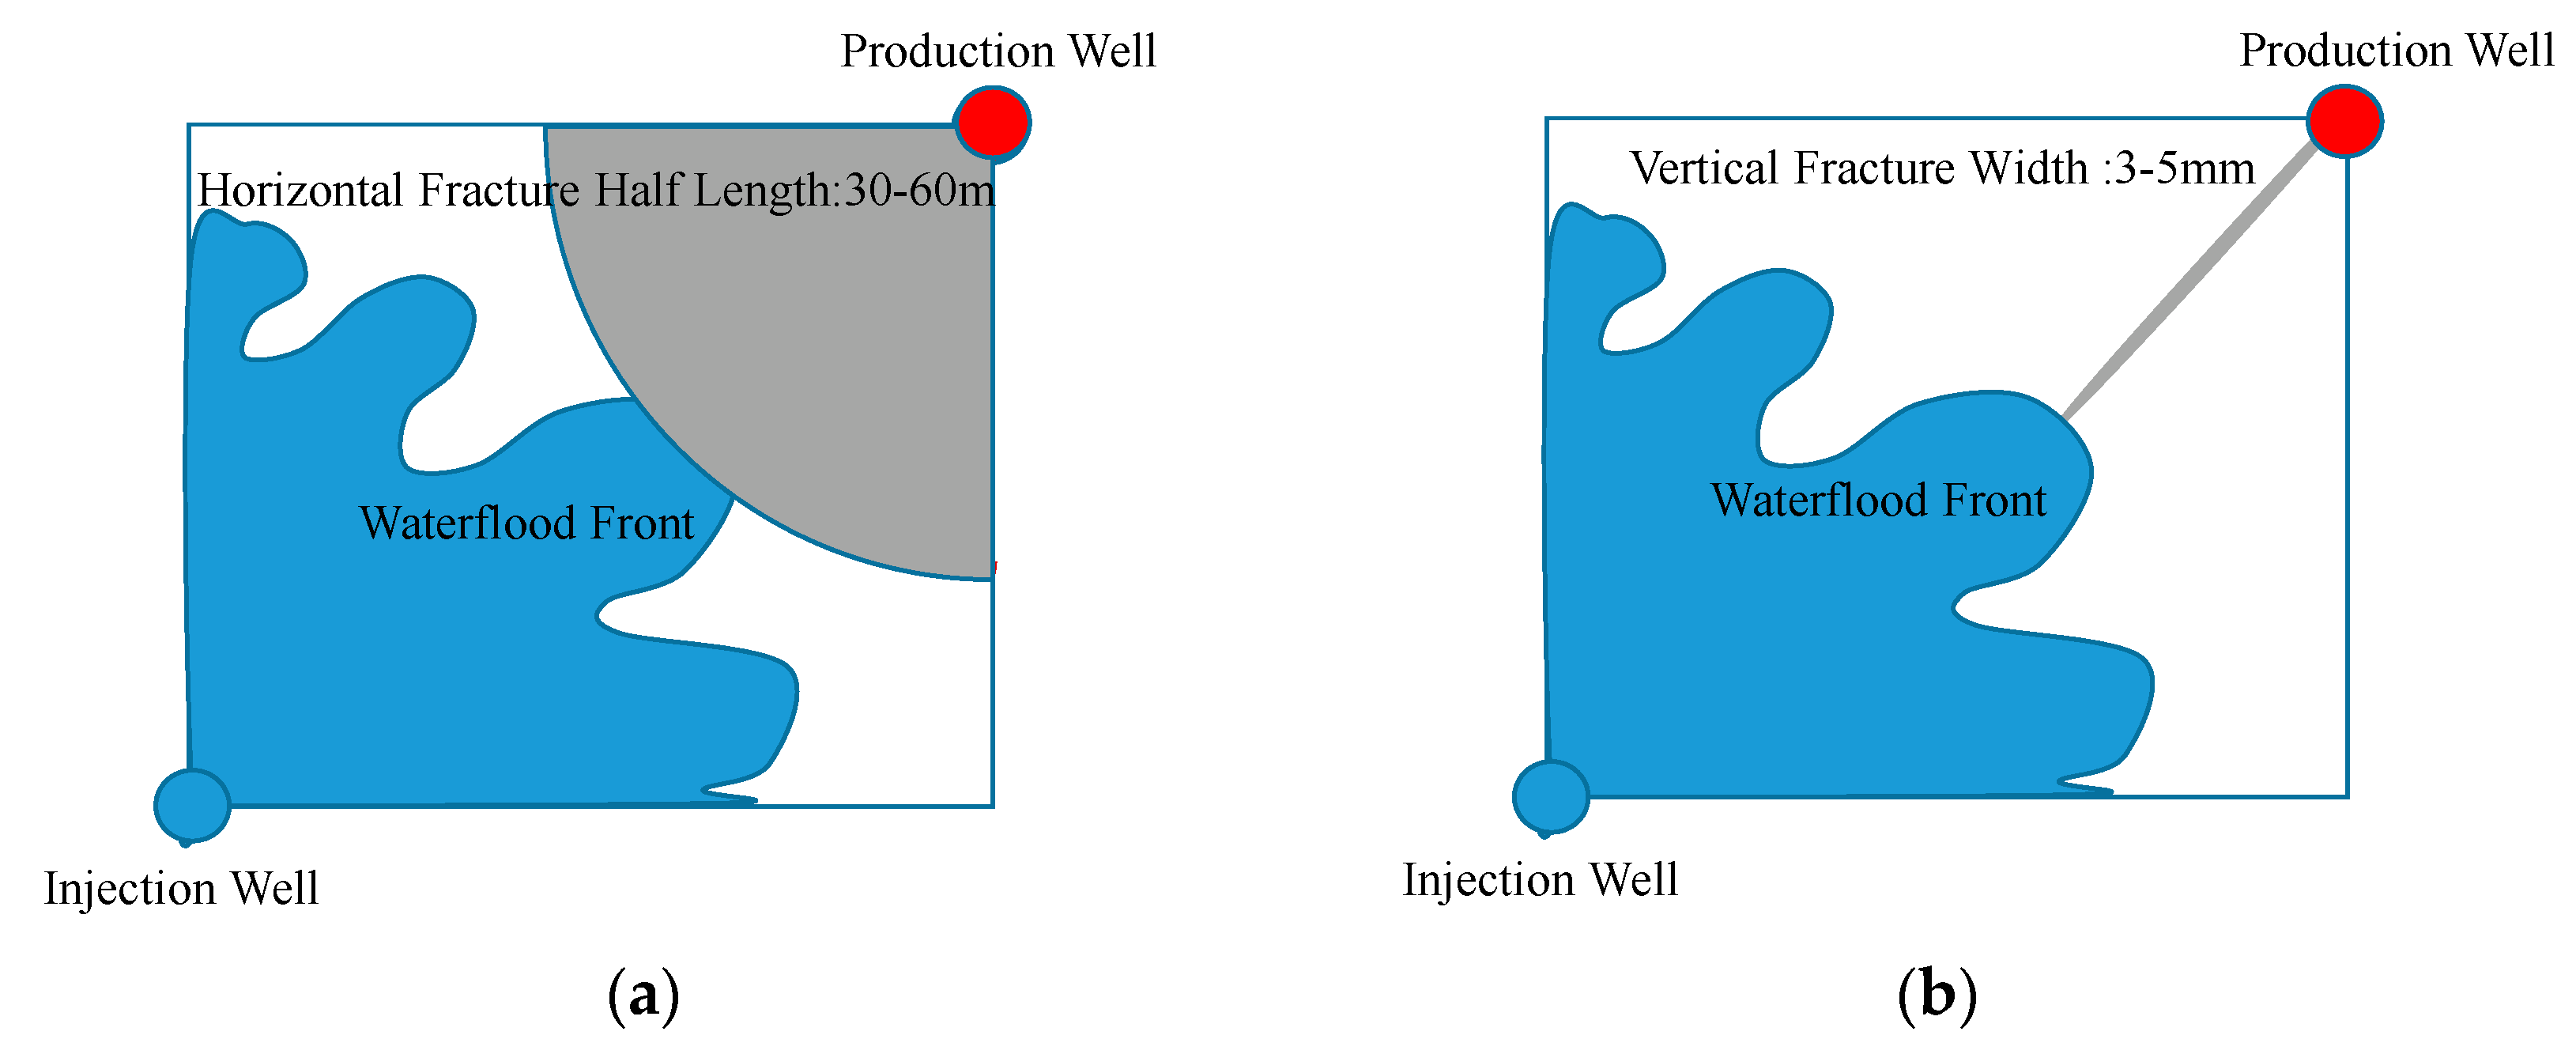
Figure 2, in the early stage of the development of the oil reservoir with horizontal fractures, the oil is mainly displaced by natural energy without water channeling in the oil well. The formation pressure is higher than the opening pressure of the oil well fractures, which is mainly manifested as the vertical flow of formation fluid to the horizontal fracturing cracks and the radial flow of fluid in the horizontal fracturing cracks to the wellbore. During waterflooding, the formation energy is supplemented by water injection, fluid flows from the middle part of the reservoir to the wellbore and fractures, and the fluid in the reservoir constantly flows to the fracture so that the fracture pressure of the oil well continuously increases. When the fracture pressure is higher than the formation pressure, the advancement speed of the waterflood front increases. Because the probability of the contact of the waterflood front (i.e., high-permeability channel) of the waterflooding well with the horizontal fracture is much bigger than that with the vertical fracture (
Figure 3), the contact of the waterflood front with the horizontal fracture will result in a faster breakthrough and the former may have water channeling more easily than the later, and it is difficult to manage them by water shut-off, profile control or other measures. According to the statistical rules of the study area, it is found that the water breakthrough time of the oil well is positively correlated with the responding time (
Figure 4). The horizontal fracture reduces the responding time of the oil well and accelerates the breakthrough and flooding of the oil well.
3.2. Bottom Waterflooding Mode
3.2.1. Waterflooding Mechanism
The waterflooding at the bottom means that the bottom of the oil layer in the water injection well is perforated as well as fractured and the upper part of the layer of the corresponding oil well is also perforated, as well as fractured in the same single layer, thereby forming horizontal cracks. The bottom of the oil layer of the corresponding oil well is only perforated without fracturing, enhanced waterflooding 3–5 times of the conventional waterflooding is completed in the bottom of the water injection well, and artificial bottom water with certain energy is formed at the bottom of the oil layer in a short time. On this basis, gravitational differentiation and capillary force are employed to replace and displace the crude oil retained in the microscopic pores (the mechanism of increase in oil production and water lowering is shown in
Figure 5). This waterflooding method can effectively supplement the formation energy, slow down the rapid rush of injected water along with the horizontal fractures, increase the volume affected by injected water and utilization rate, reduce the water cut increasing rate, and maintain the stable production of the oilfield for a long time. As shown in
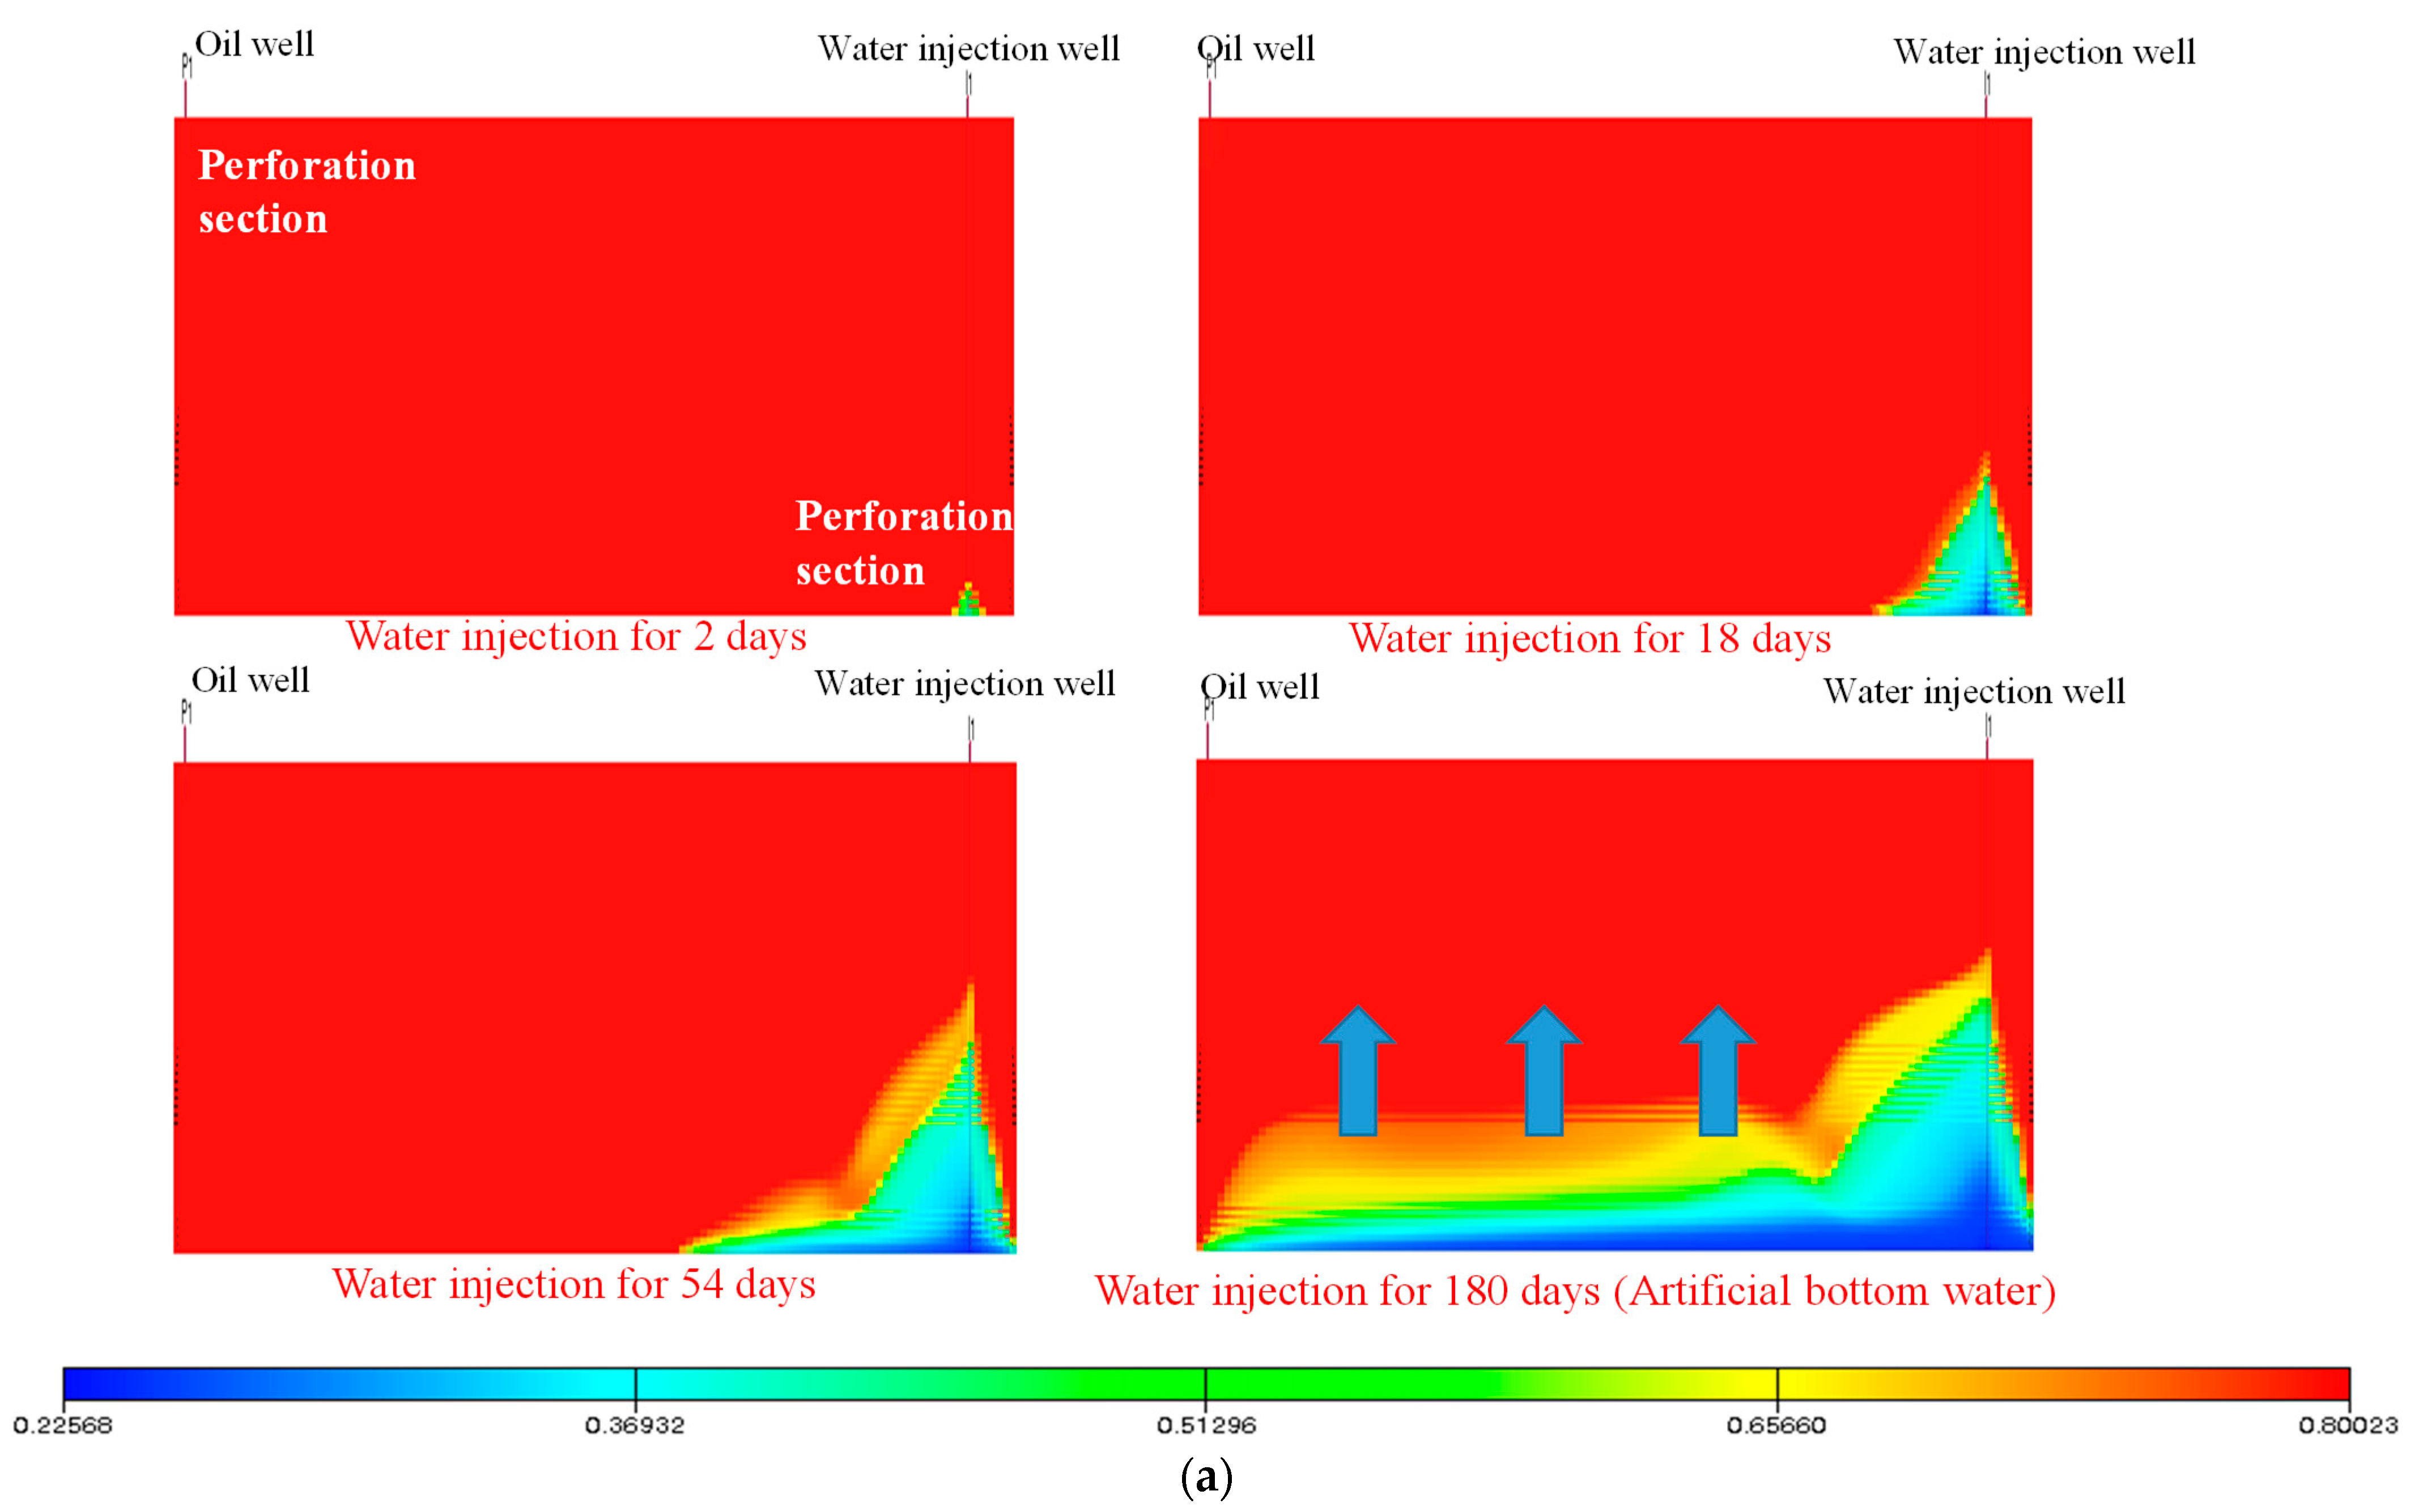
Figure 5, the model of the waterflooding mechanism at the bottom is established with the numerical simulation software (Eclipse). According to the actual conductivity and size of the fracture, the permeability of the fracture is calculated to be 1000 mD, and the horizontal fracture is approximately characterized by the equivalent permeability method. The model sets one horizontal fracture at the bottom of the water injection well, with initial permeability of 1000 mD and matrix permeability of 0.65 mD. It can be seen from the saturation field in
Figure 6a that there are obvious changes around the horizontal fracture at the bottom of the water injection well. The model parameters are as follows: the initial permeability of the fracture 1000 mD, the permeability of the matrix 0.65 mD, the porosity 12%, the initial oil saturation 65%, the viscosity of oil and water 4.5 mPa·s and 0.6 mPa·s, respectively, the temperature of the oil reservoir 42.5 °C, the original formation pressure of the oil reservoir 3.6 MPa, the well spacing 120 m, the daily waterflooding volume of the water injection well 10 m
3/d, the half-length of the horizontal fracture 50 m, with the fracture treated by equivalent seepage. It can be seen from the oil saturation, pressure distribution, and development indicators that artificial bottom water with a certain scale is formed at the bottom of the oil layer after 180 days of waterflooding, the formation pressure has increased significantly, and the final water cut of the oil well is much lower than that of conventional waterflooding, and the recovery degree is 2.2% higher than that of conventional waterflooding (
Figure 7).
3.2.2. Impact of Reservoir Heterogeneity
In the process of oilfield waterflooding, permeability is regarded as the concentrated expression of heterogeneity. The anisotropy and space distribution characteristics of permeability act as the key factors that determine the oil recovery, which reveals the essence of reservoir heterogeneity. The parameters of variation coefficient of permeability, permeability rush coefficient (means the ratio of the maximum permeability in the selected well section or single sand layer to its average value), and permeability contrast were used to comprehensively characterize the layers with or without water channeling, which provide a basis for waterflooding at the bottom and layer selection.
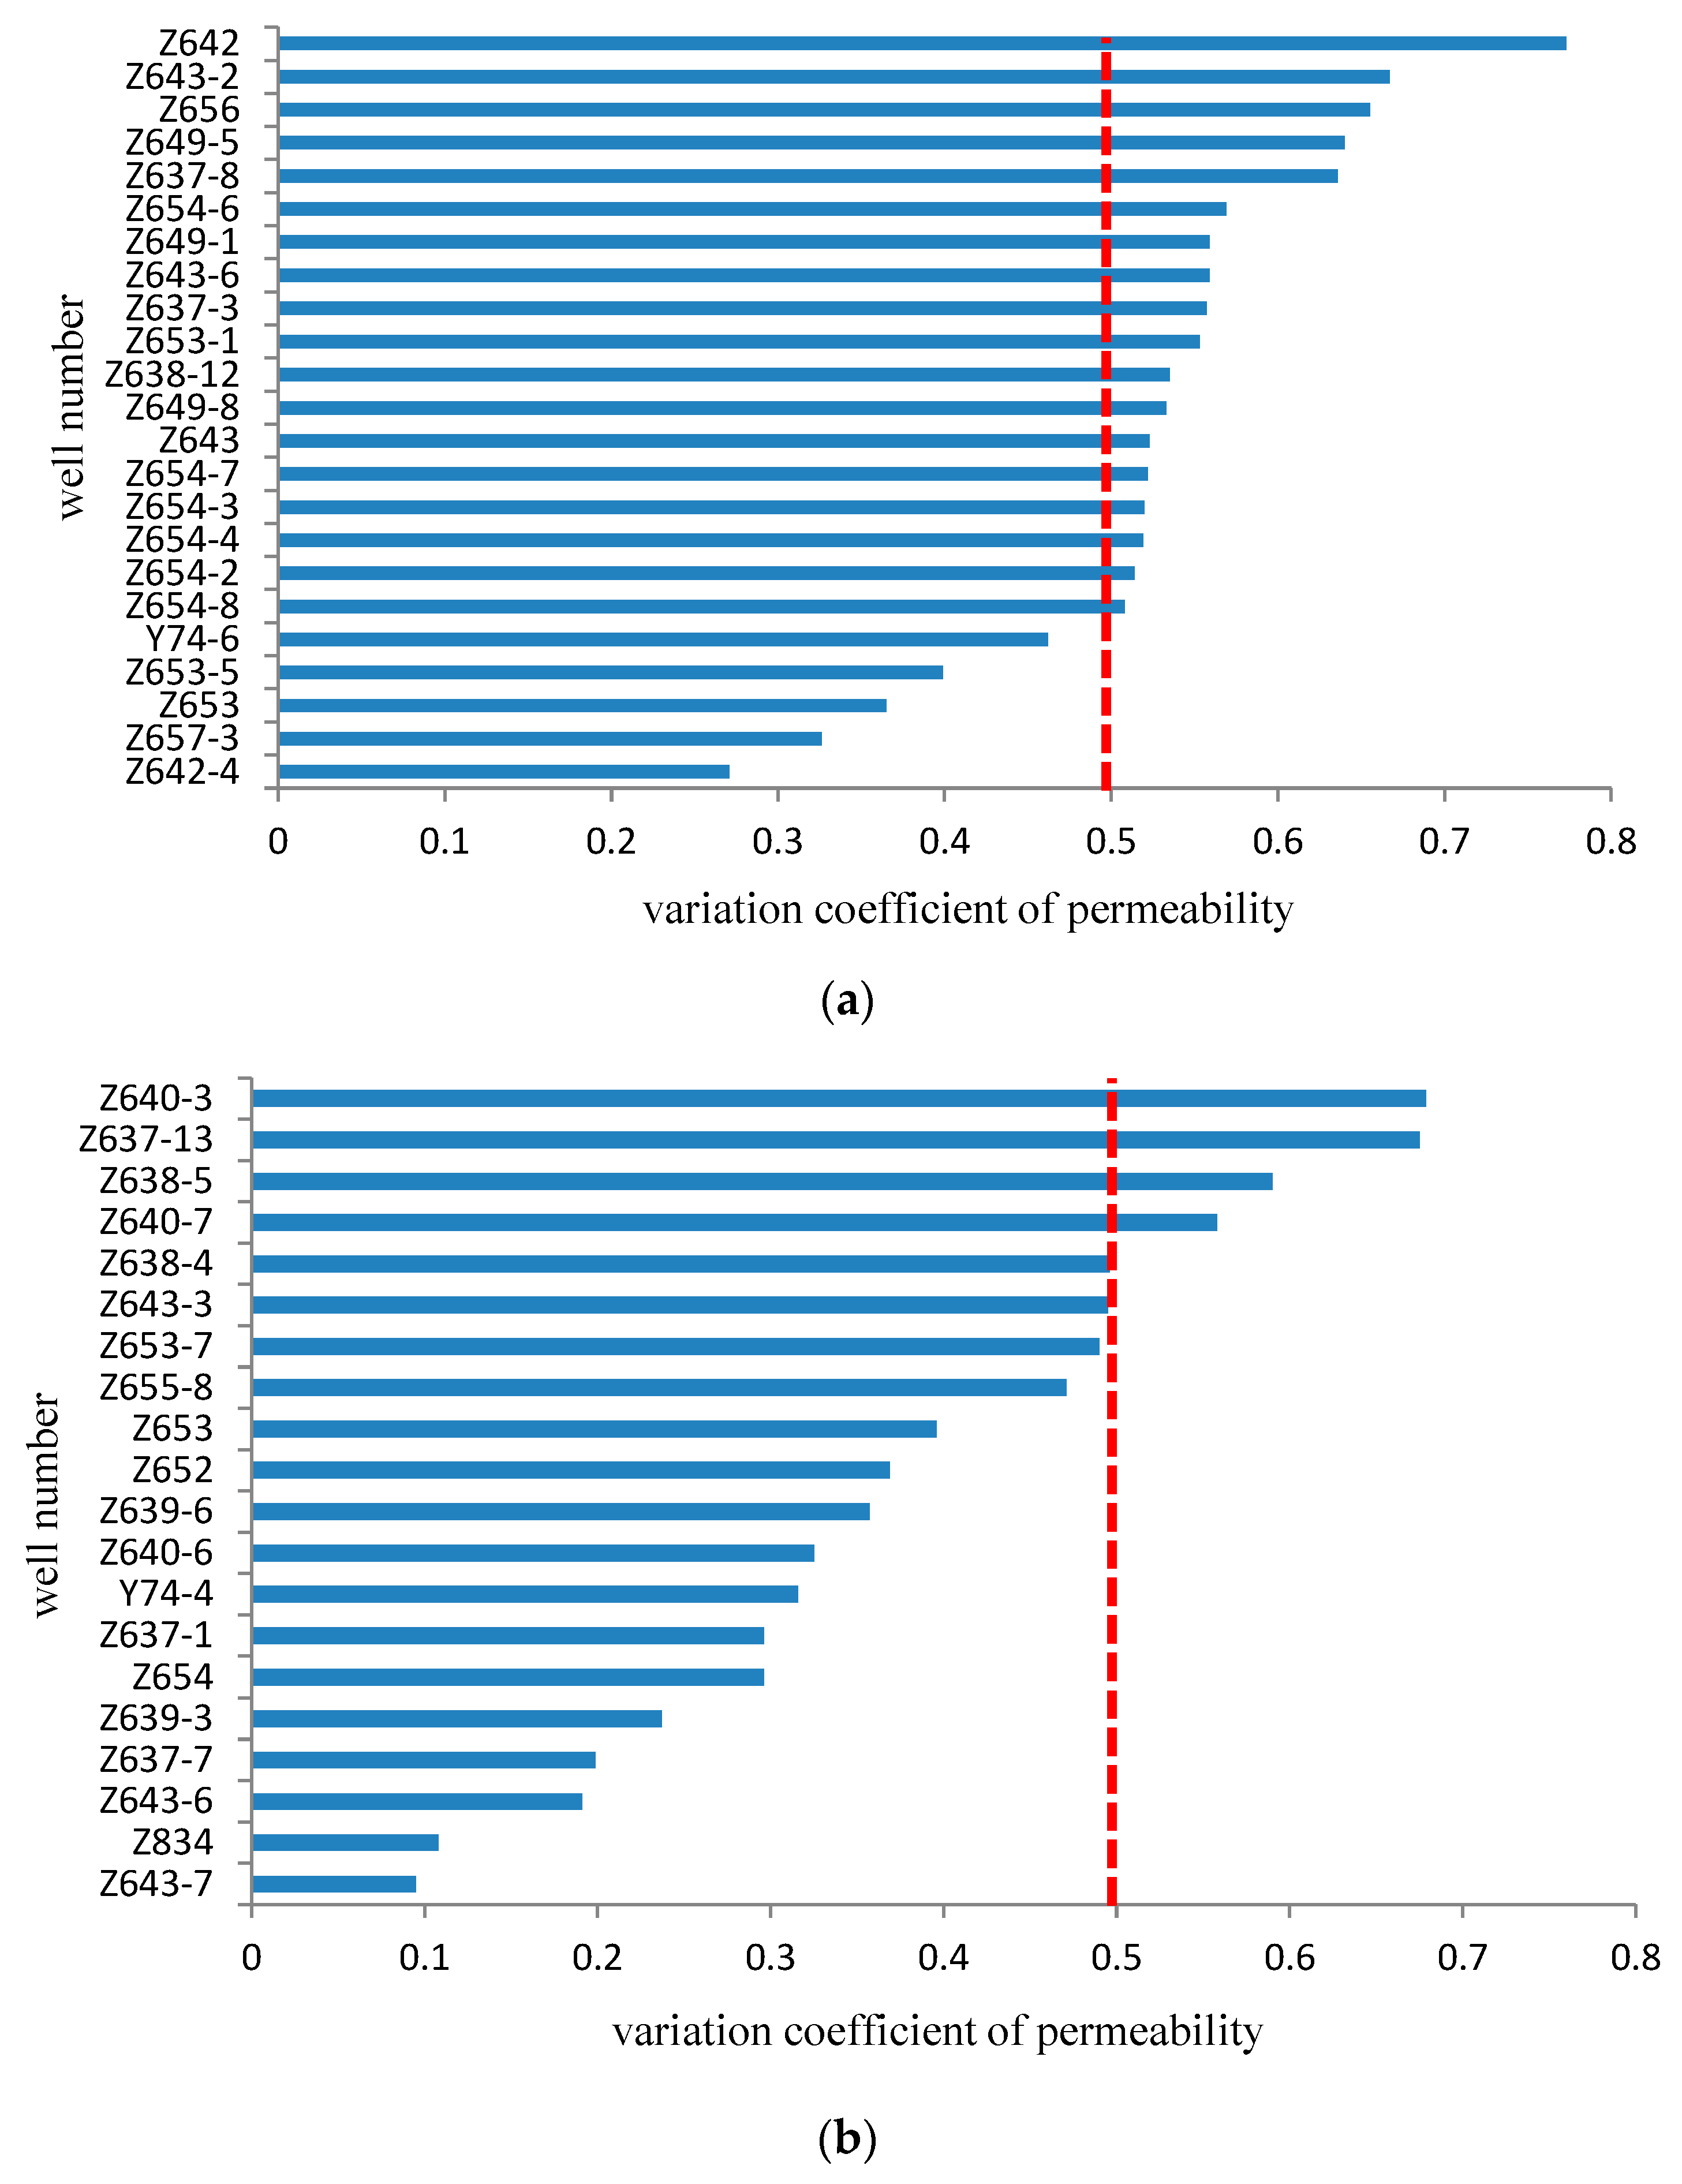
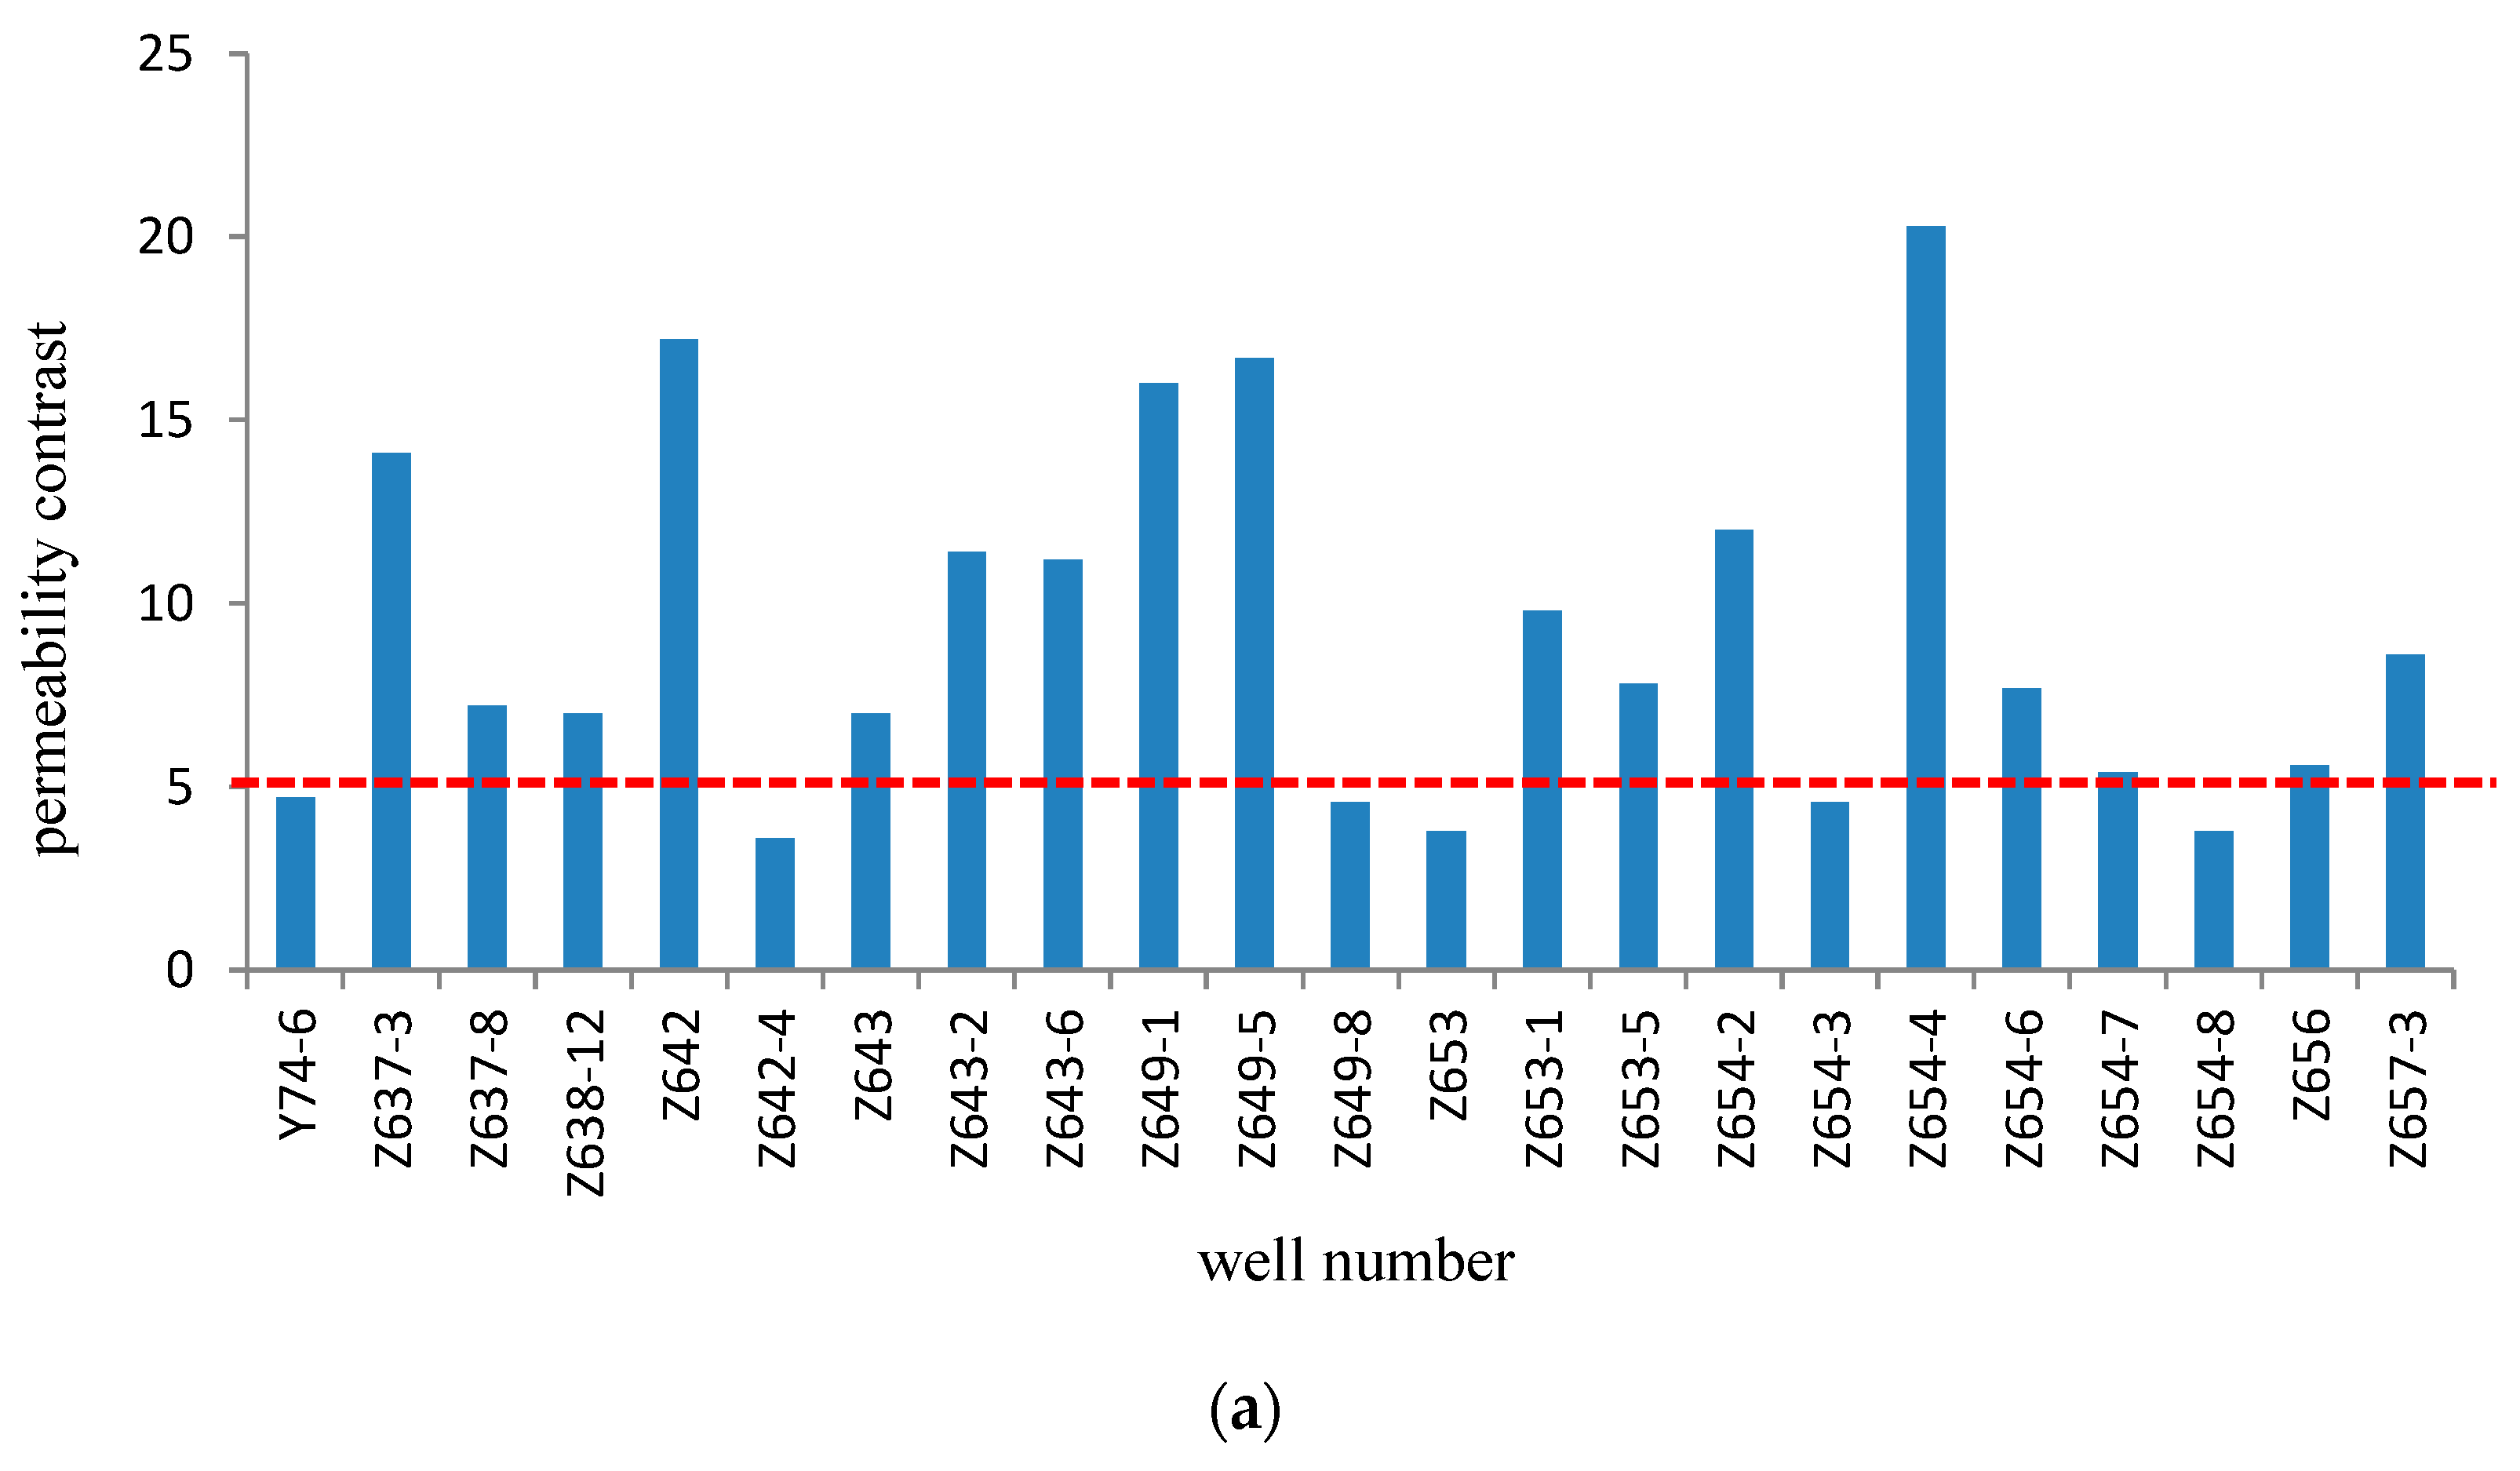
Based on the above ideas and findings in the analysis of the variation coefficient of permeability of reservoirs in the production layers of the wells with or without water channeling in the study area, from
Figure 8,
Figure 9 and
Figure 10, we can see that the variation coefficient of permeability of the layers in the wells with water channeling ranges from 0.271 to 0.773 and the average is 0.529; the variation coefficient of permeability of the layers in the wells without water channeling ranges from 0.095 to 0.724 and the average is 0.375; in the layers with water channeling, the variation coefficient of permeability of 78.3% of the output layers is above 0.5, the permeability rush coefficient of 91.3% of the output layers is above 1.5, and the permeability contrast of 73.9% of the output layers is above 5. Therefore, it is suggested to select the waterflooding layers with the variation coefficient of permeability smaller than 0.5, rush coefficient smaller than 1.5, and permeability contrast smaller than 5 for the waterflooding at the bottom so as to avoid the early occurrence of water channeling.
3.2.3. Reasonable Waterflooding Rate
Oil recovery by spontaneous imbibition refers to the process in which the non-wetting phase is replaced by the wetting phase with the capillary force. It is the main mechanism of the increase of oil production for waterflooding at the bottom. Imbibition mainly occurs in small pores. Theoretically, the longer the time of spontaneous imbibition, the better the effect of oil displacement. Waterflooding rate is the key factor affecting the oil displacement effect. Displacement mainly occurs in big pores or fractures. With the online displacement experiment of NMR, one can study the changes of oil-bearing in big and small pores during displacement and quantitatively characterize the degrees of influence on oil displacement effects under different displacement rates.
- (1)
Experimental Method
Taking the tight and shallow Chang 6 oil reservoir with horizontal fractures in Yanchang Eastern Oilfield as an example, spontaneous imbibition-displacement experiments were done. The core sample diameter is 2.50 cm, the length is 4.41 cm, the porosity is 9.96%, and the permeability is 0.55 mD.
As shown in
Figure 11, the core sample was placed in NMR online tests system for conducting imbibition-displacement experiments. The core sample was processed by cutting flat, washing oil, drying, weighing, etc., for experimental use. There are four main steps for experiments. First, core is saturated to No. 5 white oil by vacuum saturation device. Then, the saturated core is put into an Amott cell that contains the simulated formation water for spontaneous imbibition processes. During the imbibition, the volume of the produced oil is recorded with time by NMR online tests. Finally, different displacement rates experiments are carried out after washing and saturating the core sample again.
- (2)
Experimental Result and Discussion
According to the T2 spectrum distribution curve and the result of spontaneous imbibition in the core sample as shown in
Table 1 and
Figure 12, we can see that the imbibition efficiency is relatively low before 48 h, and the oil displacement efficiency and increase range increase after 48 h. When the core imbibes for 168 h, the oil displacement efficiency is 33.79%. The online displacement experiment of NMR was done based on spontaneous imbibition. According to the T2 spectrum distribution curve and result of displacement, as shown in
Table 2 and
Figure 13, we can determine the best displacement rate. When the core displacement rate is 0.06 mL/min, the big and small pores of the core with a diameter of 1.31–678.94 μm are effectively mobilized with the highest oil displacement efficiency. Therefore, this displacement rate is identified as the best and most reasonable.
3.2.4. Reasonable Waterflooding Pressure
The principle of reasonable waterflooding pressure is as follows. Sufficient displacement pressure systems should be established in the oil layer and overcome the starting pressure gradient existing in the tight reservoir itself. It should be ensured that the pressure is lower than the formation fracture pressure, avoiding the one-way rush of injected water along the dominant migration pathways such as fractures which leads to flooding and channeling of oil wells in a short time, and maintaining the uniform advancement of the waterflood front of injected water as much as possible to achieve the best oil displacement effect.
- (1)
Displacement Experiment
First, the oil displacement efficiency under different waterflooding pressures is obtained with the oil displacement experiments of the core sample to determine the reasonable waterflooding pressure. Taking the tight and shallow Chang 6 oil reservoir with horizontal fractures in Yanchang Eastern Oilfield as an example, the core sample diameter is 2.50 cm, the length is 6.73 cm, the porosity is 10.24%, and the permeability is 0.48 mD. Different displacement pressure experiments were carried out after washing and saturating the core sample.
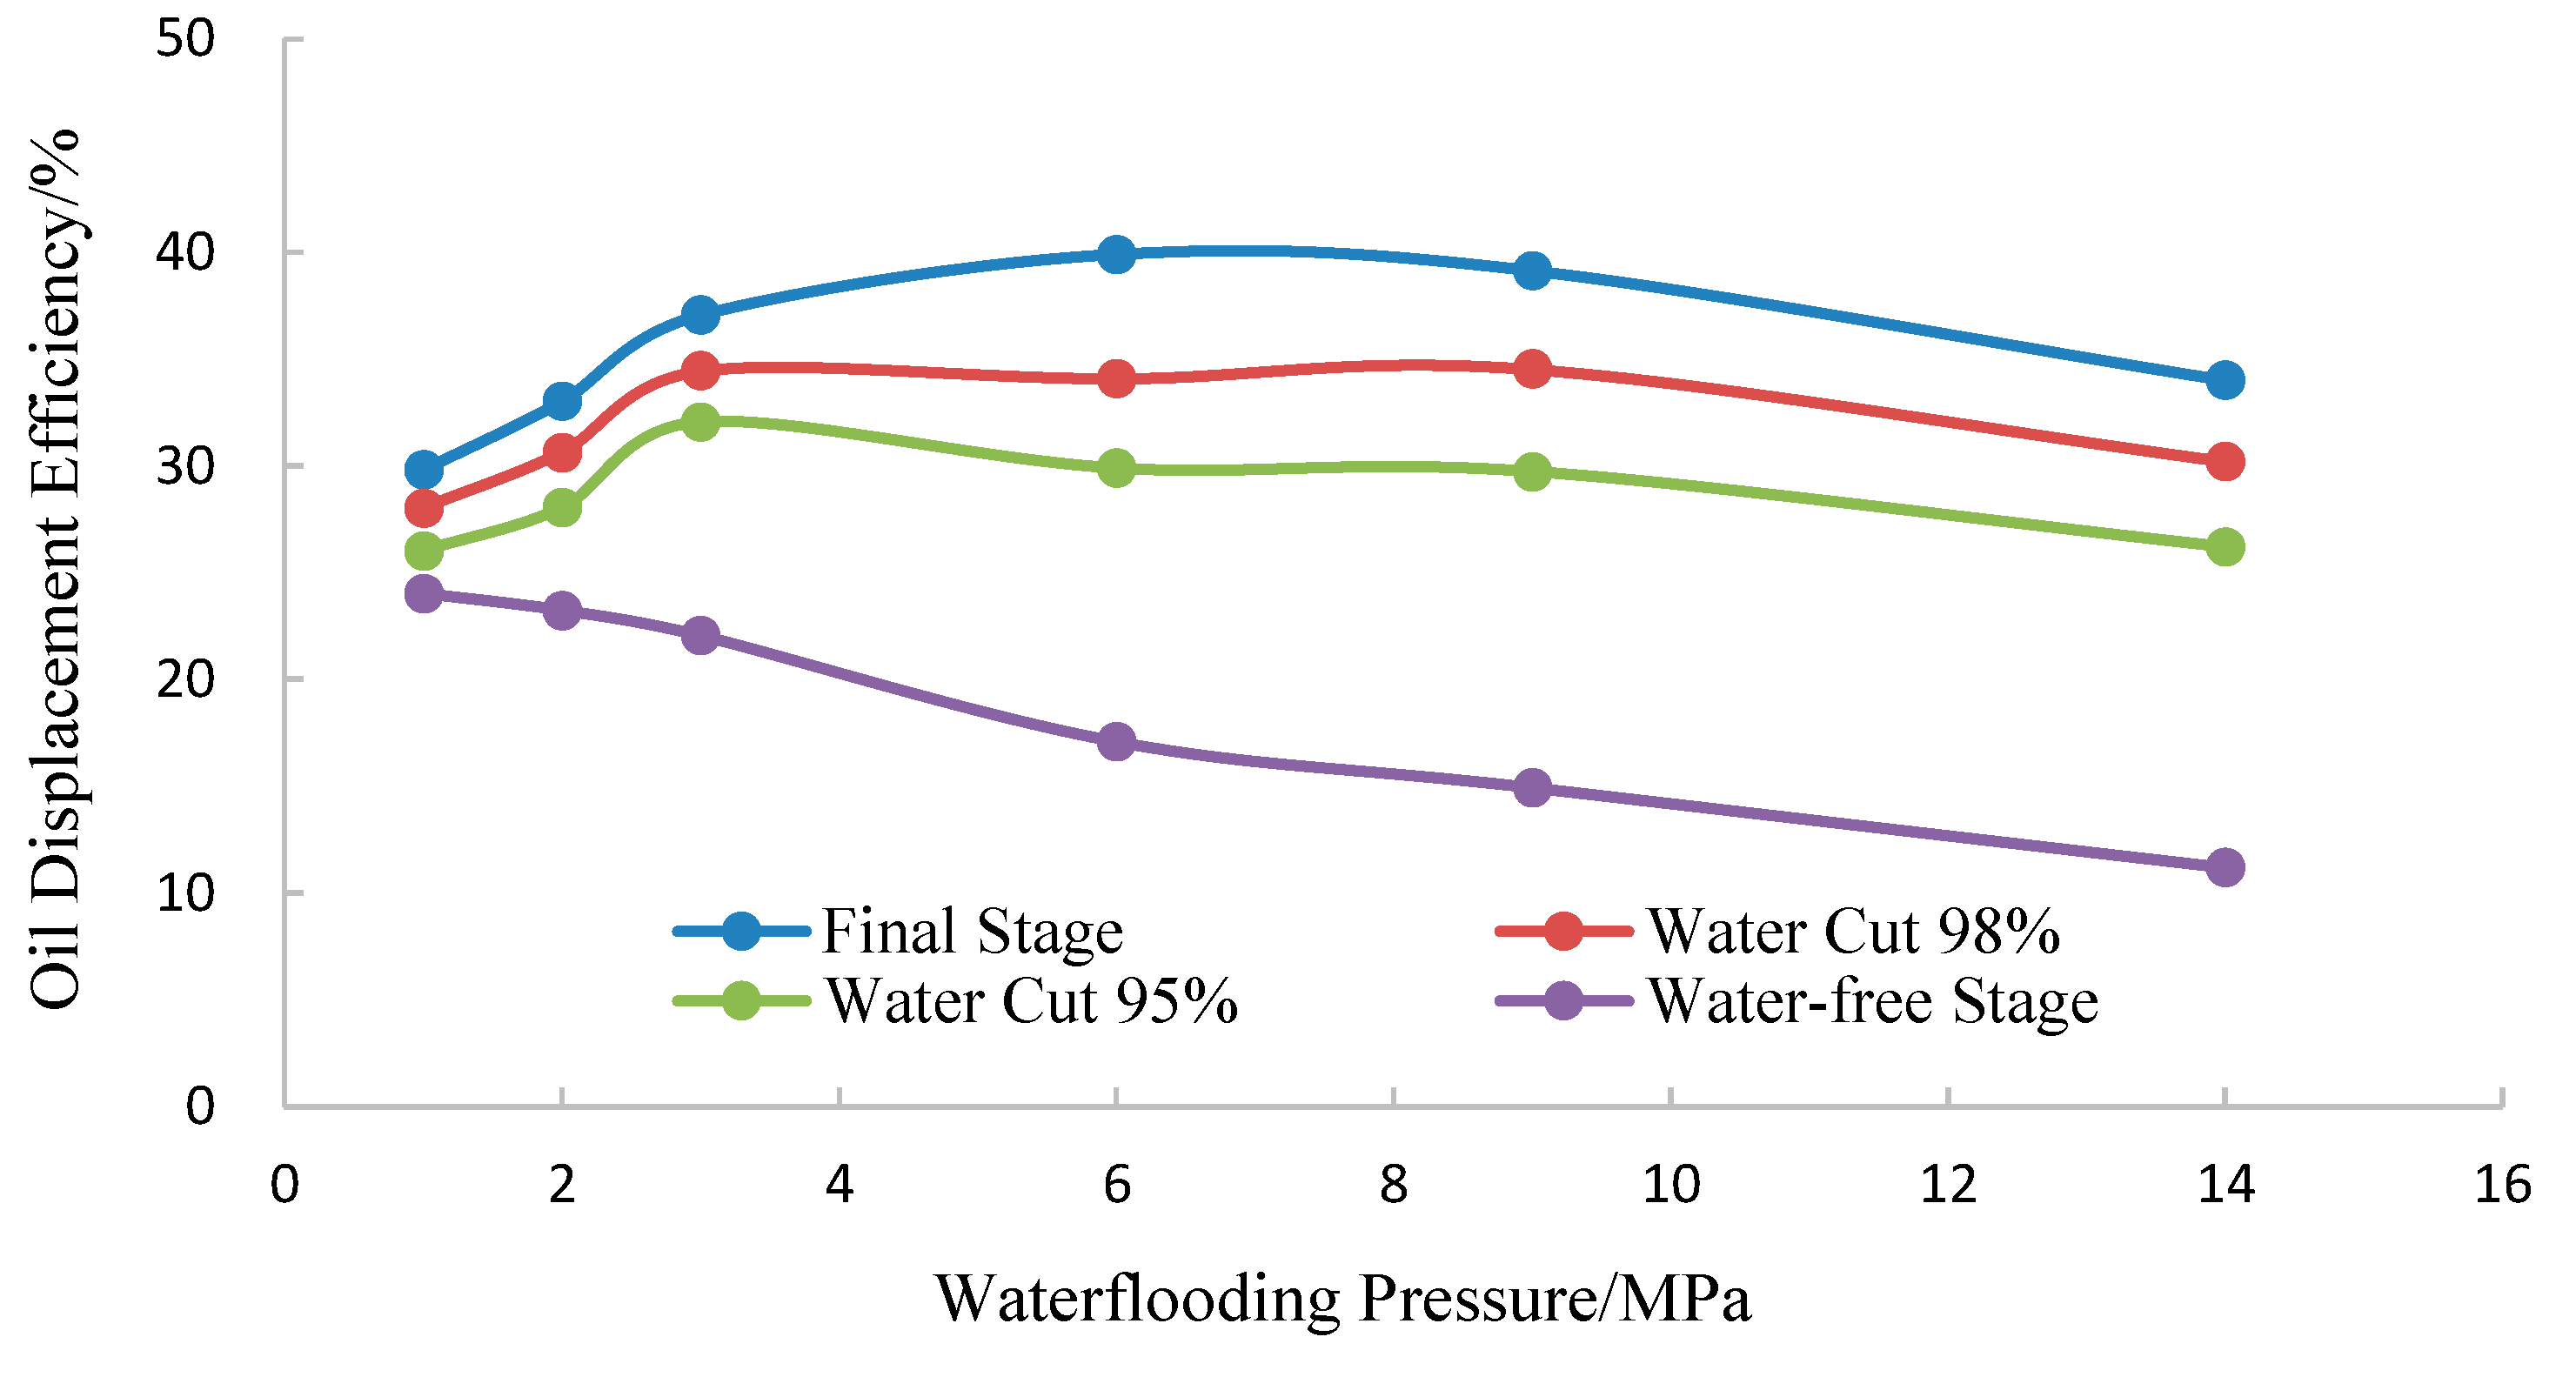
Figure 14 depicts the relationship between waterflooding pressure and oil displacement efficiency of the tight and shallow Chang 6 oil reservoir with horizontal fractures in Yanchang Eastern Oilfield, with the increase of waterflooding pressure, the oil displacement efficiency in the water-free stage generally has a downward trend and the oil displacement efficiency in the water-cut stage gradually increases. When the waterflooding pressure is greater than 9 MPa, the oil displacement efficiency has a downward trend. At this time, by increasing the waterflooding pressure, we can only increase the seepage speed of the injected water in the seepage channel that has been formed and accelerates the flooding of the oil well, but it has little effect on oil displacement efficiency.
- (2)
Waterflooding Indicator Curve
Secondly, the indicator curve of waterflooding pressure and waterflooding volume in the water injection well can be used to determine the reasonable waterflooding pressure. From the waterflooding indicator curve shown in
Figure 15, it can be seen that when the waterflooding pressure is greater than 9 MPa, the curve has an obvious inflection point and the waterflooding pressure changes little if continuing to increase the waterflooding volume. It indicates that microfractures are opened at this time, which is easy to cause the one-way rush of the injected water along the fracture, so the waterflooding pressure should be lower than 9 MPa.
- (3)
Field Tracer Test
Finally, through the dynamic monitoring technology of well-to-well tracer, the advancement speed of the waterflood in front of injected water in the formation under different waterflooding pressures can be obtained. On this basis, it is proposed for the first time to determine the reasonable waterflooding pressure by establishing the relationship between the waterflooding pressure and the advancement speed contrast of the waterflood front (definition: the ratio of the maximum value of the advancement speed of the waterflood front to the minimum value of the advancement speed of the waterflood front). Taking the tracer monitoring of water injection wells in the study area as an example, from the relation curve between the speed contrast of the waterflood front and waterflooding pressure shown in
Figure 16, it can be seen that the advancement speed contrast of the waterflood front is the smallest when the waterflooding pressure is 7 MPa and less than 9 Mpa. It can be concluded that it is easier to advance the waterflood front uniformly under this waterflooding pressure, the one-way rush of injected water can be avoided. Therefore, 7 MPa can be confirmed as a reasonable waterflooding pressure.
4. Application of Waterflooding at the Bottom in the Oil Field
According to the above theoretical and experimental study, the bottom waterflooding development mode is put forward and verified through oil field tests. Well groups Y50-5, G639-4, and G639-6 of Yanchang Eastern Oilfield were selected for the first stage pilot test of waterflooding at the bottom. The oil-bearing area in the test area was 0.35 km2, the geological reserves 20.3 × 10⁴ t, the medium depth of the oil reservoir 675 m, the effective thickness 14.9 m, the original formation pressure 2.54 MPa, the saturation pressure 1.2 MPa, the reservoir porosity 8.36%, the permeability 0.36 mD, the daily oil production of a single well 0.26 t, the composite water cut 27.5%, and the daily waterflooding volume of a single well 2.8 m3. For the G639-4 water injection well, the water flooding at the bottom started in June 2019. The daily waterflooding volume was 10 m3 and the accumulative waterflooding volume was 1492 m3. The oil production of the corresponding output well G636-7 increased from 0.0075 bpd before the test to 0.025 bpd at present, an increase of 3.3 times. The water content decreased from 15% before the test to 10%. The effect of the increase in oil output was obvious. According to the explanation of the pressure buildup test, the formation pressure of the test well group increased from 1.29 MPa before the implementation to 1.47 MPa at present, up by 0.18 MPa. It was predicted that the final recovery increased from 11.2% before the implementation to 13.3%. Compared with the conventional water injection in the same area, the water control effect is obvious, the water content rises slowly, and the cumulative oil increase of the test well group is 1130 tons. In the second stage, 20 well groups will be injected at the bottom, with an estimated annual oil increase of 1300 tons.
5. Discussion
The study area, Yanchang Eastern oil field, is a typical ultra-low permeability shallow reservoir, involving 1.1 billion tons of geological reserves. Due to the small vertical pressure of this type of reservoir, it is easy to form horizontal artificial fractures during the fracturing of oil wells, resulting in a larger contact surface of the water drive front. After conventional water injection, it is easy to cause rapid water flooding and water channeling of oil wells in a short time, and even the phenomenon of flooding upon injection. In conventional water injection development, due to the particularity of horizontal fracture location, the oil and water flow lines for water injection in horizontal fractures are very different from those in vertical fractures. On the plane, the contact probability and contact surface between the water drive front (i.e., high permeability channel) of water injection wells and horizontal fractures are much greater than those in vertical fractures. Horizontal fractures are easier to water channel than vertical fractures. After water channeling, the water content rises rapidly, forming rapid water flooding, and the water flooding direction is multi-directional, which is difficult to control. In order to overcome this technical problem, the bottom water injection development mode is innovatively proposed by using the characteristics of horizontal fractures.
Compared with the previously performed studies, this paper discussed the waterflooding effect of horizontal fractures, water flooding and channeling rules, and especially researched the reasonable limit of waterflooding parameters, which provides an experimental and theoretical basis for horizontal fracture water injection development of shallow reservoirs and plays a good demonstration role for high-efficiency water injection development of shallow reservoirs. It may be a good idea to study more on oil field experimental tests with larger areas and well groups in future research.
6. Conclusions and Understandings
- (1)
The model of waterflooding at the bottom is innovatively proposed in this study. The optimal and reasonable waterflooding speed of 0.06 mL/min is obtained through the NMR online test and core sample flow displacement experiment. At this waterflooding rate, the big and small pores of the core with a diameter of 1.31–678.94 μm are effectively mobilized, and the oil displacement efficiency is the highest.
- (2)
This study determined the reasonable waterflooding pressure by establishing the relationship between the waterflooding pressure and the advancement speed contrast of the waterflood front. It can be concluded that the advancement speed contrast of the waterflood front is the smallest when the waterflooding pressure is 7 MPa, at which it is easier to advance the waterflood front uniformly and the one-way rush of injected water can be avoided.
- (3)
The anisotropy and space distribution characteristics of permeability are the key factors that determine the waterflood recovery efficiency factor. The parameters of variation coefficient of permeability, permeability rush coefficient, and permeability contrast are used to comprehensively characterize layers with or without water channeling. The waterflooding effect is the best when the variation coefficient of permeability is less than 0.5, the permeability rush coefficient is less than 1.5, and the permeability contrast is less than 5, which provides a basis for waterflooding at the bottom and layer selection.
- (4)
Through field practice, the daily oil production of a single well in the test well group increased 3.3 times, and it is predicted that the final recovery would increase by 2%.
Author Contributions
Data curation, L.S. and B.H.; formal analysis, S.C. and Y.C.; investigation, L.S., H.Y. and B.H.; project administration, S.C.; resources, L.S., H.Y. and B.H.; supervision, Y.C.; validation, L.S. and B.H.; visualization, L.S.; writing—original draft, L.S.; writing—review and editing, L.S. and B.H. All authors have read and agreed to the published version of the manuscript.
Funding
This research received no external funding.
Institutional Review Board Statement
Not applicable.
Informed Consent Statement
Not applicable.
Data Availability Statement
Not applicable.
Conflicts of Interest
The authors declare no conflict of interest.
References
- Jinqing, B.; He, L.; Guangming, Z.; Juan, J.; Wei, C.; Jiandong, L. Fracture propagation laws in staged hydraulic fracturing and their effects on fracture conductivities. Pet. Explor. Dev. 2017, 44, 306–314. [Google Scholar] [CrossRef]
- Wang, X.; Peng, X.; Zhang, S.; Du, Z.; Zeng, F. Characteristics of oil distributions in forced and spontaneous imbibition of tight oil reservoir. Fuel 2018, 224, 280–288. [Google Scholar] [CrossRef]
- Aronofsky, J.S.; Masse, L.; Natanson, S.G. A Model for the Mechanism of Oil Recovery from the Porous Matrix Due to Water Invasion in Fractured Reservoirs. Trans. AIME 1958, 213, 17–19. [Google Scholar] [CrossRef]
- Wang, X.; Peng, X.; Zhang, S.; Liu, Y.; Peng, F.; Zeng, F. Guidelines for Economic Design of Multistage Hydraulic Fracturing, Yanchang Tight Formation, Ordos Basin. Nat. Resour. Res. 2019, 29, 1413–1426. [Google Scholar] [CrossRef]
- Wenchao, F.; Jiang, H.; Junjian, L.; Qing, W.; Killough, J.; Linkai, L.; Yongcan, P.; Hanxu, Y. A numerical simulation model for multi-scale flow in tight oil reservoirs. Pet. Explor. Dev. 2017, 44, 446–453. [Google Scholar] [CrossRef]
- Guo, J.; Li, M.; Chen, C.; Tao, L.; Liu, Z.; Zhou, D. Experimental investigation of spontaneous imbibition in tight sandstone reservoirs. J. Pet. Sci. Eng. 2020, 193, 107395. [Google Scholar] [CrossRef]
- Li, S.; Cheng, L.; Li, X.; Hao, F. Nonlinear seepage flow models of ultra-low permeability reservoirs. Pet. Explor. Dev. 2008, 35, 606–612. [Google Scholar] [CrossRef]
- Wang, Z.; Zhang, Q.; Zeng, Q.; Wei, J. A unified model of oil/water two-phase flow in the horizontal wellbore. SPE J. 2017, 22, 353–364. [Google Scholar] [CrossRef]
- Li, H.; Tan, Y.; Jiang, B.; Wang, Y.; Zhang, N. A semi-analytical model for predicting inflow profile of horizontal wells in bottom-water gas reservoir. J. Pet. Sci. Eng. 2018, 160, 351–362. [Google Scholar] [CrossRef]
- Dikken, B.J. Pressure drop in horizontal wells and its effect on their production performance. J. Pet. Technol. 1990, 42, 1426–1433. [Google Scholar] [CrossRef]
- Zidane, A.; Firoozabadi, A. An efficient numerical model for multicomponent compressible flow in fractured porous media. Adv. Water Resour. 2014, 74, 127–147. [Google Scholar] [CrossRef]
- Karimi-Fard, M.; Firoozabadi, A. Numerical simulation of water injection in fractured media using discrete-fracture model and the Galerkin method. SPE Reserv. Eval. Eng. 2003, 6, 117–126. [Google Scholar] [CrossRef]
- Cordero, J.A.R.; Sanchez, E.C.M.; Roehl, D.; Rueda, J.; Mejia, E. Integrated discrete fracture and dual porosity—Dual permeability models for fluid flow in deformable fractured media. J. Pet. Sci. Eng. 2019, 175, 644–653. [Google Scholar] [CrossRef]
- Jing, W.; Huiqing, L.; Jing, X.; Yuetian, L.; Cheng, H.; Qingbang, M.; Yang, G. Mechanism simulation of oil displacement by imbibition in fractured reservoirs. Pet. Explor. Dev. 2017, 44, 805–814. [Google Scholar] [CrossRef]
- Gao, L.; Yang, Z.; Shi, Y. Experimental study on spontaneous imbibition characteristics of tight rocks. Adv. Geo-Energy Res. 2018, 2, 292–304. [Google Scholar] [CrossRef]
- Meng, Q.; Cai, J. Recent advances in spontaneous imbibition with different boundary conditions. Capillarity 2018, 1, 19–26. [Google Scholar] [CrossRef]
- Xiangzeng, W.; Hailong, D.; Tao, G. Method of moderate water injection and its application in ultra-low permeability oil reservoirs of Yanchang Oilfield, NW China. Pet. Explor. Dev. 2018, 45, 1094–1102. [Google Scholar] [CrossRef]
- Ghasemi, F.; Ghaedi, M.; Escrochi, M. A new scaling equation for imbibition process in naturally fractured gas reservoirs. Adv. Geo-Energy Res. 2020, 4, 99–106. [Google Scholar] [CrossRef]
- Babadagli, T.; Zeidani, K. Evaluation of Matrix-Fracture Imbibition Transfer Functions for Different Types of Oil, Rock and Aqueous Phase. In Proceedings of the SPE/DOE Symposium on Improved Oil Recovery, Tulsa, OK, USA, 17–21 April 2004. [Google Scholar] [CrossRef]
- Arihara, N. Analysis of spontaneous capillary imbibition for improved Oil Recovery. In Proceedings of the SPE Asia Pacific Oil and Gas Conference and Exhibition, Perth, WA, USA, 18–20 October 2004. [Google Scholar] [CrossRef]
- Naizhen, L.; Zhaopeng, Z.; Yushi, Z.; Xinfang, M.; Yinuo, Z. Propagation law of hydraulic fractures during multi-staged horizontal well fracturing in a tight reservoir. Pet. Explor. Dev. 2018, 45, 1129–1138. [Google Scholar] [CrossRef]
- Wang, D.; Sun, J.; Li, Y.; Peng, H. An efficient hybrid model for nonlinear two-phase flow in fractured low-permeability reservoir. Energies 2019, 12, 2850. [Google Scholar] [CrossRef]
- Vodorezov, D.D. Estimation of horizontal-well productivity loss caused by formation damage on the basis of numerical modeling and laboratory-testing data. SPE J. 2019, 24, 44–59. [Google Scholar] [CrossRef]
- Junlei, W.; Ailin, J.; Yunsheng, W.; Chengye, J.; Yadong, Q.; He, Y.; Yiqiu, J. Optimization workflow for stimulation-well spacing design in a multiwell pad. Pet. Explor. Dev. 2018, 46, 1039–1050. [Google Scholar] [CrossRef]
- Tianyi, F.; Xinmin, S.; Shuhong, W.; Qiaoyun, L.; Baohua, W.; Xiaobo, L.; Hua, L.; Hailong, L. A mathematical model and numerical simulation of waterflood induced dynamic fractures of low permeability reservoirs. Pet. Explor. Dev. 2015, 42, 541–547. [Google Scholar]
- Karatas, M. Hydrogen energy storage method selection using fuzzy axiomatic design and analytic hierarchy process. Int. J. Hydrog. Energy 2019, 45, 16227–16238. [Google Scholar] [CrossRef]
- Wu, S.H.; Liu, X.E.; Guo, S.P. A simplified model of flow in horizontal wellbore. Pet. Explor. Dev. 1999, 26, 64–66. [Google Scholar]
- Chen, Z.; Liao, X.; Zhao, X.; Zhu, L.; Liu, H. Performance of multiple fractured horizontal wells with consideration of pressure drop within wellbore. J. Pet. Sci. Eng. 2016, 146, 677–693. [Google Scholar] [CrossRef]
- Dang, H.; Jiang, H.; Hou, B.; Wang, X.; Gao, T.; Wang, C.; Lu, C. Analysis of Controlling Factors at Separate Imbibition Stages for Ultra-Low-Permeability Reservoirs. Energies 2021, 14, 7093. [Google Scholar] [CrossRef]
- Pandey, V.J.; Agreda, A.J. New fracture-stimulation designs and completion techniques result in better performance of shallow Chittim Ranch wells. SPE Prod. Oper. 2014, 29, 288–309. [Google Scholar] [CrossRef]
- Fu, X.; Ji, S. Review and Outlook on Technologies for Developing PetroChina Low-permeability Reservoirs. Adv. Mater. Res. 2014, 838, 1869–1872. [Google Scholar] [CrossRef]
- Major, R.P.; Holtz, M.H. Identifying fracture orientation in a mature carbonate platform reservoir. AAPG Bull. 1997, 81, 1063–1069. [Google Scholar] [CrossRef]
- Cai, J.; Chen, Y.; Liu, Y.; Li, S.; Sun, C. Capillary imbibition and flow of wetting liquid in irregular capillaries: A 100-year review. Adv. Colloid Interface Sci. 2022, 304, 102654. [Google Scholar] [CrossRef]
Figure 1.
Location map of the Yanchang Eastern Oilfield in the Ordos Basin.
Figure 1.
Location map of the Yanchang Eastern Oilfield in the Ordos Basin.
Figure 2.
Profile of horizontal fracture water injection development in early stage by natural energy (a) and mainly waterflooding stage (b).
Figure 2.
Profile of horizontal fracture water injection development in early stage by natural energy (a) and mainly waterflooding stage (b).
Figure 3.
Comparison of water channeling characteristics of horizontal fractures (a) and vertical fractures (b).
Figure 3.
Comparison of water channeling characteristics of horizontal fractures (a) and vertical fractures (b).
Figure 4.
Comparison of water breakthrough time in oil wells.
Figure 4.
Comparison of water breakthrough time in oil wells.
Figure 5.
The mechanism model of bottom water injection.
Figure 5.
The mechanism model of bottom water injection.
Figure 6.
The change of the oil saturation (a) and pressure distribution (b) by numerical simulation.
Figure 6.
The change of the oil saturation (a) and pressure distribution (b) by numerical simulation.
Figure 7.
Comparison of conventional injection and bottom injection.
Figure 7.
Comparison of conventional injection and bottom injection.
Figure 8.
Distribution histogram of the variation coefficient of permeability in wells with water channeling (a) and without water channeling (b). Red dotted line means the value of variation coefficient of permeability is 0.5.
Figure 8.
Distribution histogram of the variation coefficient of permeability in wells with water channeling (a) and without water channeling (b). Red dotted line means the value of variation coefficient of permeability is 0.5.
Figure 9.
Distribution histogram of the permeability rush coefficient in wells with water channeling (a) and without water channeling (b). Red dotted line means the value of permeability rush coefficient is 1.5.
Figure 9.
Distribution histogram of the permeability rush coefficient in wells with water channeling (a) and without water channeling (b). Red dotted line means the value of permeability rush coefficient is 1.5.
Figure 10.
Distribution histogram of the permeability contrast in wells with water channeling (a) and without water channeling (b). Red dotted line means the value of permeability contrast is 5.
Figure 10.
Distribution histogram of the permeability contrast in wells with water channeling (a) and without water channeling (b). Red dotted line means the value of permeability contrast is 5.
Figure 11.
NMR online tests system.
Figure 11.
NMR online tests system.
Figure 12.
The T2 spectrum distribution curve of spontaneous imbibition in core sample.
Figure 12.
The T2 spectrum distribution curve of spontaneous imbibition in core sample.
Figure 13.
The T2 spectrum distribution curve at different displacement rate, 0.02 mL/min (a), 0.04 mL/min (b), 0.06 mL/min (c), 0.08 mL/min (d) and 0.10 mL/min (e).
Figure 13.
The T2 spectrum distribution curve at different displacement rate, 0.02 mL/min (a), 0.04 mL/min (b), 0.06 mL/min (c), 0.08 mL/min (d) and 0.10 mL/min (e).
Figure 14.
Relation curve of waterflooding pressure and oil displacement efficiency.
Figure 14.
Relation curve of waterflooding pressure and oil displacement efficiency.
Figure 15.
Relation curve of waterflooding volume and waterflooding pressure. Red dotted line means the value of waterflooding pressure is 9.
Figure 15.
Relation curve of waterflooding volume and waterflooding pressure. Red dotted line means the value of waterflooding pressure is 9.
Figure 16.
Relation curve of waterflooding pressure and advancement speed contrast of the waterflood front. Red dotted line means the value of waterflooding pressure is 7.
Figure 16.
Relation curve of waterflooding pressure and advancement speed contrast of the waterflood front. Red dotted line means the value of waterflooding pressure is 7.
Table 1.
Oil displacement efficiency of spontaneous imbibition at different times.
Table 1.
Oil displacement efficiency of spontaneous imbibition at different times.
| Imbibition Time, h | Oil Displacement Efficiency, % | Increase Amplitude, % |
|---|
| 0 | 0 | 0 |
| 5 | 5.92 | 5.92 |
| 24 | 8.32 | 2.40 |
| 48 | 12.49 | 4.17 |
| 96 | 25.26 | 12.77 |
| 168 | 33.79 | 8.53 |
Table 2.
Results of oil displacement experiment.
Table 2.
Results of oil displacement experiment.
| Oil Displacement Rate, mL/Min | Oil Displacement Efficiency, % | Mobilized Range, μm |
|---|
| 0.02 | 28.04 | 0.99–782.65 |
| 0.04 | 33.80 | 0.88–764.24 |
| 0.06 | 59.94 | 1.31–678.94 |
| 0.08 | 38.16 | 1.33–757.65 |
| 0.10 | 30.69 | 1.51–746.62 |
| Publisher’s Note: MDPI stays neutral with regard to jurisdictional claims in published maps and institutional affiliations. |
© 2022 by the authors. Licensee MDPI, Basel, Switzerland. This article is an open access article distributed under the terms and conditions of the Creative Commons Attribution (CC BY) license (https://creativecommons.org/licenses/by/4.0/).


