
A Technique to Determine the Breakthrough Pressure of Shale Gas Reservoir by Low-Field Nuclear Magnetic Resonance
1
PetroChina Research Institute of Petroleum Exploration Development, Beijing 100083, China
2
School of Geosciences, China University of Petroleum, Qingdao 266580, China
*
Author to whom correspondence should be addressed.
Energies 2022, 15(19), 7223; https://doi.org/10.3390/en15197223
Submission received: 4 July 2022
/
Revised: 22 September 2022
/
Accepted: 27 September 2022
/
Published: 1 October 2022
(This article belongs to the Collection Flow and Transport in Porous Media)
Abstract
:The porous and low-permeability characteristics of a shale gas reservoir determine its high gas storage efficiency, which is manifested in the extremely high breakthrough pressure of shale. Therefore, the accurate calculation of breakthrough pressure is of great significance to the study of shale gas preservation conditions. Based on a systematic analysis of a low-field NMR experiment on marine shales of the Longmaxi Formation in the Sichuan Basin, a shale gas breakthrough pressure determination technique different from conventional methods is proposed. The conventional methods have low calculation accuracy and are a tedious and time-consuming process, while low-field NMR technique is less time-consuming and of high accuracy. Firstly, the NMR T2 spectrum of shale core sample in different states is measured through low-field NMR experiment. The NMR T2 spectra of sample in water-saturated state and dry state are combined to model the mathematical relationship between shale gas breakthrough pressure and NMR T2 spectrum. It is found that the gas breakthrough pressure is power-exponentially related to the geometric mean of NMR T2 spectrum and positively related to the proportion of micropores. Accordingly, the shale gas breakthrough pressure is quickly and accurately calculated using continuous NMR logging data and then the sealing capacity of the shale caprocks is evaluated, providing basic parameters for analyzing unconventional hydrocarbon accumulation, preservation and migration. This technique has been successfully applied with actual data to evaluate the sealing capacity of shale caprock in a shale gas well in the Sichuan Basin. It can provide a good basis for the evaluation and characterization of shale oil and gas reservoirs.
1. Introduction
Except for the shale gas of the Wufeng-Longmaxi Formation in the Sichuan Basin and its surrounding areas, the multi-layer marine shale of the Cambrian and Carboniferous has not been fully discovered [1]. Shale, as a tight caprock, is one of the most ideal materials for sealing hydrocarbons. Its low porosity and permeability play a very important role in the accumulation and preservation of hydrocarbons [2,3]. Currently, the sealing capacity of shale is mainly evaluated by high-pressure mercury intrusion, gas diffusion test, triaxial stress test and breakthrough pressure test [4,5,6], from the perspective of throat size, porosity, permeability, diffusion coefficient and gas breakthrough pressure [7,8,9,10]. Due to experimental limitations (such as high pressure, threshold time, relaxation time and pore size), however, these methods are deficient in some respects, for example, the destructive effects of high-pressure mercury intrusion on pore structure at the high-pressure stage and the dependence on threshold in CT scan identification [11]. Moreover, since the pressure in core drops after it is lifted to the surface, the critical state of shale gas changes, allowing the light hydrocarbon components to volatilize or escape at a higher rate [12,13]. As a result, a large error occurs when comparing the oil/gas saturation of the core obtained under conventional laboratory conditions and the original formation value [14,15]. The log-based breakthrough pressure models are mostly dependent on conventional logging data such as acoustic time and resistivity and cannot reflect the pore structure and other microscopic features of the rock, so the accuracy of breakthrough pressure calculation is low [16]. The application of breakthrough pressure tester involves a tedious and time-consuming process. Considering the advantage of NMR technology in rapid identification of hydrogen-containing fluids, the portable low-field NMR analyzer can be used on site for rapid analysis of cores, in contrast to conventional methods that are lagging in analysis and may suffer from gas diffusion [17,18]. In addition, the NMR technique is less time-consuming and stable for multiple repetitions in the field [19,20]. Its accuracy has been verified by the consistence of the results with conventional laboratory methods [21,22].
The low-field NMR technique can effectively describe the reservoir characteristics such as pore structure and fluid composition [23]. It tests the porosity of unconventional shale gas reservoirs by analyzing the relaxation time (NMR T2 spectrum) of fluid within the pore and the phenomenon of fluid relaxation enhancement at the solid–liquid interface [24]. This technique plays a very important role in rock physics and logging. The measurement signal is only related to the formation hydrogen nucleus, which can effectively characterize the reservoir pore structure and fluid composition. The distribution of low-field NMR T2 spectrum and its characteristics can be used as a basis to quantitatively describe the microstructure in a fast and effective manner and the total porosity, clay-bound water, capillary porosity, free fluid porosity and pore size distribution of shale can be obtained by inversion.
At present, NMR has been widely used by many scholars in the evaluation of carbonate rock, sandstone, shale rock physical properties and fluid analysis [25,26,27,28,29,30,31]. This technique has significant advantages in fluid identification and pore characterization. Based on the study of the breakthrough pressure NMR mechanism, a mathematical model is established for the shale gas breakthrough pressure versus the NMR T2 spectrum of 100% water-saturated shale core samples and the NMR T2 spectrum of dry shale core samples. Then, with this mathematical model, the gas breakthrough pressure is corrected according to the linear relationship between the measured gas breakthrough pressure and the predicted gas breakthrough pressure by the low-field NMR model. Finally, an accurate gas breakthrough pressure value is obtained. Such a result agrees more with the rock conditions underground, so that the sealing capacity of the caprock can be evaluated objectively.
2. Principle of Shale NMR Measurement
The NMR technique obtains the T2 relaxation spectrum containing a variety of fluid components by observing the relaxation signal strength of the hydrogen nucleus in the formation [32]. In shale, the kerogen in organic matter, clay minerals in inorganic matter, pyrite and so on, will affect the NMR signal, thus affecting the T2 relaxation spectrum. The low-field NMR technique detects the substances according to the resonance phenomenon caused by the interaction between atoms with nuclear magnetism and the external magnetic field. Among the formation elements, the hydrogen nucleus has the largest magneto-gyric ratio and a high abundance. The NMR signals of the hydrogen nucleus can be detected to quickly identify the quantity and type of fluid within the pore space and the binding force upon the fluid between the solid surfaces of the rock pore space; thus, the physical properties, pore structure, movable fluid distribution and oil/water distribution in different pores of the rock are determined [12,15,33]. According to Gabiela et al. [34], shale does not contain a number of strongly magnetic components that may affect the NMR signal. Therefore, the information on hydrogen nuclei in the rock skeleton is largely negligible relative to the information on hydrogen nuclei flowing in the pore space if the improved acquisition signal-to-noise ratio and resolution are used [35].
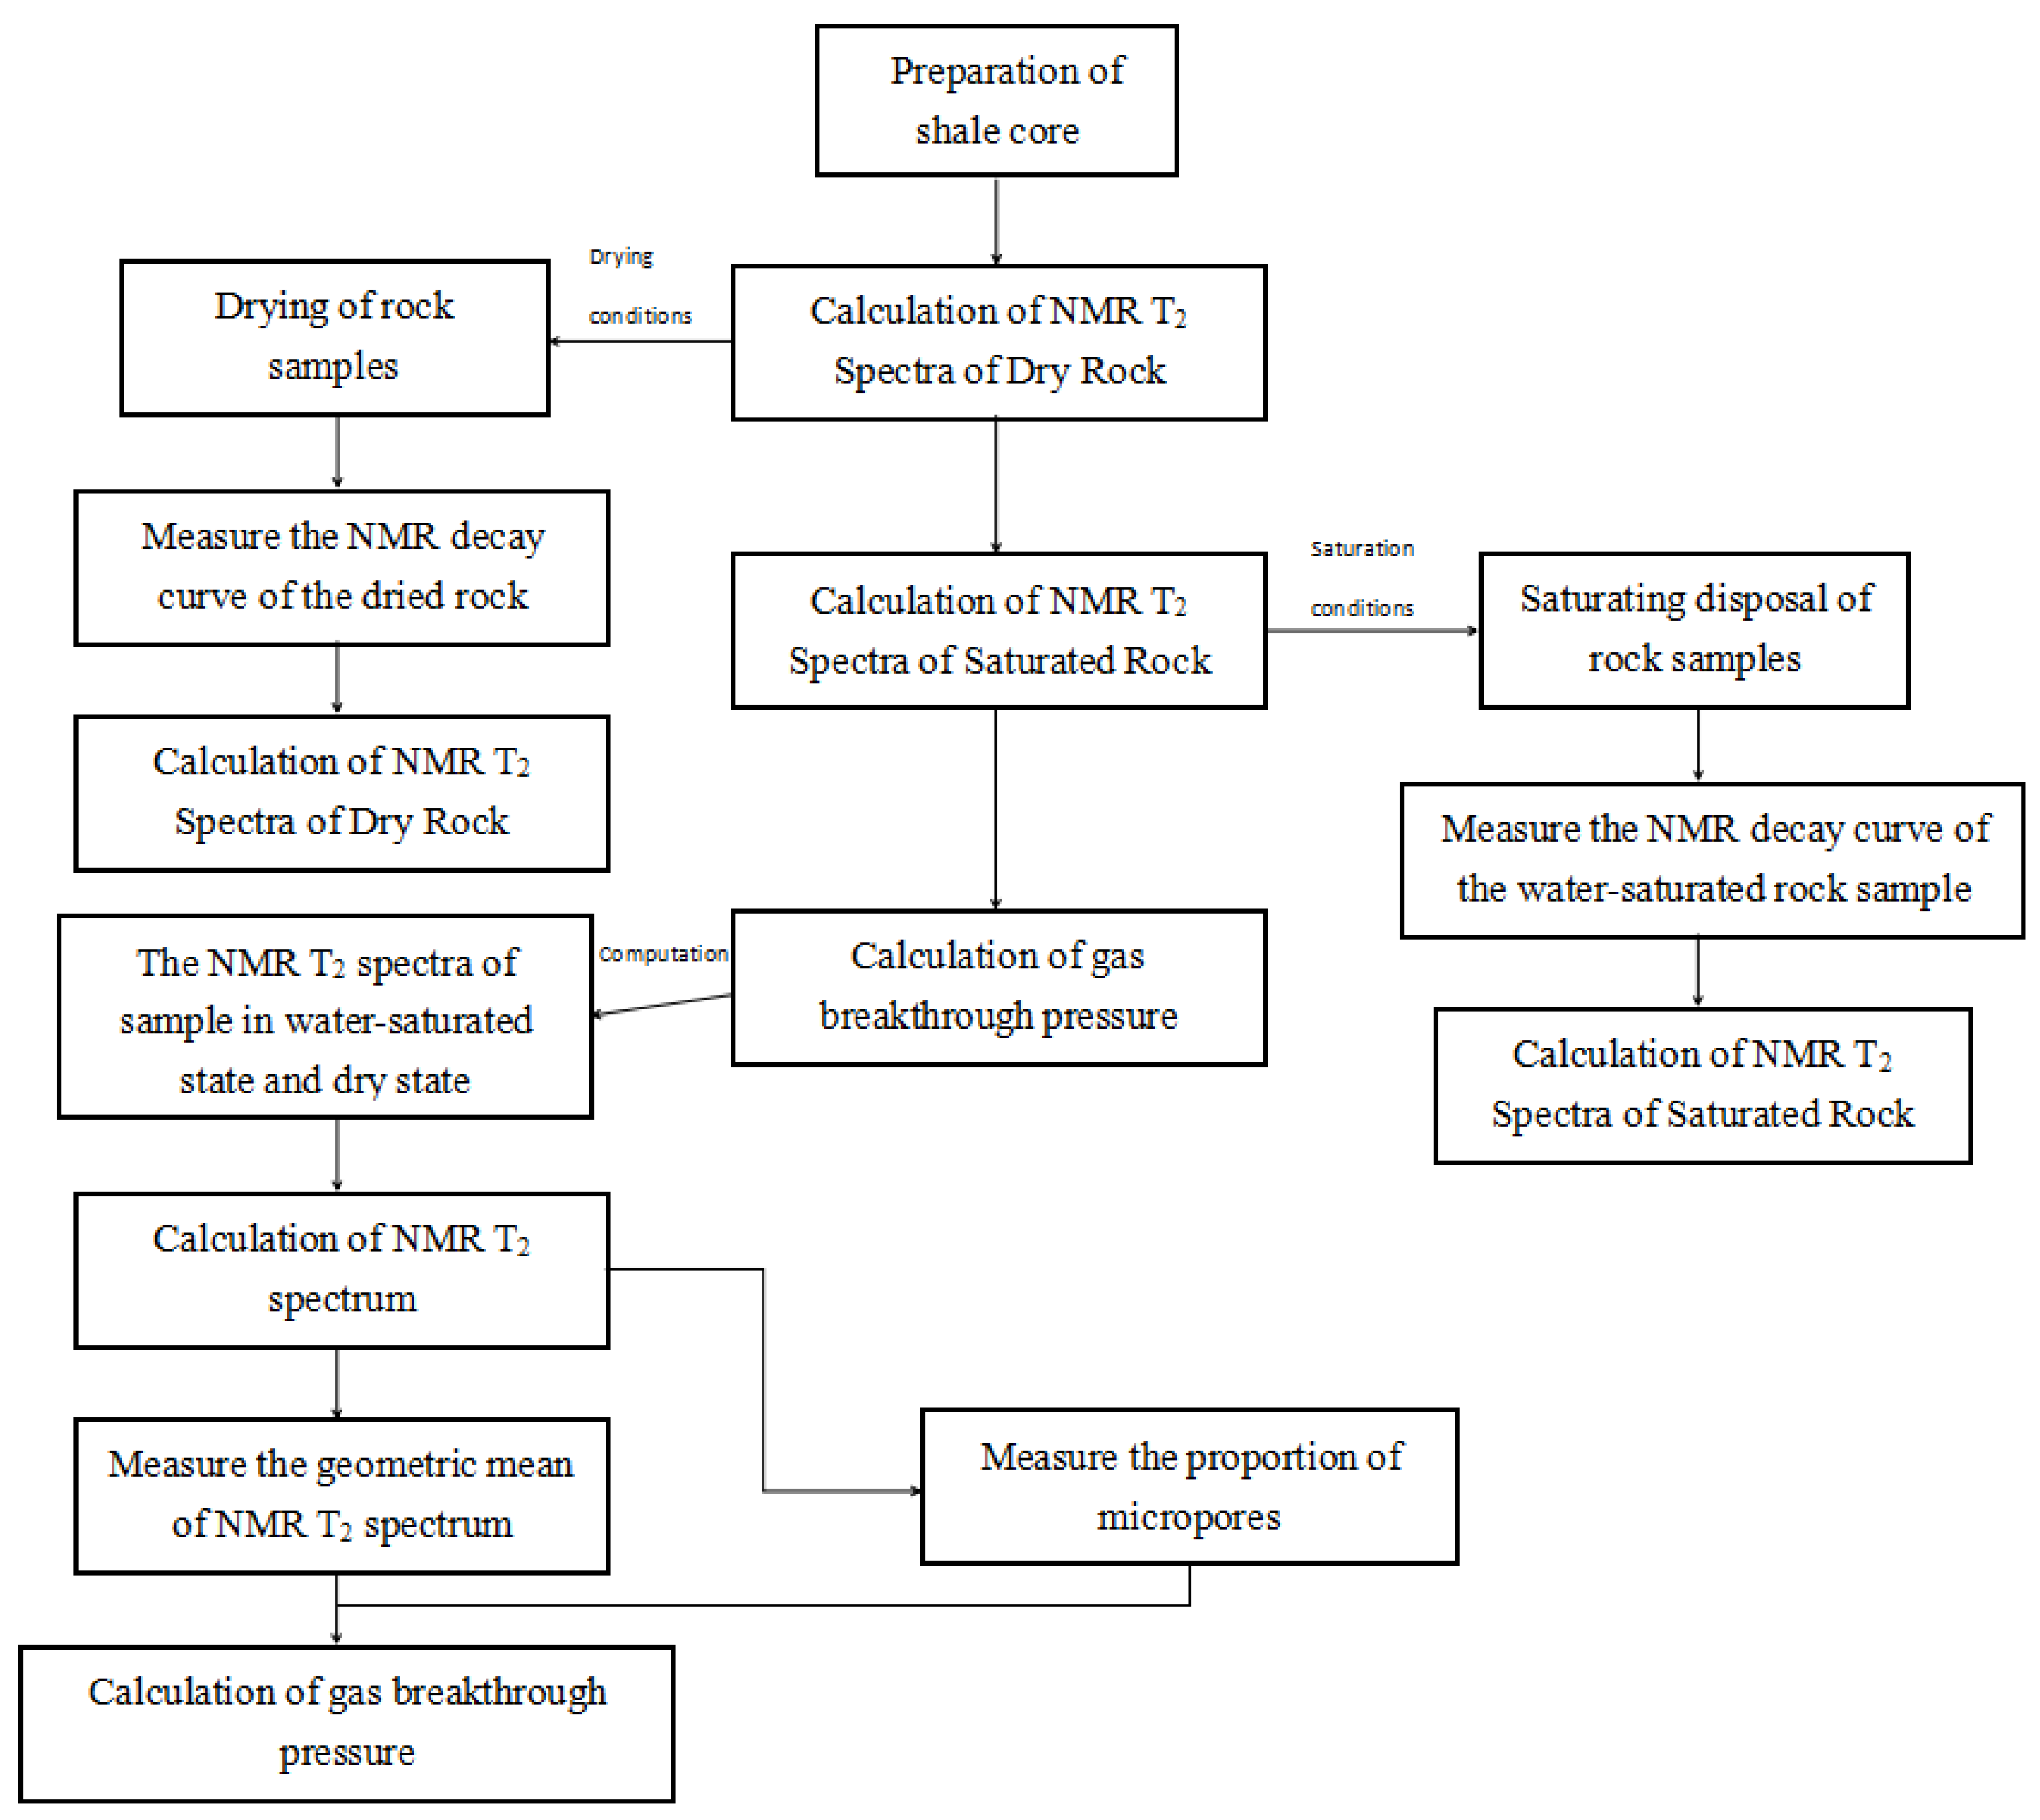
The relaxation time in NMR is mainly divided into T1 and T2. Generally, T1 and T2 measurements can obtain similar core sample information and exhibit a good consistency. T2 measurement is easier and quicker than T1 measurement. Therefore, T2 is widely used in laboratory studies and logging analysis in terms of reservoir rock properties. This paper focuses on the low-field NMR T2 spectrum analysis technique. In the experiments, the basic frequency of the core NMR analyzer was 21 MHz, highlighting the response of micropores in the shale, which are the pores showing the relaxation time in the NMR T2 spectrum, less than the threshold time. After analyzing the relationship between breakthrough pressure and pore size, the threshold time is preferred to be 2 ms. In this study, the NMR T2 spectrum of shale core sample and its geometric mean are calculated from the NMR T2 spectrum of shale core sample in 100% water-saturated state and the NMR T2 spectrum of shale core sample in dry state. Then, the proportion of micropores is calculated from the NMR T2 spectrum. Finally, the model representing the relationship between the geometric mean of NMR T2 spectrum or the proportion of micropores and the breakthrough pressure of shale core sample is built to determine the gas breakthrough pressure of the shale core sample. The classification of experimental data is verified based on the different echo intervals of rock samples for validation of the mode (Figure 1).
3. Methodology and Model Establishment
3.1. Preparation of Shale Core Samples
For the experiment, shale sample plugs were first obtained. Typical shale cores were taken from different layers and depths of the Longmaxi Formation in the Sichuan Basin and the optimal samples were selected depending on physical properties. Due to the presence of shale bedding, which makes the shale fragile, the cores should be drilled carefully to ensure their integrity. Both ends of the shale samples at specific depth were grounded flat and then machined into sample plugs using the diamond wire process. The length, diameter and weight of the samples were measured after drying. Sample plugs selected have a length of 2.54–3.5 cm and diameter of 2.54 cm.
3.2. Low-Field NMR Measurement
The NMR experiment was conducted in two steps to measure the NMR T2 spectrum of dry shale core sample, the NMR T2 spectrum of shale core sample 100% saturated with formation water (a brine with an equivalent salinity to the formation water) and the NMR T2 spectrum of the original shale core sample. First, put the dry rock sample into the core NMR analyzer, set the parameters of the analyzer (e.g., waiting time, echo interval, scan number, gain, etc.) and measure the NMR decay curve of the dried rock sample. The curve is the transverse macroscopic magnetization vector decay curve, from which the NMR T2 spectrum of the dry rock sample was calculated. In practical measurement, a raw data decay curve was obtained by measuring the resonance signal of the fluid in the shale. Using the mathematical inversion algorithms (e.g., least square, singular value decomposition and transformed inversion), the T2 relaxation time spectrum of the sample was obtained. The morphological characteristics of the T2 relaxation time spectrum are controlled by three relaxation mechanisms: surface relaxation, bulk relaxation and diffusion relaxation [36]. Second, put the rock sample into a high-pressure core saturator with a pressure of 30 MPa (with set parameters, including waiting time, echo interval, scan number, gain, etc.) and hold for 48 h to completely saturate the pores of the sample with formation water; put the water-saturated sample into the core NMR analyzer and measure the NMR decay curve of the sample. This NMR decay curve is a transverse macroscopic magnetization vector decay curve, from which the NMR T2 spectrum of the water-saturated rock sample was calculated and the NMR decay curve was calculated by inversion.
3.3. Establishment of Calculation Model
The values of breakthrough pressure depend on the lithological difference, mineral composition, grain texture, pore development characteristics and fracture filling status of the rock [35]. The in-situ preservation conditions of shale gas are also closely related to the shale breakthrough pressure. Therefore, analyzing the breakthrough pressure variation of samples under different experimental conditions is important to identify the sealing capacity of shales under different burial conditions. The equations are:
where, a, b and c are the fitting coefficients reflecting data change rule, through data fitting, a = 10.16, b = −0.87, c = 0.19, which are related to the study area and layer, etc.
NMR T2 spectrum of shale core sample = NMR T2 spectrum of shale core sample in 100% water-saturated state − NMR T2 spectrum of shale core sample in dry state
4. Breakthrough Pressure Calculation Model
4.1. Physical Property Characterization of Shale Reservoir
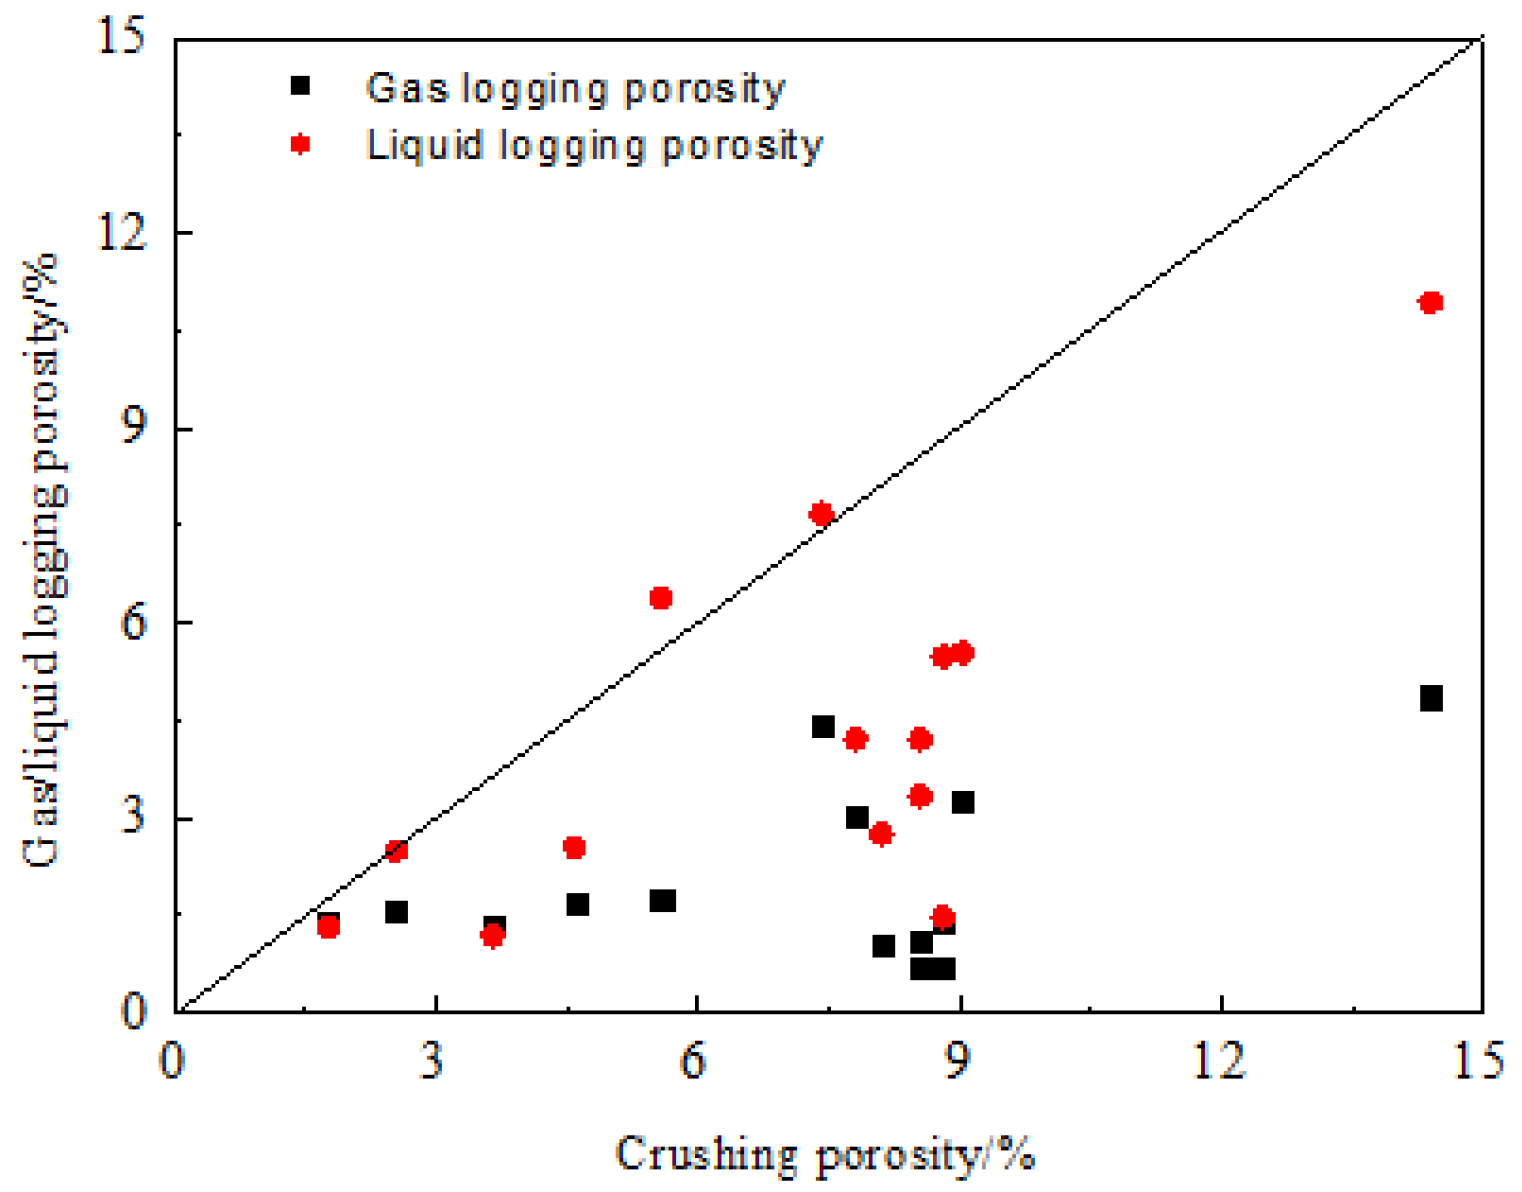
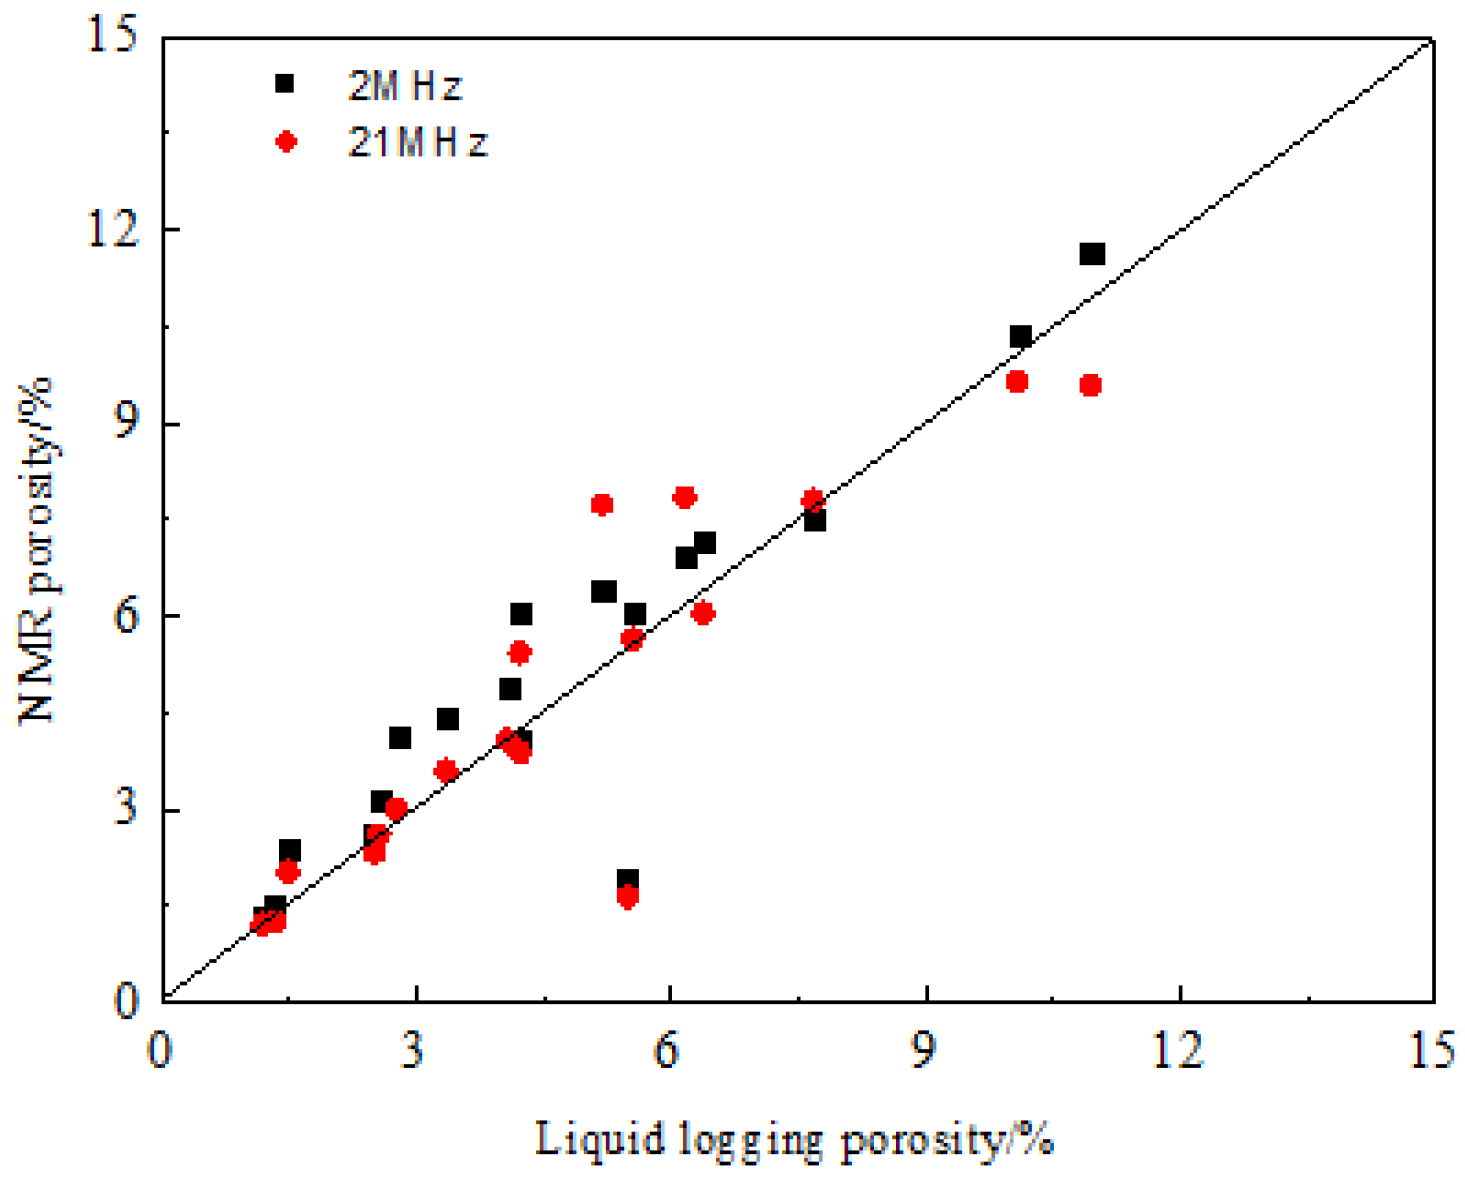
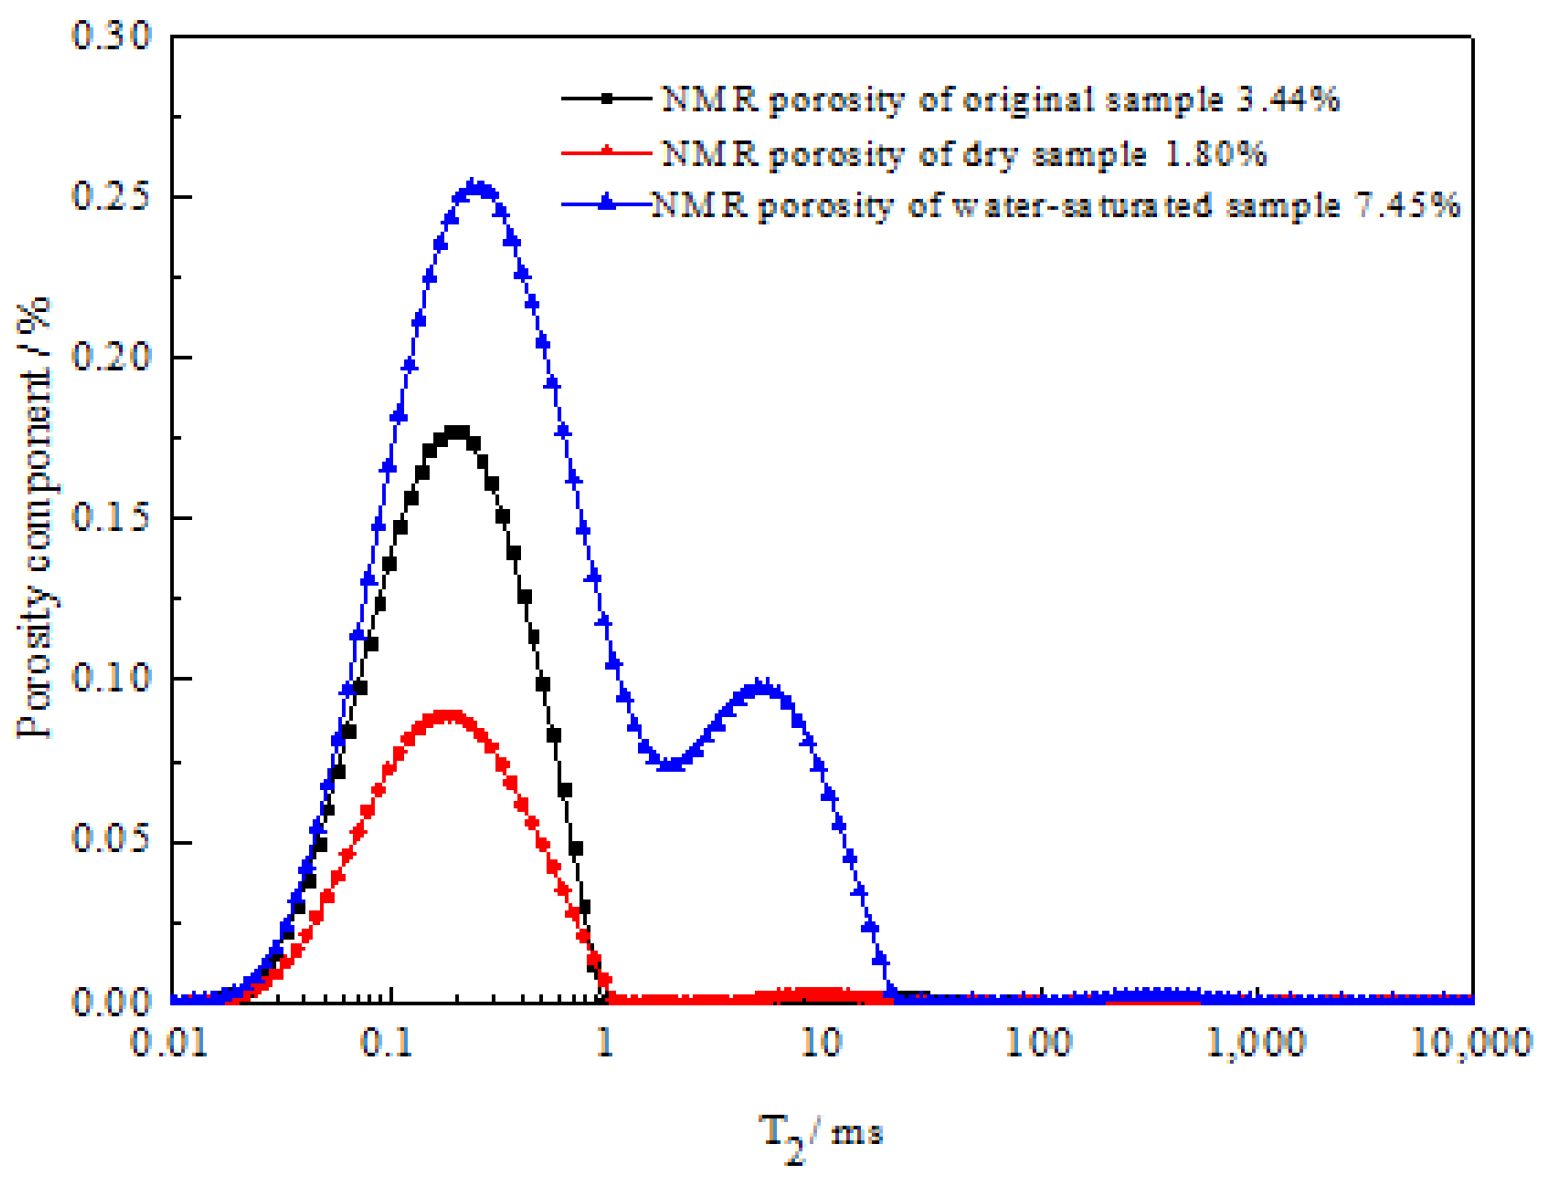
Core observations (Figure 2) reveal the basic characteristics of shales, such as tight lithology and presence of structural bedding. Depositional sequence and environment are also analyzed together to provide the basis for subsequent laboratory analysis. In this study, 14 shale core samples were collected. The porosity and permeability were obtained by gas logging and unsteady state methods, respectively. The NMR T2 spectra of dry sample and 100% water-saturated sample were measured at 2 MHz and 21 MHz, respectively and then scaled to porosity (Table 1). On the whole, the porosity measured by the crushing method (hereinafter referred to as “crushing porosity”) is the largest, the porosity measured by the gas logging method (hereinafter referred to as “gas logging porosity”) is the smallest and the porosity measured by the liquid logging method (hereinafter referred to as “liquid logging porosity”) is between the former two. The gas logging porosity represents connected pores, while the crushing porosity represents all pores, including dead pores and unconnected pores. The permeability ranges from tens of nanodarcies to a few millidarcies (Table 1). The existing porosity measurement methods are not satisfactory in terms of accuracy, especially for shale that has a strong heterogeneity, and the different measurement methods vary widely. Exceptionally, some samples exhibit less difference between the gas logging porosity and the liquid logging porosity and other samples reveal less difference between the crushing porosity and the liquid logging porosity (Figure 3). Moreover, the liquid logging porosity and the NMR porosity are roughly consistent, both around the 45° line (Figure 4). It is thus inferred that the liquid logging or NMR method can derive a more reasonable porosity. Figure 5 and Figure 6 show the NMR spectra of shale samples at different resonance frequencies. It can be seen that the shale NMRs at 2 MHz and 21 MHz are nearly the same when the shale physical properties are good. The NMR spectrum amplitude is found in an ascending order for the sample in dry state, original state and water-saturated state. The NMR spectrum of samples in the original and dry states falls between 0.01 and 1 ms, with the signals mainly from clay-bound water and nano-scale pore fluid. The NMR spectrum of sample in water-saturated state is wider, with obvious signals found at 1–10 ms. This indicates that the shale is characterized by diverse pore types and complex pore structure. Figure 7 shows that the saturated NMR T2 spectra of different samples make a great difference, so they are divided into three types (I,II,III) according to the morphology of NMR T2 spectra. The type I NMR T2 spectrum is characterized by a single peak (Figure 7 3 # sample) and the main peak is mainly distributed at 0.01–10 ms, indicating that the reservoir is dominated by micropore; they type II NMR T2 spectrum shows double peaks (Figure 7 6 # sample) and the two peaks are <1 ms and 1–100 ms, indicating that the reservoir is mostly mesopore; The type III NMR T2 spectrum is characterized by three peaks (Figure 7 12 # sample), the main peak is 0.01–1 ms, the second peak is 100–1000 ms and the third peak is 1–10 ms, indicating that the reservoir is mostly macropore. Table 1 shows that the permeability of No. 3, No. 6 and No. 12 samples increases in turn. It can be seen that the heterogeneity of type I to type III is increasing in shale reservoirs.
4.2. Shale NMR T2 Spectrum
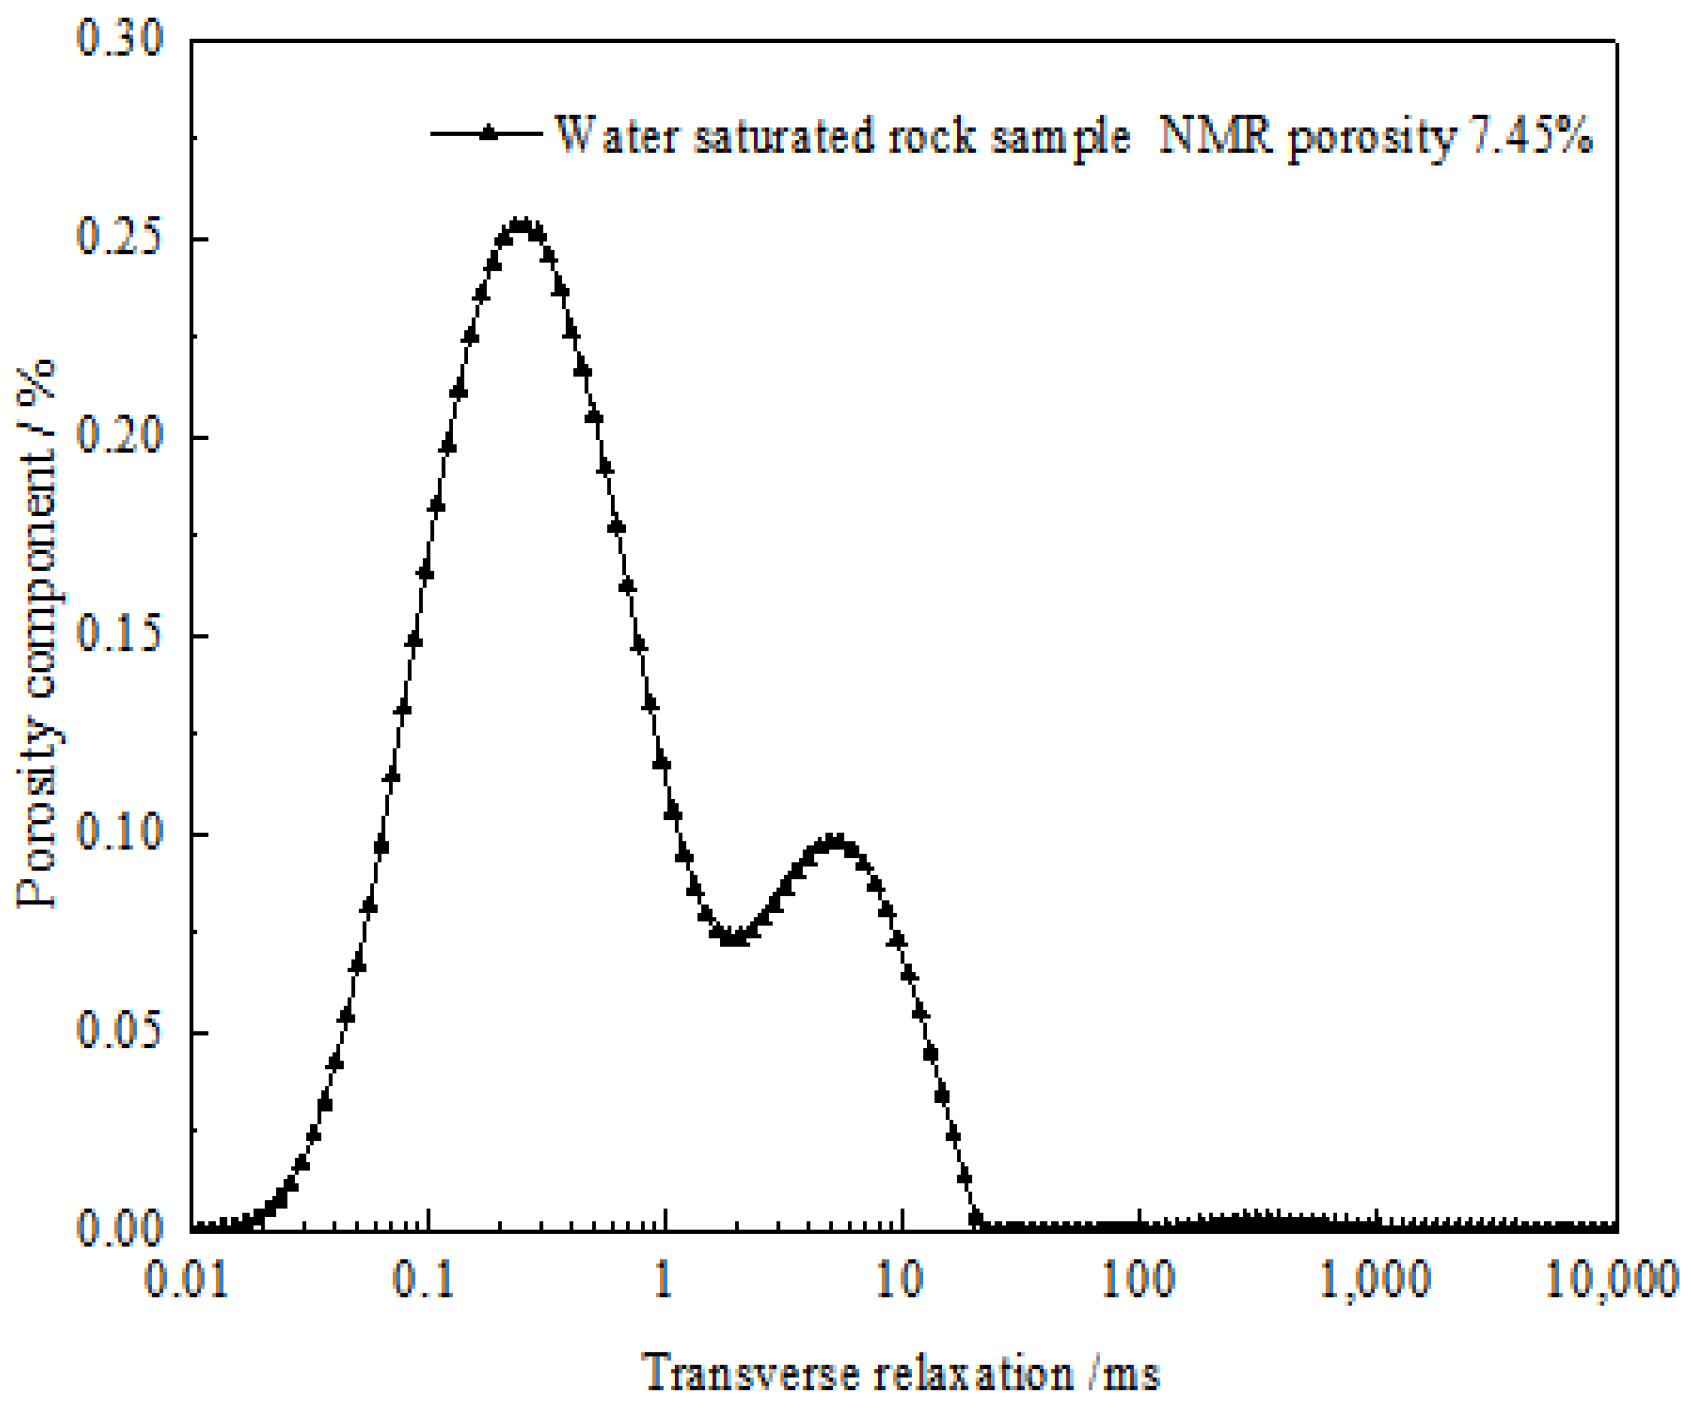
Rocks contain pores of different sizes and shapes, which are variable in T2 relaxation time. By relaxation time of 0.02–1 ms, 1–10 ms, 10–100 ms and 100–1000 ms, the pores are divided into four types: nanopores (2–100 nm), micropores (0.1–1.0 μm), mesopores (1–10 μm) and macropores (10–100 μm) [24]. The NMR T2 spectra of shale samples of different physical properties and pore sizes were obtained by NMR experiment at 21 MHz. Specifically, the NMR T2 spectrum of the dry rock sample has a relaxation time of 0.02–1 ms (Figure 8), corresponding to the type of nanopores/micropore, and mainly reflects the spectrum of the shale in the clay-bound water state. The NMR T2 spectrum of the water-saturated core sample changes from a single peak to a connected double peak, indicating the distribution of various pores that are connected to a certain extent. The left peak exhibits significantly increasing amplitude, with the relaxation time ranging from 0.02 ms to 1 ms, indicative of nanopores/micropores. The right peak has a relaxation time of 2–30 ms, suggesting micropores. The left peak shows a much larger amplitude than the right peak (Figure 9). When the pores in rock are small, the fluid therein cannot flow because it is bounded by capillary force. When the pores are large, the fluid can flow freely, which is reflected in the T2 spectrum by the existence of a relaxation time limit, i.e., the movable fluid cutoff [13]. Figure 9 shows the NMR T2 spectrum of the original shale core sample, which is very different from the T2 spectrum in Figure 8 and Figure 9. This provides a physical basis for the calculation of shale gas breakthrough pressure and the establishment of a relational model. According to the NMR T2 spectrum of the original shale core sample, the porosity is scaled to be 5.65%, which is very close to the liquid logging porosity (5.42%) of this sample. It is thus inferred that the NMR T2 spectrum provides pore fluid information (Figure 10).
4.3. Relationship between Gas Breakthrough Pressure and Relevant Parameters
Studies on shale pore characterization indicate that marine shale has the highest pore volume and the continental and transitional shales are similar in pore volume. The marine shale has a pore volume two to three times that of the other two lithofacies and provides the best storage space. According to the pore volume distribution, mesopores take the largest proportion (˃60%) in three facies of shale, while micropores and macropores are generally below 40% [37]. The mesopore volume in shale varies greatly with the degree of thermal evolution. It keeps increasing when Ro is less than 1.6% and tends to decrease when Ro is 1.6–2.2% due to the generated hydrocarbons which occupy a certain pore space. When Ro is greater than 2.2%, the volume of mesopores and micropores increases, because more space is released by hydrocarbon cracking into gas [38]. According to the above research results, the distribution of micropores can be basically identified through analysis of shale NMR T2 spectrum. The geometric mean of NMR T2 spectrum and the proportion of micropores in the shale core sample are calculated and then correlated with the gas breakthrough pressure, obtained by the high-temperature, breakthrough pressure tester, which can stimulate formation conditions, ensure that the measurement results reflect the real situation of the formation and then calculate the gas breakthrough pressure value. It is found that the gas breakthrough pressure is power-exponentially related to the geometric mean of NMR T2 spectrum and the gas breakthrough capacity is inversely proportional to the pore size. With the increase in the geometric mean of NMR T2 spectrum, the gas breakthrough pressure decreases, allowing the gas breakthrough to be less difficult (Figure 11). On this basis, the relationship between the geometric mean of NMR T2 spectrum or proportion of micropores and the gas breakthrough pressure is analyzed. As shown in Figure 12, the gas breakthrough pressure is positively related to the proportion of micropores, that is, the higher the proportion of micropores, the higher the gas breakthrough pressure, suggesting that the gas breakthrough is more difficult. Studies on shale reveal that marine shale contains abundant micropores in addition to mesopores, which is attributed to the presence of numerous organic pores. Transitional shale exhibits a high content of clay minerals, leading to a higher abundance of mesopores and the micropore development between marine shale and continental shale. Continental shale is dominated by mesopores, with a comparable amount of micropores and macropores [37]. Marine shale generally has a higher proportion of micropores than the other two lithofacies, so the gas breakthrough in marine shale is more difficult. Thus, marine shale can be a high-quality caprock.
4.4. Validation of the Gas Breakthrough Pressure Calculation Model
Breakthrough pressure is an important parameter to evaluate the sealing capacity of caprocks for hydrocarbon traps. The comparison reveals a linear error of 5.3% between the predicted gas breakthrough pressure by low-field NMR and the measured gas breakthrough pressure, suggesting a high linearity, which indicates that the accuracy is high (Figure 13). The measured gas breakthrough pressure was obtained using HTHP breakthrough pressure tester from saturated rock samples. In order to make the measurement results truly reflect the formation conditions, the real formation conditions were basically simulated on the measurement conditions. The gas breakthrough pressure was accurately obtained using the gas breakthrough pressure measurement method. Multiple measured gas breakthrough pressure values of core samples were matched with the predicted gas breakthrough pressure calculated by the low-field NMR model to establish a linear relation between the predicted gas breakthrough pressure and the measured gas breakthrough pressure. Then, the measured gas breakthrough pressure was substituted into the linear equation to obtain the real value of gas breakthrough pressure. Thus, the correction of gas breakthrough pressure was realized.
5. Application
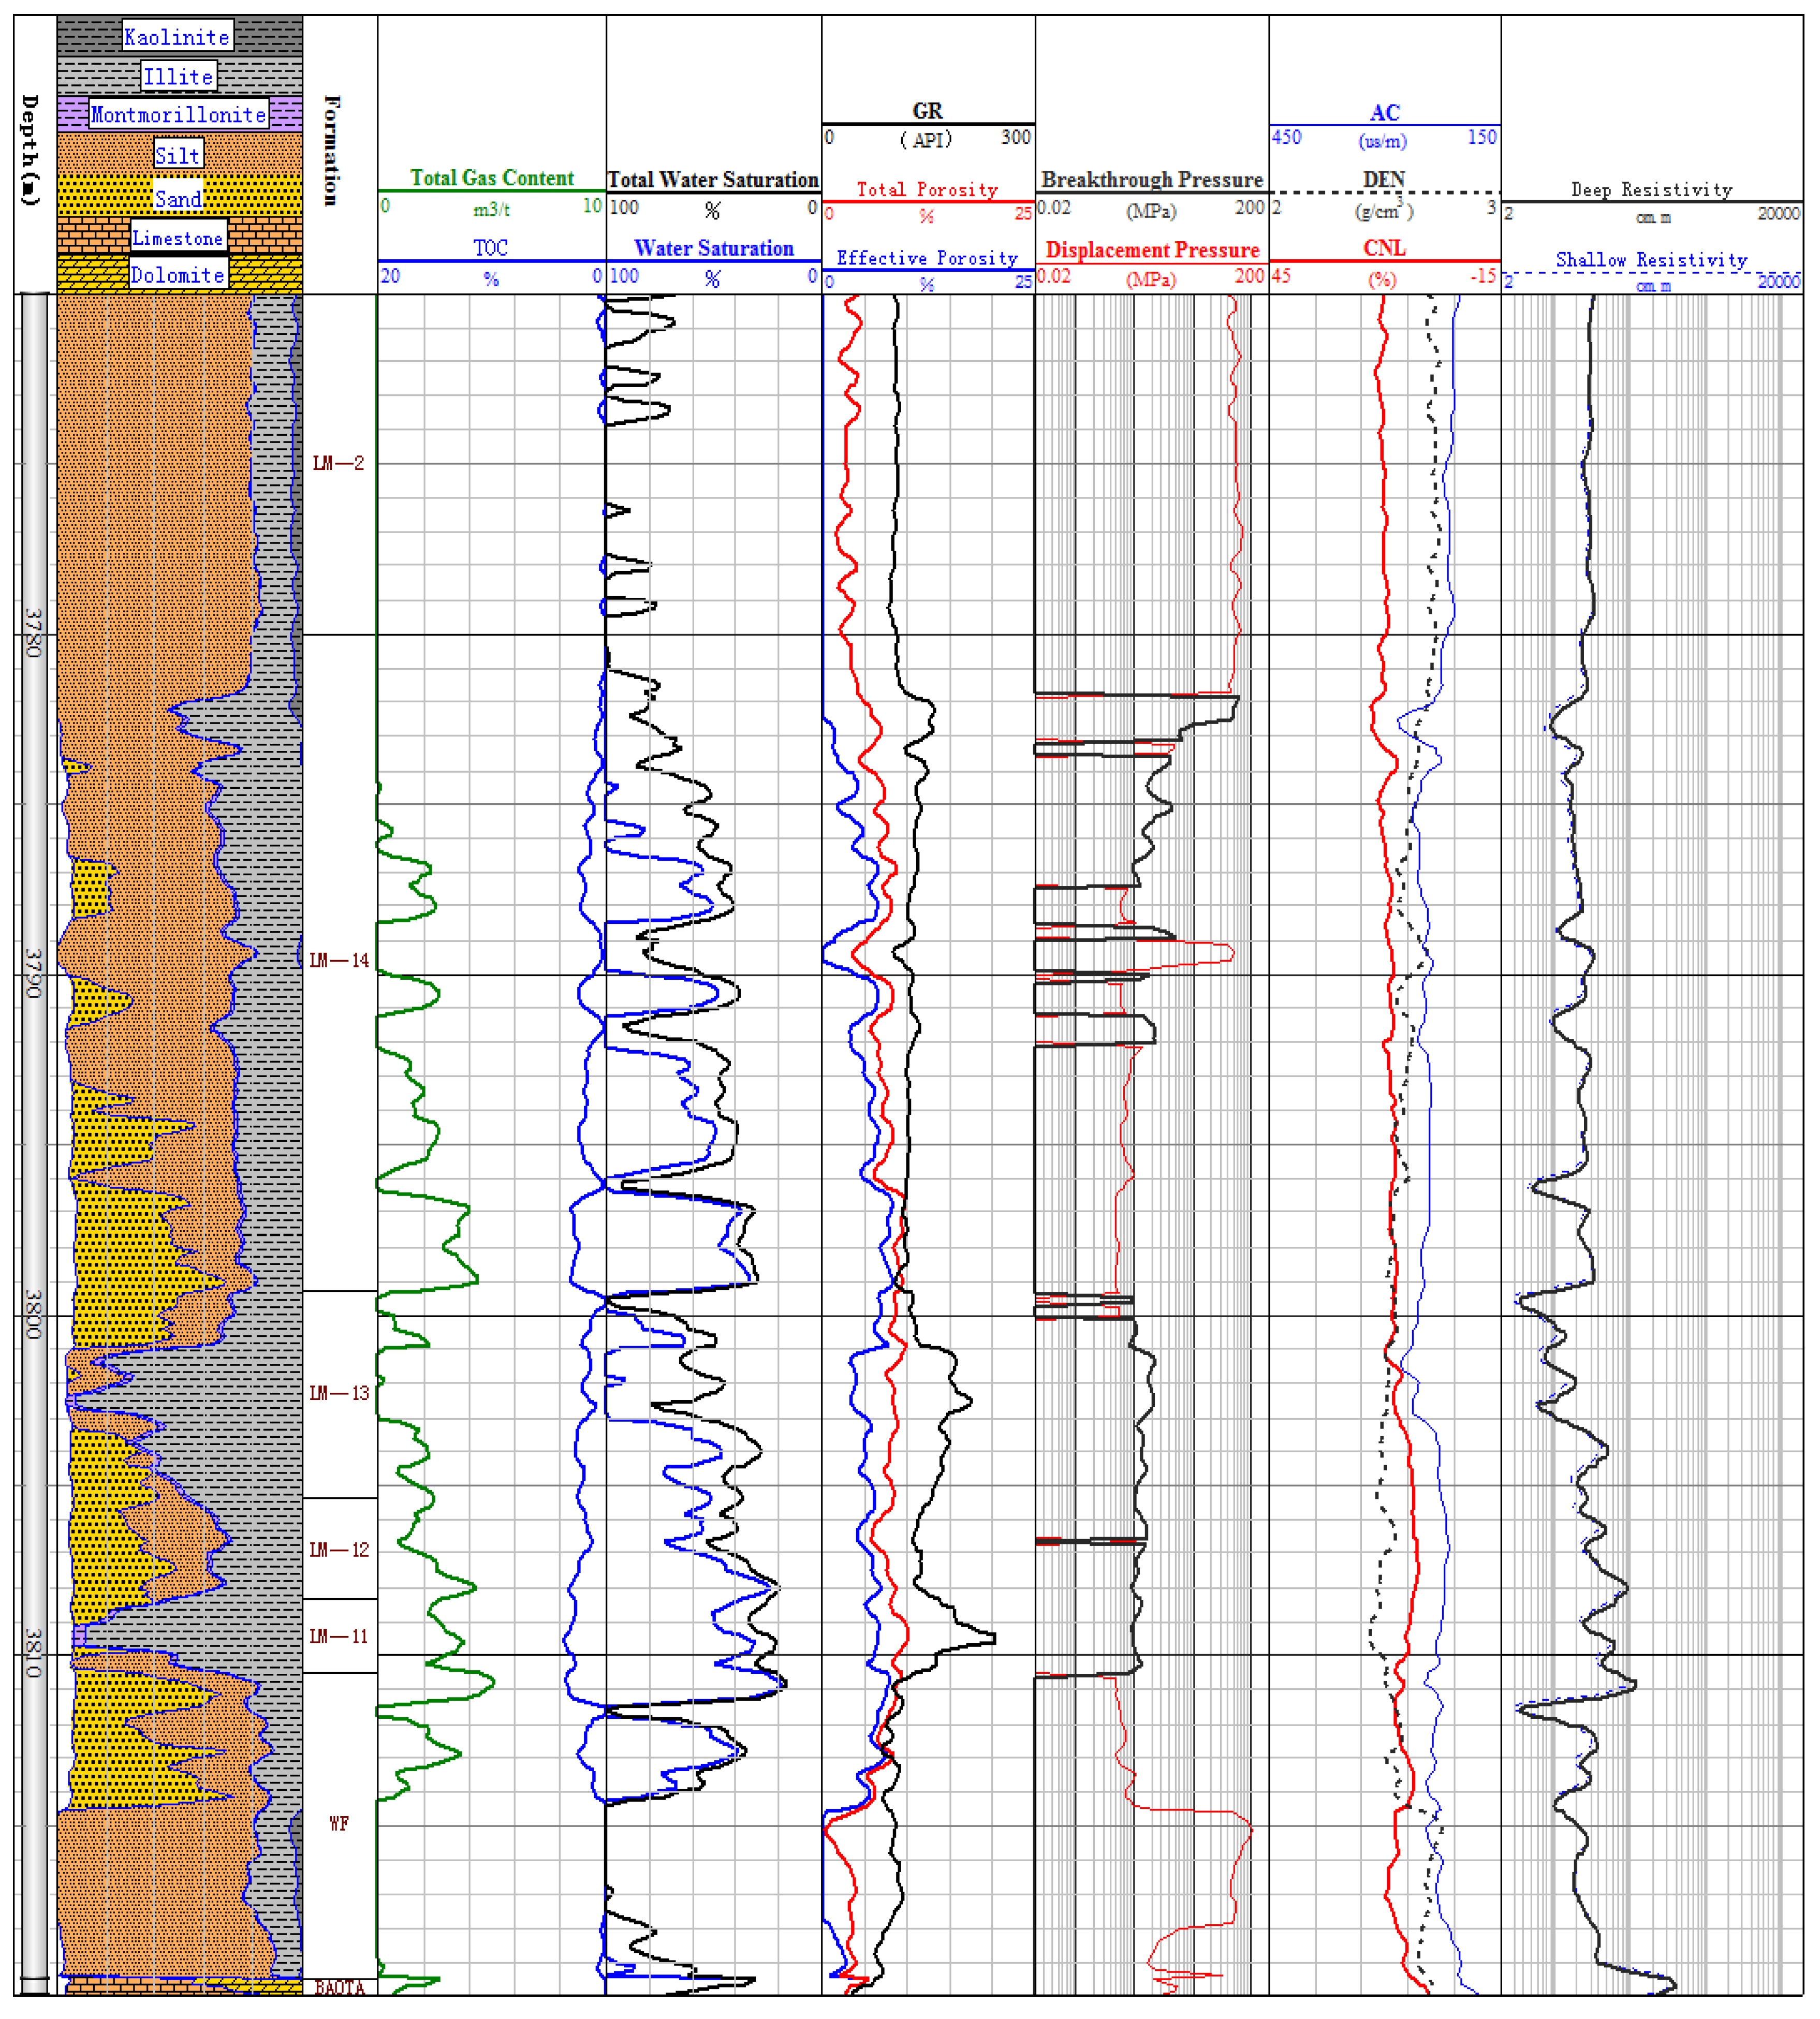
The shale breakthrough pressure calculation method based on low-field NMR, unlike the methods based on conventional logging data (e.g., acoustic and resistivity) which do not consider the influence of pore structure on the breakthrough pressure, effectively improves the accuracy of gas breakthrough pressure calculation and can quickly and accurately obtain shale gas breakthrough pressure values for application in the evaluation and comprehensive characterization of shale oil and gas. Conventional logging methods mostly realize the calculation of breakthrough pressure based on the logging-derived total porosity and effective porosity and can comprehensively reflect the logging-interpreted physical parameters of caprocks. Therefore, the results can be used to discriminate the strength of physical sealing capacity and the quality of caprocks [39]. Compared with conventional gas logging methods, the NMR method can obtain the total porosity of a sample, but also classify different porosities according to the type of pore fluid in the sample [40]. Figure 14 shows the calculated breakthrough pressure of the deep shale caprocks of the Longmaxi Formation, southern Sichuan Basin. It indicates that the caprocks from L111 to L114 have high breakthrough pressure and act as good seals for both the L111 and Wufeng Formation high-quality shale gas reservoirs. Based on the conventional logging results (including thickness of dark shale, TOC, maturity, gas content, brittle mineral content, etc.), the proposed gas breakthrough pressure calculation method by low-field NMR can be used to continuously calculate and evaluate the gas breakthrough pressure shale caprocks by virtue of the continuity of NMR logging. Thus, the shale gas preservation conditions and the high-quality shale sweet points can be comprehensively identified. This provides a new technique for studying the sealing capacity of shale caprocks.
6. Conclusions
Based on the experimental measurements and the theoretical analysis of the experimental results, the gas breakthrough pressure calculation method by low-field NMR is used to clearly understand the sealing capacity of shale. The main conclusions are as follows.
- (1)
- The gas breakthrough pressure of shale is power-exponentially related to the geometric mean of NMR T2 spectrum. As the geometric mean increases, the gas breakthrough becomes less difficult.
- (2)
- The gas breakthrough pressure of shale is related to the shale pore diameter and pore size, inversely related to the pore diameter and positively related to the proportion of micropores. The higher the proportion of micropores, the more difficult the gas breakthrough.
- (3)
- There is a linear relationship between the measured gas breakthrough pressure of saturated rock sample using the HTHP breakthrough pressure tester and the predicted gas breakthrough pressure calculated by the low-field NMR gas breakthrough pressure model. On this basis, the gas breakthrough pressure can be corrected, allowing an objective evaluation of the sealing capacity of caprocks.
- (4)
- The proposed theoretical model has been successfully applied. The technique of NMR logging evaluation on sealing capacity of shale is worthy of promotion. It extends the application of NMR logging to efficiently solve practical challenges.
- (5)
- The fitting coefficients of a, b and c will vary from different regions and different layers and there is no uniform coefficient. Therefore, the future research direction is to unify the fitting coefficients.
Author Contributions
J.X.: Conceptualization, Data curation, Formal analysis, Methodology, Validation, Visualization, Validation, Writing-Original draft. Y.X.: Investigation, Resources, Writing—Review & Editing, Funding acquisition. X.G.: Project administration, Software, Supervision, Funding acquisition. T.Z.: Writing—Review & Editing. All authors have read and agreed to the published version of the manuscript.
Funding
Sponsored by CNPC major projects (2022DJ8005), CNPC Innovation Found (2021DQ02-0402) and National Nature Science Foundation of China (42174142).
Institutional Review Board Statement
Not applicable.
Informed Consent Statement
Not applicable.
Data Availability Statement
Not applicable.
Conflicts of Interest
The authors declare no conflict of interest.
Nomenclature
| NMR | Nuclear Magnetic Resonance |
| T2 | longitudinal relaxation time |
| CT | computed tomography |
| T1 | transverse relaxation time |
| MHz | Mega Hertz |
| the proportion of micropores | |
| the area of micropores in the NMR T2 spectrum | |
| the total area of the NMR T2 spectrum | |
| the geometric mean of NMR T2 spectrum | |
| the gas breakthrough pressure | |
| Ro | reflectance of vitrinite |
| HTHP | high temperature and high pressure |
| TOC | total organic carbon |
References
- Li, J.R.; Yang, Z.; Wu, S.T.; Pan, S.Q. Key issues and development direction of petroleum geology research on source rock strata in China. Adv. Geo-Energy Res. 2021, 5, 121–126. [Google Scholar] [CrossRef]
- Hu, W.X.; Lu, X.C.; Fan, M.; Zhang, D.W.; Cao, J. Advances in the research of shale caprocks: Type, micropore characteristics and sealing mechanisms. Bull. Mineral. Petrol. Geochem. 2019, 38, 885–897. [Google Scholar] [CrossRef]
- Hinai, A.A.; Rezaee, R.; Esteban, L.; Labani, M. Comparisons of pore size distribution: A case from the Western Australian gas shale formations. J. Unconv. Oil Gas Resour. 2014, 8, 1–13. [Google Scholar] [CrossRef]
- Krooss, B.M.; Leythaeuser, D. Diffusion of methane and ethane through the reservoir caprock: Implications for the timing and duration of catagenesis: Discussion. AAPG Bull. 1997, 81, 155–161. [Google Scholar] [CrossRef]
- Boulin, P.F.; Brretonnier, P.; Vassil, V.; Samouillet, A.; Fleury, M.; Lombard, J.M. Sealing efficiency of caprocks: Experimental investigation of entry pressure measurement methods. Mar. Pet. Geol. 2013, 48, 20–30. [Google Scholar] [CrossRef]
- Arif, M.; Barifcani, A.; Lebedev, M.; Iglauer, S. Structural trapping capacity of oil-wet caprock as a function of pressure, temperature and salinity. Int. J. Greenh. Gas Control. 2016, 50, 112–120. [Google Scholar] [CrossRef]
- Fu, G.; Hu, M.; Yu, D. Volcanic caprock type and evaluation of sealing gas ability: An example of Xujiaweizi depression. J. Jilin Univ. 2010, 40, 237–244. [Google Scholar] [CrossRef]
- Fan, M.; Chen, H.Y.; Yu, L.J.; Zhang, W.T.; Liu, W.X.; Bao, Y.J. Evaluation standard of mudstone caprock combining specific surface area and breakthrough pressure. Pet. Geol. Exp. 2011, 33, 87–90. [Google Scholar] [CrossRef]
- Li, S.J.; Zhou, Y.; Sun, D.S. Rock mechanic experiment study of evaluation on caprock effectiveness. Pet. Geol. Exp. 2013, 35, 574–578. [Google Scholar] [CrossRef]
- Kawaura, K.; Akaku, K.; Nakano, M.; Ito, D.; Takahashi, T.; Kiriakehata, S. Examination of methods to measure capillary threshold pressures of pelitic rock samples. Energy Procedia 2013, 37, 5411–5418. [Google Scholar] [CrossRef] [Green Version]
- Yao, Y.B.; Liu, D.M. Comparison of low-field NMR and mercury intrusion porosimetry in characterizing pore size distributions of coals. Fuel 2012, 95, 152–158. [Google Scholar] [CrossRef]
- Clarkson, C.R.; Solano, N.; Bustin, R.M.; Bustin, A.M.M.; Blach, T.P. Pore structure characterization of North American shale gas reservoirs using USANS/SANS, gas adsorption, and mercury intrusion. Fuel 2013, 103, 606–616. [Google Scholar] [CrossRef]
- Liu, Z.J.; Yang, D.; Shao, J.X.; Hu, Y.Q. Evolution of pore connectivity in the Fushun oil shale by low-field nuclear magnetic resonance spectroscopy. Chin. J. Magn. Reson. 2019, 36, 309–318. [Google Scholar] [CrossRef]
- Zhang, Z.; Yan, J.; Hua, S.; Chen, H.H.; Liu, H.Q.; Zhang, Z.H. A new method of field NMR analysis on physical properties of shale oil reservoirs. Annu. Meet. Chin. Geosci. Union 2020, 2020, 2678–2681. [Google Scholar] [CrossRef]
- Zhao, P.Q.; Sun, Z.C.; Luo, X.P.; Wang, Z.L.; Mao, Z.Q.; Wu, Y.Z.; Xia, P. Study on the response mechanisms of nuclear magnetic resonance (NMR) log in tight oil reservoirs. Chin. J. Geophys. 2016, 5, 1927–1937. [Google Scholar] [CrossRef]
- Li, G.Y.; Ma, Z.L.; Zheng, J.X.; Pao, F.; Zheng, L.J. NMR analysis of the physical change of oil shales during in situ pyrolysis at different temperatures. Pet. Geol. Exp. 2016, 38, 402–406. [Google Scholar] [CrossRef]
- Kausik, R.; Fellah, K.; Rylander, E.; Singer, P.M.; Lewis, R.E. NMR Petrophysics for tight oil shale enabled by core resaturation. In Proceedings of the Society of Core Analysts, Avignon, France, 8–11 September 2014. [Google Scholar]
- Li, Z.Q.; Qi, Z.Y.; Shen, X.; Hu, R.L.; Huang, R.Q.; Han, Q. Research on quantitative analysis for nanopore structure characteristics of shale based on NMR and NMR cryoporometry. Energy Fuels 2017, 31, 5844–5853. [Google Scholar] [CrossRef]
- Mitchell, J.; Gladden, L.F.; Chandrasekera, T.C.; Fordham, E.J. Low-field fermanent magnets for industrial process and quality control. Prog. Nucl. Magn. Reson. Spectrosc. 2014, 76, 1–60. [Google Scholar] [CrossRef]
- Liu, B.; Yao, S.P.; Hu, W.X.; Cao, J.; Xie, D.L. Application of nuclear magnetic resonance cryoporometry in unconventional reservoir rocks. Acta Pet. Sin. 2017, 38, 1401–1410. [Google Scholar] [CrossRef]
- Xu, H.; Tang, D.Z.; Zhao, J.L.; Li, S. A precise measurement method for shale porosity with low-field nuclear magnetic resonance: A case study of the Carboniferous-Permian strata in the Linxing area, eastern Ordos Basin, China. Fuel 2015, 143, 47–54. [Google Scholar] [CrossRef]
- Li, C.X. Geology & experiment technologies of Wuxi Research Institute of Petroleum Geology, Sinopec Exploration & Production Research Institute—NMR core analysis technology. Pet. Geol. Exp. 2021, 43, 374. [Google Scholar]
- Yao, Y.B.; Liu, D.M. Petrophysical properties and fluids transportation in gas shale: A NMR relaxation spectrum analysis method. J. China Coal Soc. 2018, 43, 181–189. [Google Scholar] [CrossRef]
- Li, Z.Q.; Sun, Y.; Hu, R.L.; Zhao, Y.; Peng, Y. Quantitative analysis for nanopore structure characteristics of shales using NM4 and NMR cryoporometry. J. Eng. Geol. 2018, 26, 758–766. [Google Scholar] [CrossRef]
- Straley, C.; Rossini, D.; Vinegar, H.J.; Tutunjian, P.N.; Morriss, C.E. Core analysis by low-field NM. Log Anal. 1997, 38, 84–93. [Google Scholar]
- Bai, S.T.; Cheng, D.J.; Wan, J.B.; Yang, L.; Peng, H.L.; Gou, X.K.; Zeng, J.B. Quantitative characterization of sandstone NMR T2 spectrum. Acta Pet. Sin. 2016, 37, 382–391. [Google Scholar]
- Tan, M.J.; Zhao, W.J. Description of carbonate reservoirs with NMR log analysis method. Prog. Geophys. 2006, 21, 489–493. [Google Scholar] [CrossRef]
- Yao, Y.; Liu, D.; Yao, C.; Tang, S.; Huang, W. Petrophysical characterization of coals by low-field nuclear magnetic resonance (NMR). Fuel 2010, 89, 1371–1380. [Google Scholar] [CrossRef]
- Xue, X.H.; Ye, J.G. Application of NMR techniques in CBM exploration. Reserv. Eval. Dev. 2013, 3, 72–74. [Google Scholar] [CrossRef]
- Zhou, S.W.; Liu, H.L.; Yan, G.; Xue, H.Q.; Gou, W. NMR research of movable fluid and T2 cutoff of marine shale in South China. Oil Gas Geol. 2016, 37, 612–616. [Google Scholar]
- Jiang, Y.Q.; Liu, X.W.; Fu, Y.H.; Chen, H.; Zhang, H.J.; Yan, J.; Chen, C.; Gu, Y.F. Evaluation of effective porosity in marine shale reservoir, western Chongqing. Acta Pet. Sin. 2019, 40, 1233–1243. [Google Scholar] [CrossRef]
- Zhang, J.C.; Zhang, G.; Qin, Y.Y. Study and application of NMR T2 spectrum decomposition method. In Proceedings of the International Field Exploration and Development Conference 2021, Qingdao, China, 20–22 October 2021; Volume II. [Google Scholar] [CrossRef]
- Li, J.J.; Yin, J.X.; Zhang, Y.N.; Lu, S.F.; Wang, W.M.; Li, J.B.; Meng, Y.L. A comparison of experimental methods for describing shale pore features—A case study in the Bohai Bay Basin of eastern China. Int. J. Coal Geol. 2015, 152, 39–49. [Google Scholar] [CrossRef]
- Gomaa, A.M.; Zhang, B.; Chen, J.; Qu, Q.; Nelson, S. Innovative use of NMR to study the fracture fluid propagation in shale formation. SPE Hydraulic Fracturing Technology Conference. Soc. Pet. Eng. 2014, 1–13. [Google Scholar] [CrossRef]
- Zhang, L.; Guo, J.Y.; Lin, T.; Xie, Z.Y.; Yang, C.L.; Dong, C.Y.; Gou, Z.Q.; Hao, A.S. Influencing factors for breakthrough pressure of carbonate caprocks. Pet. Geol. Exp. 2021, 43, 461–467. [Google Scholar] [CrossRef]
- Chen, J.Y. A Study of Shale Adsorption Characteristics by Using Low Field Nuclear Magnetic Resonance Technology; China University of Geosciences: Beijing, China, 2016. [Google Scholar] [CrossRef]
- Guo, S.B.; Wang, Z.L.; Ma, X. Exploration prospect of shale gas with Permian transitional facies of some key areas in China. Pet. Geol. Exp. 2021, 43, 377–385. [Google Scholar] [CrossRef]
- Jiang, Z.X.; Song, Y.; Tang, X.L.; Li, Z.; Wang, X.M.; Wang, G.Z.; Xue, Z.X.; Li, X.; Zhang, K.; Chang, J.Q.; et al. Controlling factors of marine shale gas differential enrichment in southern China. Pet. Explor. Dev. 2020, 47, 617–628. [Google Scholar] [CrossRef]
- Xiao, Y.F.; Shi, Q.; Chen, P.; Wang, X.Q.; Liu, F.X. Study on methods of logging evaluation on gas seals. In Proceedings of the 2016 Natural Gas Conference, Yinchuan, Beijing, 27–29 September 2016. [Google Scholar]
- Prammer, M.G.; Drack, E.D.; Bouton, J.C.; Gardner, J.S.; Miller, M.N. Measurements of clay-bound water and total porosity by magnetic resonance logging. Log Anal. 1996, 37, 61–80. [Google Scholar] [CrossRef]
Figure 1.
Flowchart of the calculation model.

Figure 2.
Core samples of shale.

Figure 3.
Crushing porosity vs. gas/liquid logging porosity.

Figure 4.
Liquid logging porosity vs. NMR porosityore samples of shale.

Figure 5.
Shale NMR at 2 MHz.
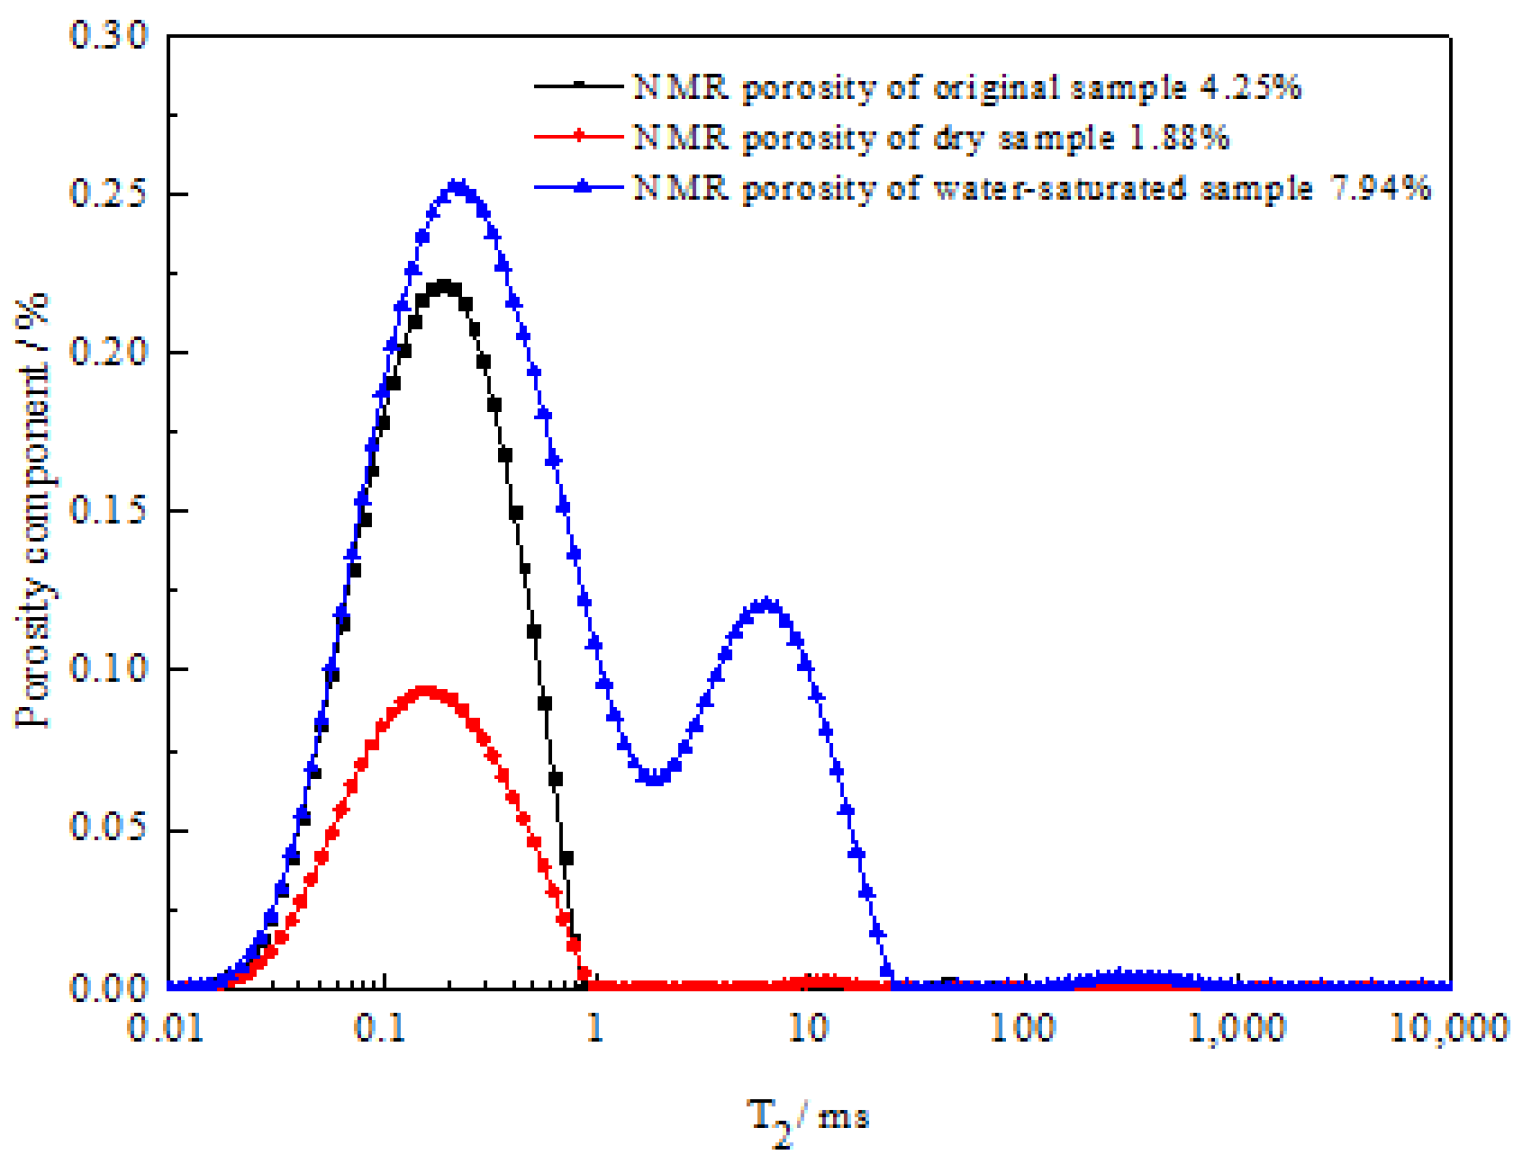
Figure 6.
Shale NMR at 21 MHz.

Figure 7.
NMR T2 distribution and schematic diagram of pore structure parameter calculation.

Figure 8.
NMR T2 spectrum of dry rock sample (single peak).
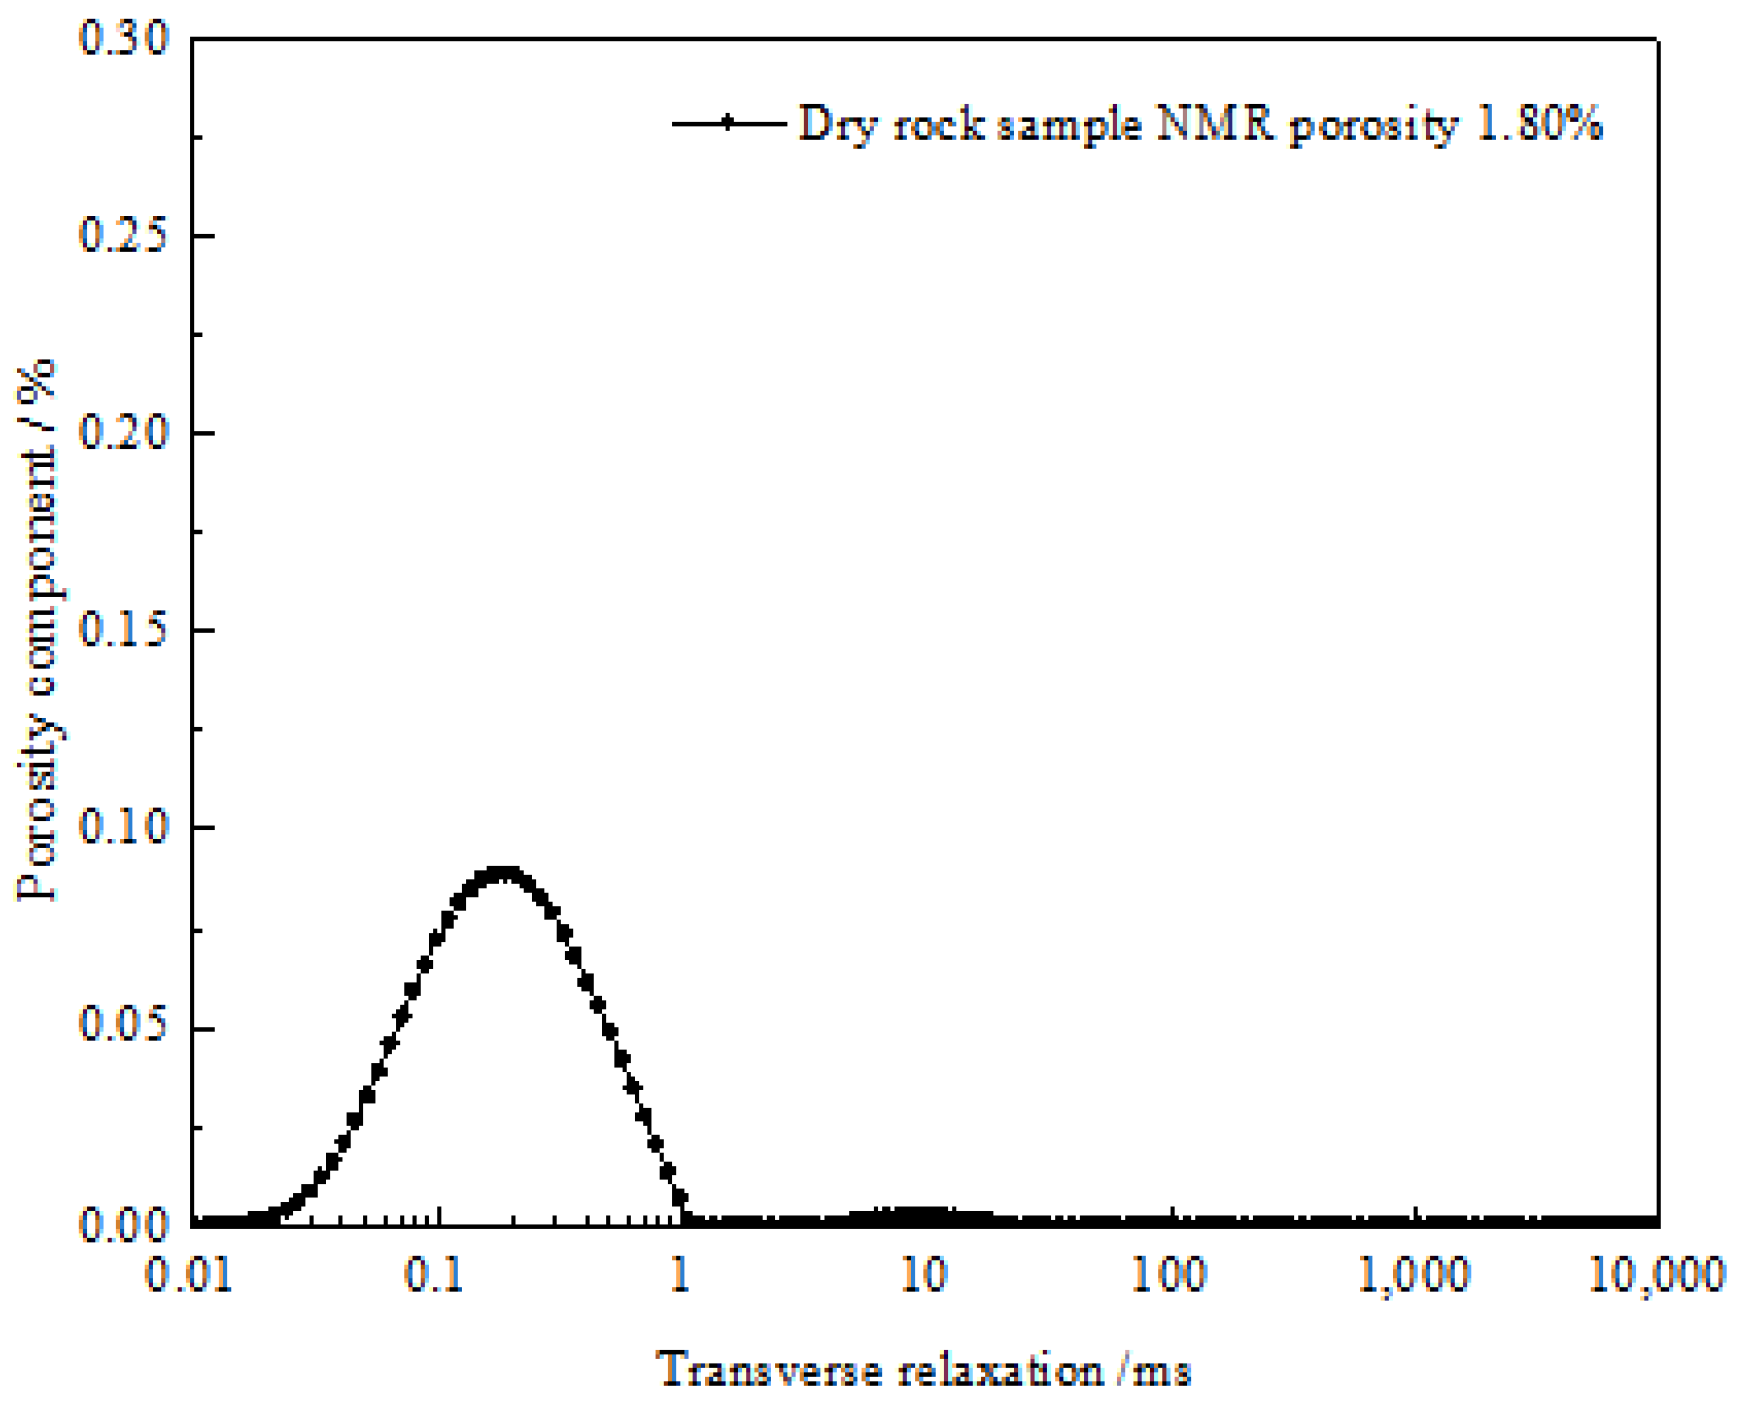
Figure 9.
NMR T2 spectrum of water-saturated rock sample (single peak to double peak).

Figure 10.
NMR T2 spectrum of original rock sample-liquid logging porosity (5.42%).
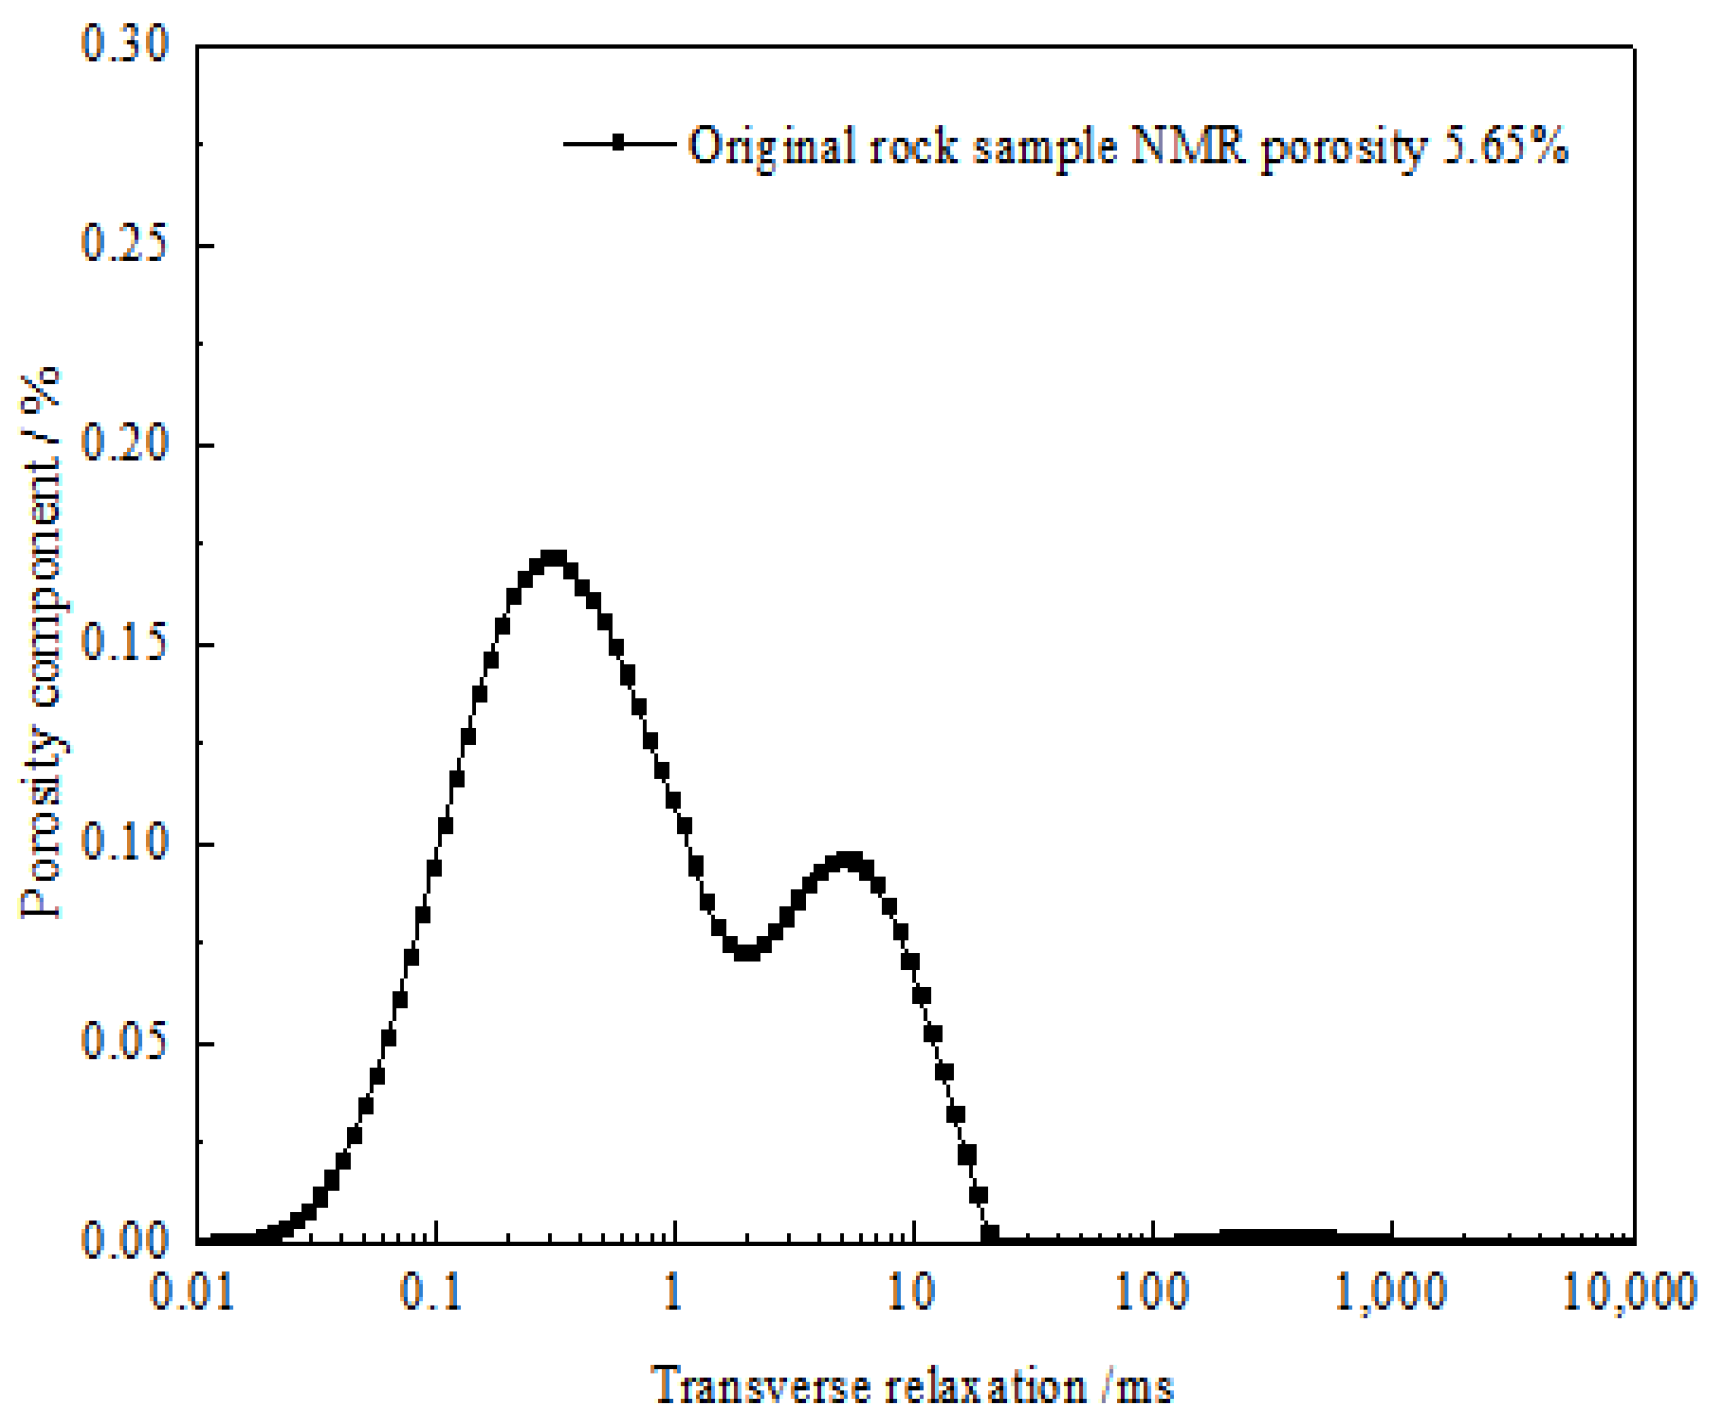
Figure 11.
Gas breakthrough pressure vs. geometric mean of NMR T2 spectrum.
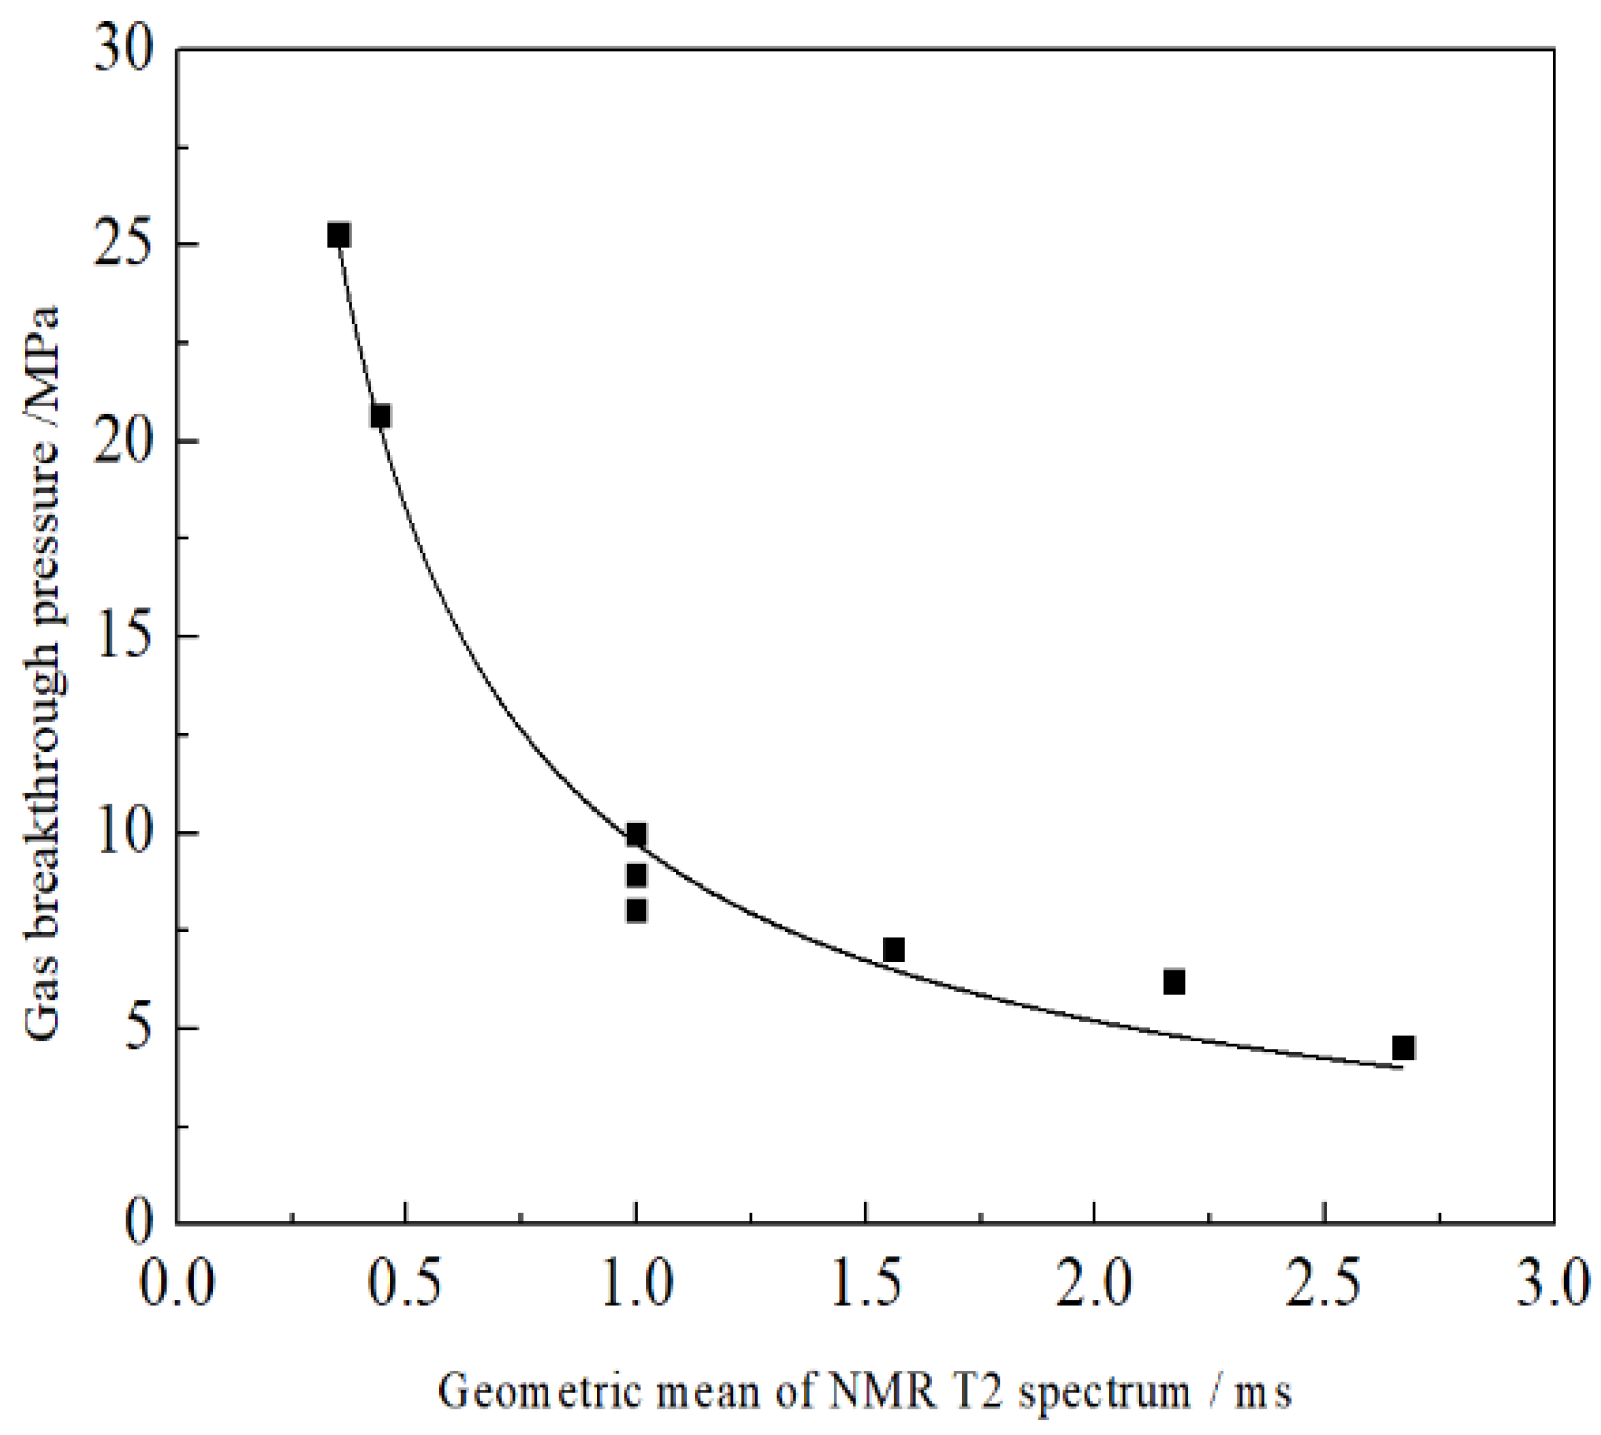
Figure 12.
Gas breakthrough pressure vs. proportion of micropores.

Figure 13.
Linear relation between predicted gas breakthrough pressure and measured gas breakthrough pressure.
Figure 13.
Linear relation between predicted gas breakthrough pressure and measured gas breakthrough pressure.
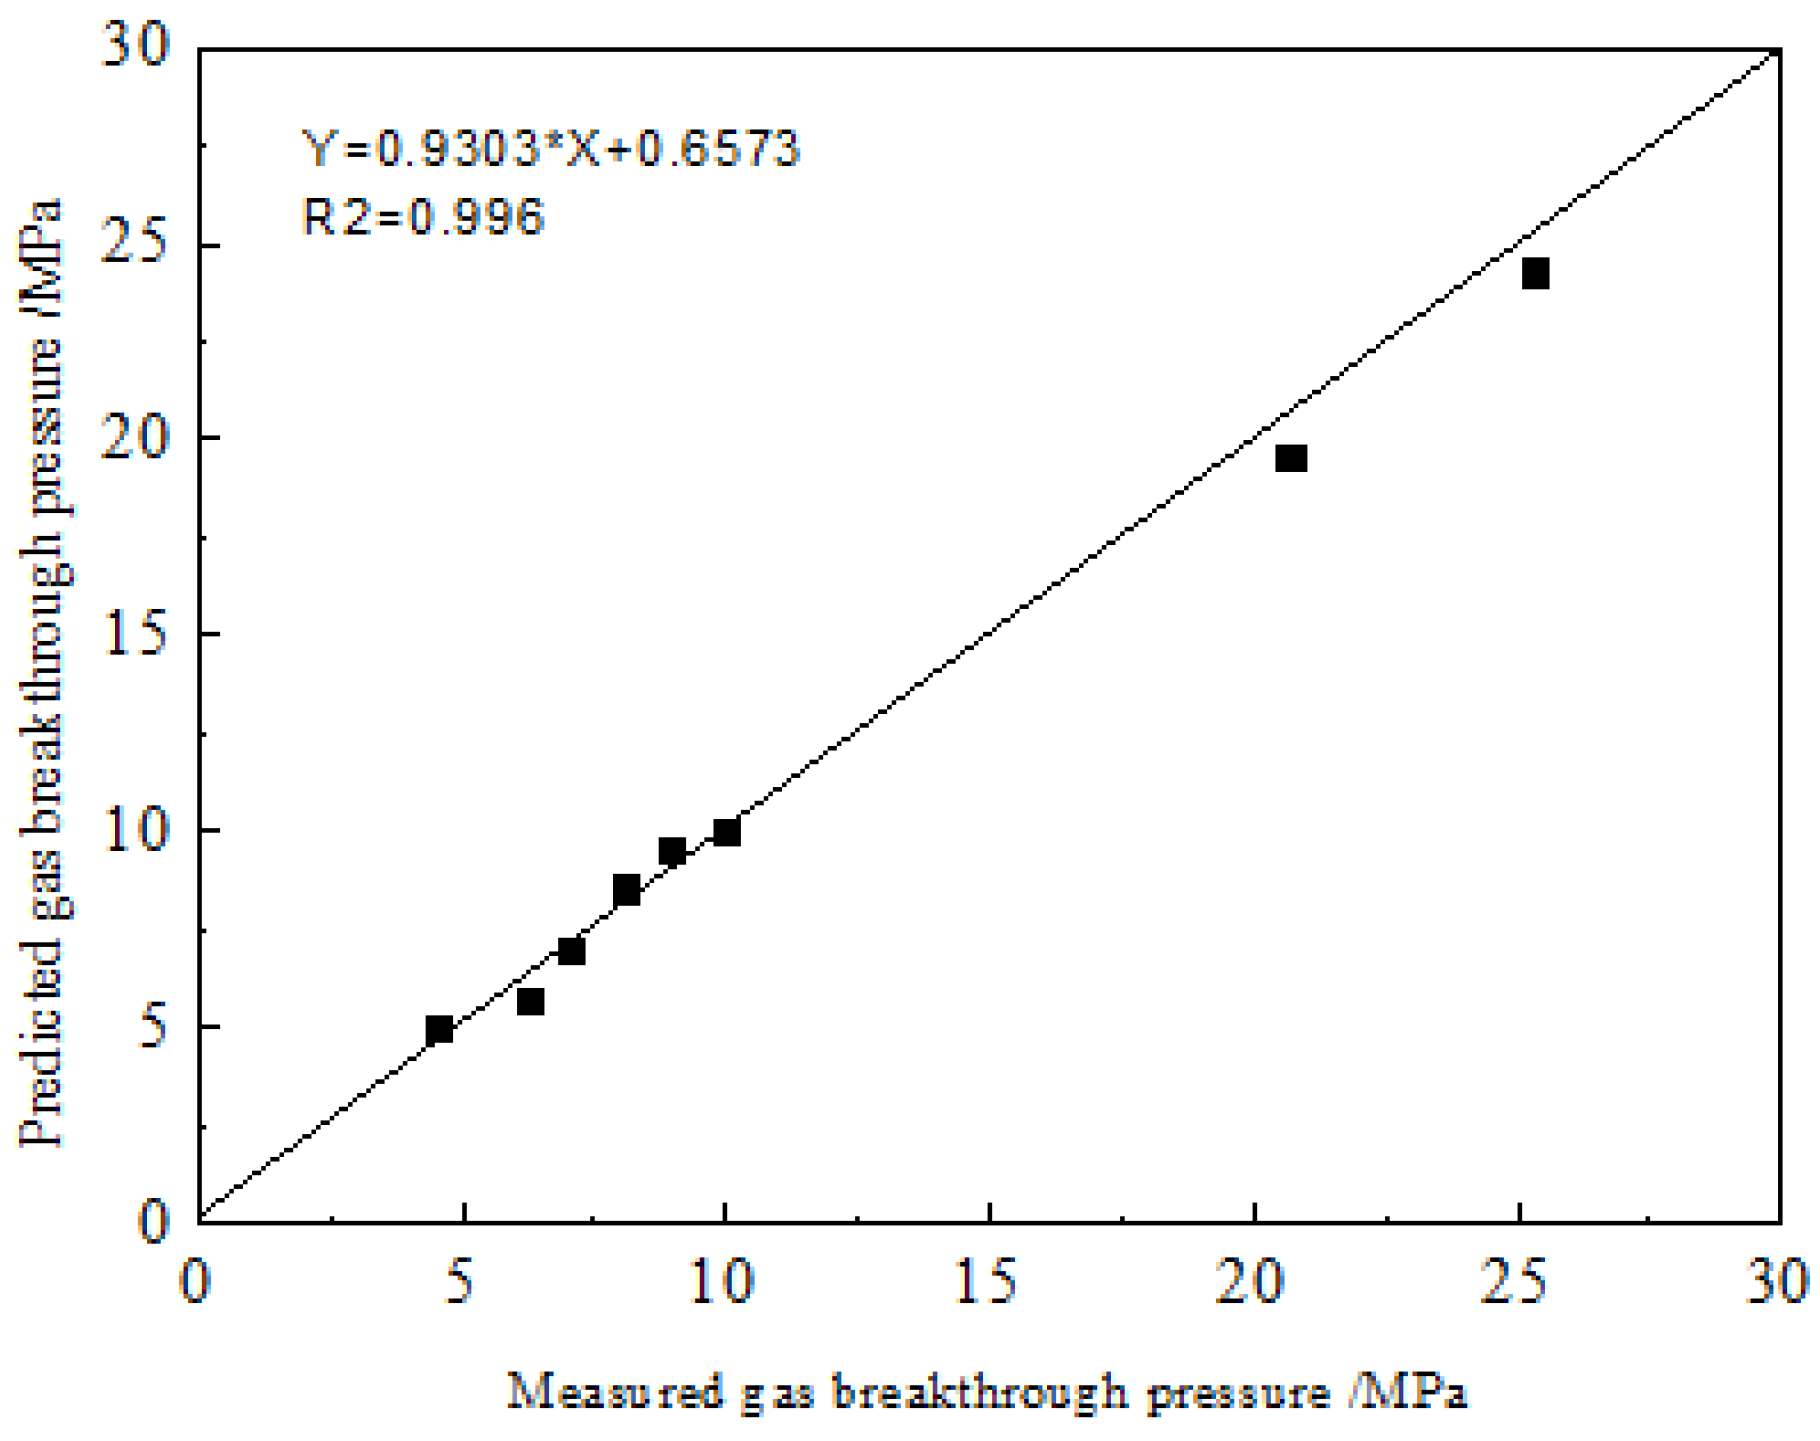
Figure 14.
Calculated breakthrough pressure of shale caprocks.


Table 1.
Basic test data of shale core samples.
| No. | Crushing Porosity | Gas Logging Porosity | NMR Porosity of Dry Sample (2 MHz) | NMR Porosity of Dry Sample (21 MHz) | Liquid Logging Porosity | NMR Porosity of Water-Saturated Sample (21 MHz) | NMR Porosity of Water-Saturated Sample (2 MHz) | Permeability (mD) |
|---|---|---|---|---|---|---|---|---|
| 1 | 9.03 | 3.258 | 1.8806 | 1.8806 | 5.5784 | 7.4509 | 7.9445 | 0.011480799 |
| 2 | 7.81 | 3.0412 | 1.3158 | 1.3158 | 4.2465 | 6.6733 | 7.3744 | 0.015426499 |
| 3 | 1.76 | 1.425 | 0.6252 | 0.6252 | 1.3563 | 1.2738 | 2.1295 | 0.013562149 |
| 4 | 3.65 | 1.325 | 0.6134 | 0.4263 | 1.2120 | 1.221 | 1.962 | 0.599922067 |
| 5 | 4.59 | 1.689 | 1.304 | 1.0922 | 2.5889 | 3.6998 | 4.439 | 0.29579695 |
| 6 | 8.1 | 1.0571 | 0 | 1.0261 | 2.8662 | 4.029 | 4.1237 | 0.103749225 |
| 7 | 8.55 | 1.1265 | 1.3312 | 1.0949 | 4.2281 | 4.9797 | 5.4359 | 3.446945844 |
| 8 | 8.55 | 0.7126 | 0.7613 | 1.1921 | 3.4051 | 4.791 | 5.1885 | 0.033529845 |
| 9 | 7.42 | 4.4199 | 1.1127 | 1.3215 | 7.7299 | 7.8039 | 8.629 | 97.00213673 |
| 10 | 5.58 | 1.733 | 0.633 | 1.6496 | 6.4616 | 7.6988 | 7.787 | 14.66605484 |
| 11 | 14.4 | 4.8704 | 0.4653 | 1 | 11.0913 | 10.5897 | 12.0987 | 0.942860955 |
| 12 | 8.81 | 0.7189 | 0.6016 | 0.2631 | 1.8082 | 1.9086 | 2.526 | 0.153821733 |
| 13 | 8.81 | 1.4316 | 0.4484 | 0.3477 | 1.5231 | 2.3747 | 2.848 | 0.016848658 |
| 14 | 2.54 | 1.5984 | 0.8934 | 0.6756 | 2.5348 | 3.0062 | 3.517 | 0.015265075 |
Publisher’s Note: MDPI stays neutral with regard to jurisdictional claims in published maps and institutional affiliations. |
© 2022 by the authors. Licensee MDPI, Basel, Switzerland. This article is an open access article distributed under the terms and conditions of the Creative Commons Attribution (CC BY) license (https://creativecommons.org/licenses/by/4.0/).
Share and Cite
MDPI and ACS Style
Xiao, J.; Xiao, Y.; Ge, X.; Zhou, T. A Technique to Determine the Breakthrough Pressure of Shale Gas Reservoir by Low-Field Nuclear Magnetic Resonance. Energies 2022, 15, 7223. https://doi.org/10.3390/en15197223
AMA Style
Xiao J, Xiao Y, Ge X, Zhou T. A Technique to Determine the Breakthrough Pressure of Shale Gas Reservoir by Low-Field Nuclear Magnetic Resonance. Energies. 2022; 15(19):7223. https://doi.org/10.3390/en15197223
Chicago/Turabian StyleXiao, Juanjuan, Yufeng Xiao, Xinmin Ge, and Tianqi Zhou. 2022. "A Technique to Determine the Breakthrough Pressure of Shale Gas Reservoir by Low-Field Nuclear Magnetic Resonance" Energies 15, no. 19: 7223. https://doi.org/10.3390/en15197223
Note that from the first issue of 2016, this journal uses article numbers instead of page numbers. See further details here.