1. Introduction
The world undeniably must turn from fossil fuels to a greener course to produce energy, for instance, with wind, solar, nuclear or bioenergy sources. An important organization in the transformation is the European Union (EU). The EU, as part of the European Green Deal, plans to target by 2030 at least 32.5% improvement in energy efficiency, 32% share for renewable energy, and 40% cuts in greenhouse gas emissions (from 1990 levels) [
1]. The European Council established in 2019 the objective of making the EU climate-neutral by 2050, in line with the Paris Agreement. The smart grid (SG) is a key element in the global trend of the future energy system. SG is an intelligent network that combines different entities actively involved in energy exchange [
2]. The smart grid differs significantly when compared to the traditional grid. The first difference is that it enables bidirectional power flow. The Distributed Energy Resources (DERs) are able to make the transition to smart grid possible [
3]. Actors that are capable to produce more energy from Renewable Energy Sources (RES) at a certain time should be able to sell it back to the market. The market itself has to evolve to a system that will get vast amounts of data as an input that need to be processed and by that create energy prices in the desired period. These data will be gathered from smart sensors and meters. It will also be transferred to demand response systems, whose task is to reduce peak demand. What is more, the SG needs to be resistant to cyberattacks. The ability to self-heal after power outages is also highly important. The transformation from the traditional grid to the smart grid will last a long time and the path of transition will require a challenging variety of technical, social, and economical innovations [
4]. Microgrid (MG) is a concept of coordinated clusters of energy storage, sources, and loads that interact and cooperate with each other and the power system [
5]. The purpose is to maximize the use of Renewable Energy Sources (RES). The social aspects of microgrids, such as increased awareness of climate catastrophe, job creation, and electrification of underdeveloped places, are also worthy of recognition. Numerous administrative actions to facilitate proper functioning and cooperation of MGs are implemented, e.g., tradable green certificates and feed-in tariffs [
2]. There are further challenges associated with MG development, such as uncertainties of demand and supply using RES; design of appropriate Demand-Side Management (DSM) systems; and economical and reliable operation of MG with high penetration of RES, plug-and-play feature, voltage and frequency control mechanisms [
4]. Due to the complexity of the MG, a flexible test system is an absolute need to ensure a reliable, secure and cost-effective evaluation environment.
MG can operate as an island or be connected to the grid or to other MGs. Moreover, multiple microgrids can also be interconnected to support and trade with each other, as described in [
6]. Nowadays, in most countries, there is no possibility, or it is not easy, to implement for the MG to operate as an island. That trend will change in the following years. Working as an island means that MG has to produce enough energy by itself to power all the loads within this MG. The inverter unit can switch to islanding operation in one of two ways: unintentional and intentional [
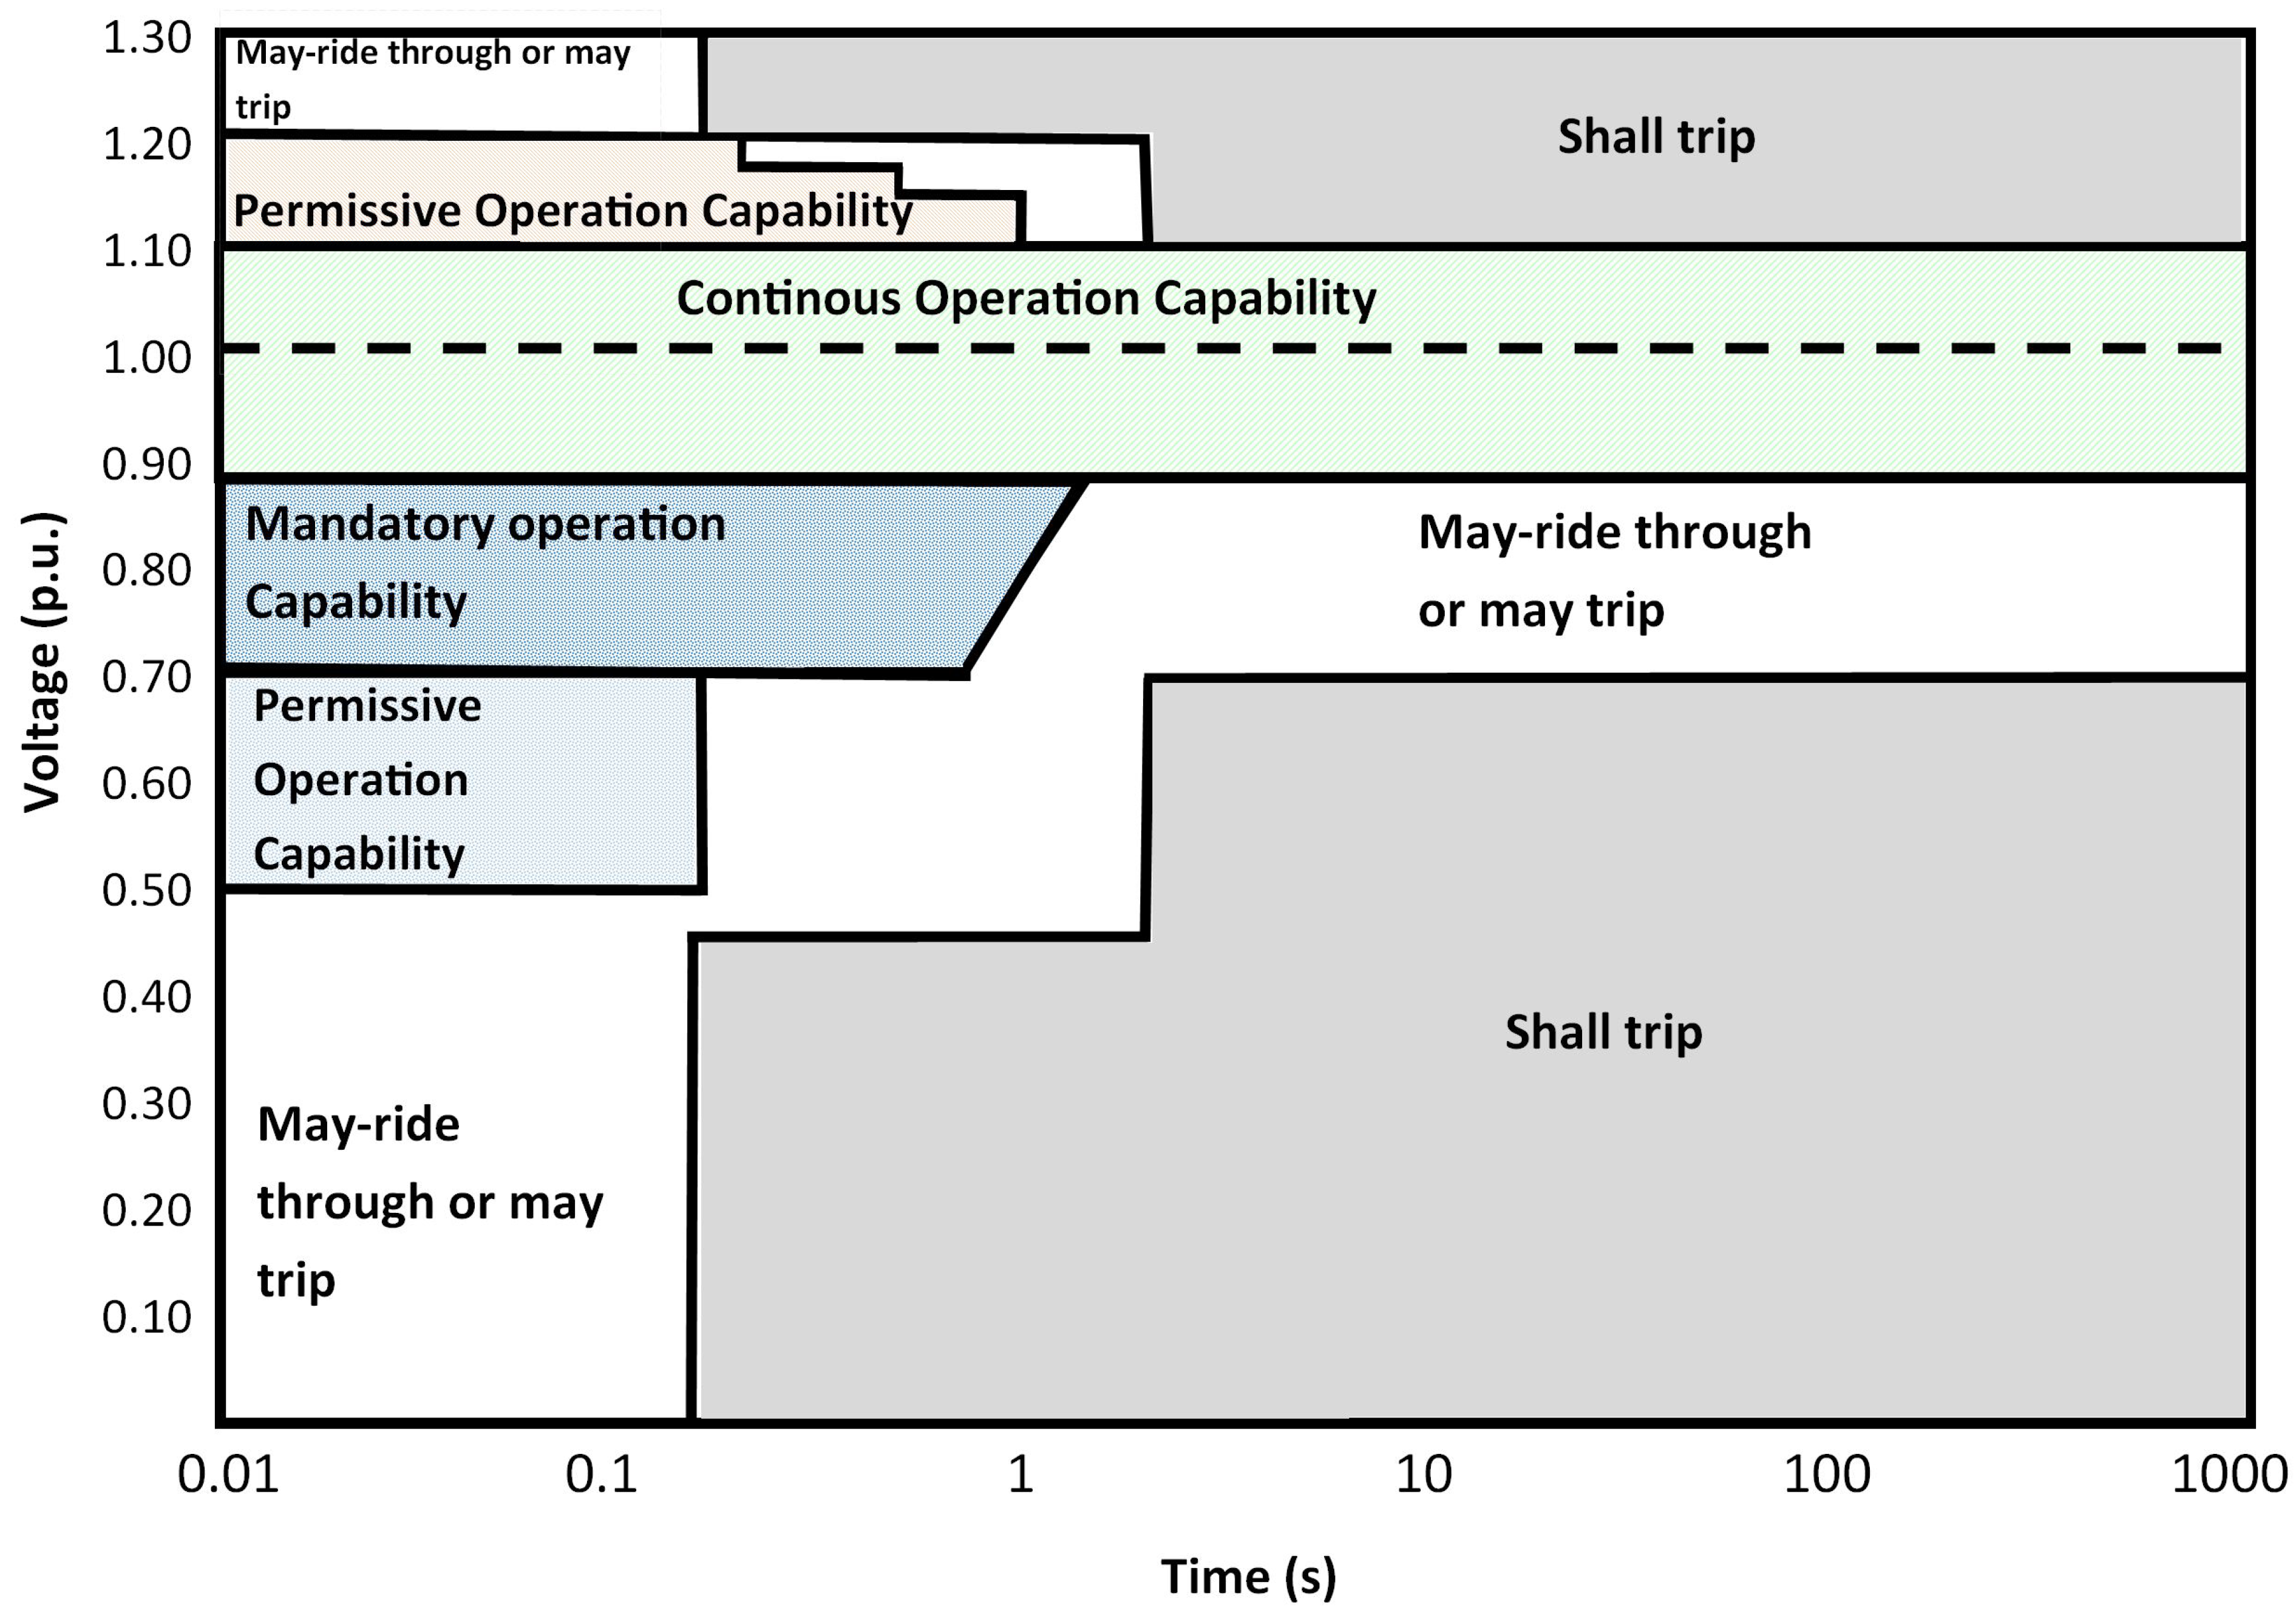
7]. The first instance, if it is not tested and handled properly, can pose a massive danger for utility workers, home appliances, or inverters. According to [
8], if the root mean square (RMS) value per unit voltage will be out of range from 0.50 to 1.20 p.u. for at least 0.16 s, or out of range from 0.88 to 1.10 p.u. for at least 2 s, or the grid frequency deviation exceeds
Hz, then DER should cease to energize and trip all units.
The inverters can combine their power and work together in parallel without the main grid. The possibility of parallel work of inverters in MG is a crucial aspect for the efficiency, flexibility, and reliability of the distributed generation system. Correct cooperation of inverter units serves to balance active and reactive power. That balance between real power (P) and reactive power (Q) must be maintained at an appropriate level. If voltage amplitude produced by one of the parallel inverters does not match, it creates reactive power circulations at the Point of Common Coupling (PCC). If additionally, the phase of the inverters is in mismatch, then both Q and P are circulating. Further, every inverter must produce voltage with an identical frequency. One of the hardware solutions to restrain circulating current is the transformer located at the output of the inverter [
9]. It provides additional galvanic isolation and diminishes the DC composite of circulating current. The current produced by the inverters should be controlled and the circulating current has to be minimized. There are a lot of control methods, to tackle that issue. Methods are divided into two main categories: communication-based and methods based on droop control. A communication-based method like active current sharing or master–slave control is efficient for load sharing, but the necessity of high-speed communication infrastructure, as well as low redundancy, are the major drawbacks of this method [
10]. Droop control does not require interconnection between inverters, although, in the most basic form, it suffers from the slow dynamic response and poor harmonic sharing [
4]. Nevertheless, numerous improvements have been introduced to that method, e.g., angle droop control method, virtual impedance control method and adaptive voltage droop control method.
The smart grid emulator aims at allowing to model the behavior of the real grid. One of the main aspects is the distributed energy production in different scenarios. That is why we need a reliable energy generation block that is configurable and controllable. The inverter block we present and evaluate in this paper shall provide this functionality.
Nearly all the testbeds existing in the literature work with hazardous voltages. The paper presents a testbed where hazardous voltages can occur only in the primary substation and secondary substation emulation does not surpass 230 V AC. However, the input DC voltage of the inverter is equal to 35 V DC and the output voltage is 24 V AC. Besides the scaled-down voltages, the system is capable of mimicking grid behaviors with improved security measures. This approach made it possible to exclude concerns to making mistakes when studying the effects of individual elements influencing others. One of the key reasons to build a test bed is not to emulate only the normal work, but rather to test the emergency situations that might happened in electrical grid and the algorithms for adjusting to the disturbances or demand. The testbed with scaled-down voltages can provide these capabilities without creating extremely dangerous situations. This creates possibilities to implement more accessible testing environment. Furthermore, more risky scenarios like variety of grid faults can be simulated. Furthermore, care was taken to select relatively inexpensive components so that the overall cost of the emulator was significantly below the average MG emulators. What is more, the emulator uses a non-commercial inverter board, which has the advantage of being available to quickly exchange or replace given components like operational amplifiers, transistors, or filters. Moreover, during the design phase, the principle of using only readily available components was followed. Most of the MG testbeds require roomy laboratories in order to accommodate high-volume inverters that are larger due to, for example, larger inductors and radiators necessary in higher voltage applications. Another bulky and costly element is the grid simulator, which is also not needed in the presented design.
The primary objective of this paper is to investigate the validity of using the inverter that can serve as part of the MG emulator. This emulator requires a high degree of flexibility from the inverter, as the inverter itself can be used in many configurable options. Among these, the inverter should emulate a collection of several photovoltaic panels or a wind turbine, as well as small power plant. To meet these requirements, the inverter was put through a series of tests. Another novelty aspect is represented by the scaled-down voltages. It can be helpful to test risky scenarios without generating very hazardous conditions. Moreover, the tests presented in this paper can serve as a foundation for future multi-domain evaluation considering the energy management algorithms, communication (data exchange within the system) and simulation of energy market aspects.
The rest of this paper is organized in the following order.
Section 2 covers the existing methods of microgrid testing. Advantages and drawbacks are discussed and the realized development has been described. In
Section 3, the structure and the possible topologies were defined. Principles of the control system of the inverter as well as the communication with the master controller were described. Test scenarios and results are presented in
Section 4. Finally,
Section 5 provides concluding remarks.
2. Testing in Microgrids
Testing MGs can be done in a variety of ways, among others digital simulation, co-simulation, Real-Time simulation (RTS) Hardware-In-the-Loop (HIL), Controller-Hardware-In-the-Loop (CHIL), Power-Hardware-In-the-Loop (PHIL) and emulators. Several reviews and analyses have been made that compare these testing strategies and present a diversity of paths to create simulation within each category of test approaches [
11,
12]. To choose the desired strategy, the trade-off has to be made between the cost, test fidelity and test coverage [
12].
The digital simulation consists of solving mathematical models with the use of high-level language code and platforms. It is mostly used for the initial state of the system development. The benefits are flexibility, rapidity, versatility and no risk of damaging the equipment [
13]. Cost varies depending on license period, but can reach several thousand EUR by year, in the case of choosing, the most popular solution, e.g., Matlab. Worth mentioning is that there are free simulation tools available, like Julia or GNU Octave. There is also a possibility that diverse power system modules can be simulated in different simulation tools; therefore, all simulations need to be merged in a co-simulation environment, for instance, mosaik.
A real-time system is performed on parallel processors. All parts of the system, for example, the control, protection and measurements, are modeled on the simulation platform [
14]. The key issue of RTS is to ensure appropriate timescale, including idle time of processors [
11].
When some parts of the system exist physically and the software part of the simulation is connected with the hardware, then the HIL approach is implemented. It is well known that HIL requires more time to build and investment costs are usually higher than in the previously mentioned approaches. A noticeable benefit is the behavior being closer to the real behavior of the given module. There are certain issues that ones designing the HIL system need to take into account, such as stability criteria and also time delay formed in simulation, which might be reflected in harmonics of output signal [
13]. The CHIL systems add hardware to RT simulator, for instance, a power converter controller and signals are exchanged between them with the use of Analog-to-Digital or Digital-to-Analog converters [
13]. That approach is widely used, and it gives scientists a valuable, small volume object to test basic algorithms like voltage control or power-sharing in MGs [
15] or testing data exchange methods [
16].
PHIL has a similar architecture to CHIL, but requires an additional power amplifier stage. This allows the use of devices that are involved in exchanging power such as solar inverters or generators. The appropriate selection of power amplifier requires a priori determination of bandwidth, expected accuracy and stability of the desired power amplifier [
17]. Voltage and current amplitudes flowing through the PHIL system might be closer to the real values flowing in the power system, thus PHIL simulation has the ability to test more risky, complex and demanding scenarios. Examples of possible test cases are fault condition detection, protection validity or power exchange between units. A common approach to performing the test is to first simulate the system only in software and then compare the results in the PHIL environment. The authors of [
18] present PHIL with the use of a commercial micro-inverter and put it through a series of stability tests. A complex test class was presented in [
19], among others, abnormal voltage and frequency conditions, voltage regulation or unintentional islanding were investigated. Another paper [
20] presents a simulation of a PV inverter, for voltage regulation in distribution networks, with the use of a variable voltage source. The system features and protection, together with reactive power behavior in case of fluctuating power capability of the PV array, were well tested. There are numerous PHIL simulators with the use of inverters. However, most of them use the commercial inverters that are dealing with dangerous voltages and are hard to configure.
The idea of the MG emulator is to imitate, as much as possible, the real behavior of the MG. Performing test scenarios on an emulator, instead of the real power system, has several advantages. For instance, there is no possibility of damaging the real equipment, it has the possibility of concentration of long tests in a shorter period by changing the timescale, it consumes less space, costs less and is more flexible [
21]. One of the examples of such an emulator is presented in [
5]. The authors present the Generator Emulator Controls that was designed to reproduce favorable grid-forming characteristic of a synchronous generator. The paper presents tests of plug-n-play ability in MG with 15-inverters. The testbed used a commercial inverter in the closed case, and it is slightly limiting the flexibility, although the authors sized the appropriate filter. In [
22], the authors introduced an emulator with a voltage source inverter. The size of the test system is relatively small and due to the modular concept of the system, it is flexible to made changes in topology, but no test was performed to present that feature. In the paper, the authors test parallel operation as well as response to load step changes, but only for two values of the load and without measuring the frequency deviations at PCC.
3. Structure of the Proposed Testbed
3.1. Structure and Possible Models to Create
The testbed is a smart grid or an MG Emulator, in which the generation is based on the inverter module that is presented in this paper. The testbed emulates the power grid, but also includes a (wireless) sensor network that monitors the power grid. The main task of the emulator is to mimic a full-scale smart power grid to test and evaluate power management algorithms. To allow creating different topologies of the grid, it follows the modular approach. There are currently four classes of blocks that differ in functionality and can be connected to form the desired topology. These blocks are connected physically to define the energy flows, but they are also connected logically to define the hierarchical relations of the monitoring and control components available in each block.
The monitoring and control module available in each emulator block can be considered as a smart meter with sensing and control features. In a given emulator deployment, these devices are configured to be organized in a wireless sensor network. It is a kind of distributed brain of the whole emulator. Each smart meter consists of three components. It is based on the
IHPNode [
23,
24] platform with the main part—the
FWNode board based on the
MSP430F5438A microcontroller. This board is responsible for exchanging measurements and control data between the different emulator blocks. The second component is the
ADCBoard—an extension board for the FWNode, whose task is to measure electrical quantities for three independent channels, using its 24-bit ADC converter. The measured electrical quantities are the active power, frequency, reactive power, apparent power, current, voltage, and the power factor. The last component is an adapter for the ADCBoard—the ACFrontEnd board. Its task is to adapt the voltage and current values in each channel to levels that are measurable by the ADCBoard.
Some of the blocks are further equipped with a management unit—a computing device with more power than a sensor network node, but it interacts with the emulator using these nodes and it runs the energy management algorithms. The management units exchange data between each other using the data exchange middleware [
25] that also allows implementing distributed energy management algorithms according to the framework defined by the European e-balance project [
26].
Primary Substation (PS) is the first block that is a part of the emulator. It is an equivalent of a large high voltage electrical substation in the full-scale power grid, whose task is to reduce the voltage level from high voltage (HV) to medium voltage (MV) and to distribute the energy to the underlying secondary substations. In the emulator the primary substation voltage ratio is 230 V (HV) to 48 V (MV). It is equipped with both, the smart meter module that monitors the voltage and current parameters on the MV side of the transformer, and the management unit.
The Secondary Substation (SS) is the second block in the emulator. Its task is to further reduce the voltage level from the MV to low voltage (LV) and to distribute the electrical energy of the area that is connected to it. The LV level in the emulator is defined at 24 V. It is also equipped with both the smart meter module that monitors the voltage and current parameters on both sides of the transformer (MV and LV), and the management unit.
The emulator blocks can be connected directly to create the energy flows between these, but it is also possible to use the Transmission Line (TL) blocks for that. Similar to full-scale transmission lines, the main purpose of this block is to transmit electrical energy. The transmission line block has a specific structure that allows to split one input into three independent outputs or to accumulate up to three independent inputs into one output. The smart meter module monitors the voltage and current parameters and controls switches that enable cutting of each of the three outputs/inputs. Furthermore, the transmission line block has the capability to emulate electricity transmission losses/influences by changing its parameters using passive electronic components between input and output.
The TL block was primarily designed to test energy management algorithms, such as the reaction to (emulated) transmission line faults. It can thus be used to detect blackouts and rearrange the topology to distribute power from another source. A TL block is not equipped with a management unit and is thus controlled by its respective parent substation. The link between the TL and the substation is logical on the wireless sensor network level, connecting the smart meter modules. It gives the opportunity to measure electrical quantities for the entire sub-grid, but also just for a selected branch of the sub-grid. The parent substation has also the possibility of cutting off the selected sub-grids in the whole grid using commands that are dedicated for this purpose.
The last and the most complex block in the emulator is the Prosumer block. This block is responsible for the emulation of power consumption and production on the LV or MV level. This is the block that contains the inverter presented in this paper. It can emulate a single household, either only consuming energy, but also one with, for instance, a photovoltaic system. However, it can also emulate a larger energy producing site, like an independent solar or wind power plant. On the energy grid emulation level, the prosumer block consists of the inverter module and the energy-consuming module connected in parallel. Both current flows are monitored using the smart meter module independently. This allows to emulate scenarios relevant for different regulatory settings in different countries, i.e., the energy consumption and production can be regarded individually or as a sum. The prosumer block also includes the management unit to run energy management algorithms.
All these block classes of the emulator provide the opportunity to flexibly design multiple topologies and test many smart grid approaches on them. An example topology to be emulated is presented in
Figure 1.
The main issue within the emulator related to the inverter module is its configurability and control to prevent hazardous situations. The energy generation in different prosumer blocks is summarized, i.e., the outputs of inverters are connected almost in parallel, thus a proper definition of the inverter behavior and reliable control mechanisms to realize that behavior are a must.
3.2. Principles of Operation and Control
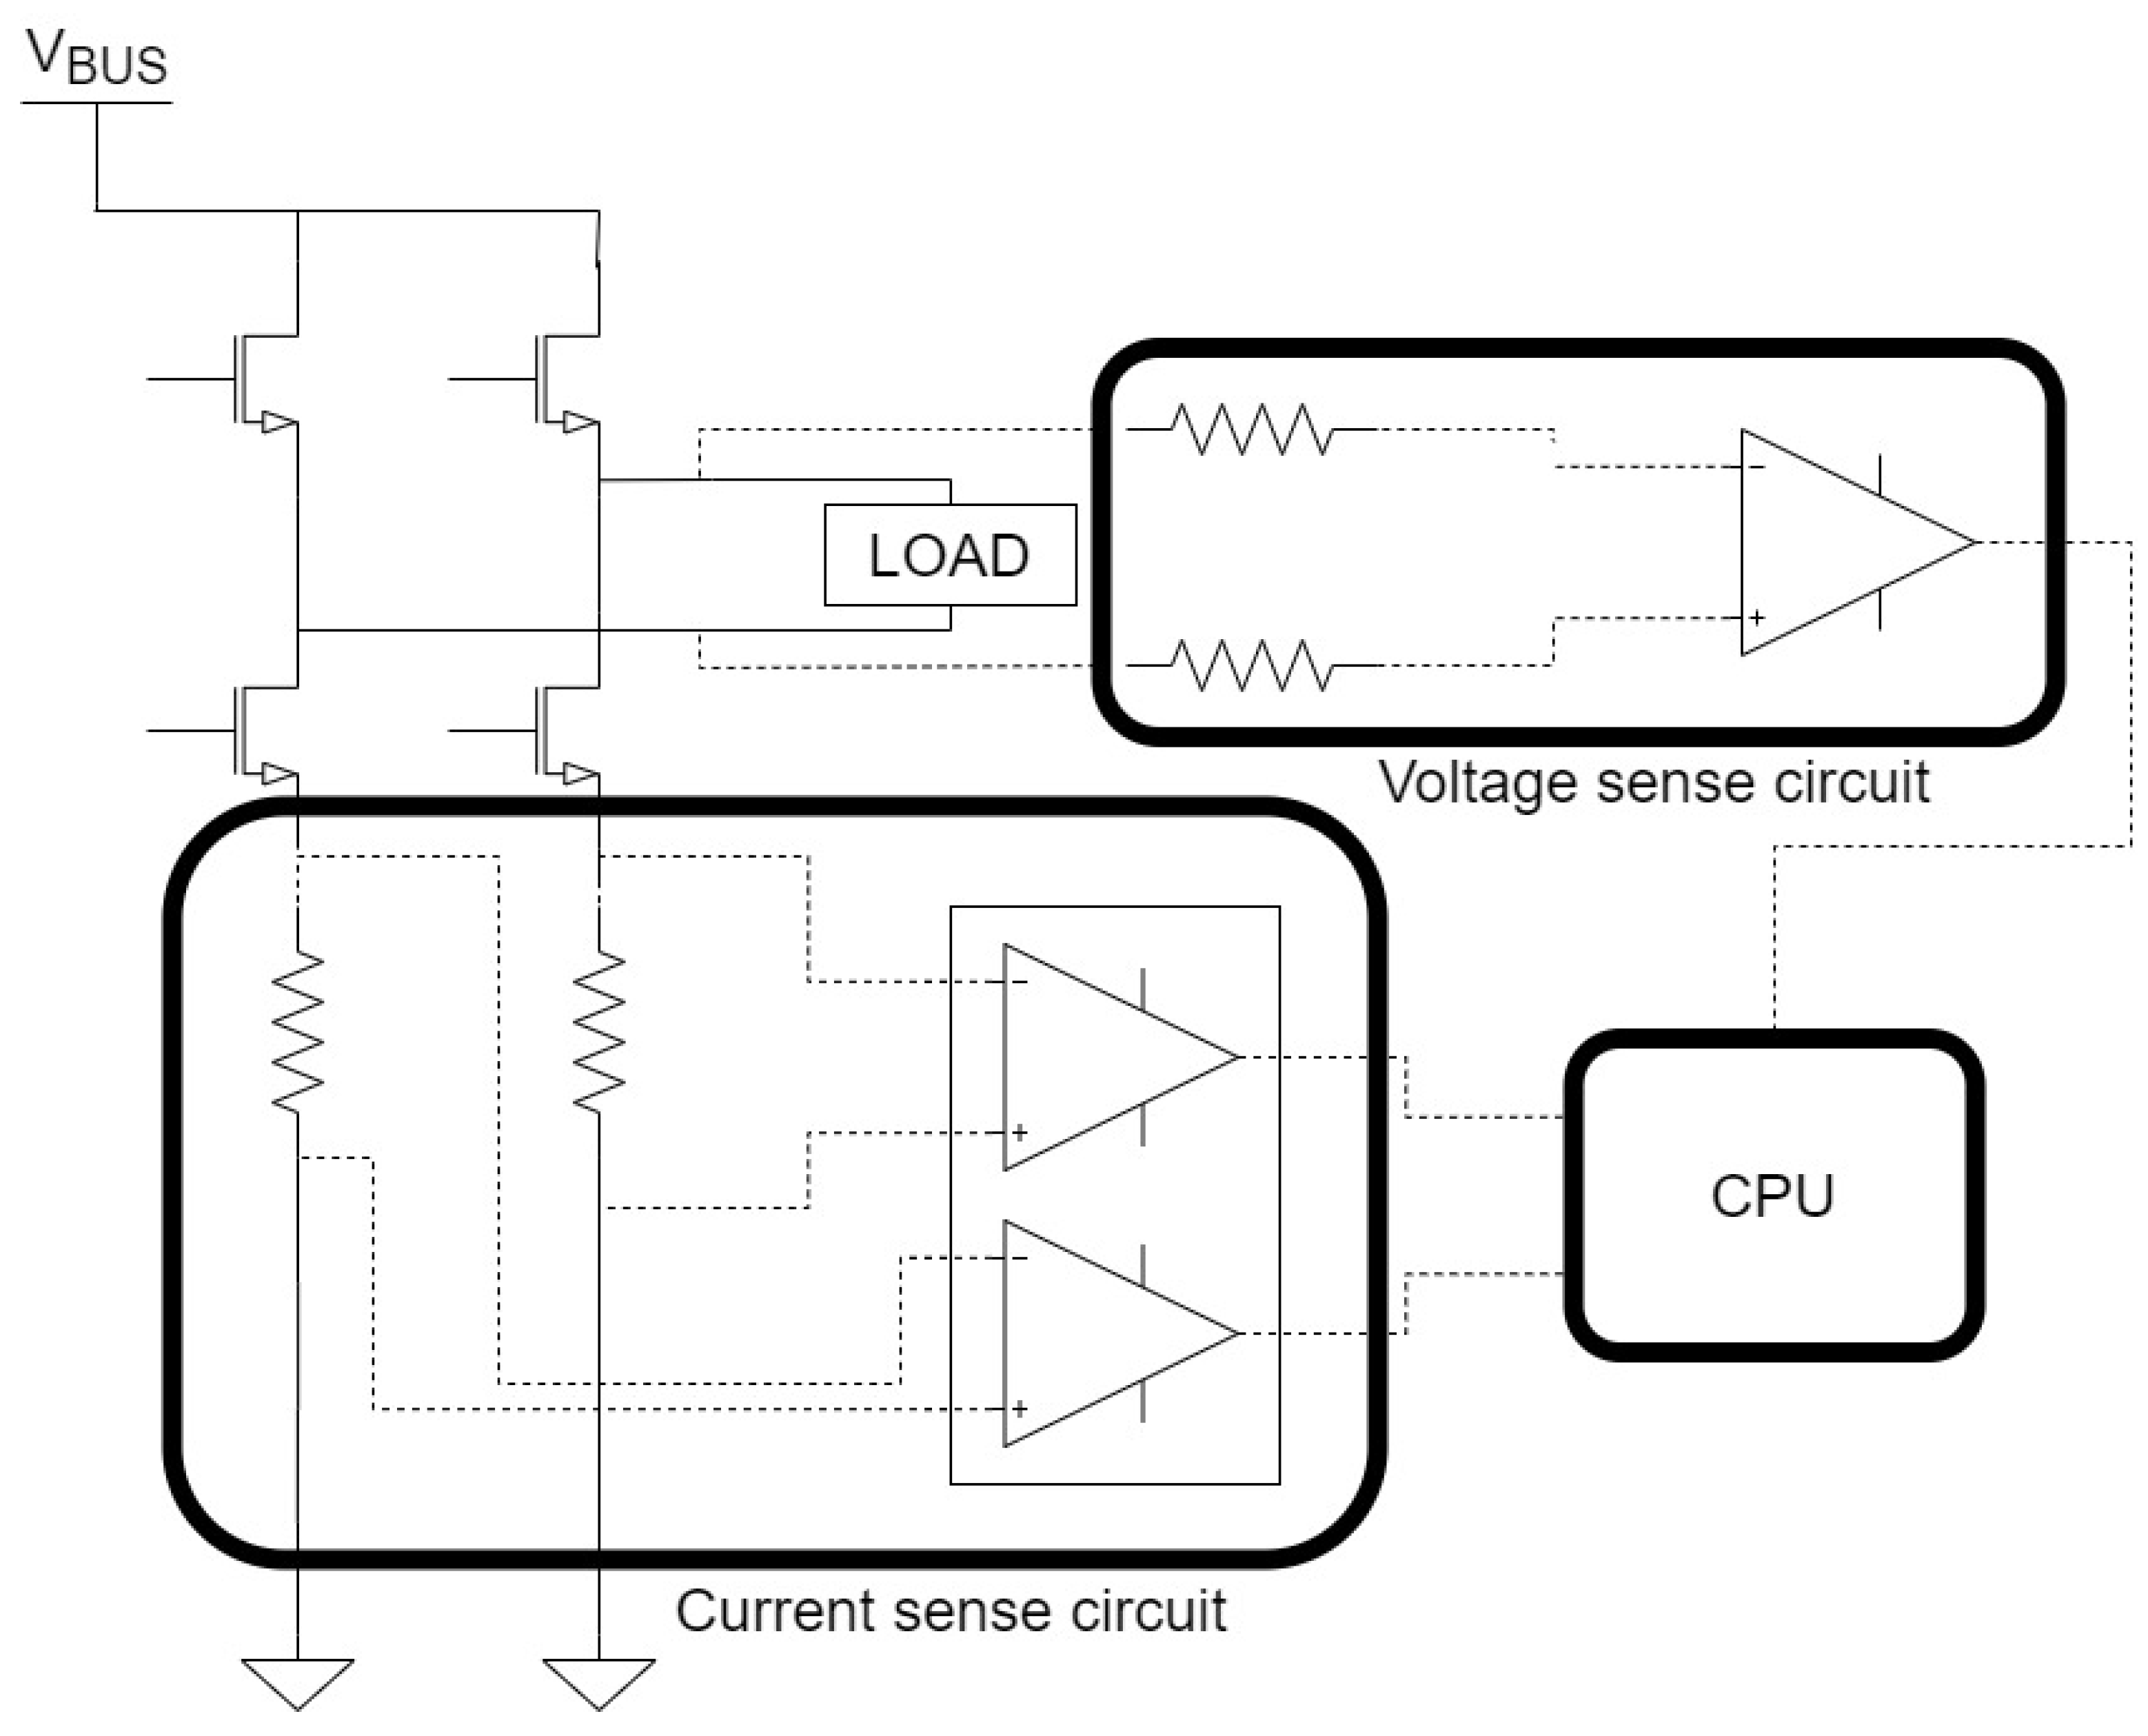
The detailed software and hardware architecture is described in master thesis [
27]. It provides a comprehensive explanation of the control mechanism as well as the hardware design procedure. Nevertheless, the principles of operation and control are presented in this section. To control voltage and current flow within the emulator, two loops with proportional-integral (PI) controllers were used. The current control loop is an inner loop. The operation of this loop starts with the measurements of the instantaneous values of currents in both leg branches of the inverter bridge. That is performed via the current sensing circuit that measures current by calculating the drop on the shunt resistor at the low side of the inverter branch. Then, the voltage drop is transmitted to the integrated circuit with an operating amplifier, whose task is to process the signal to the appropriate level. Then, the signal is transmitted to the Analog-to-Digital Converter (ADC), where the control unit of this device will process the input signals and generate PWM signals. By manipulating the PI coefficients, it is possible to shape the characteristics of the PWM signals. By changing the shunt resistor’s values or components included in the current sense circuit, it is possible to adjust the resolution and accuracy of the measurements. Hardware components are easily accessible for replacement, and software coefficients can be changed via SPI, as described in
Section 3.3. The outer voltage control loop senses the voltage at the output of the inverter and compares it to a desired voltage reference, that is 24 V. The measurement circuits are shown in
Figure 2.
To work in parallel with the grid, or with other inverter units, the synchronization of phase has to be accomplished. The most widely used, and the most researched method to ensure synchronizing is the implementation of the phase-locked loop (PLL). This structure is based on a feedback loop, where a measured output voltage signal is subtracted from a reference signal, which is the grid voltage. The result of the subtraction is an error signal. The error signal is minimized by an internal discrete low-pass filter. The discrete oscillators finally lock the generated output signal with the phase angle of the input signal. The lock of the signal is proportional to the performance of this system. The structure of this system contains three basic functional blocks:
Phase Detector (PD)—the main purpose of this block is to compare the input sinusoidal signal with the locked sinusoidal signal and to produce error signal out of it.
Loop filter (LF)—it is a low-pass filter that clears the error signal by damping output noises and high frequencies from the signal.
Voltage Controlled Oscillator (VCO)—this block produces the output signal as well as the locked signal with respect to the nominal frequency.
Unfortunately, the grid frequency can be close to the cut-off frequency of the Phase-Locked Loop. Therefore, additional blocks in the PLL system are required. Some approaches to improve PLL structures are using Adaptive filtering or Second-Order Generalized Integrator (SOGI) [
28]. In both of the methods, the loop filter transfer function must be implemented and the coefficients of that filter have to be calculated with the discretization previously performed. The values have to be carefully calculated and tuned. In the project presented in this paper, the SOGI method was chosen.
When the inverters are working in parallel, one of them, namely, the grid-forming inverter, must set the reference signals for the rest of the inverters [
29]. The other inverters are following the reference and synchronize to the grid-forming unit. In case of grid synchronization work, all inverters are grid-following units. When the intentional or unintentional islanding occurs, then one of the inverters must be transformed into the grid-forming inverter. This case is covered in the tests. If multiple inverters work in parallel and the grid-forming inverter fails, another inverter must take its role to ensure the grid stability.
The activity of the inverter depends on its current state. The state machine is presented in
Figure 3. At first, the inverter is in state 0, where it is inactive. The inverter is waiting for the command to start operation. If the incoming command arrives, then the inverter switches to state 1. There, the inverter checks, through the DC voltage sensing circuit, if there is a DC voltage higher than 34 V DC. If that condition is met, it changes to state 2, and then, the inverter is sensing the output voltage. In this state, depending on the presence of the grid voltage, the inverter can go into the synchronization or the islanded mode. First, if the grid voltage is present, it means that the main grid or another inverters already power the load. In that case, the inverter control unit needs to make sure that the inverter is capable to produce enough current according to references that are set to PI controllers. If this requirement is met, then the transistors are switched on, and the inverter starts to work in parallel with the other inverter units, on the grid. It remains in that state, until it will not receive a command from SPI to turn off, or until any of the protections trigger. If the grid voltage is not present, then it simply goes to islanded mode and powers the loads by itself. The rules for returning to state 0 are the same as for synchronous operation.
3.3. Communication between the Inverter and the Master Controller
The communication is done by means of SPI. The SPI is configured with the guidance from in [
30]. The SPI is configured to send a bitstream of length equal to 16 bits. The inverter unit is always a slave. The four-wire mode is chosen, that is Slave–Output–Master–Input (SOMI), Slave–Input–Master–Output (SIMO), Slave–Transmit–Enable (STE) and Serial-Clock (CLK). Data are transmitted at a baud rate of 156.25 KBps. The transmission of data is performed with the use of the First In, First Out (FIFO) buffer. Each member of the conversation, namely the transmitter and the receiver, is equipped with the shifted register and the buffer. In the beginning, the master initializes communication, by setting the clock. When the data are written to the buffer register, the start of the conversation is performed. Then, the data are sent, bit by bit, on each rising edge of the clock from the shifted register. The data are saved on the falling edge of the clock signal. The data from the Most Significant Bit is transmitted by pin SPISIMO, and the receiver is collecting the data from the SPISIMO pin. On the receiving side, initially, the data is assigned into the shifted register, after sending the required numbers of bits, data is passed from shifted register to buffer. After that operation, the appropriate flag is set and then data is ready to be read. Afterwards, the interrupt flag is being set, and if the master does not have anything more to transmit the clock is stopped.
In the proposed MG emulator, the management unit in the prosumer block controls the inverter in that block. The smart meter module is the interfacing in that case. It is the master and the inverter is the slave. When the master wants to control the inverter, the information is transmitted using a 16-bit hexadecimal value that is 0x, where: A is the ID of the parameter and is the value of the parameter. For instance, the variable that turns on or off the inverter has an ID equal to 1. Setting logical 1 to that variable turns on the inverter. Therefore, in order to turn on the inverter, the master controller has to write a command 0x1001 via SPI. The slave will receive data, encode it, and then change the parameters.
Further possible commands are:
Setting power reference. The inverter can control the current it is producing. When the current is lowered, then other units should compensate for the voltage drop and increase current as investigated in
Section 4.4.
Prioritizing of the inverter. There are 3 levels of priority: low, medium and high. By default, all units are configured at medium level. When priority is set to high, then the inverter will try to produce more current, and similarly setting priority to low will decrease the current.
Allowable power limit. The upper and lower ranges of producing power can also be controlled. If the upper limit is set, and a given inverter is capable of producing more power, then it will lower the current, to meet the upper boundary. In case the inverter is not capable of producing more power, than the lower limit indicates, then the inverter is turned off.
Possibility of islanded mode. Master unit can ask for possibility of transition into the islanded mode. After checking the parameters, the inverter gives an answer about the possible transition.
Request the state. The inverter navigates through the state machine as described in
Section 3.2. After receiving the request, the inverter unit responds in which of the state it currently operates, among: (i) powered, not active, (ii) islanded mode, (iii) synchronization mode as a master that is grid-forming control, (iv) synchronization mode as a slave that is grid-following control.
Request the measurement. The microcontroller is equipped with the ADC, thus it measures electrical quantities within the inverter board like the output AC voltage, branch current, input DC voltage, frequency. These values can be requested and send in predefined intervals.
3.4. Testing Circuit
To test the behavior of microgrids with different number of inverters with different configurations, several test scenarios were defined. In order to simplify the test procedure, test schemes were defined using the inverters only.
Figure 4 presents the default circuit for all testing scenarios unless otherwise stated. In the preface of every test scenario in
Section 4, the number of inverters
n participating in the test scenario as well as the preset connection of relays SWn1 and SWn2 are defined. The physical test circuit is presented in
Figure 5.
3.5. Measurements
The voltage and current measurement samples are captured by the
RIGOL MSO5104 oscilloscope. The data are saved and eventually processed for RMS values or frequency. The moving RMS values are computed in a window of five cycles of the 50 Hz sinusoidal waveform that is recommended by the standards for transient measurements [
8]. The sample rate of oscilloscope measurement varies between test cases. In load transient changes, the sample rate was equal 500 kSa/s, in connection and removal, the sample rate was within range (depending upon sub-case) from 50 kSa/s to 5 kSa/s. The voltage is measured directly at PCC and currents are measured at the output of the transformer via a current sensor circuit that contains a shunt resistor and Current-Sense Amplifier INA240 [
31].


