


A Numerical Investigation of the Energy Efficiency Enhancement of Oscillating Water Column Wave Energy Converter Systems

1
Faculty of Engineering and Natural Sciences (FENS), Sabanci University, Istanbul 34956, Turkey
2
Integrated Manufacturing Technologies Research and Application Center, Sabanci University, Istanbul 34956, Turkey
3
Composite Technologies Center of Excellence, Istanbul Technology Development Zone, Sabanci University-Kordsa, Istanbul 34906, Turkey
4
Naval Architecture and Marine Engineering Department, Faculty of Engineering, Piri Reis University, Istanbul 34940, Turkey
5
Altair Engineering GmbH, 85748 Munich, Germany
*
Authors to whom correspondence should be addressed.
Energies 2022, 15(21), 8276; https://doi.org/10.3390/en15218276
Submission received: 29 September 2022
/
Revised: 31 October 2022
/
Accepted: 3 November 2022
/
Published: 5 November 2022
(This article belongs to the Special Issue Numerical, Theoretical and Experimental Investigation of Two-Phase Flow)
Abstract
:This work focuses on the geometry effects over the performance of oscillating water column (OWC)-type wave energy converter (WEC) systems and searches for the OWC geometries that enhance the energy efficiencies under the same wave conditions. To analyze the hydrodynamic performances of the WEC systems, an in-house smoothed particle hydrodynamics (SPH) code based on weakly compressible fluid approach is utilized. The energy efficiency enhancement studies of the determined OWC device are carried out with a two-step geometry modification procedure. The first step starts with the validation of the free-surface elevation and orbital velocity time histories. Then, a three-by-three simulation matrix that depends on the geometrical design parameters of chamber length and front wall draft is run at three different wave conditions, and the OWC geometry that produces the maximum energy efficiency is determined. In the second step, the corner regions of the obtained optimal geometry are chamfered, and another simulation matrix is tested at the wave condition that yields maximum wave energy. It is observed in this step that the energy efficiency index can still be improved by 4.3% by only chamfering the back face of the OWC chamber. To scrutinize the physical grounds of this increase, the correlation between the time-averaged vorticity and energy efficiency is presented. Finally, the performance of the best configuration is also examined in three different wave periods, where the suggested geometry shows better performance with respect to base geometry results in all wave conditions.
1. Introduction
Because of global warming due to the dramatic increase in CO2 levels mainly associated with the massive fossil fuel consumption, energy production relying on renewable sources (i.e., solar, wind, and wave energies) has increased tremendously in the last two decades [1,2]. In 2017, it was reported that almost 20% of the total energy generation of humankind is based upon the renewable energy sources [3]. Among renewable energy resources, the high theoretical potential of the ocean energy [4] makes free-surface waves a prominent candidate for generating green electricity [5].
The most prominent barrier for the commercialization of wave energy converters (WECs) is the high initial capital and operational expenses associated with harvesting energy from waves in hazardous offshore and nearshore conditions [6]. Thus far, multiple efforts have been made to solve these hurdles by introducing various WEC concepts. To improve the efficiency of the WECs, various concepts and designs have been developed, where the number of patents has reached more than a thousand as of 2002 [7]. Despite the considerable variation in the suggested concepts, WECs are generally categorized by types of harvesting technology such as oscillating water columns, oscillating wave surge converters, submerged pressure differential, and overtopping devices [5]. These systems can be placed along the shoreline as stationary structures or employed as floating structures on the open seas. General overviews of available concepts and designs for wave energy converters can be found in [8,9,10,11].
The oscillating water column (OWC) is one of the most promising concepts that have reached the prototype development stage in some regions, e.g., the LIMPET experimental plant in Islay Island, Scotland [12], the Mutriku power plant in Spain [13], the Pico power plant in Portugal, and the REWEC3 experimental plant in Italy [12]. OWC systems consist of a hollow and partially immersed storage that is open to water with an air-trapped chamber. Ocean waves cause the free surface within the tank to oscillate vertically, which pressurizes and depressurizes the air inside the chamber. The pneumatic force of this trapped air enters and leaves the bidirectional turbine located on the device chamber and turns into electrical energy through power take-off systems [14].
In recent years, several experimental and numerical studies have been conducted to investigate and characterize the hydrodynamic behavior of WECs from different aspects. Morris-Tomas et al. [15] performed experiments to study the effect of the front wall configuration on the hydrodynamic efficiency of OWCs. Chang et al. [16] conducted an experimental investigation to determine the best geometrical design for the OWC device to achieve optimum hydrodynamic efficiency. Various geometric parameters were tested. The results showed that chamber geometry, especially the backplate slope, substantially influenced the OWC performance.
Although experimental methods capture and reveal such devices’ hydrodynamic behavior more realistically, they are frequently regarded to be costly and time-consuming, and may also suffer from the scale effects at the design stage. As an alternative to experimental approaches, computational investigation of the hydrodynamic performance of OWCs using numerical wave tanks is a reliable and less expensive method. Simonetti et al. [17] used a mesh-based finite volume method in the OpenFOAM environment to analyze a fixed asymmetric OWC device. The results showed that chamber length, front wall draft, and relative OWC PTO damping had a strong effect on OWC efficiency. As shown in [18], chamber length has a substantial influence on OWC performance when compared to other OWC geometric characteristics. In addition, the angle of inclination in the bottom profile is an important parameter for shoreline OWC efficiency. Kamath et al. [19] investigated the hydrodynamic behavior of a 2D OWC under various wave conditions; they used the REEF3D CFD code in their numerical study. In the simulation, lower wave steepness caused the inner free surface to move firmly similar to a piston, but higher wave steepness caused nonuniform motion.
One of the important engineering problems that can significantly affect the performance of OWC devices and cause strong nonlinearity behavior inside OWC chambers is the resonant phenomenon (gap and harbor resonance). The modifications of the OWC geometry and topographical slope can alter the resonant frequency of the water body inside the chamber. Gao et al. [20] used OpenFOAM to study the impact of topographical variation on the fluid gap resonance between a stationary box and a vertical wall using incident regular waves. They discovered that the fluid resonant frequency decreased monotonically as the topographical slope increased. Gao et al. [21] studied the effects of Bragg reflection on harbor oscillations, which are caused by two types of incoming steady-state waves. During their simulations, they thoroughly examined the impact of topographic characteristics on oscillations.
In addition to widely implemented mesh-based computational solutions [19,22,23,24], which may have difficulties in capturing the nonlinear dynamics of high free-surface deformations in the problem area, and the instantaneous response of WEC devices in severe wave conditions, in the last decade, meshless techniques have attained significant interest in providing high-fidelity results [25,26,27,28]. Luo et al. [29] reviewed the state of the art in the application of meshless techniques to solve hydrodynamic issues in marine and coastal engineering such as wave formation, propagation, and refraction, as well as related turbulence generation and dissipation, air entrainment, and mass transfer. Fu et al. [26] used a semi-Lagrangian meshless frame to investigate the sloshing phenomenon in a two-dimensional numerical tank. Their approach was shown to provide more stable and accurate results than one with an explicit mesh-based scheme.
Smoothed particle hydrodynamics (SPH) is one of the most widely utilized mesh-free computational approaches for modeling diverse physical fluid flow conditions [30,31,32,33,34]. He et al. [32] developed a coupled weakly compressible and total Lagrangian SPH (WC-TL SPH) approach to model the interactions of elastic entities with free-surface flows. Khayyer et al. [35] briefly reviewed recent progress in the development of totally Lagrangian, mesh-free computational techniques for hydroelastic fluid–structure interactions in marine engineering and highlighted some important issues in this context. Almasi et al. [30] presented a multiphase incompressible smoothed particle hydrodynamics (ISPH) method to examine complicated multiphysics electrohydrodynamics (EHD) issues. Furthermore, the SPH technique is commonly employed to research hydrodynamic problems because of its particular benefits in modeling highly nonlinear free-surface problems [36,37,38,39]. Gotoh et el. [40] provided an update on recent advances in particle methods. They discussed recent advances in accuracy, fluid–structure interactions, and computational efficiency. Lyu et al. [41] provided a detailed overview of SPH-based hydrodynamic simulations for ocean energy systems. The main focus is on three topics: SPH-based numerical fluid tanks, multiphysics SPH methods for modeling ocean energy systems, and, finally, computing efficiency and capacity. Ozbulut et al. [36] utilized the SPH technique in order to model a numerical wave tank. A wide variety of test cases with different wavelengths and steepness ratios for regular and irregular ocean waves were investigated using piston- and flap-type wavemakers.
The application of the SPH method to model the wave energy converters has also increased over the past few years [38,42,43,44]. Crespo et al. [42] simulated wave interaction with an offshore OWC device in a numerical wave tank by using an open-source SPH code (DualSPHysics). It was proven that their models can accurately create the free-surface evolution inside the chamber when the air pressure is neglected. Wen et al. [44] used an improved SPH model to examine the hydrodynamic performance of onshore OWC and considered the turbulence effect during their work. It was shown that a sloshing phenomena could be detected in the OWC chamber when the front wall depth was reduced. More recently, Ropero-Giralda et al. [38] utilized the SPH method to investigate the efficiency and survivability of a point-absorber-type WEC device under different regular wave conditions. Recently, Quartier et al. [38] used the SPH approach to numerically model an OWC WEC. In order to numerically simulate the power take-off (PTO) system, a force is applied to a plate that is floating on the free surface of the OWC chamber. This eliminates the air phase simulation, which is computationally costly in SPH approaches.
Objectives of This Paper
In this study, the weakly compressible SPH (WCSPH) approximation [45] is utilized to investigate the hydrodynamic characteristics and the energy efficiencies of OWC-type wave energy converter system. The current geometrical model of the present study is assumed to be the simplified version of the 3D case due to its longitudinal symmetry, where the validity of the results can be generalized for the 3D cases by ignoring the effects of higher-order terms related to the eddy-vortices. The proposed in-house SPH code is validated by an experimental study [46] consisting of a stationary OWC with an open chamber. Additionally, a particle resolution and convergence test is also performed to determine the optimum particle resolution on the problem domain. After achieving accurate results by utilizing the proposed SPH scheme on an OWC system, a two-step efficiency enhancement study is performed based on the geometrical modifications of the chamber part in the OWC device to obtain the configuration that provides maximum available wave energy. In the first step, the geometrical parameters (including length of chamber and front wall draft) are varied to obtain the maximum harvested energy in three different wave periods. Using the best geometrical configuration that leads to maximum wave energy production among all wave period conditions, the second step is applied by chamfering the corner parts of the chamber region, considering all possible configurations. As a final scrutiny, an investigation to obtain the relationship between the time-averaged magnitude of vorticity in the OWC inner channel and the hydrodynamic efficiency is performed through a quantitative comparison among all test cases.
The novelty of this study lies in the systematic and comprehensive analysis of the OWC system geometric configurations to increase the amount of extracted energy under equal wave conditions. It can be said as one of the major outcomes of this study that the proposed SPH scheme can accurately capture the energy level changes even after applying slight modifications to the chamber corner geometries, where the correlation between vorticity magnitudes in the flow domain and harvested energy is verified in all geometry configurations. In conclusion, due to the highly robust and accurate capabilities of the utilized in-house code of the proposed work, it becomes possible to claim that minor modifications to the chamber geometry may further improve the overall efficiency of the OWC system under the same wave conditions.
The paper’s organization is as follows: In the second section, the governing equations, and the discretized form of these equations based on the proposed WCSPH approach, are mentioned. Following the definition of the physical and geometrical parameters of the problem, hydrodynamic efficiency equations of the OWC device are presented in the third section. In the fourth section, the robustness, consistency, and accuracy of our numerical method are examined through comparing the experimental and theoretical results found in the literature [46]. Then, the effect of geometrical modifications on the OWC system is scrutinized with quantitative and qualitative measures in the fifth section. Finally, the discussions on the obtained results and concluding remarks are highlighted in the last section.
2. Governing Equations and SPH Modeling
In the present study, the continuity and conservation of linear momentum equations are employed to govern the motions of barotropic and isothermal fluid domain:
where is the material time derivative, represents the velocity, denotes the density, p is the pressure, is the dynamic viscosity, and is the gravitational acceleration. In passing, it would be explanatory to state that turbulent fluctuations and associated dissipation within the computational domain are prudently ignored with the assumption that the smallest length-scale of turbulent movement does not affect the free-surface deformation, notably.
The governing equations are discretized by the well-known WCSPH approach [47] which has been widely utilized in many engineering applications with free-surface hydrodynamics modeling [38,39,48,49]. To close the governing equation system, the WCSPH approach utilizes an equation of state that couples pressure and density variations. The following equation of state is used during the simulations of this study:
where is the reference speed of sound, is the reference density for water equal to 1000 kg/m3, and is the specific heat ratio of water, taken as 7. The reference speed of sound is determined by keeping the Mach number (M) below 0.1, which satisfies the density variations less than 1% [50]. To guarantee the limited density variations among all simulated wave conditions of the present study, the value of is set at 25 times the maximum wave group velocity, which gives 200 m/s, and satisfies the incompressibility condition, especially in the regions close to the moving boundary and beach. It should be remembered here that assigning the physical value of speed of sound in water leads to undesirable time step values in terms of high computational costs and also leads to a negligible contribution in the enforcement of incompressibility constraints.
In the SPH method, the fluid domain is represented by a collection of free particles, all of which contain information about field variables such as density, velocity, and pressure. The SPH formulation relies essentially on the integral representation of a function, which is discretizable using a particle approximation [51]. Given particle , the values of an arbitrary field variable, which is either a scalar or a vector , are computed by an interpolation procedure that uses the amounts of the neighboring particles, represented as or . To clarify the notation used in the rest of the article, note that mixed notation (both direct and index notations) is used for either the vector or tensor fields. In direct notation, vectors are denoted by bold lowercase letters, while tensor fields are denoted by bold uppercase letters. In index notation, italic Latin indices are used to denote vector or tensor components, and they are always superscripted unless otherwise indicated. Einstein’s summation convention applies, where repeating indices imply summation over them. According to the SPH technique, concisely presented here, the value of any field function is computed by the following procedure:
where subscripts and represent the particle index, N is equal to the total number of neighbor particles for particle . , or in full form , is the piecewise quintic kernel function [27], which depends on the dimensionless parameter , h is the smoothing length equivalent to 1.33 times the initial particle distance (), and is a coefficient depending on the size of the problem domain. In a two-dimension domain, is equal to . denotes the particle volume, which is computed as .
Before showing the discretization methodology of the governing equations through WCSPH approximation, it will be convenient to define the applied treatments for function derivatives. To enhance the accuracy of gradient and divergence operations for any scalar or vector valued field variables, a corrective SPH (CSPH) formulation [52,53] is included into the numerical scheme of this work:
In Equation (8), is the second rank correction tensor, which helps to avoid potential inconsistencies such as particle clustering and truncated support domains at boundaries. By representing the inverse of as , if both sides of Equation (8) are multiplied by , the gradient correction of kernel matrix can be found as , and this can be described as in direct notation.
By imposing these CSPH treatments, the described governing equations of fluid motion can be discretized through WCSPH approximation:
is the differentiation taken with respect to the position of particle . In Equation (10), , where n is the dimension of the problem domain [54] and is the kinematic viscosity, which is taken as 10 (m2/s) for water.
In the weakly compressible SPH method, accurate density computation is very critical because the pressure values are linked to the density values through the equation of state, and small density disturbances can cause large fluctuations in the pressure field, which in turn reduces the precision and stability of numerical approach [55]. To mitigate the adverse effects of oscillatory pressure field distributions during evolution of fluid flow, the density smoothing treatment, which is frequently used in the SPH literature [56,57], is incorporated into the present study’s numerical scheme:
where represents the corrected density and is computed by interpolation between neighboring particle densities.
As a final correction algorithm, hybrid velocity-variance-based free surface (VFS) and artificial particle displacement (APD) treatment is employed in the simulations of this study. The VFS algorithm is applied only to free-surface particles, which aims to ensure an averaged velocity and avoid excessive scattering on the free surface. The free-surface particles are defined as the particles with a neighboring particle number less than 65% of the average number of neighboring particles in the problem area. The velocities of the free-surface particles are calculated as follows:
where indicates the corrected particle velocity, and is a dimensionless constant which was suggested to be taken between 0.05–0.1 times the initial particle distance () in our previous studies [36,37,55], and accordingly it is taken as 0.075 in all simulations of this study. On the other hand, the APD algorithm is used for the fully populated regions of the fluid domain which considerably improves the precision of the interpolation processes of the proposed SPH method by providing a uniform particle distribution throughout flow evolution. The formulation of the APD algorithm is defined as [55]:
where denotes the updated position vector of the particles that are inside the supported domain.
In this study, the wall particle velocities are set to the velocity of the boundary and no additional formulation is applied to fluid particles that are close to the wall boundaries. The wall boundaries are represented by fixed four-layer solid particles. Due to the inherent advantages of the SPH approach in the modeling of free-surface problems, the kinematic and dynamic free-surface boundary conditions are captured inherently without applying any treatment. The time integration process is carried through a predictor-corrector scheme, which is defined in detail in our previous study [27], and the time-step value defined by the Courant–Freidrichs–Lewy (CFL) condition, described as:
where , and is the produced wave system’s celerity [36].
3. Problem Definition
3.1. Numerical Wave Tank
In this work, the energy efficiency of the OWC-type wave energy converter device is examined through generating regular waves by using flap-type moving boundaries. The simulation cases are chosen to provide intermediate water conditions that avoid shallow water effects in the wave tank and the high computational costs associated with deep water conditions. In addition, all test cases are simulated at a constant depth to reduce the problem parameters in the simulation matrix and focus directly on the geometric parameters of the OWC chamber. Finally, the value of the wave height is chosen to produce a comparable variation of the chamber pre-draft (y) heights. Considering all of these design criteria, the wave properties of this study remain at the upper limit of second-order Stokes waves according to the Le Méhauté [58] abacus given in Figure 1. The relation between wave amplitude () and full stroke of the flap () is obtained through the Biesel transfer function [59]:
where k represents the wave number and d is the initial water depth at the flap boundary. To avoid the sudden initial movement of the wavemaker, the wavemaker is set into a motion with gradually increasing displacement through utilizing a simple mathematical relation [36]:
where and represent the primary positions of the wavemaker particles. The change in the vertical locations of the wavemaker particles are deemed trivial and are not updated. In Figure 2, two different two-dimensional numerical wave tanks are schematically presented. The first wave tank (top) is employed for generating the numerical results that are compared with the experimental study of Iturrioz et al. [46], while the second one (bottom) is utilized for producing simulation results for all oscillating wave energy converter test cases.
The Stokes second-order regular waves with a period of s and wave height of m are generated in the simulations when comparing the SPH results with the experimental measurements provided in [46]. The geometrical details of the baseline OWC device are described as follows: The overall length of the channel is m, the distance between the flap and the OWC front wall is m, and the distance between the flap and the toe of the sloping wall is m. The still-water depth at the flap boundary (d) is equal to 10 m. is the inclined beach’s angle, and w and y represent the optimization variables, namely, the chamber length and draft of the front wall, respectively.
Figure 3 represents the schematic view of the OWC chamber with modified slope walls utilized in the performance enhancement simulations of the OWC geometry. The blue area inside the chamber indicates the calculation region of the time-averaged vorticity magnitude which has the equivalent distance m from both front and back sides of the OWC walls.
3.2. OWC Hydrodynamic Efficiency
The present study mainly concentrates on the investigation of increasing the harvested total wave energy in OWC systems by modifying the chamber geometries. Therefore, the energy losses due to the mechanical efficiency of turbine and energy conversion efficiency of the PTO system are not considered. To pursue an objective comparison between the efficiency levels of different OWC geometries, an energy efficiency index formulation is identified according to the ratio of calculated mean pneumatic power absorbed by the OWC (without any contribution from the damping effects of PTO system) to the incident wave power per length multiplied by the chamber width b:
where the chamber width is taken as unity. The average pneumatic power harvested by the OWC can be expressed as follows:
where indicates the total duration of the simulation, represents the instantaneous differential air column pressure obtained from numerical simulation, is the air volume flux inside the OWC chamber, and represents the time step of the simulation:
In Equation (21), w is the length of the chamber and is the instantaneous vertical velocity of the free surface in the OWC chamber, which is calculated by averaging the vertical velocity of the free-surface particles inside the OWC chamber at each time step.
The relationship between the air pressure and air flow rate at the turbine inlet can be expressed with the following parabolic expression [60,61,62]:
where is the volume flow rate of air per second per unit width (), and is the damping term in the OWC chamber, which is defined as:
Here, denotes the air density (taken as kg/m3) and is a dimensionless damping coefficient representing the relation between the pressure drop in the OWC chamber and the turbine’s flow rate. The damping coefficient depends on the utilized turbine characteristics which may significantly affect the overall performance of the OWC device [60]. To keep the simplicity and for the sake of quantitative comparison in the representation of the energy efficiencies of each OWC geometries, is considered as unity in all simulation cases. One can assign the specific value of to determine the total power harvested by the OWC for the given wave conditions and OWC device geometries.
The average incident wave power per unit width for the Stokes second-order wave is indicated as [59]:
where is the incident wave height, denotes the angular frequency of the incident wave, and d is the depth of water. By substituting all of the expressions into the OWC energy efficiency index, it can be simply calculated as follows:
4. Verification and Validation Studies for the OWC Simulations
In this section, the verification and validation of the proposed numerical scheme is realized through comparing the free-surface deformations and velocity components within the OWC chamber with the available theoretical and experimental results of the literature. In the former test case, the time series of the free-surface elevation and velocity components close to the free surface are verified with the theoretical results of second-order Stokes waves. For the latter case, the numerical performance of the proposed SPH algorithm is validated through the comparison of free-surface elevation in the center of the OWC device with experimental and time-domain results of Iturrioz et al. [46]. Additionally, a resolution test was also performed to achieve the convergence of the numerical scheme and obtain the optimum number of particle distribution in the fluid domain.
To verify the characteristics of generated waves in the numerical OWC tank, the wave kinematic quantities, namely, the free-surface elevation and orbital velocities at m and m, are compared with the Stokes second-order wave theory [59]. Considering the second-order wave theory, the theoretical time series of water surface elevation and orbital velocities of water particles for a defined position (x and z) are calculated as follows [59]:
As can be seen from the time series given in Figure 4, the generated waves in the numerical wave tank are in good agreement with the theoretical wave characteristics.
The results of the numerical approach proposed in this study are validated and verified with the experimental and theoretical findings of Iturrioz et al. [46] in terms of the free-surface time series plotted for the center location of the OWC device given. Iturrioz et al. [46] presented a simplified time-domain model for a stationary OWC. In this model, they used the Cummins integro-differential equation to express the motion of a floating body.
To examine the particle size independence of the proposed algorithm, a convergence study is also carried out with five different particle resolutions. Furthermore, the accuracy of the numerical simulation results is measured using the root mean square error (RMSE) to make a quantitative comparison between the performances of particle resolutions, defined as:
where and represent the water surface elevation within the OWC chamber for any ith sample of the numerical and experimental results, respectively, and N is the number of samples for each simulation.
Figure 5 displays the comparative graph of the numerical simulations with variable particle resolutions, while Table 1 indicates the RMSE values, computational performances of each cases. One can say that SPH results of the present study can capture the overall wave characteristics inside the OWC chamber in all resolutions and produces compatible free-surface profiles with experimental results with the increasing particle resolutions. It can also be stated that SPH predicts the nonlinear characteristics of the wave trough deformations inside the chamber better than the time-domain model solution.
In light of the obtained RMSE values, it can be said that there is no significant difference between and resolutions. On the other hand, using resolutions results in a significant increase in computational costs. The resolution is still accurate enough to compare with experimental data without increasing the particle number and computation time. Following the observations and outcomes of the convergence study, particle resolution is utilized in all simulations of this work.
5. Results and Discussion
This section presents the simulation results for the OWC-type wave energy converter device. Initially, a simulation matrix is generated by altering the chamber length and front wall draft values of the OWC system for three distinct wave conditions, leading to twenty-seven different configurations. Then, the configuration with the largest EEI value is chosen as the reference or baseline case for which the effect of corner chamfering on the wave energy output capacity of the OWC device is investigated.
5.1. Performance Assessment of Chamber Length and Front Wall Draft Configurations
Recall that investigating the impact of geometrical combinations and wave conditions on the efficiency of the stationary OWC-type wave energy converters constitutes the main objective of this study. In this context, a three-by-three simulation matrix was created based on the variation of the characteristic lengths of the system, namely, chamber length (w) and front wall draft (y). Additionally, whole simulation matrix was run for three different wave period conditions at each geometrical configuration. It may be convenient to recall that second-order Stokes waves were generated in all OWC device simulations and wave heights were set to a constant value of m to reduce the complexity of the comparison. In all cases, the simulations were carried out for 150 s.
The obtained EEI results for all geometry configurations and wave conditions are presented in Table 2. It can be seen that the anterior wall immersion depth may have a significant effect on OWC efficiency for the wave period s where the EEI values drop dramatically with the increasing draft values. In the cases of wave period s, the EEI values highly depend on both geometry parameters, where it can be deduced that there is a tendency of decreasing efficiency with higher draft sizes. In contrast, in the simulation results of the wave conditions with s, the increase in chamber length and draft values generally leads to a positive effect on the wave energy efficiencies except the maximum values of both parameters. The comparative analysis on the results of all test cases indicates that the amount of the harvested wave energy highly depends on the OWC geometry for each particular wave condition and the collected energy may be increased by the appropriate design of OWC geometry according to the dominating wave characteristics of the region. If the utilized regular wave periods are considered, it can be clearly inferred that these OWC geometries can be a good candidate for a coastal region with the peak wave period of s and average wave height of m, where the maximum EEI values are achieved for nearly all geometrical configurations.
To provide further details for the EEI calculations of all geometries, the time series of free-surface elevation, velocity, and air pressure inside the chamber are plotted in Figure 6. As can be seen in Figure 6, an increase in the front wall draft of the OWC for a fixed chamber length generally results in a decrease in the EEI index due to a decrease in the surface velocity of the water and the air pressure in the chamber. For a fixed front wall draft, a decrease in chamber length generally results in an increase in surface velocity and air pressure in the OWC chamber, leading to an increase in EEI index.
5.2. Effect of the Corner Chamfering on the Energy Effeciency
Having determined the chamber geometry configuration and wave condition that yields the maximum EEI value, a systematical investigation of this chamber geometry and wave characteristic was performed to seek for further improvement in the total efficiency by only chamfering the corners inside the OWC channel. Thus, seven additional geometry configurations (see Figure 3) were created, wherefore the dimensional details are described in Table 3 together with the best geometry of the previous analyses.
As can be seen in Table 3, all simulation cases except for cases 3 and 7 cause a drop in the OWC efficiency compared to case 1 (base model). Modifying the channel walls’ geometry in cases 3 and 7 leads to an increase in efficiency by 3.4 and 4.3 percent, respectively. The possible reason that lies behind this improvement is considered to be related to the amount of vorticity levels. To extract the vortical characteristics in all geometry configurations, a strategy for the objective quantification of vorticities is proposed. According to this strategy, a correlation between the amount of vorticity generated inside the common region for all geometries (shown as blue in Figure 3) and the EEI was established. The absolute amount of dimensionless vorticity ( with denoting the wavelength) is averaged over the total simulation time. To extract this correlation and represent the results in a succinct manner, the dimensionless vorticity and EEI values of each test cases are plotted in sequential order in Figure 7. It is numerically proven that EEI values are improving with the decrease in vorticity levels, which is actually an achievement of proper chamfers applied in the OWC chamber geometry.
Figure 8 presents the vorticity fields of test cases with maximum and minimum EEI values whereby one can clearly see that the magnitude of the vorticity field is smaller for the case with the maximum EEI value. This observation can be attributed to the fact that the vorticity inherently leads to energy dissipation. The chamfering hampers the formation of vorticity through providing a streamlined flow pattern and larger space for fluid flow. The comparison of test cases 3 and 7 reveals that they have nearly identical EEI and vorticity values, which suggests that the chamfer formed by the dimensional factors of – pairs does not have a notable influence on the EEI and vorticity magnitude. In all simulations, it is observed that the existence of the chamfer defined by the geometrical factor of the – pair reduces the EEI value.
One can easily observe that there is an inverse relationship between the energy efficiency and the amount of vorticity inside the determined region. Using the chamfer configuration of cases 3 and 7 results in lower vortex flow characteristics in the blue region (Figure 3), and hence leads to lower energy losses in the OWC system. Particularly, the chamfer on the back wall of the chamber encourages more streamlined flow along the vertical direction and enhances the free-surface velocity and the air pressure inside the chamber which can be seen in the time-series graphs given in Figure 9.
The working performance of the best geometrical configuration (test case 3) was also evaluated for the wave periods of , 8, and 10 s. Achieved efficiencies are tabulated and compared with the findings of base geometry in Table 4. As can be seen from the table, modifying the channel walls’ geometry to case number 3 leads to an increase in efficiency in all wave conditions, where the amount of increase depends on the incident wave characteristics. Figure 10 displays the time series of free-surface elevations, velocities, and air pressure in the chamber for all simulated wave periods.
When considering the whole OWC device simulation results, it can be claimed that utilizing the obtained chamber length and draft dimensions together with implying the chamfer modifications of test case 3 can be a good candidate for a coastal region with the peak wave period of s and characteristic wave height of m.
6. Conclusions
The search for possible energy efficiency enhancement in OWC-type WECs under the same wave conditions comprises the main objective of this study. A weakly compressible SPH approach was employed to investigate the hydrodynamic characteristics and the energy efficiency of an OWC-type wave energy converter system. Numerical simulations were performed in a two-dimensional numerical wave tank that generates regular waves using a flap-type moving boundary.
As an initial validation study, the numerical performance of the proposed SPH scheme was examined by comparing the free-surface elevation in the middle of the OWC device with experimental and time-domain method results of Iturrioz et al. [46]. To investigate the particle size independence of the numerical scheme and obtain the optimum particle size, a convergence study was conducted, where the accuracy of the numerical results was assessed by comparing the root mean square error with experimental results. The outcomes of these simulations proved that the proposed SPH scheme can capture the free-surface time series given by the experimental and time-domain method study of [46]. Secondly, the free-surface elevation and the orbital velocity time series of the proposed SPH scheme were compared with the theoretical second-order Stokes wave theory findings, where highly compatible results were observed.
Following the validation of the numerical method for the utilized OWC geometry, a two-step efficiency enhancement study was conducted through systematical geometry modifications. In the first step, the chamber length and front wall draft were varied to obtain the best geometry that leads to maximum harvested energy in three different wave periods. After determining the geometrical configuration that gave the maximum efficiency, the second-step geometry modification was carried out on the optimal geometry of the first step. A simulation matrix that consisted of the combinations of chamfered corner regions of the OWC chamber was run and it was observed that the energy efficiency of the OWC geometry can be still improved by . Furthermore, the enhanced OWC geometry configuration also harvested more wave energy in different wave conditions with respect to the base geometry, which had no chamfering at the corners. As a final investigation, a quantified relationship between the time-averaged vorticity inside the chamber region and the energy efficiency was built. The vorticity analyses inside the chamber region indicated that reducing the vorticity magnitudes results in the higher total energy efficiency of the device, which is an expected outcome of energy conservation laws in physics.
To summarize and make an overall assessment of all test cases, the potential of the harvested wave energy highly depends on the OWC geometry for each particular wave condition, and the collected energy may be increased by the appropriate design of OWC geometry according to the dominating wave climates of the region. Nonetheless, the inspection of the effect of the water depth is not included in the limelight of this study. As trials at different water depths will lead to different oscillation characteristics of the free surface inside the chamber, it may be beneficial to extend the comprehensiveness of this study to various water depths and wave characteristics in future studies.
Author Contributions
Conceptualization, M.O., M.Y. and S.R.; methodology, M.Y., M.O. and S.R.; software, S.R., M.O. and M.Y.; validation, S.R. and M.O.; formal analysis, S.R. and M.O.; investigation, S.R. and M.O.; resources, M.Y.; writing—original draft preparation, S.R. and M.O.; writing—review and editing, M.Y. and M.O.; visualization, S.R.; supervision, M.Y.; project administration, M.Y.; funding acquisition, M.Y. All authors have read and agreed to the published version of the manuscript.
Funding
This work is supported by the Scientific and Technological Research Council of Turkey (TUBITAK) Grant Number 117M091.
Data Availability Statement
Not applicable.
Conflicts of Interest
The authors declare no conflict of interest.
References
- Abas, N.; Kalair, A.; Khan, N. Review of fossil fuels and future energy technologies. Futures 2015, 69, 31–49. [Google Scholar] [CrossRef]
- Panwar, N.; Kaushik, S.; Kothari, S. Role of renewable energy sources in environmental protection: A review. Renew. Sustain. Energy Rev. 2011, 15, 1513–1524. [Google Scholar] [CrossRef]
- Henner, D. Renewables 2017 Global Status Report. Available online: https://www.ren21.net/wp-content/uploads/2019/05/GSR2017Full-ReportEnglish.pdf (accessed on 28 September 2022).
- Mork, G.; Barstow, S.; Kabuth, A.; Pontes, M.T. Assessing the global wave energy potential. In Proceedings of the International Conference on Offshore Mechanics and Arctic Engineering, Honolulu, HI, USA, 16–17 February 2010; Volume 49118, pp. 447–454. [Google Scholar]
- Drew, B.; Plummer, A.R.; Sahinkaya, M.N. A review of wave energy converter technology. Proc. Inst. Mech. Eng. Part A J. Power Energy 2009, 223, 887–902. [Google Scholar] [CrossRef] [Green Version]
- Rezanejad, K.; Gadelho, J.; Soares, C.G. Hydrodynamic analysis of an oscillating water column wave energy converter in the stepped bottom condition using CFD. Renew. Energy 2019, 135, 1241–1259. [Google Scholar] [CrossRef]
- Clément, A.; McCullen, P.; Falcão, A.; Fiorentino, A.; Gardner, F.; Hammarlund, K.; Lemonis, G.; Lewis, T.; Nielsen, K.; Petroncini, S.; et al. Wave energy in Europe: Current status and perspectives. Renew. Sustain. Energy Rev. 2002, 6, 405–431. [Google Scholar] [CrossRef]
- Antonio, F.d.O. Wave energy utilization: A review of the technologies. Renew. Sustain. Energy Rev. 2010, 14, 899–918. [Google Scholar]
- Falnes, J. A review of wave-energy extraction. Mar. Struct. 2007, 20, 185–201. [Google Scholar] [CrossRef]
- López, I.; Andreu, J.; Ceballos, S.; De Alegría, I.M.; Kortabarria, I. Review of wave energy technologies and the necessary power-equipment. Renew. Sustain. Energy Rev. 2013, 27, 413–434. [Google Scholar] [CrossRef]
- Markel, P.; Ringwood, J.V. A review of Wave-to-Wire Models for Wave Energy Converters. Energies 2016, 9, 506. [Google Scholar]
- Simonetti, I.; Cappietti, L.; Oumeraci, H. An empirical model as a supporting tool to optimize the main design parameters of a stationary oscillating water column wave energy converter. Appl. Energy 2018, 231, 1205–1215. [Google Scholar] [CrossRef]
- Ibarra-Berastegi, G.; Sáenz, J.; Ulazia, A.; Serras, P.; Esnaola, G.; Garcia-Soto, C. Electricity production, capacity factor, and plant efficiency index at the Mutriku wave farm (2014–2016). Ocean Eng. 2018, 147, 20–29. [Google Scholar] [CrossRef] [Green Version]
- Kharati-Koopaee, M.; Fathi-Kelestani, A. Assessment of oscillating water column performance: Influence of wave steepness at various chamber lengths and bottom slopes. Renew. Energy 2020, 147, 1595–1608. [Google Scholar] [CrossRef]
- Morris-Thomas, M.T.; Irvin, R.J.; Thiagarajan, K.P. An investigation into the hydrodynamic efficiency of an oscillating water column. Offshore Mech. Arct. Eng. 2007, 129, 273–278. [Google Scholar] [CrossRef]
- Chang, C.Y.; Chou, F.N.F.; Chen, Y.Y.; Hsieh, Y.C.; Chang, C.T. Analytical and experimental investigation of hydrodynamic performance and chamber optimization of oscillating water column system. Energy 2016, 113, 597–614. [Google Scholar] [CrossRef]
- Simonetti, I.; Cappietti, L.; El Safti, H.; Oumeraci, H. Numerical modelling of fixed oscillating water column wave energy conversion devices: Toward geometry hydraulic optimization. In Proceedings of the International Conference on Offshore Mechanics and Arctic Engineering. American Society of Mechanical Engineers, St. John’s, NL, Canada, 31 May–5 June 2015; Volume 56574, p. V009T09A031. [Google Scholar]
- Ning, D.Z.; Shi, J.; Zou, Q.P.; Teng, B. Investigation of hydrodynamic performance of an OWC (oscillating water column) wave energy device using a fully nonlinear HOBEM (higher-order boundary element method). Energy 2015, 83, 177–188. [Google Scholar] [CrossRef]
- Kamath, A.; Bihs, H.; Arntsen, Ø.A. Numerical investigations of the hydrodynamics of an oscillating water column device. Ocean Eng. 2015, 102, 40–50. [Google Scholar] [CrossRef] [Green Version]
- Gao, J.; He, Z.; Zang, J.; Chen, Q.; Ding, H.; Wang, G. Topographic effects on wave resonance in the narrow gap between fixed box and vertical wall. Ocean Eng. 2019, 180, 97–107. [Google Scholar] [CrossRef]
- Gao, J.; Ma, X.; Dong, G.; Chen, H.; Liu, Q.; Zang, J. Investigation on the effects of Bragg reflection on harbor oscillations. Coast. Eng. 2021, 170, 103977. [Google Scholar] [CrossRef]
- Elhanafi, A.; Fleming, A.; Macfarlane, G.; Leong, Z. Numerical energy balance analysis for an onshore oscillating water column–wave energy converter. Energy 2016, 116, 539–557. [Google Scholar] [CrossRef]
- Ransley, E.; Greaves, D.; Raby, A.; Simmonds, D.; Hann, M. Survivability of wave energy converters using CFD. Renew. Energy 2017, 109, 235–247. [Google Scholar] [CrossRef] [Green Version]
- Simonetti, I.; Cappietti, L.; Elsafti, H.; Oumeraci, H. Evaluation of air compressibility effects on the performance of fixed OWC wave energy converters using CFD modelling. Renew. Energy 2018, 119, 741–753. [Google Scholar] [CrossRef]
- Altomare, C.; Crespo, A.J.; Domínguez, J.M.; Gómez-Gesteira, M.; Suzuki, T.; Verwaest, T. Applicability of smoothed particle hydrodynamics for estimation of sea wave impact on coastal structures. Coast. Eng. 2015, 96, 1–12. [Google Scholar] [CrossRef]
- Fu, Z.J.; Zhang, J.; Li, P.W.; Zheng, J.H. A semi-Lagrangian meshless framework for numerical solutions of two-dimensional sloshing phenomenon. Eng. Anal. Bound. Elem. 2020, 112, 58–67. [Google Scholar] [CrossRef]
- Ozbulut, M.; Yildiz, M.; Goren, O. A numerical investigation into the correction algorithms for SPH method in modeling violent free surface flows. Int. J. Mech. Sci. 2014, 79, 56–65. [Google Scholar] [CrossRef] [Green Version]
- Shobeyri, G.; Afshar, M. Simulating free surface problems using discrete least squares meshless method. Comp. Fluids 2010, 39, 461–470. [Google Scholar] [CrossRef]
- Luo, M.; Khayyer, A.; Lin, P. Particle methods in ocean and coastal engineering. Appl. Ocean Res. 2021, 114, 102734. [Google Scholar] [CrossRef]
- Almasi, F.; Shadloo, M.; Hadjadj, A.; Ozbulut, M.; Tofighi, N.; Yildiz, M. Numerical simulations of multi-phase electro-hydrodynamics flows using a simple incompressible smoothed particle hydrodynamics method. Comput. Math. Appl. 2019, 81, 772–785. [Google Scholar] [CrossRef]
- Saghatchi, R.; Kolukisa, D.C.; Yildiz, M. Development of smoothed particle hydrodynamics method for modeling active nematics. Int. J. Numer. Methods Eng. 2022; in press. [Google Scholar] [CrossRef]
- He, J.; Tofighi, N.; Yildiz, M.; Lei, J.; Suleman, A. A coupled WC-TL SPH method for simulation of hydroelastic problems. Int. J. Comput. Fluid Dyn. 2017, 31, 174–187. [Google Scholar] [CrossRef]
- Saghatchi, R.; Ozbulut, M.; Yildiz, M. Dynamics of double emulsion interfaces under the combined effects of electric field and shear flow. Comput. Mech. 2021, 68, 775–793. [Google Scholar] [CrossRef]
- Saghatchi, R.; Rahmat, A.; Yildiz, M. Electrohydrodynamics of a droplet in a highly confined domain: A numerical study. Phys. Fluids 2020, 32, 123305. [Google Scholar] [CrossRef]
- Gotoh, H.; Khayyer, A.; Shimizu, Y. Entirely Lagrangian meshfree computational methods for hydroelastic fluid-structure interactions in ocean engineering—Reliability, adaptivity and generality. Appl. Ocean. Res. 2021, 115, 102822. [Google Scholar] [CrossRef]
- Ozbulut, M.; Ramezanzadeh, S.; Yildiz, M.; Goren, O. Modelling of wave generation in a numerical tank by SPH method. J. Ocean. Eng. Mar. Energy 2020, 6, 121–136. [Google Scholar] [CrossRef]
- Ramezanzadeh, S.; Ozbulut, M.; Yildiz, M. Simulation of irregular wave motion using a flap-type wavemaker. In Proceedings of the MARINE VIII: International Conference on Computational Methods in Marine Engineering, CIMNE, Goteborg, Sweden, 13–15 May 2019; pp. 783–794. [Google Scholar]
- Ropero-Giralda, P.; Crespo, A.J.; Tagliafierro, B.; Altomare, C.; Domínguez, J.M.; Gómez-Gesteira, M.; Viccione, G. Efficiency and survivability analysis of a point-absorber wave energy converter using DualSPHysics. Renew. Energy 2020, 162, 1763–1776. [Google Scholar] [CrossRef]
- Violeau, D.; Rogers, B.D. Smoothed particle hydrodynamics (SPH) for free-surface flows: Past, present and future. J. Hydraul. Res. 2016, 54, 1–26. [Google Scholar] [CrossRef]
- Gotoh, H.; Khayyer, A. On the state-of-the-art of particle methods for coastal and ocean engineering. Coast. Eng. J. 2018, 60, 79–103. [Google Scholar] [CrossRef] [Green Version]
- Lyu, H.G.; Sun, P.N.; Huang, X.T.; Zhong, S.Y.; Peng, Y.X.; Jiang, T.; Ji, C.N. A Review of SPH Techniques for Hydrodynamic Simulations of Ocean Energy Devices. Energies 2022, 15, 502. [Google Scholar] [CrossRef]
- Crespo, A.; Altomare, C.; Domínguez, J.; González-Cao, J.; Gómez-Gesteira, M. Towards simulating floating offshore oscillating water column converters with smoothed particle hydrodynamics. Coast. Eng. 2017, 126, 11–26. [Google Scholar] [CrossRef]
- Dias, F.; Renzi, E.; Gallagher, S.; Sarkar, D.; Wei, Y.; Abadie, T.; Cummins, C.; Rafiee, A. Analytical and computational modelling for wave energy systems: The example of oscillating wave surge converters. Acta Mech. Sin. 2017, 33, 647–662. [Google Scholar] [CrossRef] [Green Version]
- Wen, H.; Ren, B.; Yu, X. An improved SPH model for turbulent hydrodynamics of a 2D oscillating water chamber. Ocean Eng. 2018, 150, 152–166. [Google Scholar] [CrossRef]
- Gingold, R.A.; Monaghan, J.J. Smoothed particle hydrodynamics: Theory and application to non-spherical stars. Mon. Not. R. Astron. Soc. 1977, 181, 375–389. [Google Scholar] [CrossRef]
- Iturrioz, A.; Guanche, R.; Armesto, J.; Alves, M.; Vidal, C.; Losada, I. Time-domain modeling of a fixed detached oscillating water column towards a floating multi-chamber device. Ocean Eng. 2014, 76, 65–74. [Google Scholar] [CrossRef]
- Monaghan, J.J.; Kos, A. Solitary waves on a Cretan beach. J. Waterw. Port Coast. Ocean. Eng. 1999, 125, 145–155. [Google Scholar] [CrossRef]
- Domínguez, J.M.; Crespo, A.J.; Hall, M.; Altomare, C.; Wu, M.; Stratigaki, V.; Troch, P.; Cappietti, L.; Gómez-Gesteira, M. SPH simulation of floating structures with moorings. Coast. Eng. 2019, 153, 103560. [Google Scholar] [CrossRef]
- Madhi, F.; Yeung, R.W. On survivability of asymmetric wave-energy converters in extreme waves. Renew. Energy 2018, 119, 891–909. [Google Scholar] [CrossRef]
- Monaghan, J.J. Simulating free surface flows with SPH. J. Comput. Phys. 1994, 110, 399–406. [Google Scholar] [CrossRef]
- Libersky, L.D.; Petschek, A.G.; Carney, T.C.; Hipp, J.R.; Allahdadi, F.A. High strain Lagrangian hydrodynamics: A three-dimensional SPH code for dynamic material response. J. Comput. Phys. 1993, 109, 67–75. [Google Scholar] [CrossRef]
- Can Kolukisa, D.; Ozbulut, M.; Pesman, E.; Yildiz, M. Development of Computationally Efficient Augmented Lagrangian SPH for Incompressible Flows and Its Quantitative Comparison with WCSPH Simulating Flow Past a Circular Cylinder. Int. J. Numer. Methods Eng. 2020, 121, 4187–4207. [Google Scholar] [CrossRef]
- Shadloo, M.S.; Zainali, A.; Yildiz, M.; Suleman, A. A robust weakly compressible SPH method and its comparison with an incompressible SPH. Int. J. Numer. Methods Eng. 2012, 89, 939–956. [Google Scholar] [CrossRef]
- Bouscasse, B.; Colagrossi, A.; Marrone, S.; Souto-Iglesias, A. SPH modelling of viscous flow past a circular cylinder interacting with a free surface. Comp. Fluids 2017, 146, 190–212. [Google Scholar] [CrossRef]
- Ozbulut, M.; Tofighi, N.; Goren, O.; Yildiz, M. Investigation of wave characteristics in oscillatory motion of partially filled rectangular tanks. J. Fluids Eng. 2018, 140, 041204. [Google Scholar] [CrossRef]
- Liu, M.; Liu, G. Smoothed particle hydrodynamics (SPH): An overview and recent developments. Arch. Comput. Methods Eng. 2010, 17, 25–76. [Google Scholar] [CrossRef]
- Randles, P.; Libersky, L.D. Smoothed particle hydrodynamics: Some recent improvements and applications. Comput. Methods Appl. Mech. Eng. 1996, 139, 375–408. [Google Scholar] [CrossRef]
- Le Méhauté, B. An Introduction to Hydrodynamics and Water Waves; Springer Science & Business Media: Berlin/Heidelberg, Germany, 2013. [Google Scholar]
- Dalrymple, R.A.; Dean, R.G. Water Wave Mechanics for Engineers and Scientists; World Scientific Publishing Company: Singapore, 1991; Volume 2. [Google Scholar]
- López, I.; Pereiras, B.; Castro, F.; Iglesias, G. Optimisation of turbine-induced damping for an OWC wave energy converter using a RANS–VOF numerical model. Appl. Energy 2014, 127, 105–114. [Google Scholar] [CrossRef]
- Simonetti, I.; Cappietti, L.; Elsafti, H.; Oumeraci, H. Optimization of the geometry and the turbine induced damping for fixed detached and asymmetric OWC devices: A numerical study. Energy 2017, 139, 1197–1209. [Google Scholar] [CrossRef]
- Zhu, G.; Graham, D.; Zheng, S.; Hughes, J.; Greaves, D. Hydrodynamics of onshore oscillating water column devices: A numerical study using smoothed particle hydrodynamics. Ocean Eng. 2020, 218, 108226. [Google Scholar] [CrossRef]
Figure 1.
The wave characteristics of simulations with the parameters of m and m for different wave periods, which are plotted on a Le Méhauté [58] abacus.
Figure 1.
The wave characteristics of simulations with the parameters of m and m for different wave periods, which are plotted on a Le Méhauté [58] abacus.

Figure 2.
The schematic representation of the computational domain, including the validation case wave tank (top) and the baseline OWC devices (bottom).
Figure 2.
The schematic representation of the computational domain, including the validation case wave tank (top) and the baseline OWC devices (bottom).
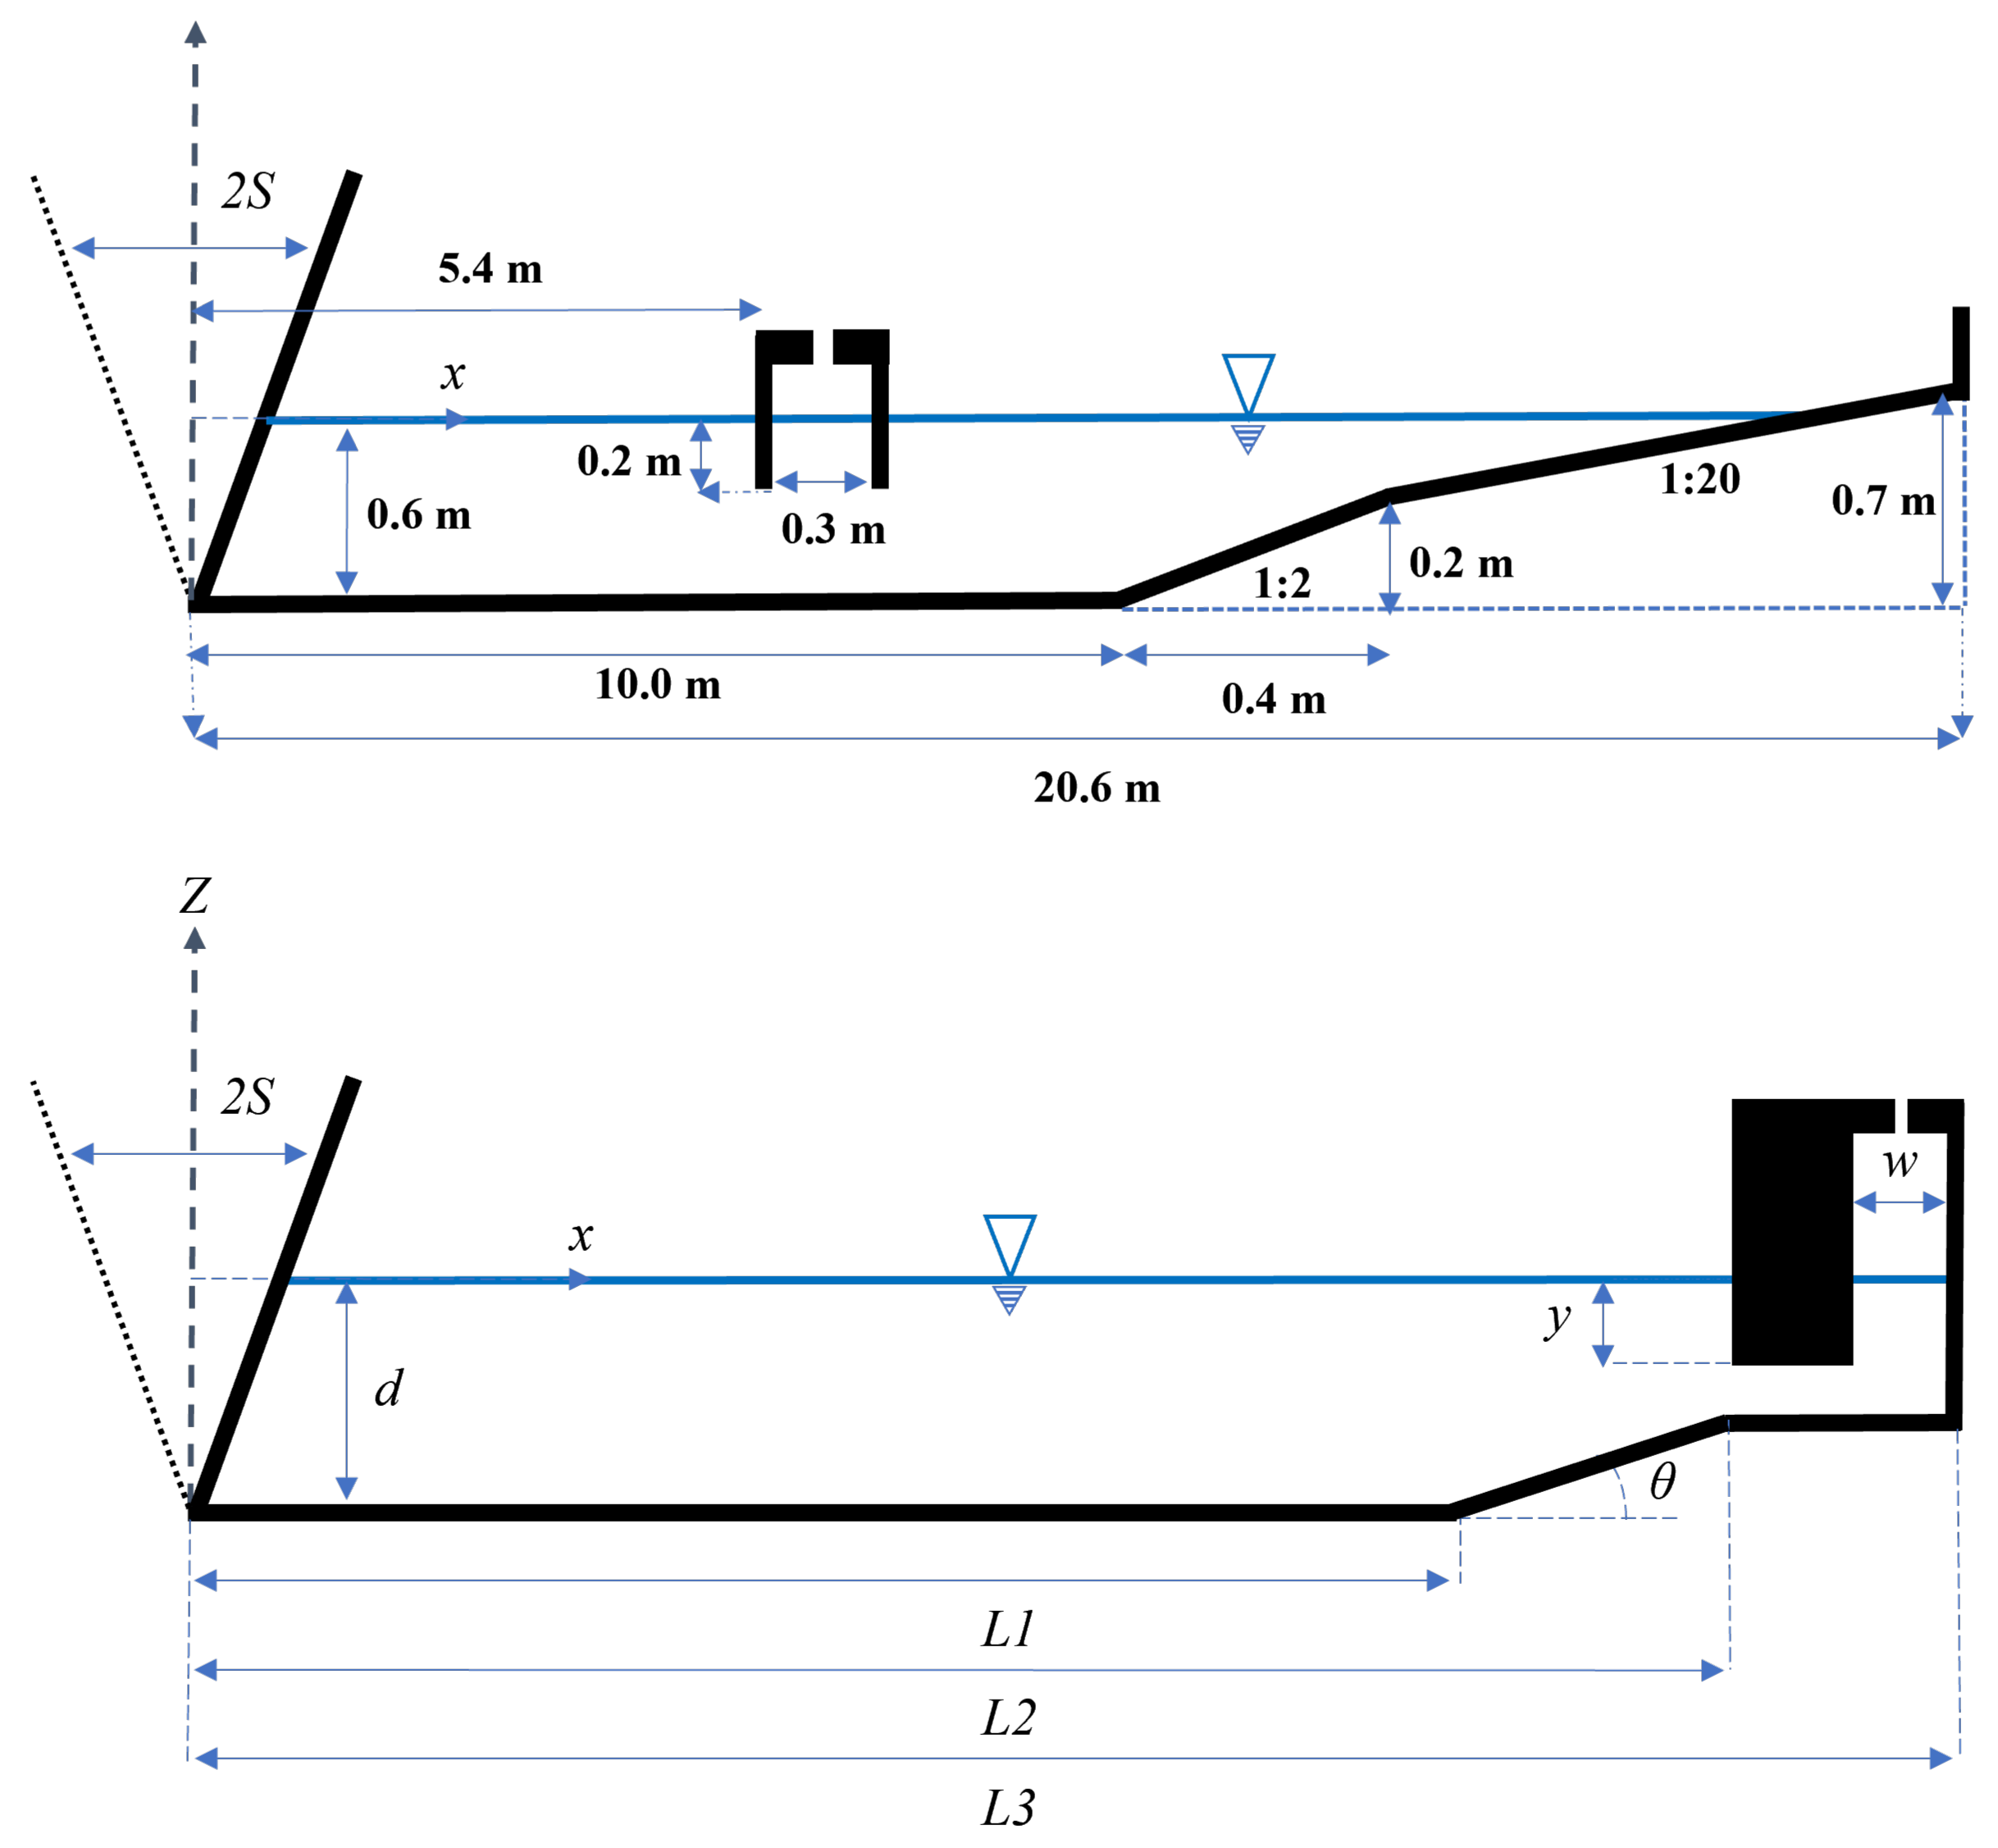
Figure 3.
The schematic representation of the OWC geometry with variable dimensions, where the blue rectangular box denotes the location at which the vorticity magnitude is computed.
Figure 3.
The schematic representation of the OWC geometry with variable dimensions, where the blue rectangular box denotes the location at which the vorticity magnitude is computed.
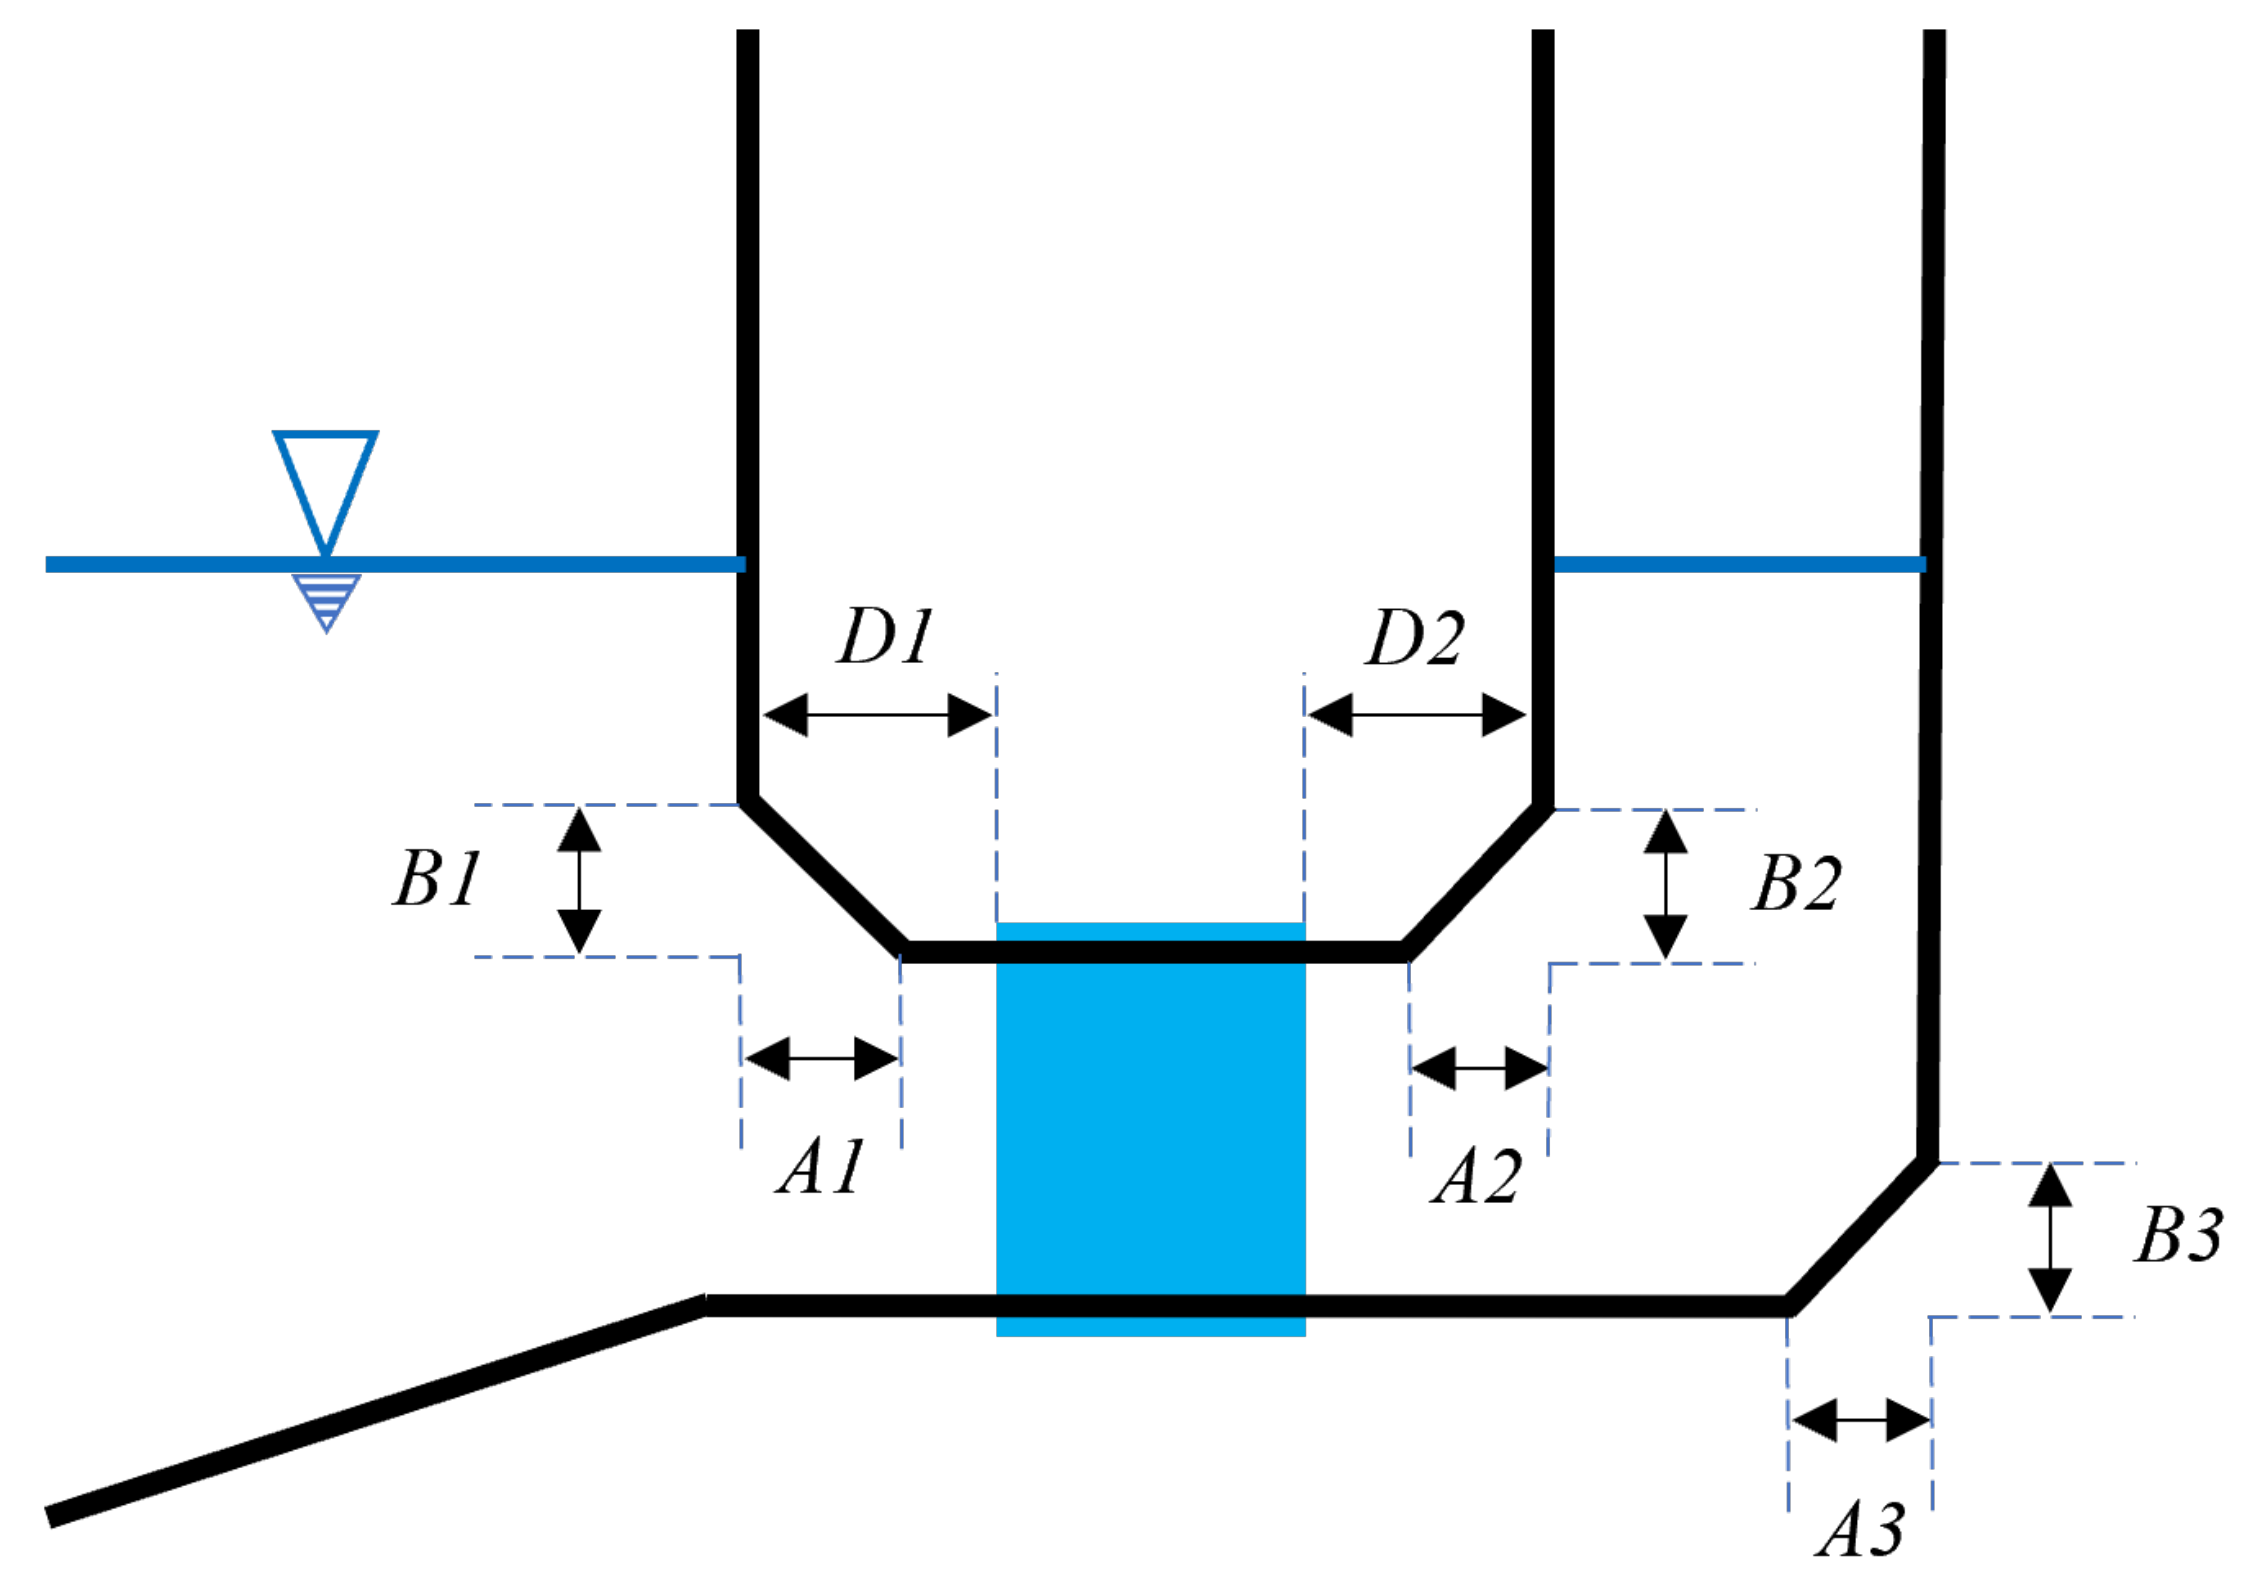
Figure 4.
Comparison of SPH numerical and theoretical (second-order Stokes) wave surface elevation and orbital velocities ( s, m, and m) at m and m.
Figure 4.
Comparison of SPH numerical and theoretical (second-order Stokes) wave surface elevation and orbital velocities ( s, m, and m) at m and m.

Figure 5.
Comparison of free-surface elevation time series of the present SPH results with those of time-domain and experimental findings of [46].
Figure 5.
Comparison of free-surface elevation time series of the present SPH results with those of time-domain and experimental findings of [46].

Figure 6.
Time series of water surface elevation (top), velocity (center), and air pressure drop (bottom) within the OWC chamber for a propagating wave with s.
Figure 6.
Time series of water surface elevation (top), velocity (center), and air pressure drop (bottom) within the OWC chamber for a propagating wave with s.
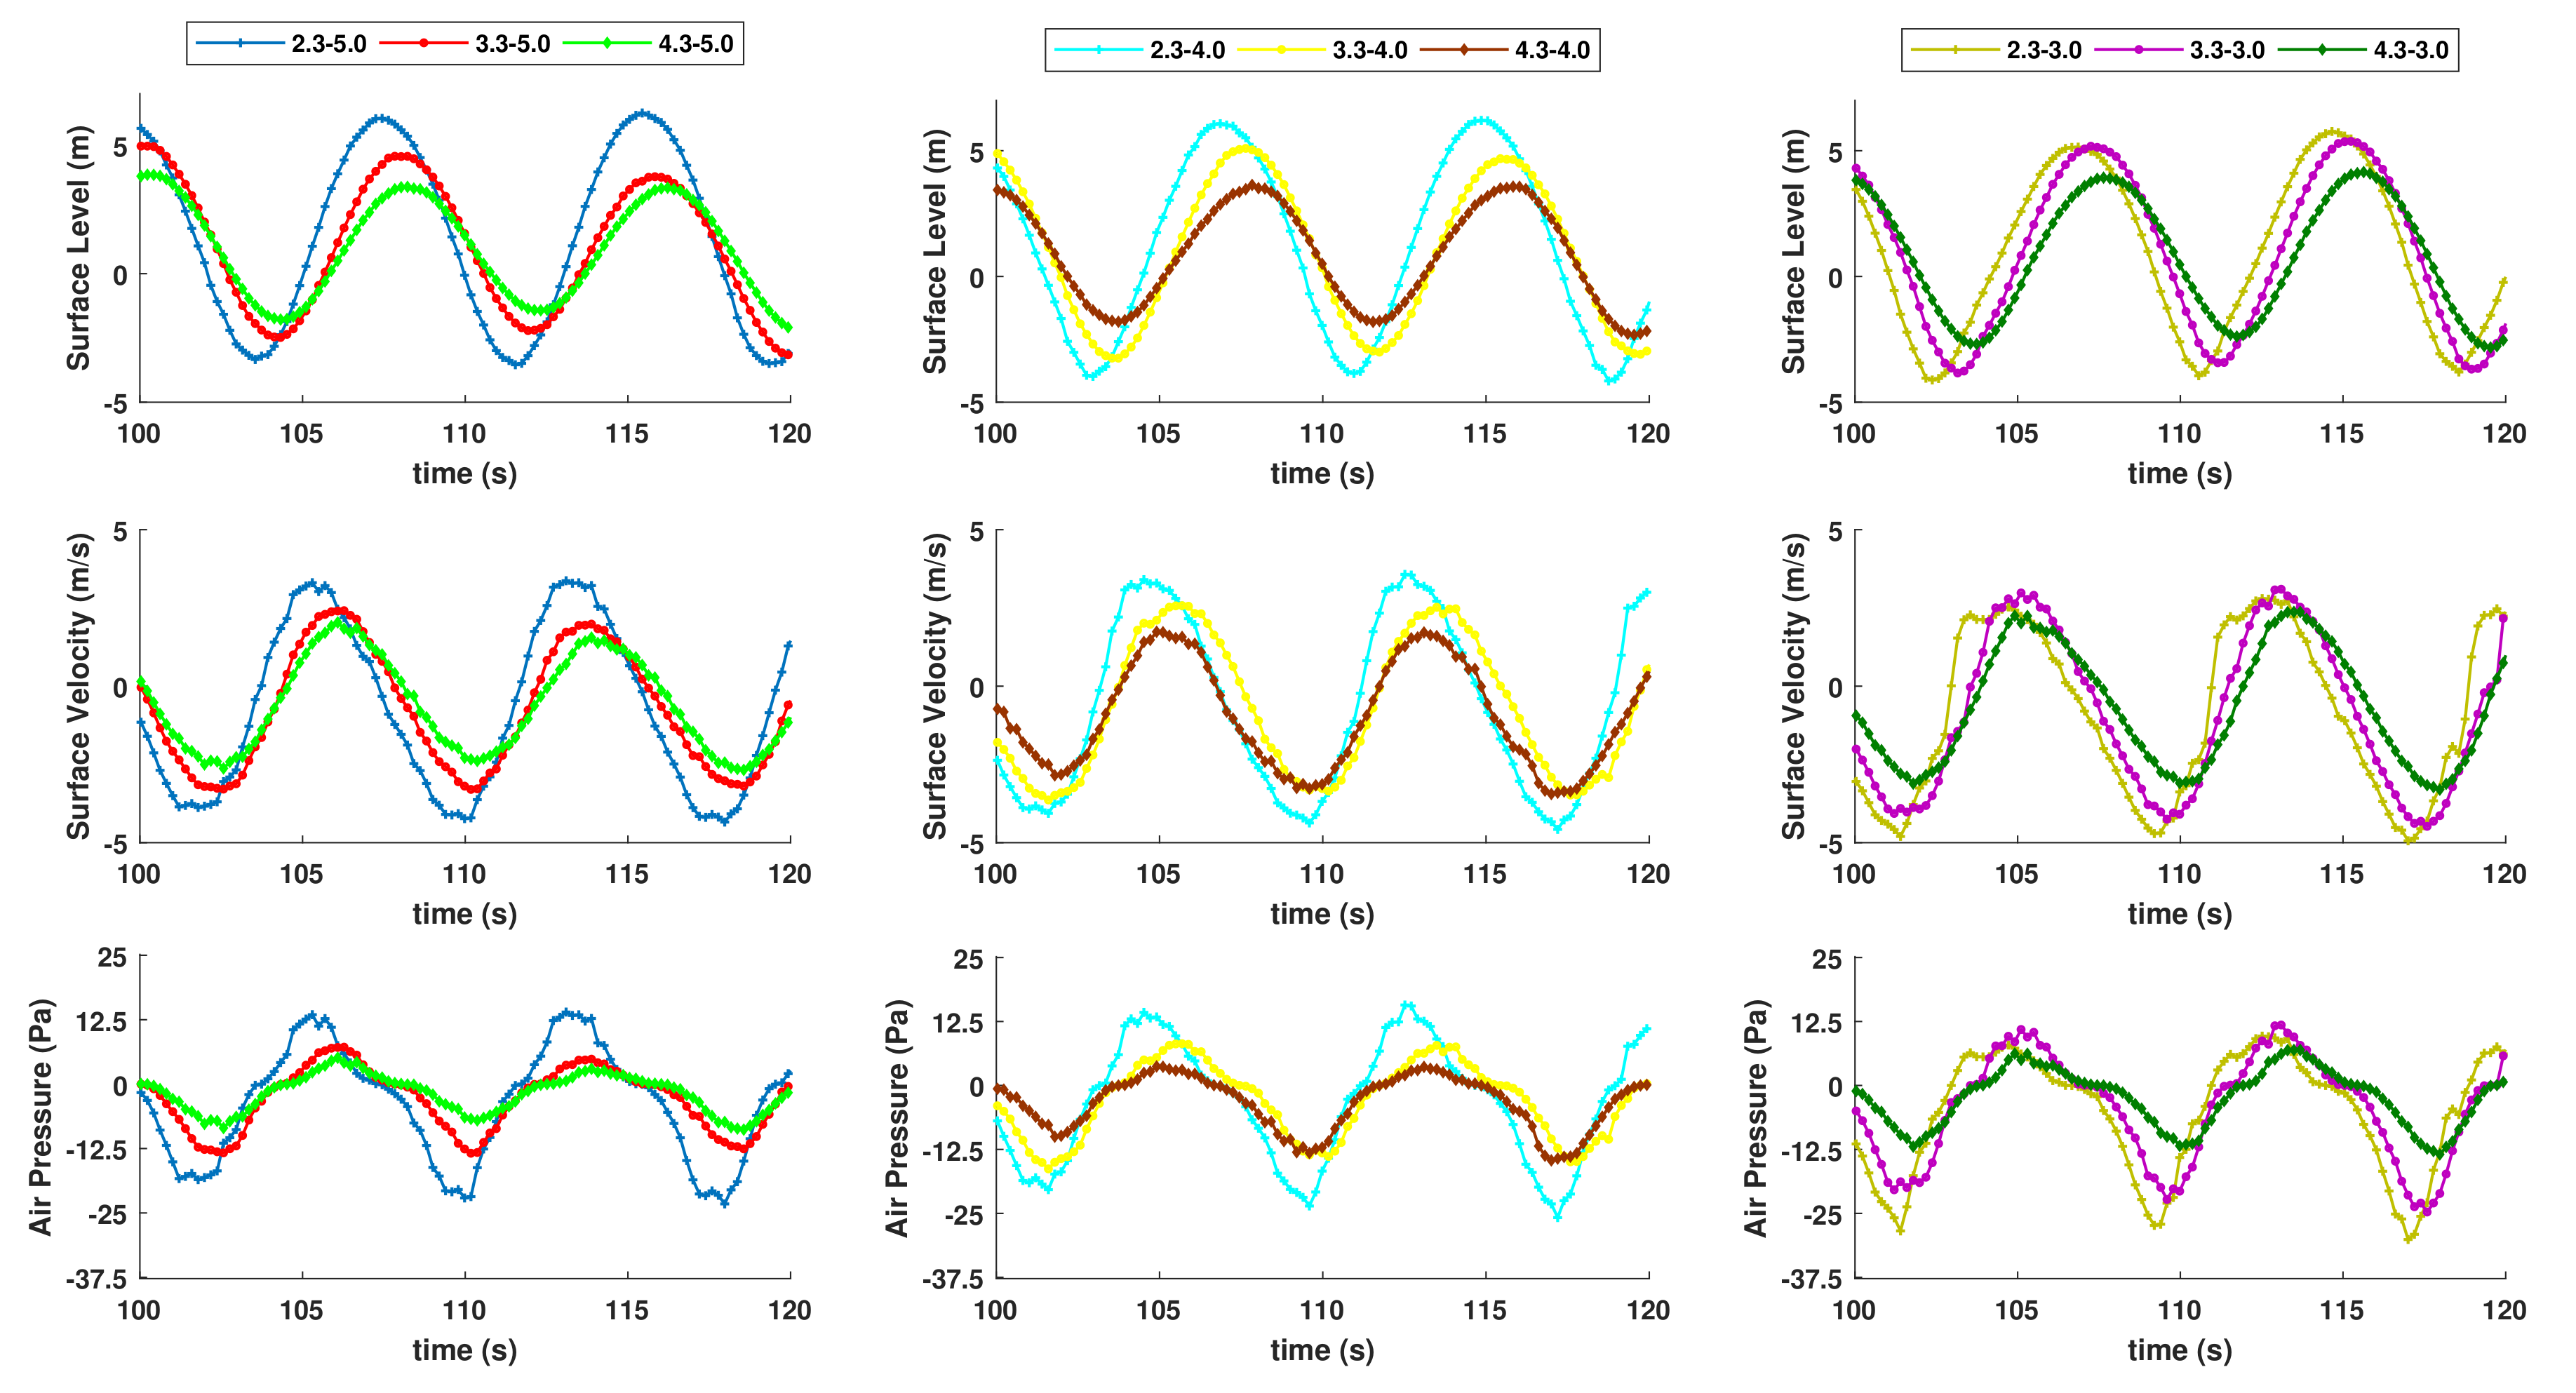
Figure 7.
Comparison between efficiency and amount of vorticity recorded within the OWC chamber for different sloping wall configurations ( s, m, and m). The numbers in red correspond to the case numbers tabulated in Table 3.
Figure 7.
Comparison between efficiency and amount of vorticity recorded within the OWC chamber for different sloping wall configurations ( s, m, and m). The numbers in red correspond to the case numbers tabulated in Table 3.
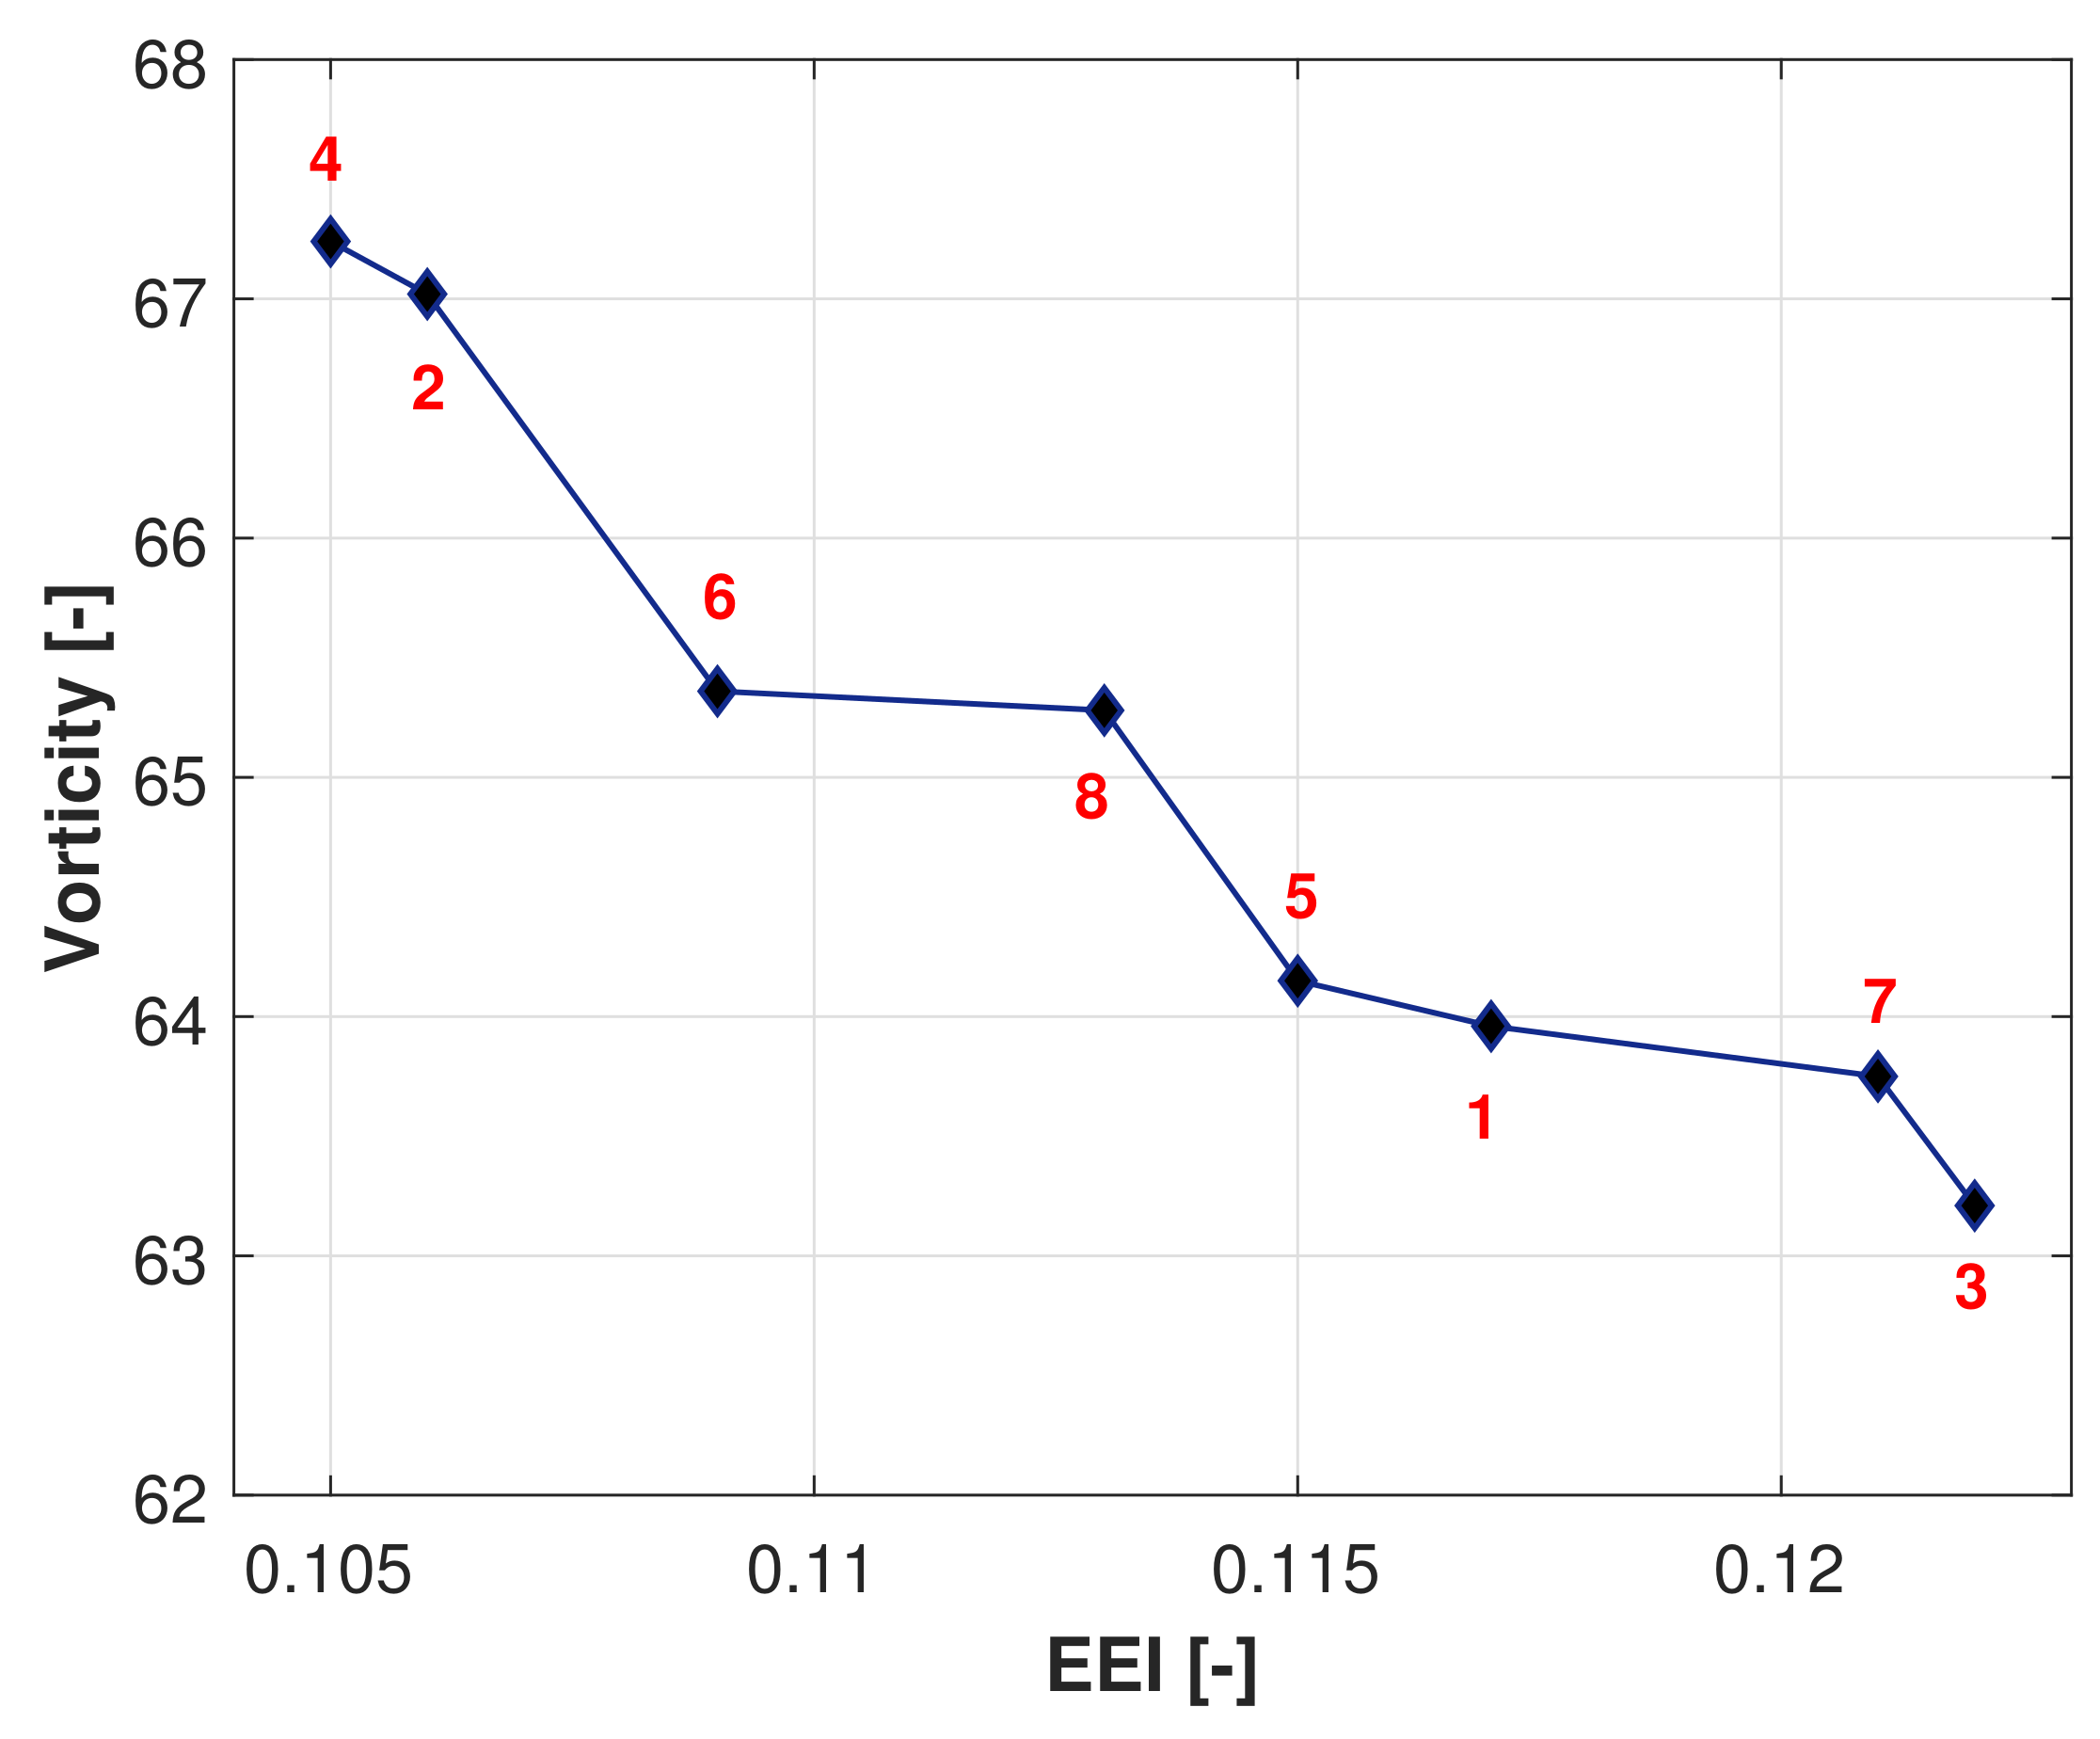
Figure 8.
Instantaneous vorticity field and velocity vector representations of test cases with maximum (case 3, left) and minimum (case 4, right) EEI values for a full period of motion.
Figure 8.
Instantaneous vorticity field and velocity vector representations of test cases with maximum (case 3, left) and minimum (case 4, right) EEI values for a full period of motion.


Figure 9.
Time series of free-surface elevation (top), velocity (center), and air pressure drop (bottom) within the OWC chamber for different chamfer configurations ( s, m, and m).
Figure 9.
Time series of free-surface elevation (top), velocity (center), and air pressure drop (bottom) within the OWC chamber for different chamfer configurations ( s, m, and m).
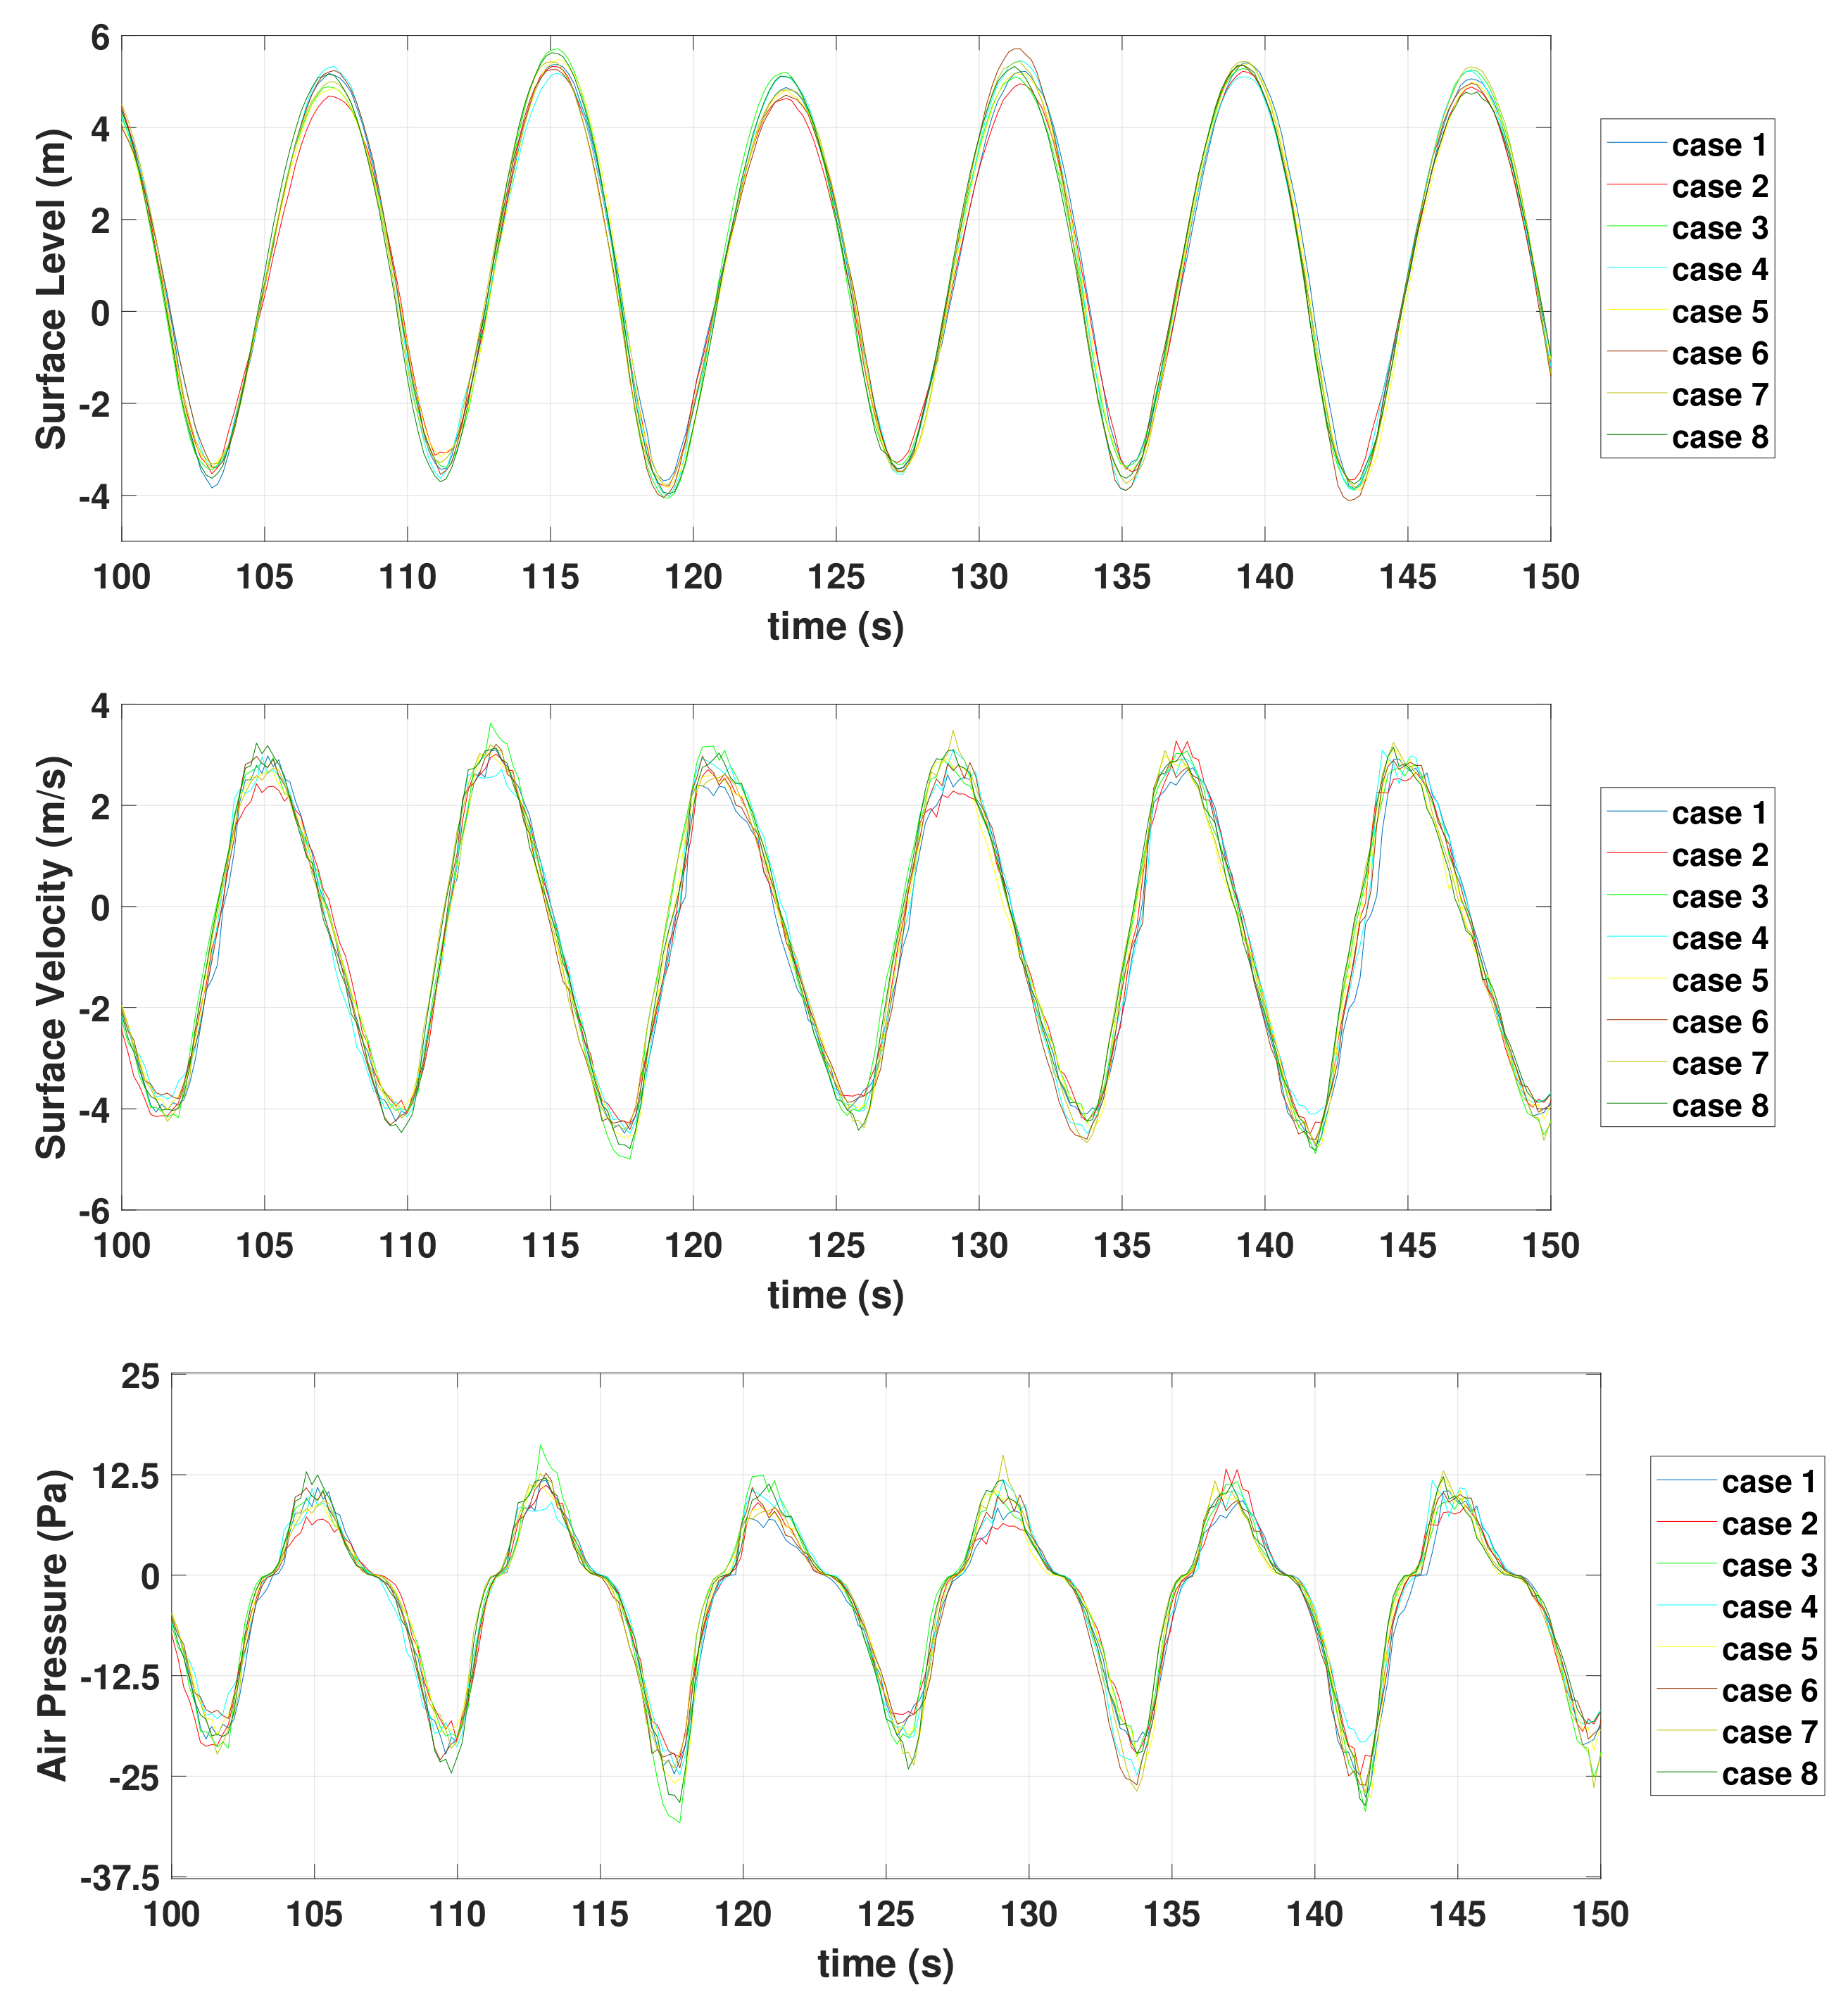
Figure 10.
Time series of free-surface elevation (top), velocity (center), and air pressure drop (bottom) inside the OWC chamber for the best performance geometry configuration (case 3) at each wave period.
Figure 10.
Time series of free-surface elevation (top), velocity (center), and air pressure drop (bottom) inside the OWC chamber for the best performance geometry configuration (case 3) at each wave period.


Table 1.
RMSE comparison between the free-surface elevation measured in the experiment and calculated by the SPH simulations.
Table 1.
RMSE comparison between the free-surface elevation measured in the experiment and calculated by the SPH simulations.
| Particle Resolutions [m] | RMSE [m] | Iteration per Second | Performance (h/s) |
|---|---|---|---|
| d/20 | 0.0134 | 5.223 | 0.274 |
| d/30 | 0.0112 | 1.579 | 1.407 |
| d/40 | 0.0086 | 0.616 | 4.797 |
| d/50 | 0.0084 | 0.252 | 14.24 |
| d/60 | 0.0070 | 0.146 | 30.35 |
Table 2.
Obtained EEI values for each OWC geometry and wave period.
| Wave Period | T = 6 s | T = 8 s | T = 10 s | |||||||
|---|---|---|---|---|---|---|---|---|---|---|
| Chamber Length | 2.3 m | 3.3 m | 4.3 m | 2.3 m | 3.3 m | 4.3 m | 2.3 m | 3.3 m | 4.3 m | |
| draft | 3.0 m | 0.094 | 0.039 | 0.012 | 0.090 | 0.117 | 0.077 | 0.011 | 0.019 | 0.029 |
| 4.0 m | 0.022 | 0.008 | 0.005 | 0.097 | 0.075 | 0.059 | 0.012 | 0.021 | 0.034 | |
| 5.0 m | 0.006 | 0.004 | 0.002 | 0.087 | 0.051 | 0.029 | 0.021 | 0.028 | 0.025 | |
Table 3.
OWC geometry variations and measured hydrodynamic efficiency for each of them (base model, s, m, and m).
Table 3.
OWC geometry variations and measured hydrodynamic efficiency for each of them (base model, s, m, and m).
| Cases | [m] | [m] | [m] | [m] | [m] | [m] | EEI | Vorticity [-] |
|---|---|---|---|---|---|---|---|---|
| 1 | 0 | 0 | 0 | 0 | 0 | 0 | 0.117 | 63.96 |
| 2 | 1 | 1 | 0 | 0 | 0 | 0 | 0.106 | 67.02 |
| 3 | 0 | 0 | 1 | 1 | 0 | 0 | 0.122 | 63.21 |
| 4 | 0 | 0 | 0 | 0 | 1 | 1 | 0.105 | 67.24 |
| 5 | 1 | 1 | 1 | 1 | 0 | 0 | 0.115 | 64.15 |
| 6 | 1 | 1 | 0 | 0 | 1 | 1 | 0.109 | 65.36 |
| 7 | 0 | 0 | 1 | 1 | 1 | 1 | 0.121 | 63.75 |
| 8 | 1 | 1 | 1 | 1 | 1 | 1 | 0.113 | 65.28 |
Table 4.
Comparison of EEI values for the base geometry and the best performance geometry configuration (case 3) at each wave period.
Table 4.
Comparison of EEI values for the base geometry and the best performance geometry configuration (case 3) at each wave period.
| Cases | T = 6 [s] | T = 8 [s] | T = 10 [s] |
|---|---|---|---|
| Base Geometry | 0.039 | 0.117 | 0.019 |
| Optimized Geometry | 0.054 | 0.122 | 0.020 |
Publisher’s Note: MDPI stays neutral with regard to jurisdictional claims in published maps and institutional affiliations. |
© 2022 by the authors. Licensee MDPI, Basel, Switzerland. This article is an open access article distributed under the terms and conditions of the Creative Commons Attribution (CC BY) license (https://creativecommons.org/licenses/by/4.0/).
Share and Cite
MDPI and ACS Style
Ramezanzadeh, S.; Ozbulut, M.; Yildiz, M. A Numerical Investigation of the Energy Efficiency Enhancement of Oscillating Water Column Wave Energy Converter Systems. Energies 2022, 15, 8276. https://doi.org/10.3390/en15218276
AMA Style
Ramezanzadeh S, Ozbulut M, Yildiz M. A Numerical Investigation of the Energy Efficiency Enhancement of Oscillating Water Column Wave Energy Converter Systems. Energies. 2022; 15(21):8276. https://doi.org/10.3390/en15218276
Chicago/Turabian StyleRamezanzadeh, Shayan, Murat Ozbulut, and Mehmet Yildiz. 2022. "A Numerical Investigation of the Energy Efficiency Enhancement of Oscillating Water Column Wave Energy Converter Systems" Energies 15, no. 21: 8276. https://doi.org/10.3390/en15218276
Note that from the first issue of 2016, this journal uses article numbers instead of page numbers. See further details here.