Article

Insights into the Thermal Performance of Underground High Voltage Electricity Transmission Lines through Thermo-Hydraulic Modelling

by
Kui Liu
1,2,*,
Renato Zagorščak
1,3,
Richard J. Sandford
4,
Oliver N. Cwikowski
5,
Alexander Yanushkevich
5 and
Hywel R. Thomas
1
1
Geoenvironmental Research Centre, Cardiff School of Engineering, Cardiff University, The Queen’s Buildings, The Parade, Cardiff CF24 3AA, UK
2
Institut de Radioprotection et de Sûreté Nucléaire, 92260 Fontenay-aux-Roses, France
3
Quintessa Ltd., First Floor, West Wing, Videcom House, Newtown Road, Henley-on-Thames RG9 1HG, UK
4
School of Earth and Environmental Sciences, Cardiff University, Main Building, Park Place, Cardiff CF10 3AT, UK
5
National Grid Electricity Transmission plc, Warwick Technology Park, Gallows Hill, Warwick CV34 6DA, UK
*
Author to whom correspondence should be addressed.
Energies 2022, 15(23), 8897; https://doi.org/10.3390/en15238897
Submission received: 21 October 2022 / Revised: 20 November 2022 / Accepted: 21 November 2022 / Published: 24 November 2022
(This article belongs to the Special Issue New Challenges in the Utilization of Underground Energy and Space)

Abstract

:
In this paper, a flexible numerical framework to provide thermal performance assessment for the underground buried cables, considering different geological and meteorological conditions, has been presented. Underground cables tend to retain the heat produced in the conductor, so complex coupled thermo-hydraulic response of the porous medium surrounding the cables needs to be assessed to prevent cable overheating and the associated reduction in cable capacity for carrying current. Applying a coupled thermo-hydraulic model within the developed numerical framework to conduct a health assessment on a subset of National Grid Electricity Transmission’s underground cables, this study provides novel insights into the thermal behaviour of buried circuits. The results indicate that backfill and surrounding native soil have the dominant effect on the thermal behaviour of cables, while the amount of precipitation and ambient temperature were found to have less impact on cable’s thermal behaviour. The findings strongly infer that the nature of the overloading which is undertaken in practice would have no ongoing negative impact, suggesting that more frequent or longer duration overloading regimes could be tolerated. Overall, this study demonstrates how the developed numerical framework could be harnessed to allow safe rating adjustments of buried transmission circuits.

1. Introduction

In the context of climate change, the future decarbonisation and decentralisation of energy production are set to impose unprecedented demands upon the electricity transmission network. The increasing reliance on wind and solar-generated power and uptake in the use of electric vehicles, battery storage and heat pumps will drive power flows that are considerably different from those today.
The World Energy Outlook 2020 [1] has targeted the net-zero emissions by 2050 (NZE2050), aiming for a reduction of CO2 emissions from the power sector by around 60% between 2019 and 2030. This requires a threefold investment in power from $760 billion in 2019 to $2200 billion in 2030. Typically, more than half of the vehicles to be sold in 2030 will be electric, an increase from 2.5% of vehicles in 2019; and a quarter of the industrial-use heat will be based on electricity and low-carbon fuels by 2030 in the NZE2050. Therefore, it can be foreseen that electrification will play a central part in emission reduction.
To achieve the goal of net-zero emissions, the National Grid Electricity Transmission (NGET), who owns and operates the high voltage (HV) buried circuits in England and Wales, makes significant investment to transform the grid. This requires a good understanding of the health status of the current circuit asset and an appropriate planning for new cables, for example the proportion of cables that are expected to reach their end-of-life concurrently. Therefore, when designing a cable system, effective heat dissipation to avoid overheating and the associated potential reduction in its capacity for carrying current (i.e., cable rating) needs to be considered to help optimise the electrical performance of the cable system [2,3].
Two factors that exert a dominating influence on the degradation of a cable are temperature and electrical stress, where temperature is the most significant unknown. To prioritise the circuits that are in need of upgrading or replacement, it is important to consider the history of previous loading, accounting appropriately for the relevant geotechnical and meteorological conditions. The buried cables are usually mounted within the backfill material with a high thermal conductivity to dissipate heat, surrounded by the native soil. The potential moisture migration in the backfill material and native soil due to the heat imposed by the cable loadings would affect the heat transfer conditions [4,5,6]. Additionally, the meteorological factors at the ground surface, for example the precipitation and surface temperature, may also influence the migration process. Therefore, it is important to understand how these properties and factors affect the heat transfer through backfill materials and native soils, facilitating the prediction of thermal performance of the HV cables buried underground [7].
In previous research, the thermal behaviour of land cables have been studied using analytical approaches, experimental investigations, and various numerical simulations. The early study of Anders and Radhakrishna [8] adopted the Philip and DeVries model for the analysis of coupled thermo-hydraulic flow adjacent to buried power cables; the validation study showed comparable results between predicted and measured results. Hwang and Jiang [9] adopted a magnetothermal approach to investigate the thermal behaviour of underground cables buried in the banks, and showed that the outer cable of the parallel mounted cables had a lower temperature profile than the middle one as a result of the mutual heating effect. Gouda et al. [10] carried out an experimental study on the influence of dry-zone formation on the ampacity of underground power cables, which decreased the capacity of the cables depending on the backfill soil types. de Lieto Vollaro et al. [11] conducted a numerical analysis via finite-difference method to investigate the thermal behaviour of a buried cable under various scenarios with different layered-soil thermal properties and different trench dimensions; a semi-empirical correlating equation was obtained from the multiple regression analysis and proved to be a useful tool for thermal analysis of cables. A theoretical analysis was conducted by Papagiannopoulos et al. [12] to assess the thermal behaviour of a buried cable with respect to various buried depths with the same temperature result obtained. Chatziathanasiou et al. [13] conducted a small-scale experiment to assess thermal behaviour of buried power cables, with the results of the dynamic thermal properties obtained with the support of an analytical solution. Experiments were also designed by de Lieto Vollaro et al. [14] to investigate the heat transfer of a buried single cable, embedded with different geometrical configurations and soil thermal properties, and the results showed good agreement with numerical validation. The numerical analysis from Kroener et al. [15] showed the necessity to consider the coupled liquid water, vapour and heat flow into the assessment of heat dissipation from the underground cables, and indicated that the comparison between different weather conditions from various sites and years would be helpful. A harmonic analysis of the thermal behaviour of buried cables was conducted by Wiecek et al. [16], who indicated that both the input power and the calculated temperature show a periodic behaviour for the day-night periodicity. Ocłoń et al. [17] conducted thermal analysis on the underground buried circuits in Poland using a finite element method, with the results showing good agreement with the other models on which the multi-layered soil was assumed as homogeneous that possesses constant heat conductivity. Hughes et al. [18] used finite element method to assess the thermal performance of the high-voltage submarine cables and the influence of sediment condition; the results indicated the pivotal role of the permeability in the thermal behaviours of the cables and also the importance of heat convection in such scenarios. Still, despite extensive research has been conducted over the past couple of years, a flexible framework which allows an easy and quick derivation of cable’s health status is required.
This study aims to develop a flexible numerical framework to provide thermal performance assessment for the NGET’s underground buried cables from various locations, considering different geological and meteorological conditions. The COde for Modelling PArtially Saturated Soils (COMPASS) code has been employed for this purpose [19,20,21]. The database of circuit loading histories is used to determine temperature time-histories, with the emphasis on: (i) establishing the material datasets that exert a controlling influence on underground asset condition; (ii) analysing the various external factors that could affect the underground asset condition; (iii) determining the bounds on the expected range of temperature time-histories at the cable surface, based on appropriate assumptions; and (iv) assessing the health status of the circuits under normal and overloading conditions.

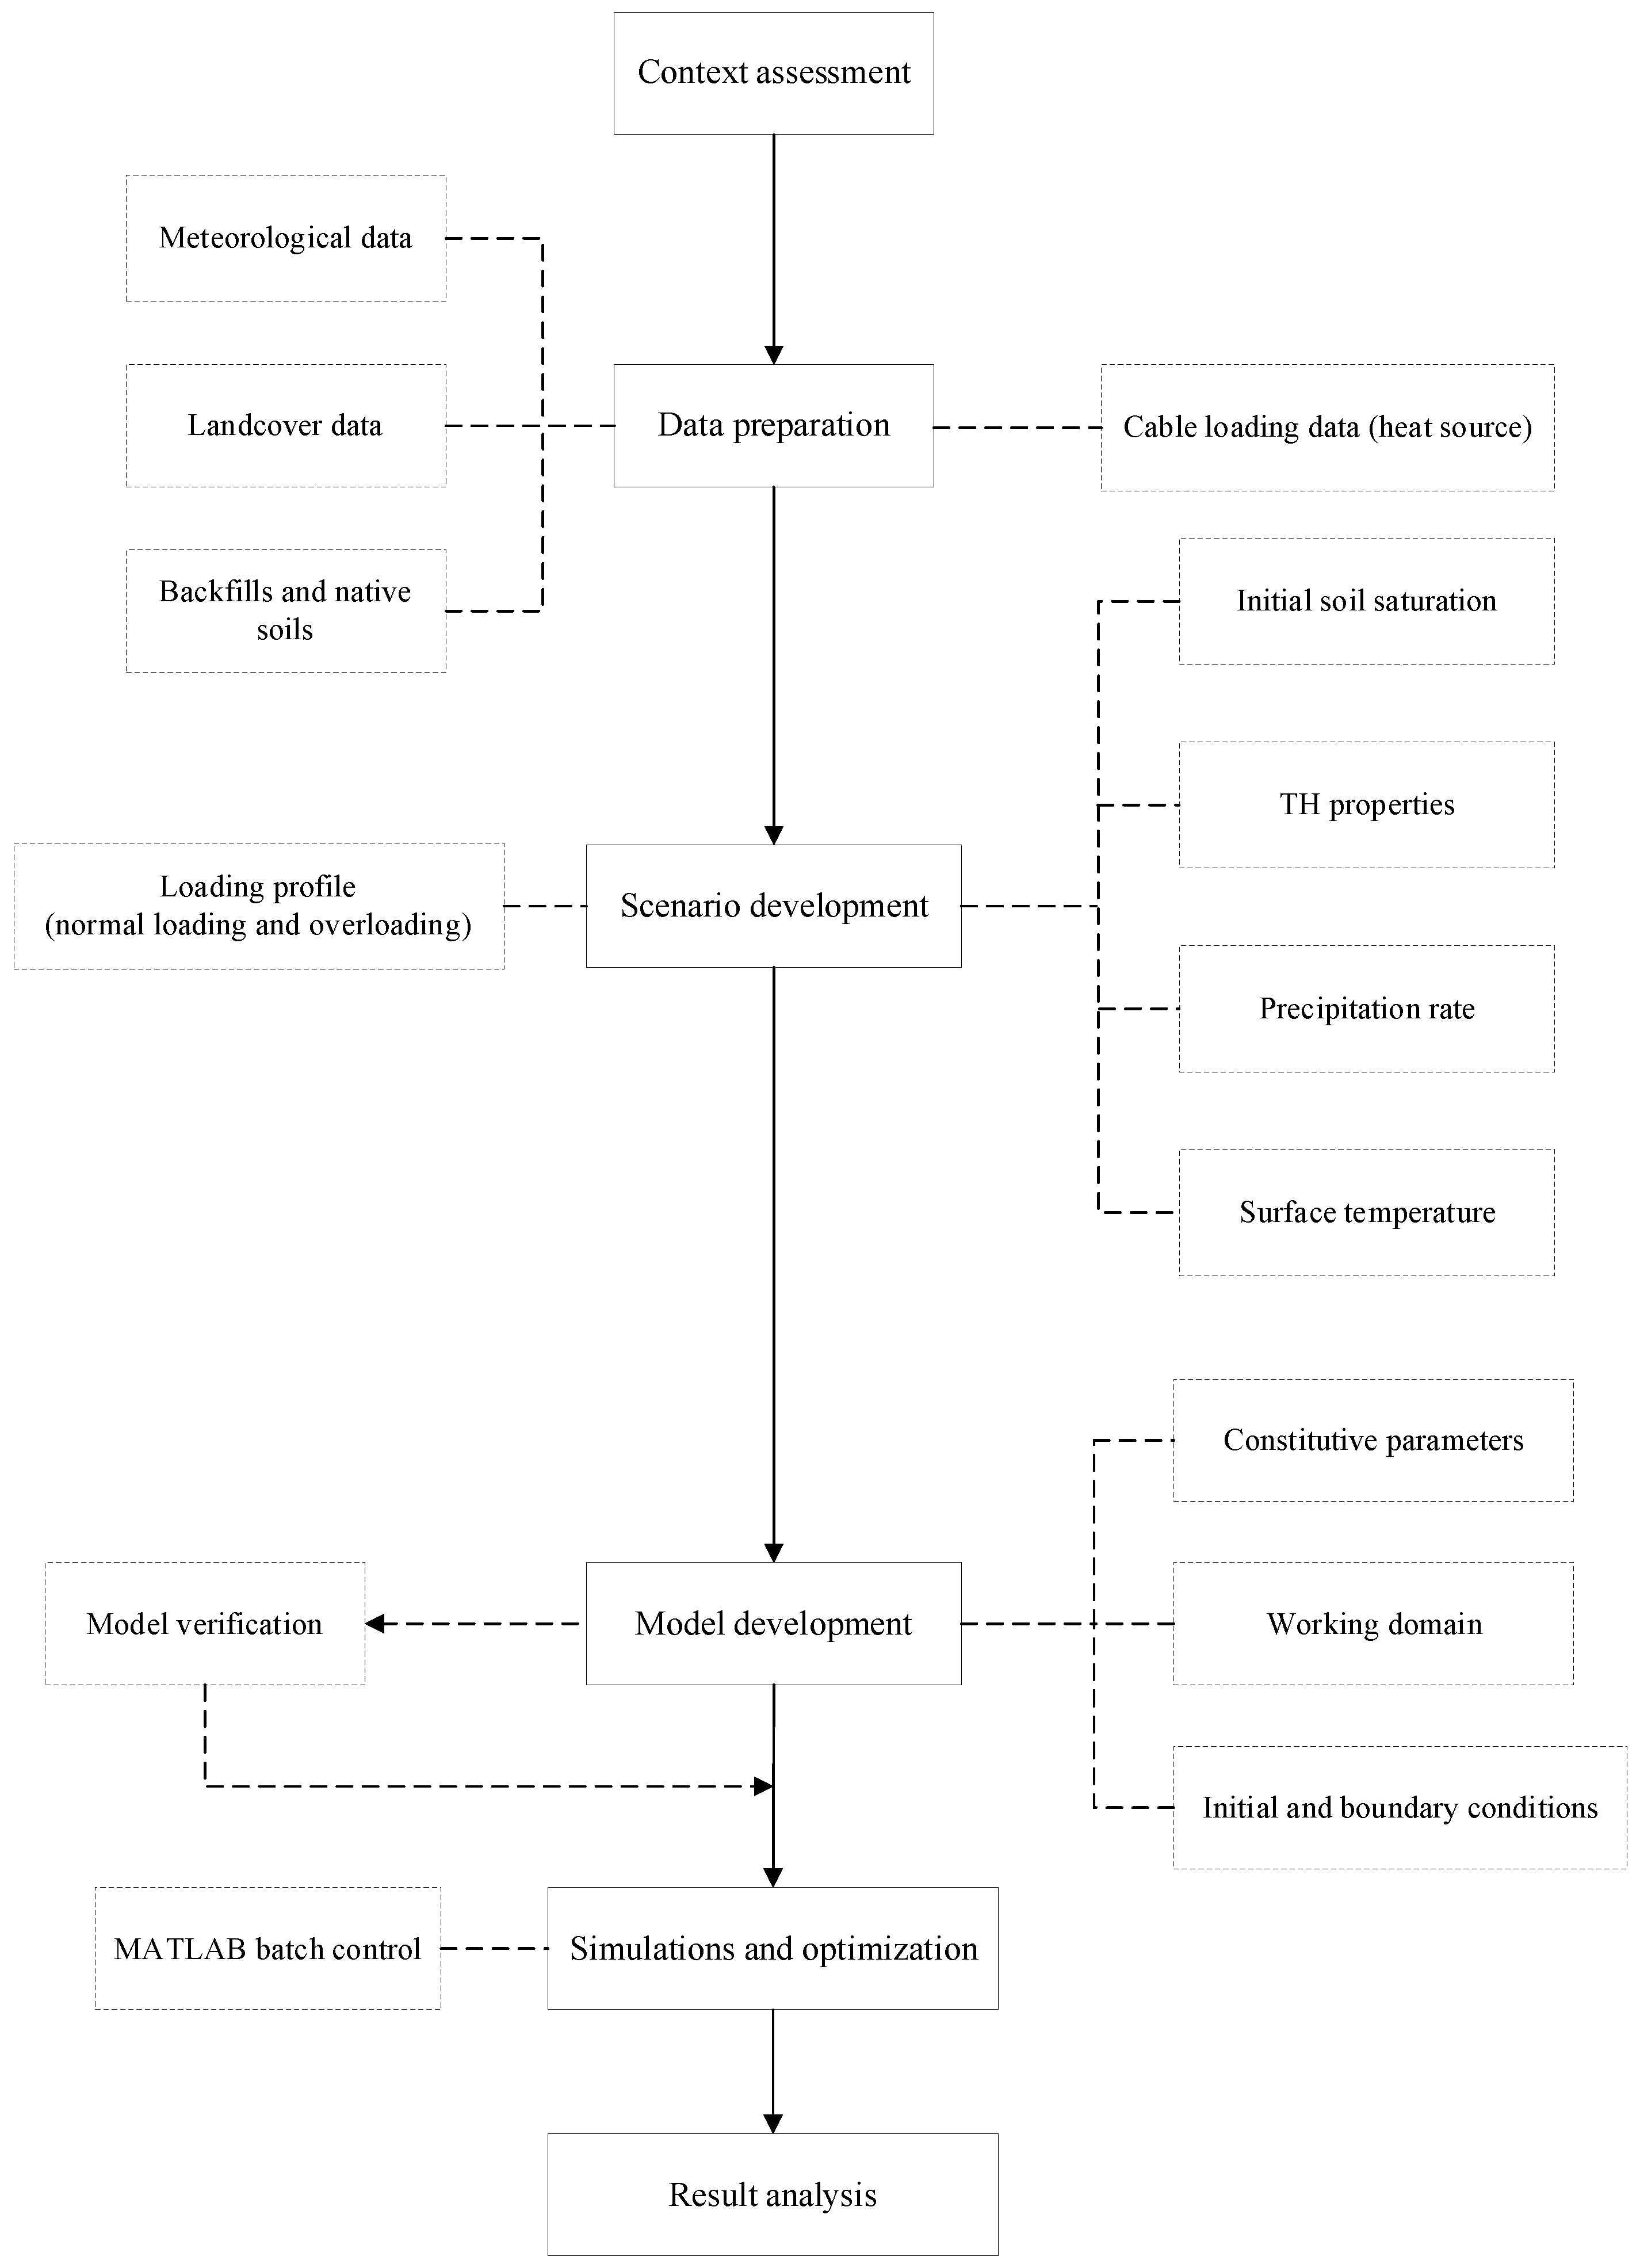
2. Methodology and Theoretical Formulations

The methodology developed and adopted in this work is shown in Figure 1. The first step involved defining the assessment context, which included establishing the variables that need to be investigated, the thresholds and the performance metrics. This was followed by data collation for the selected cables of interest and scenario development. The latter involved consideration of a range of variables, such as soil TH properties, saturation state, meteorological conditions, surface cover type, and loading profiles. Based on the scenarios, a numerical TH model was developed within the existing framework of the COMPASS, which has been also verified against an analytical solution. The model was then run using a bespoke algorithm created in MATLAB, which enabled running a batch of scenarios through automated input file creation and simulation.
The COMPASS code is a coupled thermo-hydraulic-chemical-mechanical (THCM) model, which has been developed in an incremental manner by Thomas and co-workers [22,23,24,25,26] at the Geoenvironmental Research Centre (GRC), Cardiff University. Due to the highly coupled nature of the COMPASS framework, an iterative approach is used for simultaneous solving for governing equations and the non-linear problems to achieve a converged solution. For this purpose, the finite element method (FEM) via the Galerkin weighted residual method is used for spatial discretisation. The finite difference method (FDM) via an implicit mid-interval backward difference algorithm is used for temporal discretisation. For mesh generation, definition of material parameters as well as specifying initial and boundary conditions, GiD software packed is used.

2.1. Heat Transfer

Heat transfer is the energy transport between two bodies of materials under a temperature difference. Conduction and convection are the primary mechanisms of heat transfer, and can be expressed through Equation (1) [19,27]:
Ω t =   Q
where Ω is the heat content, Q is the heat flux, and t is the time.
The heat content for a partially saturated soil is the summation of the heat storage capacity multiplied with the temperature difference and the contribution of enthalpy characterised by the latent heat of vaporisation [27]. This gives Equation (2):
Ω = H c ( T T r ) + L n S a ρ v
where Hc is the heat capacity of soil, T is the actual temperature, Tr is the reference temperature, L is the latent heat of vaporisation, n is the porosity, Sa is the degree of saturation of pore air (fraction of void space occupied by air), ρv is the density of water vapour. The heat capacity can be written as Equation (3) [27]:
H c = ( 1 n ) ρ s C p s + n ( ρ l S l C p l + ρ v S a C p v + ρ d a S a C p d a )
where Sl is the degree of saturation of liquid saturation (fraction of void space occupied by liquid), Cps, Cpl, Cpv and Cpda are the specific heat capacities of the solid, liquid, vapour and dry air, respectively and ρs is the density of the solid.
The heat flux (Q) can be defined by considering three components of heat transportation, that is, thermal conduction in accordance with Fourier’s law, latent heat flow associated with vapour movement, and heat convection in the light of the liquid-phase flows, the vapour phase with a vapour pressure gradient, the vapour phase with bulk air flow and the air phase, Equation (4) [20]:
Q = λ T T + L ( ν v ρ l + ν a ρ v ) + ( ρ l ν l C p l + ρ l ν v C p v + ρ v ν a C p v + ρ d a ν a C p d a ) ( T T r )
where λT is the coefficient of thermal conductivity, Vv, Va, and Vl are the vapour, air and liquid velocities, respectively.

2.2. Moisture and Air Transfers

Moisture transfer through an unsaturated soil can be considered as a two-phase process, which includes the combined flow of liquid and vapour. Based on the principle of the local thermodynamic equilibrium, it can be assumed that at a given point, the volumetric liquid water and water vapour are in equilibrium. Accordingly, the general expression for the moisture flow can be described as Equation (5) [19]:
ρ l ( θ l ) t + ( ρ v θ a ) t = ρ l ν l ρ l ν v ρ v ν a
where θl and θa are the volumetric liquid and air (including dry air and vapour) contents, respectively.
Liquid water flow occurs due to pressure and elevation heads and Darcy’s law is used to present this potential for unsaturated soils, Equation (6) [19]:
v l = k l μ l [ u l γ l + z ] = K l [ u l γ l + z ]
where kl is the intrinsic permeability, µl is the absolute viscosity, ul is the pore water pressure, γl is the unit weight of the liquid, z is the elevation head and Kl is the unsaturated hydraulic conductivity affected by a number of factors, namely, the fabric of the soil and degree of saturation.
Vapour transfer occurs, through diffusive and vapour flows. The bulk air is usually considered as a binary mixture of dry air and water vapour, addressed using a generalised form of Darcy’s law, Equation (7) [19]:
ν a = k a μ a u a = K a u a
where ka is the effective permeability of pore air, µa is the absolute viscosity of pore air, ua is the pore air pressure and Ka is the unsaturated conductivity of pore air which is a function of the pore air properties and volume/mass of a soil.
The velocity of vapours (vv) is described by Equation (8), referring to [28]:
v v = D a t m s υ v τ v θ a ρ l ρ v
where Datms is the diffusivity of vapour through air, υv is the mass flow factor, τv is the tortuosity coefficient and ∇ρv is the spatial vapour density gradient.

2.3. Heat and Moisture Flow Coupling

The presentation of the fully coupled heat and moisture formulation, while not complex, is lengthy. Therefore, for brevity, attention is restricted to an explanation of the constitutive models that are used in the coupled analysis.

2.3.1. Thermal Conductivity

The coefficient of thermal conductivity (λ) for an unsaturated soil can be expressed through the volume fractions of the soil constituents (i.e., solid, liquid and air), and their respective thermal conductivities [25], as Equation (9):
λ = λ s x s λ w x w λ a x a
where x s , x w and x a are expressed as Equations (10)–(12).
x s = 1 n
x w = n S l
x a = n ( 1 S l )

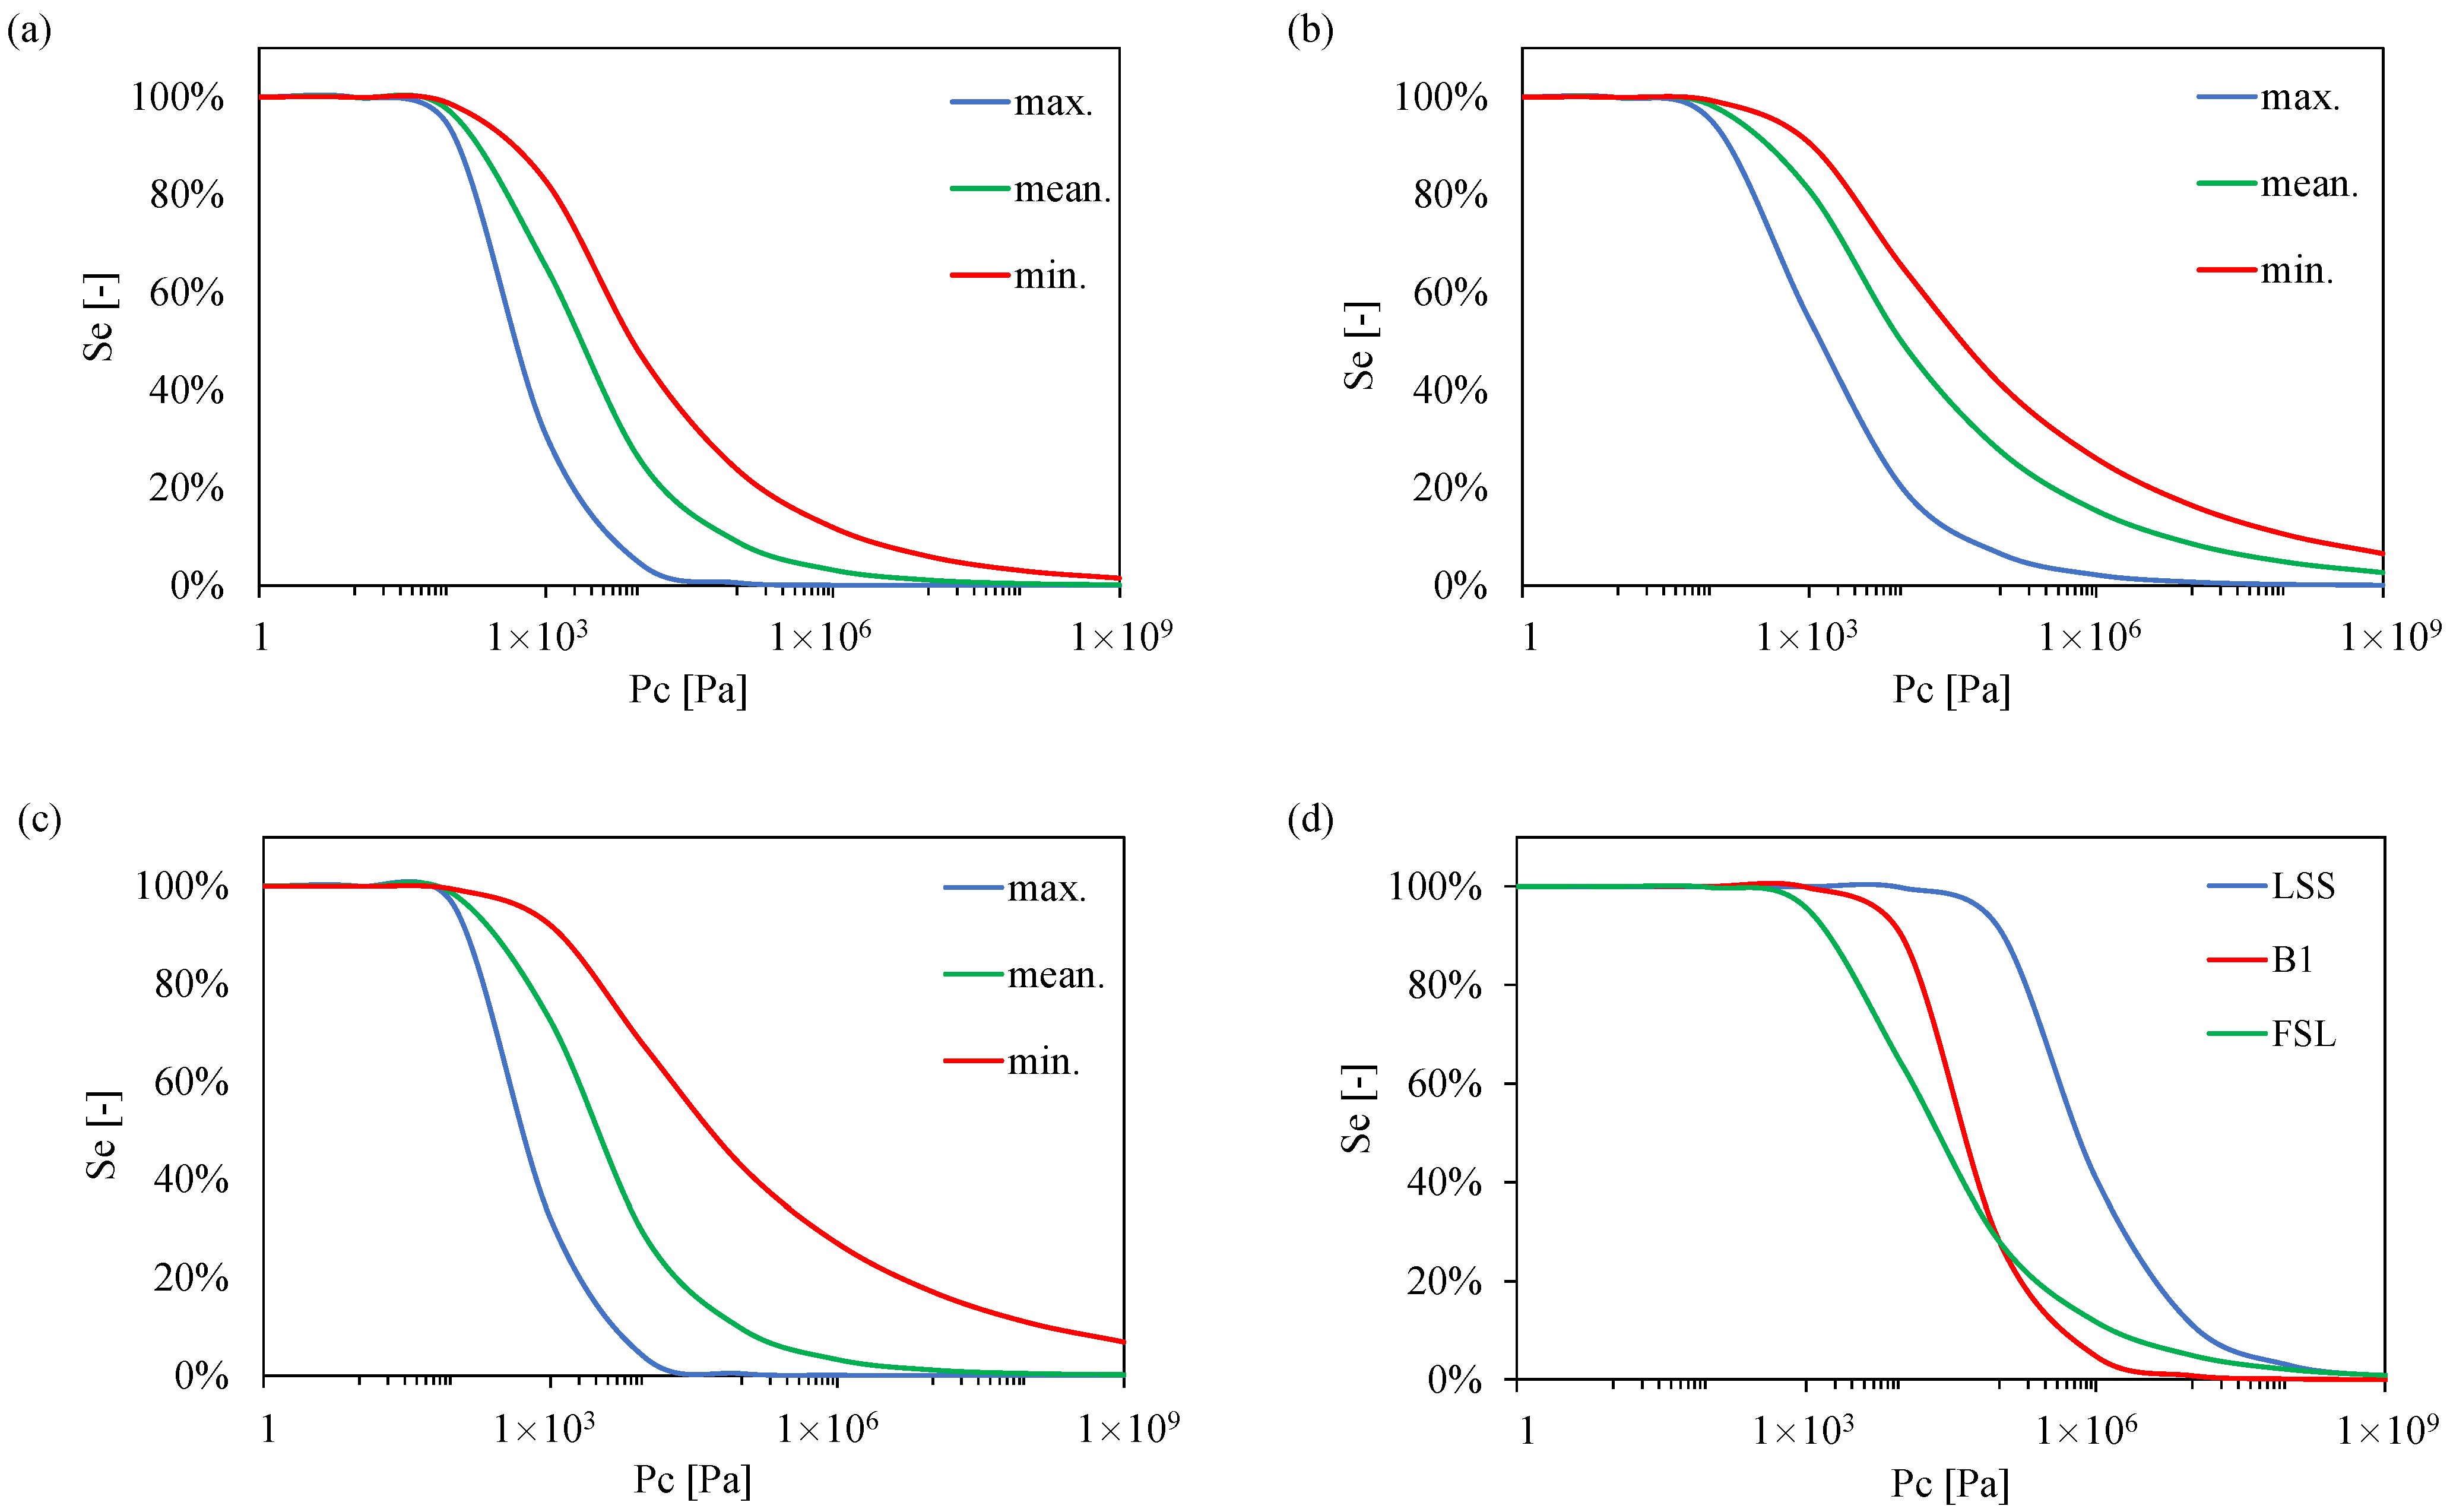
2.3.2. Water Retention Characteristics

The water retention law is critical in all unsaturated soil mechanics problems, especially those involving drying. This law describes the relationship between the suction (the negative of water potential, which is equal to the excess of pore air pressure, ua, over pore water pressure, ul) and the water content, θl. A soil’s ability to retain water depends strongly on the particle size; water is held more tightly in a fine-grained soil such as a clay, and is less strongly bound in a coarse grained material. For instance, a widely used relation [29] can be used to describe such phenomenon, as Equation (13):
θ = θ r e s + θ s a t θ r e s ( 1 + ( α P c ) β ) 1 1 / β
where θsat is the saturated (or max.) water content, which is commonly taken to be equal to the porosity, θres is the residual (or min.) water content. Pc is capillary pressure (Pc = uaul). The remaining constitutive parameters are the fitting terms, α and β.

2.3.3. Unsaturated Phase Conductivities

The unsaturated conductivity of soil is influenced predominantly by the fabric of the soil and degree of saturation. To account for that, the relative conductivity ( K i , r ) of either phase (liquid or air) can be expressed as Equation (14):
K i , r = K i , r ( S i )
where subscript i is the phase identifier.
Hence, the relative conductivity of liquid ( K l , r ) can be expressed by the widely used Van Genuchten [29] model, as Equation (15):
K l , r = S e 0.5 [ 1 ( 1 S e 1 / β ) β ] 2 K l , s a t
where K l , s a t is the hydraulic conductivity of the liquid phase for the case of that pores are fully saturated with liquid.
The relative conductivity of air ( K a , r ) can be either taken to be a constant (where air changes in the degree of air saturation are negligible) or described by an extended model (Equation (16)) such as [30]:
K a , r = ( 1 S e ) 0.5 ( 1 S e 1 / β ) 2 β K a , s a t
where K a , s a t is the hydraulic conductivity of air phase for the case of that pores are fully saturated with air.
Here, the effective saturation (Se) is introduced as Equation (17):
S e = θ θ r e s θ s a t θ r e s

3. Data Preparation

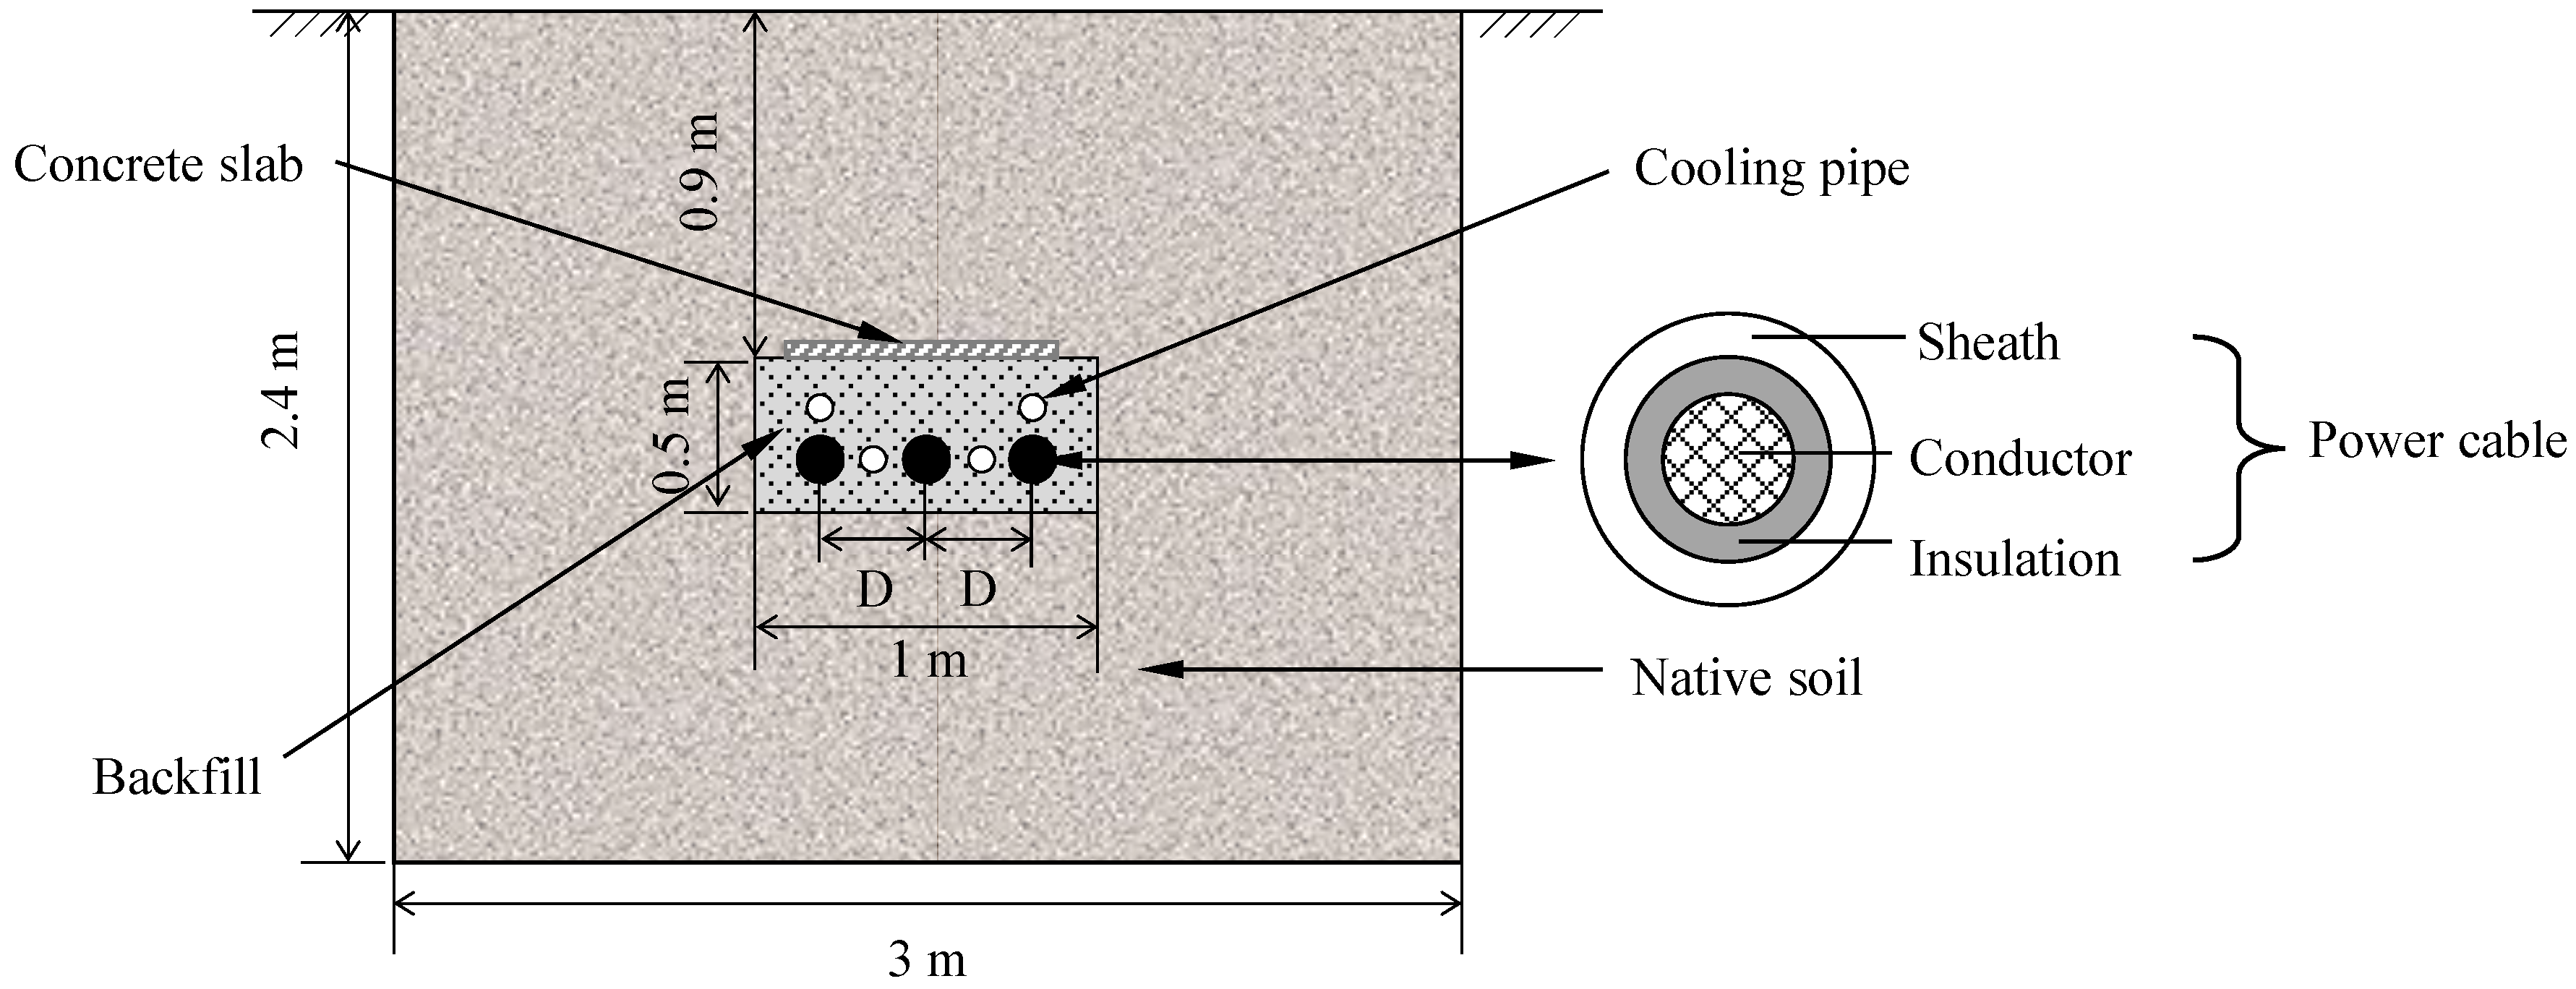
3.1. Cable and Location Information

The NGET’s buried cables (Table 1) from three different locations were assessed, each consisting of three parallel phases as shown in Figure 2. The trench cross-section domain also included two sets of water-cooling pipes (although not in use), the reinforced concrete slab, and the backfill.

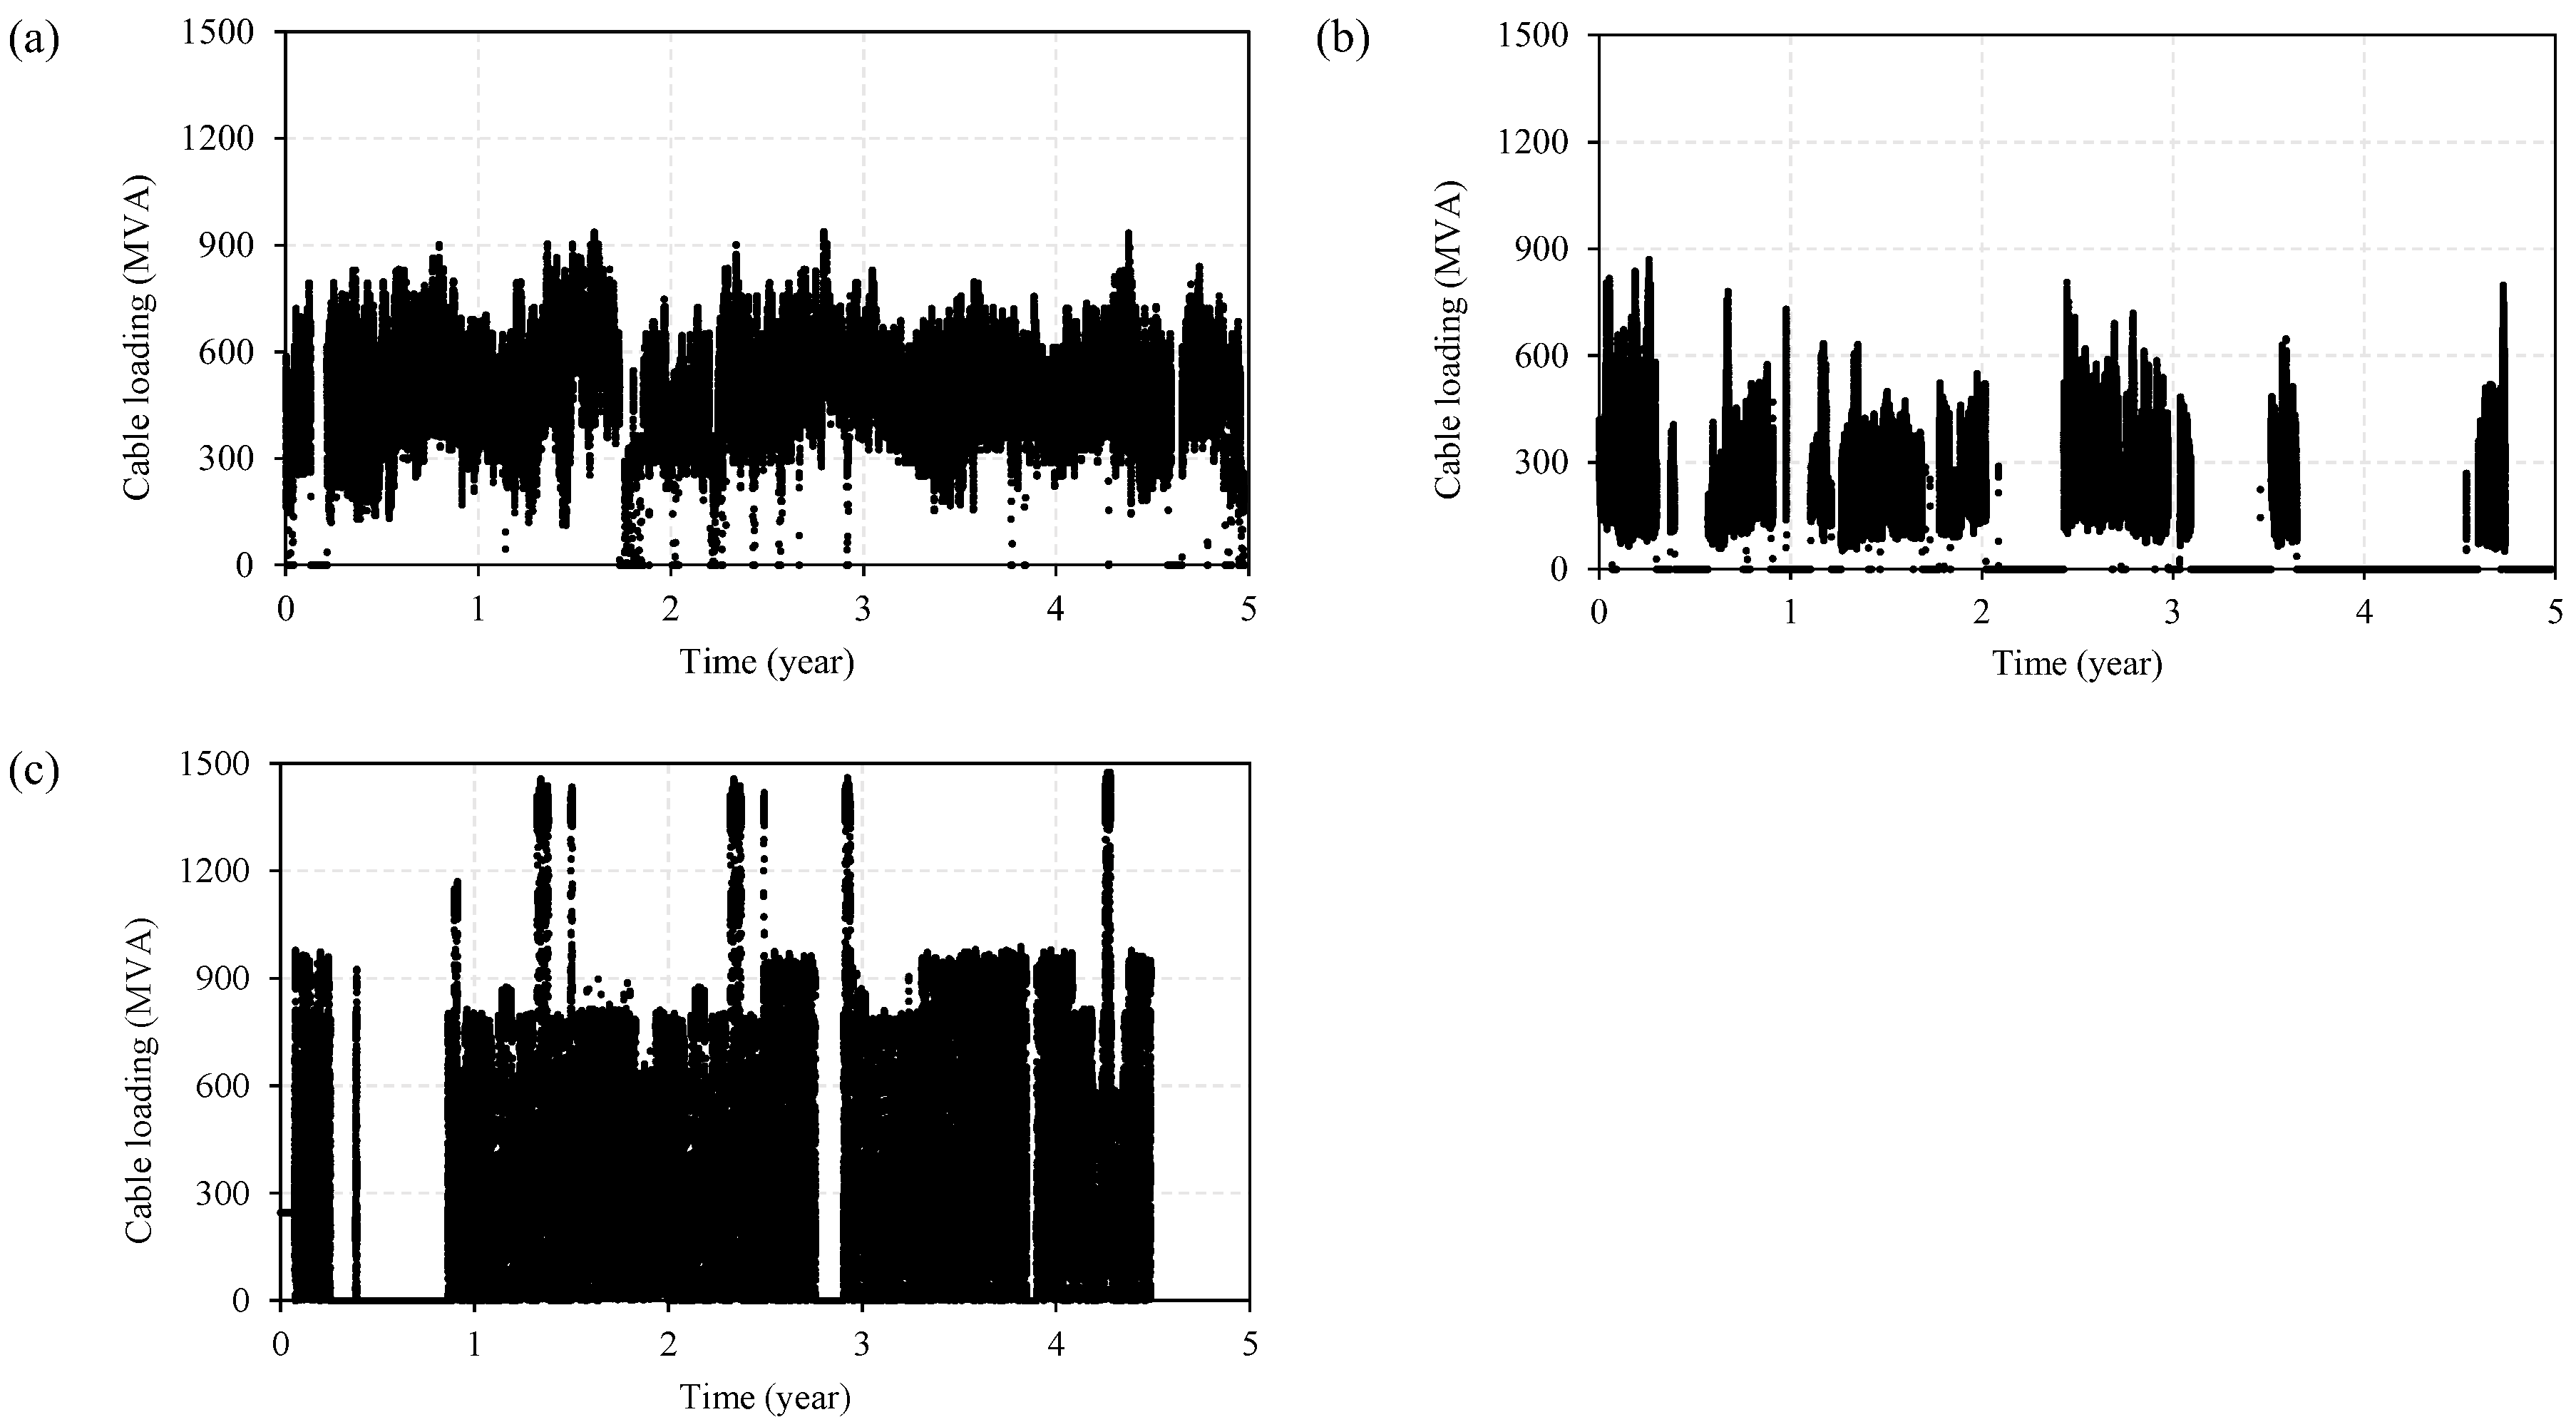
3.2. Loading Data and Heat Flux

Loading data are presented graphically in Figure 3. The BRU loading profile covered 5-year timescale from 27 June 2012 to 18 June 2017; LT loading profile covered 5-year timescale from 27 June 2012 to 18 June 2017; and DP loading profile covered 5-year timescale from 6 January 2012 to 30 May 2014 and 1 January 2015 to 29 December 2016. As there was a 6-month gap (1 June 2014–31 December 2014) in the original loading data for DP cables, the data for the 1~1.5-year period (1 June 2013–31 December 2013) forming the first portion of the loading data has been used to fill the gap between the remaining data portions in order to obtain a continuous dataset covering the 4.5-year loading period. The provided loading data in terms of the power (MVA) corresponding to the cables was converted into a heat flux (W/m2) for the thermal analysis. This followed the protocol as demonstrated in International Electrotechnical Commission [32].
Following the approach in IEC 60287 [33], the parameter values used in the calculation of heat losses are presented in Table 2. The distance (D) between either of the three cables was 0.3 m for BRU location, 0.45 m for LT location, and 0.32 m for DP location, respectively, which was considered when converting load into heat flux (Figure 4).
To also consider the effect of overloading on the cables of interest, the time-history loading (in MVA) was augmented for a subset of simulations. For time spans of 24 h duration, the loading was tripled throughout the third year, with each 24 h period of overloading followed by a subsequent 24 h period over which the loading was at the normal magnitude. Such overloading simulations were carried out to assess the possibility of reaching the emergency loading scenario under certain extreme condition, that is, 90 °C which was the current maximum acceptable operating temperature of a fluid-filled conductor [38].

3.3. Ground Condition Data
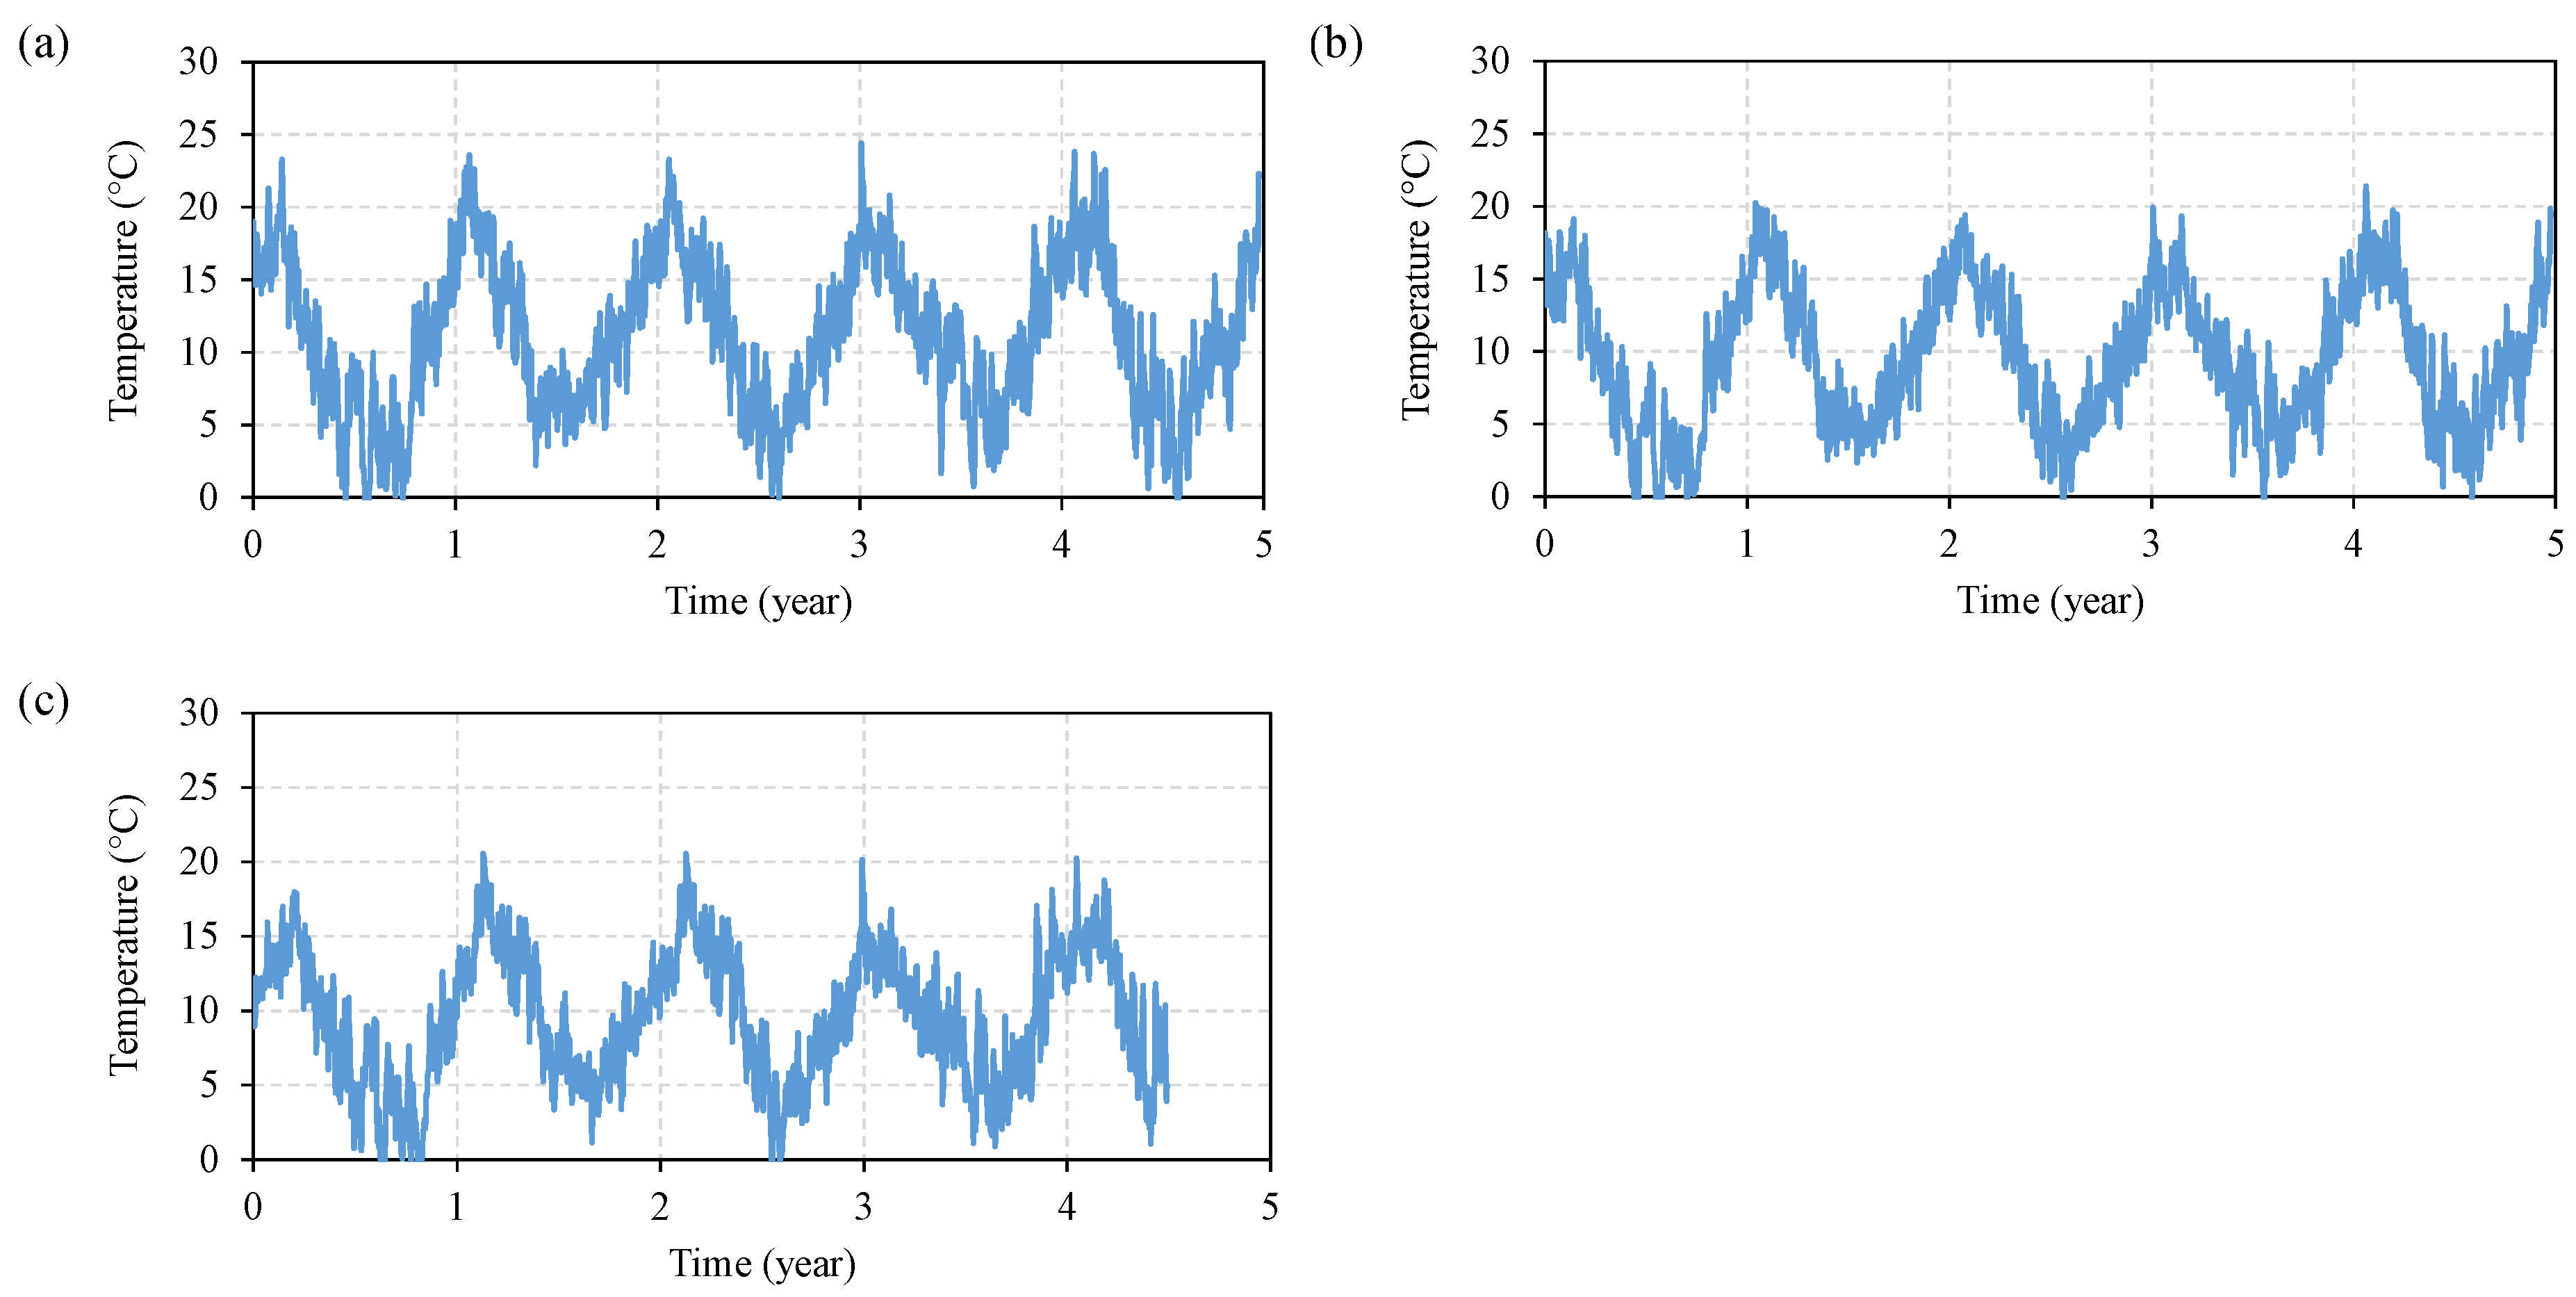
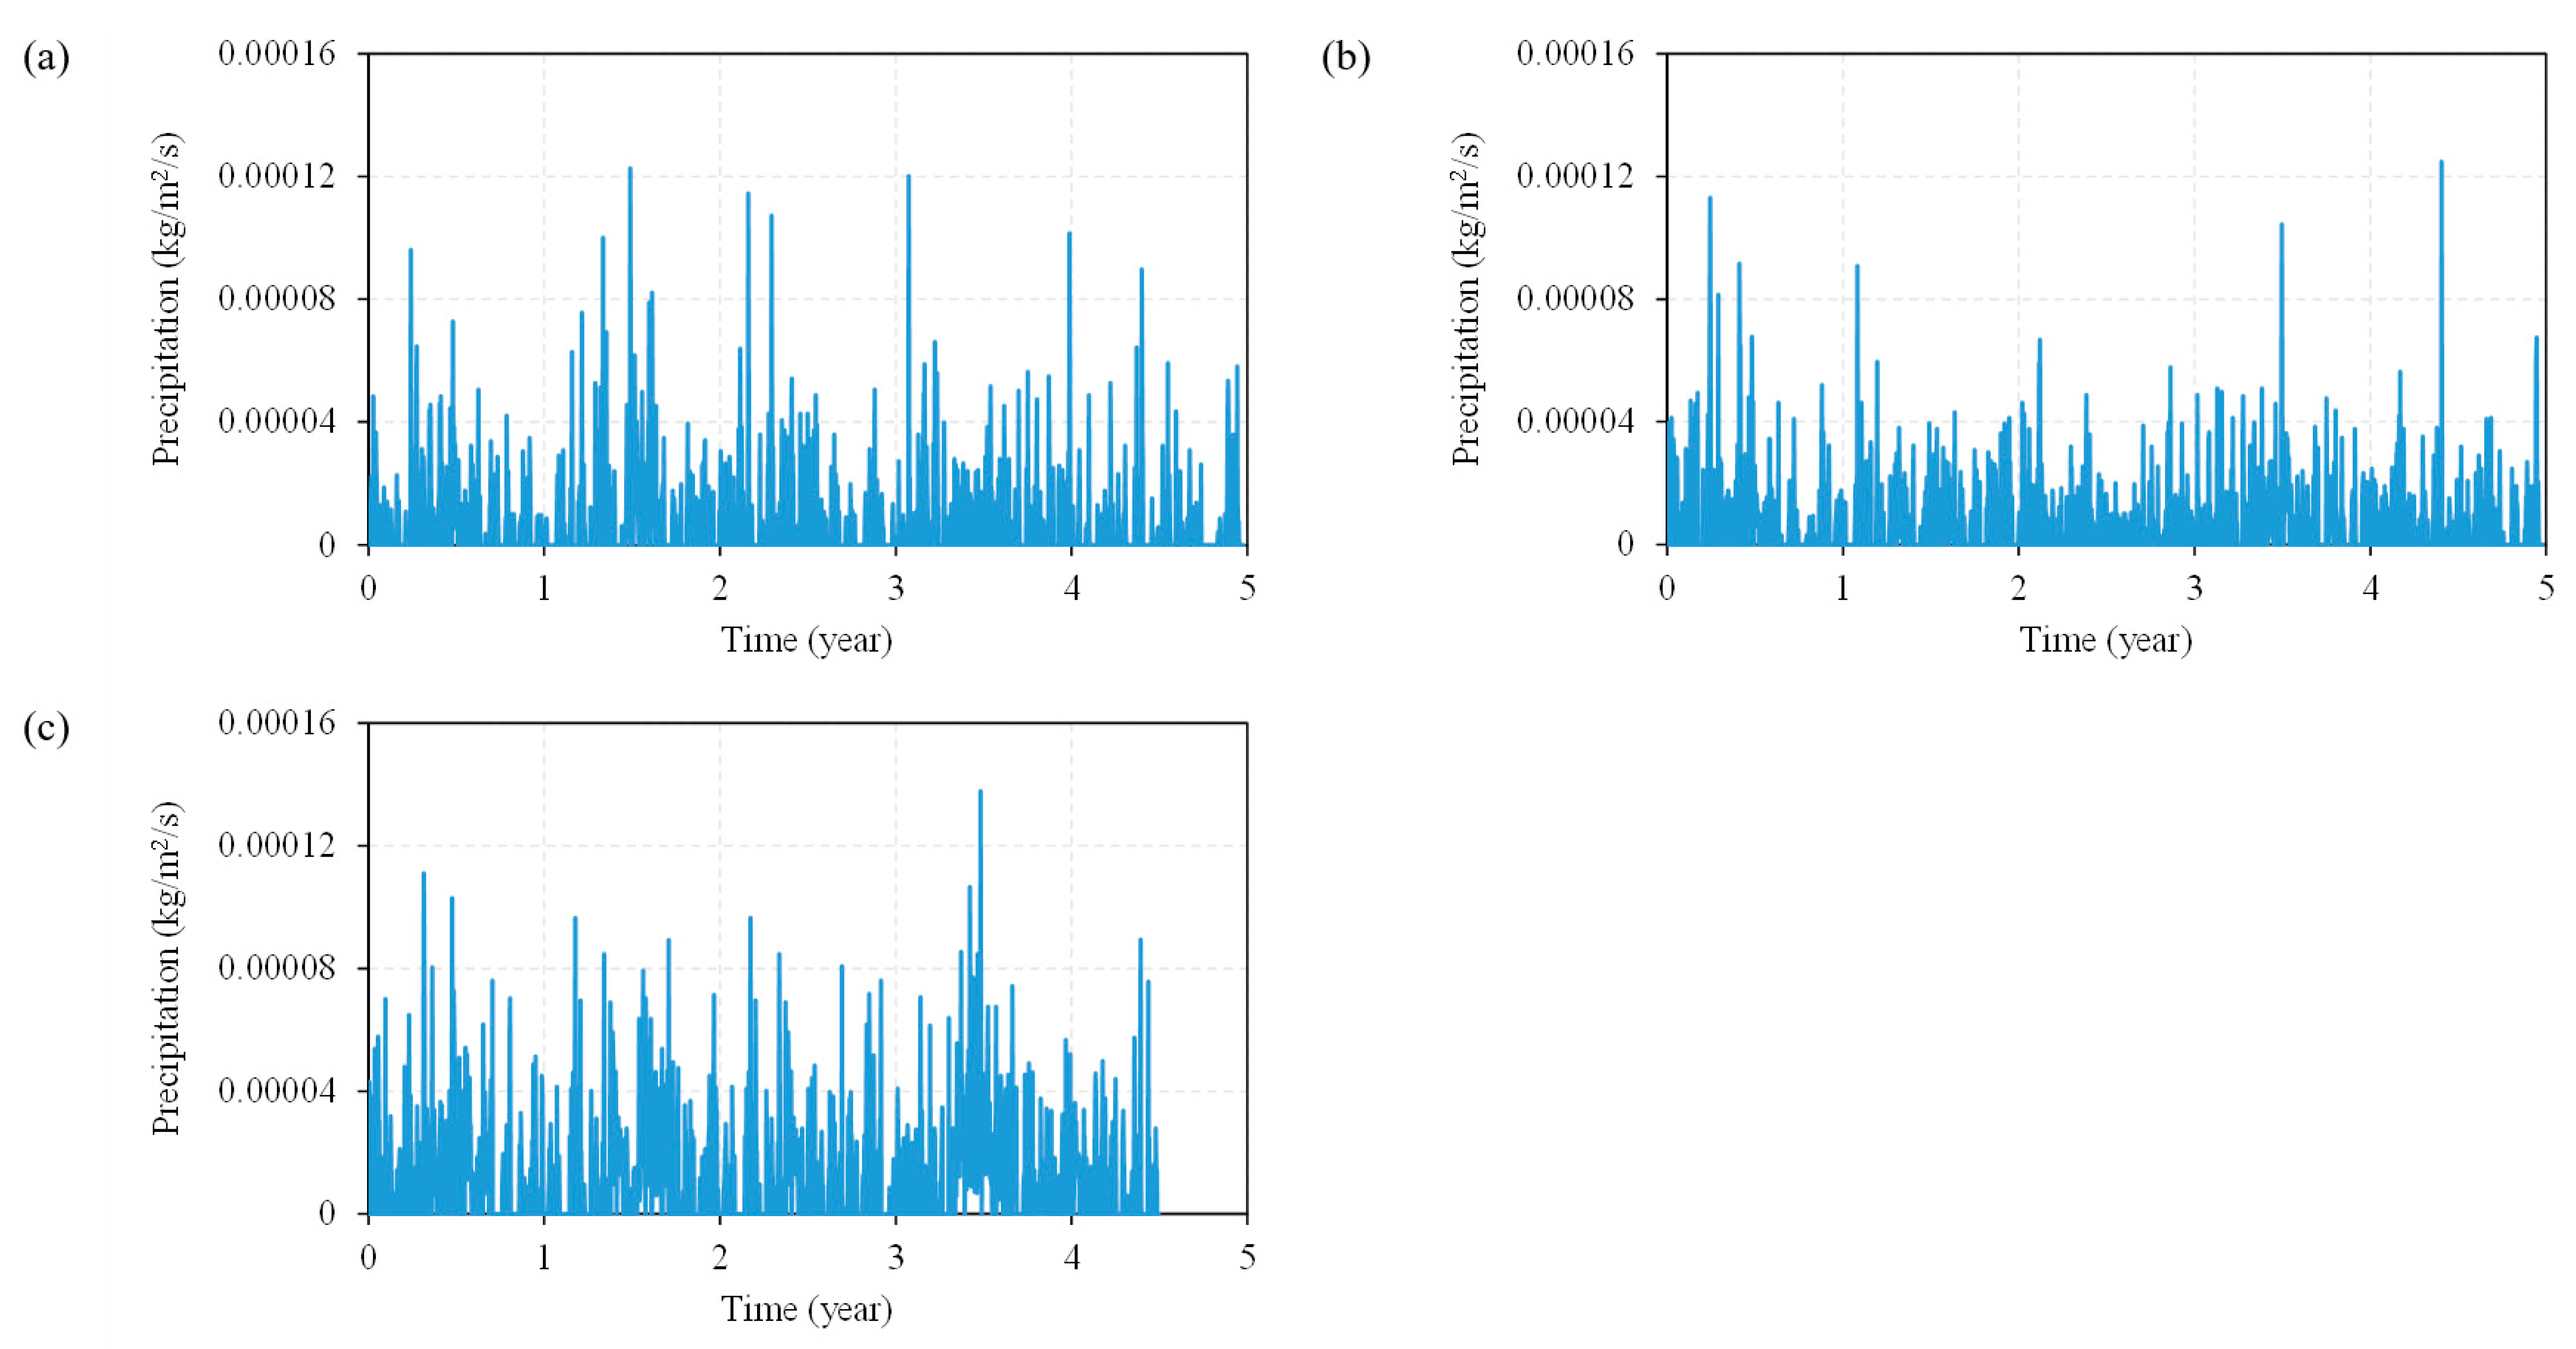
According to the geodatabase under license by the British Geological Survey (BGS), ground conditions of native soils corresponding to each location are summarised in Table 3. As there was no information available on the exact backfill types used in different locations, a range of backfill materials were investigated. Three types, that is, sand-bentonite B1 (B1) [39], liquid soil sand (LSS) [40], and fine sandy loam (FSL) [41] were considered in this study.

3.4. Climatic Data

Copernicus E-OBS gridded data was acquired from the European Space Agency portal for the climate data, with daily values from 1 January 2010 to 31 December 2019 for ambient temperature and total precipitation.
The runoff factors were considered in converting the precipitation into mass flux at the ground surface, based on a range of studies (e.g., [42,43,44,45,46]). Three values corresponding to the runoff factors of 2% (min), 31% (mean) and 60% (max) were taken from the range (2–60%) reported in the literature to account for variability in ground surface types and their influence on water infiltration. The temperature and precipitation profiles obtained are presented as Figure 5 and Figure 6, respectively.

4. Model Development and Verification

4.1. Scenarios and Soil Parameters

A batch of scenarios (Table 4) were developed for each location, to assess the effect of various influence factors, based on different combinations of soil thermal and hydraulic parameters, precipitation, and initial saturation condition. Additionally, three backfill materials with different properties were considered in each location. Additionally, overloading was applied for the best (lowest temperature) and the worst (highest temperature) scenarios from each batch.
The min, mean, and max values of soil parameters, e.g., θ r , θ s , K a , s a t , K l , s a t and van Genuchten parameters of α and β , ranged from min to max by their corresponding standard deviation. Such variation considered the natural variability in grain type and size, and pore size within a particular soil, which would affect the thermo-hydraulic parameters.
Precipitation functions with different infiltration factors, were prescribed to reflect the surface type and its ability to transport water through pores. The initial saturations of the native soil were 20% (min), 40% (mean) and 60% (max). Such values were assumed to represent a variability in the soil moisture. It should be noted that based on the soil water retention curve (SWRC), the saturation value corresponded to a particular water pressure in the soil pores (assuming the air pressure being atmospheric). As different materials, that is, native soils and backfills, had different abilities to retain water, possessing the same pore water pressure in those materials would result in different saturation states. In this work, an approach was taken where an initial saturation with different values for the native soil was assumed, to account for the variability of the soil moisture which could be a function of the season (i.e., near-surface soils in winter/rainy seasons were expected to have a higher degree of saturation, while soils in summer/dry seasons were expected to have a lower degree of saturation). Then, the same pore water pressure calculated for the native soil was prescribed for the backfill material. Consequently, the saturation state in the backfill might have differed to the saturation of the native soil due to differences in soil water retention characteristics. This approach was undertaken to avoid any effect that the water flow induced by pore water pressure differences between the backfill and native soil regions might have on the heat flow in the ground. This can be justified by the fact that the cables have been in operation for a long duration before the period that was covered by the simulations presented in this study. Hence, it was not possible to know the exact pore water pressure or the saturation state in the backfill material, but it was reasonable to assume that at the start of the simulation, the pore water pressure in both materials has reached equilibrium, that is, the pore water pressure in both materials was equal. Parameter values adopted for the analysis and corresponding references are provided in the following sections.

4.1.1. Native Soil Parameters

As the invariant parameters in the batch-scenario study, thermal properties of native soils taken from Busby [47] are presented in Table 5. Hydraulic soil parameters of different soil textures were taken from ROSETTA Class Average Hydraulic Parameters [48].
Assumptions were made for certain parameters as a consideration of rationality and numerical perspective, particularly on the fitting parameter ( β and 1 1 / β ) and residual water content ( θ r ) in the min parameter scenarios. The min value of β was chosen to be slightly higher than the one calculated using lower standard deviation value to ensure computational convergence. The min  θ r was taken as 0.01, to represent the most conservative scenario where the soil can potentially dry out completely; this value ( θ r = 0.01) was also used for the case where an error appears on the calculated effective moisture content (e.g., numerically negative). The hydraulic conductivity was assumed to be equal to the hydraulic conductivity at saturated conditions and kept constant throughout the simulations, which represented the most conservative scenario, as the hydraulic conductivity of soil to water decreased with a reduction in soil water saturation. The batch data are given in Table 6 for BRU location, Table 7 for LT location, and Table 8 for DP location. The SWRCs for each native soil under the corresponding location are presented in Figure 7.

4.1.2. Backfill Parameters

Backfill parameters are provided in Table 9 as invariant. Several properties ( ρ s , C p s , λ s ) were assumed to be equal for all backfill materials [38], due to the lack of site-specific information. The SWRCs of the backfills are presented in Figure 7d.

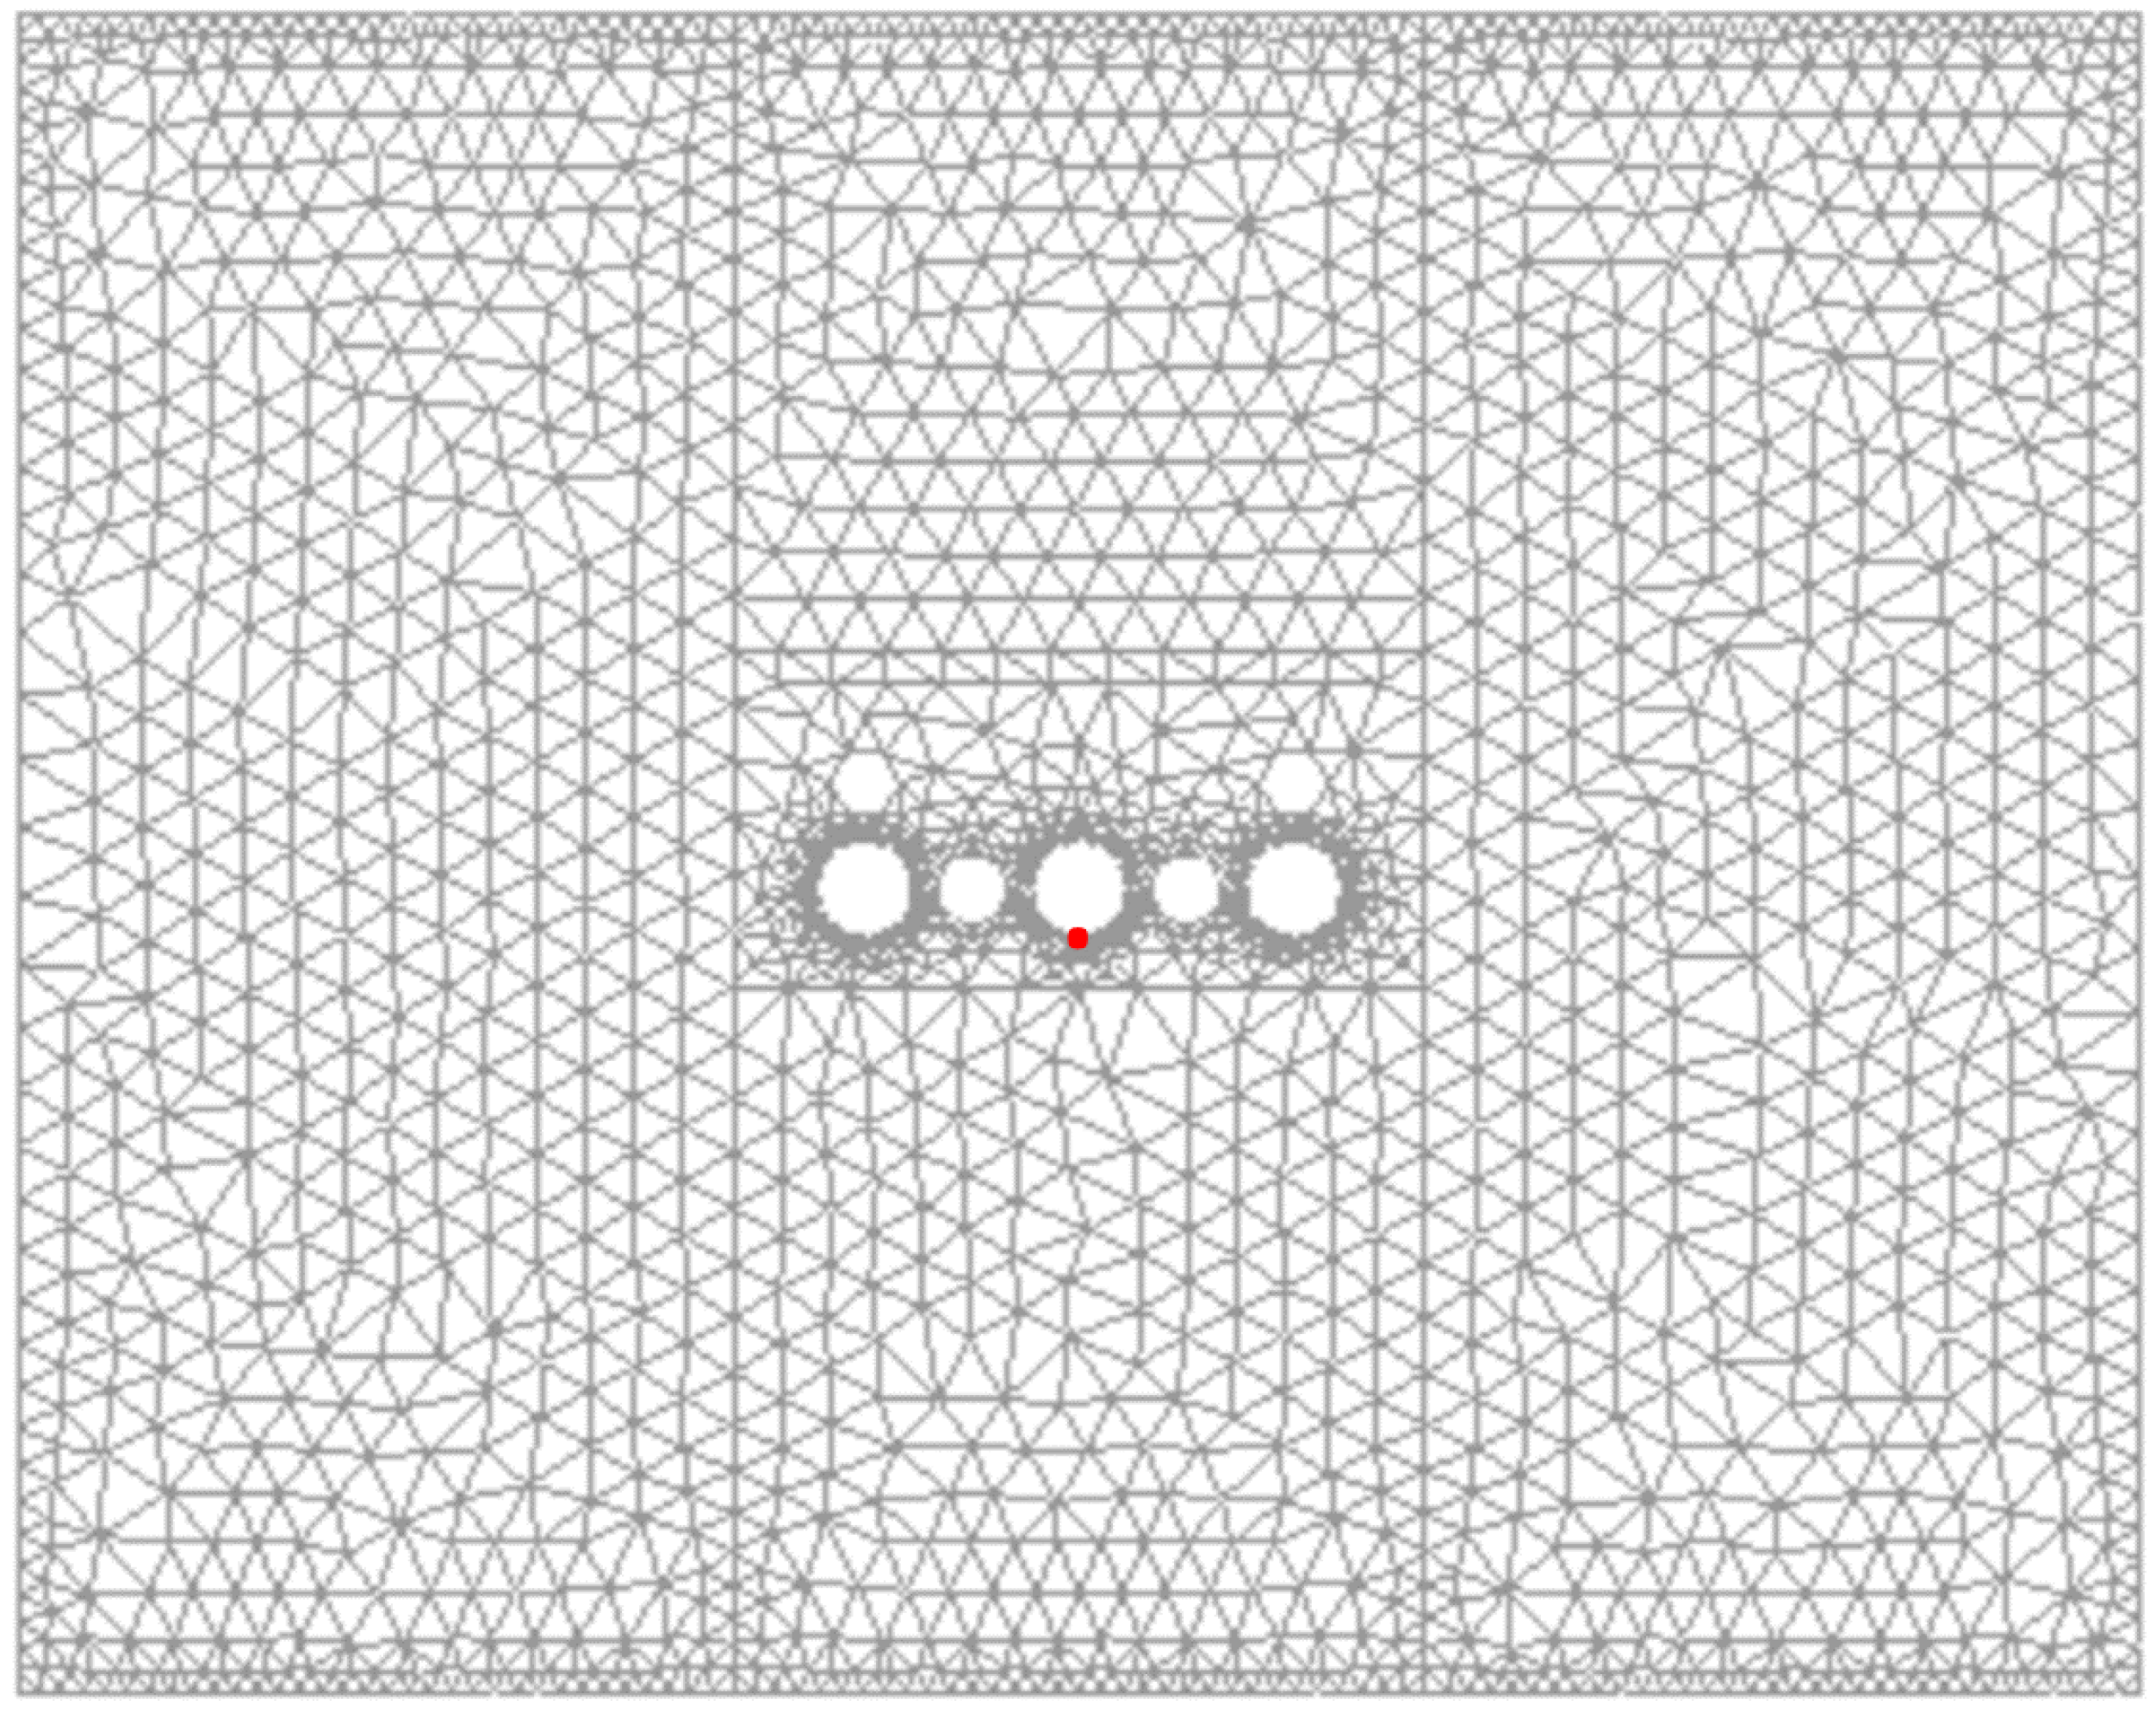
4.2. Spatial Representation and Meshing

Triangular meshing was used for the working domain (Figure 8), whereas the denser mesh was implemented on the location around cables and boundaries. The temperature and saturation results were assessed on the middle cable surface (red dot). Here, the concrete slab was assumed to be the backfill material as well, for simplicity.

4.3. Initial and Boundary Conditions

Initial and boundary conditions were prescribed by three variables, that is, the pore water pressure ( u l ), the pore air pressure ( u a ) and the temperature ( T ). As presented in the input tables, the initial u a was prescribed as the constant atmospheric pressure and u l was determined by the prescribed degree of saturation ( S l ) based on the SWRC. The initial T was assumed to be the ambient temperature for the corresponding season (i.e., 15 °C).
Zero flux for all the three variables was prescribed on the left and right boundaries to impose boundaries impermeable to fluid and heat flux. A fixed bottom bound was prescribed, where u l , u a and T were all fixed as their initial conditions.
At the top surface boundary, u a was assumed as the atmospheric pressure. Surface temperature and precipitation were prescribed as time-dependent functions, as presented in Figure 5 and Figure 6, respectively. Heat flux data (Figure 4) were prescribed at the cable surface, while it was impermeable to water and air.

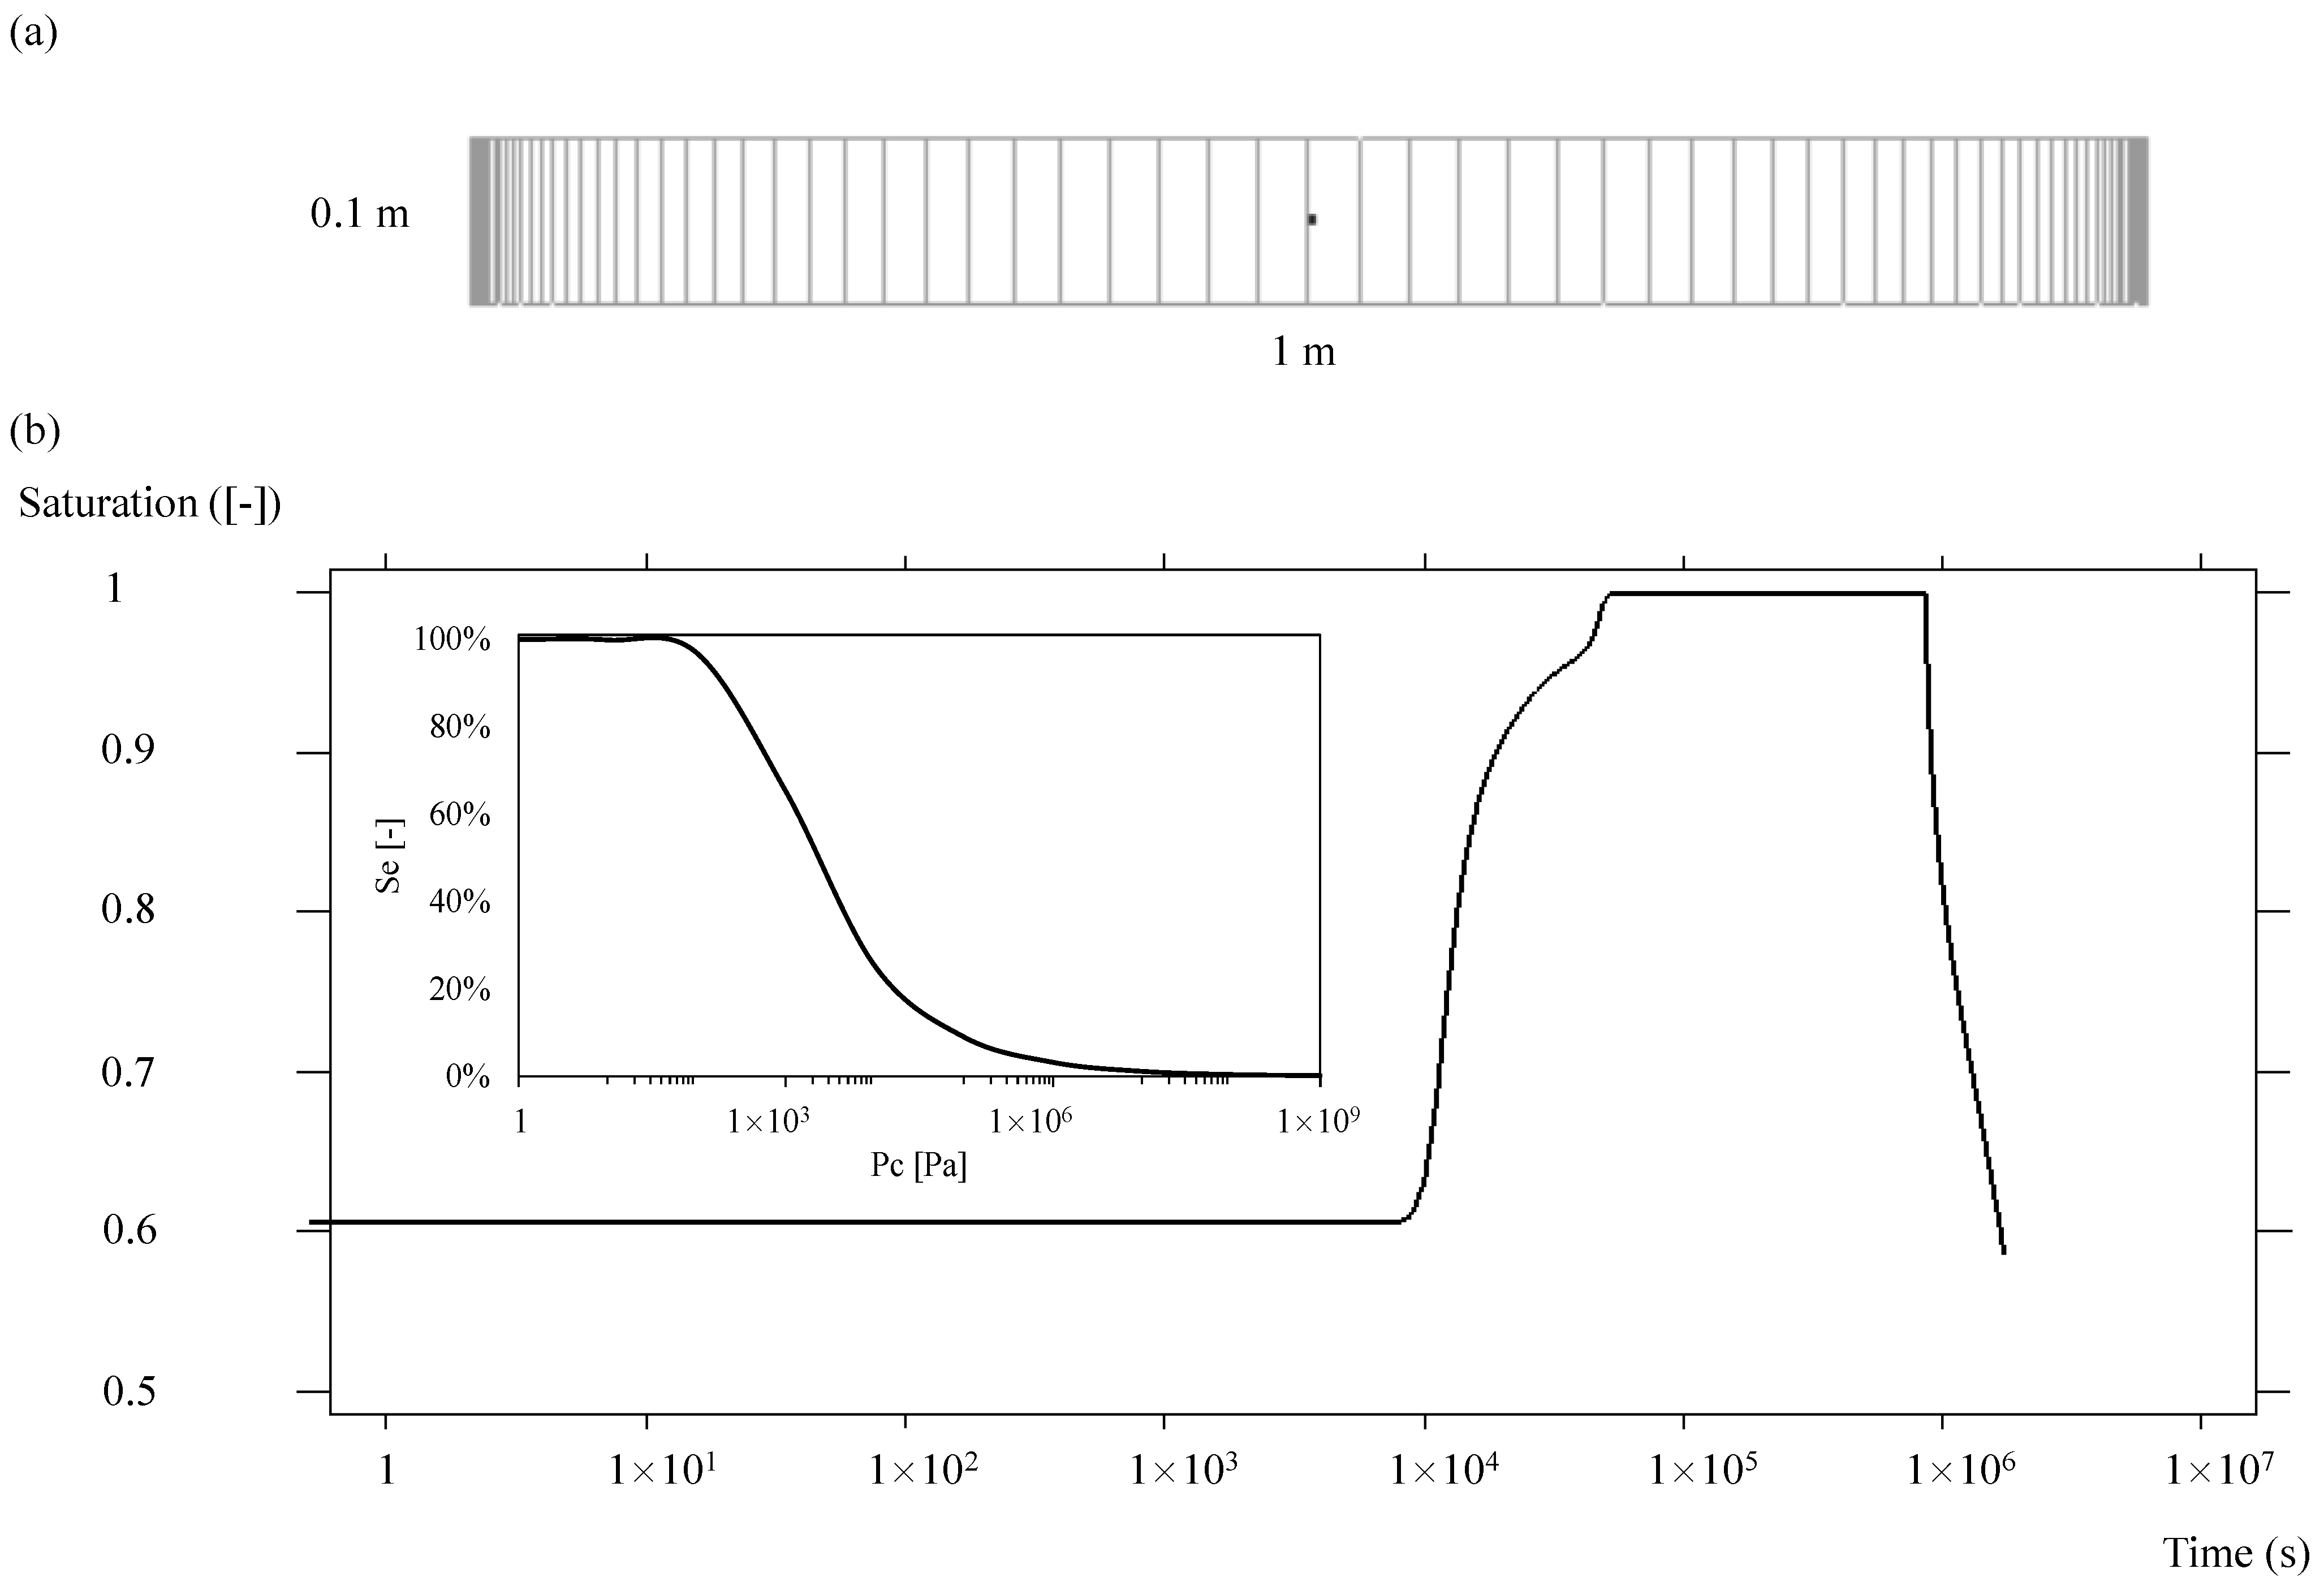
4.4. TH-Model Verification

A verification test was designed to assess the reliability of the model for coupled TH analysis of partially saturated soils. Initial and boundary conditions are shown in Table 10, while Figure 9a shows model domain and mesh condition. Sandy loam was considered in the test, using the mean parameter values and max saturation (see Table 6).
The verification test considered the moisture evolution (in terms of saturation). The benchmark for the simulation was via comparing the predicted changes in the degree of saturation with the condition with reference to SWRC (see Figure 9b).
The saturation ( S m i d ) profile at the middle position (0.5 m, 0.05 m) of the domain is presented in Figure 9b. The first reference point was at the initial condition, which gave the saturation of 60% by the flat portion until water started to infiltrate from the downstream under the gradient of pore water pressure. Considering the initial suction of 1521 Pa, the corresponding saturation value determined from the numerical simulation agreed with the expected value from the SWRC. Then, S m i d raised toward the fully saturated condition as the water flow reached the middle position, which prevailed until the onset of gas infiltration after 10 days (8.64 × 10⁵ s). Consequently, the gas influx from the upstream caused a drop in S m i d . This could be explained by the increased capillary pressure ( P c ) induced by the increased pore air pressure (PAP).
Therefore, the results of the verification test proved the capability of the developed model to simulate two-phase flow under the prescribed conditions, that is, re-saturation of a partially saturated soil and then the desaturation process via gas injection.

5. Results and Discussion

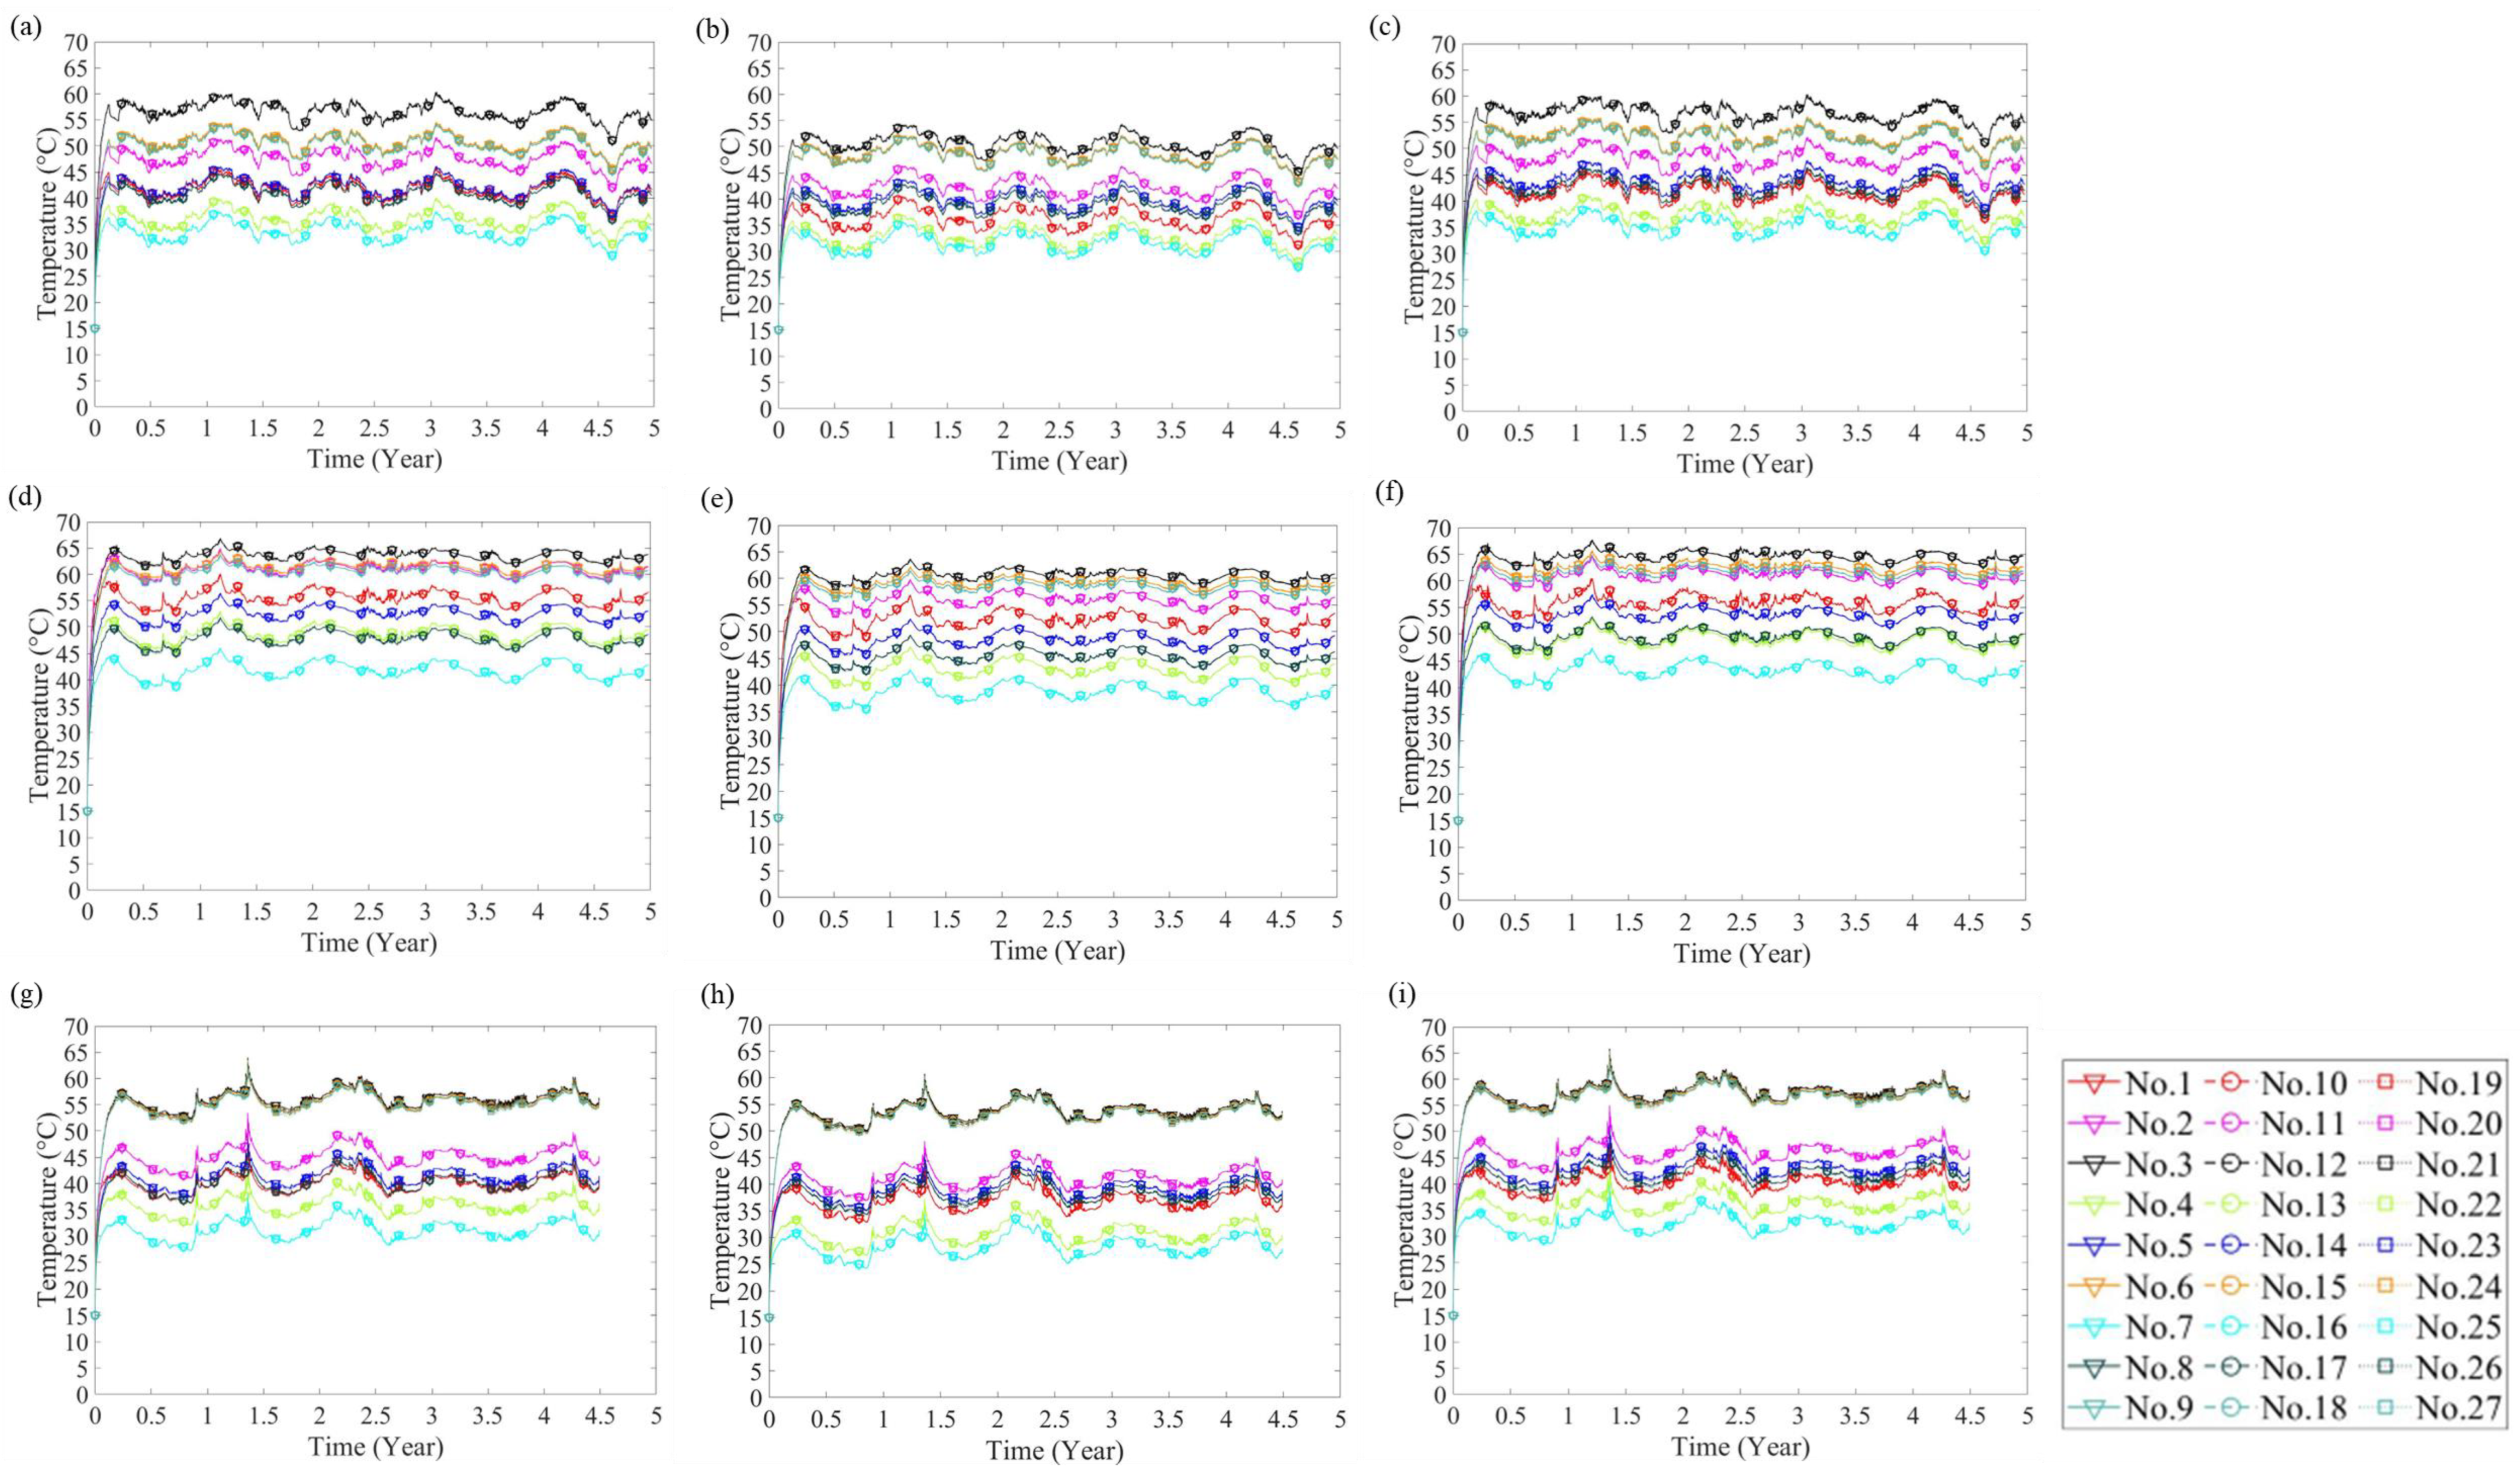
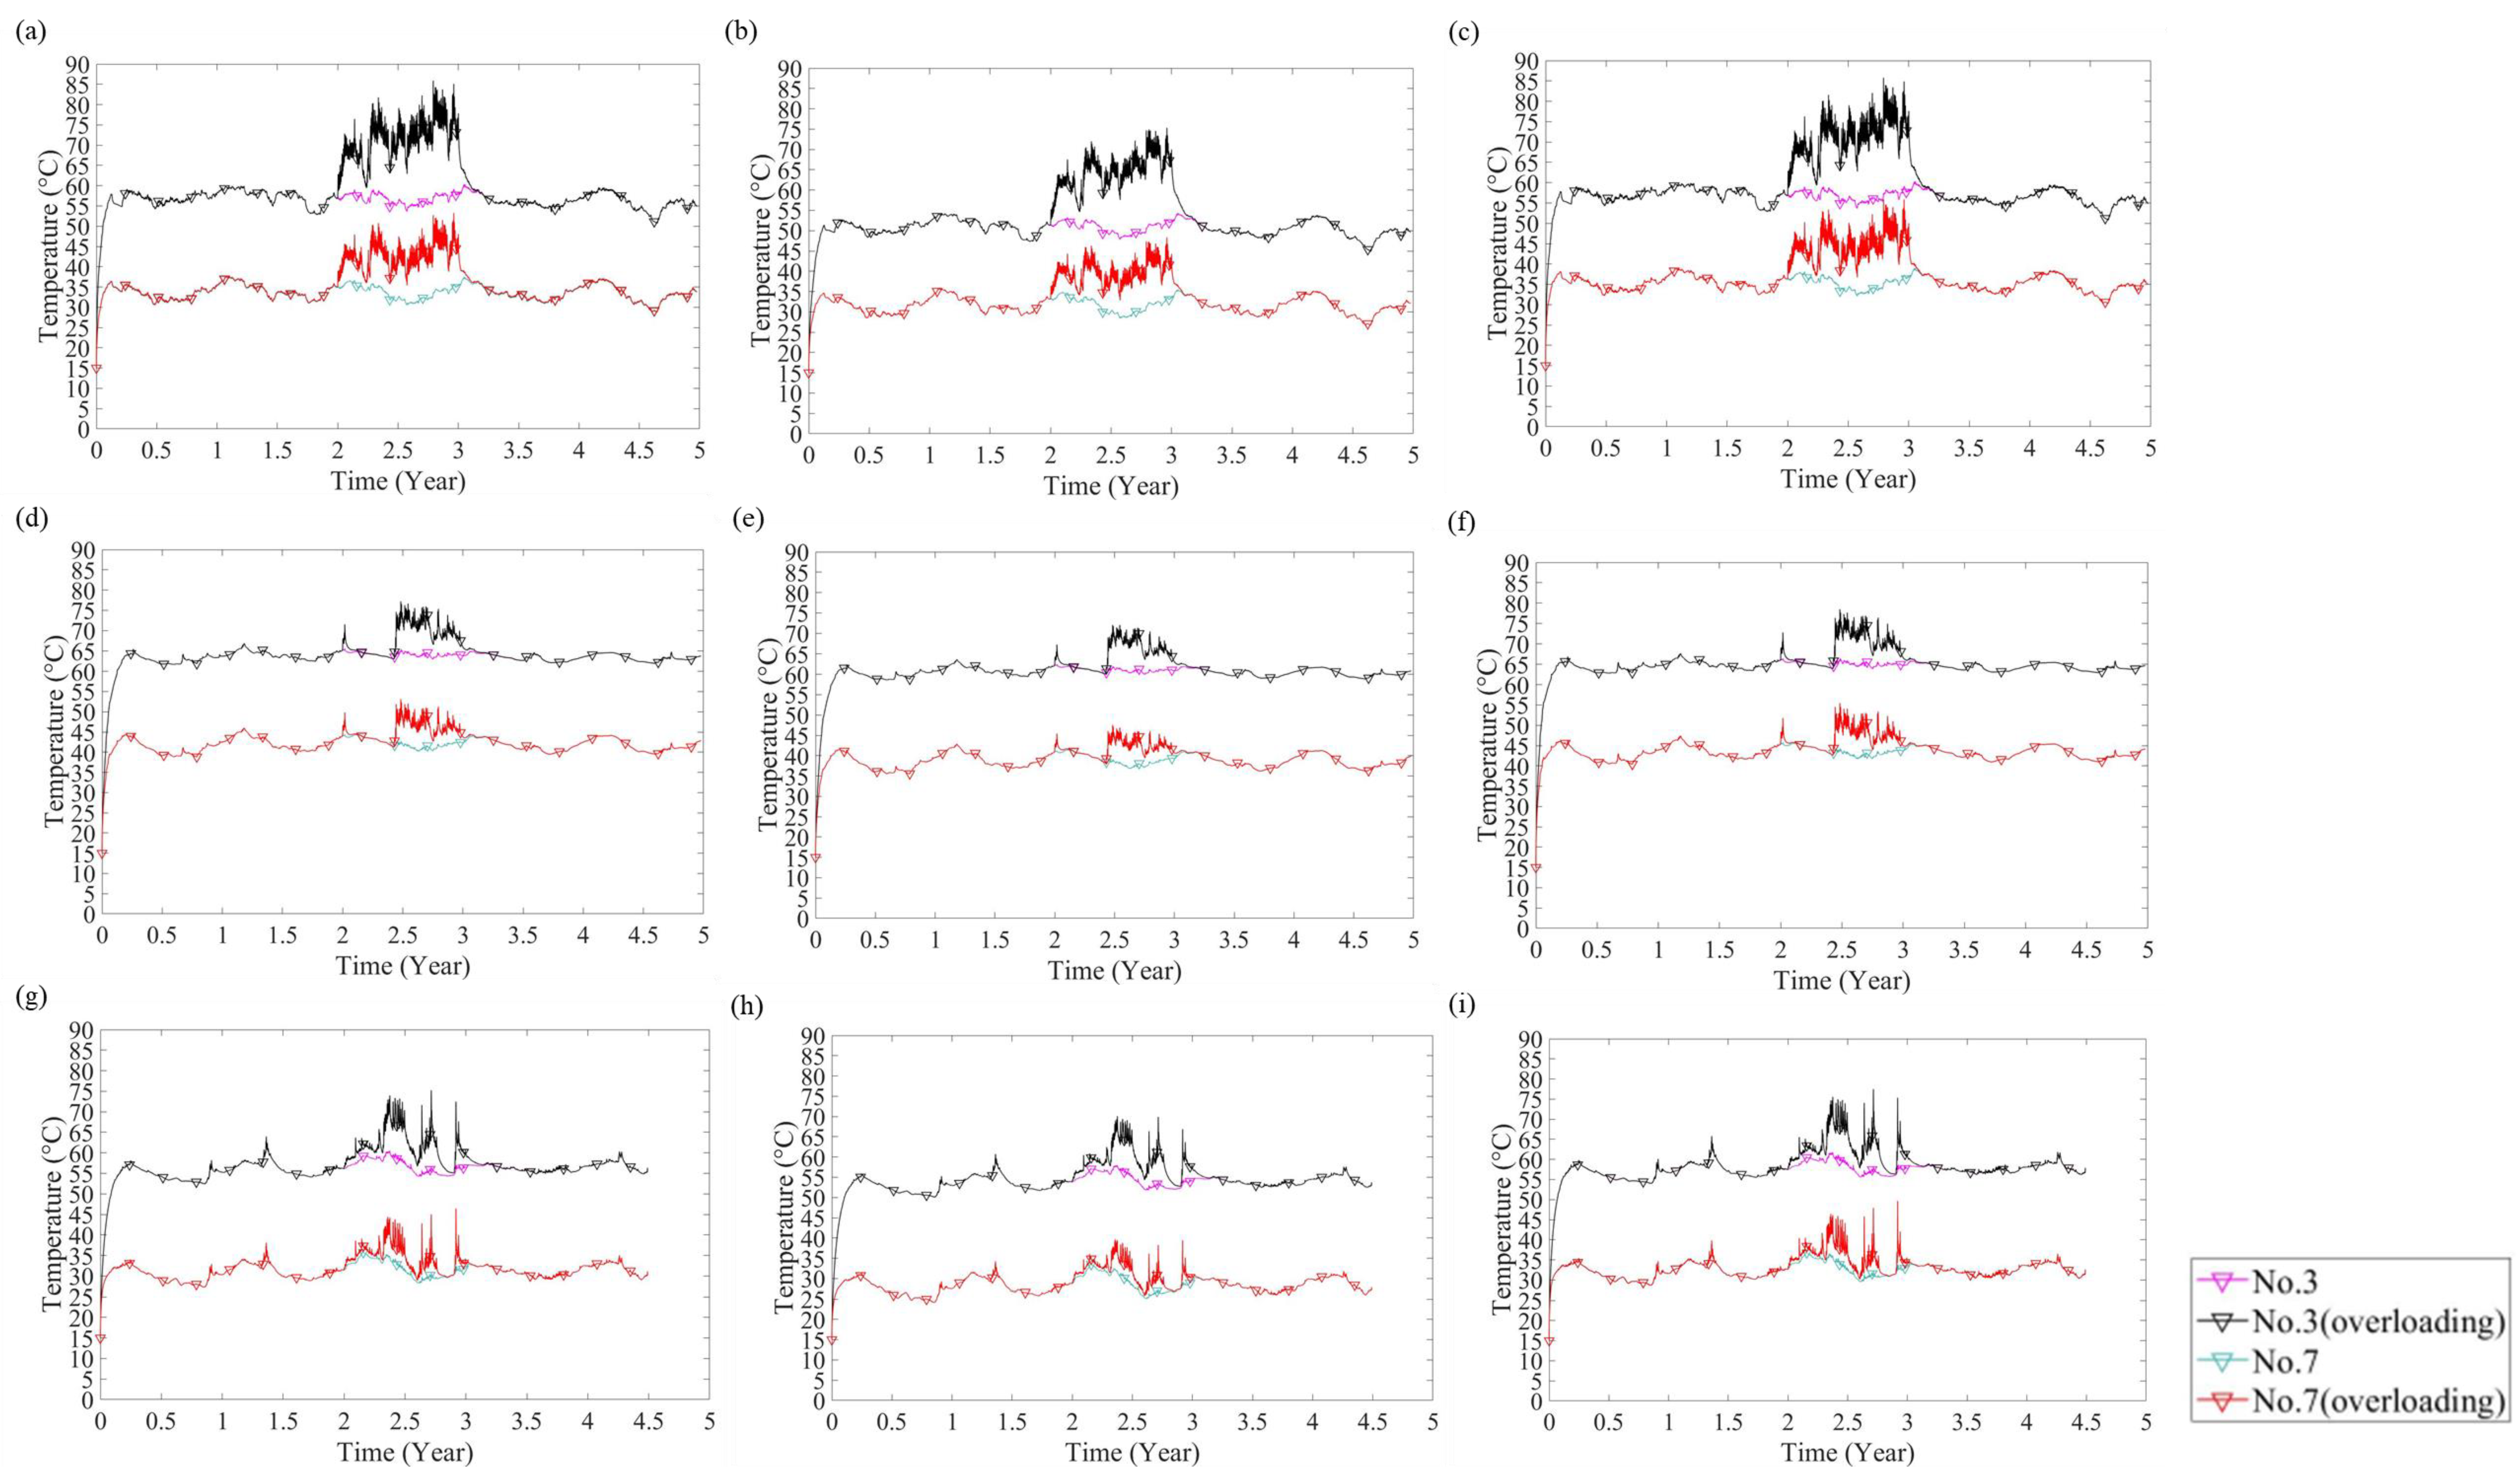
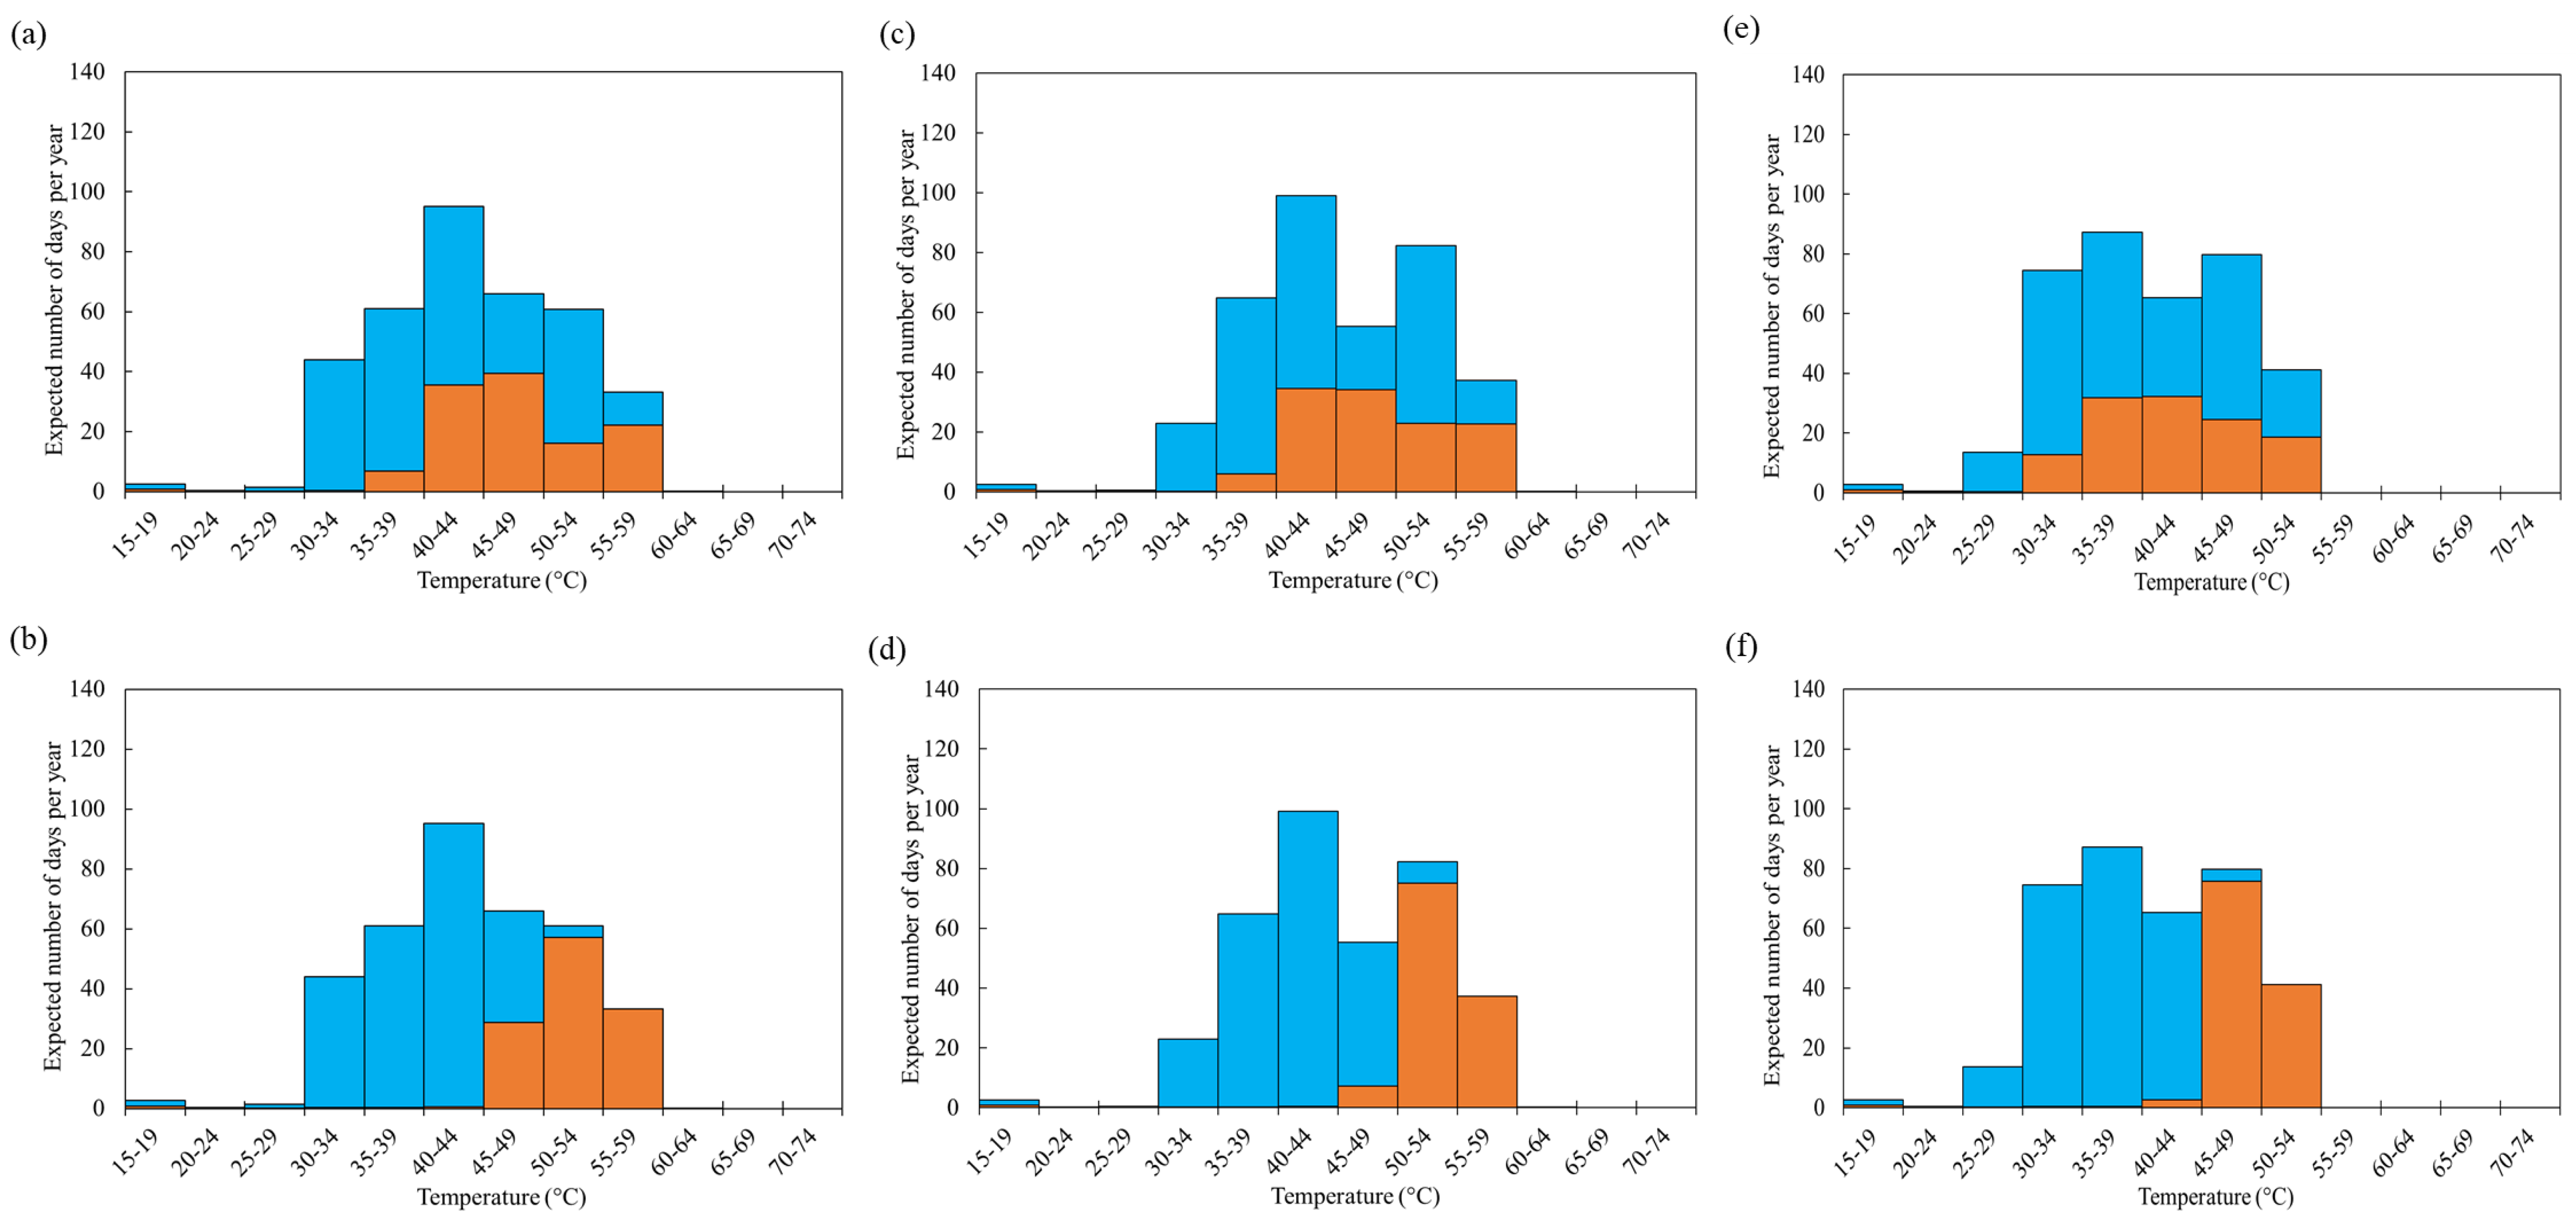
5.1. Cable Thermal Behaviour

The temperature profiles for all scenarios are presented in Figure 10. For each location, a consistent trend can be observed that regardless of the type of backfill materials, a rapid temperature increase in the very early stage occurs before cable reaching a stable thermal condition. For the results from BRU location, the B1 (Figure 10a) and FSL (Figure 10c) backfills have a similar temperature response, reaching up to 60 °C. The LSS backfill (Figure 10b) produced the best thermal performance, with the temperature at the cable surface approaching 55 °C. The DP location (Figure 10g–i) has a similar temperature response. In contrast, the thermal performance of cables at LT location (Figure 10d,f) is worse than at the other two locations, as temperatures up to 65 °C can be observed.
For each group under the same precipitation level (i.e., No. 1–9, No. 10–18, No. 19–27), the scenario with the max soil parameters (hydraulic properties) and the min initial saturation condition was the worst scenario (highest temperature increase), and the scenario with the min soil parameters (hydraulic properties) and the max initial saturation condition was the best scenario (i.e., the lowest temperature increase). Taking the group of No.1 to No.9 as an example, No.3 was the worst scenario, and No.7 was the best scenario. This can be explained from the thermal conductivity perspective that a soil with a higher water saturation would have a greater thermal conductivity, thus better heat dissipation than that from the same soil with less moisture.
The comparison between the cases differed only in precipitation (e.g., No. 1 vs. No. 10 vs. No. 19), shows that the temperature profile was less dependent on the precipitation at the ground surface, compared with the influence of soil parameters and soil initial saturation. As mentioned earlier, the temperature profiles showed that at the same location (with the same native soil), the scenarios with the LSS backfill performed the best compared with the scenarios with the other two backfills; this can be attributed to the better water retention characteristics (see Figure 7d) of the LSS material which meaned a higher degree of saturation thus a greater thermal dissipation can be expected under the same circumstance. Besides, the finding that temperature profiles from LT location were generally higher than those from BRU location and DP location with the same backfill material, could be a result of the combined effect of various circuit ratings and different thermal/hydraulic properties of the native soils from different locations.
The overloading scenarios, as implemented between 2–3 years, showed the expected further increase in temperature (Figure 11) compared to normal loading scenarios. The incremental level depends on loading characteristics in the overloading duration. The results indicated a much higher rise (30–35 °C) in temperature for BRU location compared to those for the other two locations, around 10–15 °C, inferring a higher circuit rating for BRU location during overloading. Additionally, none of the overloading scenarios induced the emergency risk, that is temperatures above 90 °C, on the circuit.

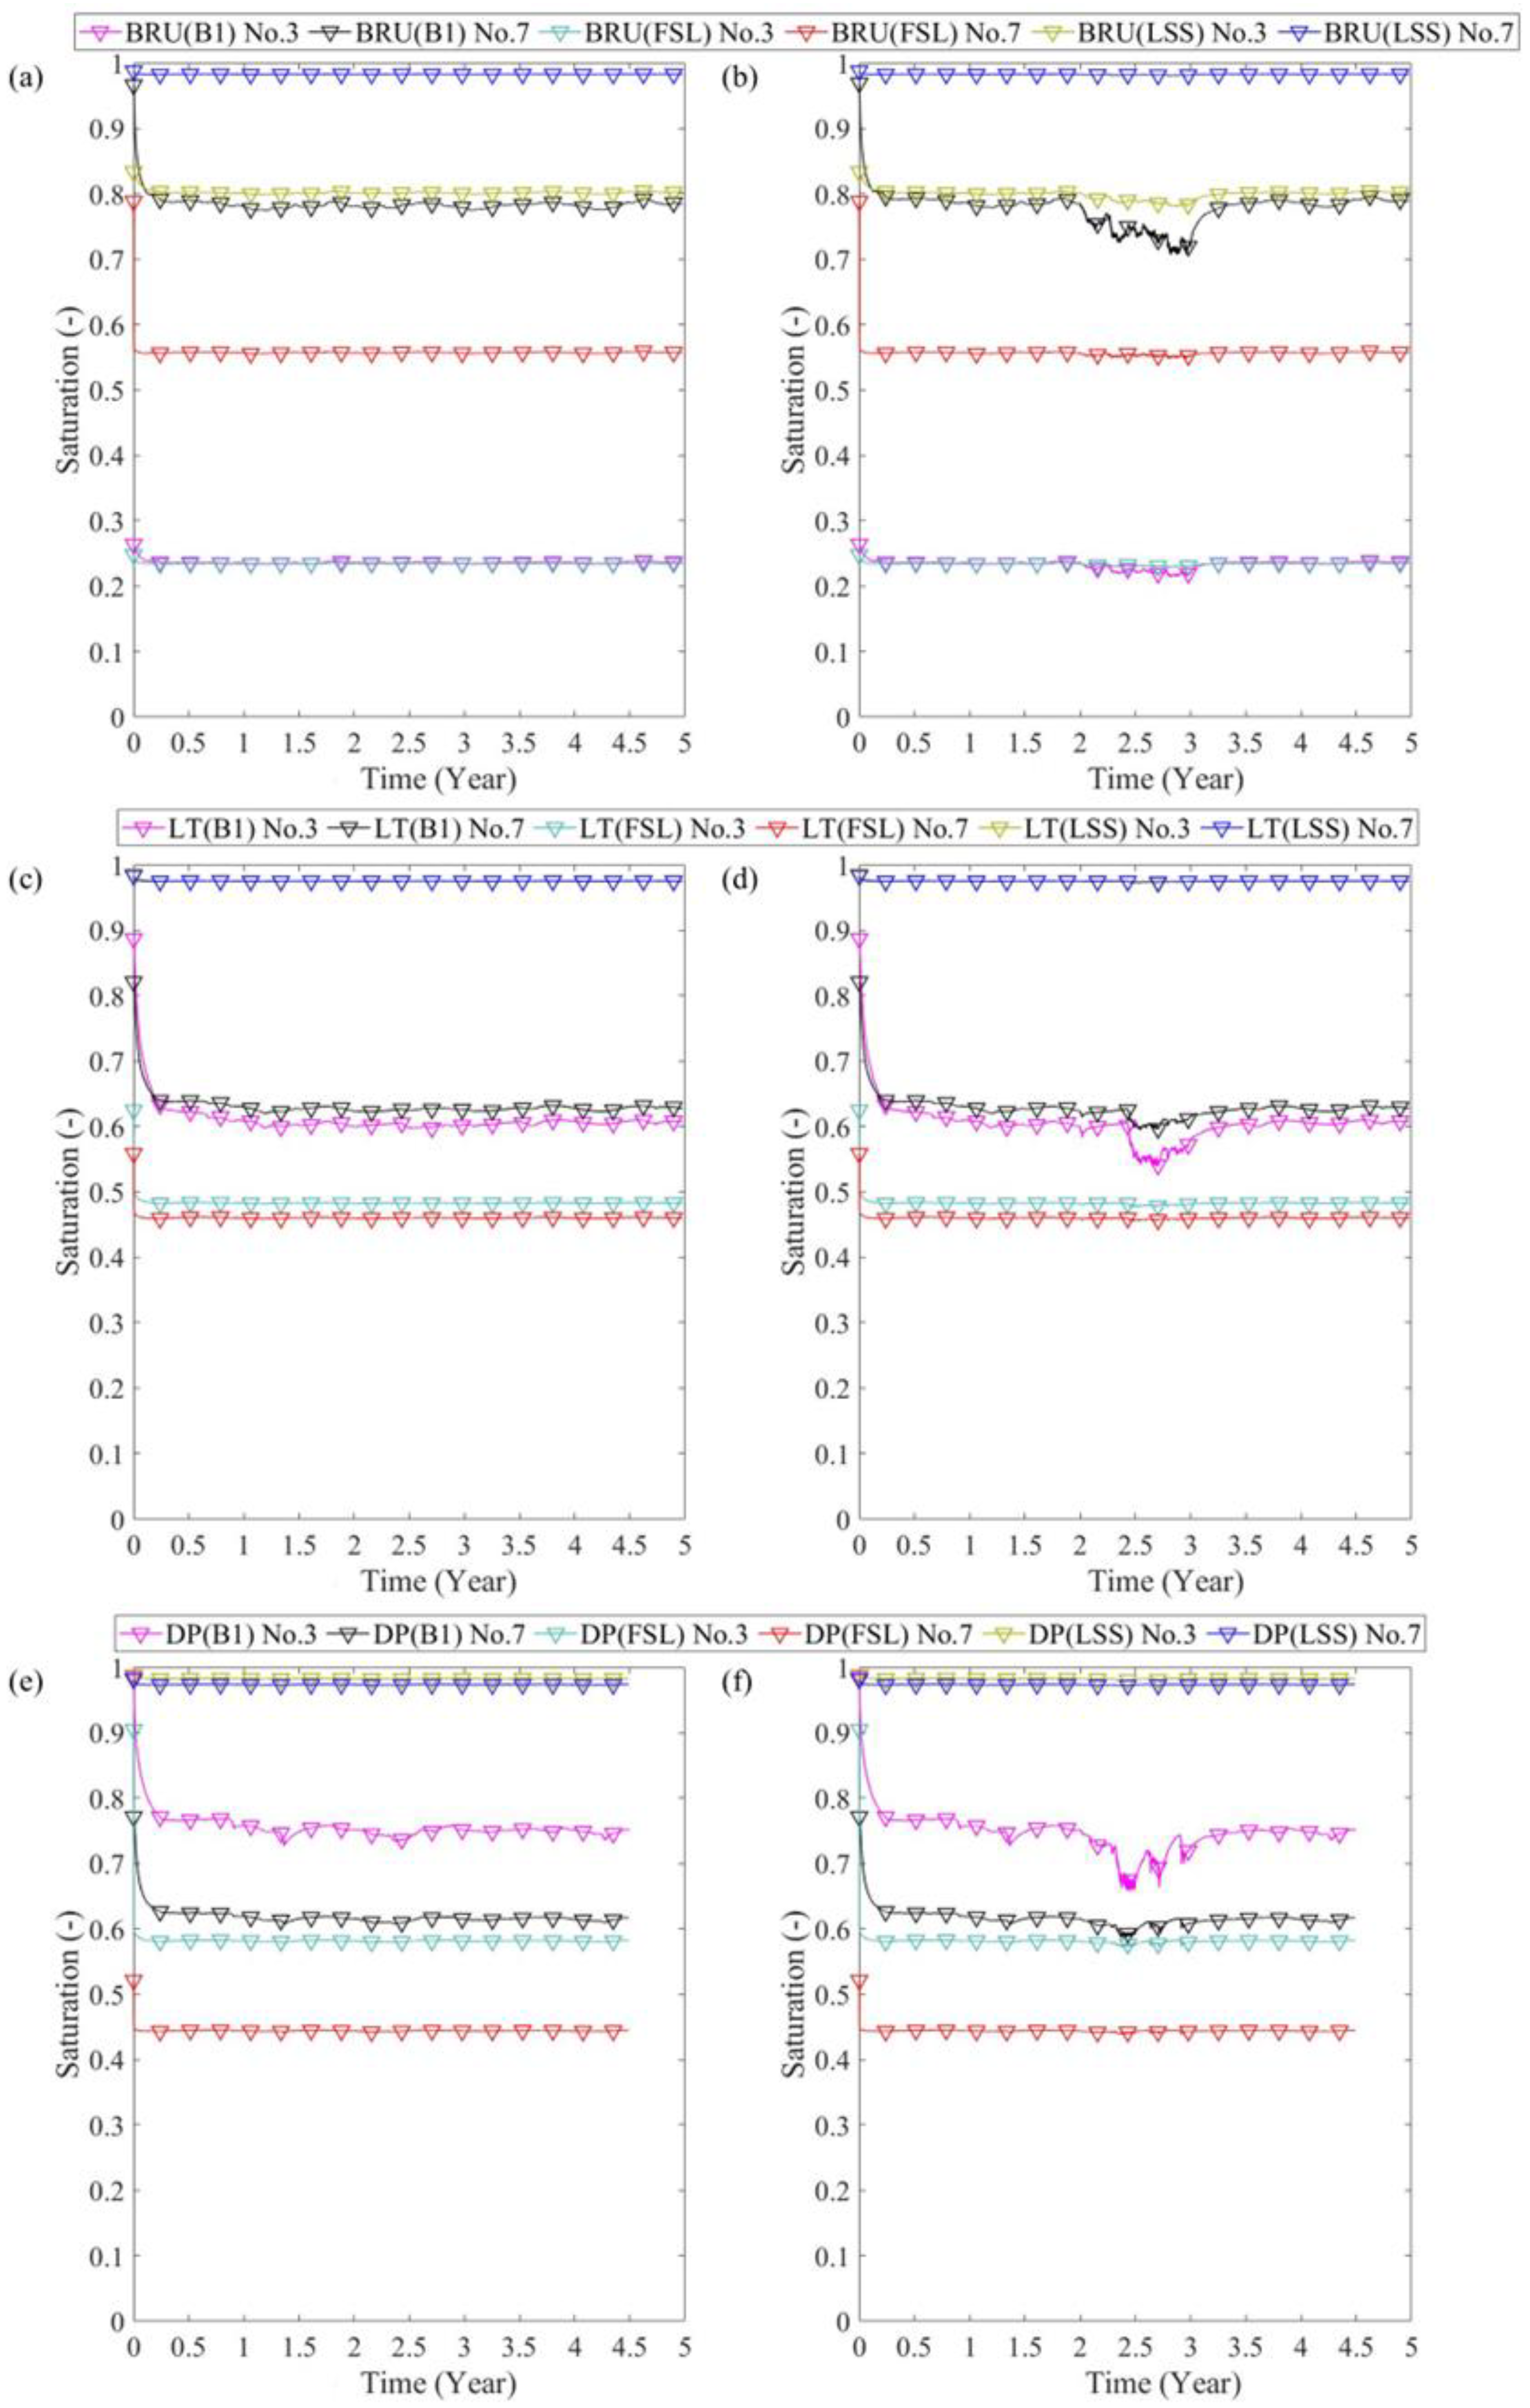
5.2. Hydraulic Behaviour of Backfill

The results of soil saturation changes adjacent to the cable surface (Figure 12) indicated that the drying out in backfills was generally small (the maximum change in saturation being around 0.3), which could be a result of the soil saturation condition in respond to SWRC. The heat flux imposed from the cable was not strong enough to cause excessive drying out.
Most saturation changes happened during the first half-year period, associated with the transient thermal behaviour of cables in response to loading development. A stable condition was then obtained with small fluctuations under the loading and surface boundary conditions.
The various saturation levels for each case were related to the SWRC of different backfill materials, determined by the prescribed pore water pressure following the initial saturation of native soil. Overall, the LSS backfill had the best performance in retaining moisture (i.e., negligible saturation drop), owing to its good water retention characteristics and low hydraulic conductivity. In contrast, the FSL backfill had the worst performance (the decrease in saturation being up to 0.3), due to its relatively poorer water retention characteristics and the several orders of magnitude higher hydraulic conductivity, in comparison to LSS and B1 backfills.
The further saturation change induced by the prescribed overloading was not significant (maximum change being approximately 0.1), which indicated the good water retention ability of backfill materials. Besides, the results corresponding to B1 backfill had more noticeable differences compared to the normal loading results, which may be explained by the corresponding soil retention characteristic (e.g., the slope of the curve portion) at the prescribed saturation level.

5.3. Discussion

The results inferred a close relationship between the thermal dissipation ability (i.e., thermal conductivity) and soil water retention characteristics. Regarding the backfill material, the LSS had a good water retention ability and tended to retain a high amount of moisture in pore space, thereby delivering a better thermal dissipation ability compared to the other two backfills under the same condition. As the α parameter from the SWRC model is correlated to the inverse of the air entry suction, a lower α value and a higher soil suction would be needed for the backfill to dry out. This means, with the atmospheric air pressure in backfill pores, the pore water pressure would need to be very low for moisture to drain. For this circumstance, the heat flux from the cables would need to be higher than the present loading condition.
Additionally, the solid constituents of the backfill material had a very high thermal conductivity, and this would lead to a high bulk conductivity, thus producing a good transport of heat away from the cable even under the relatively unsaturated conditions. Nonetheless, there was no actual information available on backfill type and properties at the interested locations, the behaviour of the backfill may differ in real practice.
In terms of the native soils, the LT circuit was embedded in clay and had a higher temperature profile compared to the BRU circuit (in sandy loam) and DP circuit (in loam). This can be explained by the relatively low thermal conductivity for the clay-featured native soil. The thermal conductivity of solid grains in the LT location was nearly 50% lower than the conductivity of solid grains in BRU and DP locations. Although the clayey soil had a better water retention characteristic than sandy loam and loam, this could not compensate for the lower solid thermal conductivity which governed the bulk soil conductivity, as the volume of solids in the overall soil volume was around 70% for the clayey soil in LT location.
From the soil hydraulic perspective, the max parameter setting produced the worst (highest) temperature profile. This was predominantly related to the fact that the native soils, where the max hydraulic characteristics were assumed, had the weakest water retention characteristics. Thus, even a low suction can drive water away from pores. Additionally, the native soils with the max hydraulic characteristics had the highest hydraulic conductivity which means that under an established hydraulic gradient, the velocity of water flowing away from the heat source would be higher compared to the soils with mean and min hydraulic characteristics. In other words, such soil was relatively easy to drain, hence a more rapid decrease in bulk thermal conductivity and the establishment of a higher temperature zone around the heat source could be expected. The effect of saturation level was also noticed, as the initial lower saturated condition resulted in a worse temperature profile compared to that from a higher saturated condition. This was attributed to the different bulk thermal conductivities induced by different saturation conditions.
The relative importance of the two major factors (min initial saturation and max soil parameter settings) were investigated further. A series of histograms were produced for BRU location (Figure 13), LT location (Figure 14) and DP location (Figure 15). For each case (one location with one native soil), an annual temperature distribution (in blue) was developed based on the temperature profiles of the whole 27 scenarios. Similarly, the probabilistic data (in red) on temperature corresponding to the interested factor was created on the same histogram. The results confirmed the findings that the LT location had the worse temperature profile compared to the other two locations, and the native soil of LSS had the best heat dissipation ability. More importantly, the relative significance of the two factors can be obtained, that is, the max soil parameter setting was more significant than the min initial saturation in terms of the contribution to the relatively high temperature profile on the cables.
The small influence of the precipitation prescribed at the ground surface can be inferred from the results. This was related to the fact that the water that penetrated through the native soil surface was being mostly drained through the bottom boundary, on which a fixed value of pore water that equalled to the initial pore water pressure in the domain was prescribed. As the hydraulic conductivity of the native soil was several orders of magnitude higher than the hydraulic conductivity of the backfill (especially LSS and B1), water migrated faster in the native soil and its transport within the backfill was limited. Consequently, the saturation changes in the backfill were small and any temperature changes because of that were negligible.
The overloading triggered an extra temperature increase and saturation decrease, as expected. This was because a higher loading resulted in a higher heat flux generated at the cable surface, producing a higher thermal gradient in the domain. Accordingly, this caused an enhanced migration of moisture away from the cable, compared to the normal loading scenario. As a result, the bulk thermal conductivities of the backfill and the native soil around the cables reduced and correspondingly temperature increased.
The emergency temperature (i.e., cable temperatures above 90 °C) was not reached in any scenario, under the assumptions considered. The max temperature of around 85 °C was estimated at the BRU location. However, such results should not be taken as conclusive, as several assumptions were considered while estimating the temperature evolution. For instance, no actual information on the overloading pattern or its magnitude was available. Additionally, the backfill properties, for example at the BRU location were not known, although literature data were used to compensate. Nevertheless, this study showed that overloading under such condition was feasible and was not supposed to cause excessive drying out. However, more site-specific information would be desired to obtain more reliable results.

6. Conclusions

This paper presented a flexible numerical modelling framework which allows for thermal performance assessment of underground high voltage electricity transmission lines. A comprehensive numerical investigation into the temperature time-histories of several buried cable circuits operated by the National Grid Electricity Transmission was carried out using a bespoke thermo-hydraulic model of the COMPASS code. Numerical results in terms of temperature evolution at the cable surface, with a focus on assessing the relevant parameters exerting a controlling influence on the ability of a cable to dissipate heat, were presented and discussed. Considering the site-specific information for the cables of interest and the assumptions based on literature data, it can be concluded that backfills have the dominant effect on the thermal behaviour of cables, due to their ability to retain water and not completely dry out, even during the overloading episodes. The initial saturation state and the thermal properties of native soil surrounding the backfill also play an important role in dissipating the heat transferred through the backfill. Hence, if it can be ensured that a backfill material has good hydraulic properties (i.e., high water retention characteristics and low hydraulic conductivity), and good thermal properties (main solid constituents should be sand-based materials), then a good performance of the cable can be expected.
Overall, this study provided novel insights into the thermal performance of buried circuits and demonstrated that nature of the overloading that is undertaken in practice would have no negative ongoing impact (at least in relation to thermal overloading), and thus more frequent or longer duration overloading regimes could probably be tolerated. The developed numerical framework, with further development and validation against site data, could be harnessed to allow safe rating adjustments of buried transmission circuits.

Author Contributions

Conceptualization, R.Z. and R.J.S.; methodology, R.Z. and R.J.S.; software, K.L. and R.J.S.; validation, K.L.; formal analysis, K.L., R.Z. and R.J.S.; resources, O.N.C. and A.Y.; data curation, K.L.; writing – original draft preparation, K.L. and R.Z.; writing – review & editing, R.J.S. and H.R.T.; visualization, K.L.; supervision: H.R.T.; project administration, R.Z. and O.N.C.; funding acquisition, H.R.T. and R.Z. All authors have read and agreed to the published version of the manuscript.

Funding

This research was funded by the National Grid Electricity Transmission [Grant reference number NIA_NGTO041], and the APC was funded by the MDPI.

Data Availability Statement

Restrictions apply to the availability of these data. Data was obtained from National Grid Electricity Transmission and are available from the authors Oliver N. Cwikowski and Alexander Yanushkevich with the permission of National Grid Electricity Transmission.

Acknowledgments

This work was conducted at the Geoenvironmental Research Centre (GRC), Cardiff University, supported by the National Grid Electricity Transmission (NGET) as a part of the Big Data Analytics for Cable Systems project (Grant reference number NIA_NGTO041). The financial support is gratefully acknowledged. The authors also appreciate the help from Irfan Muhammad of the Geoenvironmental Research Centre for his technical assistance in geodatabase collation and preparation of the web-based ArcGIS system.

Conflicts of Interest

The authors declare no conflict of interest.

References

  1. IEA. World Energy Outlook 2021. Available online: https://www.iea.org/reports/world-energy-outlook-2021 (accessed on 21 January 2021).
  2. Yang, L.; Qiu, W.; Huang, J.; Hao, Y.; Fu, M.; Hou, S.; Li, L. Comparison of conductor-temperature calculations based on different radial-position-temperature detections for high-voltage power cable. Energies 2018, 11, 117. [Google Scholar] [CrossRef] [Green Version]
  3. Czapp, S.; Ratkowski, F. Optimization of thermal backfill configurations for desired high-voltage power cables ampacity. Energies 2021, 14, 1452. [Google Scholar] [CrossRef]
  4. Movasat, M.; Tomac, I. Assessment of physical properties of water repellent soils. J. Geotech. Geoenviron. Eng. 2021, 147, 06021010. [Google Scholar] [CrossRef]
  5. Ahmad, S.; Rizvi, Z.H.; Arp, J.C.C.; Wuttke, F.; Tirth, V.; Islam, S. Evolution of temperature field around underground power cable for static and cyclic heating. Energies 2021, 14, 8191. [Google Scholar] [CrossRef]
  6. Verschaffel-Drefke, C.; Schedel, M.; Balzer, C.; Hinrichsen, V.; Sass, I. Heat dissipation in variable underground power cable beddings: Experiences from a real scale field experiment. Energies 2021, 14, 7189. [Google Scholar] [CrossRef]
  7. Shafagh, I.; Shepley, P.; Shepherd, W.; Loveridge, F.; Schellart, A.; Tait, S.; Rees, S.J. Thermal energy transfer around buried pipe infrastructure. Geomech. Energy Environ. 2022, 29, 100273. [Google Scholar] [CrossRef]
  8. Anders, G.J.; Radhakrishna, H.S. Power cable thermal analysis with consideration of heat and moisture transfer in the soil. IEEE Trans. Power Deliv. 1988, 3, 1280–1288. [Google Scholar] [CrossRef]
  9. Hwang, C.C.; Jiang, Y.H. Extensions to the finite element method for thermal analysis of underground cable systems. Electr. Power Syst. Res. 2003, 64, 159–164. [Google Scholar] [CrossRef]
  10. Gouda, O.E.; El Dein, A.Z.; Amer, G.M. Effect of the formation of the dry zone around underground power cables on their ratings. IEEE Trans. Power Deliv. 2011, 26, 972–978. [Google Scholar] [CrossRef]
  11. De Lieto Vollaro, R.; Fontana, L.; Vallati, A. Thermal analysis of underground electrical power cables buried in non-homogeneous soils. Appl. Therm. Eng. 2011, 31, 772–778. [Google Scholar] [CrossRef]
  12. Papagiannopoulos, I.; Chatziathanasiou, V.; Exizidis, L.; Andreou, G.T.; De Mey, G.; Więcek, B. Behaviour of the thermal impedance of buried power cables. Int. J. Electr. Power Energy Syst. 2013, 44, 383–387. [Google Scholar] [CrossRef]
  13. Chatziathanasiou, V.; Chatzipanagiotou, P.; Papagiannopoulos, I.; De Mey, G.; Więcek, B. Dynamic thermal analysis of underground medium power cables using thermal impedance, time constant distribution and structure function. Appl. Therm. Eng. 2013, 60, 256–260. [Google Scholar] [CrossRef]
  14. De Lieto Vollaro, R.; Fontana, L.; Vallati, A. Experimental study of thermal field deriving from an underground electrical power cable buried in non-homogeneous soils. Appl. Therm. Eng. 2014, 62, 390–397. [Google Scholar] [CrossRef]
  15. Kroener, E.; Vallati, A.; Bittelli, M. Numerical simulation of coupled heat, liquid water and water vapor in soils for heat dissipation of underground electrical power cables. Appl. Therm. Eng. 2014, 70, 510–523. [Google Scholar] [CrossRef]
  16. Wiecek, B.; De Mey, G.; Chatziathanasiou, V.; Papagiannakis, A.; Theodosoglou, I. Harmonic analysis of dynamic thermal problems in high voltage overhead transmission lines and buried cables. Int. J. Electr. Power Energy Syst. 2014, 58, 199–205. [Google Scholar] [CrossRef]
  17. Ocłoń, P.; Cisek, P.; Pilarczyk, M.; Taler, D. Numerical simulation of heat dissipation processes in underground power cable system situated in thermal backfill and buried in a multilayered soil. Energy Convers. Manag. 2015, 95, 352–370. [Google Scholar] [CrossRef]
  18. Hughes, T.J.; Henstock, T.J.; Pilgrim, J.A.; Dix, J.K.; Gernon, T.M.; Thompson, C.E. Effect of sediment properties on the thermal performance of submarine HV cables. IEEE Trans. Power Deliv. 2015, 30, 2443–2450. [Google Scholar] [CrossRef]
  19. Thomas, H.R.; He, Y. Analysis of coupled heat, moisture and air transfer in a deformable unsaturated soil. Geotechnique 1995, 45, 677–689. [Google Scholar] [CrossRef]
  20. Thomas, H.R.; Sansom, M.R. Fully coupled analysis of heat, moisture, and air transfer in unsaturated soil. J. Eng. Mech. 1995, 121, 392–405. [Google Scholar] [CrossRef]
  21. Thomas, H.R.; Rees, S.W. Measured and simulated heat transfer to foundation soils. Géotechnique 2009, 59, 365–375. [Google Scholar] [CrossRef]
  22. Thomas, H.R. Modelling two-dimensional heat and moisture transfer in unsaturated soils, including gravity effects. Int. J. Numer. Anal. Methods Geomech. 1985, 9, 573–588. [Google Scholar] [CrossRef]
  23. Thomas, H.R.; King, S.D. Coupled temperature/capillary potential variations in unsaturated soil. J. Eng. Mech. 1991, 117, 2475–2491. [Google Scholar] [CrossRef]
  24. Thomas, H.R.; He, Y.; Onofrei, C. An examination of the validation of a model of the hydro/thermo/mechanical behaviour of engineered clay barriers. Int. J. Numer. Anal. Methods Geomech. 1998, 22, 49–71. [Google Scholar] [CrossRef]
  25. Thomas, H.R.; Cleall, P.; Li, Y.C.; Harris, C.; Kern-Luetschg, M. Modelling of cryogenic processes in permafrost and seasonally frozen soils. Geotechnique 2009, 59, 173–184. [Google Scholar] [CrossRef]
  26. Hosking, L.J.; Thomas, H.R.; Sedighi, M. A dual porosity model of high-pressure gas flow for geoenergy applications. Can. Geotech. J. 2018, 55, 839–851. [Google Scholar] [CrossRef] [Green Version]
  27. Ewen, J.; Thomas, H.R. Heating unsaturated medium sand. Geotechnique 1989, 39, 455–470. [Google Scholar] [CrossRef]
  28. Philip, J.R.; De Vries, D.A. Moisture movement in porous materials under temperature gradients. EOS Trans. Am. Geophys. Union 1957, 38, 222–232. [Google Scholar] [CrossRef]
  29. Van Genuchten, M.T. A closed-form equation for predicting the hydraulic conductivity of unsaturated soils. Soil Sci. Soc. Am. J. 1980, 44, 892–898. [Google Scholar] [CrossRef] [Green Version]
  30. Parker, J.C.; Lenhard, R.J.; Kuppusamy, T. A parametric model for constitutive properties governing multiphase flow in porous media. Water Resour. Res. 1987, 23, 618–624. [Google Scholar] [CrossRef]
  31. Central Electricity Generating Board. Contract: TC/ST/C5388. Beddington-Rowdown. Surrey; The National Grid Company plc: London, UK, 1986. [Google Scholar]
  32. International Electrotechnical Commission. Electric Cables—Calculation of the Current Rating; International Electrotechnical Commission: Geneva, Switzerland, 2006. [Google Scholar]
  33. IEC 60287-2-1; Electric Cables-Calculation of the Current Rating—Part 2: Thermal Resistance—Section 1: Calculation of the Thermal Resistance. IEC: Geneva, Switzerland, 1995.
  34. CIGRE. Cable Systems Electrical Characteristics. Technical Brochure of Working Group WG B1.30; CIGRE: Paris, France, 2013. [Google Scholar]
  35. CIGRE. A Guide for Rating Calculations of Insulated Cables. Technical Brochure of Working Group B1.35 on Cable Ratings; CIGRE: Paris, France, 2015. [Google Scholar]
  36. Engineering Toolbox. Permeability. Available online: https://www.engineeringtoolbox.com/permeability-d_1923.html (accessed on 21 January 2021).
  37. Lindström, L. Evaluating Impact on Ampacity According to IEC-60287 Regarding Thermally Unfavourable Placement of Power Cables; KTH: Stockholm, Sweden, 2011. [Google Scholar]
  38. The National Grid Company plc. Current Ratings for Cables. Technical Guidance Note TGN(T)067. Surrey; The National Grid Company plc: London, UK, 1996. [Google Scholar]
  39. Malusis, M.A.; Yeom, S.; Evans, J.C. Hydraulic conductivity of model soil–bentonite backfills subjected to wet–dry cycling. Can. Geotech. J. 2011, 48, 1198–1211. [Google Scholar] [CrossRef]
  40. Sandford, R.J.; Swan, F.K.; Thomas, H.R. An Investigation into Temporary Flowable Backfills: Liquid Soil Technology; Geoenvironmental Research Centre, Cardiff University: Cardiff, UK, 2019. [Google Scholar]
  41. Hruška, M.; Clauser, C.; De Doncker, R.W. The effect of drying around power cables on the vadose zone temperature. Vadose Zone J. 2018, 17, 1–15. [Google Scholar] [CrossRef] [Green Version]
  42. Ragab, R.; Rosier, P.; Dixon, A.; Bromley, J.; Cooper, J.D. Experimental study of water fluxes in a residential area: 2. Road infiltration, runoff and evaporation. Hydrol. Process. 2003, 17, 2423–2437. [Google Scholar] [CrossRef]
  43. Ramier, D.; Berthier, E.; Andrieu, H. An urban lysimeter to assess runoff losses on asphalt concrete plates. Phys. Chem. Earth Parts A/B/C 2004, 29, 839–847. [Google Scholar] [CrossRef]
  44. Ramier, D.; Berthier, E.; Andrieu, H. The hydrological behaviour of urban streets: Long-term observations and modelling of runoff losses and rainfall–runoff transformation. Hydrol. Process. 2011, 25, 2161–2178. [Google Scholar] [CrossRef]
  45. Redfern, T.W.; Macdonald, N.; Kjeldsen, T.R.; Miller, J.D.; Reynard, N. Current understanding of hydrological processes on common urban surfaces. Prog. Phys. Geogr. 2016, 40, 699–713. [Google Scholar] [CrossRef] [Green Version]
  46. Angrill, S.; Petit-Boix, A.; Morales-Pinzón, T.; Josa, A.; Rieradevall, J.; Gabarrell, X. Urban rainwater runoff quantity and quality—A potential endogenous resource in cities? J. Environ. Manag. 2017, 189, 14–21. [Google Scholar] [CrossRef] [PubMed] [Green Version]
  47. Busby, J. Thermal conductivity and diffusivity estimations for shallow geothermal systems. Q. J. Eng. Geol. Hydrogeol. 2016, 49, 138–146. [Google Scholar] [CrossRef]
  48. USDA. U.S. Salinity Laboratory. Available online: https://www.ars.usda.gov/pacific-west-area/riverside-ca/agricultural-water-efficiency-and-salinity-research-unit/docs/model/rosetta-class-average-hydraulic-parameters/ (accessed on 21 January 2021).
Figure 1. Schematic of methodology.
Energies 15 08897 g001
Figure 2. Cable working domain, adopted from Central Electricity Generating Board [31].
Energies 15 08897 g002
Figure 3. Loading data for (a) BRU cables (b) LT cables (c) DP cables.
Energies 15 08897 g003
Figure 4. Heat flux for (a) BRU cables (b) LT cables (c) DP cables.
Energies 15 08897 g004
Figure 5. Examples of the mean temperature: (a) BRU location (b) LT location (c) DP location.
Energies 15 08897 g005
Figure 6. Examples of the mean precipitation: (a) BRU location (b) LT location (c) DP location.
Energies 15 08897 g006
Figure 7. SWRCs for native soils of (a) BRU (b) LT (c) DP and (d) backfill materials.
Energies 15 08897 g007
Figure 8. Meshing and assessment location.
Energies 15 08897 g008
Figure 9. Verification scenario (a) working domain (b) predicted saturation evolution at middle position.
Energies 15 08897 g009
Figure 10. Temperature evolution: backfill of BRU location (a) B1 (b) LSS (c) FSL; LT location (d) B1 (e) LSS (f) FSL; DP location (g) B1 (h) LSS (i) FSL.
Energies 15 08897 g010
Figure 11. Temperature comparisons: backfill of BRU location (a) B1 (b) LSS (c) FSL; LT location (d) B1 (e) LSS (f) FSL; DP location (g) B1 (h) LSS (i) FSL.
Energies 15 08897 g011
Figure 12. Saturation changes at middle cable: BRU location (a) normal loading (b) overloading; LT location (c) normal loading (d) overloading; DP location (e) normal loading (f) overloading.
Energies 15 08897 g012
Figure 13. Correlation of influence factors at BRU location; (a) min saturation under B1, (b) max parameter setting under B1, (c) min saturation under FSL, (d) max parameter setting under FSL, (e) min saturation under LSS, (f) max parameter setting under LSS.
Energies 15 08897 g013
Figure 14. Correlation of influence factors at LT location: (a) min saturation under B1, (b) max parameter setting under B1, (c) min saturation under FSL, (d) max parameter setting under FSL, (e) min saturation under LSS, (f) max parameter setting under LSS.
Energies 15 08897 g014
Figure 15. Correlation of influence factors at DP location: (a) min saturation under B1, (b) max parameter setting under B1, (c) min saturation under FSL, (d) max parameter setting under FSL, (e) min saturation under LSS, (f) max parameter setting under LSS.
Energies 15 08897 g015
Table 1. Cable information.
Circuit Name (Location)Cable TypeCable Section Length
(km)
Single Core (mm2)
(OD, mm)
Loading Condition (kV)
Beddington–Rowdown (BRU)XLPE10.0682000 (135)400
Lackenby–Thornton (LT)Oil-filled11.5682000 (135)400
Dinorwig–Pentir (DP)Oil-filled10.7572000 (135)400
Note: OD stands for the outer diameter; XLPE stands for cross-linked polyethylene insulated aluminium conductor armoured cable.
Table 2. List of parameters used in the calculation of conductor and dielectric heat losses.
ParameterUnit Equation/ReferenceValue
Conductor resistivity (Cu), ρ Ωm[34]1.84
Proximity effect coefficient, K ρ -[34]1.07
Angular frequency, ω 1/s[35]439.82
Relative magnetic permeability, μ H/m[36]1.26 × 10−6
Skin effect coefficient, k s -[34]1
Proximity effect coefficient, k P -[34]1
Phase to Earth VoltagekV400/√3 [37] 2.31 × 10⁵
Loss angle (power dissipation factor), t a n δ -[34]0.003
Table 3. Native materials at areas of interest.
DatasetCable Location
BRULTDP
Native soil typeSandy loamClayLoam
Groundwater depth2 m>30 m>2 m
Ground Water Flooding potentialPotential for groundwater floodingNot prone/Limited potential/potential to groundwater flooding Potential for groundwater flooding
Bedrock Permeability HighLowLow
Table 4. Scenarios for batch simulation.
ScenarioParametersPrecipitationSaturation
1MinMinMin
2MeanMinMin
3MaxMinMin
4MinMinMean
5MeanMinMean
6MaxMinMean
7MinMinMax
8MeanMinMax
9MaxMinMax
10MinMeanMin
11MeanMeanMin
12MaxMeanMin
13MinMeanMean
14MeanMeanMean
15MaxMeanMean
16MinMeanMax
17MeanMeanMax
18MaxMeanMax
19MinMaxMin
20MeanMaxMin
21MaxMaxMin
22MinMaxMean
23MeanMaxMean
24MaxMaxMean
25MinMaxMax
26MeanMaxMax
27MaxMaxMax
Table 5. Density and solid thermal properties of native soils (adopted from [47]).
LocationNative Soil ρ s   (kg/m3) C p s (J/(kg K)) λ s (W/(mK))
BRUSandy loam2620793.693.81
DPLoam2660788.913.82
LT Clay2600796.721.96
Table 6. Initial input for batch simulation of BRU location (adopted from [48]).
Parameter (min)Parameter (mean)Parameter (max)
Native soil
(sandy loam)
u l (Pa) at S l   =   20 % −78,20939,399−65,206
u l (Pa) at S l   =   40 % 84,24996,104100,068
u l (Pa) at S l   =   60 % 97,27199,803100,814
α (cm−1)0.120.210.36
β 1.31.451.87
1 1 / β 0.230.310.47
θ r e s 0.010.040.09
θ s a t 0.300.390.47
K l , s a t (m/s)6.99 × 10−61.35 × 10−52.62 × 10⁻⁵
K a , s a t (m/s)5.14 × 10−79.95 × 10−71.93 × 10⁻⁷
u a (Pa)101,325101,325101,325
T (K)288.15288.15288.15
Backfill u l (Pa) at S l   =   20 % −78,20939,399−65,206
u l (Pa) at S l   =   40 % 84,24996,104100,068
u l (Pa) at S l   =   60 % 97,27199,803100,814
Table 7. Initial input for batch simulation of LT location (adopted from [48]).
Parameter (min)Parameter (mean)Parameter (max)
Native soil
(clay)
u l (Pa) at S l   =   20 % −6,150,000−386,55390,589
u l (Pa) at S l   =   40 % −34,45476,52299,173
u l (Pa) at S l   =   60 % 85,93496,945100,539
α (cm−1)0.080.160.32
β 1.201.251.47
1 1 / β 0.170.200.32
θ r e s 0.010.010.01
θ s a t 0.380.460.54
K l , s a t (m/s)3.56 × 10−68.94 × 10−62.24 × 10⁻⁵
K a , s a t (m/s)2.62 × 10−76.58 × 10−71.65 × 10⁻⁶
u a (Pa)101,325101,325101,325
T (K)288.15288.15288.15
Backfill u l (Pa) at S l   =   20 % −6,150,000−386,55390,589
u l (Pa) at S l   =   40 % −34,45476,52299,173
u l (Pa) at S l   =   60 % 85,93496,945100,539
Table 8. Initial input for batch simulation of DP location (adopted from [48]).
Parameter (min)Parameter (mean)Parameter (max)
Native soil
(loam)
u l (Pa) at S l   =   20 % −878,967975,73499,515
u l (Pa) at S l   =   40 % −71,98996,394100,530
u l (Pa) at S l   =   60 % 82,28699,545100,874
α (cm−1)0.070.140.29
β 1.201.471.99
1 1 / β 0.170.320.50
θ r e s 0.010.010.01
θ s a t 0.300.400.50
K l , s a t (m/s)3.26 × 10−68.19 × 10−62.06 × 10⁻⁵
K a , s a t (m/s)2.40 × 10−76.02 × 10−71.51 × 10⁻⁶
u a (Pa)101,325101,325101,325
T (K)288.15288.15288.15
Backfill u l (Pa) at S l   =   20 % −8,789,67975,73499,515
u l (Pa) at S l   =   40 % −71,98996,394100,530
u l (Pa) at S l   =   60 % 82,28699,545100,874
Table 9. Thermal and hydraulic properties of backfill materials (adopted from [39,40,41]).
Backfill α (cm−1) β 1 1 / β K l , s a t (m/s) K a , s a t (m/s)
Liquid Soil Sand (LSS)4.33 × 10−41.580.372.30 × 10−101.69 × 10⁻¹¹
sand-bentonite (B1)4.84 × 10−31.780.442.60 × 10−101.91 × 10⁻¹¹
fine sandy loam (FSL)2.77 × 10−21.380.283.96 × 10−62.91 × 10⁻⁷
Backfill ρ s (kg/m3) C p s (J/(kg K)) λ s (W/(mK)) θ r e s θ s a t
Liquid Soil Sand (LSS)2896.91779.19.090.010.35
sand-bentonite (B1)2896.91779.19.090.040.44
fine sandy loam (FSL)2896.91779.19.090.010.45
Table 10. Initial and boundary conditions for verification test.
Upstream Boundary Conditions
(Left Side)
Initial ConditionsDownstream Boundary Conditions
(Right Side)
PAP flux: 0 (kg/m2/s)
(0 ≤ t ≤ 10 days)
PAP flux: linear increase from 0 to 1 × 10⁻⁴ (kg/m2/s)
(10 ≤ t ≤ 20 days)
u l = −1421 Pa
u a = 100 Pa
T = 288.15 K
u l = 100 Pa
u a = 100 Pa
Publisher’s Note: MDPI stays neutral with regard to jurisdictional claims in published maps and institutional affiliations.

