
Techno-Economic and Environmental Assessment of Municipal Solid Waste Energetic Valorization

 , , , , , and
Abstract
:1. Introduction
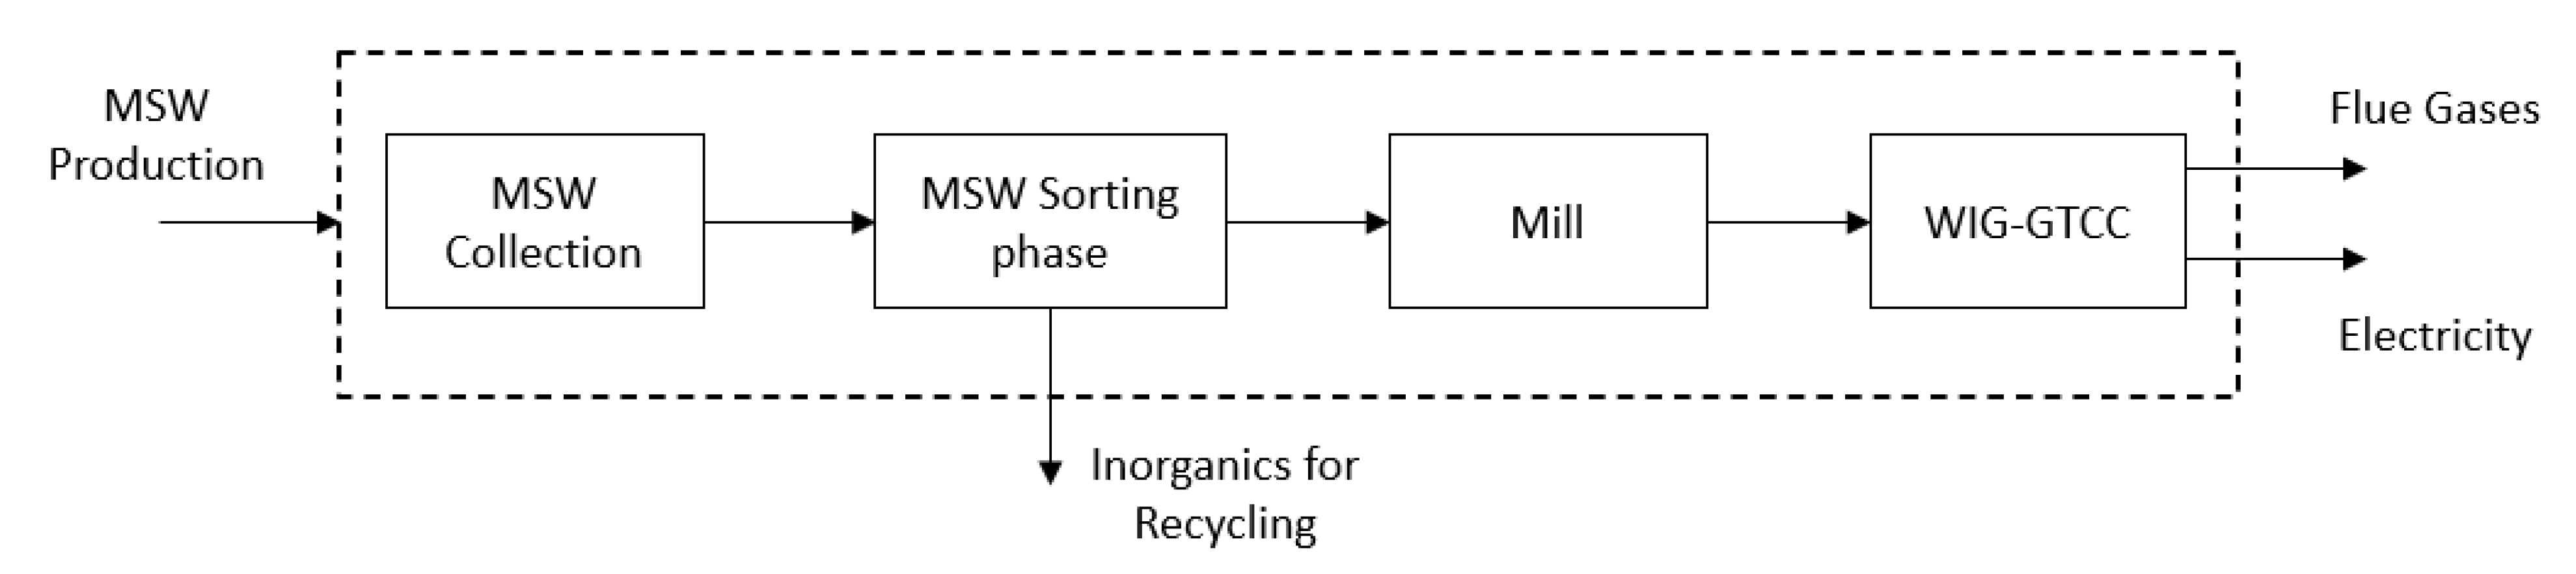
2. Studied Case
3. Economic Appraisal Methodology for the WIG-GTCC’s Incorporation into MSW Treatment
4. Methodology for Determining the Impact Indicators for MSW’s Gasification for Power Generation in Chile
4.1. Goal and Scope Definition
4.2. Life Cycle Inventory (LCI)
4.3. Power Generation
4.4. Emissions from the Syngas Combustion
4.5. Environmental Life Cycle Impact Assessment (ELCIA)
5. Results and Discussion
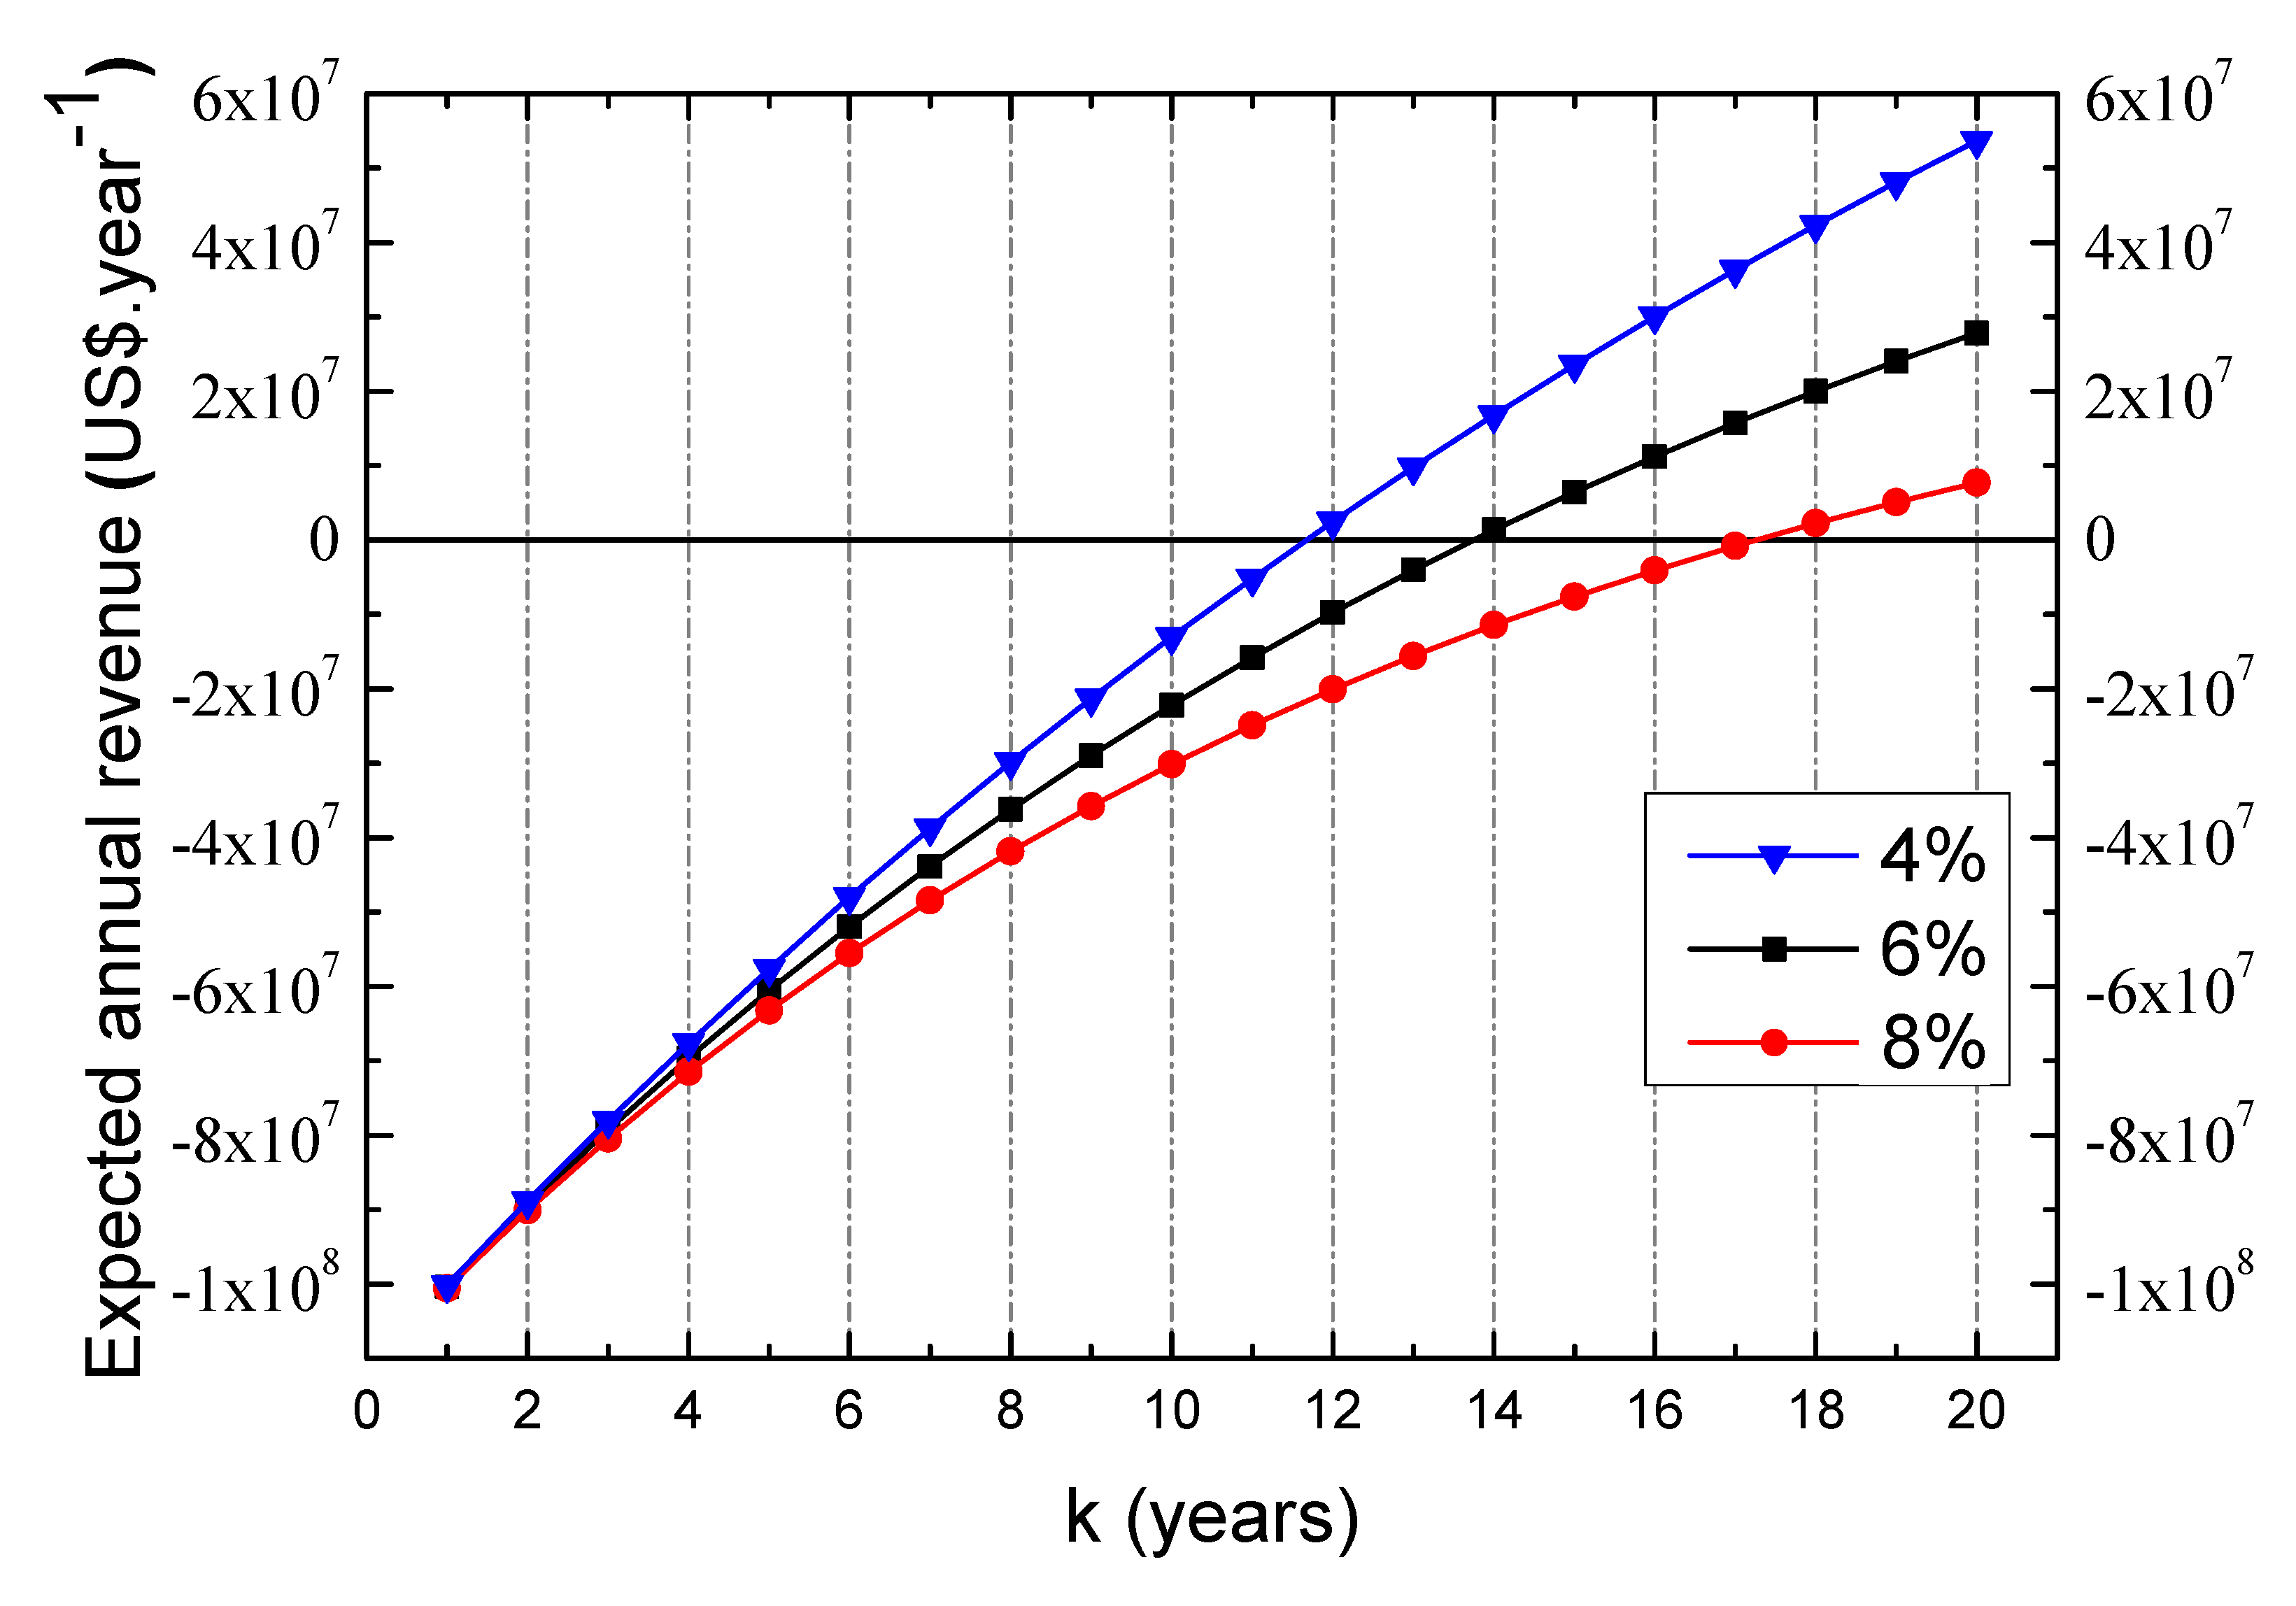
5.1. Economic Analysis of the WIG-GI TCC Incorporation in the MSW Treatment
5.2. Results of the Environmental Impact Assessment
6. Conclusions
Author Contributions
Funding
Data Availability Statement
Conflicts of Interest
Nomenclature
| Acidification potential (kg SO2 eq.) | |
| Air pollution control | |
| Ash removal cost (USD$·year−1) | |
| Costs of auxiliary services (USD$) | |
| Costs of ash transport (USD$·year−1) | |
| Ash removal cost (USD$·t−1) | |
| Ash transport cost (USD$·t−1) | |
| The remuneration of the employed personnel (USD$·unit−1year−1) | |
| Transportation operations personnel rate (USD$·unit−1year−1) | |
| Vehicle transporting costs (USD$·km−1) | |
| Updated equipment costs to the year 2020 (USD$) | |
| Equipment reference cost (USD$) | |
| Chemical Engineering Plant Cost Index of 2020 | |
| Cost Index of the reference year of the Chemical Engineering Plant | |
| Costs of the civil works (USD$) | |
| Direct costs (USD$) | |
| Direct installation costs (USD$) | |
| Total distance covered annually (km·year−1) | |
| Uniform distribution density of MSW (t·km−2year−1) | |
| Electricity costs (USD$) | |
| Engineering costs (USD$) | |
| Current market electricity price (USD$·kWh−1) | |
| Eutrophication potential (kg of PO4 eq.) | |
| Financial charges (USD$) | |
| Annual cash flow in the year k (USD$) | |
| Government subsidies (USD$·t−1) | |
| Gasification | |
| Global Warming Potential over 100 years (kg CO2 eq.) | |
| Human toxicity | |
| Indirect costs (USD$) | |
| General and insurance costs (USD$·year−1) | |
| Incineration | |
| Internal rate of return | |
| Number of years | |
| Life cycle assessment. | |
| Life cycle inventory | |
| Life Cycle Impact Assessment | |
| Landfill disposal | |
| Maintenance costs (USD$·year−1) | |
| Ash flow rate (t·year−1) | |
| Flow rate of MSW feeding the reactor (kg·h−1) | |
| HRSG steam flow produced (kg·h−1) | |
| Municipal solid waste | |
| Waste flow rate (t·year−1) | |
| Net present value (USD$) | |
| Number of personnel that works annually (unit) | |
| Number of employees in transport operations (unit) | |
| Plant´s annual operation hours (h·year−1) | |
| Operative labor costs (USD$·year−1) | |
| Pipeline costs (USD$) | |
| Purchased equipment costs (USD$) | |
| Revenue (USD$·year−1) | |
| Refuse Derived Fuel | |
| Site preparation and instrumentation costs (USD$) | |
| Start-up costs (USD$) | |
| Taxes (USD$) | |
| Total investment cost (USD$) | |
| Total operation cost (USD$·year−1) | |
| Transportation personnel costs (USD$·year−1) | |
| Vehicle costs (USD$·year−1) | |
| Each vehicle capacity (t·vehicle−1) | |
| Plant’s net production of electric power for sale (MW) | |
| Gas turbine Power (MW) | |
| Net power (MW) | |
| Power generated by Rankine cycle (MW) | |
| Waste transport costs (USD$·year−1) | |
| Subscript | |
| Dry MSW feeding the Gasifier | |
| GT | Gas turbine |
| HRSG | Heat Recovery Steam Generator |
| ST | Steam turbine |
| Greek letters | |
| Electricity generation efficiency (%) | |
| Global efficiencies (%) | |
| Electric motor efficiency (%) | |
| Acidification potential (kg SO2 eq.) |
References
- Chen, P.; Xie, Q.; Addy, M.; Zhou, W.; Liu, Y.; Wang, Y.; Cheng, Y.; Li, K.; Ruan, R. Utilization of Municipal Solid and Liquid Wastes for Bioenergy and Bioproducts Production. Bioresour. Technol. 2016, 215, 163–172. [Google Scholar] [CrossRef] [PubMed] [Green Version]
- Sharma, H.B.; Sarmah, A.K.; Dubey, B. Hydrothermal Carbonization of Renewable Waste Biomass for Solid Biofuel Production: A Discussion on Process Mechanism, the Influence of Process Parameters, Environmental Performance and Fuel Properties of Hydrochar. Renew. Sustain. Energy Rev. 2020, 123, 109761. [Google Scholar] [CrossRef]
- Hameed, Z.; Aslam, M.; Khan, Z.; Maqsood, K.; Atabani, A.E.; Ghauri, M.; Khurram, M.S.; Rehan, M.; Nizami, A.S. Gasification of Municipal Solid Waste Blends with Biomass for Energy Production and Resources Recovery: Current Status, Hybrid Technologies and Innovative Prospects. Renew. Sustain. Energy Rev. 2021, 136, 110375. [Google Scholar] [CrossRef]
- Campuzano, F.; Brown, R.C.; Martínez, J.D. Auger Reactors for Pyrolysis of Biomass and Wastes. Renew. Sustain. Energy Rev. 2019, 102, 372–409. [Google Scholar] [CrossRef]
- Sabki, M.H.; Lee, C.T.; Bong, C.P.C.; Zhang, Z.; Li, C.; Klemeš, J.J. Sustainable Organic Waste Management Framework: A Case Study in Minhang District, Shanghai, China. Chem. Eng. Trans. 2019, 72, 7–12. [Google Scholar] [CrossRef]
- Hansen, S.; Mirkouei, A.; Diaz, L.A. A Comprehensive State-of-Technology Review for Upgrading Bio-Oil to Renewable or Blended Hydrocarbon Fuels. Renew. Sustain. Energy Rev. 2020, 118, 109548. [Google Scholar] [CrossRef]
- Chile Lidera Generación de Basura per Cápita En Sudamérica—La Tercera. Available online: https://www.latercera.com/noticia/chile-lidera-generacion-basura-per-capita-sudamerica/ (accessed on 25 September 2022).
- REMA. Sexto Reporte Del Estado Del Medio Ambiente 2021; REMA: Santiago de Chile, Chile, 2021. [Google Scholar]
- OECD. OECD Regulatory Policy Outlook 2021; OECD: Paris, France, 2021. [Google Scholar]
- SGS SIGA. Diagnostico de La Situacion Por Comuna y Por Region En Materia de RSD y Asimilables; SGS SIGA: Santiago de Chile, Chile, 2018. [Google Scholar]
- Wang, K.; Nakakubo, T. Comparative Assessment of Waste Disposal Systems and Technologies with Regard to Greenhouse Gas Emissions: A Case Study of Municipal Solid Waste Treatment Options in China. J. Clean. Prod. 2020, 260, 120827. [Google Scholar] [CrossRef]
- Sipra, A.T.; Gao, N.; Sarwar, H. Municipal Solid Waste (MSW) Pyrolysis for Bio-Fuel Production: A Review of Effects of MSW Components and Catalysts. Fuel Process. Technol. 2018, 175, 131–147. [Google Scholar] [CrossRef]
- Gao, N.; Humphrey Milandile, M.; Tariq Sipra, A.; Su, S.; Miskolczi, N.; Quan, C. Co-Pyrolysis of Municipal Solid Waste (MSW) and Biomass with Co/Sludge Fly Ash Catalyst. Fuel 2022, 322, 124127. [Google Scholar] [CrossRef]
- Macrì, D.; Cassano, K.; Pierro, A.; Le Pera, A.; Giglio, E.; Muraca, E.; Farinelli, P.; Freda, C.; Catizzone, E.; Giordano, G.; et al. Electromagnetic Induction-Assisted Pyrolysis of Pre-Treated MSW: Modelling and Experimental Analysis. Fuel Process. Technol. 2022, 233, 107297. [Google Scholar] [CrossRef]
- Czajczyńska, D.; Anguilano, L.; Ghazal, H.; Krzyżyńska, R.; Reynolds, A.J.; Spencer, N.; Jouhara, H. Potential of Pyrolysis Processes in the Waste Management Sector. Therm. Sci. Eng. Prog. 2017, 3, 171–197. [Google Scholar] [CrossRef]
- Liu, J.; Li, Z.; Zhang, W.; Jin, H.; Xing, F.; Chen, C.; Tang, L.; Wang, Y. Valorization of Municipal Solid Waste Incineration Bottom Ash (MSWIBA) into Cold-Bonded Aggregates (CBAs): Feasibility and Influence of Curing Methods. Sci. Total Environ. 2022, 843, 157004. [Google Scholar] [CrossRef]
- Dou, X.; Ren, F.; Nguyen, M.Q.; Ahamed, A.; Yin, K.; Chan, W.P.; Chang, V.W.-C. Review of MSWI Bottom Ash Utilization from Perspectives of Collective Characterization, Treatment and Existing Application. Renew. Sustain. Energy Rev. 2017, 79, 24–38. [Google Scholar] [CrossRef]
- Mendiburu, A.Z.; Carvalho, J.A.; Zanzi, R.; Coronado, C.R.; Silveira, J.L. Thermochemical Equilibrium Modeling of a Biomass Downdraft Gasifier: Constrained and Unconstrained Non-Stoichiometric Models. Energy 2014, 71, 624–637. [Google Scholar] [CrossRef]
- Basu, P. Gasification Theory. In Biomass Gasification, Pyrolysis and Torrefaction; Elsevier: Amsterdam, The Netherlands, 2013; pp. 199–248. [Google Scholar]
- Reed, T.; Das, A. Handbook of Biomass Downdraft Gasifier Engine Systems; Biomass Energy Foundation: Golden, CO, USA, 1988; Volume 148. [Google Scholar]
- Basu, P. Gasification Theory: Practical Design and Theory; Elsevier: Amsterdam, The Netherlands, 2018; ISBN 9780128129920. [Google Scholar]
- Edwards, D.; Eng, P. Scaling Up Bioenergy Technologies. Chem. Eng. Prog 2015, 111, 58–61. [Google Scholar]
- Dai, J.; Cui, H.; Grace, J.R. Biomass Feeding for Thermochemical Reactors. Prog. Energy Combust. Sci. 2012, 38, 716–736. [Google Scholar] [CrossRef]
- Mishra, S.; Upadhyay, R.K. Review on Biomass Gasification: Gasifiers, Gasifying Mediums, and Operational Parameters. Mater. Sci. Energy Technol. 2021, 4, 329–340. [Google Scholar] [CrossRef]
- Prins, M.J. Thermodynamic Analysis of Biomass Gasification and Torrefaction; Technische Universiteit Eindhoven: Eindhoven, The Netherlands, 2005. [Google Scholar]
- Pedroso, D.T.; Machin, E.B.; Proenza Pérez, N.; Braga, L.B.; Silveira, J.L. Technical Assessment of the Biomass Integrated Gasification/Gas Turbine Combined Cycle (BIG/GTCC) Incorporation in the Sugarcane Industry. Renew. Energy 2017, 114, 464–479. [Google Scholar] [CrossRef] [Green Version]
- Gas Turbine World 2012 Handbook; Pequot Publishing Inc.: Southport, CT, USA, 2012. Available online: https://gasturbineworld.com/shop/annual-handbook/2012-handbook-volume-29/ (accessed on 1 September 2022).
- Stevens, D.J. Hot Gas Conditioning: Recent Progress with Larger-Scale Biomass Gasification Systems; National Renewable Energy Lab.(NREL): Golden, CO, USA, 2001; p. 103. [Google Scholar] [CrossRef] [Green Version]
- Worley, M.; Yale, J. Biomass Gasification Technology Assessment Consolidated Report Biomass Gasification Technology Assessment Consolidated Report; National Renewable Energy Lab.(NREL): Golden, CO, USA, 2012. [Google Scholar]
- Worley, M.; Yale, J. Biomass Gasification Technology Assessment. Ind. Eng. Chem. Res. 2012. [Google Scholar] [CrossRef]
- Paisley, M.A.; Anson, D. Biomass Gasification for Gas Turbine-Based Power Generation. J. Eng. Gas Turbines Power 1998, 120, 284–288. [Google Scholar] [CrossRef]
- Grift, J.M.; Conradie, R.E.; Fransen, S.; Verhoeff, F. Micro Gas Turbine Operation with Biomass Producer Gas. 15th Eur. Biomass Conf. 2007, 1–5. [Google Scholar] [CrossRef] [Green Version]
- Larson, E.D.; Williams, R.H.; Leal, M.R.L.V. A Review of Biomass Integrated-Gasifier/Gas Turbine Combined Cycle Technology and Its Application in Sugarcane Industries, with an Analysis for Cuba. Energy Sustain. Dev. 2001, 5, 54–76. [Google Scholar] [CrossRef]
- Jankes, G.; Trninic, M.; Stamenic, M.; Simonovic, T.; Tanasic, N.; Labus, J. Biomass Gasification with CHP Production: A Review of State of the Art Technology and near Future Perspectives. Therm. Sci. 2012, 16, 115–130. [Google Scholar] [CrossRef]
- Rodrigues, L.F.; dos Santos, I.F.S.; dos Santos, T.I.S.; Barros, R.M.; Tiago Filho, G.L. Energy and Economic Evaluation of MSW Incineration and Gasification in Brazil. Renew. Energy 2022, 188, 933–944. [Google Scholar] [CrossRef]
- Sansaniwal, S.K.; Pal, K.; Rosen, M.A.; Tyagi, S.K. Recent Advances in the Development of Biomass Gasi Fi Cation Technology: A Comprehensive Review. Renew. Sustain. Energy Rev. 2017, 72, 363–384. [Google Scholar] [CrossRef]
- Chen, W.H.; Lin, B.J.; Huang, M.Y.; Chang, J.S. Thermochemical Conversion of Microalgal Biomass into Biofuels: A Review. Bioresour. Technol. 2015, 184, 314–327. [Google Scholar] [CrossRef] [PubMed]
- Campoy, M.; Gómez-Barea, A.; Ollero, P.; Nilsson, S. Gasification of Wastes in a Pilot Fluidized Bed Gasifier. Fuel Process. Technol. 2014, 121, 63–69. [Google Scholar] [CrossRef]
- Nixon, J.D.; Dey, P.K.; Ghosh, S.K.; Davies, P.A. Evaluation of Options for Energy Recovery from Municipal Solid Waste in India Using the Hierarchical Analytical Network Process. Energy 2013, 59, 215–223. [Google Scholar] [CrossRef]
- Yang, Y.; Liew, R.K.; Tamothran, A.M.; Foong, S.Y.; Yek, P.N.Y.; Chia, P.W.; Van Tran, T.; Peng, W.; Lam, S.S. Gasification of Refuse-Derived Fuel from Municipal Solid Waste for Energy Production: A Review. Environ. Chem. Lett. 2021, 19, 2127–2140. [Google Scholar] [CrossRef]
- Luz, F.C.; Rocha, M.H.; Lora, E.E.S.; Venturini, O.J.; Andrade, R.V.; Leme, M.M.V.; Del Olmo, O.A. Techno-Economic Analysis of Municipal Solid Waste Gasification for Electricity Generation in Brazil. Energy Convers. Manag. 2015, 103, 321–337. [Google Scholar] [CrossRef]
- Klinghoffer, N.B.; Castaldi, M.J. Gasification and Pyrolysis of Municipal Solid Waste (MSW). In Waste to Energy Conversion Technology; Elsevier: Amsterdam, The Netherlands, 2013; pp. 146–176. ISBN 9780857090119. [Google Scholar]
- Bridgwater, A.V. Review of Fast Pyrolysis of Biomass and Product Upgrading. Biomass Bioenergy 2012, 38, 68–94. [Google Scholar] [CrossRef]
- Jana, K.; De, S. Biomass Integrated Gasification Combined Cogeneration with or without CO2 Capture—A Comparative Thermodynamic Study. Renew. Energy 2014, 72, 243–252. [Google Scholar] [CrossRef]
- Babu, S. Thermal Gasification of Biomass Technology Developments: End of Task Report for 1992 to 1994. Biomass Bioenergy 1995, 9, 271–285. [Google Scholar] [CrossRef]
- Pedroso, D.T.; Machín, E.B.; Silveira, J.L.; Nemoto, Y. Experimental Study of Bottom Feed Updraft Gasifier. Renew. Energy 2013, 57, 311–316. [Google Scholar] [CrossRef]
- Grammelis, P.; Margaritis, N.; Karampinis, E. Solid Fuel Types for Energy Generation. In Fuel Flexible Energy Generation; lsevier: Amsterdam, The Netherlands, 2016; pp. 29–58. [Google Scholar]
- Aguado, R.; Vera, D.; Jurado, F.; Beltrán, G. An Integrated Gasification Plant for Electric Power Generation from Wet Biomass: Toward a Sustainable Production in the Olive Oil Industry. Biomass Convers. Biorefinery 2022. [Google Scholar] [CrossRef]
- Devi, L.; Ptasinski, K.J.; Janssen, F.J.J.G. A Review of the Primary Measures for Tar Elimination in Biomass Gasification Processes. Biomass Bioenergy 2003, 24, 125–140. [Google Scholar] [CrossRef]
- Hasler, P.; Nussbaumer, T. Gas Cleaning for IC Engine Applications from Fixed Bed Biomass Gasification. Biomass Bioenergy 1999, 16, 385–395. [Google Scholar] [CrossRef]
- Asadullah, M. Barriers of Commercial Power Generation Using Biomass Gasification Gas: A Review. Renew. Sustain. Energy Rev. 2014, 29, 201–215. [Google Scholar] [CrossRef]
- Zhang, W.; Liu, H.; Ul Hai, I.; Neubauer, Y.; Schröder, P.; Oldenburg, H.; Seilkopf, A.; Kolling, A. Gas Cleaning Strategies for Biomass Gasification Product Gas. Int. J. Low-Carbon Technol. 2012, 7, 69–74. [Google Scholar] [CrossRef]
- Methods for Calculating CHP Efficiency|US EPA. Available online: https://www.epa.gov/chp/methods-calculating-chp-efficiency (accessed on 15 April 2022).
- Wang, C.; Song, J.; Zheng, W.; Liu, Z.; Lin, C. Analysis of Economy, Energy Efficiency, Environment: A Case Study of the CHP System with Both Civil and Industrial Heat Users. Case Stud. Therm. Eng. 2022, 30, 101768. [Google Scholar] [CrossRef]
- Caputo, A.C.; Palumbo, M.; Pelagagge, P.M.; Scacchia, F. Economics of Biomass Energy Utilization in Combustion and Gasification Plants: Effects of Logistic Variables. Biomass Bioenergy 2005, 28, 35–51. [Google Scholar] [CrossRef]
- Lozowski, D. (Ed.) The Chemical Engineering Plant Cost Index; Chemical Engineering: New York, NY, USA, 2020. [Google Scholar]
- Braga, L.B.; Silveira, J.L.; Da Silva, M.E.; Tuna, C.E.; Machin, E.B.; Pedroso, D.T. Hydrogen Production by Biogas Steam Reforming: A Technical, Economic and Ecological Analysis. Renew. Sustain. Energy Rev. 2013, 28, 166–173. [Google Scholar] [CrossRef]
- Aleluia, J.; Ferrão, P. Assessing the Costs of Municipal Solid Waste Treatment Technologies in Developing Asian Countries. Waste Manag. 2017, 69, 592–608. [Google Scholar] [CrossRef]
- Taylor-de-Lima, R.L.N.; Gerbasi da Silva, A.J.; Legey, L.F.L.; Szklo, A. Evaluation of Economic Feasibility under Uncertainty of a Thermochemical Route for Ethanol Production in Brazil. Energy 2018, 150, 363–376. [Google Scholar] [CrossRef]
- Dirbeba, M.J.; Brink, A.; DeMartini, N.; Zevenhoven, M.; Hupa, M. Potential for Thermochemical Conversion of Biomass Residues from the Integrated Sugar-Ethanol Process—Fate of Ash and Ash-Forming Elements. Bioresour. Technol. 2017. [Google Scholar] [CrossRef]
- Anukam, A.; Mamphweli, S.; Reddy, P.; Meyer, E. Pre-Processing of Sugarcane Bagasse for Gasi Fi Cation in a Downdraft Biomass Gasi Fi Er System: A Comprehensive Review. 2016, 66, 775–801. Renew. Sustain. Energy Rev. 2016, 66, 775–801. [Google Scholar] [CrossRef] [Green Version]
- Alzate, S.; Restrepo-Cuestas, B.; Jaramillo-Duque, Á. Municipal Solid Waste as a Source of Electric Power Generation in Colombia: A Techno-Economic Evaluation under Different Scenarios. Resource 2019, 8, 51. [Google Scholar] [CrossRef] [Green Version]
- Khoo, H.H. Life Cycle Impact Assessment of Various Waste Conversion Technologies. Waste Manag. 2009, 29, 1892–1900. [Google Scholar] [CrossRef]
- Arena, U.; Ardolino, F.; Di Gregorio, F. A Life Cycle Assessment of Environmental Performances of Two Combustion- and Gasification-Based Waste-to-Energy Technologies. Waste Manag. 2015, 41, 60–74. [Google Scholar] [CrossRef] [PubMed]
- Dong, J.; Tang, Y.; Nzihou, A.; Chi, Y.; Weiss-Hortala, E.; Ni, M. Life Cycle Assessment of Pyrolysis, Gasification and Incineration Waste-to-Energy Technologies: Theoretical Analysis and Case Study of Commercial Plants. Sci. Total Environ. 2018, 626, 744–753. [Google Scholar] [CrossRef]
- Zaman, A.U. Comparative Study of Municipal Solid Waste Treatment Technologies Using Life Cycle Assessment Method. Int. J. Environ. Sci. Technol. 2010, 7, 225–234. [Google Scholar] [CrossRef] [Green Version]
- Iqbal, A.; Liu, X.; Chen, G.H. Municipal Solid Waste: Review of Best Practices in Application of Life Cycle Assessment and Sustainable Management Techniques. Sci. Total Environ. 2020, 729, 138622. [Google Scholar] [CrossRef] [PubMed]
- González, P.; Riveros, S.; Concha, S.; Casas, Y. Waste-to-Energy Options within a Circular Economy Strategy in a Developing Country: The Case of the Bio Bio Region in Chile. Int. J. Energy Prod. Manag. 2018, 3, 144–156. [Google Scholar] [CrossRef]
- ASTM D5231-92(2008); Standard Test Method for Determination of the Composition of Unprocessed Municipal Solid Waste. ASTM International: West Conshohocken, PA, USA, 2008.
- Characterization of Municipal Solid Waste; Instituto Nacional de Normalización: Santiago de Chile, Chile. Available online: https://archive.epa.gov/epawaste/nonhaz/municipal/web/pdf/msw97rpt.pdf (accessed on 1 September 2022).
- Tang, Y.; Dong, J.; Li, G.; Zheng, Y.; Chi, Y.; Nzihou, A.; Weiss-Hortala, E.; Ye, C. Environmental and Exergetic Life Cycle Assessment of Incineration- and Gasification-Based Waste to Energy Systems in China. Energy 2020, 205, 118002. [Google Scholar] [CrossRef]
- Njoku, P.O.; Edokpayi, J.N.; Odiyo, J.O. Health and Environmental Risks of Residents Living Close to a Landfill: A Case Study of Thohoyandou Landfill, Limpopo Province, South Africa. Int. J. Environ. Res. Public Health 2019, 16, 2125. [Google Scholar] [CrossRef] [PubMed] [Green Version]
- Whitty, K.J.; Zhang, H.R.; Eddings, E.G. Emissions from Syngas Combustion. Combust. Sci. Technol. 2008, 180, 1117–1136. [Google Scholar] [CrossRef]


| Point | 1 (MSW) | 2 (Ash) | 3 (Air) | 4 (Producer Gas) | 5 (Volatile Ash) | 6 (Air) |
|---|---|---|---|---|---|---|
| Mass flow (kg·s−1) | 4.06 | 0.406 | 5.85 | 9.5 | 0.032 | 5.85 |
| Temperature K (°C) | 473 (200) | 823 (550) | 823 (550) | 288 (15) | ||
| Enthalpy (kJ·kg−1) | 753.6 | 1764 | ||||
| LHV (kJ·kg−1) | 19713.8 | 5900 | ||||
| Point | 7 (Producer gas) | 8 (Producer gas) | 9 (Water) | 10 (Producer gas) | 11 (Water) | 12 (Producer gas) |
| Mass flow (kg·s−1) | 9.5 | 9.5 | 42.5 | 9.02 | 42 | 9.02 |
| Temperature K (°C) | 823 (550) | 317 (44 °C) | 308 K (35 °C) | 314.6 (41.6) | 288 (15) | 642 (369) |
| Enthalpy (kJ·kg−1) | 1064 | 412.1 | 146.1 | 408.9 | 62.6 | 789.66 |
| LHV (kJ·kg−1) | 5900 | 5900 | 5900 | 5900 | ||
| Point | 13 (Air) | 14 (Air) | 15 (Exhaust gases) | 16 (Exhaust gases) | 17 (Exhaust gases) | 18 (Exhaust gases) |
| Mass flow (kg·s−1) | 57.9 | 57.9 | 67 | 67 | 67 | 67 |
| Temperature K (°C) | 298 (15) | 685 (412) | 1396 (1123) | 822 (559) | 495 (222) | 431 (158) |
| Pressure (kPa) | 101.3 | 1520 | 1520 | 101.3 | 101.3 | 101.3 |
| Point | 20 (Subcooled liquid) | 21 (Saturated liquid) | 22 (Superheated steam) | 23 (Superheated steam) | 24 (Saturated liquid) | |
| Mass flow (kg·s−1) | 7.15 | 7.15 | 7.15 | 7.15 | 7.15 | |
| Pressure (MPa) | 0.5 | 0.5 | 0.5 | 0.006 | 0.006 | |
| Enthalpy (kJ·kg−1) | 151.5 | 640.2 | 3188 | 2618 | 151.5 | |
| Point | 25 (Power of the gas turbine) | 26 (Power of the steam turbine) | 27 (Gross power) | Efficiencies | 28 (Power consumed by the mill) | 29 (Power consumed by gasification island) |
| Power (kW) | 15,623.7 | 3953.2 | 19,576.9 | Rgas cycle: 25.7% Rsteam cycle: 21.7% Rcombine cycle: 44.5% | 276.4 | 1249.9 |
| Plant Section | Equipment Plant | PE Correlation (USD) |
|---|---|---|
| Power generation | Steam turbine | 806,054WST0.398 |
| Gasifier | 2037MG/CC0.917 | |
| Turbo-gas group | 4839WGT0.754 | |
| HRSG | 8328MHRSG0.81 | |
| Condenser | 506,808WST0.333 | |
| Heat exchanger (cooling water) | 65,579WST 0.5129 | |
| Alternator | 176,109WST 0.6107 | |
| Fans | 44,951WST 0.3139 | |
| Condensate extraction pumps | 11,460WST 0.4425 | |
| Feed pumps | 44,569WST 0.6107 | |
| Pumps | 35,655WST 0.5575 | |
| Waste storage-handing | Waste storage | 145,294WNE0.5575 |
| Waste handling | 59,340WNE0.9554 | |
| Dryers and compressor | 14,517WNE0.5575 | |
| Emergency fuel (Diesel) | 46,097WNE0.1989 | |
| Heat-recovery dryer | 12,225MG/CC0.65 | |
| Exhaust treatment | SOx and NOx removal equipment | 160,447WNE0.5882 |
| Exhaust purification | 84,808WNE0.7565 | |
| Ashes storage | 112,440WNE0.3139 | |
| Ashes extraction | 119,062WNE0.4425 | |
| Fans | 36,292WNE0.5575 | |
| Fumes ductworks | 65,579WNE0.5129 | |
| Discharge stack | 36,292WNE0.5575 | |
| Accessories | Accessories installation | Cost correlation (USD) |
| Piping | Firefighting tank | 109,129WNE0.1040 |
| Firefighting components | 6749WNE0.7565 | |
| Firefighting system | 8404WNE0. 7565 | |
| Industrial water tank | 11,843WNE0. 7565 | |
| Tanks | 13,116WNE0. 5129 | |
| Heat exchanger | 43,550WNE0. 5575 | |
| Degasifier | 21,775WNE0. 5575 | |
| Low-pressure valves | 26,232WNE0.5129 | |
| High-pressure valves | 36,292WNE0. 5575 | |
| Control valves | 12,861WNE0. 6756 | |
| Valves | 36,292WNE0. 5575 | |
| Pipes | 53,864WNE0. 885 | |
| Pipe rack | 15,408WNE0. 686 | |
| Electrical | Switches | 17,063WNE0. 3672 |
| Electric protections | 56,920WNE0.2266 | |
| Transformer | 82,261WNE0.4289 | |
| Auxiliary transformer | 17,827WNE0.4425 | |
| Electrical equipment | 520,943WNE0.6415 | |
| Assembly | 237,996WNE0.7137 | |
| Civil works | Buildings’ yard guards | 89,264WNE0.4425 |
| Conditioning plant and ventilation system | 29,797WNE0.6328 | |
| Civil works | 1,703,028WNE0.3672 | |
| Personnel of building yard | 170,252WNE0.3672 | |
| Buildings yard facilities | 16,936WNE0.7565 | |
| Wastewater treatment | 8786WNE0.6107 |
| Cost Component | Equation |
|---|---|
| Operative labor (USD·year−1) | |
| Ash transport (USD·year−1) | |
| Ash removal (USD·year−1) | |
| Waste transport (USD·year−1) | |
| Maintenance (USD·year−1) | |
| Insurance and general (USD·year−1) |
| Input | Unit | Value |
|---|---|---|
| MSW | kg | 1000 |
| Electricity | kWh | 100 |
| Diesel | L | 7.7 |
| Limestone | kg | 4.3 |
| Output | ||
| Electricity | kWh | 1035.28 |
| Heat | MJ | 0 |
| Emissions | ||
| CO2, fossil | kg | 331.4 |
| CO | kg | 0.2 |
| SO2 | kg | 0.1 |
| NOx | kg | 0.1 |
| HCl | kg | 0 |
| Dust | kg | 0 |
| Dioxins | kg I-TEQ | 2.5 × 10⁻⁷ |
| Solid Residues | ||
| Ashes | kg | 120 |
| APC residues | kg | 20 |
| Impact Category | Reference Unit | Landfilling a | WIG-GTCC | Gasification a | Incineration a |
|---|---|---|---|---|---|
| Per ton | |||||
| AP | kg SO2 eq. | 0.2 | −1.7 | −3.1 | −2.9 |
| GWP100 | kg CO2 eq. | 516 | −134 | −135 | −148 |
| EPOT | kg PO4 eq. | 0.1 | 0.1 | 0.2 | 0.9 |
| HTP | kg 1.4 DB eq. | 16 | −466 | −661 | −15 |
| Per kWh | |||||
| AP | kg SO2 eq. | - | −0.0013 | −0.0045 | −0.0036 |
| GWP100 | kg CO2 eq. | - | 0.2852 | 0.5916 | 0.4874 |
| EPOT | kg PO4 eq. | - | 0.0001 | 0.0005 | 0.0014 |
| HTP | Kg 1.4 DB | - | −0.3359 | −1.0016 | 0.0013 |
Publisher’s Note: MDPI stays neutral with regard to jurisdictional claims in published maps and institutional affiliations. |
© 2022 by the authors. Licensee MDPI, Basel, Switzerland. This article is an open access article distributed under the terms and conditions of the Creative Commons Attribution (CC BY) license (https://creativecommons.org/licenses/by/4.0/).
Share and Cite
Machin, E.B.; Pedroso, D.T.; Acosta, D.G.; Silva dos Santos, M.I.; de Carvalho, F.S.; Machín, A.B.; Neira Ortíz, M.A.; Arriagada, R.S.; Travieso Fernández, D.I.; Braga Maciel, L.B.; et al. Techno-Economic and Environmental Assessment of Municipal Solid Waste Energetic Valorization. Energies 2022, 15, 8900. https://doi.org/10.3390/en15238900
Machin EB, Pedroso DT, Acosta DG, Silva dos Santos MI, de Carvalho FS, Machín AB, Neira Ortíz MA, Arriagada RS, Travieso Fernández DI, Braga Maciel LB, et al. Techno-Economic and Environmental Assessment of Municipal Solid Waste Energetic Valorization. Energies. 2022; 15(23):8900. https://doi.org/10.3390/en15238900
Chicago/Turabian StyleMachin, Einara Blanco, Daniel Travieso Pedroso, Daviel Gómez Acosta, Maria Isabel Silva dos Santos, Felipe Solferini de Carvalho, Adrian Blanco Machín, Matías Abner Neira Ortíz, Reinaldo Sánchez Arriagada, Daniel Ignacio Travieso Fernández, Lúcia Bollini Braga Maciel, and et al. 2022. "Techno-Economic and Environmental Assessment of Municipal Solid Waste Energetic Valorization" Energies 15, no. 23: 8900. https://doi.org/10.3390/en15238900