
Pore-Scale Simulation of Gas and Water Two-Phase Flow in Rough-Walled Fractures Using the Volume of Fluid Method
by
Qingzhong Zhu
1, 
Yanhui Yang
1,
Xueying Zhang
1,
Sanshuai Wang
1,
Jinzhao Yang
2,3 and
Jiyuan Zhang
2,3,* 1
PetroChina Huabei Oilfield Company, Renqiu 062552, China
2
Key Laboratory of Unconventional Oil & Gas Development, China University of Petroleum (East China), Qingdao 266580, China
3
School of Petroleum Engineering, China University of Petroleum (East China), Qingdao 266580, China
*
Author to whom correspondence should be addressed.
Energies 2022, 15(24), 9382; https://doi.org/10.3390/en15249382
Submission received: 8 November 2022
/
Revised: 25 November 2022
/
Accepted: 25 November 2022
/
Published: 11 December 2022
(This article belongs to the Special Issue Exploitation of Geological Resources in Unconventional Reservoirs)
Abstract
:The gas and water flow behavior in rough-walled hydrophilic fractures at the pore scale is crucial for understanding the gas production characteristics of naturally fractured formations. This paper presents a systematic analysis of the gas and water flow characteristics in both the single-fracture and Y-shaped junction fracture models using the volume of fluid (VOF) method. Numerical simulations showed that the gas/water rate ratio is the most significant factor influencing gas bubble/slug geometry, phase distribution, and saturation. The effect of fracture roughness and tortuosity is less significant than the gas/water ratio, whereas the total fluid rate has a negligible effect. For Y-shaped junction models, the phase distribution and referential pathways are predominantly controlled only by the channel aperture ratio, whereas the effect of the intersecting angle and fluid flow rate can be neglected.
1. Introduction
Natural gas from naturally fractured gas formations such as coal, shale, and carbonate is an important addition to global energy supplies [1,2,3]. Gas and water two-phase flows occur frequently in discrete fractures due to the presence of either inherent water or injected water-based fracturing fluids in these formations [4,5,6]. It is well recognized that the interactions of gas and water at pore scales exert profound effects on the spatial distribution and flow capacities of the fluids and thus the production characteristics [7,8,9].
To date, two categories of investigation tools, namely, laboratory microfluidics and numerical simulation, have been proposed to investigate the gas and water interaction behaviors at the pore scale. Microfluidics provides a platform to directly visualize multi-phase flows at micron-scale geometries [10]. A number of experiments have been conducted to investigate the gas and water flow patterns in a single fracture or complex fracture networks. Mansour et al. [11] investigated the gas and water flow pattern in a single-fracture micro-chip model. Wang et al. [12] performed gas and water flow experiments on a microchip model representing carbonate reservoirs and proposed several gas trapping patterns. Chen et al. [13] investigated the relative permeability of gas and water in a Y-junction fracture model subject to varying fluid flow rates. Gerami et al. [14] performed gas and water flow tests on both fork-shaped fracture networks and coal cleat chip models. The previous experimental work gave direct observations of how gas and water interact at the pore scale. However, most of these previous works used microchip models with specific wall roughness and thus did not provide insights into how the fracture roughness affects the flow pattern. Another issue with the microfluidic method is the interpretation accuracy due to the limitation of image resolution. The image resolution of current commercial microscopes is generally on the magnitude of micrometers. However, if the wall roughness is on the magnitude of nanometers, the recorded images are incapable of capturing the accurate fluid distribution on the rough surface. Besides, microfluidic experiments are usually quite expensive and require the integration of specially designed microfluidic chips, microscope(s), and high-speed digital camera(s).
Compared with the microfluidic experiment, numerical simulations are generally less expensive, more versatile, and provide rapid predictions for a large range of flow conditions [15,16]. To date, various methods have been proposed for simulating multiphase flow at the pore scale (or mesoscale), among which, pore network modeling (PNM) and computational fluid dynamics (CFD) are the most widely used. The PNM performs simulations on conceptualized models consisting of simplified geometries of pores and throats rather than on the true geometry of the flow path [17,18,19]. Thus, the accuracy of the PNM depends heavily on the accuracy of the reconstructed discrete physical pore–throat model. It is recognized that the PNM is incapable of producing reliable predictions of fluid–solid interactions and flow characteristics for geometric models with high irregularity [20]. Moreover, the PNM requires a predefinition of certain mechanisms such as the snap-off and pore-filling [21,22] for modeling multiphase flows, which inevitably brings in additional errors.
Compared with the PNM method, the CFD method is capable of simulating fluid flows directly on true physical models with complex geometries and thus is considered to be more accurate than the PNM [23]. Moreover, the CFD method is capable of modeling a more complex multiphase flow that involves mix-wettability [24], heat transfer [25], and solid particle flow [26]. Among the various CFD methods, the LBM and VOF are the most commonly used for modeling two-phase flows in porous media at the mesoscale. The LBM method is superior to the VOF method in terms of convergence stability and conservation accuracy for simulating incompressible fluid flow [27,28]. However, conventional LBM is associated with the issue of numerical instability when simulating multiphase flow with a high density and viscosity ratio [29] (e.g., gas/water or gas/oil two-phase flow). Moreover, the LBM method has inherent difficulties in handling compressibility problems when compressible fluid(s) is(are) considered. The VOF method has an inherent advantage of mass conservation [30] and does not require a complex phase interface tracking algorithm that is important for calculating two-phase flow in complex geometric shapes [26]. Thus, the VOF method is more mature and reliable than the LBM for simulating multiphase flow with compressible fluid(s) and a large density/viscosity ratio in pathways with complex geometries. The underlying philosophy of VOF is to couple the Navier–Stokes equations with the volume fraction model and then solve the discretized equations with numerical computation techniques [31,32,33,34,35].
Although the VOF method has been proven to be capable of simulating compressible fluid flows in channels in meso- and macroscale sand packs or pipelines, very limited research has reported the use of the VOF method to investigate gas and water interactions in pore-scale fracture networks. To the best knowledge of the authors, the only paper that reported gas and water flow simulation in microscale fractures was by Huang et al. [36], who showed the accuracy of the CFD simulation for gas and water flow patterns in Y-junction models. However, all the simulations were based on smooth fractures, which do not conform to real rough fractures. Moreover, the model used by Huang et al. neglects the gas compressibility effects. This paper used the compressible VOF method to simulate two-phase gas and water flows in rough-walled single-fracture and Y-shaped junction models. The interactions between the two-phase fluids in different fracture geometries will be analyzed, and new insights will be discussed.
2. Methods
2.1. Numerical Simulation Method for Two-Phase Flow
The CFD methods used for simulating fluid flow have been extensively presented in previous papers (e.g., [37,38,39]). For the completeness of this paper, the basic mathematical models will be briefly addressed as follows.
The fluid flow considering fluid compressibility is written as:
where ρ, U, and P are phase density, velocity, and pressure, respectively. and F represent the sheer stress and surface tension, respectively.
For a two-phase flow problem, it is required that the fluid interface be captured with certain techniques such as the VOF and the Level-set (LS) methods. It is commonly recognized that the VOF is superior to the LS method in terms of mass conservation and the simulation accuracy in complex structures [40,41]. The basic philosophy behind the VOF method is to solve two single-phase flow problems independently outside the interfacial region and then couple the two-phase fluids in the interfacial region with specific assumptions and simplifications. The concept of volume fraction (α) is used to define the interfacial and non-interfacial zones, which is given as:
where Vi is the volume of the phase i, and Vf is the control volume. For a two-phase gas and water flow problem, we can assume that α = 0 and α = 1 represent the gaseous and water regions, respectively. For the interface region, the volume fraction falls in the range of (0, 1), and the fluid properties such as the density and viscosity can be approximated as [42]:
The VOF model describing the volume fraction is given as:
Equations (1), (2) and (6) are coupled and iteratively solved using the finite volume method.
In this study, all simulations were conducted using the compressibleInterFoam solver implemented in the open-source CFD toolbox OpenFoam (https://openfoam.org/, accessed on 24 November 2022). The compressibleInterFoam solver is capable of simulating compressible and immiscible two-phase flow with a non-isothermal effect. The VOF method is implemented in the solver to capture the fluid interface. For models considered in this study, we used the SnappyHexMesh toolbox to construct the meshing. The strategy that combines coarse and fine meshing was used in order to ensure accuracy while maintaining high computational accuracy. The coarse meshing and fine meshing were applied in the center and boundary regions, respectively. The maximum total number of grids was set to be 2 × 10⁶ considering Cha et al.’s simulation results [19] as a reference.
2.2. Validity Test of the VOF Method
To validate the accuracy of the VOF for simulating gas and water flow at the microscale, simulations were conducted and then compared with experimental results by Gerami et al. [14] and Mansour et al. [11] in this paper.
Gerami et al. [14] conducted the experiment of water charging into hydrophobic fork-shaped flow channels manufactured on polydimethylsiloxane (PDMS). The geometry of the flow channels is illustrated in Figure 1a. The flow channels were initially saturated with air. Deionized water was subsequently injected into the micro-channel at a constant flow rate of 1 μL/min. The distribution of water and air was recorded as the water invaded gradually into the flow channels. The experimental process was simulated in this paper, and the simulation results on gas/water distribution were compared with the experimental observations.
Mansour et al. [11] performed experiments on the simultaneous flow of water and gas (nitrogen) through a T-junction channel. The flow channel was manufactured using the UV lithography technique on PDMS material. The wall surface of the flow channel was modified using the oxygen plasma treatment to alter the wettability from hydrophobicity to hydrophilicity. The geometry of the T-junction channel used for experiments is illustrated in Figure 1b. Simulation scenarios with different gas/water ratios are to be conducted to identify the flow pattern, which will then be compared with the experimental results.
2.3. Simulation of Gas/Water Flow in Rough-Walled Fracture Models
Previous studies [43,44,45] and our preliminary tests showed that natural fractures are generally non-smooth and exhibit a certain degree of tortuosity (Figure 2a), which may affect fluid flow therein. For naturally fractured reservoirs, the geometry of the fracture system is complex and typically composed of a number of inter-connected single fractures with relatively large ranges of apertures [46,47]. Our preliminary tests confirmed that the basic joints of the intersected fractures are generally Y-shaped or T-shaped junctions (Figure 2b). As a matter of fact, the T-shape junctions can be considered as specific cases of Y-shaped junctions with a right intersecting angle.
2.3.1. Single-Fracture Model
The geometry of a basic single-fracture model is shown in Figure 3. The fracture length and mean aperture were set to be 4500 and 300 μm, respectively. The roughness of a fracture has been demonstrated previously to exert profound effects on fluid flow in microchannels [48,49]. It is well-recognized that almost all natural and hydraulic fractures are with a certain degree of roughness. In this study, the roughness is set by adding a random noise on the aperture along the fracture, which is quantitatively represented as the averaged deviations of the fracture wall inner surface from the average fracture aperture (Figure 3). The mathematical expression for calculating the roughness is:
where L is the length of a fracture; Z(x) is the distance between the inner surface and the averaged center of the fracture at point x; Z0 is the half of the average fracture aperture, which is quantitatively calculated as the average distance between the inner surface and the center of the of the fracture.
The tortuosity is defined as the ratio of the length of the true flow path to the geometrical length of the flow channel (Figure 3). Generally, a higher tortuosity results in an increased flow path length and thus increases the flow resistance [50,51]. To investigate the effect of the tortuosity on the two-phase flow, single-fracture models with varying tortuosity were synthetized. The synthesis of the torturous rough fractures includes three steps. First, two sine functions with different frequencies were used to generate the base trend lines of the fracture’s upper and lower wall boundaries, respectively. Second, the trend lines were shifted with a random frequency to form the wall boundary of the fracture. Third, both the upper and lower boundaries were added randomly distributed noises to represent rough walls. The true flow path was approximated as the middle points between the upper and lower boundaries of the fracture surface. To calculate the tortuosity, the true flow and the geometrical length were obtained using computer-aided design software.
To investigate the gas and water flow characteristics in single-fracture models, simulations were conducted considering the effect of roughness, tortuosity, flow rate, and gas/water ratio. The simulation scenarios are shown in Table 1. Since this paper is primarily concerned with low-velocity fluid flow in fractured gas reservoirs, relatively small flow rate values were considered to mimic the underground conditions. Previous studies [52,53] showed that most naturally fractured formations such as coal and carbonate are water-wet. However, the contact angle may vary significantly with mineral content, roughness, pressure, etc. Therefore, the inner wall surface was assumed to have a contact angle of 45°, which is the median between the complete water-wetting condition (with a contact angle of 0°) and the cutting-off value of the gas-wetting condition (with a contact angle of 90°). To simulate the “simultaneous” injection of gas and water, a T-junction representing two inlets was used (Figure 3). It is noted that the T-junction was assumed to have a smooth inner surface in order to ensure a complete mix of the two phases once injected into the fracture model. The water and gas flow into the fracture model at their respective constant flow rates through the horizontal and vertical inlets, respectively. The outlet was constrained with a constant pressure of 0.1 MPa.
2.3.2. Y-Shaped Fracture Junction Model
Different scenarios of Y-shaped fracture junction models were constructed to investigate the effect of Y-shaped junction geometry, flow rate, and gas/water ratio on the phase distribution. The basic Y-shaped junction model is shown in Figure 4. The roughness and gas/water ratio for the base model were assigned to be 0.4 and 1, respectively. Varying intersecting angles (30°, 60°, and 90°) and fracture aperture ratios were considered to investigate the fracture geometry on the phase distribution. The apertures of the inlet and the upper outlet remained fixed at 300 μm and 200 μm, respectively. The aperture of the lower outlet was varied at 200, 300, and 400 μm to examine the effect of the fracture aperture ratio.
Similar to the constraint conditions of the single-fracture models, for each Y-shaped junction model, gas and water were simultaneously injected through a T-junction into the fracture model at given flow rates. The outlets of the model were assumed to operate at a constant pressure of 0.1 MPa.
3. Results and Discussion
3.1. Validation of the VOF Method
Figure 5 depicts the comparison between the VOF method and Gerami et al.’s experimental results of the fluid distribution in the fork-shaped gas-wet channel model during the water invasion process. It can be seen that the VOF method is capable of accurately reproducing the experiment results. Both the experiment and simulation showed that the injected water first invaded into the largest channel and displaced the gas phase-out. As the injection continued, the water phase gradually invaded into the middle channel with the moderate aperture, whereas the narrowest channel was never invaded throughout the test. The underlying mechanism is quite straightforward because the resistance force to water flow decreases with the channel width due to the hydrophobic nature of the model; therefore, it is easier for the water phase to invade the larger channel with less resistance.
Figure 6 compares the simulation results with the experimental observations of the simultaneous flow of gas and water by Mansour et al. [8]. It is shown that the simulation results agree well with the experiment in terms of the bubble patterns (Figure 6a). Figure 6b compares the experimental and simulated bubble aspect ratio (BAR). The BAR is defined as the ratio of the bubble length along the major axis to that along the minor axis. In this study, the major and minor axes correspond to the directions along and perpendicular to the flow direction, respectively. The BAR is a basic parameter describing the shape of a bubble and reflects the underlying interactions between two fluids. It can be seen that the simulated and experimental BARs are also in fine agreement. The results shown in Figure 5 and Figure 6 confirm the validity of the VOF method for compressible two-phase flow in microscale channels.
3.2. Gas/Water Flow Simulations in Rough-Walled Single-Fracture Models
3.2.1. Effect of Roughness
Figure 7 depicts the gas and water distribution in the single-fracture models with different roughness. It can be seen that all the gas bubbles have generally identical sizes, and the bubbles are distributed evenly along the smooth fracture (with zero roughness). As the roughness increases, the shape of the gas bubble becomes more irregular and the shape of each bubble depends heavily on the local surface roughness. Moreover, the distance between any two neighboring bubbles is also affected by the surface roughness.
Figure 8 shows the evolution of water saturation as simultaneous gas and water flow occurs along the rough fracture. As depicted, the water saturation exhibits a general linear decrease trend for each roughness value at the initial injection stage when gas is introduced into the fracture. As gas and water injection continues, the water saturation fluctuates around an average value for each roughness value. The fluctuation is due to the alternating introduction of water and gas into the fractures. Generally, the gas and water flow can be considered as “stable” after a duration of approximately 10 s for all the roughness cases. The residual water saturation is considered to be the average water saturation at the stable stage.
Figure 9 shows the effect of roughness on BAR and residual water saturation. As shown in Figure 9a, the average BAR exhibits a slightly increasing trend with increasing roughness. Overall, the effect of roughness on the BAR can be neglected. As shown in Figure 9b, the residual water saturation climbs as the roughness increases. The increase in the residual water saturation is due to the increase in the end-corner structures due to increasing roughness, which provides increasing accommodation space for the residual water (see Figure 7d). Such observation is consistent with [54].
3.2.2. Effect of the Tortuosity
Figure 10 depicts the effect of tortuosity on gas and water distribution. It can be seen that the gas bubble tends to be ‘stretched’ along the flow direction as the tortuosity increases. The stretch of the gas bubble can be quantitatively described with the BAR as shown in Figure 11a. It can be seen that the stretch effect becomes stable at high tortuosity. It is presumed that the reason why the BAR remains almost constant at a critical tortuosity value of 1.3 is due to the snap-off effect constrained by the tortuous fracture. However, further investigations are needed to validate this presumption and to examine the predominant factors influencing the critical tortuosity value. As depicted in Figure 11b, the residual water saturation tends to increase with the tortuosity, which is due to the increased possibility of water trapping occurring in the end-corners of the tortuous flow paths (Figure 10d). However, the percentage of the increase in the water saturation is limited (within 10%).
3.2.3. Effect of Gas/Water Ratio
Figure 12 shows the gas and water phase distributions with different gas/water ratios. It is depicted that with the increase in the gas/water ratio, the gas phase expands gradually from a bubble pattern to a slug pattern. Moreover, the distance between two neighboring bubbles or slugs is decreased as the gas/water ratio increases. For the scenario of a high gas/water ratio of 9:1, it can be seen clearly that residual water is trapped in the wall corners due to the roughness nature. Comparing Figure 6, Figure 8 and Figure 10 leads to the conclusion that the gas/water ratio exerts a more significant effect on the gas and water distributions in the rough-walled fracture than roughness and tortuosity.
The qualitative analyses above are consistent with the quantitative correlations shown in Figure 13, which depicts significant changes in the BAR and residual water saturation with respect to the varying gas/water ratio. Overall, the BAR increases linearly with the gas/water ratio, whereas the residual water saturation exhibits a logarithmic decreasing trend with the gas/water ratio.
3.2.4. Effect of Total Flow Rate
Figure 14 depicts that the gas bubble geometry and phase distribution pattern exhibit minor changes when the total flow rate was varied from 0.2 to 8 × 10⁻³ m/s. Our statistics show that the BARs and residual water saturations for these flow rate conditions are in relatively small ranges of 1.45 to 1.5, and 0.54 to 0.56, respectively. Chen et al.’s [10] microfluidic experiments concluded that gas and water flow patterns in the fracture junction can be affected by the flow rate, which is inconsistent with our observations. The inconsistency may be possibly associated with the inherent experimental errors due to the fluctuations of alternating gas and water flows.
These statistical values suggest that the total flow rate exerts a negligible effect on the gas and water phase distribution and flow pattern. In other words, the so-called water-blockage effect can be neglected for a single fracture. These simulation results indicate that relatively large dewatering rates or large pressure differences can be applied in order to accelerate the gas recovery factor for reservoirs where single fractures are developed.
3.3. Gas/Water Flow Simulations in Rough-Walled Y-Shaped Junction Models
3.3.1. Effect of Aperture Ratio on the Phase Distribution
Figure 15 shows the water and gas distributions for Y-shaped junction models with varying aperture ratios. As can be seen from Figure 15b,c, the gas and water phases are generally distributed evenly along the flow channels where the downstream outlets have identical apertures of 200 μm. In this case, the flow paths for the water and gas phases are identical, viz., the two phases do not have their own preferential flow path.
However, as the lower outlet has increased apertures of 300 and 400 μm (corresponding to an aperture ratio of 1.5 and 2.0), the gas phase flows out of the model only through the larger outlet channel, and no gas exists within the smaller outlet channel (Figure 15f,i). For these two models, the water phase flows through both the larger and the smaller outlet channels (Figure 16). In other words, preferential flow through the larger channel occurs for the gas phase. This observation is within expectations, considering the Young–Laplace equation that results in reduced resistance for the gas phase in a hydrophilic channel with a larger aperture.
3.3.2. Effect of Intersecting Angle and Flow Rate on the Phase Distribution
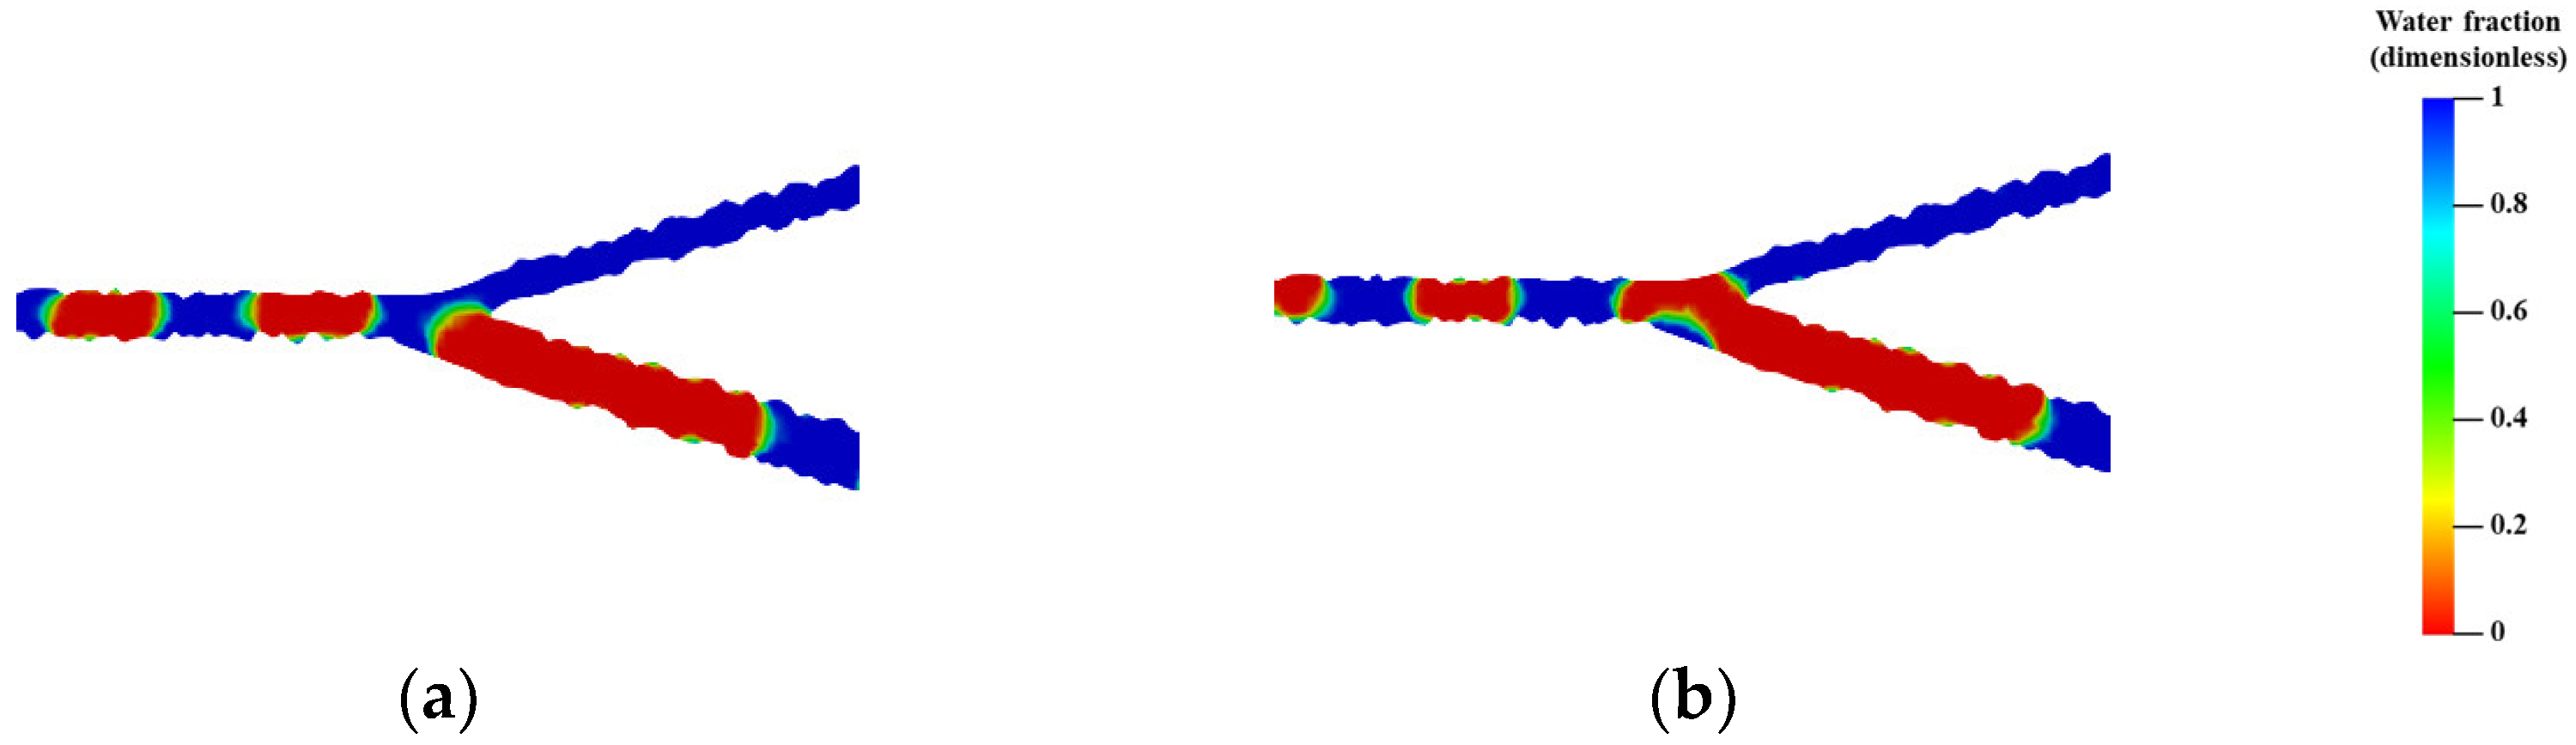
Figure 17 and Figure 18 depict the phase distributions considering the intersecting angle and flow rate, respectively. As shown in the two figures, the intersecting angle and flow rate exert a negligible effect on the phase distribution. For all the cases considered in Figure 17 and Figure 18, the gas phase flows out of the model only from the larger outlet channel, whereas the water phase flows through both the larger and smaller channels.
With reference to Figure 15, Figure 16, Figure 17 and Figure 18, it can be concluded that for the Y-shaped junction model, the aperture ratio of the outlet channels is the predominant factor controlling the gas phase distribution, whereas the effects of the remaining geometric parameters, flow rates, and gas/water ratio are negligible. These results indicate that for a real fractured gas reservoir, the aperture ratios of intersected fractures should be carefully examined in order to attain high gas recovery efficiency while minimizing the effect of the water blockage effect. However, it is noted that this paper is only concerned with conceptualized fracture geometries that are relatively simple. It requires further investigation into how the above-mentioned factors affect the flow pattern in real complex fracture networks, which is beyond the scope of this study.
4. Conclusions
Numerical simulation runs were conducted using the VOF method for gas and water flows in rough-walled single-fracture and Y-shaped junction models considering varying factors. The key findings from the simulation results are concluded as follows.
(1) For single-fracture models, the gas/water ratio is the primary factor that determines gas bubble geometries, phase distribution, and saturation. The effects of roughness and tortuosity on the shape of gas bubbles and residual water saturation are noticeable but significantly less than the effect of the gas/water ratio. The effect of total fluid rate is negligible on the gas and water flow pattern in single-fracture models.
(2) For the Y-shaped junction model, gas preferential flow through larger paths occurs in cases where the apertures of the adjacent downstream channels are non-identical. The intersecting angle and fluid flow rate have negligible effects on the phase distribution characteristics in Y-shaped junctions.
It should be noted that the fracture wettability was assumed to be hydrophilicity in this study, and thus the results may not apply to hydrophobic or mix-wetting fractures. Therefore, further studies may be anticipated on the effect of wettability on the two-phase flow characteristics in rough-walled fractures. It is also noted that this paper is concerned with conceptual single- and Y-junction fracture models. For true naturally fractured reservoirs, the spatial distribution and connectivity of the fracture network may be more complex. Therefore, simulations on gas and water flow through true fracture networks are anticipated to reveal the two-phase interaction characteristics under the influence of various factors such as fracture network patterns and flow rates.
Author Contributions
Conceptualization, Q.Z. and Y.Y.; methodology, X.Z.; software, J.Y.; validation, S.W.; formal analysis, Q.Z.; writing—original draft preparation, J.Z.; writing—review and editing, J.Y.; visualization, J.Y.; supervision, Y.Y.; project administration, X.Z.; funding acquisition, J.Z. All authors have read and agreed to the published version of the manuscript.
Funding
This research was funded by NSFC of China, grant number 51904319, and PetroChina Huabei Oilfield Company, grant number HBYT-2020-JS-50278.
Conflicts of Interest
The authors declare no conflict of interest.
References
- Zhang, J.; Zhang, B.; Xu, S.; Feng, Q.; Zhang, X.; Elsworth, D. Interpretation of Gas/Water Relative Permeability of Coal Using the Hybrid Bayesian-Assisted History Matching: New Insights. Energies 2021, 14, 626. [Google Scholar] [CrossRef]
- Zhang, J.; Feng, Q.; Zhang, X.; Hu, Q.; Yang, J.; Wang, N. A Novel Data-Driven Method to Estimate Methane Adsorption Isotherm on Coals Using the Gradient Boosting Decision Tree: A Case Study in the Qinshui Basin, China. Energies 2020, 13, 5369. [Google Scholar] [CrossRef]
- Yan, X.; Sun, H.; Huang, Z.; Liu, L.; Wang, P.; Zhang, Q.; Yao, J. Hierarchical Modeling of Hydromechanical Coupling in Fractured Shale Gas Reservoirs with Multiple Porosity Scales. Energy Fuels 2021, 35, 5758–5776. [Google Scholar] [CrossRef]
- Zhu, S.; Salmachi, A. Flowing Material Balance and Rate-Transient Analysis of Horizontal Wells in Under-Saturated Coal Seam Gas Reservoirs: A Case Study from the Qinshui Basin, China. Energies 2021, 14, 4887. [Google Scholar] [CrossRef]
- Ming, Y.; Liu, J.; Liu, J.; Liu, Z.; Elsworth, A. Effect of adsorption-induced matrix swelling on coal permeability evolution of micro-fracture with the real geometry. Petrol. Sci. 2021, 18, 1143–1152. [Google Scholar]
- Yang, R.; Li, G.; Qin, X.; Huang, Z.; Li, J.; Sheng, M.; Wang, B. Productivity enhancement in multilayered coalbed methane reservoirs by radial borehole fracturing. Petrol. Sci. 2022, in press.
- Yang, Y.; Xu, Q.; Li, X.; Zhang, L.; Lan, X.; Wang, J.; Zhang, K.; Sun, H.; Zhang, L.; Yao, J. Pore-scale simulation of gas-water two-phase flow in volcanic gas reservoir based on Volume of Fluid method. J. Nat. Gas Sci. Eng. 2022, 106, 104733. [Google Scholar] [CrossRef]
- Zhang, Q.; Yan, X.; Shao, J. Fluid flow through anisotropic and deformable double porosity media with ultra-low matrix permeability: A continuum framework. J. Petrol. Sci. Eng. 2021, 200, 108349. [Google Scholar] [CrossRef]
- Zhang, Q.; Yan, X.; Li, Z. A mathematical framework for multiphase poromechanics in multiple porosity media. Comput. Geotech. 2022, 146, 104728. [Google Scholar] [CrossRef]
- Xu, K.; Zhu, P. A Microfluidic Investigation of the Synergistic Effect of Nanoparticles and Surfactants in Macro-Emulsion-Based Enhanced Oil Recovery. SPE J. 2017, 22, 459. [Google Scholar] [CrossRef]
- Mansour, M.; Kawahara, A.; Sadatomi, M. Experimental investigation of gas–non-Newtonian liquid two-phase flows from T-junction mixer in rectangular microchannel. Int. J. Multiph. Flow. 2015, 72, 263–274. [Google Scholar] [CrossRef]
- Wang, L.; Yang, S.; Peng, X.; Deng, H.; Meng, Z.; Qian, K.; Wang, Z.; Lei, H. An improved visual investigation on gas–water flow characteristics and trapped gas formation mechanism of fracture–cavity carbonate gas reservoir. J. Nat. Gas Sci. Eng. 2018, 49, 213–226. [Google Scholar] [CrossRef]
- Chen, S.; Zhang, J.; Yin, D.; Cheng, X.; Jiang, N. Relative permeability measurement of coal microchannels using advanced microchip technology. Fuel 2021, 312, 122633. [Google Scholar] [CrossRef]
- Gerami, A.; Mostaghimi, P.; Armstrong, R.; Zamani, A.; Warkiani, M. A microfluidic framework for studying relative permeability in coal. Int. J. Coal Geol. 2016, 159, 183–193. [Google Scholar] [CrossRef]
- Xie, C.; Raaeini, A.; Wang, Y.; Blunt, M.; Wang, M. An improved pore-network model including viscous coupling effects using direct simulation by the lattice Boltzmann method. Adv. Water Resour. 2017, 100, 26–34. [Google Scholar] [CrossRef]
- Raeini, A.; Blunt, J.; Bijeljic, B. Direct simulations of two-phase flow on micro-CT images of porous media and upscaling of pore-scale forces. Adv. Water Resour. 2014, 74, 116–126. [Google Scholar] [CrossRef]
- Yang, Y.; Wang, K.; Zhang, L.; Sun, H.; Ma, J. Pore-scale simulation of shale oil flow based on pore network model. Fuel 2019, 251, 683–692. [Google Scholar] [CrossRef]
- Wang, S.; Feng, Q.; Javadpour, F. Multiscale modeling of gas transport in shale matrix: An integrated study of molecular dynamics and rigid-pore-network model. SPE J. 2020, 25, 1416–1442. [Google Scholar] [CrossRef]
- Wang, S.; Feng, Q.; Dong, Y.; Han, X.; Wang, S. A dynamic pore-scale network model for two-phase imbibition. J. Nat. Gas Sci. Eng. 2015, 26, 118–129. [Google Scholar] [CrossRef]
- Li, X.; Wei, W.; Wang, L. A new method for evaluating the pore structure complexity of digital rocks based on the relative value of fractal dimension. Mar. Petrol. Geol. 2022, 141, 105694. [Google Scholar] [CrossRef]
- Yang, Y.; Zhou, Y.; Blunt, M.J.; Yao, J.; Cai, J. Advances in multiscale numerical and experimental approaches for multiphysics problems in porous media. Adv. Geo-Energy Res. 2021, 5, 233–238. [Google Scholar] [CrossRef]
- Cha, L.; Xie, C.; Feng, Q.; Balhoff, M. Geometric criteria for the snap-off of a non-wetting droplet in pore-throat channels with rectangular cross-sections. Water Resour. Res. 2021, 57, e2020WR029476. [Google Scholar] [CrossRef]
- Farahani, M.V.; Nezhad, M.M. On the effect of flow regime and pore structure on the flow signatures in porous media. Phys. Fluids 2022, 34, 115139. [Google Scholar] [CrossRef]
- Cha, L.; Feng, Q.; Wang, S.; Xu, S.; Xie, C. Pore-Scale Modeling of Immiscible Displacement in Porous Media: The Effects of Dual Wettability. SPE J. 2022, 1–12. [Google Scholar] [CrossRef]
- Tariq, A.; Liu, Z. Heat transfer and friction factor correlations for slip gaseous fluid flow in confined porous medium with pore-scale LBM modelling. Int. J. Therm. Sci. 2022, 173, 107382. [Google Scholar] [CrossRef]
- Feng, Q.; Cha, L.; Dai, C.; Zhao, G.; Wang, S. Effect of particle size and concentration on the migration behavior in porous media by coupling computational fluid dynamics and discrete element method. Powder Technol. 2020, 360, 704–714. [Google Scholar] [CrossRef]
- Qin, X.; Cai, J.; Zhou, Y.; Kang, Z. Lattice Boltzmann simulation and fractal analysis of effective thermal conductivity in porous media. Appl. Therm. Eng. 2020, 180, 115562. [Google Scholar] [CrossRef]
- Wang, Z.; Chen, L.; Wei, H.; Dai, Z.; Kang, Q.; Tao, W. Pore-scale study of mineral dissolution in heterogeneous structures and deep learning prediction of permeability. Phys. Fluids 2022, 34, 116609. [Google Scholar] [CrossRef]
- Yang, Y.; Cai, S.; Yao, J.; Zhong, J.; Zhang, K.; Song, W. Pore-scale simulation of remaining oil distribution in 3D porous media affected by wettability and capillarity based on volume of fluid method. Int. J. Multiph. Flow 2021, 143, 103746. [Google Scholar] [CrossRef]
- Kumar, R.; Premachandran, B. A coupled level set and volume of fluid method for three dimensional unstructured polyhedral meshes for boiling flows. Int. J. Multiph. Flow 2022, 156, 104207. [Google Scholar] [CrossRef]
- Sacher, J.; Repke, J. Development of a mesoscale model for the gas phase fluid dynamics in structured packings based on fundamental experiments and CFD investigations. Chem. Eng. Res. Des. 2019, 147, 430–442. [Google Scholar] [CrossRef]
- Li, J.; Zhengsong, Q.; Zhong, H.; Zhao, X.; Huang, W. Coupled CFD-DEM analysis of parameters on bridging in the fracture during lost circulation. J. Petrol. Sci. Eng. 2020, 184, 106501. [Google Scholar] [CrossRef]
- Zhang, G.; Marte, G.; Li, M. A coupled CFD-DEM approach to model particle-fluid mixture transport between two parallel plates to improve understanding of proppant micromechanics in hydraulic fractures. Powder Technol. 2017, 308, 235–248. [Google Scholar] [CrossRef]
- Song, R.; Wang, Y.; Liu, J.J.; Cui, M.M.; Ranjith, P.G. Pore scale investigation on scaling-up micro-macro capillary number and wettability on trapping and mobilization of residual fluid. J. Contam. Hydrol. 2019, 225, 103499. [Google Scholar]
- Yang, N.; Wu, Z.; Chen, J.; Wang, Y.; Li, J. Multi-scale analysis of gas–liquid interaction and CFD simulation of gas–liquid flow in bubble columns. Chem. Eng. Sci. 2011, 86, 3212–3222. [Google Scholar] [CrossRef]
- Huang, X.; Zhang, L.; Zhang, R.; Chen, X.; Zhao, Y.; Yuan, S. Numerical simulation of gas-liquid two-phase flow in the micro-fracture networks in fractured reservoirs. J. Nat. Gas Sci. Eng. 2021, 94, 104101. [Google Scholar] [CrossRef]
- Lafmejani, S.; Olesen, A.; Kær, S. VOF modelling of gas-liquid flow in PEM water electrolysis cell micro-channels. Int. J. Hydrogen Energy 2017, 42, 16333–16344. [Google Scholar] [CrossRef] [Green Version]
- Akhlaghi, M.; Mohammadi, V.; Nouri, N.M.; Taherkhani, M.; Karimi, M. Multi-Fluid VoF model assessment to simulate the horizontal air–water intermittent flow. Chem. Eng. Res. Des. 2019, 52, 48–59. [Google Scholar] [CrossRef]
- Saeedipour, M.; Schneiderbauer, S. Favre-filtered LES-VOF of two-phase flows with eddy viscosity-based subgrid closure models: An a-posteriori analysis. Int. J. Multiph. Flow. 2021, 144, 103780. [Google Scholar] [CrossRef]
- Huang, H.; Meakin, P.; Liu, M. Computer simulation of two-phase immiscible fluid motion in unsaturated complex fractures using a volume of fluid method. Water Resour. Res. 2005, 41, 2179–2187. [Google Scholar] [CrossRef]
- Woerner, M. Numerical modeling of multiphase flows in microfluidics and micro process engineering: A review of methods and applications. Microfluid. Nanofluid. 2012, 12, 841–886. [Google Scholar] [CrossRef]
- Soh, G.Y.; Yeoh, G.H.; Timchenko, V. An algorithm to calculate interfacial area for multiphase mass transfer through the Volume-Of-Fluid method. Int. J. Heat Mass Transf. 2016, 100, 573–581. [Google Scholar] [CrossRef]
- Mahoney, S.A.; Rufford, T.E.; Johnson, D.; Dmyterko, A.S.; Rodrigues, S.; Esterle, J.; Rudolph, V.; Steel, K.M. The effect of rank, lithotype and roughness on contact angle measurements in coal cleats. Int. J. Coal Geol. 2017, 179, 302–315. [Google Scholar] [CrossRef]
- Akhondzadeh, H.; Keshavarz, A.; Awan, F.U.R.; Zamani, A.; Iglauer, S.; Lebedev, M. Coal cleat network evolution through liquid nitrogen freeze-thaw cycling. Fuel 2022, 314, 123069. [Google Scholar] [CrossRef]
- Jin, Y.; Zheng, J.; Liu, X.; Pan, J.; Liu, S. Control mechanisms of self-affine, rough cleat networks on flow dynamics in coal reservoir. Energy 2019, 189, 116149. [Google Scholar] [CrossRef]
- Mostaghimi, P.; Armstrong, R.T.; Gerami, A.; Hu, Y.; Jing, Y.; Kamali, F.; Liu, M.; Liu, Z.; Lu, X.; Ramandi, H.L.; et al. Cleat-scale characterisation of coal: An overview. J. Nat. Gas. Sci. Eng. 2017, 39, 143–160. [Google Scholar] [CrossRef]
- Akhondzadeh, H.; Keshavarz, A.; Al-Yaseri, A.Z.; Ali, M.; Awan, F.U.; Wang, X.; Yang, Y.; Iglauer, S.; Lebedev, M. Pore-scale analysis of coal cleat network evolution through liquid nitrogen treatment: A Micro-Computed Tomography investigation. Int. J. Coal Geol. 2020, 219, 103370. [Google Scholar] [CrossRef]
- Babadagli, T.; Raza, S.; Ren, X.; Develi, K. Effect of surface roughness and lithology on the water–gas and water–oil relative permeability ratios of oil-wet single fractures. Int. J. Multiph. Flow 2015, 75, 68–81. [Google Scholar] [CrossRef]
- Wang, M.; Chen, Y.; Ma, G.; Zhou, J.; Zhou, C. Influence of surface roughness on non-linear flow behaviors in 3D self-affine rough fractures: Lattice Boltzmann simulations. Adv. Water Resour. 2016, 96, 373–388. [Google Scholar] [CrossRef]
- Maghsoudy, S.; Bakhtiari, O.; Maghsoudy, S. Tortuosity prediction and investigation of fluid flow behavior using pore flow approach in heap leaching. Hydrometallurgy 2022, 211, 105868. [Google Scholar] [CrossRef]
- Muzemder, A.; Singh, K. Intra-pore tortuosity and diverging-converging pore geometry controls on flow enhancement due to liquid boundary slip. J. Hydrol. 2021, 598, 126475. [Google Scholar] [CrossRef]
- Lu, Y.; Liu, D.; Cai, Y.; Gao, C.; Jia, Q.; Zhou, Y. AFM measurement of roughness, adhesive force and wettability in various rank coal samples from Qinshui and Junggar basin, China. Fuel 2022, 317, 123556. [Google Scholar] [CrossRef]
- Hou, J.; Lin, S.; Zhang, M.; Li, W. Salinity, temperature and pressure effect on hydrogen wettability of carbonate rocks. Int. J. Hydrogen Energy, 2022; in press. [Google Scholar] [CrossRef]
- Liu, Y.; Berg, S.; Ju, Y.; Wei, W.; Kou, J.; Cai, J. Systematic investigation of corner flow impact in forced imbibition. Water Resour. Res. 2022, 58, e2022WR0. [Google Scholar] [CrossRef]
Figure 1.
Illustration of the geometries of the fracture models used for validating the simulation method. (a) Gerami model; (b) Mansour model.
Figure 1.
Illustration of the geometries of the fracture models used for validating the simulation method. (a) Gerami model; (b) Mansour model.

Figure 2.
Examples of SEM images of rough-walled tortuous single-fracture (a) and Y-shaped fracture junction (b) in coals.
Figure 2.
Examples of SEM images of rough-walled tortuous single-fracture (a) and Y-shaped fracture junction (b) in coals.

Figure 3.
The basic geometry of a rough-walled single-fracture model.

Figure 4.
Illustration of the geometry of the Y-shaped fracture model.
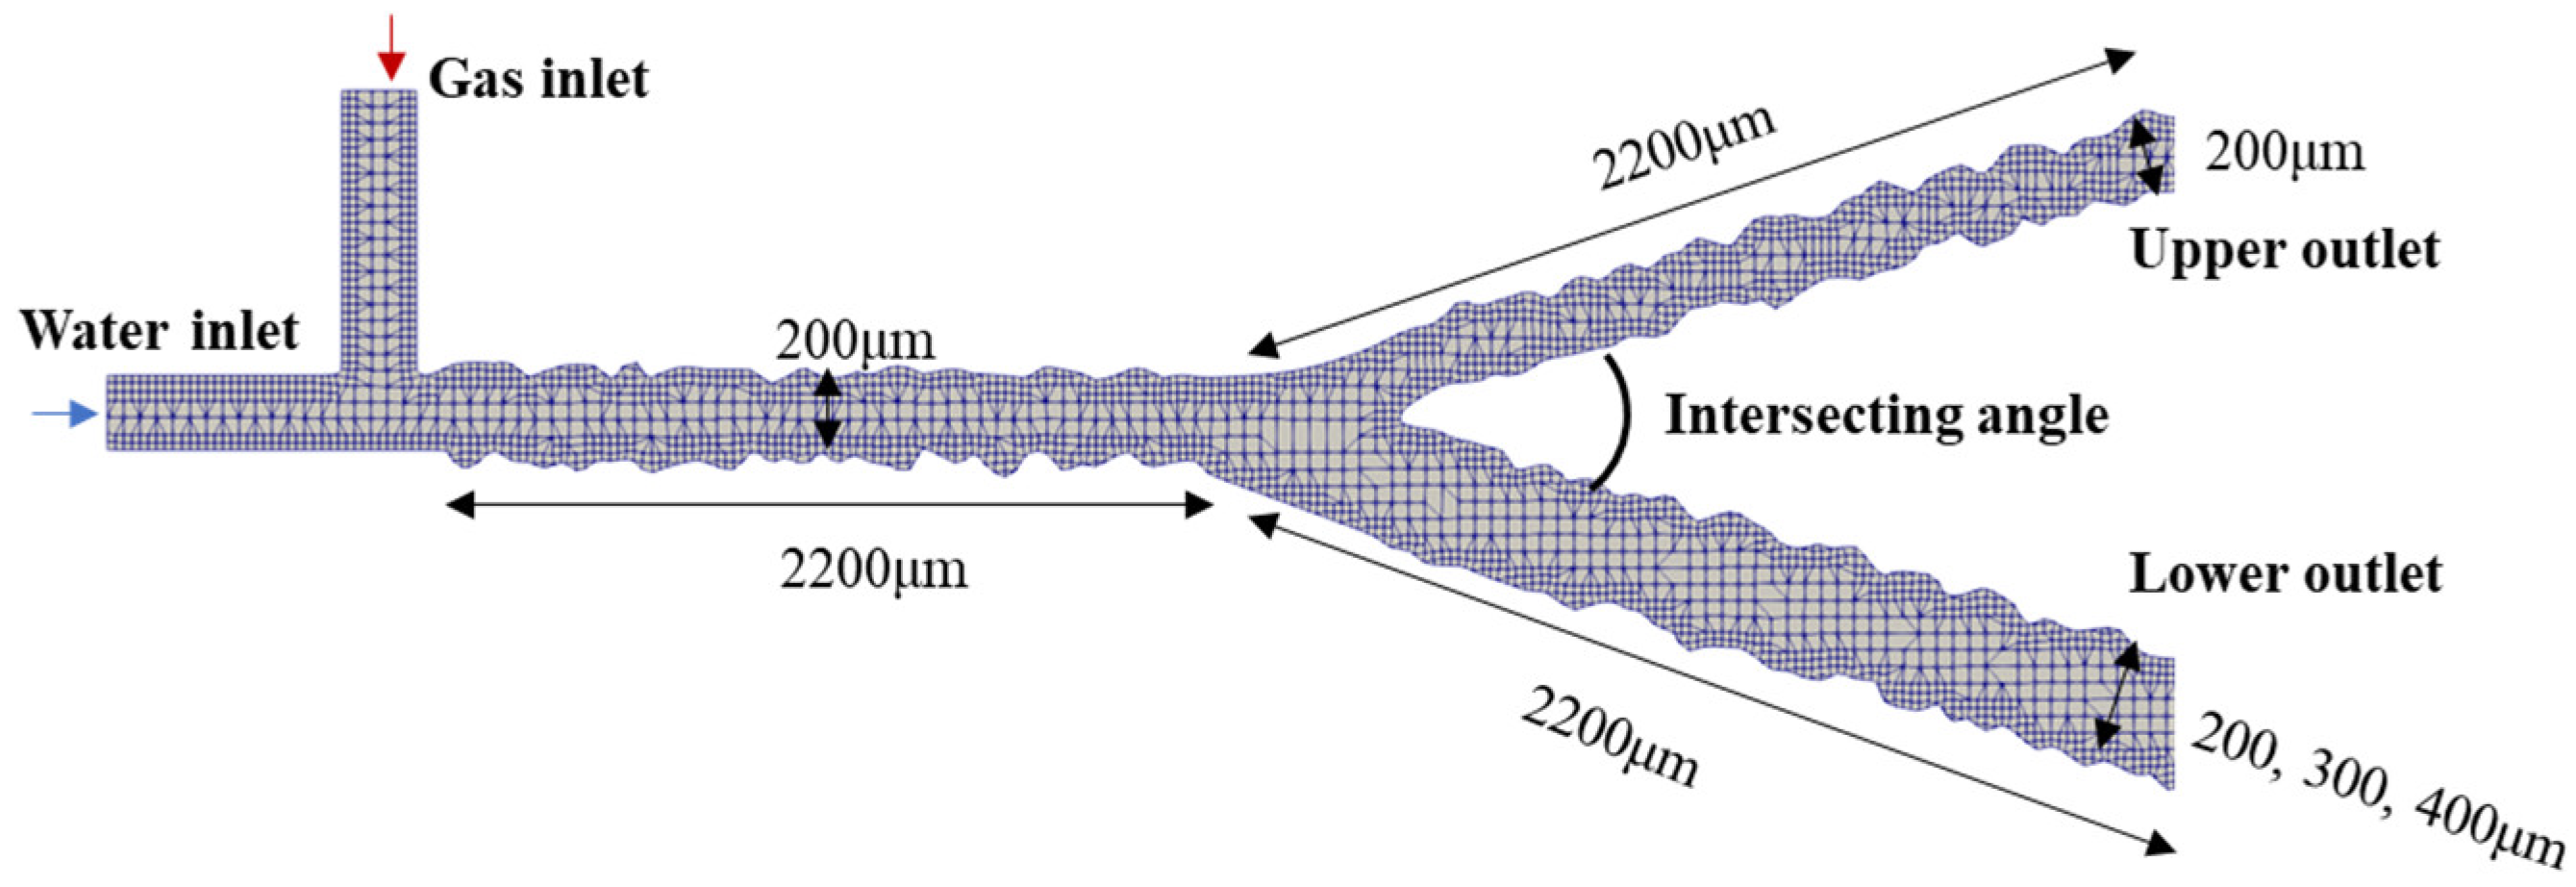
Figure 5.
Comparison of the simulation with experimental results for water invasion into fork-shaped adjacent channel model at time steps of (a) 10 s; (b) 30 s; (c) 40 s. The upper and lower rows are experimental and simulation results, respectively. The water and gas phases are in orange and white, respectively, for the experiment results in the upper row.

Figure 6.
Comparison of the simulation with experimental results for the single-fracture model. (a) Comparison of water and gas distribution patterns, with the color bar representing water phase saturation; (b) comparison of the BAR.
Figure 6.
Comparison of the simulation with experimental results for the single-fracture model. (a) Comparison of water and gas distribution patterns, with the color bar representing water phase saturation; (b) comparison of the BAR.
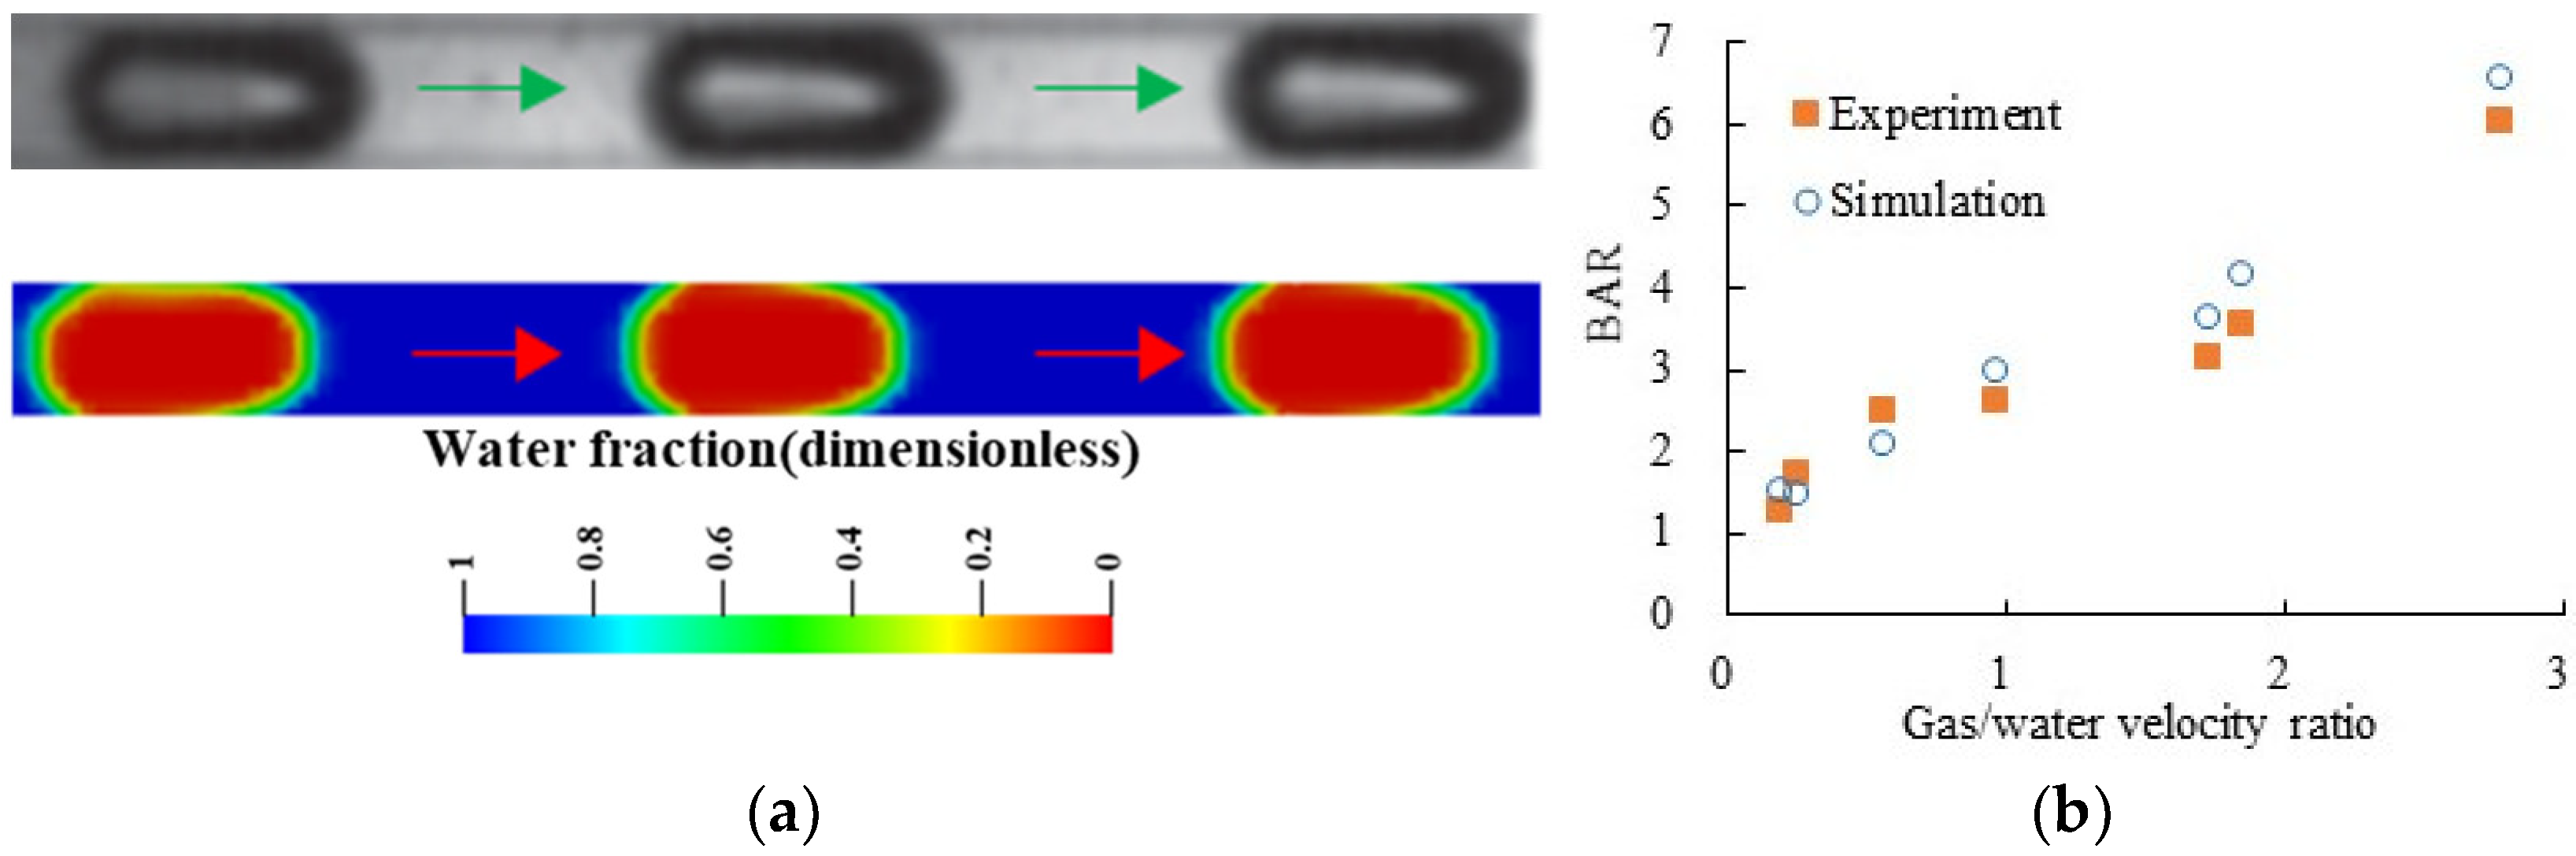
Figure 7.
Snapshots of the gas and water distribution in single-fracture models. (a) Roughness = 0; (b) roughness = 0.4; (c) roughness = 0.7; and (d) roughness = 1.3.
Figure 7.
Snapshots of the gas and water distribution in single-fracture models. (a) Roughness = 0; (b) roughness = 0.4; (c) roughness = 0.7; and (d) roughness = 1.3.
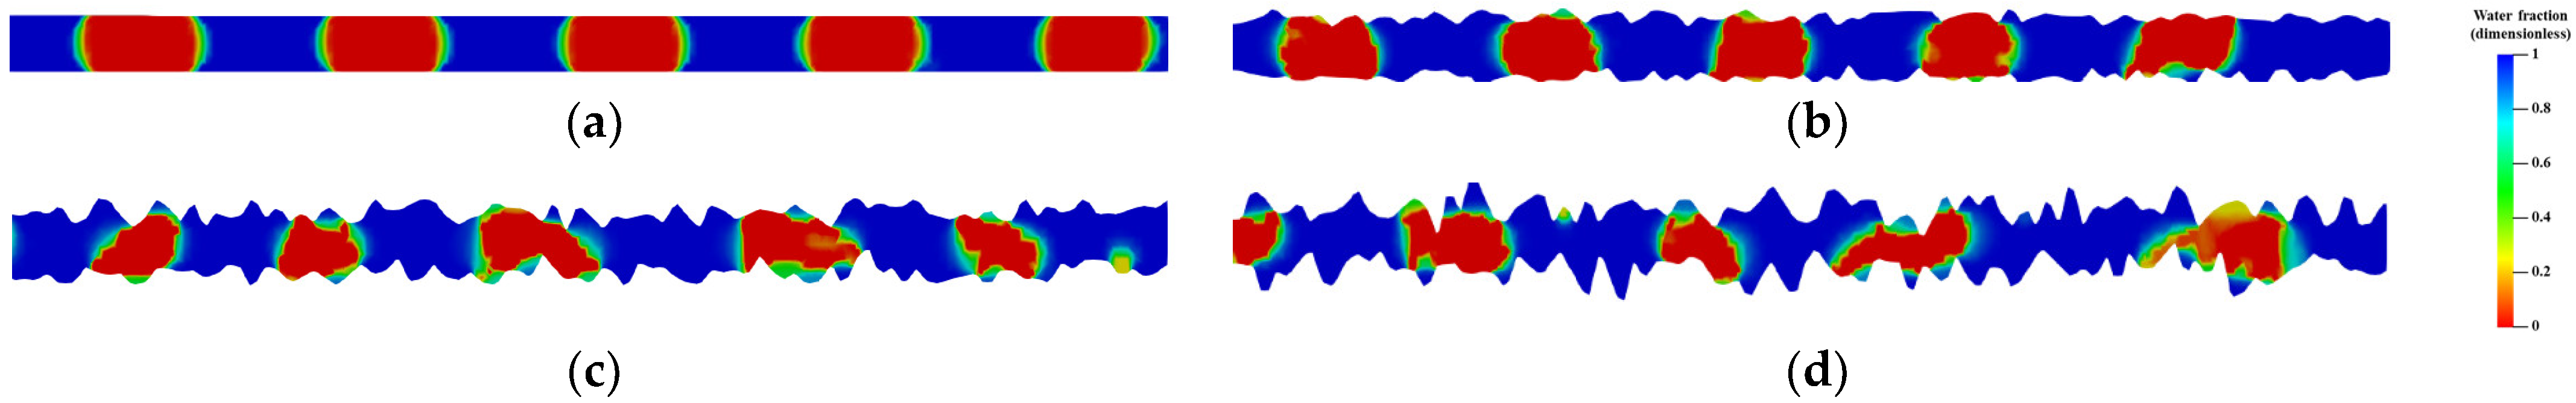
Figure 8.
Variation of average water saturation with time for single-fracture models.

Figure 9.
Effect of roughness on (a) bubble aspect ratio and (b) residual water saturation.
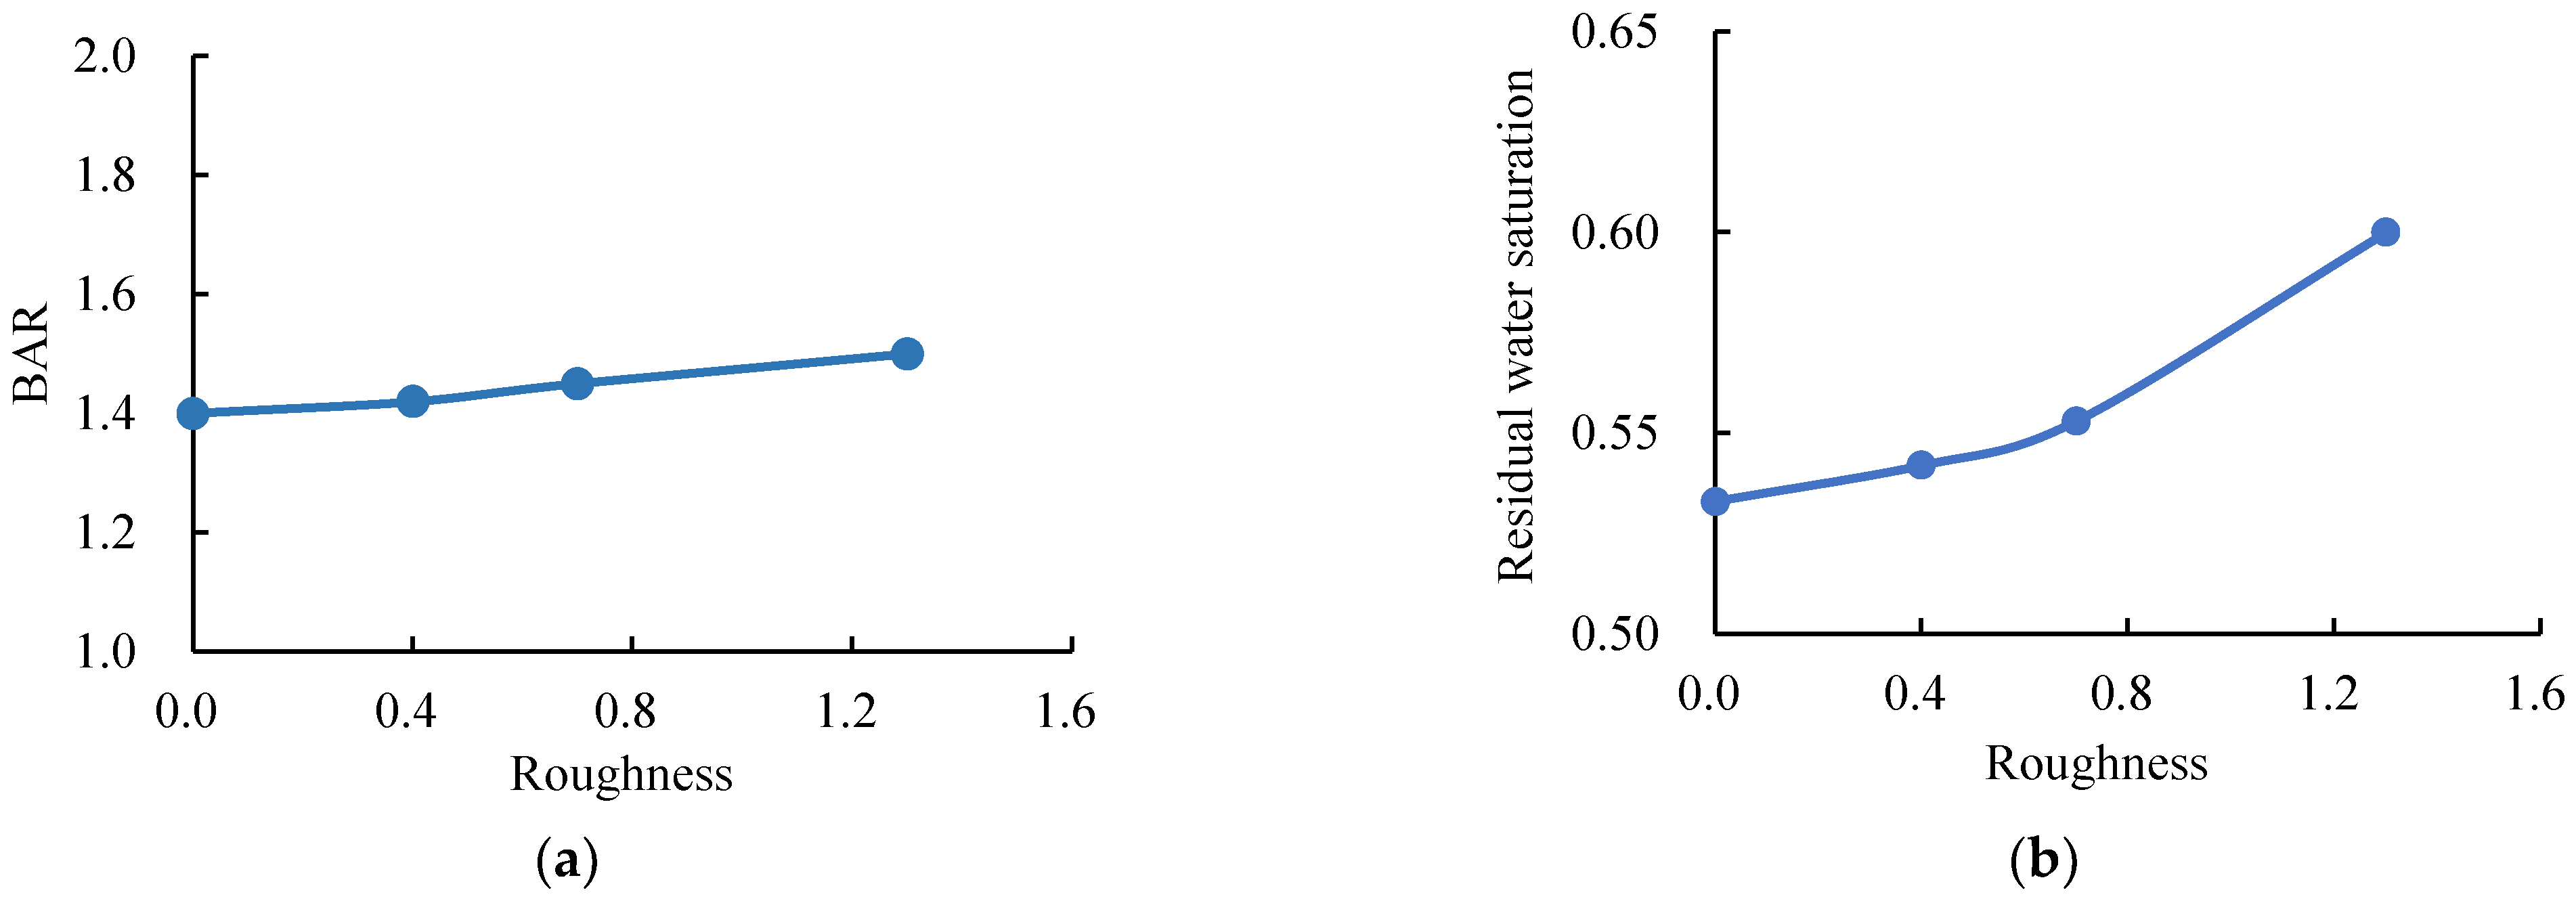
Figure 10.
Snapshots of gas and water distribution in single-fracture with tortuosity of (a) 1.1; (b) 1.2; (c) 1.3; and (d) 1.5.
Figure 10.
Snapshots of gas and water distribution in single-fracture with tortuosity of (a) 1.1; (b) 1.2; (c) 1.3; and (d) 1.5.

Figure 11.
Effect of tortuosity on (a) bubble aspect ratio and (b) residual water saturation.
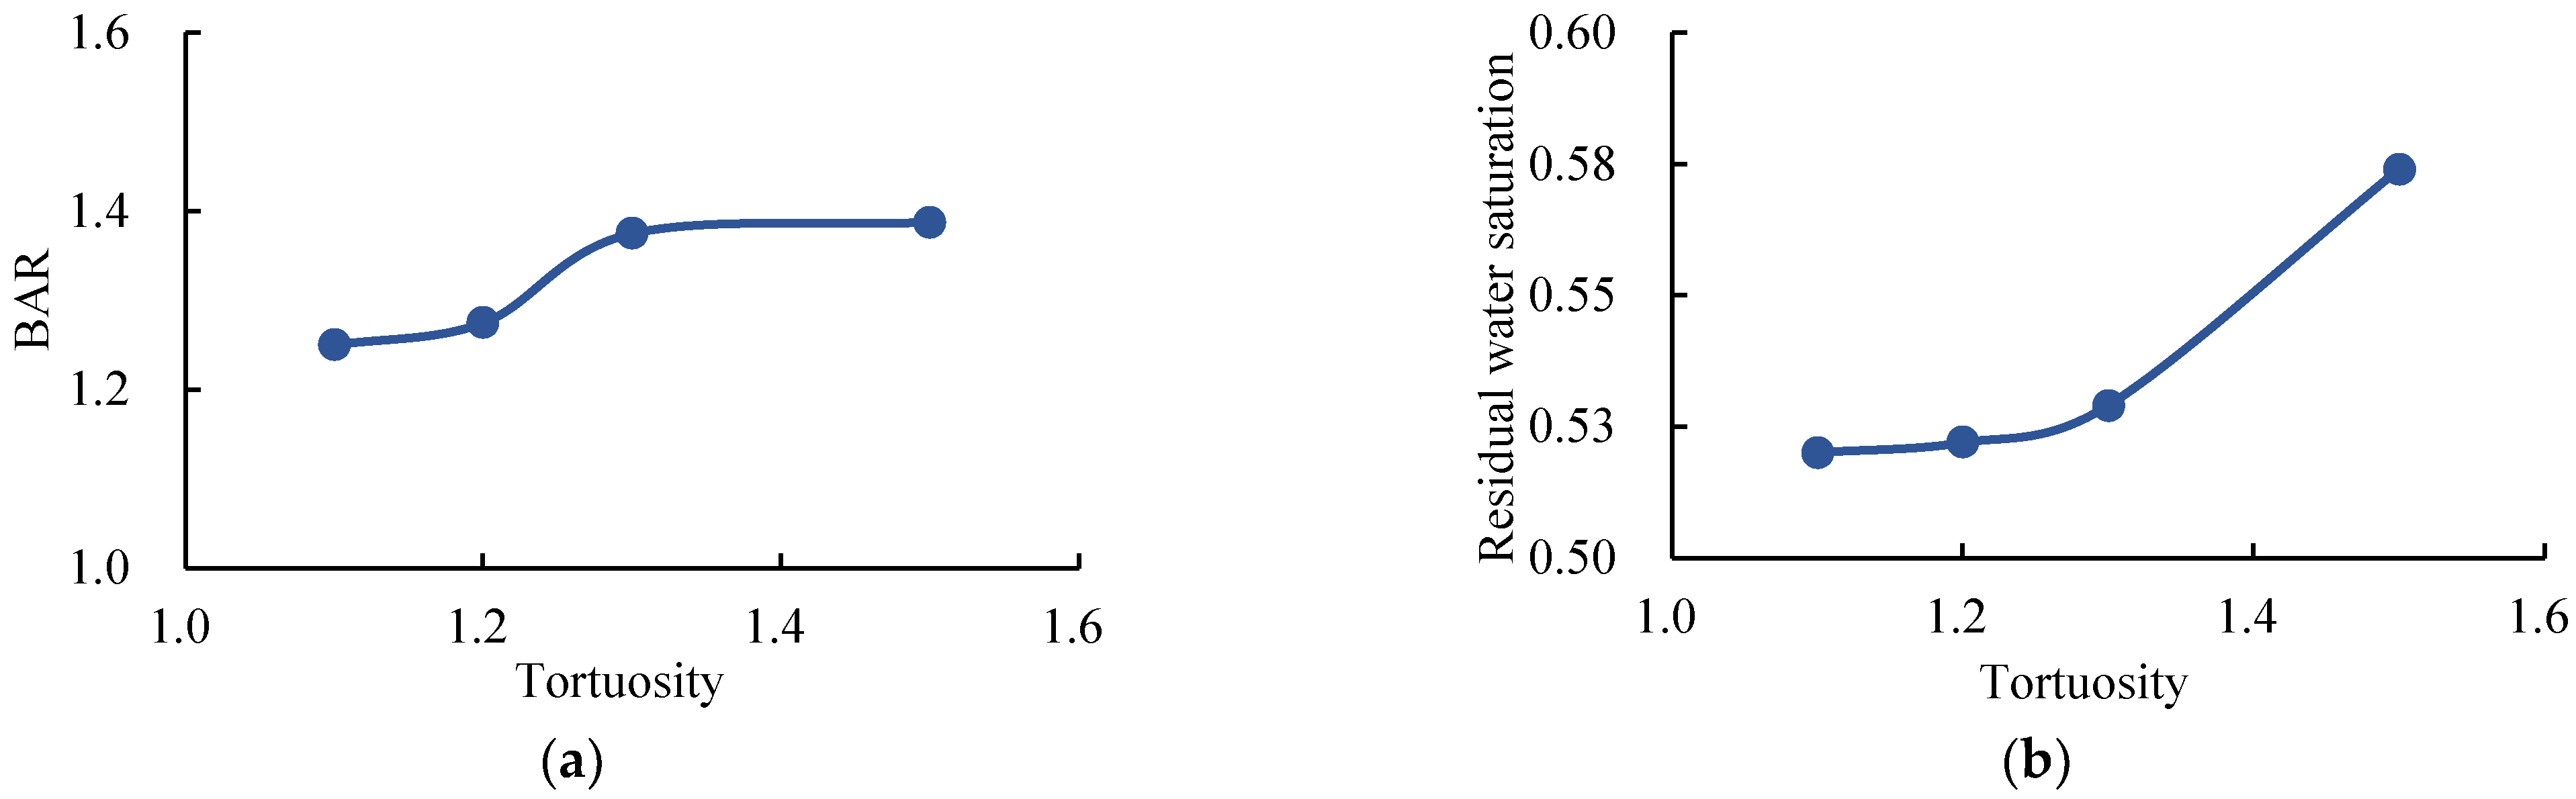
Figure 12.
Snapshots of the gas and water distribution in single-fracture models with gas/water ratios of (a) 1:9; (b) 1:4; (c) 4:1; and (d) 9:1. Refer to Figure 4 for the color bar.
Figure 12.
Snapshots of the gas and water distribution in single-fracture models with gas/water ratios of (a) 1:9; (b) 1:4; (c) 4:1; and (d) 9:1. Refer to Figure 4 for the color bar.
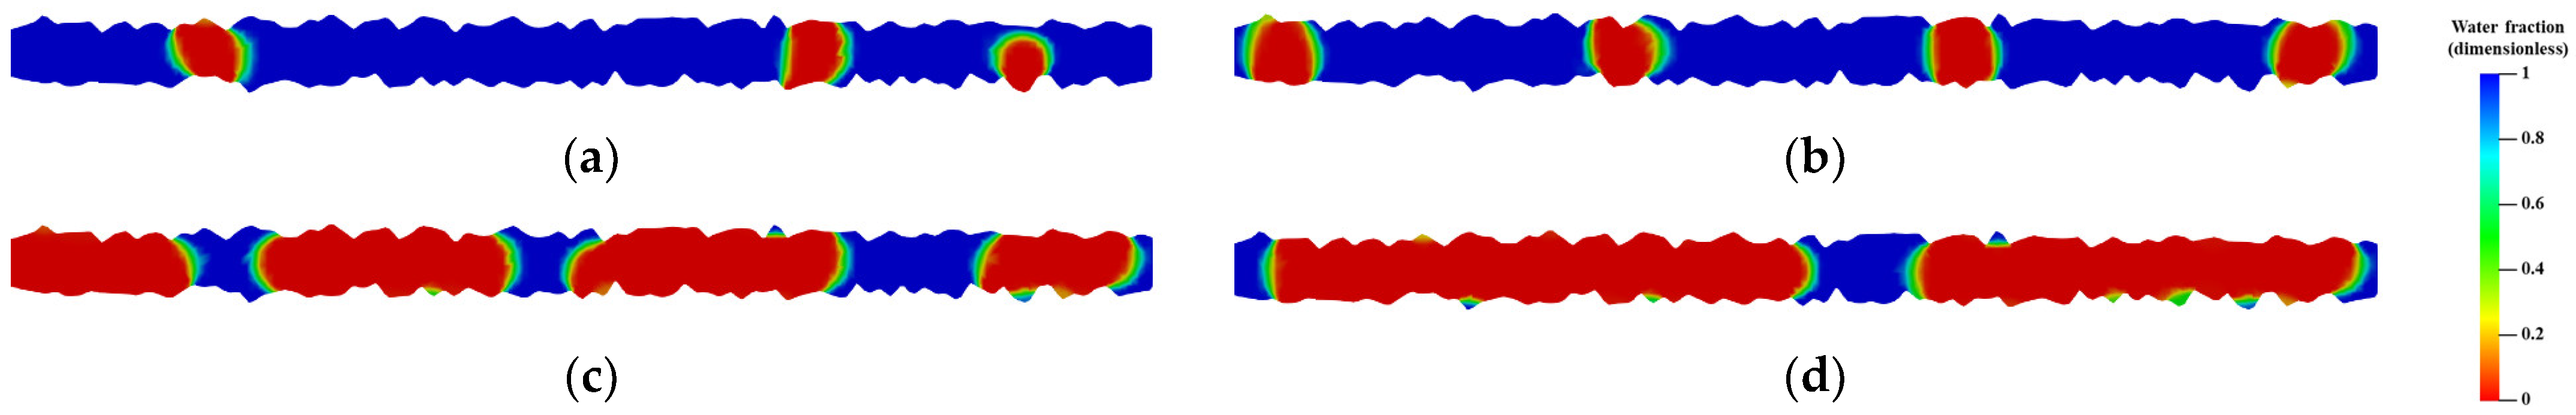
Figure 13.
Effect of the gas/water ratio on (a) BAR and (b) residual water saturation.

Figure 14.
Snapshots of the gas and water distribution in single-fracture models with flow rates of (a) 0.0002; (b) 0.002; (c) 0.004; and (d) 0.008 m/s.
Figure 14.
Snapshots of the gas and water distribution in single-fracture models with flow rates of (a) 0.0002; (b) 0.002; (c) 0.004; and (d) 0.008 m/s.
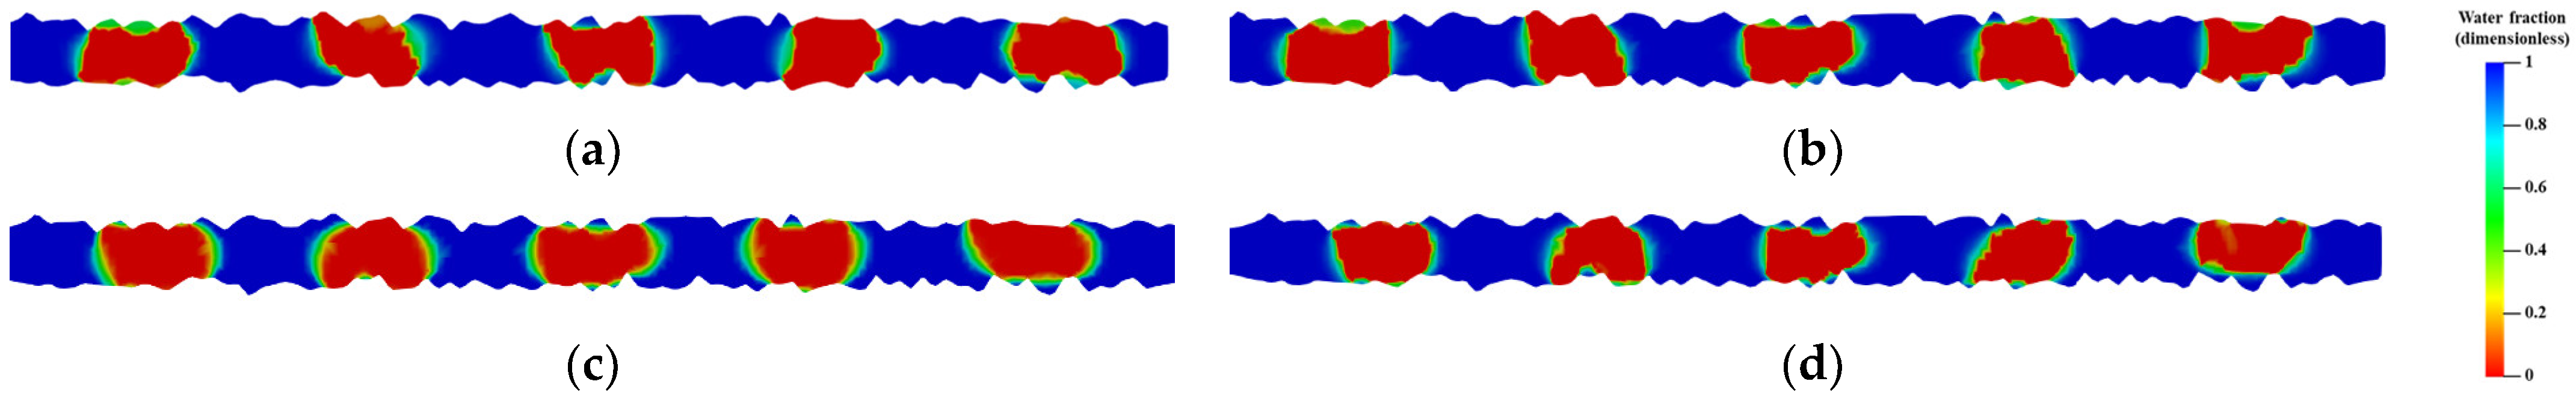
Figure 15.
Snapshots of the gas and water distribution in Y-shaped junction models. (a–c) aperture ratio of 1.0; (d–f) aperture ratio of 1.5; (g–i) aperture ratio of 2.0. The left, middle, and right columns represent the snapshots at simulation steps of 0 s, 1.5 s, and 8.5 s, respectively.
Figure 15.
Snapshots of the gas and water distribution in Y-shaped junction models. (a–c) aperture ratio of 1.0; (d–f) aperture ratio of 1.5; (g–i) aperture ratio of 2.0. The left, middle, and right columns represent the snapshots at simulation steps of 0 s, 1.5 s, and 8.5 s, respectively.
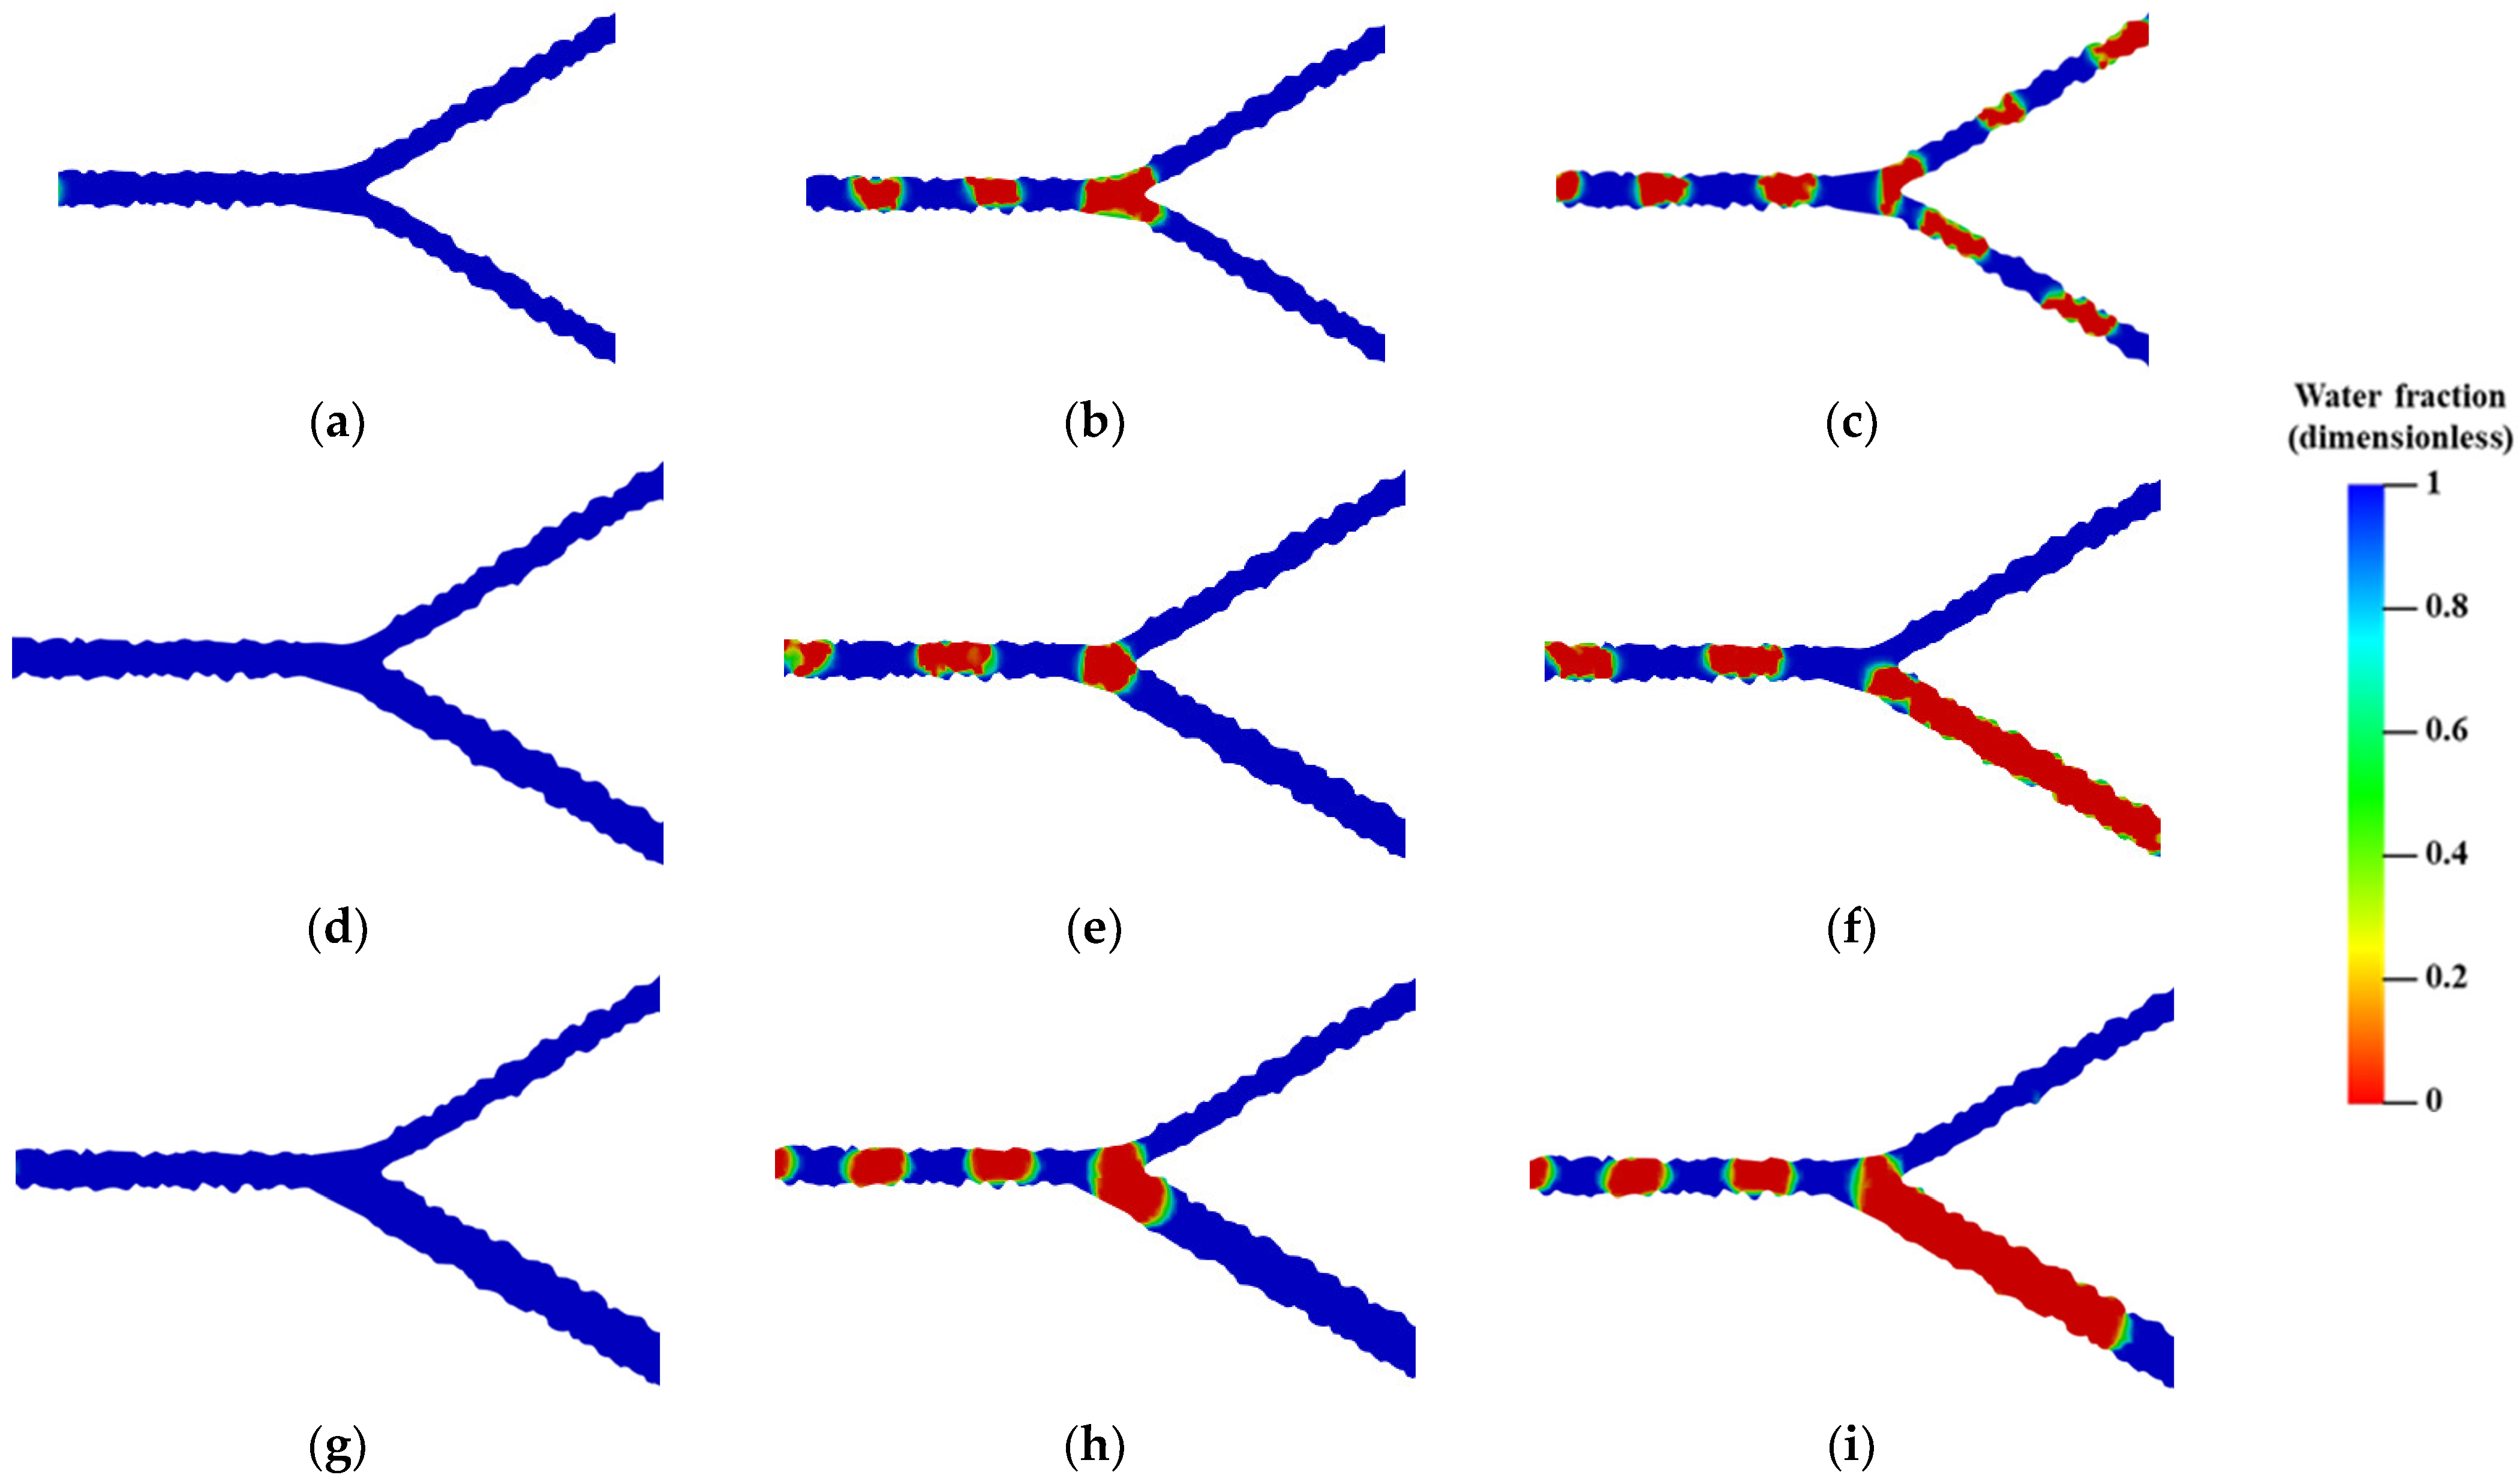
Figure 16.
Flow velocity at outlets of the Y-shaped junction. (a) Aperture ratio = 1.5, upper outlet; (b) aperture ratio = 1.5, lower outlet; (c) aperture ratio = 2, upper outlet; (d) aperture ratio = 2, lower outlet.
Figure 16.
Flow velocity at outlets of the Y-shaped junction. (a) Aperture ratio = 1.5, upper outlet; (b) aperture ratio = 1.5, lower outlet; (c) aperture ratio = 2, upper outlet; (d) aperture ratio = 2, lower outlet.
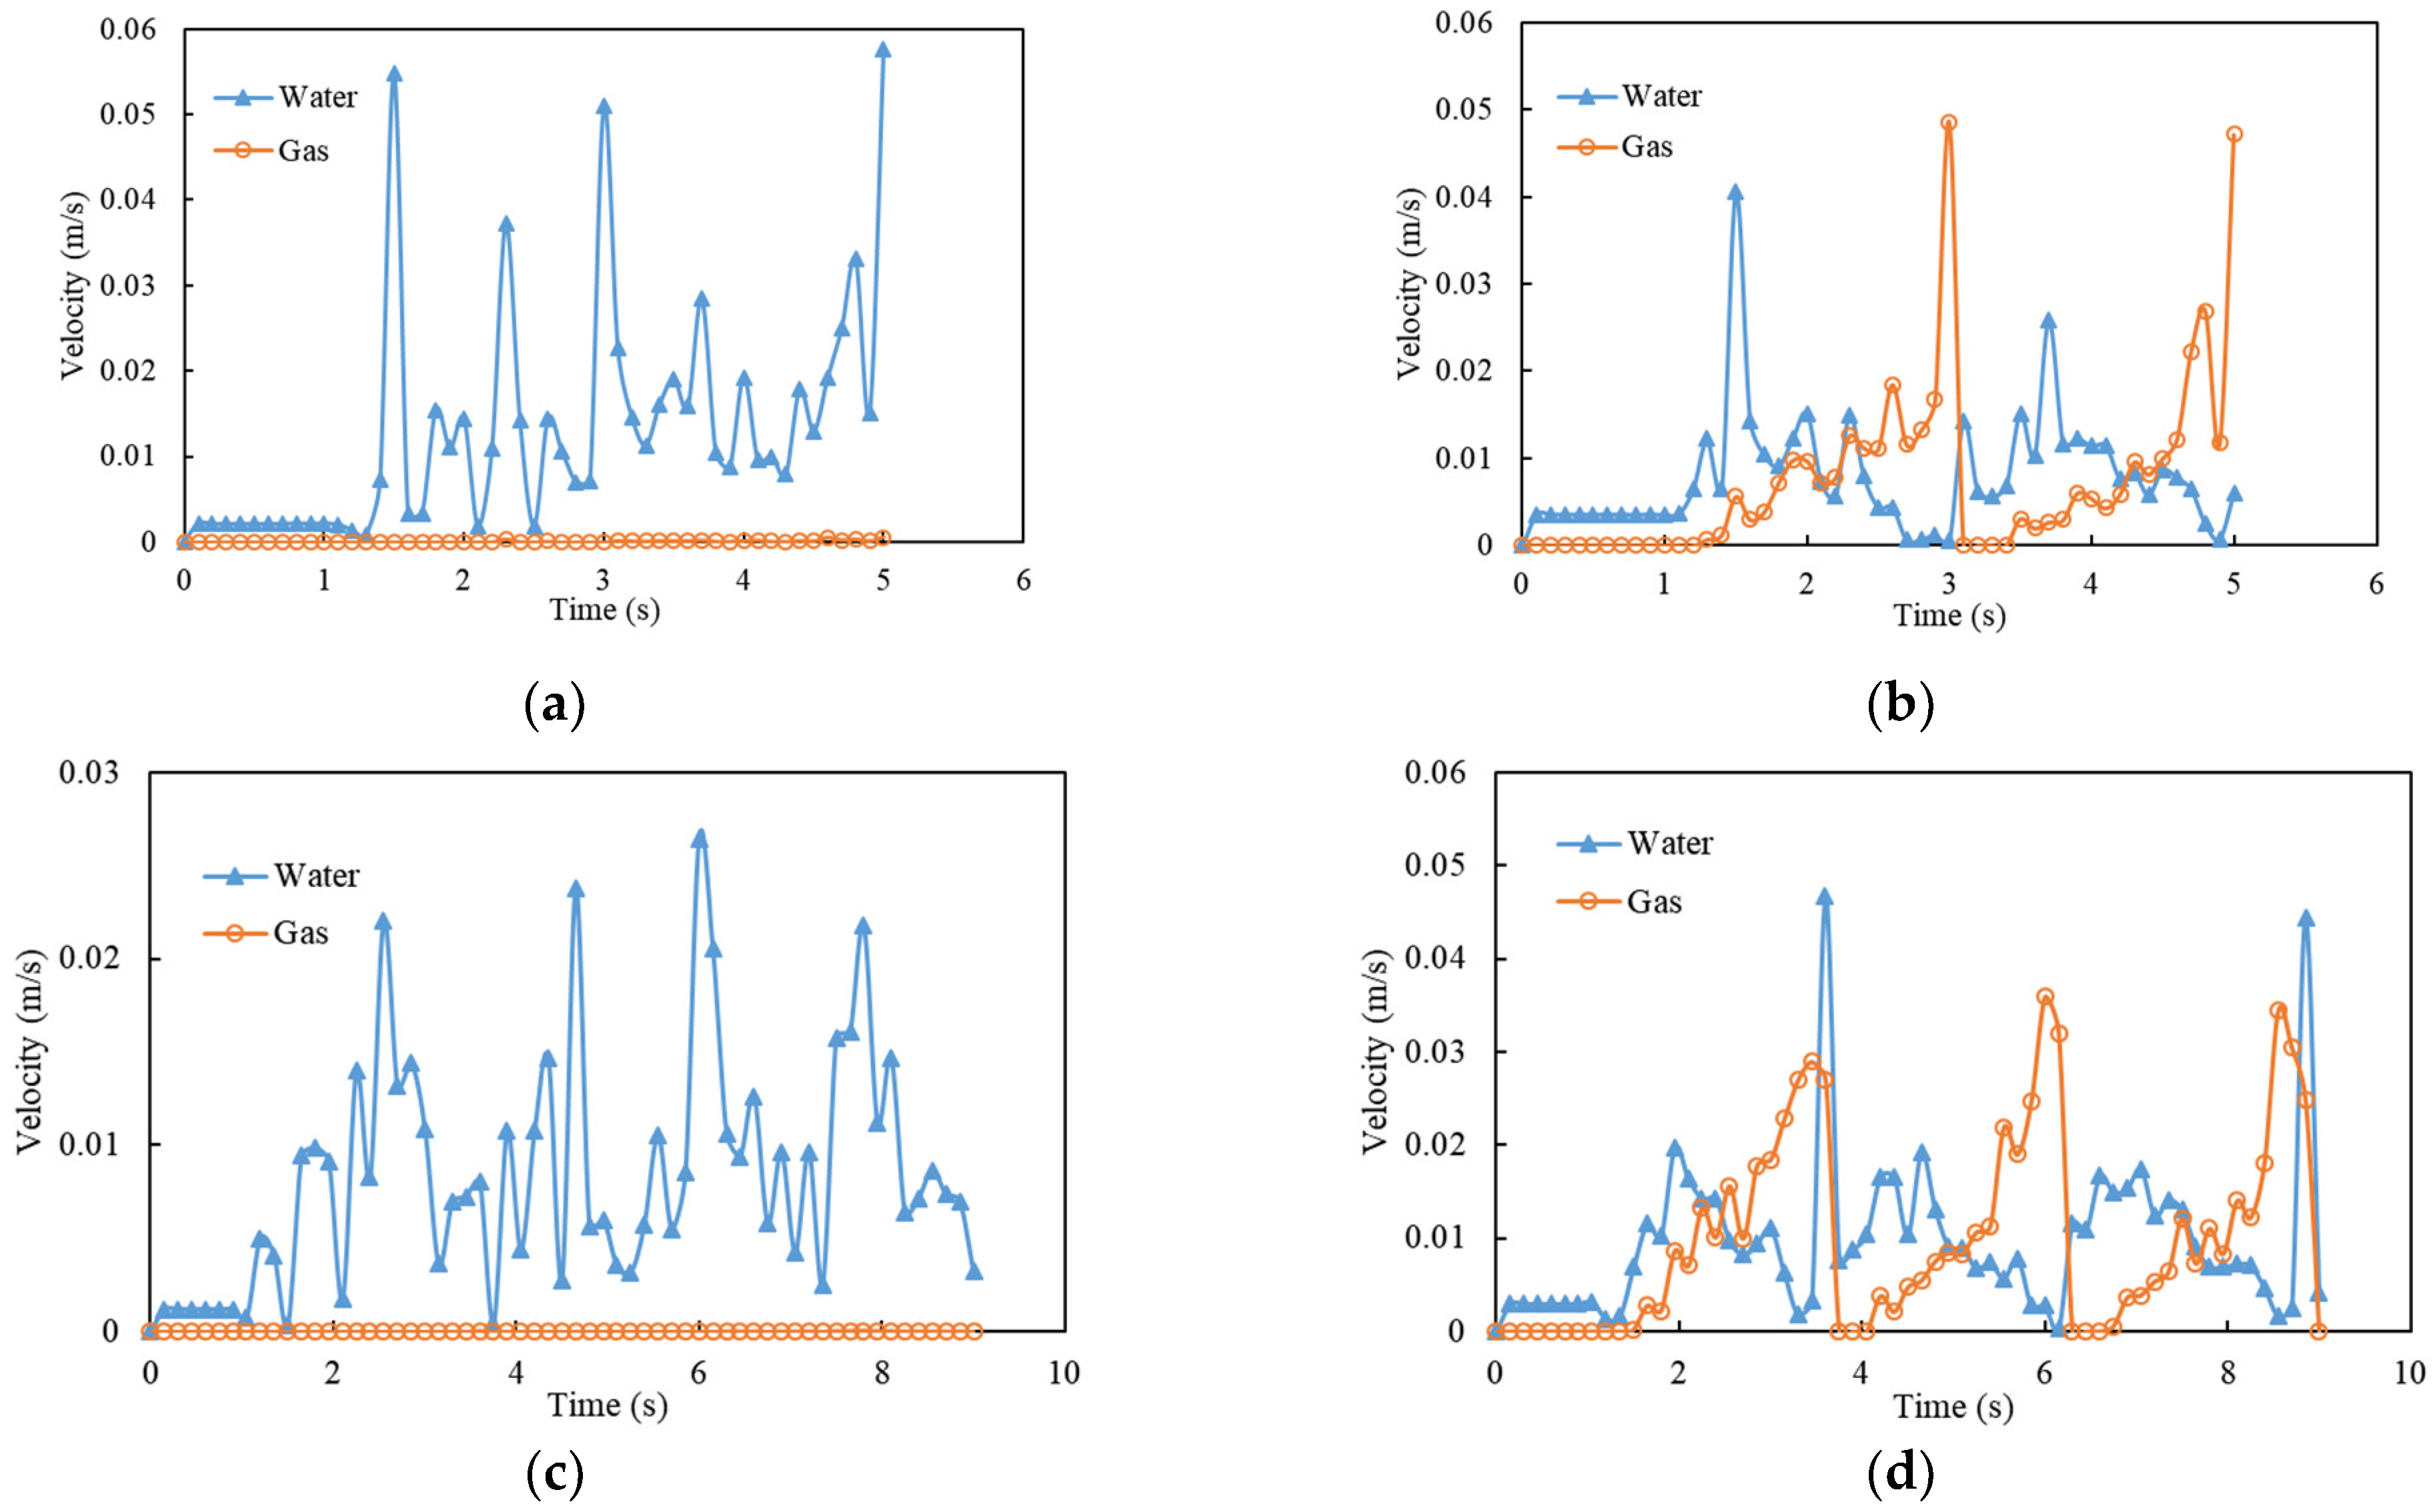
Figure 17.
Snapshots of the phase distribution for the Y-shaped junction models with intersecting angles of (a) 30°; (b) 60°; and (c) 90°.
Figure 17.
Snapshots of the phase distribution for the Y-shaped junction models with intersecting angles of (a) 30°; (b) 60°; and (c) 90°.
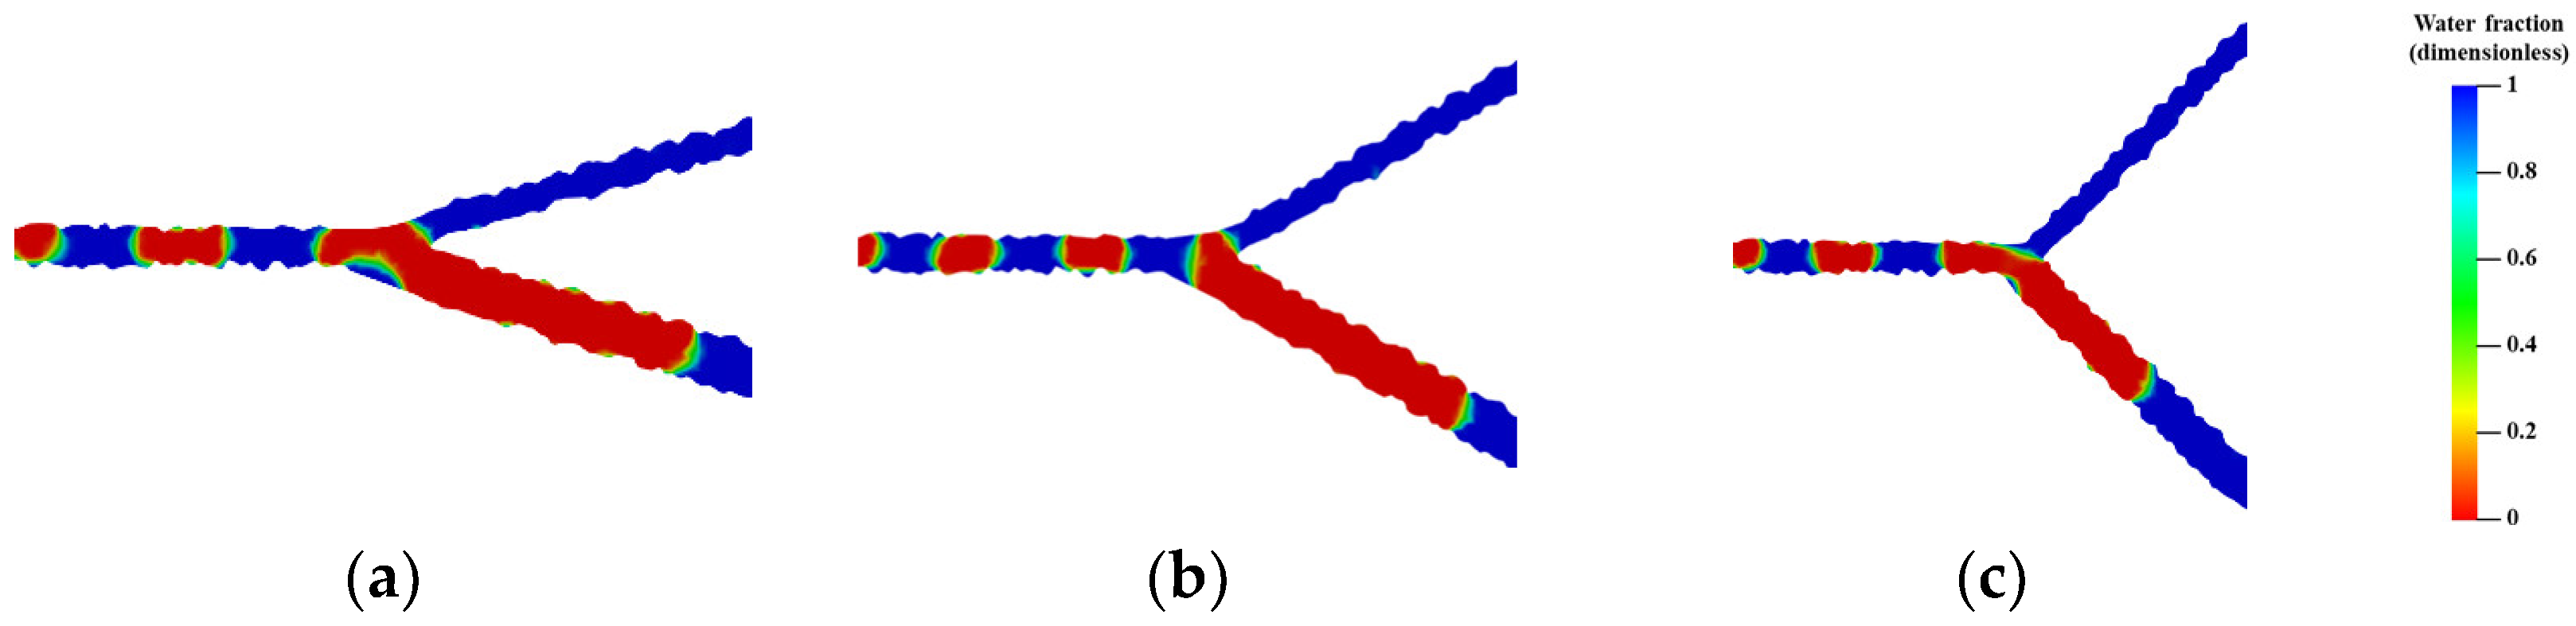
Figure 18.
Snapshots of the phase distribution for the Y-shaped junction models with flow rates of (a) 0.0002 m/s; (b) 0.004 m/s.
Figure 18.
Snapshots of the phase distribution for the Y-shaped junction models with flow rates of (a) 0.0002 m/s; (b) 0.004 m/s.

Table 1.
Simulation scenario setup for the single-fracture models.
| Parameter | Base Value | Range |
|---|---|---|
| Roughness | 0.4 | 0, 0.4, 0.7, 1.3 |
| Tortuosity | 1 | 1, 1.1, 1.3, 1.5 |
| Flow rate (10−3 m/s) | 4 | 0.2, 2, 4, 8 |
| Gas/water ratio | 1:1 | 1:9, 1:1, 4:1, 9:1 |
Publisher’s Note: MDPI stays neutral with regard to jurisdictional claims in published maps and institutional affiliations. |
© 2022 by the authors. Licensee MDPI, Basel, Switzerland. This article is an open access article distributed under the terms and conditions of the Creative Commons Attribution (CC BY) license (https://creativecommons.org/licenses/by/4.0/).
Share and Cite
MDPI and ACS Style
Zhu, Q.; Yang, Y.; Zhang, X.; Wang, S.; Yang, J.; Zhang, J. Pore-Scale Simulation of Gas and Water Two-Phase Flow in Rough-Walled Fractures Using the Volume of Fluid Method. Energies 2022, 15, 9382. https://doi.org/10.3390/en15249382
AMA Style
Zhu Q, Yang Y, Zhang X, Wang S, Yang J, Zhang J. Pore-Scale Simulation of Gas and Water Two-Phase Flow in Rough-Walled Fractures Using the Volume of Fluid Method. Energies. 2022; 15(24):9382. https://doi.org/10.3390/en15249382
Chicago/Turabian StyleZhu, Qingzhong, Yanhui Yang, Xueying Zhang, Sanshuai Wang, Jinzhao Yang, and Jiyuan Zhang. 2022. "Pore-Scale Simulation of Gas and Water Two-Phase Flow in Rough-Walled Fractures Using the Volume of Fluid Method" Energies 15, no. 24: 9382. https://doi.org/10.3390/en15249382
Note that from the first issue of 2016, this journal uses article numbers instead of page numbers. See further details here.