
Molecular Simulation of Adsorption in Deep Marine Shale Gas Reservoirs

1
PetroChina Southwest Oil & Gas Field Company, Chengdu 610000, China
2
State Key Laboratory of Oil and Gas Reservoir Geology and Exploitation, Southwest Petroleum University, Chengdu 610000, China
*
Authors to whom correspondence should be addressed.
Energies 2022, 15(3), 944; https://doi.org/10.3390/en15030944
Submission received: 10 August 2021
/
Revised: 29 November 2021
/
Accepted: 1 December 2021
/
Published: 27 January 2022
(This article belongs to the Special Issue Multiscale Petrophysics Characterization and Multiphase Flow in Unconventional Reservoirs)
Abstract
:Deep marine shale gas reservoirs are extremely rich in the Sichuan basin in China. However, due to the in situ conditions with high temperature and high pressure (HTHP), in particular reservoir pressure being usually much higher than the test pressure, it is difficult to accurately clarify the adsorption behavior, as seepage theory plays an important role in shale gas reserves evaluation. Therefore, three kinds of sorbent, including illite, quartz and kerogen, and two simulation methods, containing the grand canonical ensemble Monte Carlo method and molecular dynamics method, are synthetically used to determine the methane adsorption behavior under HTHP. The results show that both absolute adsorption and excess adsorption decrease with the increase of temperature. When the pressure increases, the absolute adsorption increases quickly and then slowly, and the excess adsorption first increases and then decreases. The superposition of wall potential energy is strongest in a circular hole, second in a square hole, and weakest in a narrow slit. The effect of pore size increases with the decrease of the pore diameter. Under HTHP, multi-layer adsorption can occur in shale, but the timing and number of layers are related to the sorbent type.
1. Introduction
Shale gas is an important energy resource, and it is mainly stored with free gas and adsorbed gas in shale reservoirs, with adsorbed gas accounting for 20~85% [1,2]. The shale gas reservoir usually has low permeability and low porosity. Generally, the shale matrix porosity is less than 10%, and its permeability is approximately 10−5 mD [1]. Meanwhile, it has high organic matter content, rich nano-pores, and large specific surface area, which are favorable for methane adsorption, as the main component (more than 95%) of shale gas [3,4,5]. With the development of shale gas reservoirs, deep shale gas has been gradually focused on because of its considerable reserves. For example, among the huge marine shale gas resources in the Sichuan Basin, in China, more than 80% of shale gas is in deep and ultra-deep layers below 3500 m, which is the main area to develop in the future. However, many challenges are faced when developing deep shale gas reservoirs because of its complex mechanisms caused by special reservoir conditions; among them, shale gas adsorption is unclear under high temperature and high pressure (HTHP).
At present, major advances on shale gas adsorption have been made for medium-shallow shale gas reservoirs with low temperature and low pressure, mainly by using testing methods, which can be divided into two categories: field evaluation methods, such as logging interpretation and on-site desorption, and laboratory evaluation methods, including adsorption isotherm experiments, and nuclear magnetic resonance (NMR) adsorption experiments. Among them, the adsorption isotherm experiment is the most widely used because of its highest test accuracy, and it can be conducted by a capacity/volumetric method and gravimetric method. Compared to the volumetric method, the result from the gravimetric method is more reliable, because it uses a high-precision magnetic levitation balance and can avoid the calculation of physical parameters. Based on these test methods, many corresponding shale gas adsorption theories and models are proposed, such as monolayer adsorption theory [6,7,8], multi-molecular layer adsorption theory [9,10], micropore filling theory [11,12,13], SLD adsorption theory [14,15,16,17], Ono-Kondo adsorption theory [18,19,20,21], and combined adsorption theory [22]. However, on the one hand, all these adsorption experimental conditions cannot satisfy the reservoir conditions with the increase of reservoir development depth from shallow to deep, especially pressure, usually lower than 40 MPa for experimental conditions but higher than 50 MPa for in situ conditions. On the other hand, test results merely reflect the relation between adsorption volume and pressure under isothermal conditions, and the adsorption process cannot be observed, so the current adsorption theories based on certain assumptions are still inconsistent.
In recent years, molecular simulation technology has become a popular method to reveal shale gas adsorption, and the main research methods include the grand canal ensemble Monte Carlo method (GCMC) and molecular dynamics (MD). Generally, GCMC is used to research adsorption, and MD is applied to discover diffusion features. Xiong et al. [23] used the GCMC to study the adsorption characteristics of methane in quartz, and the results showed that the gas-solid interaction decreases with the increase of pressure or the decrease of pore size, and the adsorption site energy of methane is from high to low. Zhang et al. [24] used GCMC and MD to study the methane adsorption in type I kerogen, clarifying that the the main cause of volumetric strain is adsorption at low pressure, and pressure at high pressure states. Shi et al. [25] studied the adsorption and diffusion of methane in kerogen based on GCMC and MD, and deemed that the methane adsorption and diffusion coefficient would decrease with the increase of buried depth. Lu et al. [26] used GCMC to study the adsorption behavior of methane in shale clay minerals (montmorillonite, illite/montmorillonite mixed layer and illite), and pointed out that the adsorbing methane with three clay minerals ranging from strong to weak is in the form of: montmorillonite > illite/montmorillonite mixed layer > illite. Huang et al. [27] applied GCMC and MD to reveal that methane can create multilayer adsorption in clay minerals. Guo et al. [28] used GCMC to determine the independent adsorption and absorption isotherms of methane within slit-shaped shale kerogen under supercritical conditions. The results showed that the absorption capacity is superior to that of the adsorption at lower pressure, and becomes low if the pore pressure is higher than 3.5 MPa. Sun et al. [29] proposed a new method to construct case-based organic nanopores, and studied the flow behavior of methane in different pore sizes and kerogen types under formation conditions by using the molecular dynamics method. It was found that the adsorption capacity of methane increased with the decrease of pore size in the nanopores, and the ratio of the average methane density to the volume gas density in the nanopore was 1.2~2.6, which increases with the decrease of the pressure and pore size. Kawthar et al. [30] built a shale model with combining kerogen, illite, montmorillonite and quartz by using Materials Studio (MS) software. The adsorption of carbon dioxide and methane on the surface of shale was studied by MD and Monte Carlo (MC) methods under drying conditions with temperature being 313 K and pressure ranging from 0.01 MPa to 17 MPa. The results showed that the adsorbed capacity of carbon dioxide is significantly higher than that of methane, and the volume of adsorbed gas is significantly more than that of free gas in the shale. The model has a high degree of matching with the real shale and can be used to explain the difference between the simulated and experimental data. Sun et al. [31] used a kerogen slit to research on the recovery of shale gas by carbon dioxide injection based on GCMC and MD, and discovered that carbon dioxide has a higher affinity to kerogen and lower self-diffusion coefficient.
Based on the above analysis, although molecular simulation has been successfully applied to study shale gas adsorption, it is mainly used for medium-shallow shale gas reservoirs, so the simulated pressure is usually low. Moreover, a slit model is always proposed in current research, but it is too idealistic. How to build a model close to reality is necessary. In this paper, a slit model and modified kerogen model considering the pore features are built respectively, and a series of adsorption simulations are performed with higher temperature and higher pressure to reveal adsorption characteristics based on constructed sorbent models. This work systematically studies the adsorption mechanism of shale gas at HTHP, and makes adsorption features for deep shale gas reservoirs more definite.
2. Establishment of Model
Both organic matter and clay minerals in shale can adsorb methane [32,33]. Therefore, before using molecular simulation technology to study methane adsorption, molecular models of methane, illite, quartz, and kerogen were constructed based on different force fields.
2.1. Methane
When using hydrocarbon organic molecules, compared to other element atoms, generally, a hydrogen atom is bigger, but its relative atomic mass is smaller, and its motion speed is higher. The gross movement of so many hydrogen atoms in the system will greatly affect the efficiency of molecular simulation. The application of united atomic force field can effectively improve the simulation efficiency for hydrocarbon system by superimposing the mass and interaction of the hydrogen atom attached onto the corresponding carbon atom to form a united atom. This can greatly reduce the complexity of the system and simulate a larger system with longer simulation time.
Here, the TraPPE as one of united atomic forces is chosen to construct a methane model. This force field, first proposed by Martin and Siepmann [34], provides a set of optimized Lennard–Jones (LJ) parameters for commonly used n-alkanes and has good applicability in methane model construction. In this force field, all bond lengths are constrained at equilibrium positions, vibration is not allowed, and there is no covalent bond stretching potential. The non-bond interaction of TraPPE field includes van der Waals interaction and electrostatic interaction, which are described by LJ 12-6 potential and Coulomb potential respectively. Therefore, by hiding the hydrogen atom directly connected with a carbon atom by a covalent bond in a carbon atom, a methane molecule is simplified into a single united atom, and the potential energy parameters of methane molecules is shown in Table 1, and the model is shown in Figure 1.
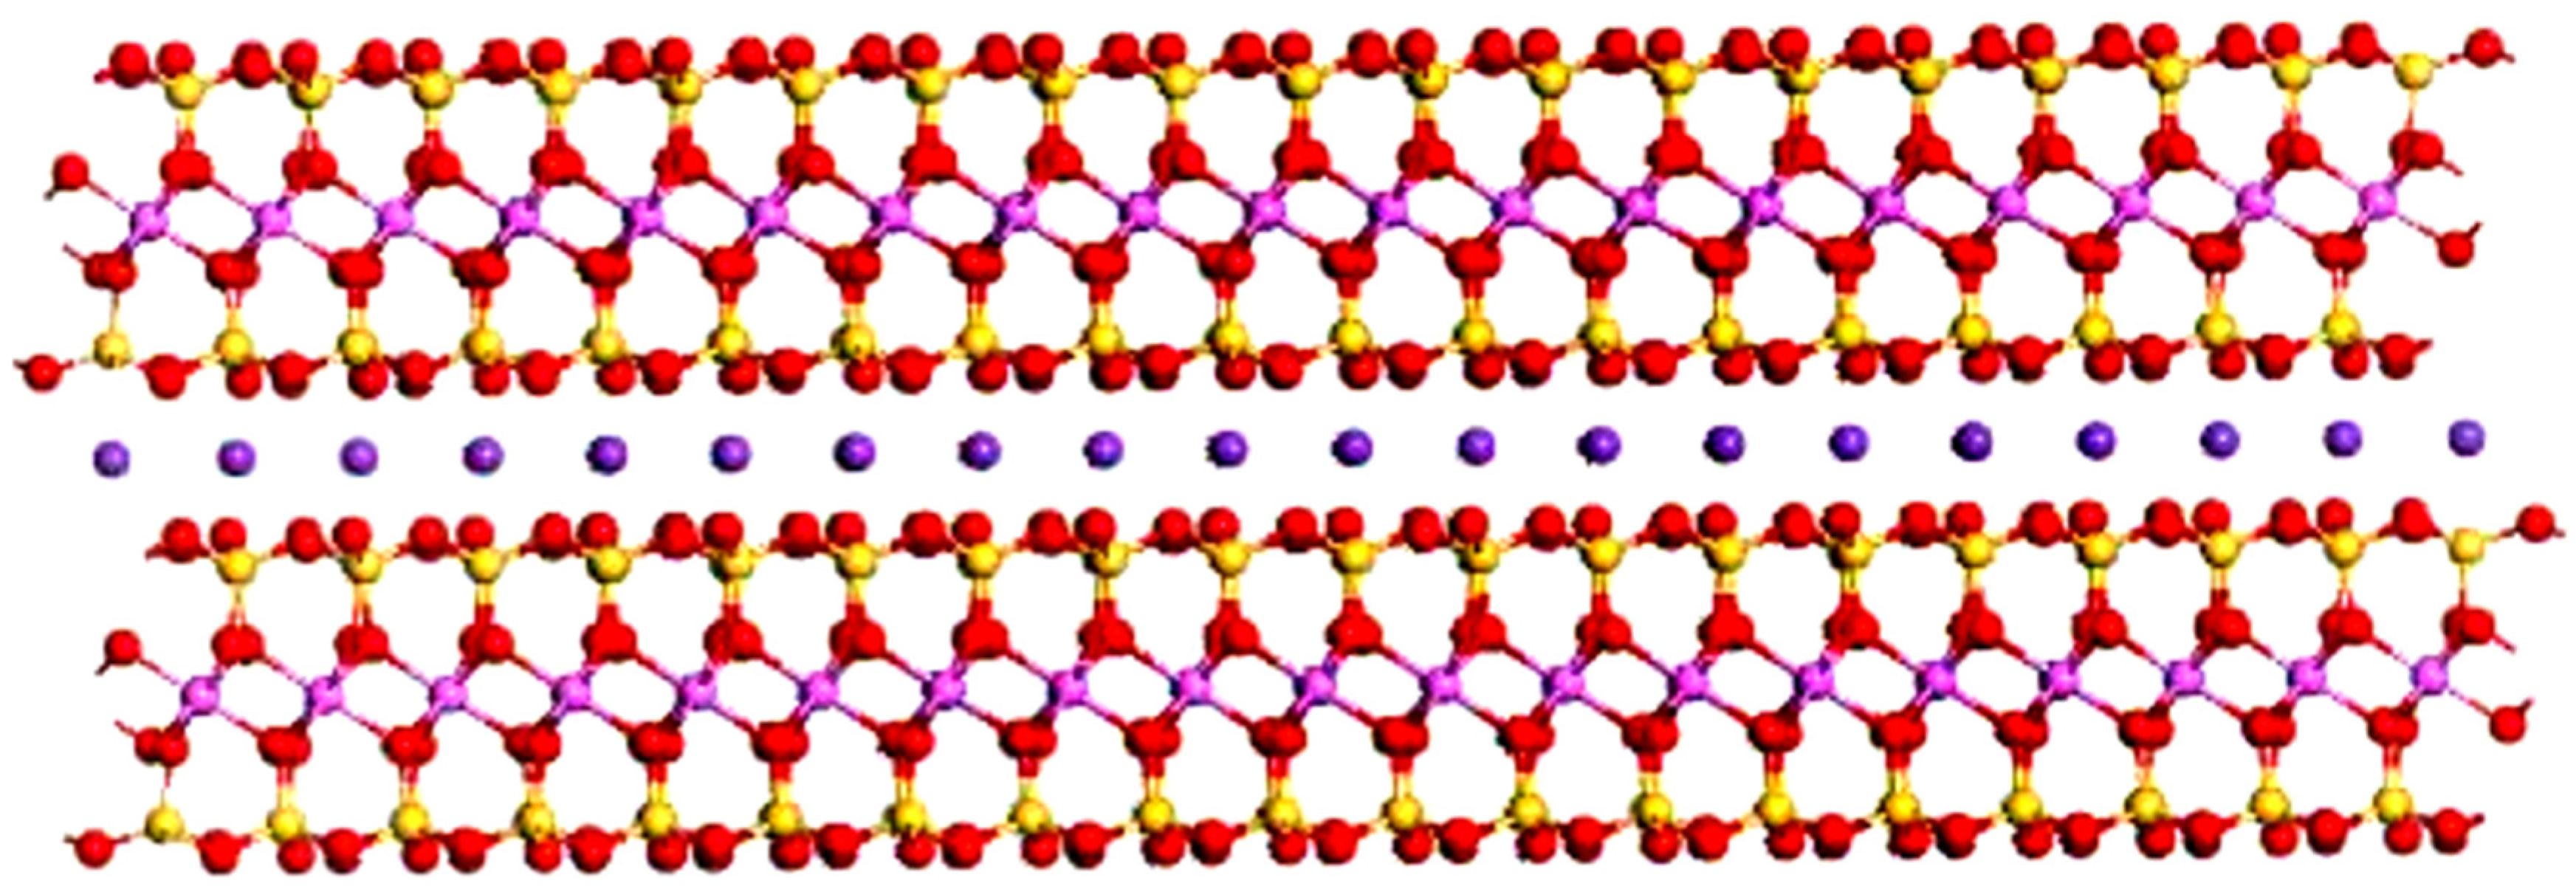
2.2. Illite
The layered structure of illite is composed of two basic units: silicon-oxygen tetrahedron and aluminum-oxygen octahedron [35]. There is no or very small amount of water between the lamellae. Its chemical formula is Kx[SiaAl8-a][AlbMg4-b]O20(OH)4. Under natural conditions, the basic unit of illite will undergo isomorphic replacement, that is, one out of every 32 Si2+ in the silicon-oxygen tetrahedron is replaced by Al3+, and 3 out of every 40 Al3+ in the alumino-octahedron are replaced by Mg2+. The negative charge generated by isomorphic replacement is balanced by the K+ between layers [36]. Using CLAYFF force field to construct the illite crystal model is shown in Figure 2.
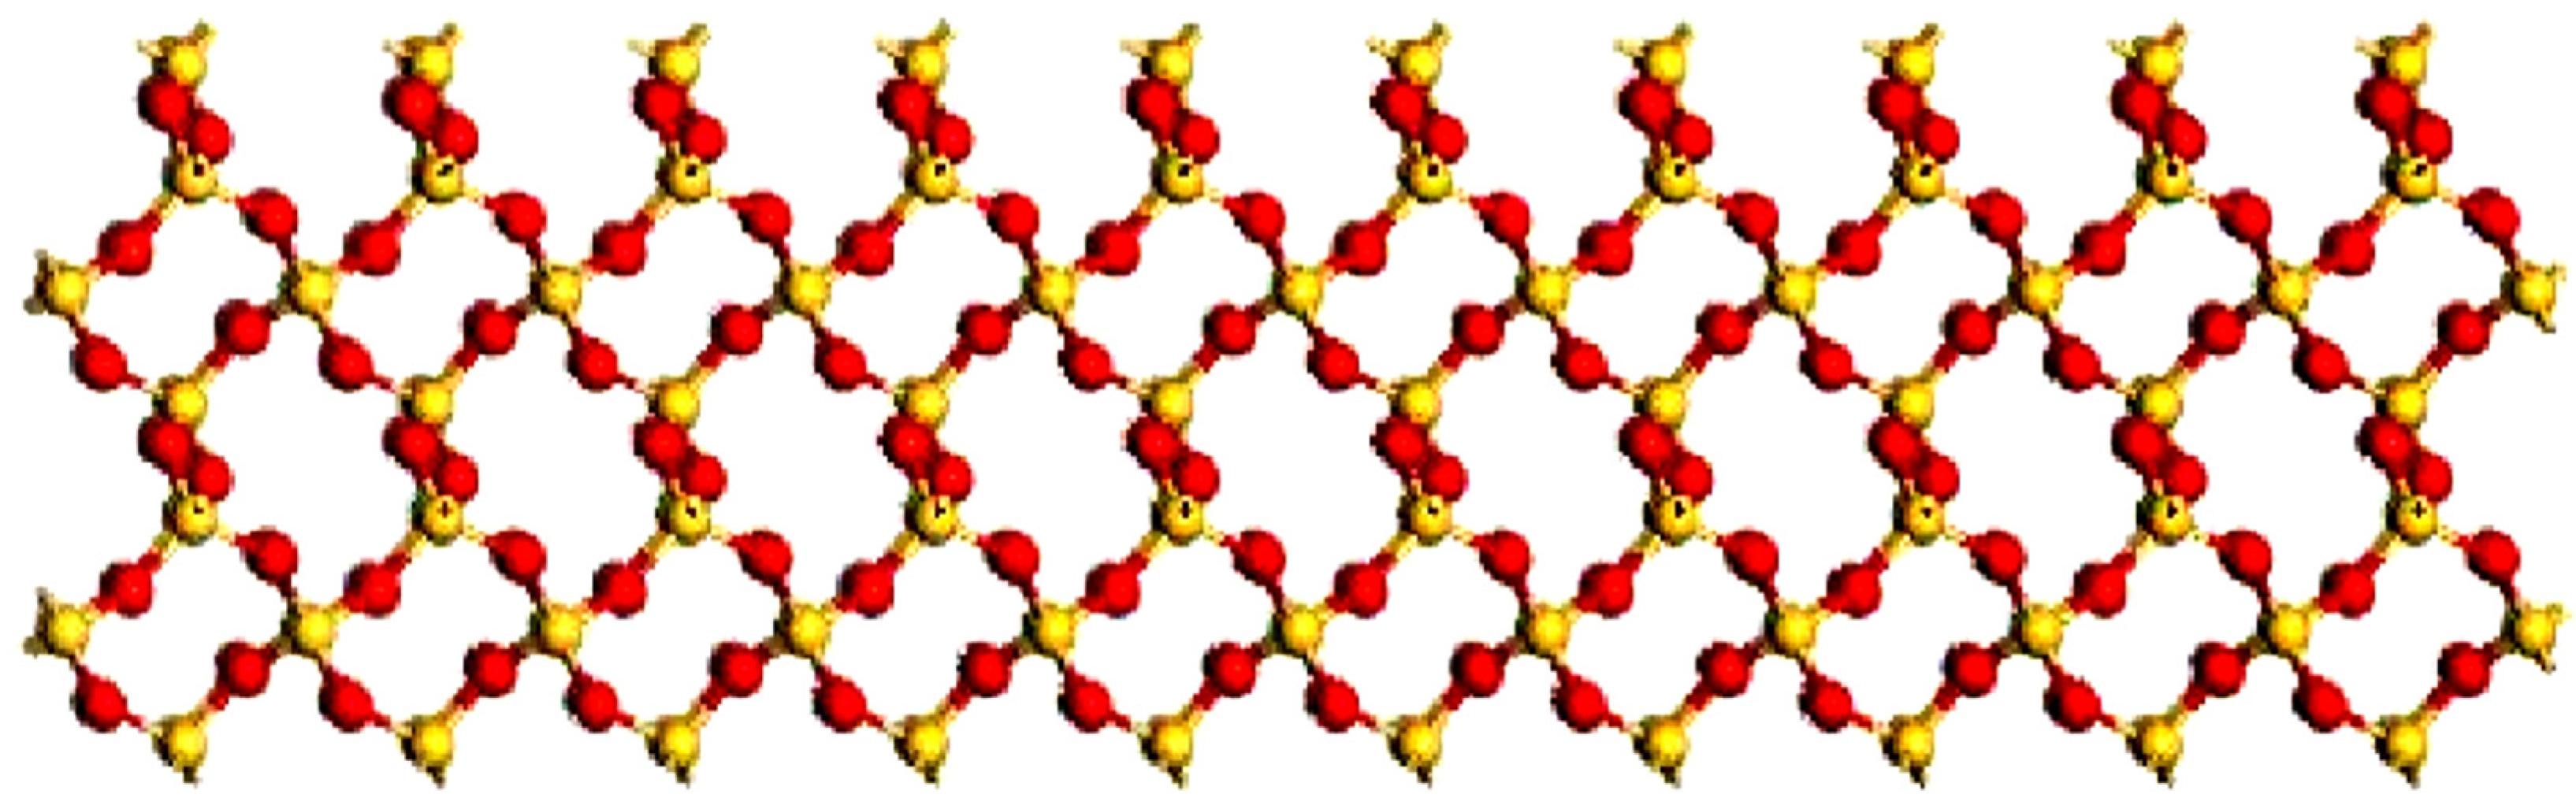
2.3. Quartz
Quartz (SiO4) is a crystalline mineral formed by connecting silicon-oxygen tetrahedrons through a common vertex. Among them, the silicon atom located in the center of the tetrahedron is bonded with four oxygen atoms, and each oxygen atom is bonded with two silicon atoms to form a quartz skeleton structure. The quartz in nature is dominated by α-quartz. Therefore, the α-quartz molecular model based on the CLAYFF force field is shown in Figure 3.
2.4. Kerogen
Kerogen is the main component of shale organic matter, usually without a fixed molecular structure, and is related to factors such as the depositional environment during its formation. The type II of the kerogen molecular model used in this paper is constructed with reference to existing research results [37,38,39]. Table 2 shows the ratio of each element to carbon. The main structure of the kerogen molecule is composed of four to five aromatic hydrocarbons with alkyl groups as linkers. Oxygen atoms appear randomly in aromatic hydrocarbons or on the alkyl chain, and nitrogen and sulfur atoms exist as heterocyclic rings [40]. According to the above principles, multiple kerogen molecules are combined and then the NPT ensemble is used to optimize the model unit cell. The optimized kerogen is shown in Figure 4, and its density is 1.25 g/cm3.
3. Results and Discussion
Using established sorbent molecular models in Section 2, three slit-shaped pore structures are constructed, as shown in Figure 5. In order to clarify the methane adsorption characteristics at HTHP, the pressure range is set from 0 to 60 MPa under isothermal condition, which is 30 °C, 60 °C and 90 °C, respectively, and the simulation method is GCMC. The simulation runs for a total of 300 × 104 time steps to make the system balanced, and the last 50 × 104 time steps are taken for statistical average to determine the equilibrium properties of the gas.
3.1. Characteristics of Methane Adsorption
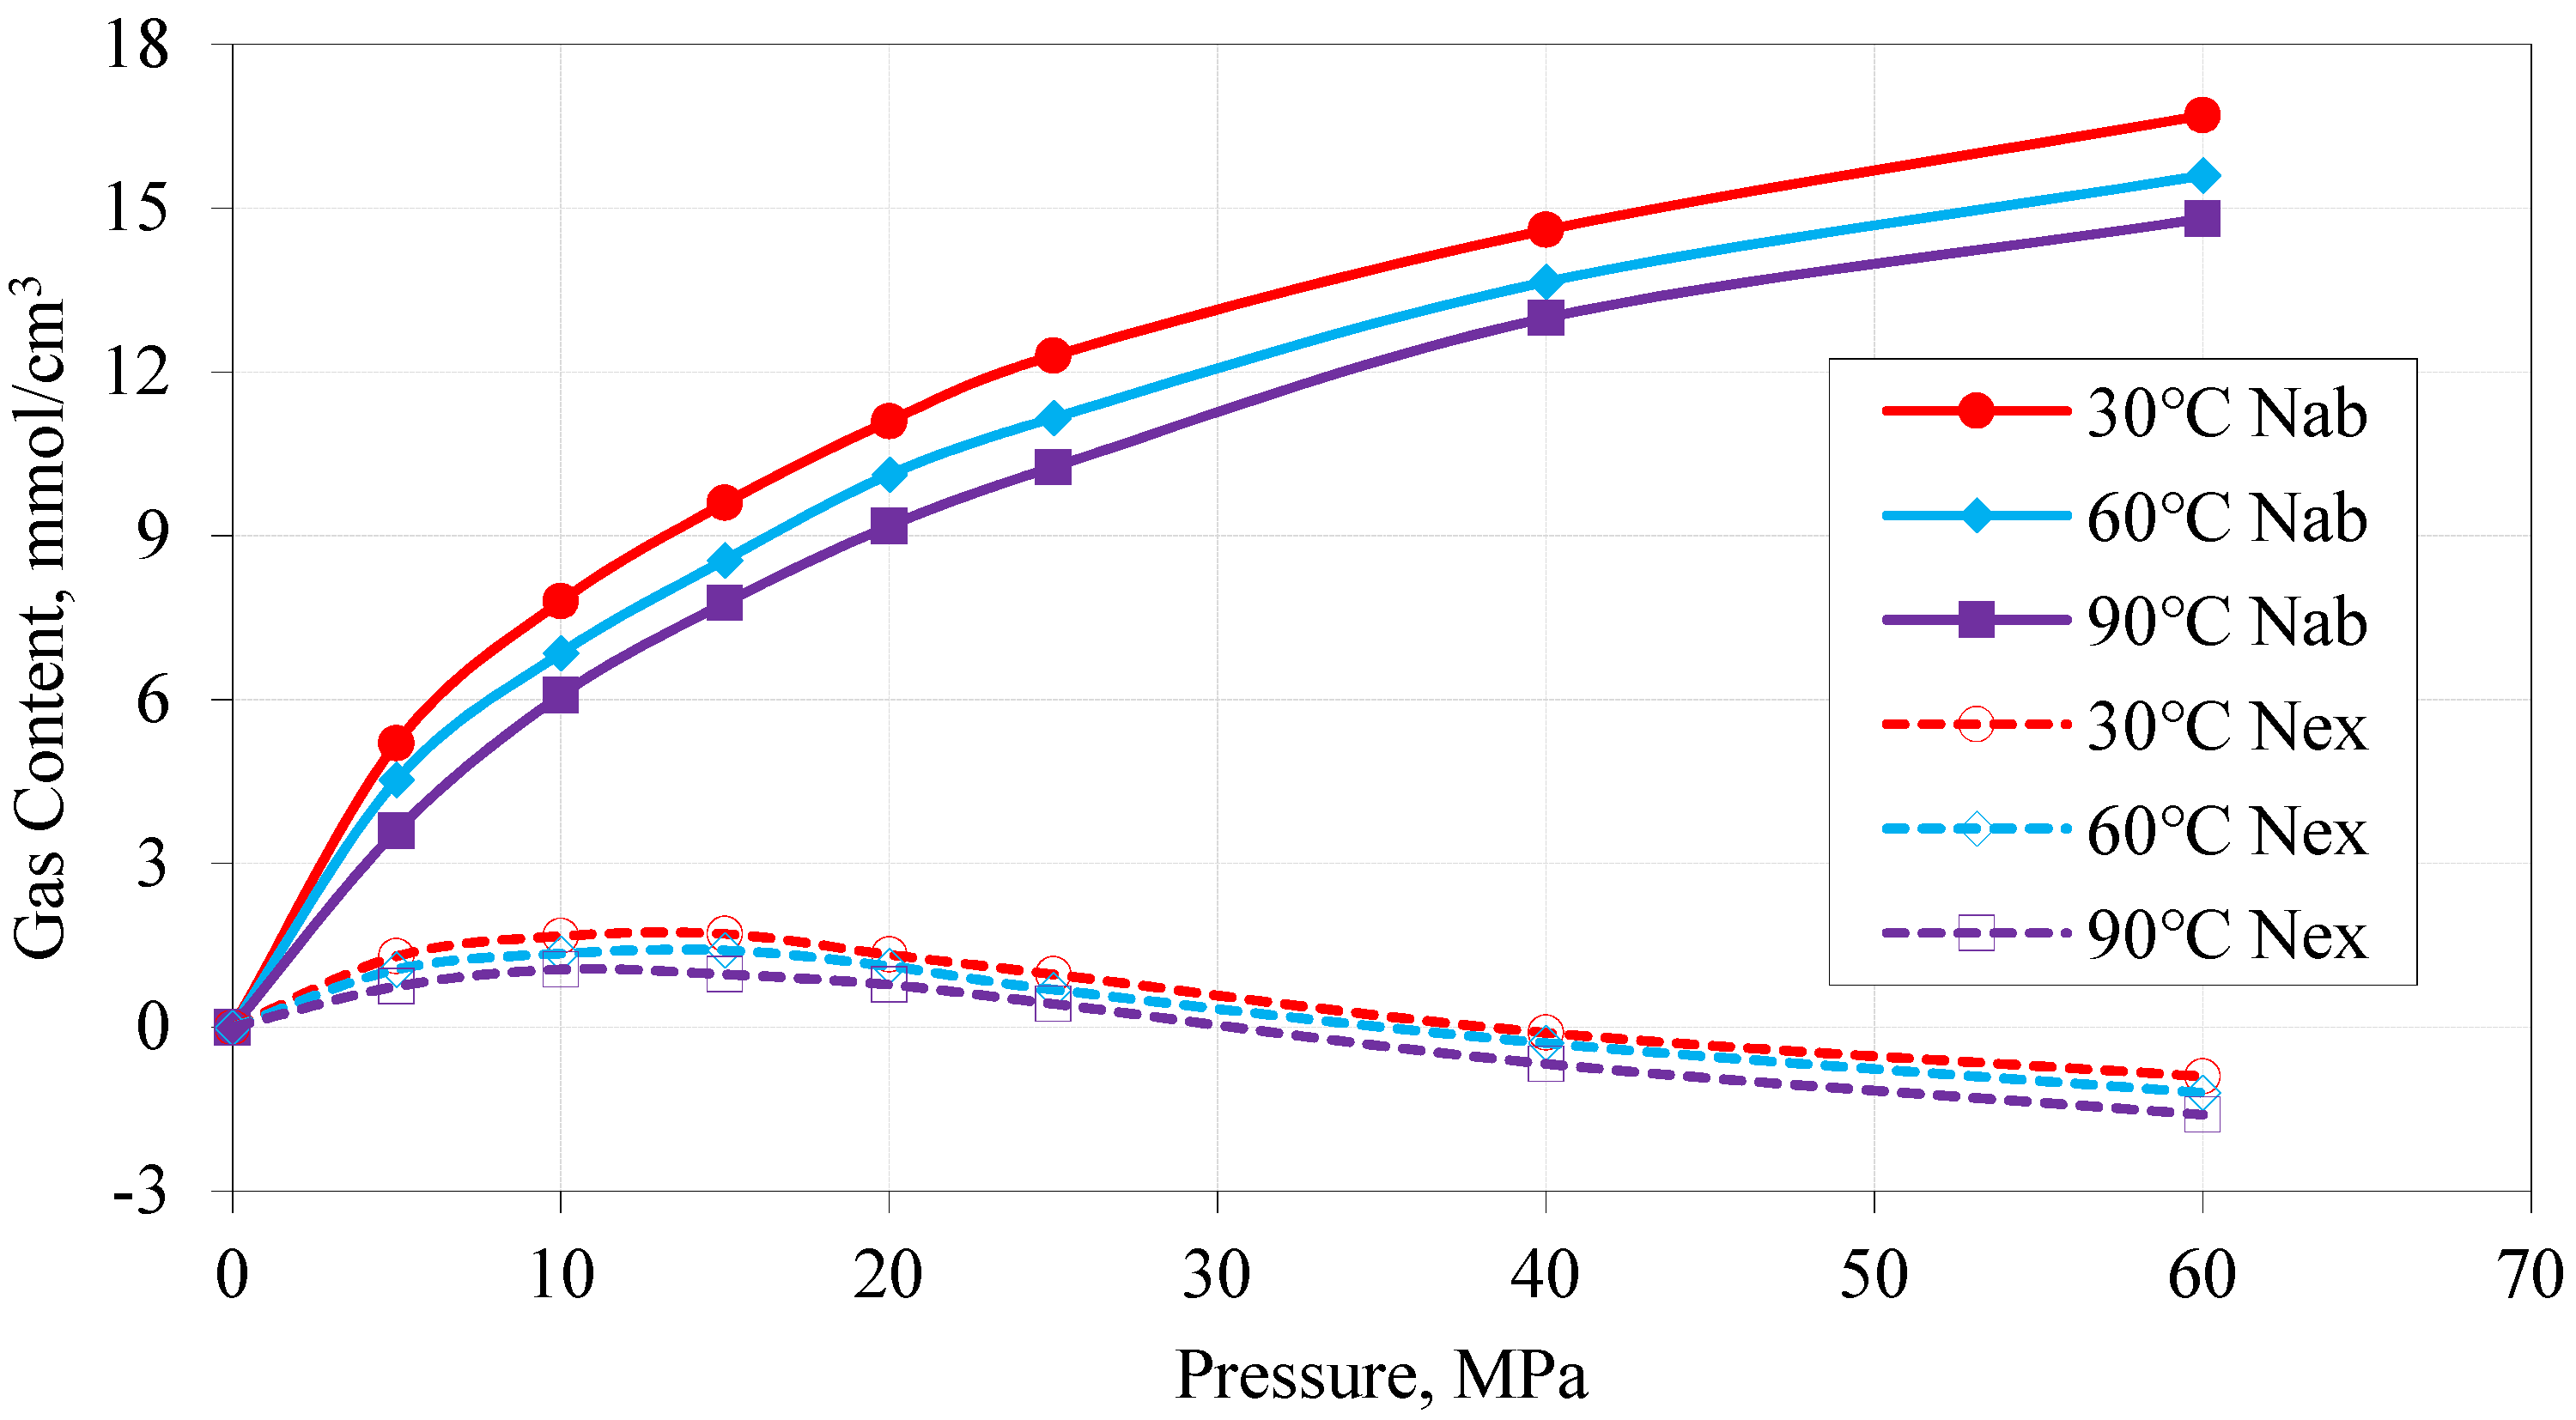
Adsorption volume can divide into absolution adsorption volume calculated by the adsorption model, and excess adsorption volume tested by an isotherm adsorption experiment. The relationship between the two can be expressed as:
However, the value of the adsorption phase density generally regarded as a constant is obviously incorrect although it is hard to test now. By using the molecular simulation technology, combining Formulas (2) and (3), this problem can be solved, no longer referring to this parameter.
where, Nab is absolute adsorption volume, mmol/cm3; Nex is excess adsorption volume, mmol/cm3; ρa is adsorption phase density, mmol/cm3; ρg is free gas density, mmol/cm3; ρ(z) is the methane density on the vertical wall (z axis), mmol/cm3; h is the height of pores and cracks, m; h1 is the boundary of the lower wall adsorption layer, m; h2 is the upper wall surface adsorption layer boundary, m.
The adsorption of methane is simulated by using GCMC, as shown in Figure 6. It can be seen that the absolution adsorption volume increases with the increase of pressure and the decrease of temperature, and the excess adsorption volume increases first and then decreases with pressure increasing, and also is negatively correlated with temperature. Both the methane adsorption characteristics and volume in the low pressure stage are reliable compared to previous research [41].
By simulating the adsorption behavior of methane in a slit-shaped kerogen with a pore diameter of 5 nm under a temperature of 90 °C and a pressure from 5 to 60 MPa, the results are shown in Figure 7. The density near the wall fiercely fluctuates, but that far away from the wall is mild. Comparing the methane density from the National Institute of Standards and Technology (NIST), it is found that the methane density near the wall is significantly higher than the NIST data, and the free gas density not affected by the wall is close to the NIST data. This indicates that adsorption is formed near the pore wall. Combined with the number of peak density, it can be known that when the pressure is lower than 15 MPa, adsorption is single layer, and when higher than 15 MPa, it is double-layer adsorption.
Based on above analysis, it can be confirmed that the proposed models and methods are reasonable, and the simulation results are reliable, which can be used to further study gas adsorption characteristics.
3.2. Effect of Porosity on Methane Adsorption
3.2.1. Shape of Pore
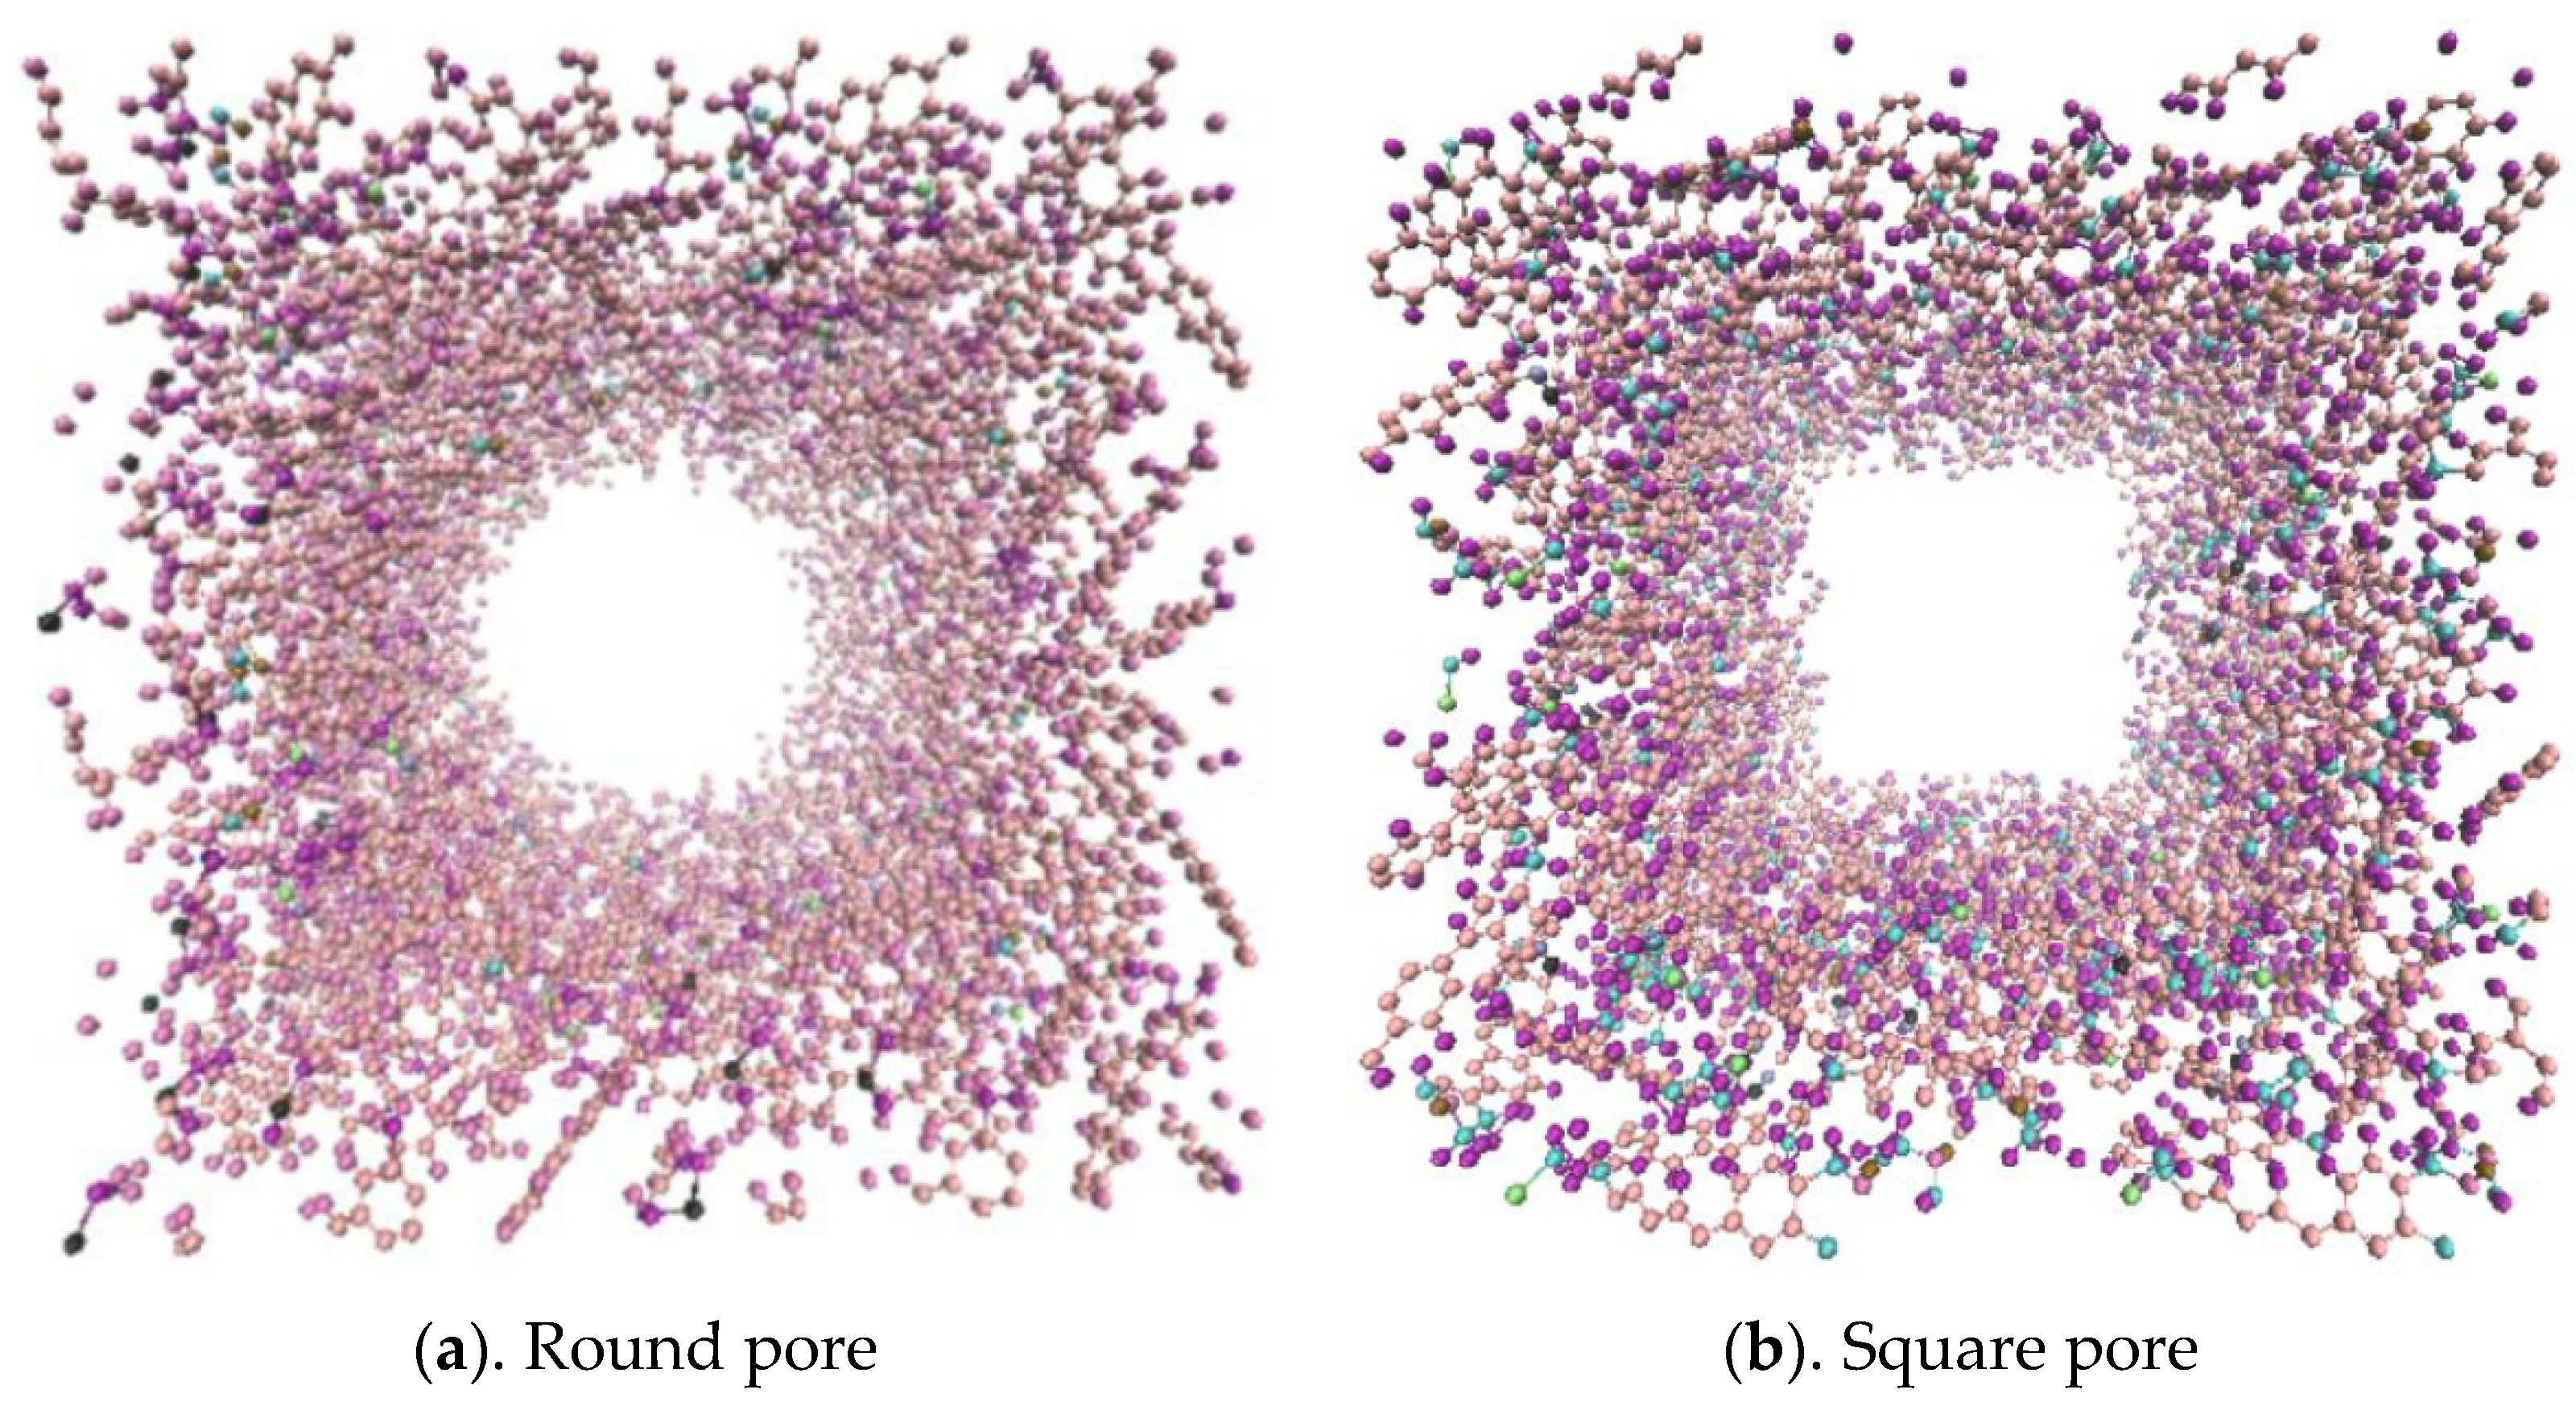
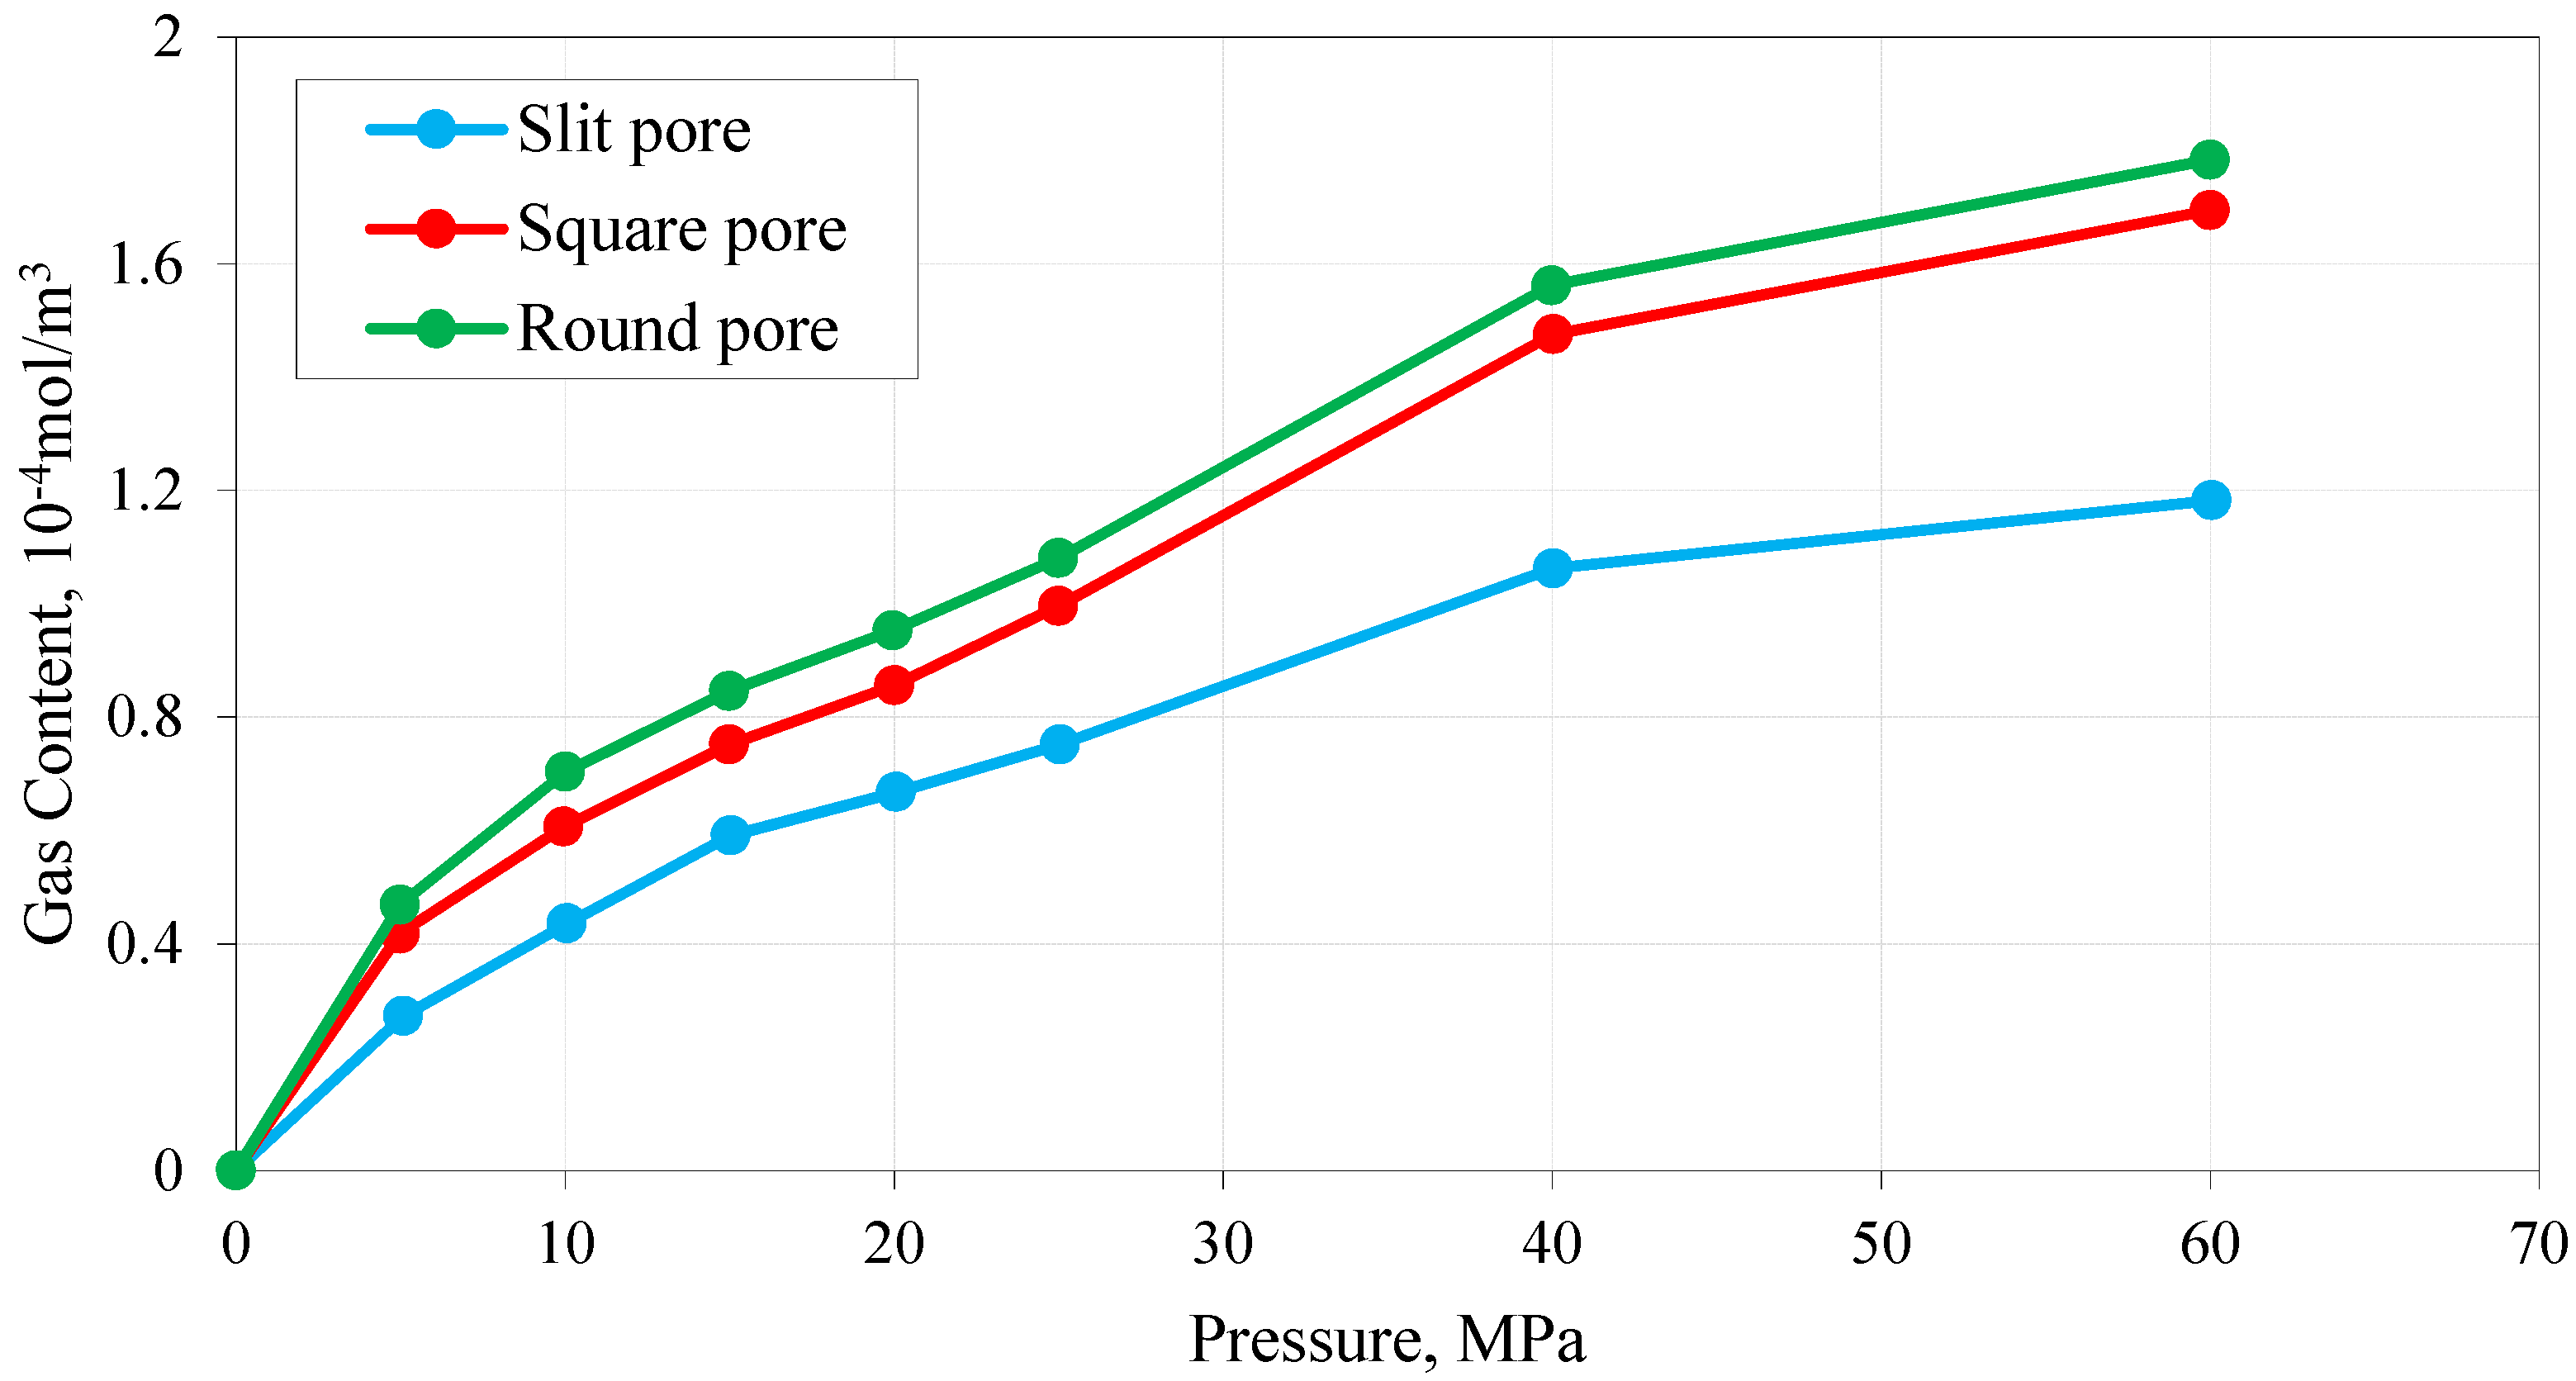
Shale organic pores as an important place to reserve adsorbed gas mainly include micropores (<2 nm) and mesopores (2~50 nm) [42]. Although the pore shape of shale is complicated, containing slit pore, round pore and square pore [43], only the slit-shaped pore is generally considered because of its simplicity. In this paper, the round pore and square pore with a cross-sectional diameter of 3 nm based on the kerogen model is further constructed, as shown in Figure 8, besides building silt pore, as shown in Figure 5a. The simulated temperature is 90 °C and the simulated pressure is still from 0 to 60 MPa. The simulation results are shown in Figure 9 and Figure 10. The results show that the adsorption capacity of methane per unit area from large to small is slit > square pore > round pore. The adsorption capacity of methane per unit volume from large to small is round pore > square pore > slit. For a slit-shape pore, its wall surface has been fully expended with almost no interaction between the potential energy fields on the same side wall surface, and the effect of wall space on adsorption is the greatest, so the adsorption capacity per unit area of the slit is the largest, and the adsorption capacity per unit volume is the smallest. Relatively, for a round pore, due to the bending of the pore wall, the wall potential energy field is superimposed everywhere, and the wall potential energy is the strongest, but the adsorption space is limited, so adsorption capacity per unit volume is the largest, and the adsorption capacity per unit area is the smallest. The characteristics of the square pore are between the characteristics of the slit pore and the circular pore, so the adsorption capacity is also between them.
3.2.2. Size of Pore
Chen et al. [44] deemed that when the pore size is close to the collision diameter of gas molecules, there may be microscopic differences in the adsorption behavior of organic matter. Based on the slit pores of kerogen, the methane adsorption under six groups of different pore sizes (1 nm, 2 nm, 3 nm, 4 nm, 5 nm and 6 nm) at a temperature of 90 °C and a pressure of 25 MPa was simulated. The results are shown in Figure 11. Among them, the red dotted line in the figure is the density of free methane at simulated temperature and pressure, which is 138.226 kg/m3 (from the NIST database). Studies have shown that when the pore diameter is less than 2 nm, the methane density in the middle of the pore is higher than the free state methane density, indicating that the superposition of potential energy occurs in the pore wall at this time, and the methane in the entire pore is adsorbed. Monomolecular adsorption occurs at 1 nm, and bilayer adsorption occurs at 2 nm. When the pore size is greater than 2 nm, the methane density in the middle of the pore is similar to the free state methane density, indicating that there is no interaction between the pore walls at this time. Except for the double-layer adsorption behavior near the pore wall, other methane away from the pore wall should be free state.
3.3. Effect of Matrix Types on Methane Adsorption
Under the conditions of a temperature of 90 °C and a pressure from 5 to 60 MPa, three types of slit-shaped models of kerogen, illite and quartz with a pore diameter of 5 nm were established to simulate the methane adsorption behavior. The simulation results are shown in Figure 7 and Figure 12, Figure 13 and Figure 14. It can be seen from Figure 7, Figure 12 and Figure 13 that only the inside of the kerogen matrix has adsorbed methane molecules. When the pressure reaches 15 MPa, double-layer adsorption appears in the pores of illite; when reaching 20 MPa, obvious double-layer adsorption can be observed in the pores of kerogen and quartz. Furthermore, the third layer adsorption is shown in the pores of illite and quartz, while the kerogen pores are still double-layer adsorption, after the pressure reaches 40 MPa. As shown in Figure 14, by comparing the methane density distribution curve of each sorbent under HTHP (90 °C, 60 MPa), it can be seen that the peak adsorption density from big to small is illite > kerogen > quartz, and the thickness of the adsorption layer is kerogen > illite > quartz. This shows that the content of kerogen has the most significant influence on the adsorption capacity of shale.
4. Conclusions
In this paper, given the complex shale reservoirs conditions, adsorption characteristics of methane at HTHP are revealed by using molecular simulation with GCMC and DM. By contrast with previous molecular simulation research on methane adsorption with a single adsorbent, the integrated effects of three sorbents, pore size, and in situ condition on methane adsorption are considered. The proposed method and analysis are helpful to further determine the adsorption in deep shale reservoirs. According to the above results and analysis, the following conclusions can be drawn:
(1) Based on the valid force field, two types of three sorbent models are constructed, including inorganic matter represented by illite and quartz, and organic matter represented by kerogen. Besides a slit pore, a round pore and square pore based on the kerogen are further constructed considering the complex pore shapes in organic matter.
(2) Adsorption characteristics of methane at HTHP are determined. Based on molecular simulation technology, methane sorption is simulated with the larger changes of temperature and pressure, wherein the sorption features at low temperature and low pressure are reliable. The results show that the absolute adsorption volume increases with the increase of pressure, and the excess adsorption appears as negative adsorption under high pressure, even when the volume is negative.
(3) The influence of pore shape and size, sorbent type on adsorption under high temperature, and pressure conditions is revealed. The potential energy superposition for the round pore wall is the most significant, and for the slit wall is the weakest. Therefore, the adsorption capacity per unit area is the largest, and the round pore is the smallest. The adsorption capacity per unit volume is just the opposite. The smaller the pore size, the more obvious the superposition of potential energy and the larger the proportion of adsorbed gas. Multi-layer adsorption can occur in each sorbent at HTHP.
Although many achievements have been obtained, some key problems still need to be further studied. For example, current equivalent models of shale are idealistic, usually using the slit model or integrated slit, such as a parallel plate with one side being organic matter like kerogen and other side being inorganic matter like quartz. How to reconstruct the more realistic adsorbent is crucial. Moreover, with increase of reservoir development depth, accurately describing the adsorption features becoming important, however, there is still a lack of relevant reports at present. Meanwhile, how to accurately describe the adsorption features is also important, but there is still a lack of relevant reports at present.
Author Contributions
C.C.—Original draft, Investigation, Formal analysis, and Writing; J.Z.—Project administration; H.H.—Conceptualisation, Methodology, Writing; D.Z.—Data Curation and Visualization; Y.Z.—Conceptualisation, Methodology, Supervision, Funding acquisition. All authors have read and agreed to the published version of the manuscript.
Funding
This research received no external funding.
Acknowledgments
This work was funded by National Natural Science Foundation of China (Grant No. 52074235, 52174036), Science and Technology Cooperation Project of the CNPC-SWPU Innovation Alliance (No. 2020CX020202, 2020CX030202, 2020CX010403), Sichuan Science and Technology Program (No. 2021YJ0345) and 111 Project (No. D18016).
Conflicts of Interest
The authors declare no conflict of interest.
References
- Li, A.; Han, W.; Fang, Q.; Memon, A.; Ma, M. Experimental investigation of methane adsorption and desorption in water-bearing shale. Capillarity 2020, 3, 45–55. [Google Scholar] [CrossRef]
- Chen, F.; Lu, S.; Ding, X.; Ju, Y. Evaluation of the density and thickness of adsorbed methane in differently sized pores contributed by various components in a shale gas reservoir: A case study of the Longmaxi Shale in Southeast Chongqing, China. Chem. Eng. J. 2019, 367, 123–138. [Google Scholar] [CrossRef]
- Li, K.; Kong, S.; Xia, P.; Wang, X. Microstructural characterisation of organic matter pores in coal-measure shale. Adv. Geo-Energy Res. 2020, 4, 372–391. [Google Scholar] [CrossRef]
- Zhang, L.H.; Chen, Z.X.; Zhao, Y.L. Well Production Performance Analysis for Shale Gas Reservoirs; Elsevier: Amsterdam, The Netherland, 2019; pp. 2–39. [Google Scholar]
- Jiang, W.; Cao, G.; Luo, C.; Lin, M.; Ji, L.; Zhou, L. A composition-based model for methane adsorption of overmature shales in Wufeng and Longmaxi Formation, Sichuan Basin. Chem. Eng. J. 2022, 429, 130766. [Google Scholar] [CrossRef]
- Langmuir, I. The adsorption of gases on plane surfaces of glass, mica and platinum. J. Am. Chem. Soc. 1918, 40, 1361–1403. [Google Scholar] [CrossRef] [Green Version]
- Zhao, Y.L.; Lu, G.; Zhang, L.H.; Wei, Y.S.; Guo, J.J.; Chang, C. Numerical simulation of shale gas reservoirs considering discrete fracture network using a coupled multiple transport mechanisms and geomechanics model. J. Pet. Sci. Eng. 2020, 195, 107588. [Google Scholar] [CrossRef]
- Eundayo, J.M.; Razaee, R.; Fana, C.Y. Experimental investigation and mathematical modelling of shale gas adsorption and desorption hysteresis. J. Nat. Gas Sci. Eng. 2021, 88, 103761. [Google Scholar] [CrossRef]
- Brunauer, S.; Emmett, P.H.; Teller, E. Adsorption of gases in multimolecular layers. J. Am. Chem. Soc. 1938, 60, 309–319. [Google Scholar] [CrossRef]
- Fan, L.; Liu, S.M. A novel experimental system for accurate gas sorption and its application to various shale rocks. Chem. Eng. Res. Des. 2021, 165, 180–191. [Google Scholar] [CrossRef]
- Wang, Y.; Tao, C.; Ni, X.; Gao, X.; He, Y. Amount of adsorbed gas in deep coal reservoir based on adsorption potential theory. J. China Coal Soc. 2018, 43, 1547–1552. [Google Scholar]
- Dubinin, M.M.; Astakhov, V.A. Development of the concepts of volume filling of micropores in the adsorption of gases and vapors by microporous adsorbents. Russ. Chem. Bull. 1971, 20, 3–7. [Google Scholar] [CrossRef]
- Dubinin, M.M.; Stoeckli, H.F. Homogeneous and heterogeneous micropore structures in carbonaceous adsorbents. J. Colloid Interface Sci. 1980, 75, 34–42. [Google Scholar] [CrossRef] [Green Version]
- Zuo, L.; Wang, Y.P.; Guo, W. Predicting the sorption isotherm of methane on shale with simplified local-density model. Nat. Gas Geosci. 2015, 26, 592–598. [Google Scholar]
- Kong, S.; Huang, X.; Li, K.; Song, X. Adsorption/desorption isotherms of CH4 and C2H6 on typical shale samples. Fuel 2019, 255, 115632. [Google Scholar] [CrossRef]
- Chen, Y.F.; Jiang, C.B.; Leung, J.Y.; Wojtanowicz, A.K.; Zhang, D.M. Multiscale characterization of shale pore-fracture system: Geological controls on gas transport and pore size classification in shale reservoirs. J. Pet. Sci. Eng. 2021, 202, 108442. [Google Scholar] [CrossRef]
- Chareonsuppanimit, P.; Mohammad, S.A.; Robinson, R.L.; Gasem, K.A.M. High-pressure adsorption of gases on shales: Measurements and modeling. Int. J. Coal Geol. 2012, 95, 34–46. [Google Scholar] [CrossRef]
- Ono, S.; Kondo, S. Molecular Theory of Surface Tension; Springer: Berlin, Germany, 1960. [Google Scholar]
- Bi, H.; Jiang, Z.; Li, J.; Xiong, F.; Peng, L.; Lei, C. Ono-Kondo model for supercritical shale gas storage: A case study of Silurian Longmaxi Shale in Southeast Chongqing, China. Energy Fuels 2017, 31, 2755–2764. [Google Scholar] [CrossRef]
- Zhou, S.; Zhang, D.; Wang, H.; Li, X. A modified BET equation to investigate supercritical methane adsorption mechanisms in shale. Mar. Pet. Geol. 2019, 105, 284–292. [Google Scholar] [CrossRef]
- Pang, W.; Jin, Z. Ono-Kondo lattice model for propane multilayer adsorption in organic nanopores in relation to shale gas. Fuel 2019, 235, 158–166. [Google Scholar] [CrossRef]
- Zhou, S.; Ning, Y.; Wang, H.; Liu, H.; Xue, H. Investigation of methane adsorption mechanism on Longmaxi shale by combining the micropore filling and monolayer coverage theories. Adv. Geo-Energy Res. 2018, 2, 269–281. [Google Scholar] [CrossRef] [Green Version]
- Xiong, J.; Liu, X.J.; Liang, L.X. Adsorption of methane in quartz by Grand Canonical Monte Carlo simulation. Nat. Gas Geosci. 2016, 27, 1532–1540. [Google Scholar]
- Zhang, F.Y.; Sui, H.G.; Yao, J.; Zhang, L. Molecular simulation of shale gas adsorption in organic matter. Sci. Sin. Phys. Mech. Astron. 2017, 47, 114615. [Google Scholar] [CrossRef]
- Shi, H.J.; Chen, C.; Gong, L.; Bai, Z.; Sun, S.Y. Characteristic of Adsorption and Diffusion for Methane in Kerogen. J. Eng. Thermophys. 2019, 40, 1338–1343. [Google Scholar]
- Lv, Z.L.; Ning, Z.F.; Wang, Q.; Huang, L.; Meng, H.; Yu, X.F.; Qin, H.B. Molecular simulation of methane adsorption behavior on clay minerals. J. China Coal Soc. 2019, 44, 3117–3124. [Google Scholar]
- Huang, T.; Liu, D.H.; Sun, J. Simulation on adsorption of methane in micro-pore of clay minerals. Sci. Technol. Eng. 2020, 20, 141–145. [Google Scholar]
- Guo, F.G.; Wang, S.; Feng, Q.H.; Yao, X.Y.; Xue, Q.Z.; Li, X.F. Adsorption and absorption of supercritical methane within shale kerogen slit. J. Mol. Liq. 2020, 320, 114364. [Google Scholar] [CrossRef]
- Sun, Z.; Li, X.F.; Liu, W.Y.; Zhang, T.; He, M.X.; Nasrabadi, H. Molecular dynamics of methane flow behavior through realistic organic nanopores under geologic shale condition: Pore size and kerogen types. Chem. Eng. J. 2020, 398, 124341. [Google Scholar] [CrossRef]
- Kawthar, A.B.; Berihun, M.N.; Muhammed, R.M.; Tigabwa, Y.A.; Shiferaw, R.J. Molecular simulation study of CO2/CH4 adsorption on realistic heterogeneous shale surfaces. Appl. Surf. Sci. 2021, 543, 148789. [Google Scholar]
- Sun, Q.; Liu, W.; Zhang, N. Molecular insights into recovery of shale gas by CO2 injection in kerogen slit nanopores. J. Nat. Gas Sci. Eng. 2021, 90, 103903. [Google Scholar] [CrossRef]
- Gou, Q.; Xu, S. Quantitative evaluation of free gas and adsorbed gas content of Wufeng-Longmaxi shales in the Jiaoshiba area, Sichuan Basin, China. Adv. Geo-Energy Res. 2019, 3, 258–267. [Google Scholar] [CrossRef] [Green Version]
- Liu, X.Y.; Zhang, L.H.; Zhao, Y.L.; He, X.; Wu, J.F.; Su, S.W. Shale gas transport in nanopores: Contribution of different transport mechanisms and influencing factors. Energy Fuels 2021, 35, 2033–2047. [Google Scholar] [CrossRef]
- Martin, M.G.; Siepmann, J.I. Transferable potentials for phase equilibria. 1. united-atom description of n-alkanes. J. Phys. Chem. B 1998, 102, 2569–2577. [Google Scholar] [CrossRef]
- Ji, L.M.; Qiu, J.L.; Zhang, T.W.; Xia, Y.Q. Experiments on methane adsorption of common clay minerals in shale. Earth Sci. J. China Univ. Geosci. 2012, 37, 1043–1050. [Google Scholar]
- Xiong, J. Investigation of the Influences of the Methane Adsorption Capacity on the Shales; Southwest Petroleum University: Chengdu, China, 2015. [Google Scholar]
- Vandenbroucke, M. Kerogen: From types to models of chemical structure. Oil Gas Sci. Technol. 2003, 58, 243–269. [Google Scholar] [CrossRef] [Green Version]
- Collell, J.; Ungerer, P.; Galliero, G.; Yiannourakou, M.; Montel, F.; Pujol, M. Molecular simulation of bulk organic matter in type II shales in the middle of the oil formation window. Energy Fuels 2014, 28, 7457–7466. [Google Scholar] [CrossRef]
- Mayo, S.L.; Olafson, B.D.; Goddard, W.A. Dreiding: A generic force field for molecular simulations. J. Phys. Chem. 1990, 94, 8897–8909. [Google Scholar] [CrossRef]
- Liu, X.J.; Luo, D.X.; Xiong, J.; Liang, L.X. Construction of the average molecular modeling of the kerogen from the Longmaxi formation. Chem. Ind. Eng. Prog. 2017, 36, 530–537. [Google Scholar]
- Sui, H.G. Molecular Simulation Studies of Shale Gas Adsorption Behavior in Reservoir; China University of Petroleum (East China): Qingdao, China, 2016. [Google Scholar]
- Zhang, L.H.; Liang, H.B.; Zhao, Y.L.; Xie, J.; Peng, X.; Li, Q. Gas transport characteristics in shale matrix based on multiple mechanisms. Chem. Eng. J. 2020, 386, 124002. [Google Scholar] [CrossRef]
- Song, W.; Yao, J.; Ma, J.; Li, A.; Li, Y.; Sun, H.; Zhang, L. Grand canonical Monte Carlo simulations of pore structure influence on methane adsorption in micro-porous carbons with applications to coal and shale systems. Fuel 2018, 215, 196–203. [Google Scholar] [CrossRef]
- Chen, Y.; Zhang, L.; Li, J. Nano-scale pore structure and fractal dimension of lower Silurian Longmaxi Shale. Chem. Technol. Fuels Oils 2018, 54, 354–366. [Google Scholar] [CrossRef]
Figure 1.
Different expressions of methane.

Figure 2.
Schematic diagram of illite structure. The red particles are oxygen atoms, the yellow particles are silicon atoms, the pink particles are aluminum atoms, and the purple particles between layers are potassium ions.
Figure 2.
Schematic diagram of illite structure. The red particles are oxygen atoms, the yellow particles are silicon atoms, the pink particles are aluminum atoms, and the purple particles between layers are potassium ions.

Figure 3.
Schematic diagram of α-quartz structure. Red particles are oxygen atoms; yellow particles are silicon atoms.
Figure 3.
Schematic diagram of α-quartz structure. Red particles are oxygen atoms; yellow particles are silicon atoms.

Figure 4.
Molecular model of kerogen.

Figure 5.
Schematic diagram of pore structures of different shale matrix.

Figure 6.
Methane isotherm adsorption curves at different temperatures.

Figure 7.
Methane density distribution curves in the slit-shaped pore space of kerogen (including pore walls).
Figure 7.
Methane density distribution curves in the slit-shaped pore space of kerogen (including pore walls).

Figure 8.
Different pore shape models.

Figure 9.
Methane adsorption per unit area.

Figure 10.
Methane adsorption per unit volume.

Figure 11.
Density distribution curves of methane in pore spaces of different sizes.

Figure 12.
Methane density distribution curve in illite slit-shaped pore space (including pore walls).
Figure 12.
Methane density distribution curve in illite slit-shaped pore space (including pore walls).

Figure 13.
Methane density distribution curve in quartz slit-shaped pore space (including pore walls).
Figure 13.
Methane density distribution curve in quartz slit-shaped pore space (including pore walls).

Figure 14.
Methane density distribution curve in different matrix pores.


Table 1.
TraPPE potential energy parameters for united atom of methane.
| Type of Model | Ratio of ε/kB, K | Collision Diameter δ, nm | Atomic Charge q, e |
|---|---|---|---|
| United atom of methane | 148.1 | 0.373 | 0 |
where, ε is potential well, kJ/mol; kB is Boltzmann constant, MPa·m3/K.
Table 2.
Elemental composition table of kerogen.
| Type of Kerogen | H/C | O/C | S/C | N/C |
|---|---|---|---|---|
| Type II | 0.5 | 0.02 | 0.005 | 0.005 |
Publisher’s Note: MDPI stays neutral with regard to jurisdictional claims in published maps and institutional affiliations. |
© 2022 by the authors. Licensee MDPI, Basel, Switzerland. This article is an open access article distributed under the terms and conditions of the Creative Commons Attribution (CC BY) license (https://creativecommons.org/licenses/by/4.0/).
Share and Cite
MDPI and ACS Style
Chang, C.; Zhang, J.; Hu, H.; Zhang, D.; Zhao, Y. Molecular Simulation of Adsorption in Deep Marine Shale Gas Reservoirs. Energies 2022, 15, 944. https://doi.org/10.3390/en15030944
AMA Style
Chang C, Zhang J, Hu H, Zhang D, Zhao Y. Molecular Simulation of Adsorption in Deep Marine Shale Gas Reservoirs. Energies. 2022; 15(3):944. https://doi.org/10.3390/en15030944
Chicago/Turabian StyleChang, Cheng, Jian Zhang, Haoran Hu, Deliang Zhang, and Yulong Zhao. 2022. "Molecular Simulation of Adsorption in Deep Marine Shale Gas Reservoirs" Energies 15, no. 3: 944. https://doi.org/10.3390/en15030944
Note that from the first issue of 2016, this journal uses article numbers instead of page numbers. See further details here.