
Study on Surface Subsidence Characteristics Based on Three-Dimensional Test Device for Simulating Rock Strata and Surface Movement

 ,
,
Abstract
:1. Introduction
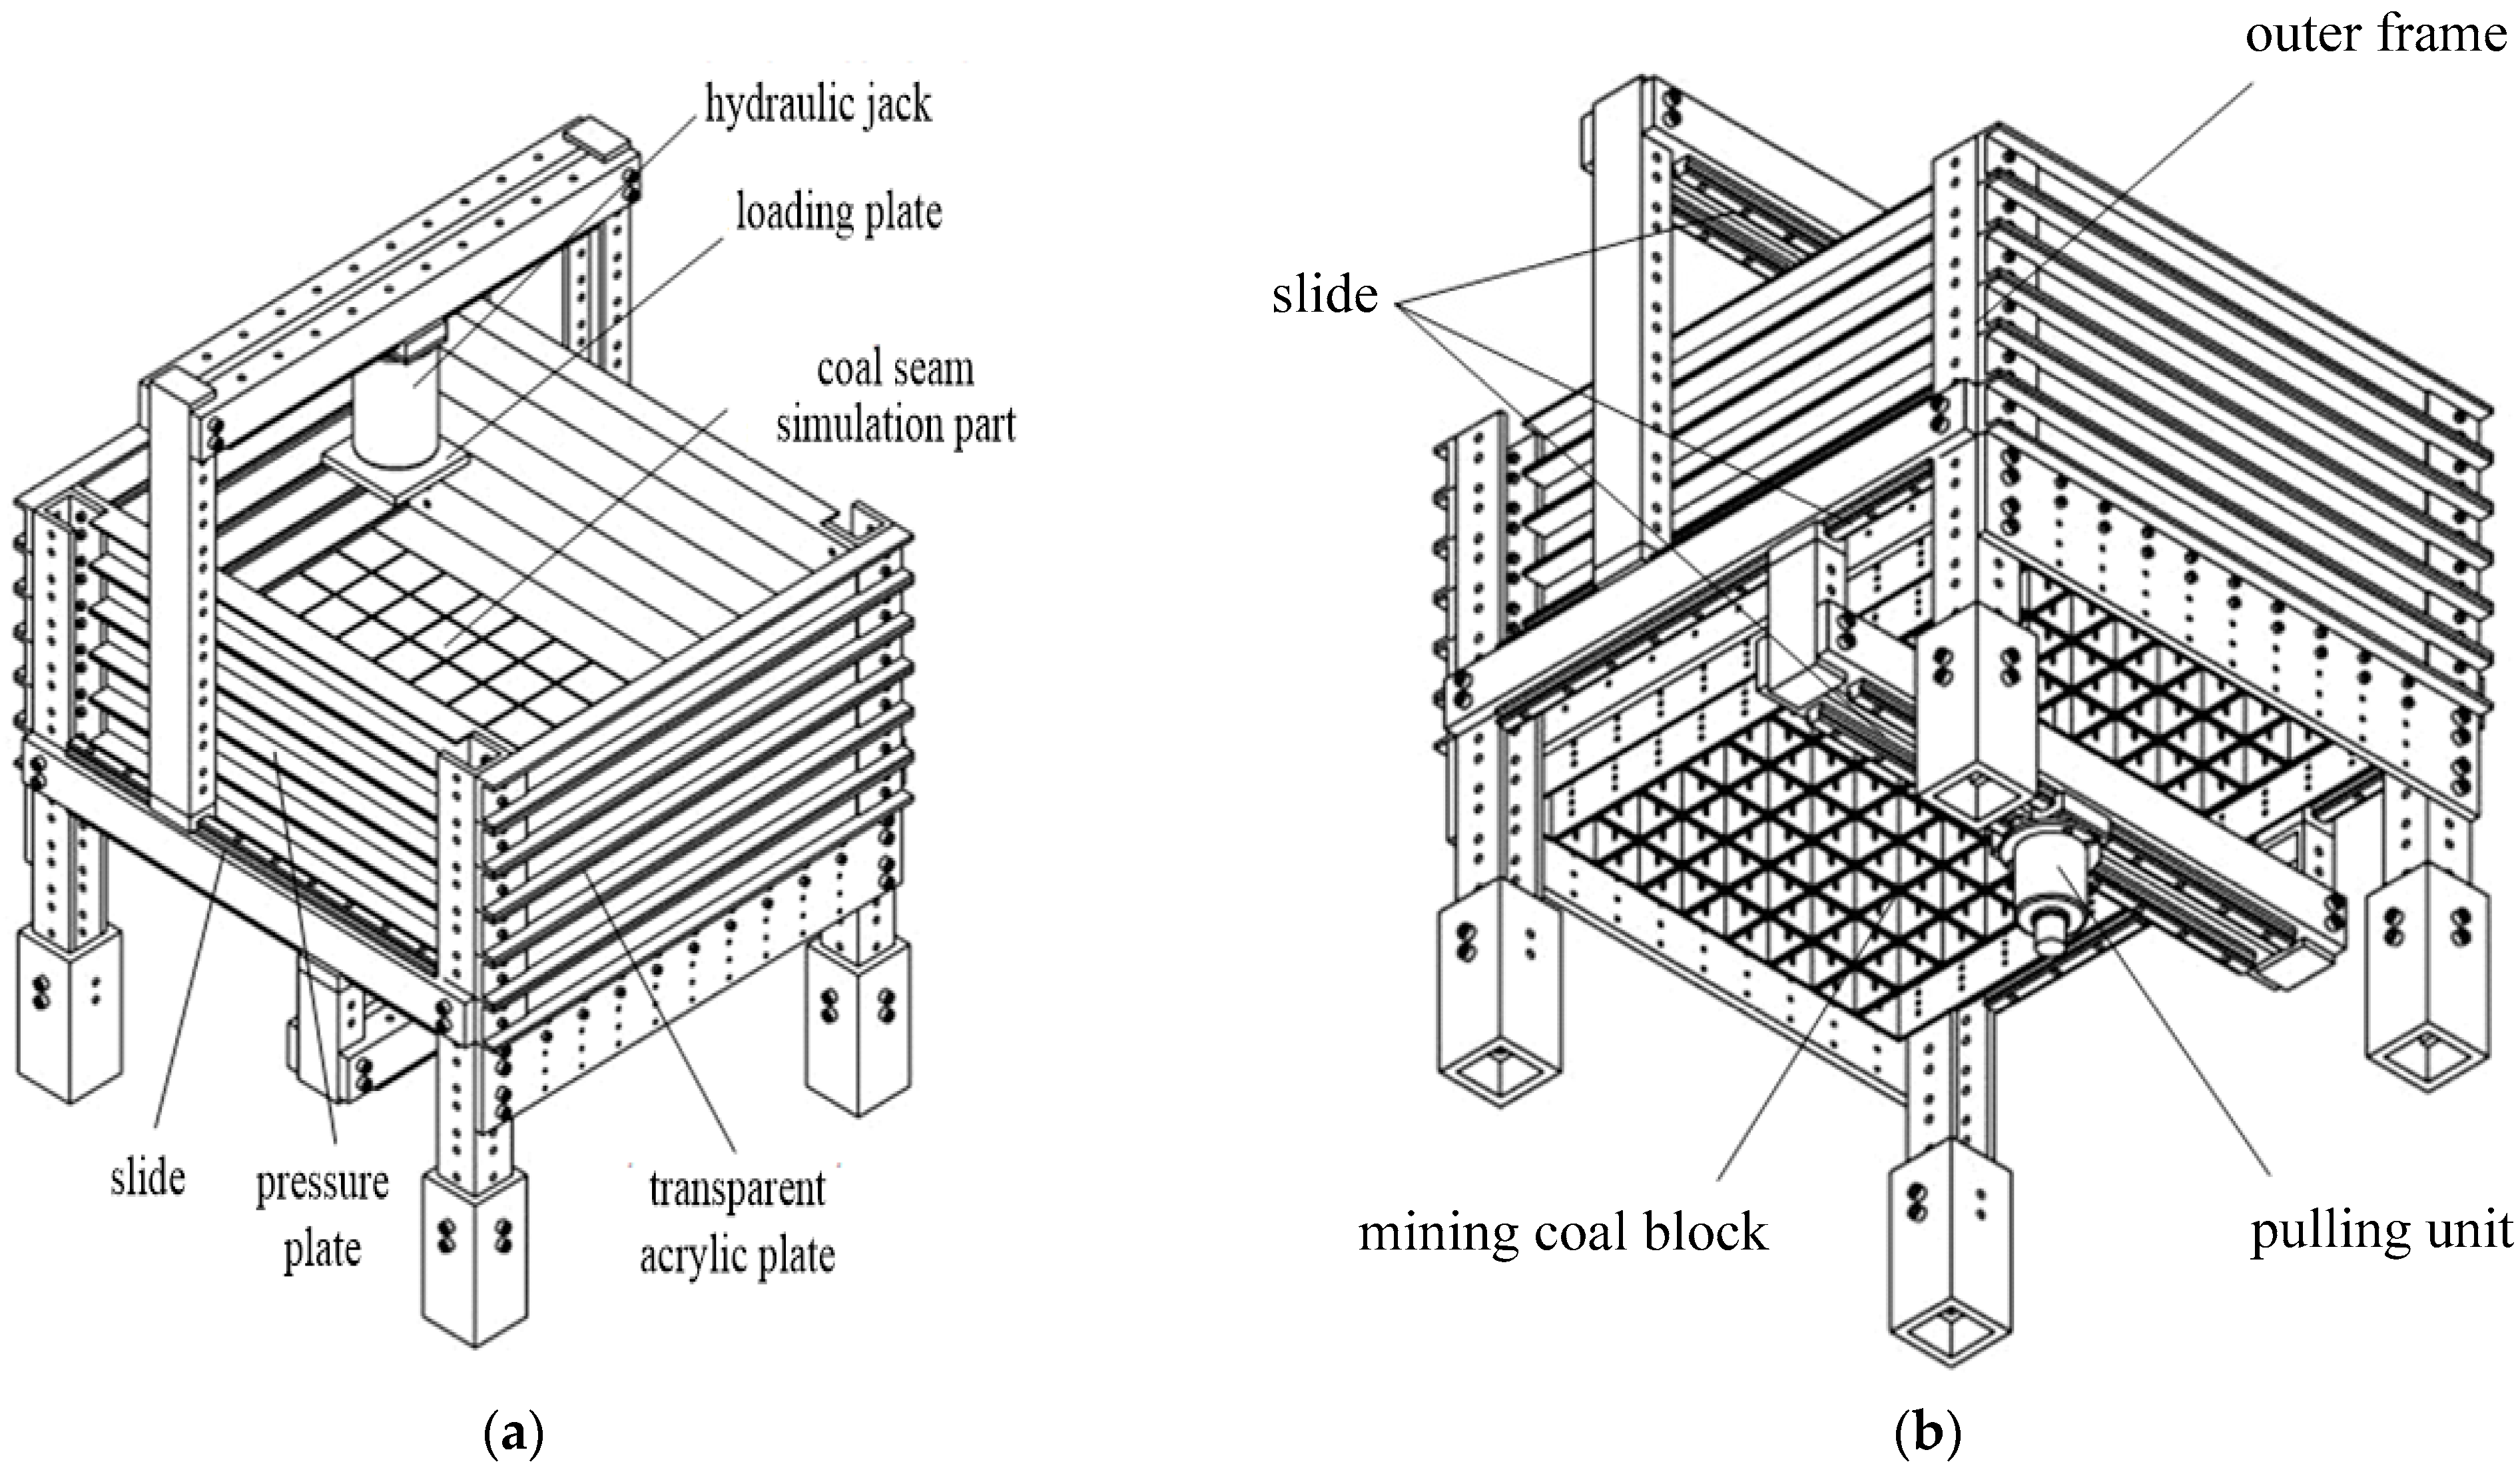
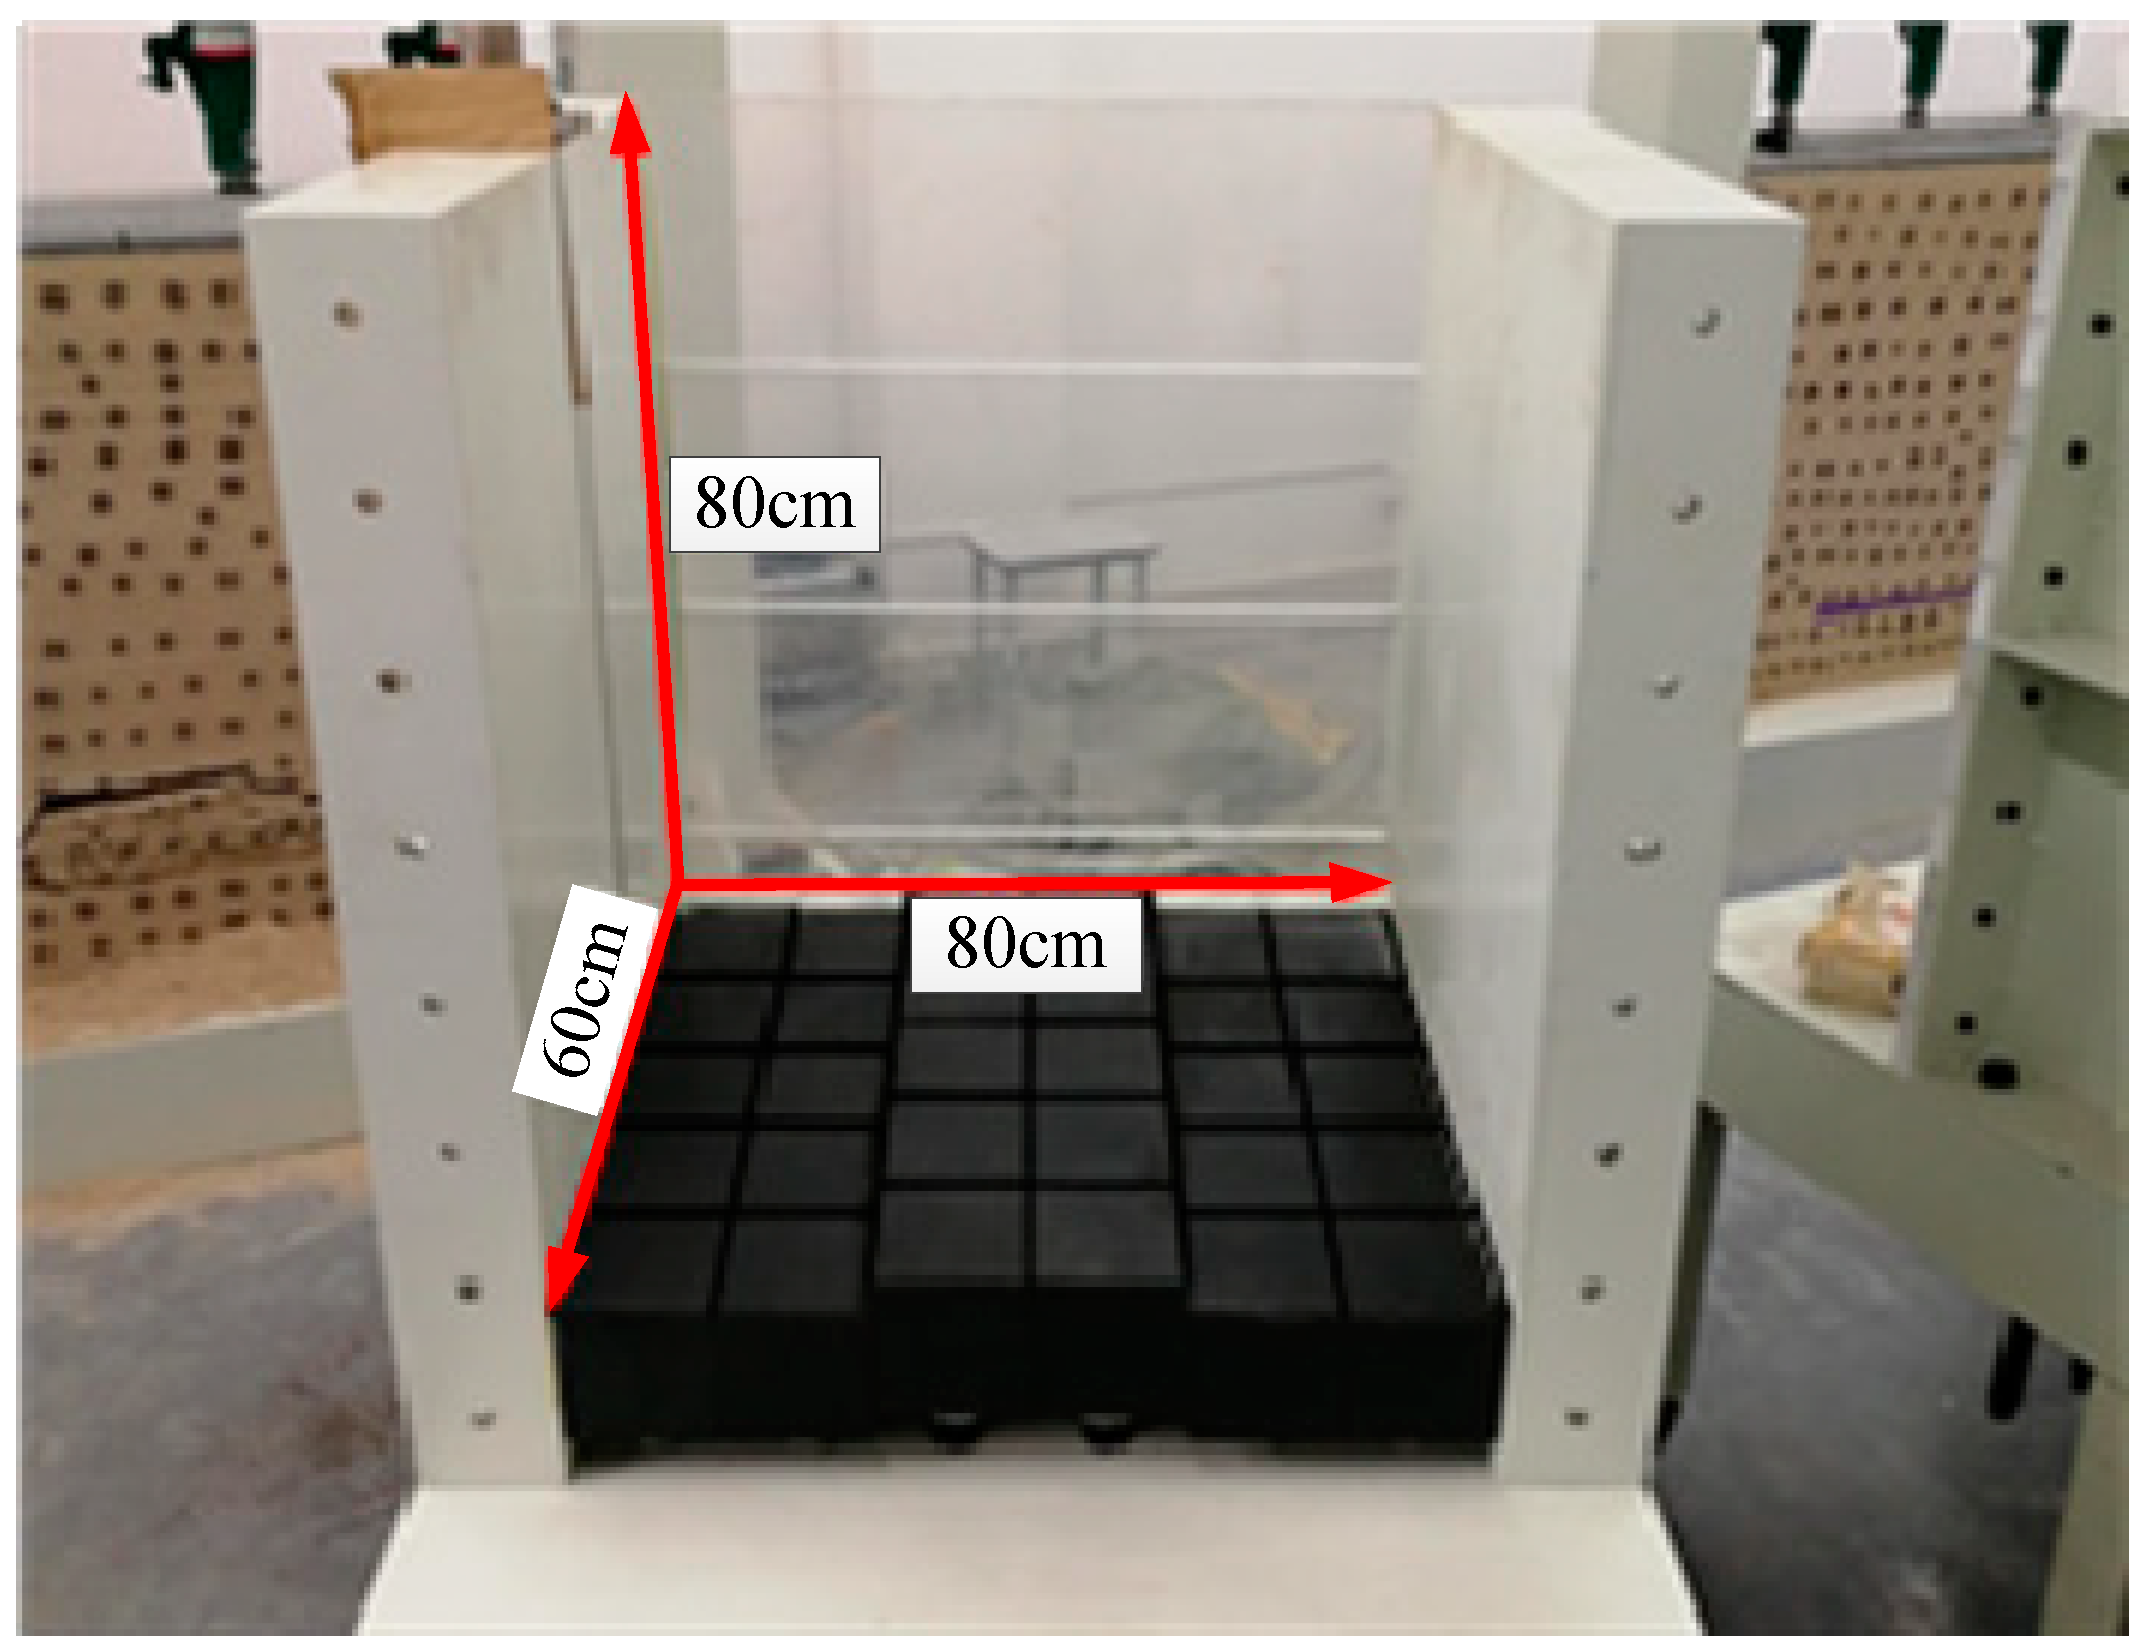
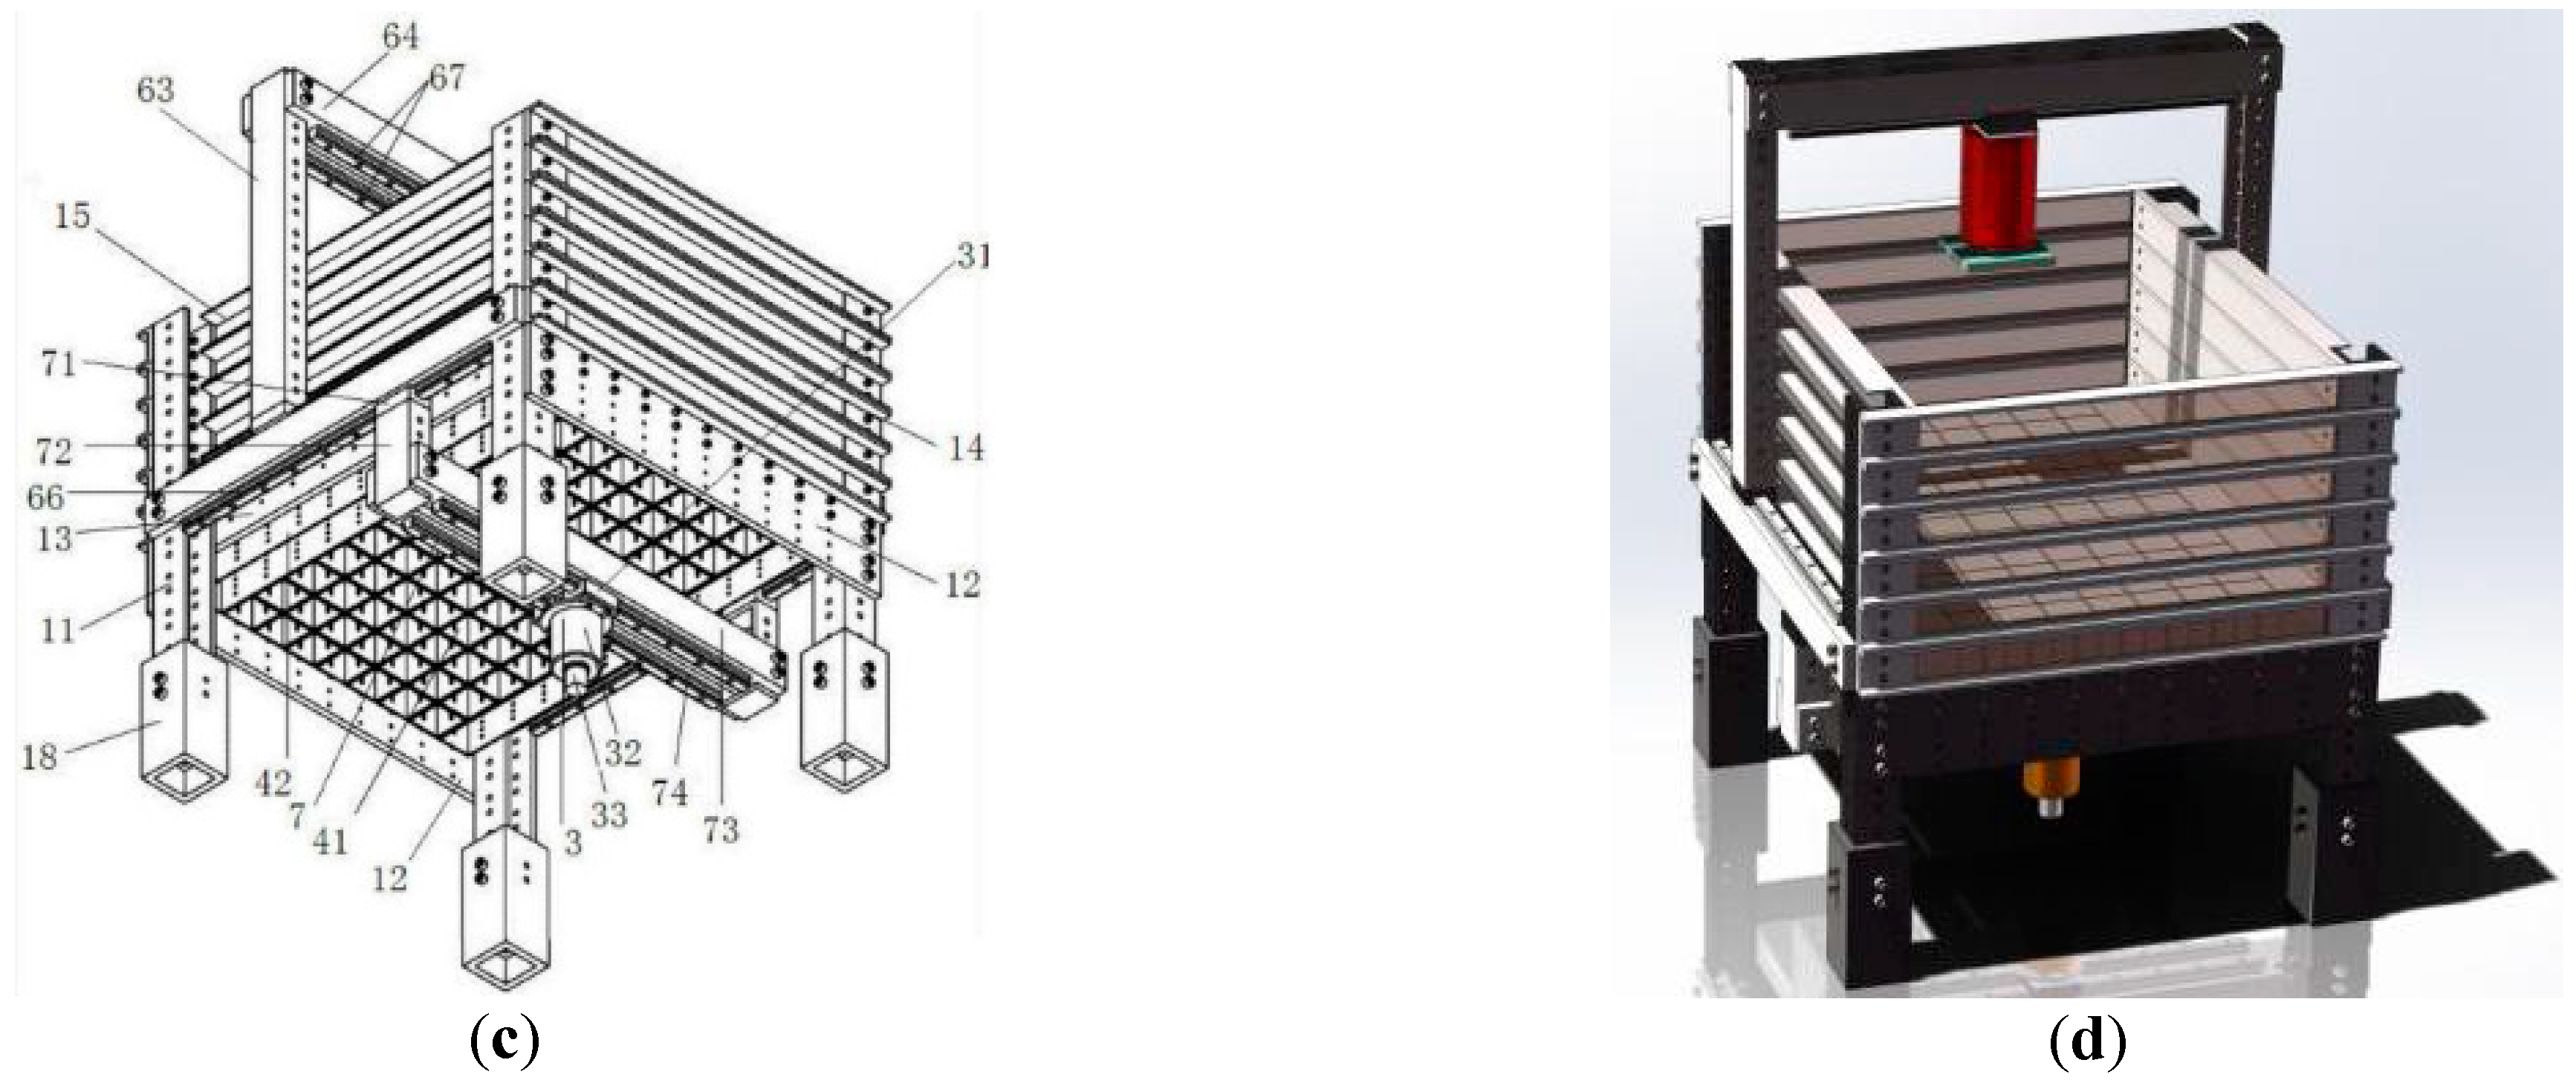
2. Testing Device
2.1. The Overall Structure of the Test Device
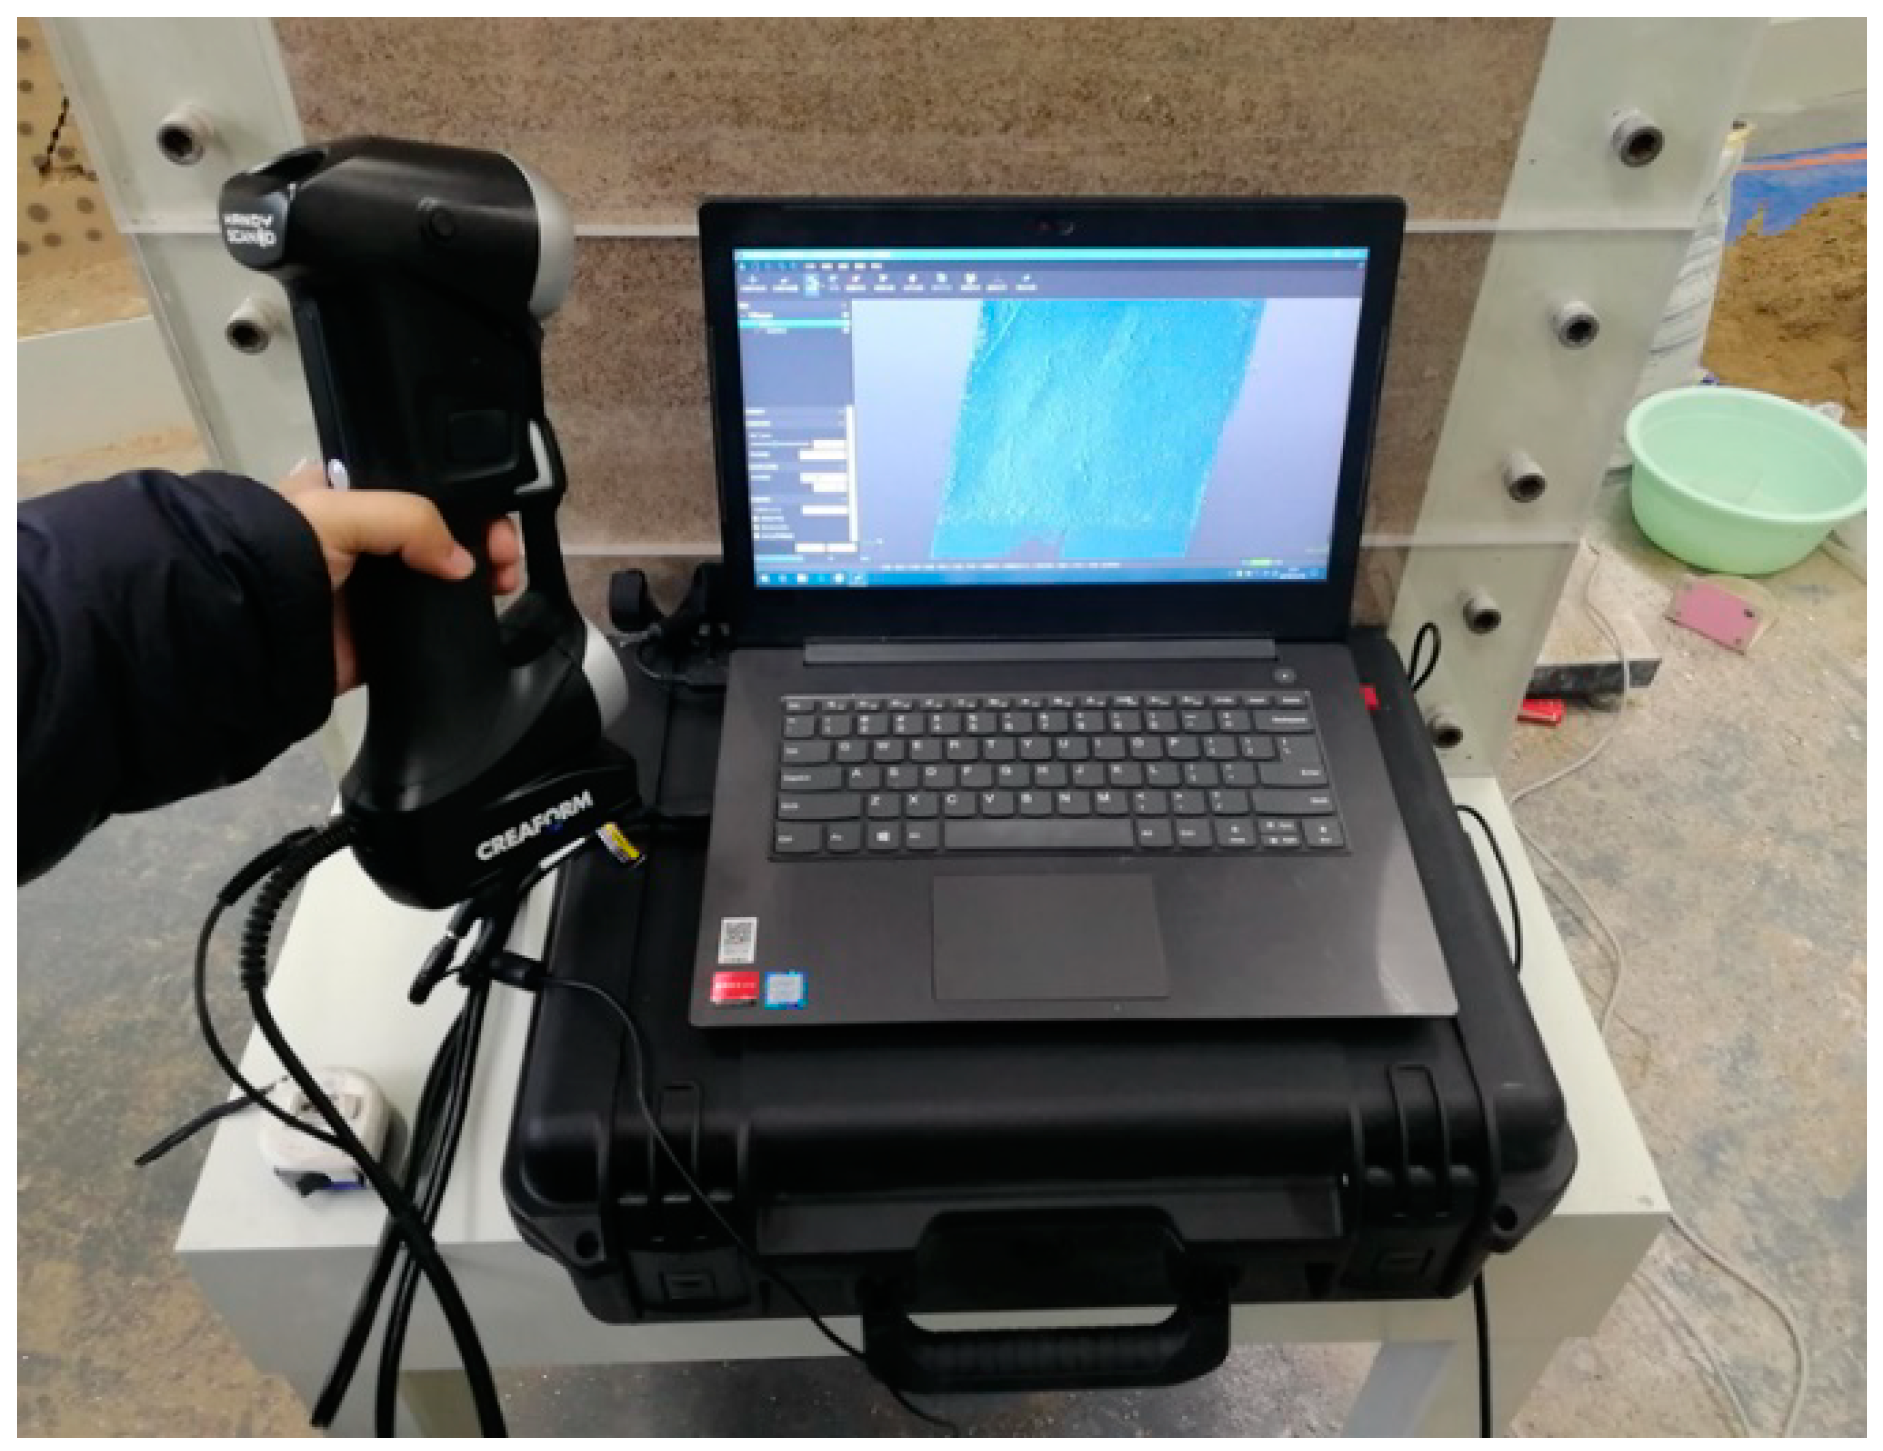
2.2. Introduction of Function and Test Method
2.3. Test Steps
3. Characteristics Analysis of Surface Subsidence in Coal Seam Mining
3.1. Test Scheme
3.1.1. Formulation Ratio of Similar Materials
3.1.2. Test Steps
3.2. Analysis of Test Results
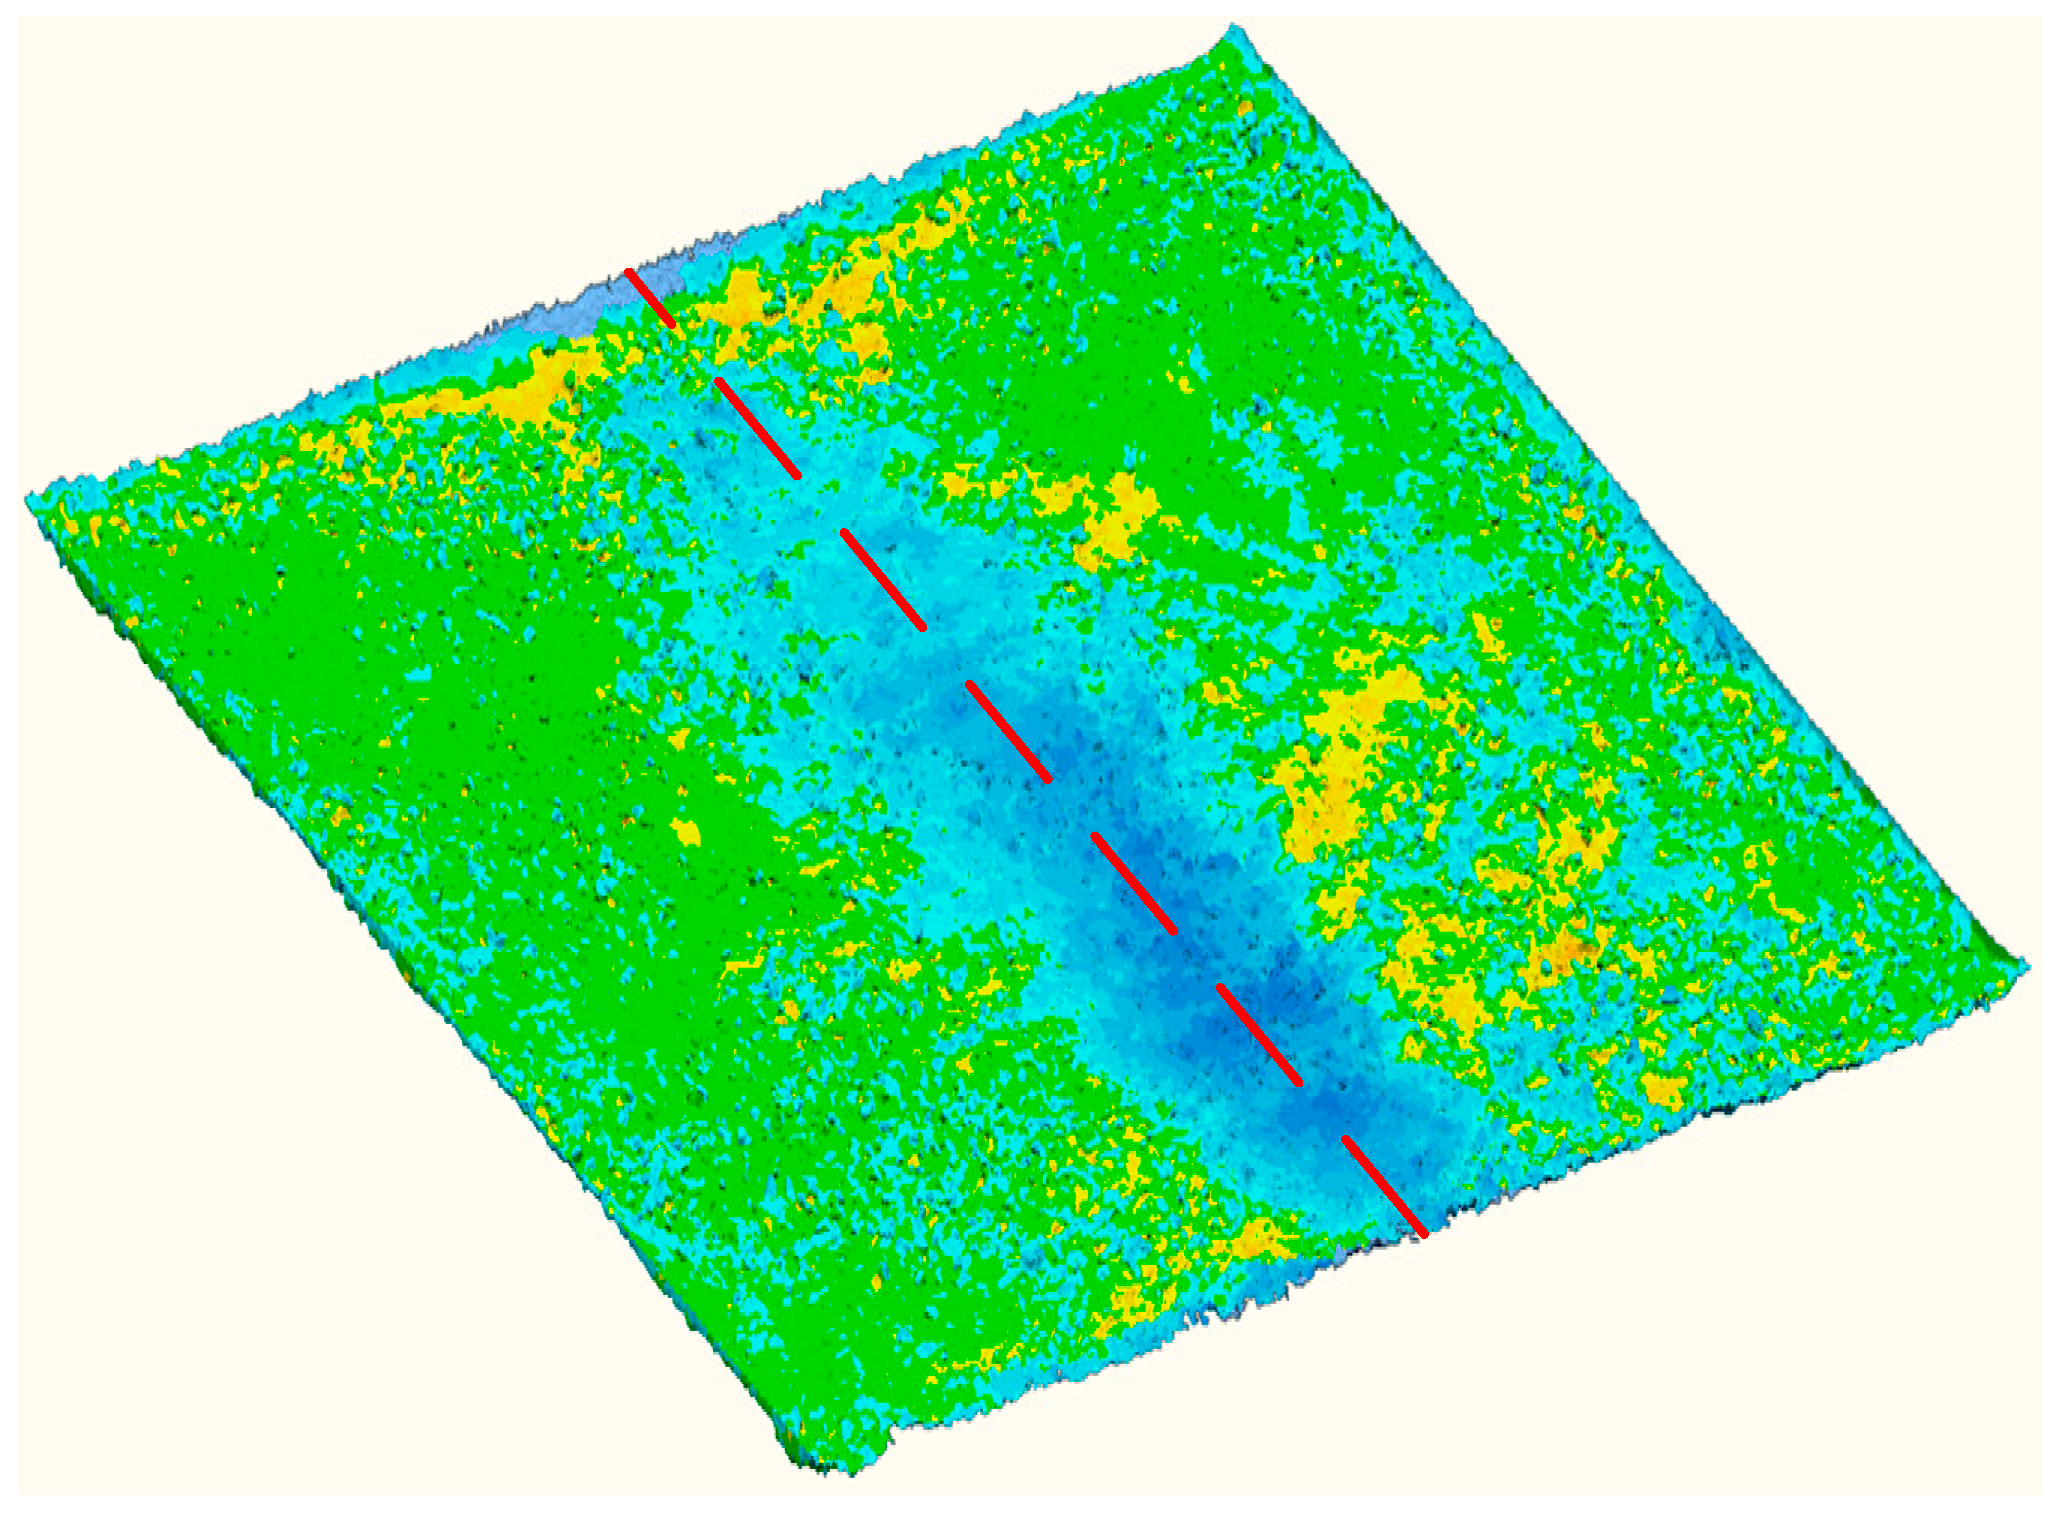
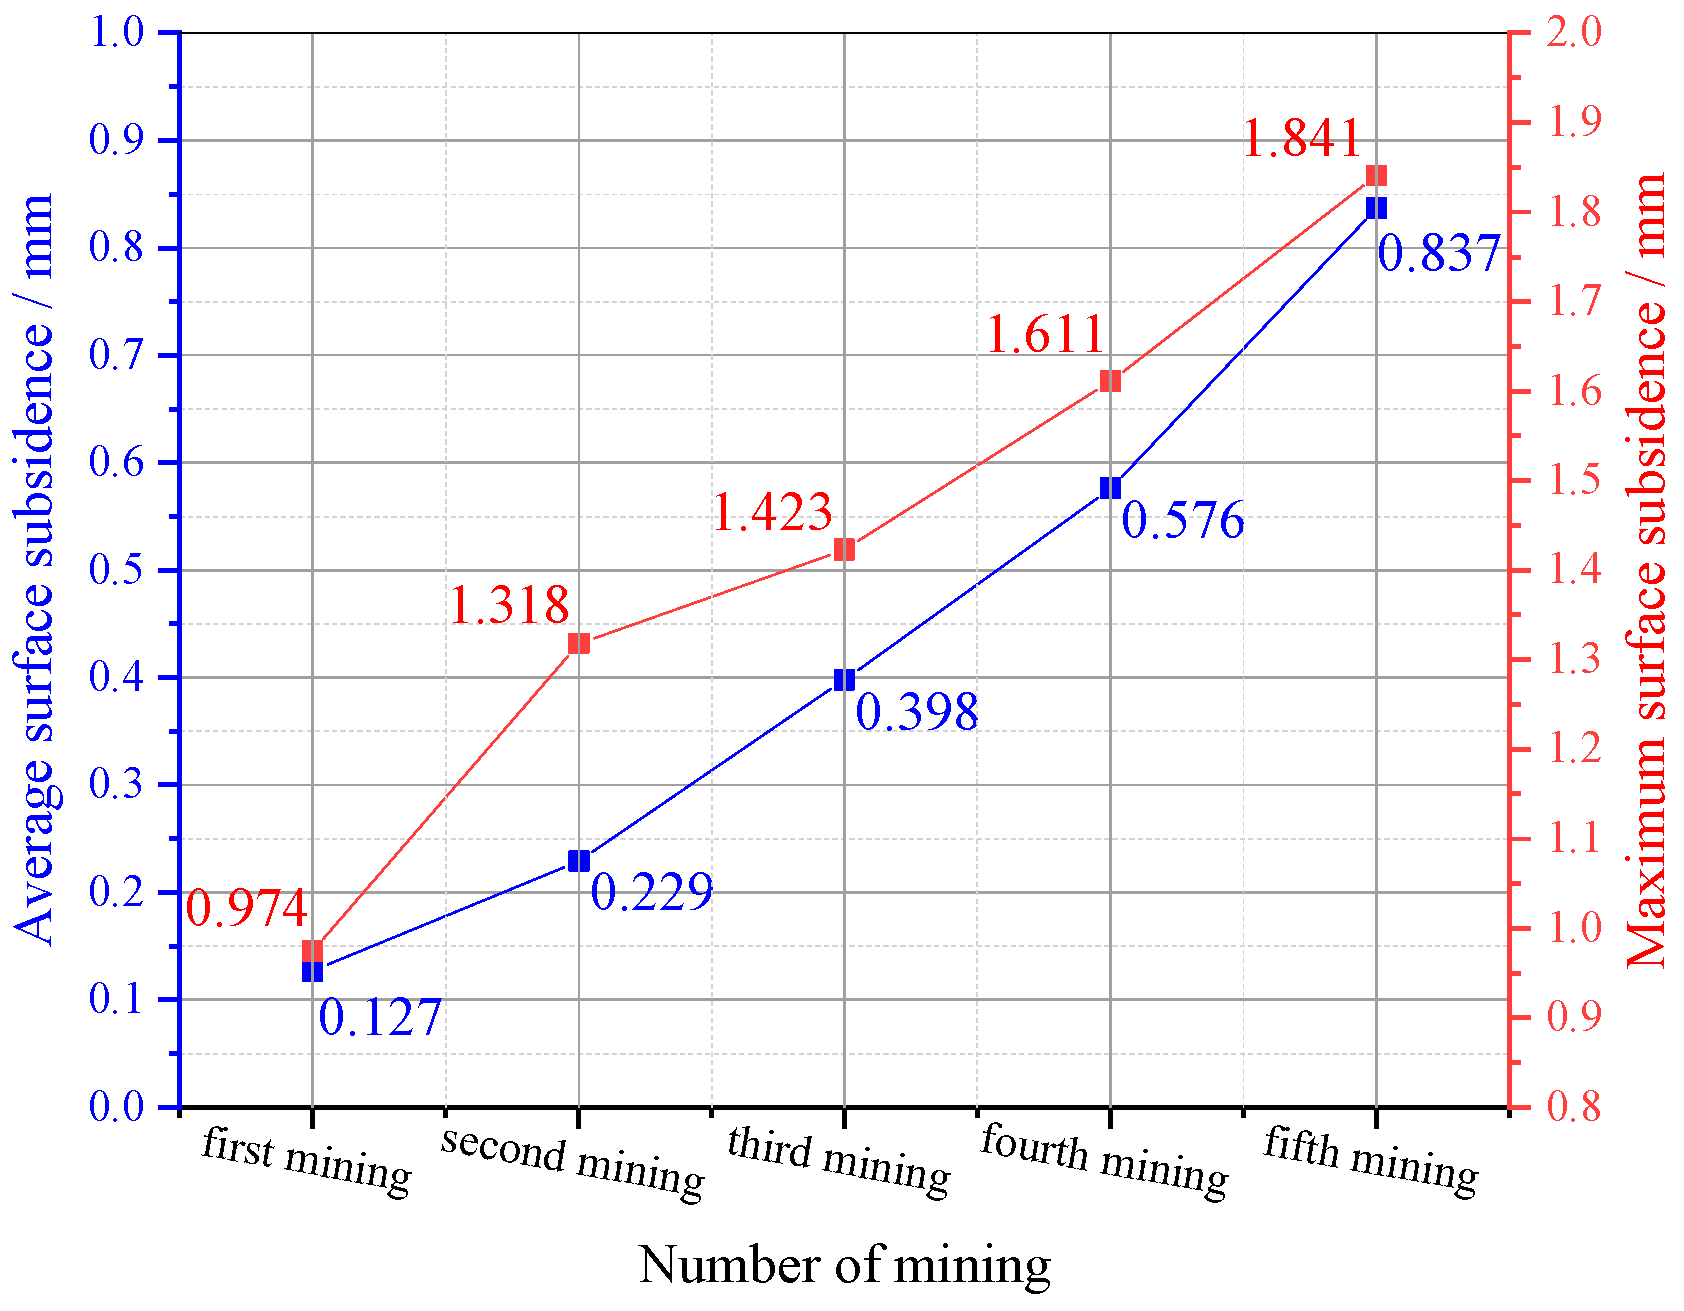
3.2.1. Surface Subsidence Characteristics of Coal Seam Mining
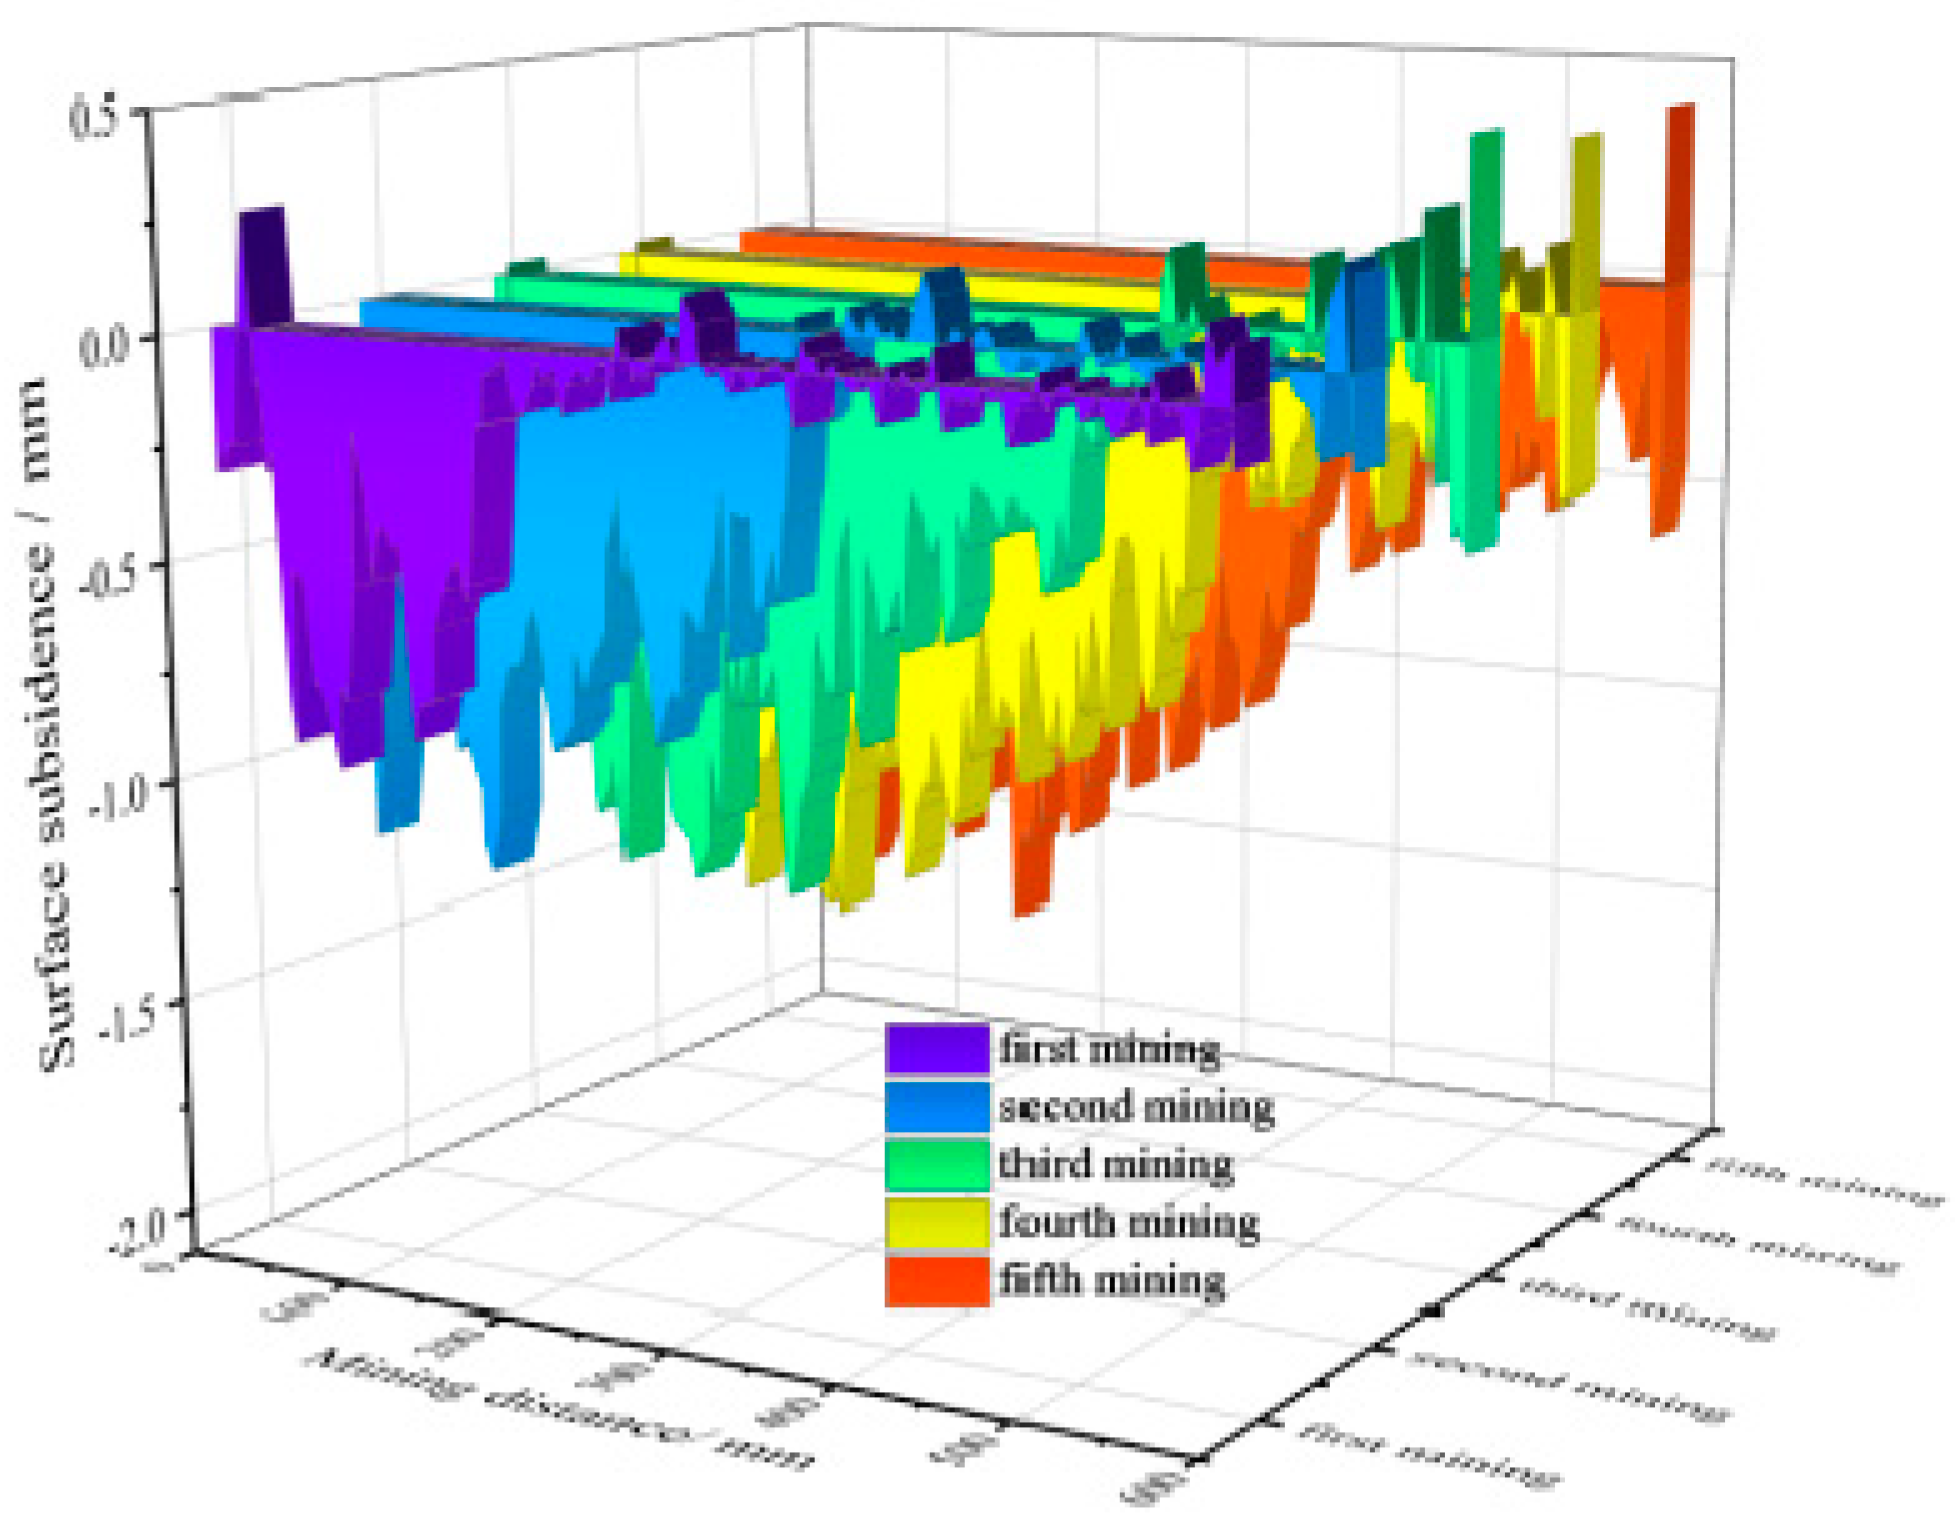
3.2.2. Transfer Law of Surface Subsidence in Coal Seam Mining
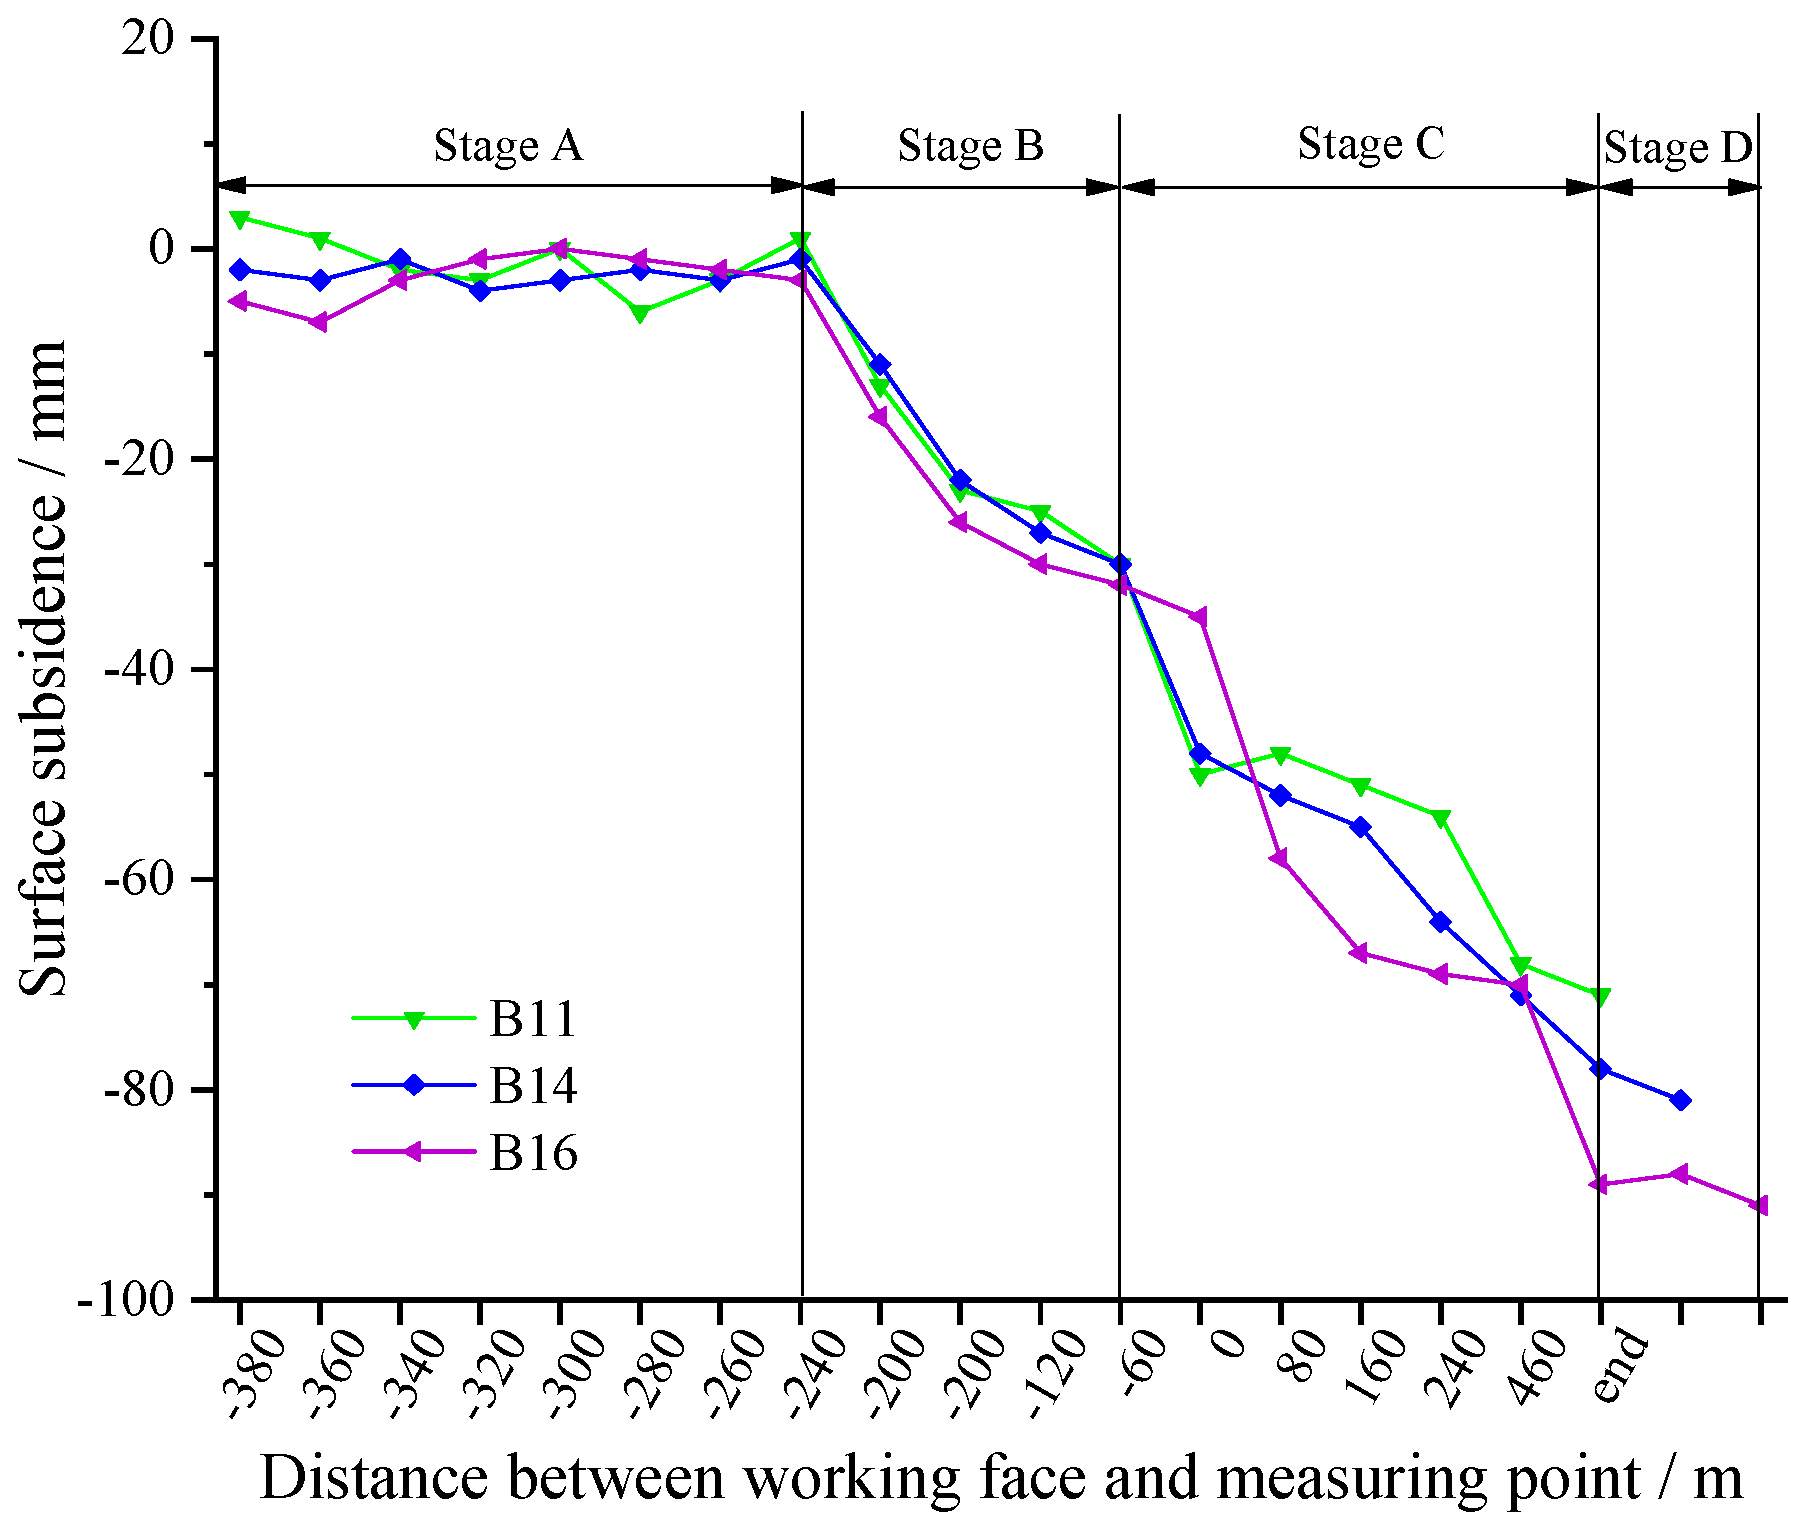
4. Field Engineering Validation
5. Conclusions
Author Contributions
Funding
Institutional Review Board Statement
Informed Consent Statement
Data Availability Statement
Acknowledgments
Conflicts of Interest
References
- Adhikary, D.; Khanal, M.; Jayasundara, C.; Balusu, R. Deficiencies in 2D simulation: A comparative study of 2D versus 3D simulation of multi-seam longwall mining. Rock Mech. Rock Eng. 2016, 49, 2181–2185. [Google Scholar] [CrossRef]
- Ghabraie, B.; Ghabraie, K.; Ren, G.; Smith, J.V. Numerical modelling of multistage caving processes: Insights from multi-seam longwall mining-induced subsidence. Int. J. Numer. Anal. Methods Geomech. 2017, 41, 959–975. [Google Scholar] [CrossRef]
- Whittles, D.N.; Reddish, D.J.; Lowndes, I.S. The development of a coal measure classification (CMC) and its use for prediction of geomechanical parameters. Int. J. Rock Mech. Min. Sci. 2007, 44, 496–513. [Google Scholar] [CrossRef]
- Sun, X.K. Present situation and prospect of green backfill mining in mines. Coal Sci. Technol. 2020, 48, 48–55. (In Chinese) [Google Scholar]
- Bell, F.G.; Stacey, T.R.; Genske, D.D. Mining subsidence and its effect on the environment: Some differing examples. Environ. Geol. 2000, 40, 135–152. [Google Scholar] [CrossRef]
- Sun, G.J.; Wang, P.; Feng, T.; Yu, W.J.; Liu, J.H. Strata movement characteristics of the deep well gangue filling on the fully mechanized mining face. J. Min. Saf. Eng. 2020, 37, 562–570. (In Chinese) [Google Scholar]
- Altun, A.A.; Yilmaz, I.; Yildirim, M. A short review on the surficial impacts of underground mining. Sci. Res. Essays 2010, 5, 3206–3212. [Google Scholar]
- Barbato, J.; Hebblewhite, B.; Mitra, R.; Mills, K. Prediction of horizontal movement and strain at the surface due to longwall coal mining. Int. J. Rock Mech. Min. Sci. 2016, 84, 105–118. [Google Scholar] [CrossRef]
- Vivanco, F.; Melo, F. The effect of rock decompaction on the interaction of movement zones in underground mining. Int. J. Rock Mech. Min. Sci. 2013, 60, 381–388. [Google Scholar] [CrossRef]
- Soni, A.K.; Singh, K.K.K.; Prakash, A.; Singh, K.B.; Chakraboraty, A.K. Shallow cover over coal mining: A case study of subsidence at Kamptee Colliery, Nagpur, India. Bull. Eng. Geol. Environ. 2007, 66, 311–318. [Google Scholar] [CrossRef]
- Zhao, J.Y. Study on Dynamic Subsidence Law of Mining Surface of Adjacent Working Face in Yushen Mining Area. Ph.D. Thesis, Xi’an University of Science and Technology, Xi’an, China, 2020. (In Chinese). [Google Scholar]
- Gligoric, M.V.; Gligoric, Z.M.; Beljic, C.R.; Lutovac, S.M.; Damnjanovic, V.M. Long-term room and pillarmine production planning based on fuzzy 0-1 linear programing and multicriteria clustering algorithm with uncertainty. Math. Probl. Eng. 2019, 2019, 3078234. [Google Scholar] [CrossRef]
- Sementsov, V.V.; Prokopenko, S.A. Room-and-pillar mining of thick coal seams in the conditions of high gas dynamic hazard in Kuzbass. In Proceedings of the Conference on Challenges for Development in Mining Science and Mining Industry, Novosibirsk, Russia, 1–5 October 2018; Volume 262, p. 12064. [Google Scholar]
- Singh, R.; Mandal, P.K.; Singh, A.K.; Kumar, R.; Sinha, A. Optimal underground extraction of coal at shallow cover beneath surface//subsurface objects: Indian practices. Rock Mech. Rock Eng. 2008, 41, 421–444. [Google Scholar] [CrossRef]
- Sasaoka, T.; Takamoto, H.; Shimada, H.; Oya, J.; Hamanaka, A.; Matsui, K. Surface subsidence due to underground mining operation under weak geological condition in Indonesia. J. Rock Mech. Geotech. Eng. 2015, 7, 337–344. [Google Scholar] [CrossRef] [Green Version]
- Sivakugan, N.; Widisinghe, S.; Wang, V.Z. Vertical stress determination within backfilled mine stopes. Int. J. Geomech. 2014, 14, 06014011. [Google Scholar] [CrossRef]
- Wang, F.; Jiang, B.; Chen, S.; Ren, M. Surface collapse control under thick unconsolidated layers by backfilling strip mining in coal mines. Int. J. Rock Mech. Min. Sci. 2019, 113, 268–277. [Google Scholar] [CrossRef]
- Brent, G.F. Quantifying eco-efficiency within life cycle management using a process model of strip coal mining. Int. J. Min. Reclam. Environ. 2011, 25, 258–273. [Google Scholar] [CrossRef]
- Zuo, J.P.; Sun, Y.J.; Wen, J.H.; Li, Z.D. Theoretical and mechanical models of rock strata movement and their prospects. Coal Sci. Technol. 2018, 46, 1–11. (In Chinese) [Google Scholar]
- Cheng, J.W.; Zhao, G.; Sa, Z.Y.; Zheng, W.C.; Wang, Y.G.; Liu, J. Overlying strata movement and deformation calculation prediction models for underground coal mines. J. Min. Strat. Control Eng. 2020, 2, 20–29. (In Chinese) [Google Scholar]
- Cai, Y.F.; Li, X.J.; Deng, W.N.; Xiao, W.; Zhang, W.K. Simulation of surface movement and deformation rules and detriment key parameters in high-strength mining. J. Min. Strat. Control Eng. 2020, 2, 46–54. (In Chinese) [Google Scholar]
- Ren, B.W. Study on Surface Subsidence of Mining Area Based on Multi-source Monitoring Data. Ph.D. Thesis, Hebei University of Engineering, Handan, China, 2020. [Google Scholar]
- Panchal, S.; Deb, D.; Sreenivas, T. Variability in rheology of cemented paste backfill with hydration age, binder and superplasticizer dosages. Adv. Powder Technol. 2018, 29, 2211–2220. [Google Scholar] [CrossRef]
- Sun, Y.J.; Zuo, J.P.; Karakus, M.; Liu, L.; Zhou, H.W.; Yu, M.L. A new theoretical method to predict strata movement and surface subsidence due to inclined coal seam mining. Rock Mech. Rock Eng. 2021, 54, 2723–2740. [Google Scholar] [CrossRef]
- Dong, L.J.; Tong, X.J.; Ma, J. Quantitative investigation of tomographic effects in abnormal regions of complex structures. Engineering 2021, 7, 1011–1022. [Google Scholar] [CrossRef]
- Zhu, G.A.; Dou, L.M.; Wang, C.B.; Ding, Z.W.; Feng, Z.J.; Xue, F. Experimental study of rock burst in coal samples under overstress and true-triaxial unloading through passive velocity tomography. Saf. Sci. 2019, 117, 388–403. [Google Scholar] [CrossRef]
- Li, X.B.; Dong, L.J.; Zhao, G.Y.; Huang, M.; Liu, A.H.; Zeng, L.F.; Dong, L.; Chen, G.H. Stability analysis and comprehensive treatment methods of landslides under complex mining environment—A case study of Dahu landslide from Linbao Henan in China. Saf. Sci. 2012, 50, 695–704. [Google Scholar] [CrossRef]
- Hou, D.; Li, D.; Xu, G.; Zhang, Y. Superposition model for analyzing the dynamic ground subsidence in mining area of thick loose layer. Int. J. Min. Sci. Technol. 2018, 28, 663–668. [Google Scholar] [CrossRef]
- Thongprapha, T.; Fuenkajorn, K.; Daemen, J.J.K. Study of surface subsidence above an underground opening using a trap door apparatus. Tunn. Undergr. Space Technol. 2015, 46, 94–103. [Google Scholar] [CrossRef]
- Suchowerska Iwanec, A.M.; Carter, J.P.; Hambleton, J.P. Geomechanics of subsidence above single and multi-seam coal mining. J. Rock Mech. Geotech. Eng. 2016, 8, 304–313. [Google Scholar] [CrossRef] [Green Version]
- Fathi Salmi, E.; Nazem, M.; Karakus, M. Numerical analysis of a large landslide induced by coal mining subsidence. Eng. Geol. 2017, 217, 141–152. [Google Scholar] [CrossRef]
- Salmi, E.F.; Nazem, M.; Karakus, M. The effect of rock mass gradual deterioration on the mechanism of post-mining subsidence over shallow abandoned coal mines. Int. J. Rock Mech. Geotech. Eng. 2017, 91, 59–71. [Google Scholar] [CrossRef]
- Sun, Y.; Zuo, J.; Karakus, M.; Wang, J. Investigation of movement and damage of integral overburden during shallow coal seam mining. Int. J. Rock Mech. Min. Sci. 2019, 117, 63–75. [Google Scholar] [CrossRef]
- Yin, B.J.; Wang, A.L.; Zhang, P.F.; Fu, Z.Y.; Qiu, D.W. Analysis of the laws and control effect of surface subsidence of solid backfilling mining. China Coal 2018, 44, 81–86. (In Chinese) [Google Scholar]


| Layer No. | Lithology | Thickness/m | Model Thickness/cm | Unit Weight g/cm3 | Formulation Ratio | Amount of Material/kg | ||||
|---|---|---|---|---|---|---|---|---|---|---|
| Total Weight | Sand | Calcium Carbonate | Gypsum | Water | ||||||
| R4 | Loose Layer | 300 | 33 | 0.95 | 673 | 182.40 | 156.34 | 18.24 | 7.82 | 20.27 |
| R3 | Bedrock Layer | 300 | 33 | 1.60 | 537 | 230.40 | 192.00 | 11.52 | 26.88 | 25.60 |
| R2 | Basic Roof | 100 | 11 | 1.70 | 755 | 73.44 | 64.26 | 4.59 | 4.59 | 8.16 |
| R1 | Immediate Roof | 30 | 3 | 1.80 | 773 | 34.56 | 30.24 | 1.30 | 3.02 | 3.84 |
| Total | 730 | 80 | 520.80 | 442.84 | 35.65 | 42.31 | 57.87 | |||
Publisher’s Note: MDPI stays neutral with regard to jurisdictional claims in published maps and institutional affiliations. |
© 2022 by the authors. Licensee MDPI, Basel, Switzerland. This article is an open access article distributed under the terms and conditions of the Creative Commons Attribution (CC BY) license (https://creativecommons.org/licenses/by/4.0/).
Share and Cite
Ma, X.; Fu, Z.; Li, Y.; Zhang, P.; Zhao, Y.; Ma, G. Study on Surface Subsidence Characteristics Based on Three-Dimensional Test Device for Simulating Rock Strata and Surface Movement. Energies 2022, 15, 1927. https://doi.org/10.3390/en15051927
Ma X, Fu Z, Li Y, Zhang P, Zhao Y, Ma G. Study on Surface Subsidence Characteristics Based on Three-Dimensional Test Device for Simulating Rock Strata and Surface Movement. Energies. 2022; 15(5):1927. https://doi.org/10.3390/en15051927
Chicago/Turabian StyleMa, Xingyin, Zhiyong Fu, Yurong Li, Pengfei Zhang, Yongqiang Zhao, and Guoping Ma. 2022. "Study on Surface Subsidence Characteristics Based on Three-Dimensional Test Device for Simulating Rock Strata and Surface Movement" Energies 15, no. 5: 1927. https://doi.org/10.3390/en15051927