Article

Evaluation of NVIDIA Xavier NX Platform for Real-Time Image Processing for Plasma Diagnostics †

1
Department of Microelectronics and Computer Science, Lodz University of Technology, 90-924 Łódź, Poland
2
Stellarator Edge and Divertor Physics Division, Max Planck Institute for Plasma Physics, 17491 Greifswald, Germany
3
Wendelstein 7-X Operations Division, Max Planck Institute for Plasma Physics, 17491 Greifswald, Germany
*
Author to whom correspondence should be addressed.
This paper is an extended version of our paper published in Proceedings of the 28th International Conference on Mixed Design of Integrated Circuits and Systems—MIXDES 2021.
W7-X Team are listed in acknowledgments.
Energies 2022, 15(6), 2088; https://doi.org/10.3390/en15062088
Submission received: 14 February 2022 / Revised: 7 March 2022 / Accepted: 10 March 2022 / Published: 12 March 2022

Abstract

:
Machine protection is a core task of real-time image diagnostics aiming for steady-state operation in nuclear fusion devices. The paper evaluates the applicability of the newest low-power NVIDIA Jetson Xavier NX platform for image plasma diagnostics. This embedded NVIDIA Tegra System-on-a-Chip (SoC) integrates a Graphics Processing Unit (GPU) and Central Processing Unit (CPU) on a single chip. The hardware differences and features compared to the previous NVIDIA Jetson TX2 are signified. Implemented algorithms detect thermal events in real-time, utilising the high parallelism provided by the embedded General-Purpose computing on Graphics Processing Units (GPGPU). The performance and accuracy are evaluated on the experimental data from the Wendelstein 7-X (W7-X) stellarator. Strike-line and reflection events are primarily investigated, yet benchmarks for overload hotspots, surface layers and visualisation algorithms are also included. Their detection might allow for automating real-time risk evaluation incorporated in the divertor protection system in W7-X. For the first time, the paper demonstrates the feasibility of complex real-time image processing in nuclear fusion applications on low-power embedded devices. Moreover, GPU-accelerated reference processing pipelines yielding higher accuracy compared to the literature results are proposed, and remarkable performance improvement resulting from the upgrade to the Xavier NX platform is attained.

1. Introduction

1.1. Problem Statement

Machine protection is one of the primary challenges in the current and future large-power fusion devices operating with plasma pulses longer than 30 min , such as 7-X (W7-X), ITER and DEMO. Protection systems prevent machine damage that would lead to downtime and impose significant repair costs [1]. In addition, a machine control system has to intelligently mitigate the overheating threat so that discharges are not prematurely terminated and an optimal fusion efficiency is attained. Various plasma diagnostics are applied to identify and analyse risks [2]. Nowadays, Visible Spectrum (VIS) and Infrared (IR) cameras are fundamental components of vision diagnostics. Image plasma diagnostics in thermonuclear fusion rely on information acquired from processed images to perform protection and control actions. Therefore, hard real-time image acquisition and processing systems are essential to provide effective machine operation. Both the suitable hardware platform and efficient software contribute towards complying with the time constraints. Reliable detection of overloads is a basis for the prevention of permanent damages to Plasma Facing Components (PFCs). The supplementary classification and analysis of thermal events and their ontology (see Figure 1) aid in estimating risk and avoiding alarms due to false positives.
Thermal events identified in the W7-X stellarator primarily entail hotspots [4], leading edges [5], reflections [6], surface layers [4] and strike-lines [7]. Similar patterns are observed in tokamaks, yet certain thermal events vary due to the differences between devices. In Joint European Torus (JET), different sources of overheating are distinguished, i.e., severe such as fast particle losses, and those that might lead to false positives, e.g., dust particles, delaminations, surface layers [8,9]. In W Environment in Steady-state Tokamak (WEST), vision systems detect hotspots and recognise thermal events based on their location and evolution, including electrical arcs, B 4 C flakes and fast ion losses [10]. Since fusion devices will reach long discharges in future, e.g., 30 min in W7-X, new challenges emerge that might affect the robustness of image-processing methods. Throughout a long discharge, machine and plasma conditions will volatilely evolve. The algorithms will have to adapt to challenges such as the emissivity of tungsten PFCs changing due to temperature [11] or surface erosion [12]. Therefore, the application of Artificial Intelligence (AI) techniques might facilitate long discharge scenarios. Exemplary image-based AI applications in nuclear fusion are outlined in Section 2.2. However, deterministic image-processing systems should retain their grounded position in fallback safety systems due to the black-box characteristics of AI systems and their heavy dependence on available data.
The field of General-Purpose computing on Graphics Processing Units (GPGPU) is constantly evolving and offers hardware acceleration of Computer Vision (CV) tasks. Graphics Processing Units (GPUs) are also utilised in fusion experiments to provide hardware acceleration for efficient computations [13,14]. New New System-on-a-Chip (SoC) platforms provide accelerated edge computing on low-power embedded systems.

1.2. Research Objective

In this paper, the authors evaluate the newest embedded NVIDIA Jetson Xavier NX platform [1] and implement GPU-accelerated real-time algorithms for thermal events detection. The algorithms are implemented based on the literature and the W7-X experimental data to execute on SoC platforms with limited resources. The assumed real-time constraint of 110 ms is the same as in the W7-X stellarator [15]. The paper focuses on the evaluation of performance and some accuracy aspects of the developed image processing system for plasma diagnostics presented in Figure 2.
Overload hotspot and surface layer detection algorithms were described and benchmarked in [16]. Correction and calibration algorithms, i.e., Non-Uniformity Correction (NUC), Bad Pixel Correction (BPC) and thermal calibration, are not examined in the paper since they shall be executed on a Field-Programmable Gate Array (FPGA) for the highest performance due to their simplicity. Although real-time aspects are essential for machine protection and control systems in nuclear fusion, there are almost no benchmarks available in the literature to validate the performance and quality of newly developed solutions against previous literature findings. Therefore, the paper reports the obtained real-time performance on distinct setups and actual experimental data for further comparisons. A hypothesis is that the current computing power and algorithms enable real-time machine protection based on image processing on embedded devices. The first innovative application of a low-power embedded platform for relatively complex real-time image processing for plasma diagnostics will be investigated and evaluated in order to verify the hypothesis.

2. Hardware Platform

2.1. Nvidia Jetson Xavier NX

NVIDIA Jetson series covers low-power embedded platforms suitable for GPU-accelerated computing. The NVIDIA Jetson Xavier NX module [17] integrates both a Central Processing Unit (CPU) and a GPU on a single chip of size 70 mm × 45 mm. The device specifications are listed in Table 1. The image-processing software was developed on the Linux for Tegra (L4T) Operating System (OS) using custom Compute Unified Device Architecture (CUDA) kernels and software libraries with CUDA support in the C++ programming language.
The SoC module mounted in the carrier board [18] used for the evaluation is shown in Figure 3.

2.2. Features Relevant to Image Processing

NVIDIA Jetson Xavier NX features I/O coherency contrary to its predecessor, the NVIDIA Jetson TX2 [19]. The I/O coherency enables one-way caching in a CPU cache, removing the overhead of coherency management. As a consequence, repetitive access to the same page-locked buffer from a CPU is efficient (see Figure 4), and the page-locked memory might be used as an alternative to the unified memory in order to achieve one-way caching behaviour in Tegra.
Furthermore, NVIDIA Jetson Xavier NX accommodates a Programmable Vision Accelerator (PVA) that support a set of predefined CV algorithms, e.g., Harris Corner Detector or Gaussian Pyramid Generator. It is separate hardware consisting of a Cortex-R5 CPU core, dedicated vector processing units, its own memory and a Direct Memory Access (DMA) engine [17]. Nevertheless, the available Application Programming Interface (API) does not allow one to define custom functions. According to the benchmarks of exposed Vision Programming Interface (VPI) (https://docs.nvidia.com/vpi/algo_performance.html, accessed on 15 November 2021), the PVA does not provide superior performance to the GPU but offloads it by concurrently executing supplementary operations.
Deep Learning (DL) model training and inference are significantly accelerated in NVIDIA Jetson Xavier NX as it offers additional Tensor Cores, NVIDIA Deep Learning Accelerators (NVDLAs) as well as supports a reduced precision mode—INT8. DL and classical Machine Learning (ML) techniques are widely applied in image processing, including image plasma diagnostics for thermonuclear fusion. As an example, the Cascade Region-Based Convolutional Neural Network (R-CNN) algorithm detects and classifies thermal events in IR images in WEST [20]. VIS images are used to classify disruptive discharges in Korea Superconducting Tokamak Advanced Research (KSTAR) [21]. Heat-flux images with strike-lines on horizontal and vertical divertors are taken as input to control a coil current with a CNN [22], and descriptors are computed from IR images to reconstruct magnetic configuration in W7-X [23]. Two-dimensional data from a bolometer diagnostic is used to predict disruptions and detect anomalies in JET using supervised and unsupervised methods, respectively [24].
NVIDIA Jetson Xavier NX is suitable for MicroTCA.4 architectures since it is equipped with a Peripheral Component Interconnect Express (PCIe) interface and consumes below 80 W . MicroTCA.4 is a common solution in large-scale physics experiments [25,26,27,28]. PCIe Gen 4 provides higher acquisition performance due to the increased throughput and reduced latency compared to previous generations. Modern GPUs based on the same Volta architecture—Tesla V100 and Quadro GV100—still have PCIe Gen 3. As a result, the NVIDIA Jetson Xavier NX is a cost-effective, low-power solution for MicroTCA.4 systems.
The NVIDIA Jetson Xavier NX features two distinct CPU power modes that affect the maximum performance at 15 W (see Table 2) due to the differences in online cores and core frequencies.
An optimal power mode selection depends on a specific application. A user has to decide between more parallel threads and higher frequencies. A power mode does not affect the performance of the embedded GPU.

3. Infrared Image Processing

Thermal events detection is based on the W7-X experimental data (discharge 20171114. 053–AEF20), i.e., 16-bit IR videos with a resolution of 1024 × 768. Each dataset contains the scene model that stores additional pixel-wise information on the observed components, e.g., Field of View (FoV), a stellarator Computer-Aided Design (CAD) model and PFC labels. The details regarding the selection of C++/CUDA algorithms, implementation and optimisation are described in the following paragraphs. The further minor characteristics of datasets, scene models and software dependencies are described in [16].

3.1. Strike-Line Segmentation

A strike-line is an elongated heat load pattern established due to the power emitted by plasma that arrives at the divertors. The detection of this event facilitates the control of the strike-line position with the control coils in order to prevent the excessive heat load onto delaminated components [5]. For the purpose of strike-line segmentation, a morphological image processing approach based on the max-tree algorithm [7] was investigated. It was initially proposed within the H2020 EUROfusion project (EUROfusion ITER Physics WP S1: Preparation and Exploitation of W7-X Campaigns, P.2: Specific diagnostics, software and component reparation (Tasks S1.P2.T6-T7)).

3.1.1. Max-Tree Representation

The max-tree algorithm creates a hierarchical representation of an image in the form of connected components based on pixel values in the immediate surrounding of each pixel. The constructed tree is traversed in order to compute attributes and propagate them from leaves towards the root. It allows nodes to be filtered based on the computed descriptors. These three steps are disjunctive, e.g., various attributes might be computed once the max-tree is constructed (see Figure 5).
In Figure 6, an example presenting an output of the canonical max-tree algorithm computed with the implemented procedures is shown. The canonical max-tree is represented as a 2D parenthood matrix of indices and a 1D vector of ordered indices. The vector defines traversal order from a tree root to leaves.
The connectivity used in the example is a four-way connection, i.e., top, down, left and right pixels are considered neighbours. The attribute computation algorithm propagates the maximum value from the leaf to the root with the constraint that the parent value remains above 50 % of the current maximum; otherwise, it is set to 0. The direct filter is performed for a threshold equal to seven. As a consequence, the pruned image contains only the continuous line where source values are above the threshold and are connected to values t r u n c a t e ( 1 2 7 ) = 3 . The above case resembles a simplified strike-line segmentation since a temperature is also not uniform and fluctuates across a strike-line. It is noteworthy that the max-tree representation enables the detection of nested thermal events inside a strike-line, e.g., leading edges, due to its hierarchical structure.
The authors implemented and benchmarked two distinct max-tree algorithms. In both variants, to optimise performance, image indices are pre-sorted using GPU-accelerated radix sort based on pixel values. Moreover, the max-tree is computed in a Region of Interest (RoI) that contains only components that are affected by strike-lines, i.e., divertors and adjacent baffles (x: 86; y: 276; width: 867; height: 404 for 20171114.053–AEF20). The coordinates may vary for different discharges and camera ports, yet they are calculated by taking a bounding box over the masks of analysed components available in a scene model.

3.1.2. Sequential Implementation

The sequential implementation is based on Berger’s immersion algorithm [29] for max-tree construction and extended with attribute computation and direct filter procedures proposed in [30]. The union-by-rank technique is used at the cost of extra space complexity [30], a Lookup Table (LUT) of neighbouring pixels is pre-computed for all indices, and the iterative findRoot function is used instead of a recursive one to enhance performance.

3.1.3. Parallel Implementation

The parallel implementation is based on the flooding non-recursive Salembier’s algorithm [30], the subtree merging procedure described in [31] and the concurrent direct filter [32]. Two optimisations are introduced to obtain higher performance. Radix sort is computed concurrently with max-tree construction since sorted indices are necessary only for the attributes calculation step. Asynchronous radix sort is provided by NVIDIA’s CUB 1.12.1.0 (https://docs.nvidia.com/cuda/cub/, accessed on 16 November 2021). Max-tree construction is modelled using mapping and reduction transformations. An image is split row-wise, and each chunk is mapped to a subtree that is concurrently reduced (merged) as soon as two adjacent chunks are available (see Figure 7). Parallelisation, e.g., an optimal splitting strategy and thread scheduling, is orchestrated by Intel’s oneAPI Threading Building Blocks (oneTBB) 2021.3.0 (https://oneapi-src.github.io/oneTBB/, accessed on 16 November 2021).

3.1.4. Segmentation Algorithm

The processing pipeline for the segmentation algorithm is visible in Figure 8. The FoV mask substitutes values outside the camera lens with 0’s since there is only irrelevant noise. By subtracting the background frame, the influence of ambient temperature is decreased. The first frame in a dataset is taken as a background frame since there is no heating present at this point. The median filter is applied to eliminate salt noise, i.e., high transient values due to a neutron hitting the lens. Quantization and top-hat filters reduce the number of unique values and their range in the image. As a consequence, the number of nodes and depth of the max-tree created in the next step decreases, which is particularly important since the algorithm has to operate on 16-bit images that encode values from 0 to 65,535.
Morphological operations such as erosion and dilation that are used for the top-hat transform are based on the van Herk/Gil-Werman (vHGW) algorithm [33,34]. The algorithm computes 1D image erosion and dilation, which in turn allows one to construct more complex image morphology operators. Assuming that the structuring element is symmetric, then a 2D operator is obtained by applying a 1D operator row-wise, followed by applying the same operator column-wise on the result from the first operation. The vHGW method relies on a parallelisable scan operation that accumulates minimum or maximum (erosion or dilation) values across predefined segments. As a consequence, it requires only two comparisons to determine pixel value regardless of structuring element size. The applied structuring element size for the top-hat transform is 13 × 13, and the quantisation factor is 15.
For max-tree attributes computation, the identity operator is applied since pixel values are used for filtering. To propagate an attribute from a child to a parent, the operator shown in Formula (1) is applied. The direct filter threshold is 20 K :
f ( v p a r e n t , v ) = 0 , if v p a r e n t < 15 % v m a x ( v p a r e n t , v ) , otherwise

3.2. Reflection Detection

Reflections are typically observed on reflective materials, e.g., metallic surfaces, as opposed to highly emissive materials, e.g., carbon surfaces. Due to the high temperature measured on divertors and the proximity of other PFCs, divertors might be potential sources of reflections. The correlation of temporal temperature evolution between hotspots on a source (S) and destination (D) PFCs is measured using Normalised Cross Correlations ( N C C ) on a Sliding Time Window ( S W N C C ) with Formula (2) proposed by [35]:
S W N C C ( S , D ) = 1 T u = t T t ( S ( u ) μ S ) ( D ( u ) μ D ) σ S σ D ,
where the maximum hotspot temperature is used in calculations, as well as statistical parameters average ( μ ) and standard deviation ( σ ) over a window of length T to detect reflections (see Figure 9). The adaptive Gaussian filter extracts clusters having a higher temperature than the surrounding pixels that are candidates for reflection or a source of reflection. The FoV mask is utilised for the same reason as in the previous pipeline.
Blob analysis is performed in parallel for source and destination PFCs. Blob tracking is performed with the correspondence criteria that match blobs between consecutive frames by evaluating the relative change in overlap and area [16,36]. The GPU Block-based Union Find (BUF) algorithm [37] is used for Connected Component Labelling (CCL). The authors benchmarked various algorithms available in Yet Another Connected Components Labelling Benchmark (YACCLAB) [38], and no significant difference in performance was observed. Due to the inherently sequential nature of the CCL algorithm, the speed-up offered by a GPU is restricted. However, it allows data to remain in the GPU’s memory effectively, reducing the number of costly transfers between a host and device. Two blobs are classified as correlated when the S W N C C factor is ≥0.95.
The observed reflections between the divertors and the wall heat shields are shown in Figure 10. Although the wall heat shields were made of graphite during Operational Phase (OP) 1.2, which has low reflectivity, the reflections might still occur on this PFC, according to the reflection map [6] generated for W7-X with a Monte-Carlo Ray-Tracing model by [39].
Additional reflections are detected between the divertors and the vertical baffle (see Figure 11). The reflection blob coloured in red is not a reflection but the extension of the vertical divertor strike-line towards the vertical baffle [40]. Thus, the correlation to the other strike-line parts is high. The region where two blobs, coloured in green and blue, were detected has a high ratio between reflected flux and total flux according to the reflection model.
Figure 12, along with the supplementary labelling, shows S W N C C evolution between the exemplary blob on the wall heat shields and all source blobs on the divertors that are part of the strike-lines. The initial correlation spike and the eventual convergence resembles the results presented in [35]. All normalised correlation coefficients between source and destination blobs are above the threshold; therefore, it is presumed that the reflections originated from strike-lines.
It is noteworthy that there are also parallel divertor units monitored by another IR camera that might also contribute to the observed reflections. It would require an architecture that delivers both images simultaneously to compute the correlation from blobs originating on both divertor units. In addition, a heating profile might also influence the correlation characteristics between blobs.

3.3. Visualisation

Typically, IR images encode a measured surface temperature in more than 8-bits; therefore, in order to display those images in a meaningful way (see Figure 13), image processing is mandatory (see Figure 14). The CAD model of the stellarator is included in the scene model [13]. It is prepared by diagnosticians for each viewport and aligned with monitored PFCs. Properly visualised images might aid experts in the manual detection of certain events in order to control a machine from a control room or prepare annotations. Annotated data are necessary to quantitatively evaluate algorithms or train supervised ML and DL models [7].
Although step three could be performed concurrently to the execution of consecutive steps on a PVA to offload a GPU, the maximum operation is not currently supported in VPI. The global maximum temperature is used to plot a temperature evolution throughout a discharge. The implemented algorithm visualises frames that resemble the images shown in [40].

4. Results

4.1. Algorithm Performance

Benchmarks were performed for the three presented algorithms, as well as the two algorithms, overload hotspot detection and surface layer detection, previously described in [16]. For comparison, the measurements also include the setup with a discrete GPU (see Table 3).
The algorithms were benchmarked in the corresponding most computationally demanding intervals marked in Figure 15.
The strike-line segmentation, overload hotspot detection and reflection detection algorithms were benchmarked during the peak temperature from timestamps E to F. The surface-layer detection algorithm was benchmarked during the rapid temperature rise from timestamps C to D. The visualisation algorithm was benchmarked over the entire pulse from timestamps A to B. For the reflection detection, the performance of the detection between the divertor and the baffle components was measured.
In order to evaluate the speed-up resulting from applying the GPU, alternative parallel CPU pipelines were also implemented, i.e., all the steps are performed on the CPU. Most of the alternative CPU steps are highly optimised OpenCV functions with the oneTBB parallel framework to fully utilise computational resources. Measurements were performed after several warm-up iterations to minimise initialisation overhead. The execution time per frame is averaged over the selected discharge interval and repeated 20 times to compute the standard deviation and mean. The overhead of data migration between devices is included in the GPU benchmarks [16].
The results for the five algorithms measured on both configurations for two corresponding implementations—CPU-only and GPU-accelerated—are visible in Figure 16.
On the NVIDIA Quadro P4000 configuration, the parallel max-tree implementation (9.59 ms) is faster compared to the sequential implementation (16.43 ms). However, on the NVIDIA Jetson Xavier NX, the sequential implementation is slightly faster (29.37 ms in comparison to 33.12 ms).
For the NVIDIA Jetson Xavier NX, all the algorithms have the highest performance in NVPModel 0. One exception is the strike-line segmentation based on the parallel max-tree implementation (see Table 4).
Although the parallel max-tree implementation in the strike-line segmentation algorithm benefits from more active cores, it does not compensate for the reduced core frequencies in other operations.

4.2. Filter Performance

In the strike-line segmentation algorithm, the second most computationally intensive operation after the max-tree is the top-hat morphological operation. GPU-accelerated implementations provided by NVIDIA Performance Primitives (NPP) and OpenCV libraries deteriorate the performance of the entire segmentation process (see Table 5).

4.3. Algorithm Accuracy

The F 1 and the F 2 scores shown in Formulas (3) and (4) are used to evaluate strike-line binary segmentation quality in regard to the ground-truth masks:
F 1 = 2 × p r e c i s i o n × r e c a l l p r e c i s i o n + r e c a l l
F 2 = 5 × p r e c i s i o n × r e c a l l 4 × p r e c i s i o n + r e c a l l
The recall and precision measures are computed according to Formulas (5) and (6):
r e c a l l = T P T P + F N
p r e c i s i o n = T P T P + F P ,
where T P is the number of pixels correctly segmented as 1, F N refers to the number of pixels incorrectly segmented as 0 and F P corresponds to the number of pixels incorrectly segmented as 1.
The results of strike-line detection at the maximum temperature with the implemented 8-way canonical max-tree algorithm, segmented masks obtained in the literature [7] and the ground-truth masks are visible in Figure 17. The ground-truth mask was manually created under the supervision of an expert in [7].
Both masks were computed at the time when the heating process had just stopped. This timestamp is denoted as T 4 in the datasets. In the 20171114.053 (AEF20) dataset, it is timestamp 2017.11.14 16:39:49.701,240,461 UTC that corresponds to frame 259. In the 20180927.025 (AEF20) dataset, it is timestamp 2018.11.27 11:00:19.149,848,901 UTC that corresponds to frame 1635, and the RoI applied for this supplementary dataset is (x: 78; y: 277; width: 868; height: 402).
The actual ground-truth mask and the mask for comparison were not available in full resolution. The masks were manually extracted from the referenced paper and reconstructed. As a consequence, the comparison is not entirely accurate due to certain offset and resizing errors. A mask optimised for an F 1 score has too low resolution in [7] to make a meaningful comparison with the implemented algorithm. The F-scores computed for both images are summarised in Table 6.

5. Discussion

The paper expands the research and development presented in the authors’ previous publication [16] by describing more advanced algorithms for strike-line segmentation and reflection detection. Another low-power, embedded hardware platform was investigated and compared to the setup with the dedicated GPU.
All the benchmarked algorithms compute a result within the real-time constraint, i.e., 110 ms. The performance measured on the NVIDIA Jetson Xavier NX is higher for the algorithms described in [16]. There is a 30 % latency reduction in the overload hotspot detection and a 15 % reduction in the surface layer detection on the newer platform. Therefore, the performance of the NVIDIA Jetson Xavier NX is higher compared to the NVIDIA Jetson TX2. It is noteworthy that the price range and power consumption are the same for both SoC platforms, yet the NVIDIA Jetson Xavier NX offers superior performance, a smaller form-factor and additional features outlined in Section 2.2. Moreover, the I/O coherency reduces the efforts when porting the code from the configuration with a discrete GPU as page-locked buffers are cached on the CPU on the newest Tegra, as well as discrete GPUs. Even though the majority of the algorithms performed better in NVPModel 0, it is still advised to benchmark the target application on the NVPModel 2 to select the most optimal mode, especially for highly parallel CPU workloads, i.e., the parallel max-tree implementation has a higher performance when more cores are active.
As a result of incorporating a GPU, the implemented algorithms were notably accelerated on the NVIDIA Jetson Xavier NX. The latency was reduced for the strike-line segmentation and reflection detection by 47 % and 64 % , respectively. On the NVIDIA Quadro P4000 configuration, the execution time was decreased by 42 % and 69 % . It is observed that some GPU-accelerated implementations supplied by libraries are suboptimal and offer worse performance than their highly optimised CPU counterparts [16]. The authors applied the separable vHGW morphological dilation and erosion operations to implement the top-hat transform that has 87 % lower latency compared to the NPP and OpenCV implementations. Not only does the article confirm the hypothesis that real-time image processing is achievable in nuclear fusion applications, but also the embedded low-power SoC devices provide sufficient performance when appropriate algorithms and techniques are integrated. If GPU acceleration is applied, it is feasible to execute all the five algorithms sequentially (62 ms) within real-time constraints on the NVIDIA Jetson Xavier NX. However, the algorithms shall be executed concurrently in a real system to allocate more time to other essential activities, e.g., acquisition and feedback control.
In the first dataset, the obtained F-score for the strike-line segmentation algorithm is higher than the results described in the literature. Moreover, it is organoleptically visible that the obtained mask reassembles the ground-truth target more accurately, e.g., the strike-line is continuous, details at the top of the frame are not lost. In the second dataset, only the F 1 score is higher since the literature result significantly over-segments the strike-lines. It is also visible by comparing the notable spread between the F 1 ( 0.48 ) and the F 2 ( 0.67 ) scores for the literature result. It is justified to claim that the result obtained for the second dataset is also superior since it has remarkably higher granularity compared to the ground-truth mask, e.g., visible leading edges on the divertor tiles in the form of vertical spikes. The selection of parameters for the segmentation was not optimised to maximise any metric, and all the parameters were uniform across both datasets. If either recall or precision is prioritised, then it is advised to optimise the parameters, e.g., increase a top-hat kernel size or reduce a minimum propagation temperature percentage in Formula (1) to improve recall. The disadvantage of a deterministic image processing algorithm in image plasma diagnostics is the requirement of adjusting the parameters of several low-level algorithms to reflect discharge conditions.
The developed system is suitable for further extensions and qualitative comparison as a reference with future solutions. The authors plan to develop an efficient way of extracting nested thermal events inside a segmented strike-line. In addition to the online analysis, the image processing algorithms might also be applicable in an initial semi-automated offline data labelling for the AI models’ training. As a consequence, it is planned to explore applications of AI in image plasma diagnostics for adaptive machine protection and control.

6. Conclusions

For the first time, the paper demonstrates the feasibility of applying low-power SoC devices for relatively complex real-time image processing for image plasma diagnostics, including the first real-time capable implementation of strike-line segmentation for W7-X. Furthermore, it provides the reasons for selecting cost-efficient and power-efficient embedded Tegra devices for image plasma diagnostics, especially in MicroTCA.4 architectures. The GPU-accelerated processing pipelines consisting of selected and implemented image-processing algorithms are proposed based on the previous strategies [7,35] to segment and detect strike-lines and reflections in the W7-X stellarator. Their detection might allow for automating real-time risk evaluation incorporated in the divertor protection system in W7-X. A reduction in latency up to 64 % was observed, owing to the application of the embedded GPU. The undertaken optimisation process covered a proper selection of algorithms, their parameters, data migration techniques and allocation of GPU–CPU resources to maximise performance on the embedded architecture. In addition, the strike-line segmentation algorithm yields higher accuracy in comparison to the literature results due to the improved selection of the pre-processing algorithms, as well as the max-tree filtering criteria. Moreover, the paper illustrates the superiority of the new NVIDIA Jetson Xavier NX over the previous NVIDIA Jetson TX2 in terms of functional and computational capabilities [16]. Although the algorithms were tested on the W7-X experimental data, they are also applicable in different fusion devices equipped with IR monitoring systems, e.g., JET or WEST, after the adjustment of the algorithm parameters.

Author Contributions

Conceptualization, B.J.; methodology, D.M.; software, B.J.; validation, D.M., A.P.S., M.J. and Y.G.; formal analysis, B.J. and D.M.; investigation, B.J. and D.M.; resources, D.M., P.N.v.N., A.P.S., M.J., Y.G. and A.W.; data curation, B.J.; writing—original draft preparation, B.J. and D.M.; writing—review and editing, B.J., D.M., P.P. and P.N.v.N.; visualization, B.J.; supervision, D.M.; project administration, D.M.; funding acquisition, D.M. All authors have read and agreed to the published version of the manuscript.
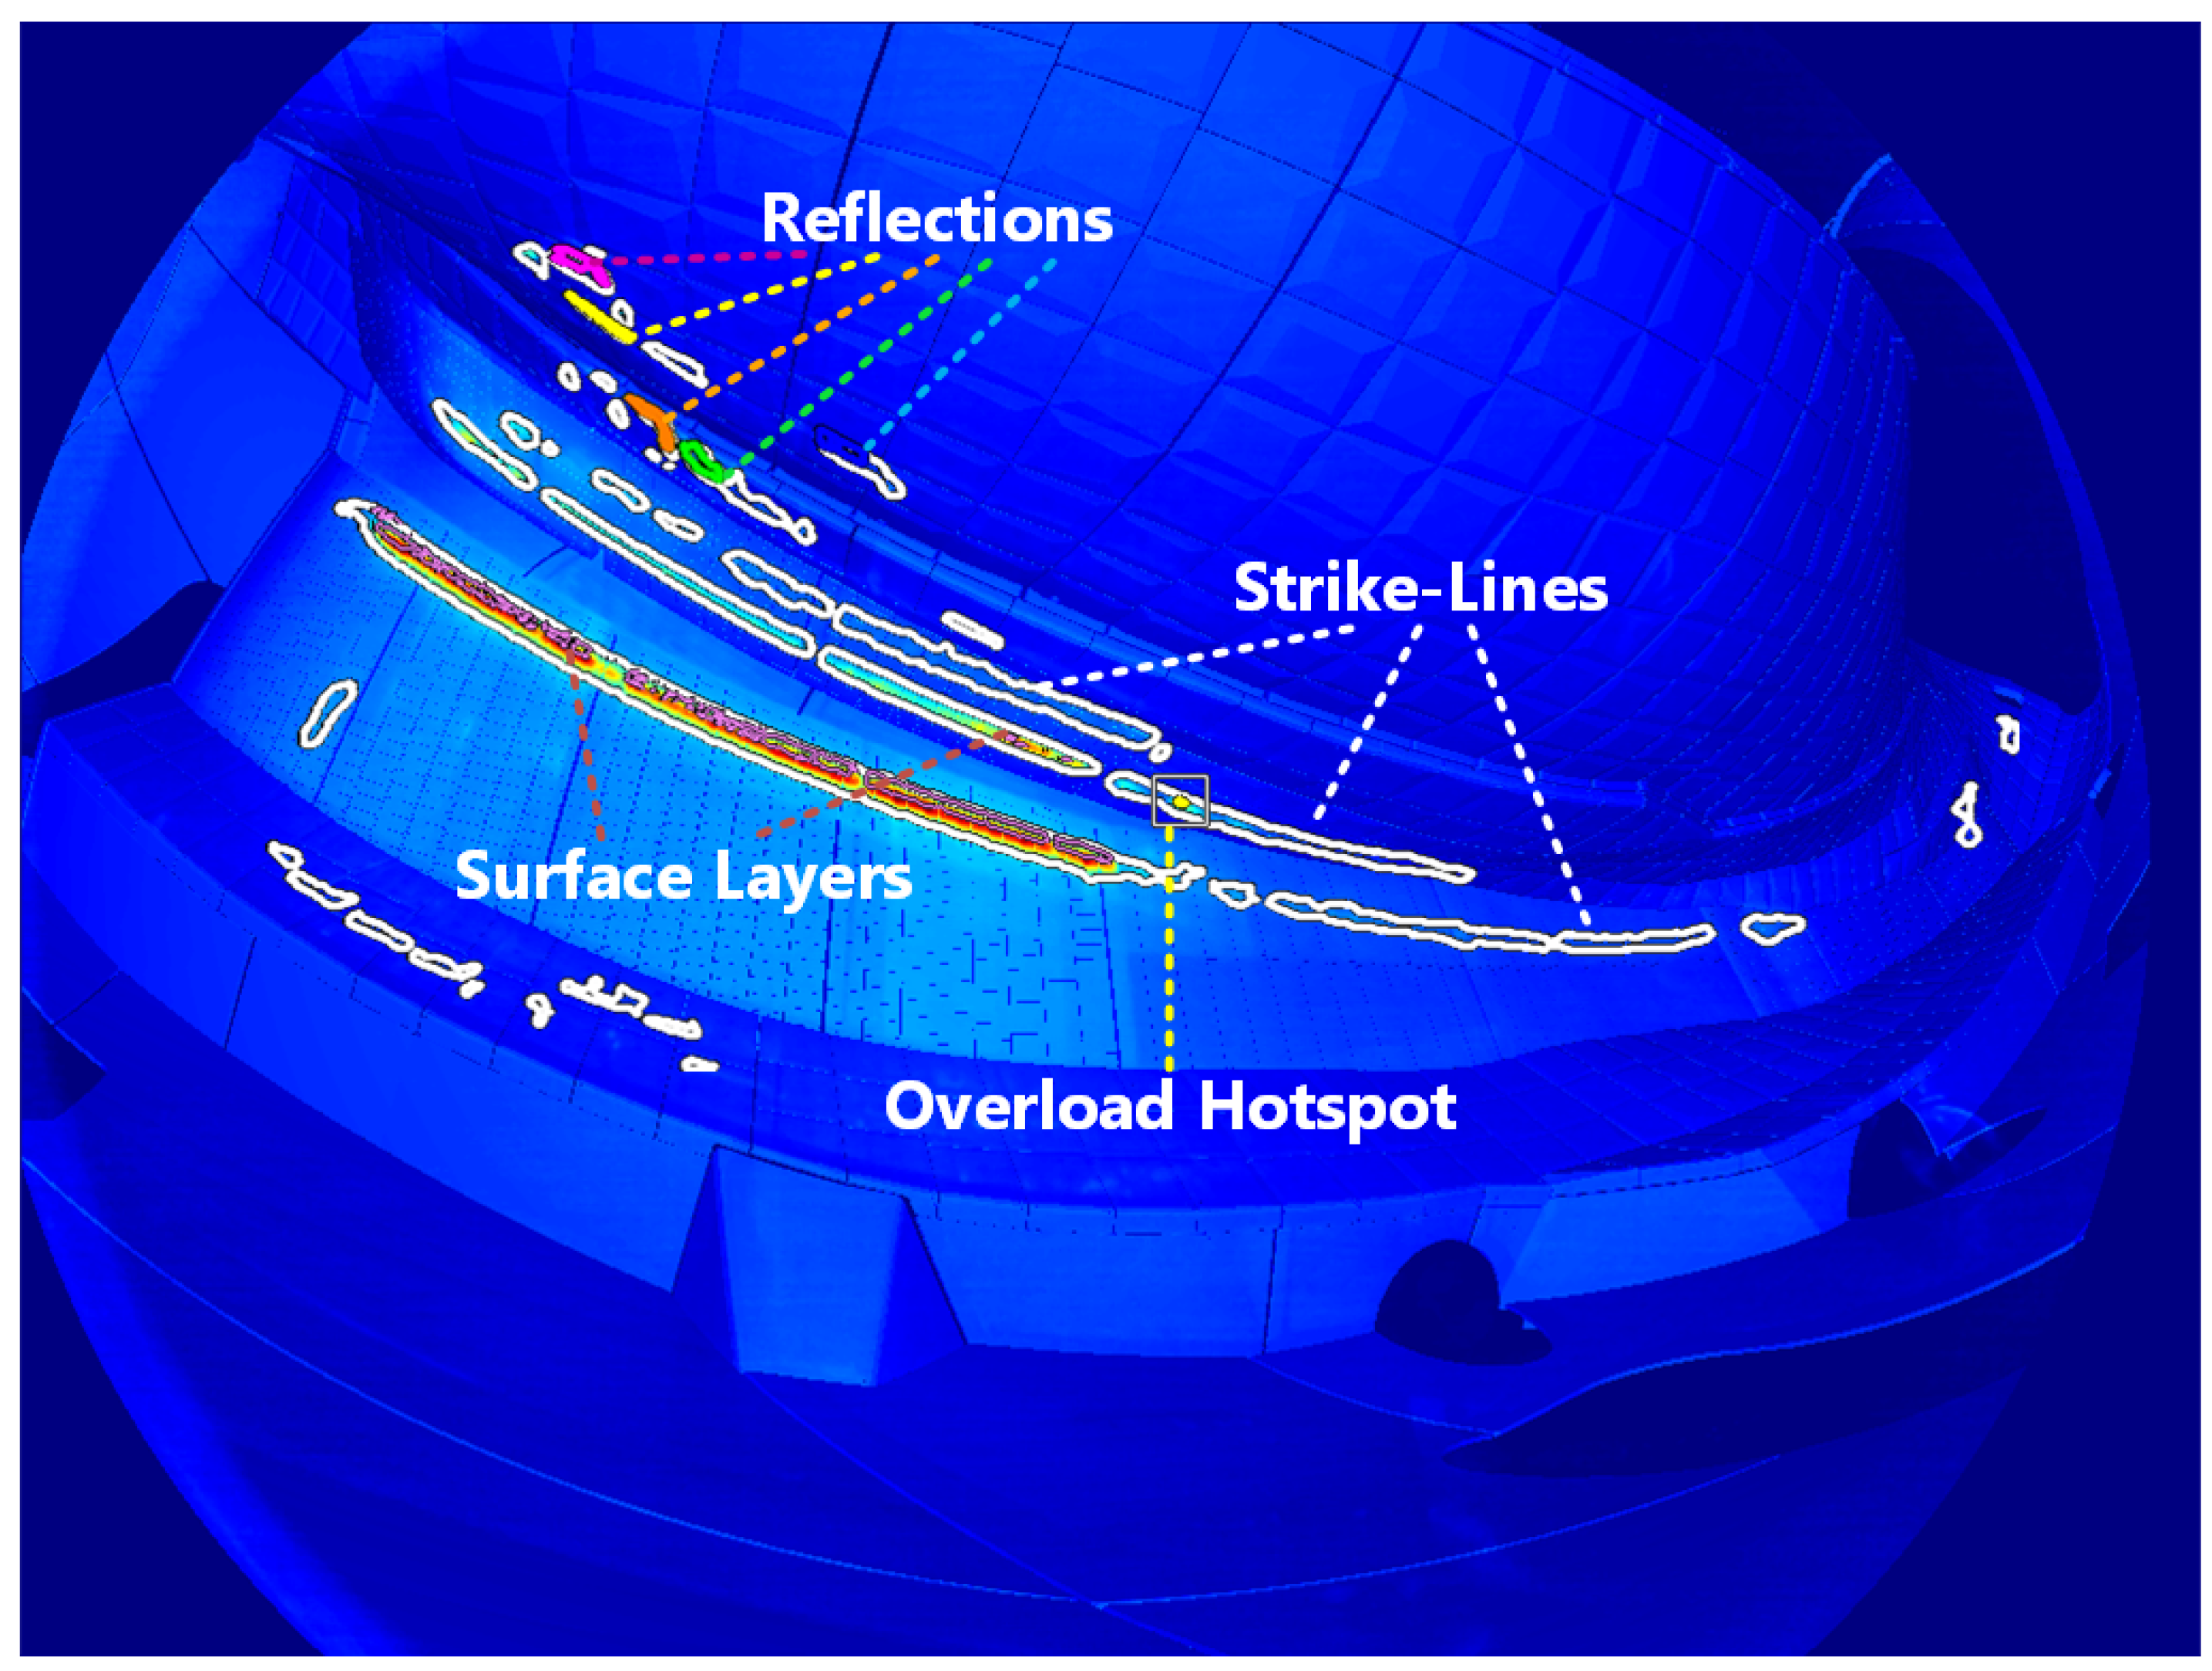
Funding

This research received no external funding.

Institutional Review Board Statement

Not applicable.

Informed Consent Statement

Not applicable.

Data Availability Statement

Restrictions apply to the availability of the Wendelstein 7-X experimental data. Data belong to EUROfusion Consortium, and the authors are not entitled to disclose it.

Acknowledgments

This work has been carried out within the framework of the EUROfusion Consortium, funded by the European Union via the Euratom Research and Training Programme (Grant Agreement No 101052200—EUROfusion). Views and opinions expressed are, however, those of the author(s) only and do not necessarily reflect those of the European Union or the European Commission. Neither the European Union nor the European Commission can be held responsible for them. This scientific paper has been published as part of the international project called ’PMW’, co-financed by the Polish Ministry of Science and Higher Education within the framework of the scientific financial resources for 2021 under the contract No W3/HEU-EURATOM/2022. This scientific paper has been completed while the first author and the fourth author were the Doctoral Candidates in the Interdisciplinary School at the Lodz University of Technology, Poland. Members of the W7-X team are listed in https://iopscience.iop.org/article/10.1088/1741-4326/ab03a7/meta, accessed on 1 March 2022.

Conflicts of Interest

The authors declare no conflict of interest.

Abbreviations

The following abbreviations are used in this manuscript:
AIArtificial Intelligence
APIApplication Programming Interface
BPCBad Pixel Correction
BUFBlock-based Union Find
CADComputer-Aided Design
CCLConnected Component Labelling
CPUCentral Processing Unit
CUDACompute Unified Device Architecture
CVComputer Vision
DLDeep Learning
DMADirect Memory Access
F N False Negative
FoVField of View
F P False Positive
FPGAField-Programmable Gate Array
GPGPUGeneral-Purpose computing on Graphics Processing Units
GPUGraphics Processing Unit
IRInfrared
JETJoint European Torus
KSTARKorea Superconducting Tokamak Advanced Research
L4TLinux for Tegra
LUTLookup Table
MLMachine Learning
NPPNVIDIA Performance Primitives
NUCNon-Uniformity Correction
NVDLANVIDIA Deep Learning Accelerator
oneTBBoneAPI Threading Building Blocks
OPOperational Phase
OSOperating System
PCIePeripheral Component Interconnect Express
PFCPlasma Facing Component
PVAProgrammable Vision Accelerator
RAMRandom-Access Memory
R-CNNRegion-Based Convolutional Neural Network
RoIRegion of Interest
SoCSystem-on-a-Chip
S W N C C Normalised Cross Correlations ( N C C ) on a Sliding Time Window
T P True Positive
vHGWvan Herk/Gil-Werman
VISVisible spectrum
VPIVision Programming Interface
W7-XWendelstein 7-X
WESTW Environment in Steady-state Tokamak
YACCLABYet Another Connected Components Labelling Benchmark

References

  1. Jabłoński, B.; Makowski, D.; Perek, P. Evaluation of NVIDIA Xavier NX Platform for Real-Time Image Processing for Fusion Diagnostics. In Proceedings of the 2021 28th International Conference on Mixed Design of Integrated Circuits and System, Lodz, Poland, 24–26 June 2021; pp. 63–68. [Google Scholar] [CrossRef]
  2. Orsitto, F.; Villari, R.; Moro, F.; Todd, T.; Lilley, S.; Jenkins, I.; Felton, R.; Biel, W.; Silva, A.; Scholz, M.; et al. Diagnostics and control for the steady state and pulsed tokamak DEMO. Nucl. Fusion 2016, 56, 026009. [Google Scholar] [CrossRef]
  3. Aumeunier, M.H.; Bohec, M.L.; Brunet, R.; Juven, A.; Gao, Y.; Sitjes, A.P.; Jakubowski, M.; Rigollet, F.; The WEST Team; The W7-X Upgrade Team. Development of Inverse Thermography Methods Based on Infrared Synthetic Diagnostic. Presentation at the 4th IAEA Technical Meeting on Fusion Data Processing, Validation and Analysis. 2021. Available online: https://conferences.iaea.org/event/251/contributions/20680/ (accessed on 6 December 2021).
  4. Ali, A.; Niemann, H.; Jakubowski, M.; Pedersen, T.S.; Neu, R.; Corre, Y.; Drewelow, P.; Sitjes, A.P.; Wurden, G.; Pisano, F.; et al. Initial results from the hotspot detection scheme for protection of plasma facing components in Wendelstein 7-X. Nucl. Mater. Energy 2019, 19, 335–339. [Google Scholar] [CrossRef]
  5. Rodatos, A.; Greuner, H.; Jakubowski, M.W.; Boscary, J.; Wurden, G.A.; Pedersen, T.S.; König, R. Detecting divertor damage during steady state operation of Wendelstein 7-X from thermographic measurements. Rev. Sci. Instrum. 2016, 87, 023506. [Google Scholar] [CrossRef] [PubMed]
  6. Sitjes, A.P.; Jakubowski, M.; Fellinger, J.; Drewelow, P.; Gao, Y.; Niemann, H.; Sunn-Pedersen, T.; König, R.; Naujoks, D.; Winter, A.; et al. Strategy for the real-time detection of thermal events on the plasma facing components of Wendelstein 7-X. In Proceedings of the Poster at 31st Symposium on Fusion Technology (SOFT2020), Dubrovnik, Croatia, 20–25 September 2020. [Google Scholar]
  7. Clemente Bonjour, R. Detection and Classification of Thermal Events in the Wendelstein 7-X. Master’s Thesis, Escola Tècnica Superior d’Enginyeria de Telecomunicació de Barcelona, Universitat Politècnica de Catalunya, Barcelona, Spain, 2020. [Google Scholar]
  8. Huber, A.; Kinna, D.; Huber, V.; Arnoux, G.; Sergienko, G.; Balboa, I.; Balorin, C.; Carman, P.; Carvalho, P.; Collins, S.; et al. Real-time protection of the JET ITER-like wall based on near infrared imaging diagnostic systems. Nucl. Fusion 2018, 58, 106021. [Google Scholar] [CrossRef] [Green Version]
  9. Huber, V.; Huber, A.; Kinna, D.; Matthews, G.; Sergienko, G.; Balboa, I.; Brezinsek, S.; Lomas, P.; Mailloux, J.; McCullen, P.; et al. The software and hardware architecture of the real-time protection of in-vessel components in JET-ILW. Nucl. Fusion 2019, 59, 076016. [Google Scholar] [CrossRef]
  10. Martin, V.; Travere, J.M.; Bremond, F.; Moncada, V.; Dunand, G. Thermal Event Recognition Applied to Protection of Tokamak Plasma-Facing Components. IEEE Trans. Instrum. Meas. 2010, 59, 1182–1191. [Google Scholar] [CrossRef] [Green Version]
  11. Minissale, M.; Pardanaud, C.; Bisson, R.; Gallais, L. The temperature dependence of optical properties of tungsten in the visible and near-infrared domains: An experimental and theoretical study. J. Phys. D Appl. Phys. 2017, 50, 455601. [Google Scholar] [CrossRef] [Green Version]
  12. Gaspar, J.; Aumeunier, M.H.; Le Bohec, M.; Rigollet, F.; Brezinsek, S.; Corre, Y.; Courtois, X.; Dejarnac, R.; Diez, M.; Dubus, L.; et al. In-situ assessment of the emissivity of tungsten plasma facing components of the WEST tokamak. Nucl. Mater. Energy 2020, 25, 100851. [Google Scholar] [CrossRef]
  13. Sitjes, A.P.; Jakubowski, M.; Ali, A.; Drewelow, P.; Moncada, V.; Pisano, F.; Ngo, T.T.; Cannas, B.; Travere, J.M.; Kocsis, G.; et al. Wendelstein 7-X Near Real-Time Image Diagnostic System for Plasma-Facing Components Protection. Fusion Sci. Technol. 2018, 74, 116–124. [Google Scholar] [CrossRef] [Green Version]
  14. Kadziela, M.; Jablonski, B.; Perek, P.; Makowski, D. Evaluation of the ITER Real-Time Framework for Data Acquisition and Processing from Pulsed Gigasample Digitizers. J. Fusion Energy 2020, 39, 261–269. [Google Scholar] [CrossRef]
  15. Puig Sitjes, A.; Jakubowski, M.; Naujoks, D.; Gao, Y.; Drewelow, P.; Niemann, H.; Fellinger, J.; Moncada, V.; Pisano, F.; Belafdil, C.; et al. Real-Time Detection of Overloads on the Plasma-Facing Components of Wendelstein 7-X. Appl. Sci. 2021, 11, 1969. [Google Scholar] [CrossRef]
  16. Jabłoński, B.; Makowski, D.; Perek, P. Implementation of Thermal Event Image Processing Algorithms on NVIDIA Tegra Jetson TX2 Embedded System-on-a-Chip. Energies 2021, 14, 4416. [Google Scholar] [CrossRef]
  17. NVIDIA Corporation. NVIDIA Jetson Xavier NX System-on-Module Data Sheet. Version 1.6.. 2020. Available online: https://developer.nvidia.com/jetson-xavier-nx-data-sheet/ (accessed on 16 November 2021).
  18. NVIDIA Corporation. NVIDIA Jetson Xavier NX Developer Kit Carrier Board Specification. Version 1.0.. 2020. Available online: https://developer.nvidia.com/jetson-xavier-nx-developer-kit-carrier-board-specification-p3509-a01/ (accessed on 16 November 2021).
  19. NVIDIA Corporation. CUDA for Tegra. Version 11.3.1.. 2021. Available online: https://docs.nvidia.com/cuda/cuda-for-tegra-appnote/ (accessed on 16 November 2021).
  20. Grelier, E.; Mitteau, R.; Moncada, V. Deep Learning and Image Processing for the Automated Analysis of Thermal Events on the First Wall and Divertor of Fusion Reactors. Presentation at the 4th IAEA Technical Meeting on Fusion Data Processing, Validation and Analysis. 2021. Available online: https://conferences.iaea.org/event/251/contributions/20638/ (accessed on 6 December 2021).
  21. Kwon, G.; Wi, H.; Hong, J. Tokamak visible image sequence recognition using nonlocal spatio-temporal CNN for attention needed area localization. Fusion Eng. Des. 2021, 168, 112375. [Google Scholar] [CrossRef]
  22. Pisano, F.; Cannas, B.; Fanni, A.; Sias, G.; Gao, Y.; Jakubowski, M.; Niemann, H.; Sitjes, A.P. Learning control coil currents from heat-flux images using convolutional neural networks at Wendelstein 7-X. Plasma Phys. Control. Fusion 2020, 63, 025009. [Google Scholar] [CrossRef]
  23. Böckenhoff, D.; Blatzheim, M.; Hölbe, H.; Niemann, H.; Pisano, F.; Labahn, R.; Pedersen, T.S. Reconstruction of magnetic configurations in W7-X using artificial neural networks. Nucl. Fusion 2018, 58, 056009. [Google Scholar] [CrossRef] [Green Version]
  24. Ferreira, D.R. Using HPC infrastructures for deep learning applications in fusion research. Plasma Phys. Control. Fusion 2021, 63, 084006. [Google Scholar] [CrossRef]
  25. Jabłoński, G.; Makowski, D.; Mielczarek, A.; Orlikowski, M.; Perek, P.; Napieralski, A.; Makijarvi, P.; Simrock, S. IEEE 1588 Time Synchronization Board in MTCA.4 Form Factor. IEEE Trans. Nucl. Sci. 2015, 62, 919–924. [Google Scholar] [CrossRef]
  26. Makowski, D.; Mielczarek, A.; Perek, P.; Napieralski, A.; Butkowski, L.; Branlard, J.; Fenner, M.; Schlarb, H.; Yang, B. High-Speed Data Processing Module for LLRF. IEEE Trans. Nucl. Sci. 2015, 62, 1083–1090. [Google Scholar] [CrossRef] [Green Version]
  27. Makowski, D.; Mielczarek, A.; Perek, P.; Jabłoński, G.; Orlikowski, M.; Sakowicz, B.; Napieralski, A.; Makijarvi, P.; Simrock, S.; Martin, V. High-Performance Image Acquisition and Processing System with MTCA.4. IEEE Trans. Nucl. Sci. 2015, 62, 925–931. [Google Scholar] [CrossRef]
  28. Mielczarek, A.; Makowski, D.; Perek, P.; Napieralski, A. Framework for High-Performance Video Acquisition and Processing in MTCA.4 Form Factor. IEEE Trans. Nucl. Sci. 2019, 66, 1144–1150. [Google Scholar] [CrossRef]
  29. Berger, C.; Geraud, T.; Levillain, R.; Widynski, N.; Baillard, A.; Bertin, E. Effective Component Tree Computation with Application to Pattern Recognition in Astronomical Imaging. In Proceedings of the 2007 IEEE International Conference on Image Processing, San Antonio, TX, USA, 16 September–19 October 2007; Volume 4, pp. IV-41–IV-44. [Google Scholar] [CrossRef] [Green Version]
  30. Carlinet, E.; Géraud, T. A Comparative Review of Component Tree Computation Algorithms. IEEE Trans. Image Process. 2014, 23, 3885–3895. [Google Scholar] [CrossRef] [PubMed] [Green Version]
  31. Götz, M.; Cavallaro, G.; Géraud, T.; Book, M.; Riedel, M. Parallel Computation of Component Trees on Distributed Memory Machines. IEEE Trans. Parallel Distrib. Syst. 2018, 29, 2582–2598. [Google Scholar] [CrossRef] [Green Version]
  32. Wilkinson, M.H.; Gao, H.; Hesselink, W.H.; Jonker, J.E.; Meijster, A. Concurrent Computation of Attribute Filters on Shared Memory Parallel Machines. IEEE Trans. Pattern Anal. Mach. Intell. 2008, 30, 1800–1813. [Google Scholar] [CrossRef] [PubMed] [Green Version]
  33. Domanski, L.; Vallotton, P.; Wang, D. Parallel van Herk/Gil-Werman Image Morphology on GPUs Using CUDA. Poster at GTC Silicon Valley. 2009. Available online: https://www.nvidia.com/content/GTC/posters/14_Domanski_Parallel_vanHerk.pdf (accessed on 16 November 2021).
  34. Thurley, M.J.; Danell, V. Fast Morphological Image Processing Open-Source Extensions for GPU Processing with CUDA. IEEE J. Sel. Top. Signal Process. 2012, 6, 849–855. [Google Scholar] [CrossRef] [Green Version]
  35. Martin, V.; Moncada, V.; Travere, J.M.; Loarer, T.; Brémond, F.; Charpiat, G.; Thonnat, M. A cognitive vision system for nuclear fusion device monitoring. In Computer Vision Systems; Springer: Berlin/Heidelberg, Germany, 2011; pp. 163–172. [Google Scholar]
  36. Drenik, A.; Brezinsek, S.; Carvalho, P.; Huber, V.; Osterman, N.; Matthews, G.; Nemec, M. Analysis of the outer divertor hot spot activity in the protection video camera recordings at JET. Fusion Eng. Des. 2019, 139, 115–123. [Google Scholar] [CrossRef] [Green Version]
  37. Allegretti, S.; Bolelli, F.; Grana, C. Optimized Block-Based Algorithms to Label Connected Components on GPUs. IEEE Trans. Parallel Distrib. Syst. 2019, 31, 423–438. [Google Scholar] [CrossRef] [Green Version]
  38. Grana, C.; Bolelli, F.; Baraldi, L.; Vezzani, R. YACCLAB-Yet Another Connected Components Labeling Benchmark. In Proceedings of the 2016 23rd International Conference on Pattern Recognition (ICPR), Cancun, Mexico, 4–8 December 2016; pp. 3109–3114. [Google Scholar] [CrossRef] [Green Version]
  39. Ben Yaala, M.; Aumeunier, M.H.; Steiner, R.; Schönenberger, M.; Martin, C.; Le Bohec, M.; Talatizi, C.; Marot, L.; Meyer, E. Bidirectional reflectance measurement of tungsten samples to assess reflection model in WEST tokamak. Rev. Sci. Instrum. 2021, 92, 093501. [Google Scholar] [CrossRef] [PubMed]
  40. Sitjes, A.P.; Gao, Y.; Jakubowski, M.; Drewelow, P.; Niemann, H.; Ali, A.; Moncada, V.; Pisano, F.; Ngo, T.; Cannas, B.; et al. Observation of thermal events on the plasma facing components of Wendelstein 7-X. J. Instrum. 2019, 14, C11002. [Google Scholar] [CrossRef]
Figure 1. Detected thermal events in the 20171114.053 (AEF20) dataset. The strike-line visible on the vertical divertor, the top one, is a reflection of the other strike-line, according to simulations conducted by [3].
Energies 15 02088 g001
Figure 2. Developed image processing pipeline. Algorithms described in the article have bolded edges, i.e., strike-line segmentation, reflection detection and visualisation.
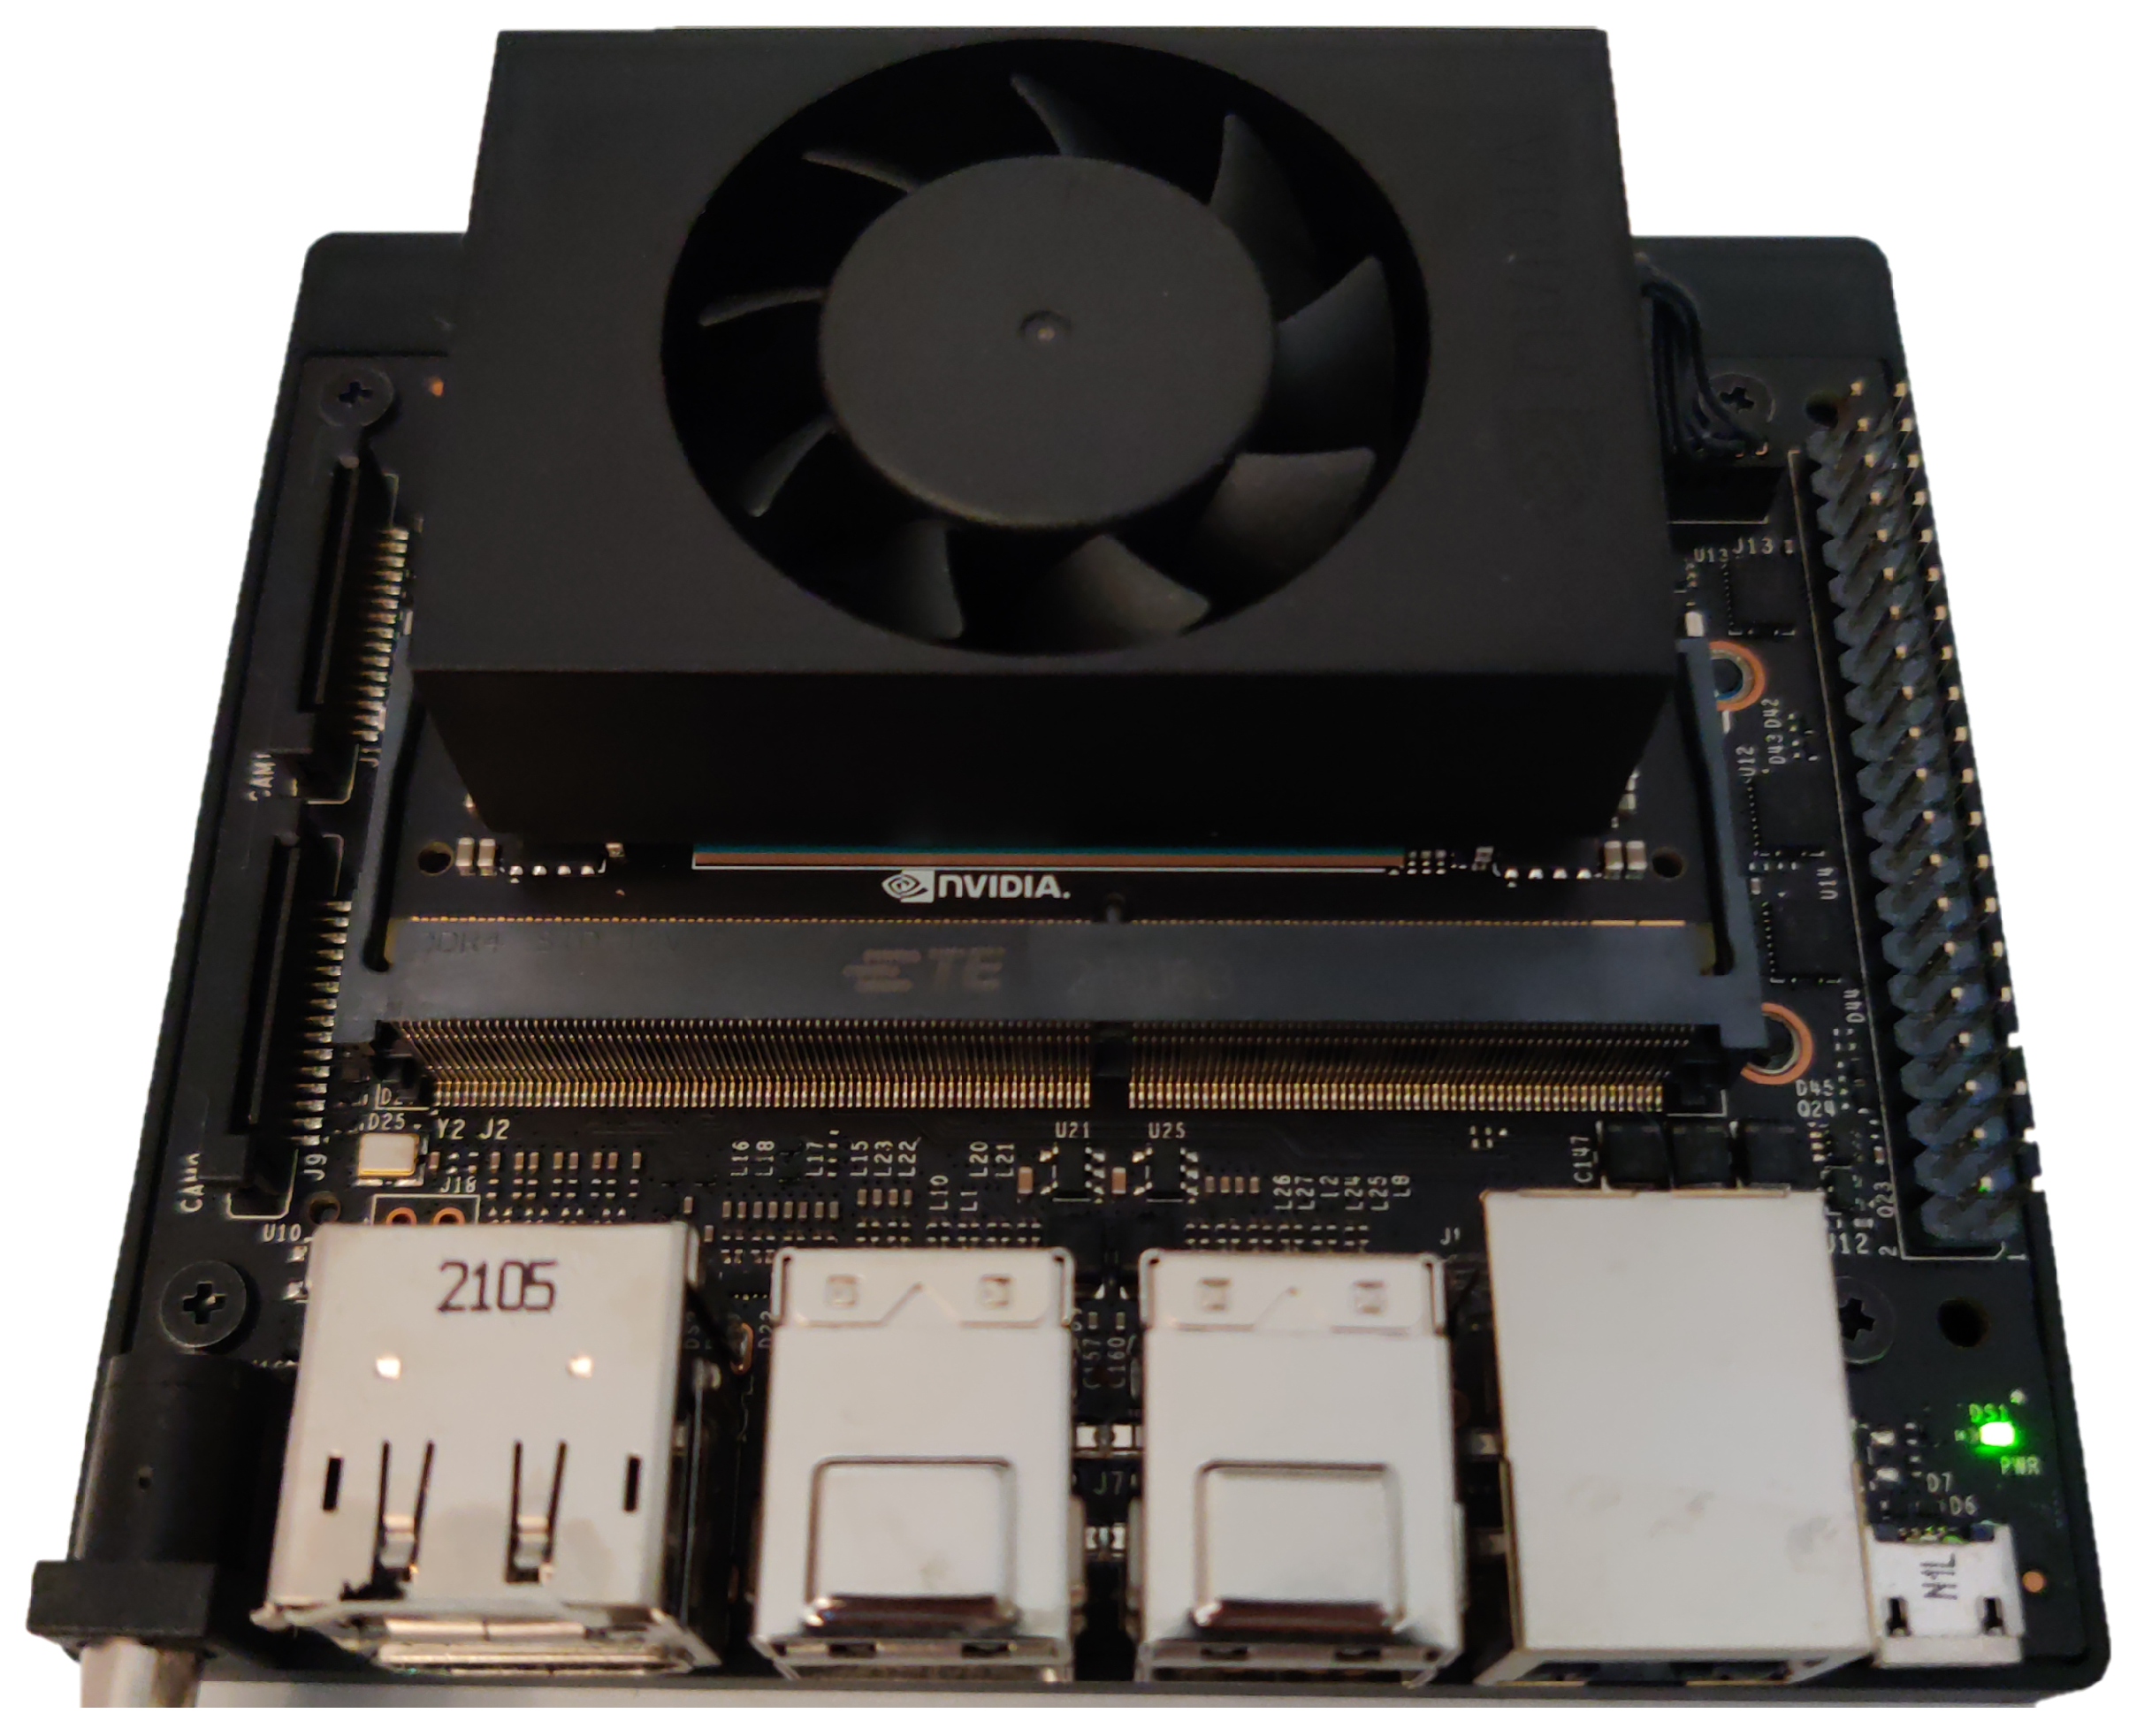
Energies 15 02088 g002
Figure 3. NVIDIA Jetson Xavier NX Developer Kit.
Energies 15 02088 g003
Figure 4. Visualisation of data accessibility and caching of pageable and pinned buffers for integrated Graphics Processing Unit (GPU) and Central Processing Unit (CPU) on the System-on-a-Chip (SoC) platform supporting I/O coherency.
Energies 15 02088 g004
Figure 5. Max-tree processing pipeline.
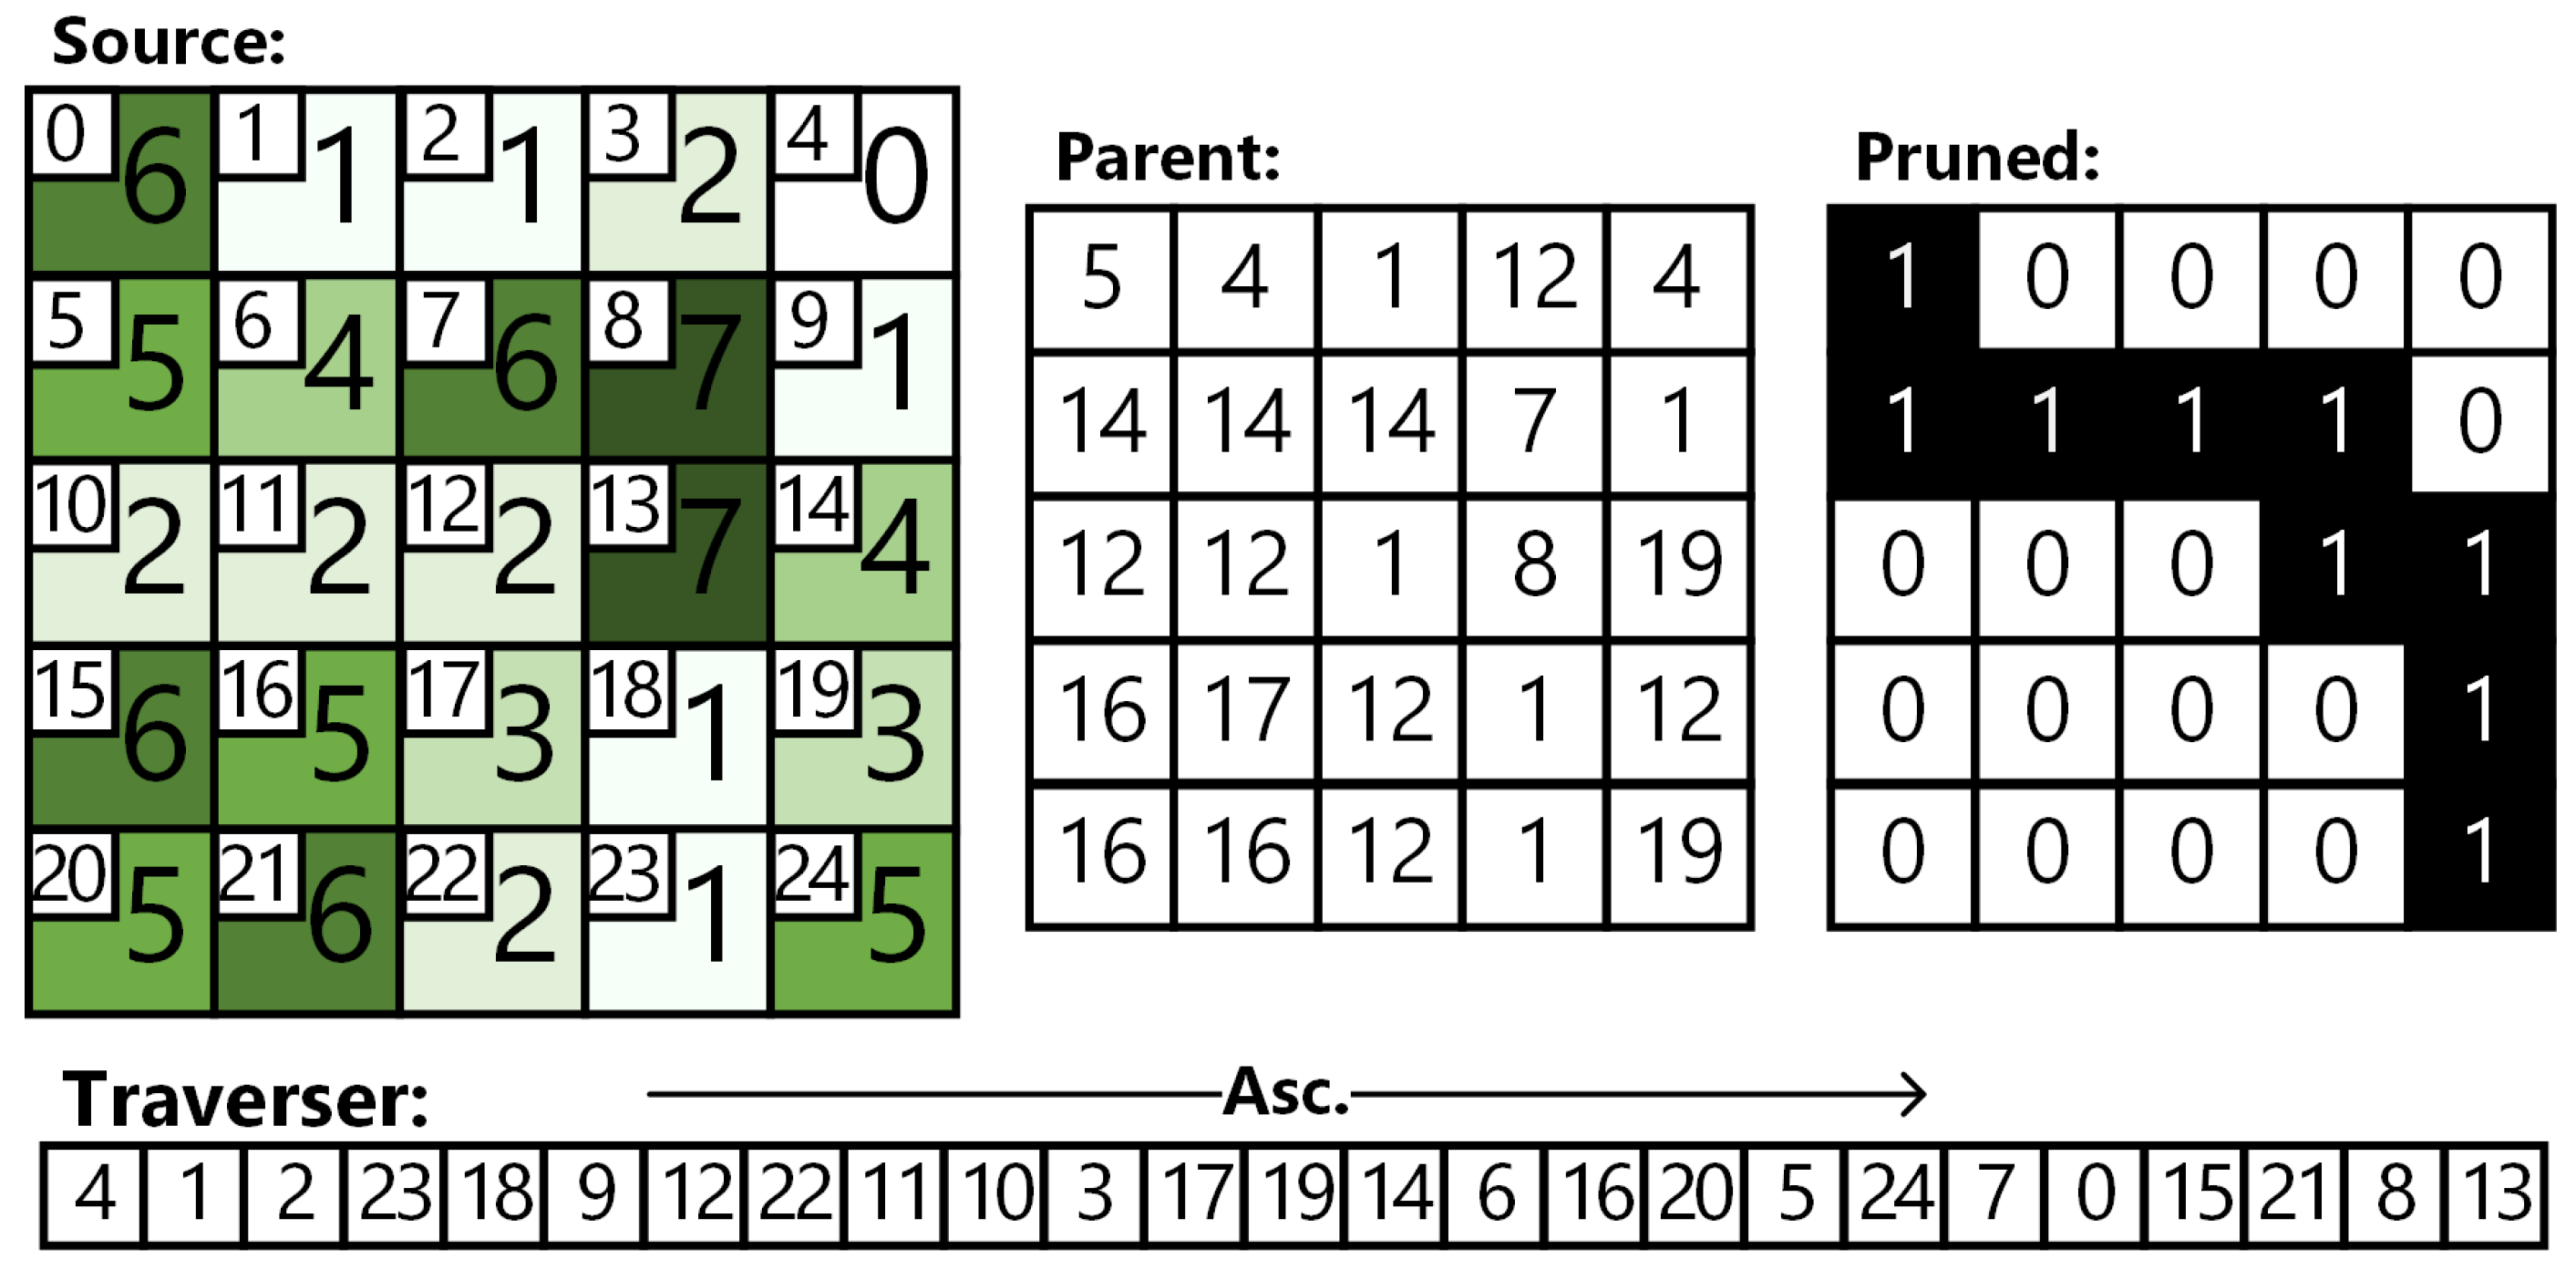
Energies 15 02088 g005
Figure 6. Resulting max-tree representation (parent, traverser) and the pruning result (pruned) for the exemplary source image (source).
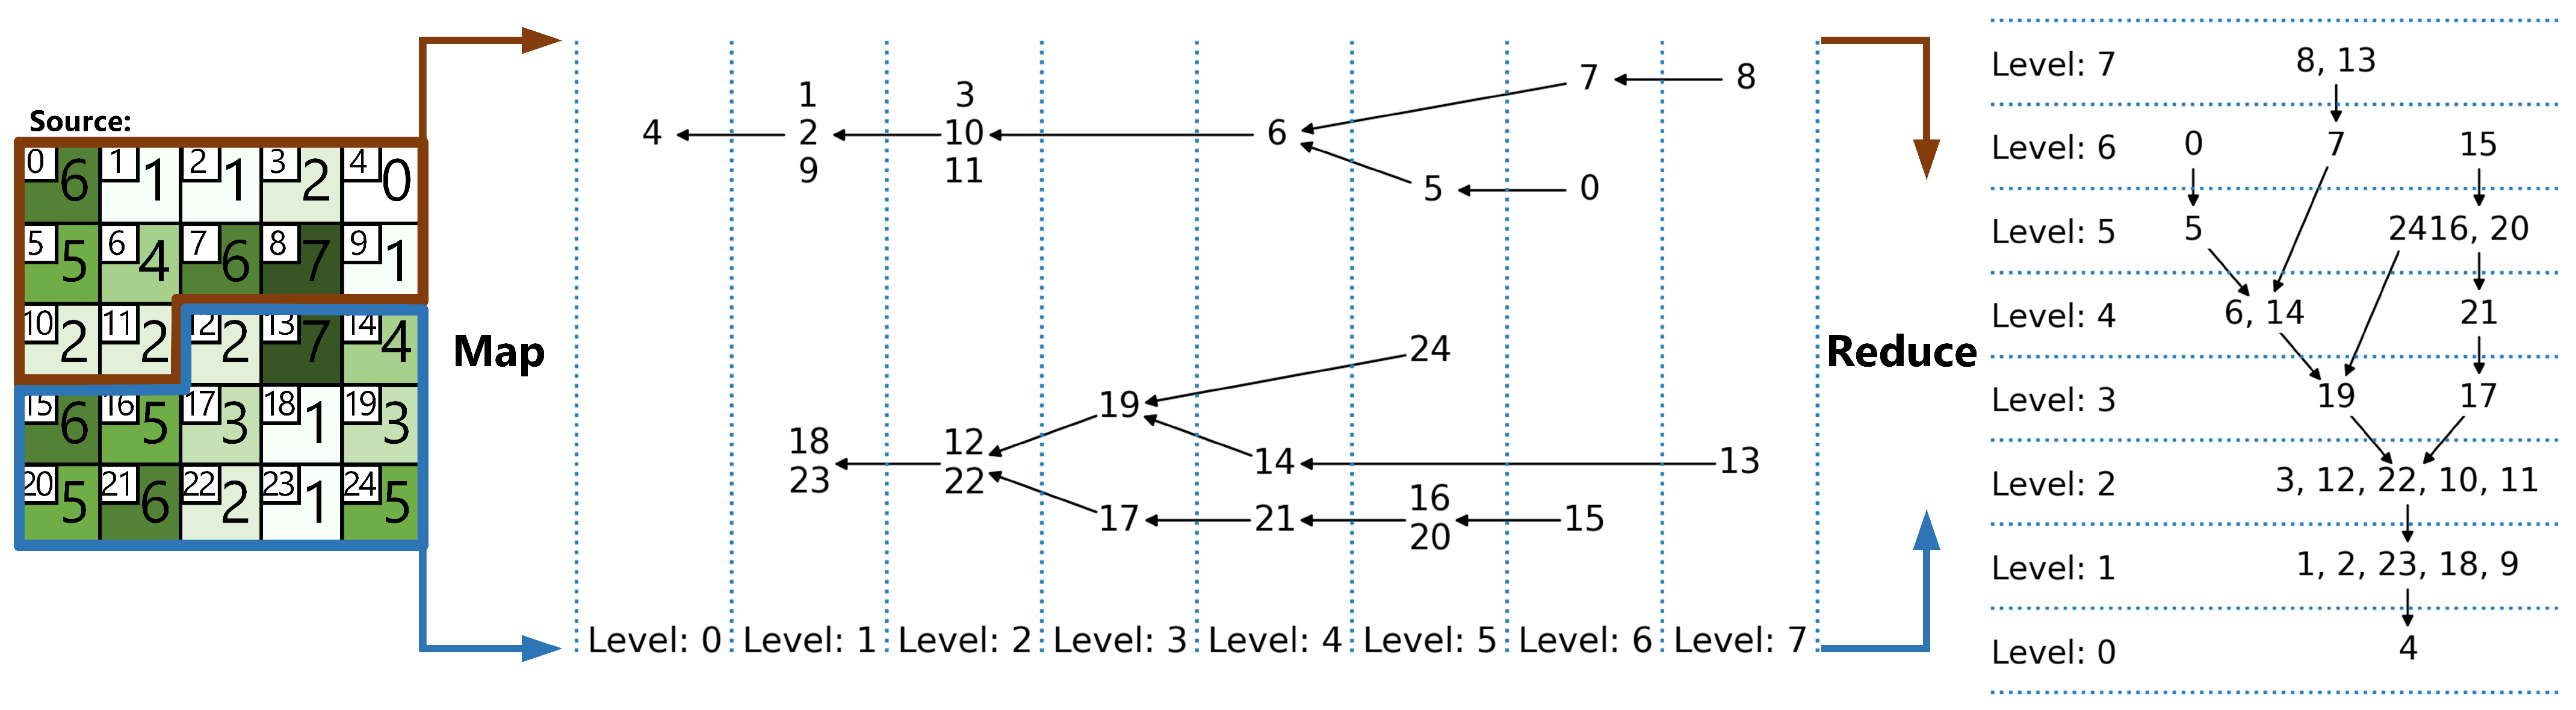
Energies 15 02088 g006
Figure 7. Example of the parallel max-tree mapping and reduction transformations. A source image is split into two parts of sizes 12 and 13, then two chunks are mapped to two subtrees and merged into the final result. Graph nodes contain image indices.
Energies 15 02088 g007
Figure 8. Strike-line segmentation algorithm pipeline. The algorithm returns the mask containing continuous segmented regions of elevated temperature corresponding to strike-lines and hot-spots. Each step is annotated as to whether a CPU or GPU is used for computations.
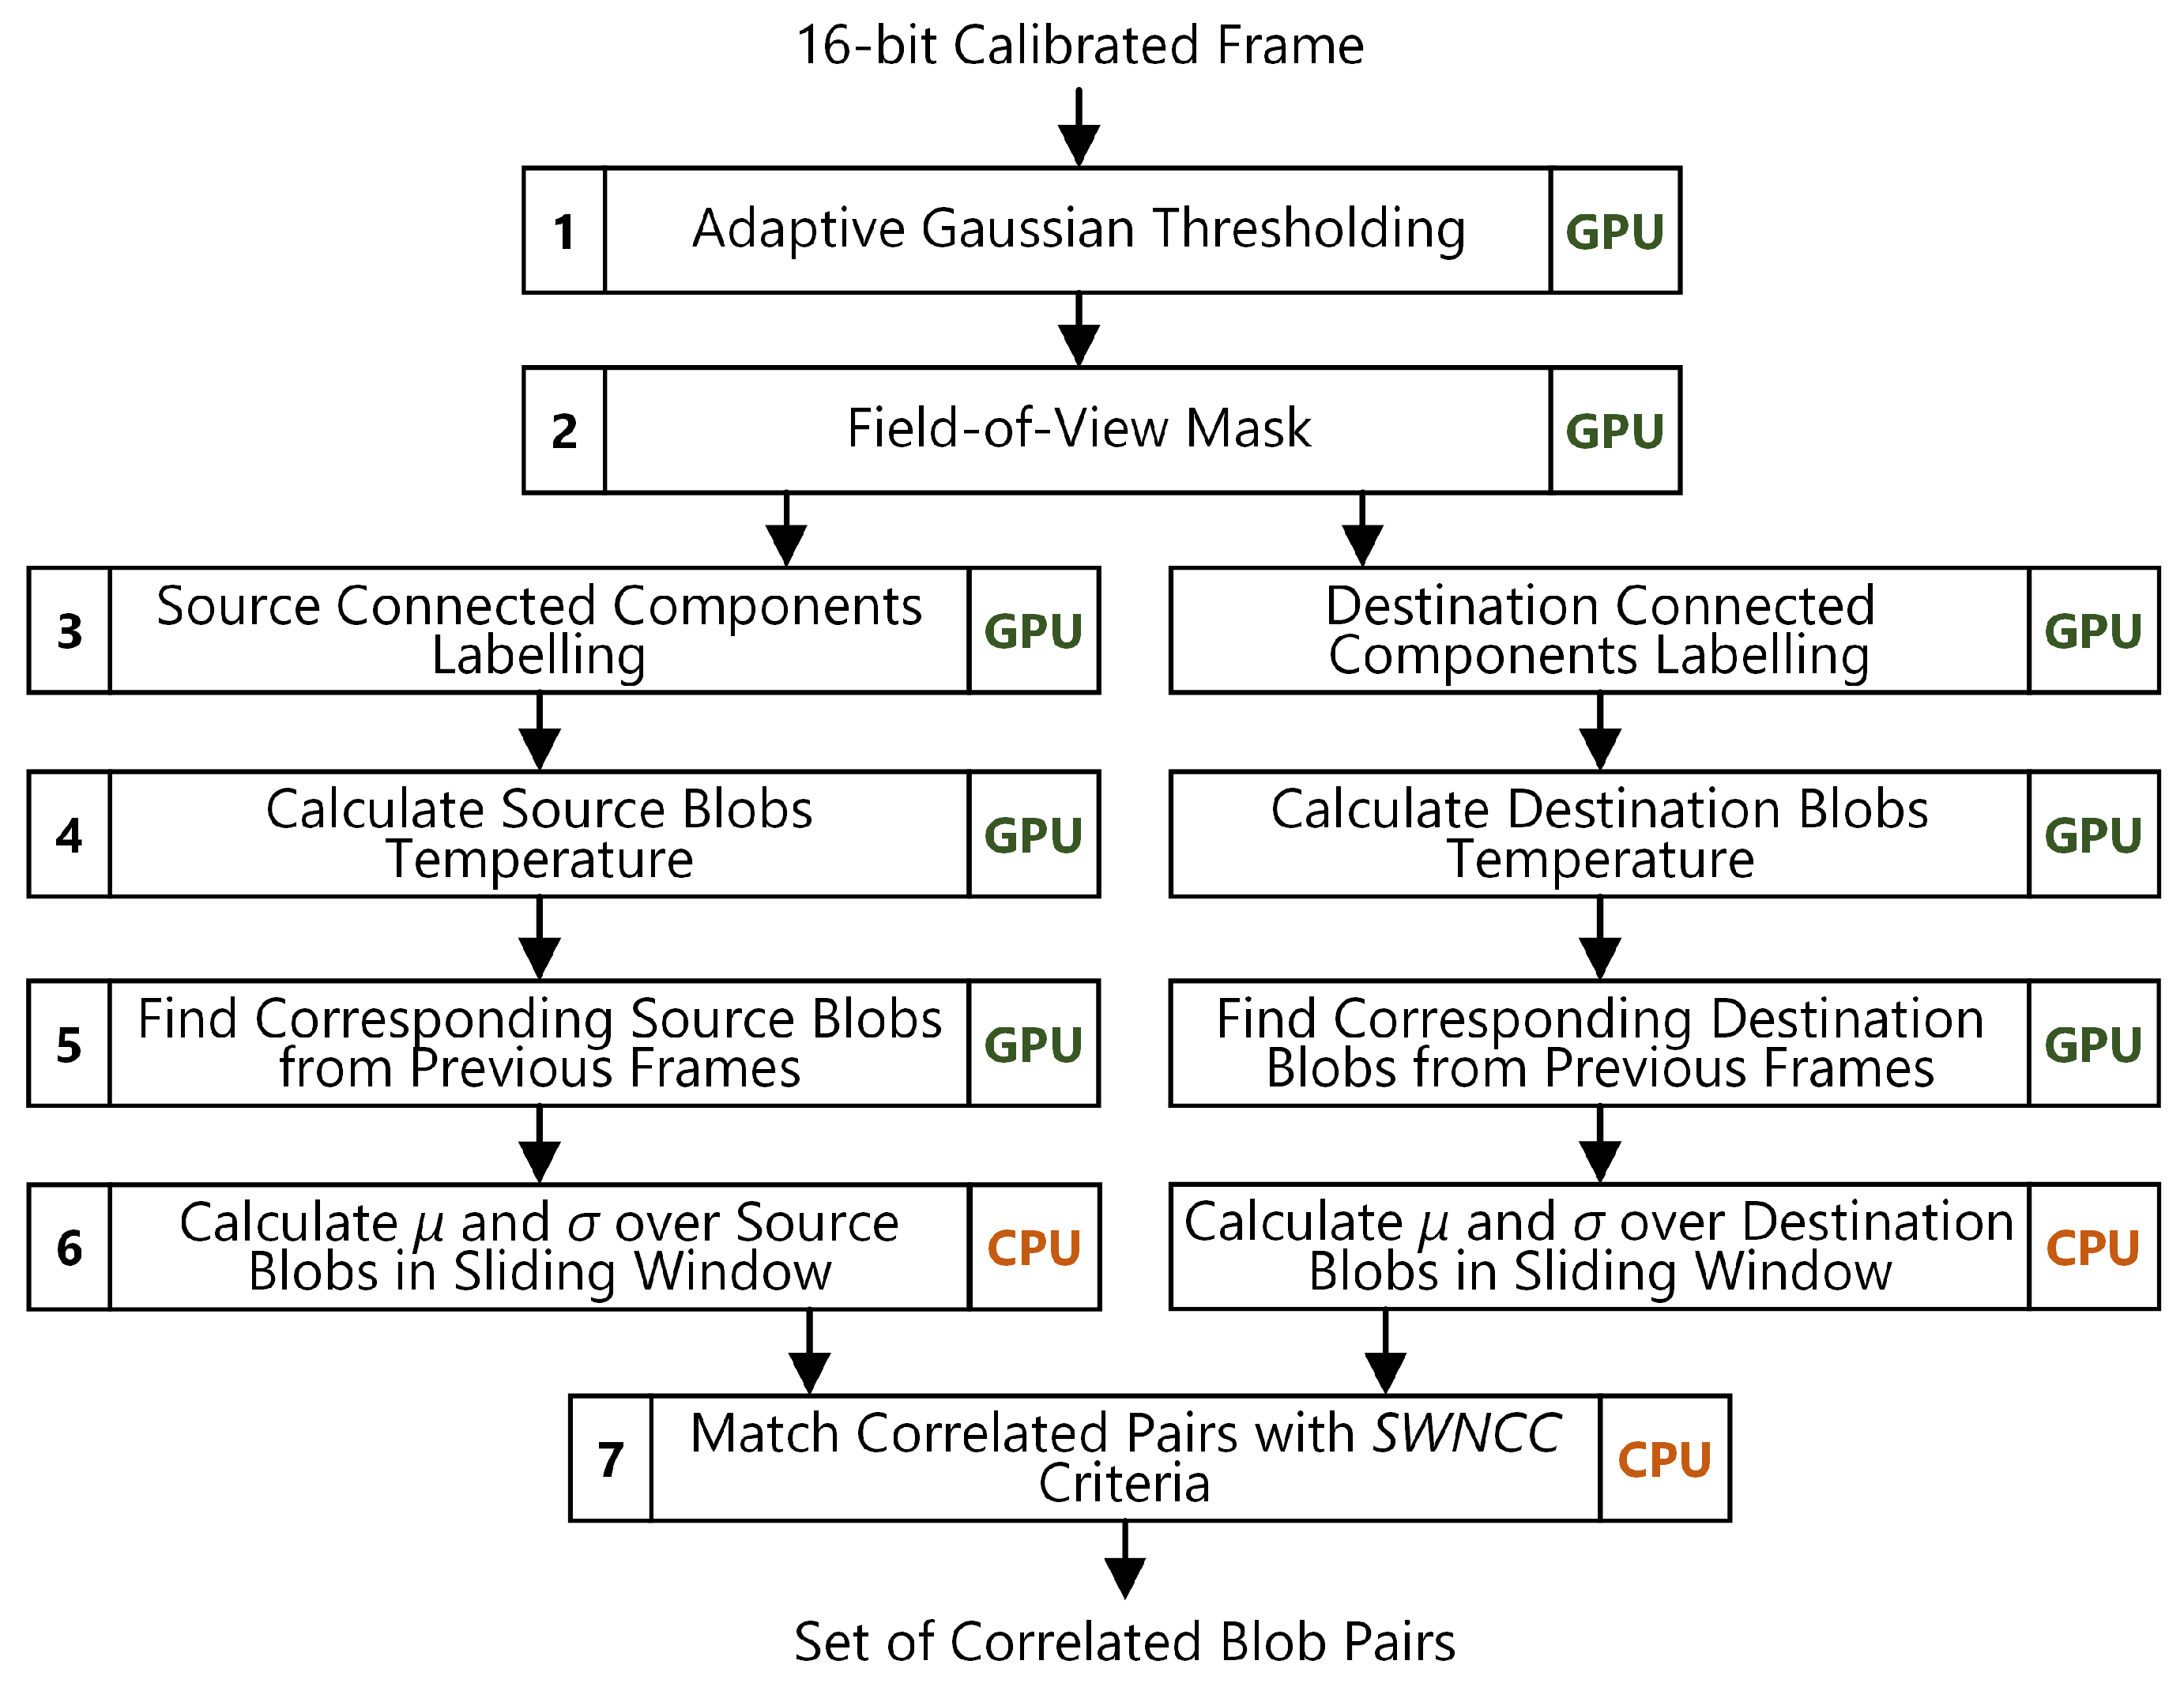
Energies 15 02088 g008
Figure 9. Reflection detection algorithm pipeline. The algorithm returns correlated blob pairs between two selected Plasma Facing Component (PFC) corresponding to reflections. Each step is annotated as to whether a GPU or GPU is used for computations.
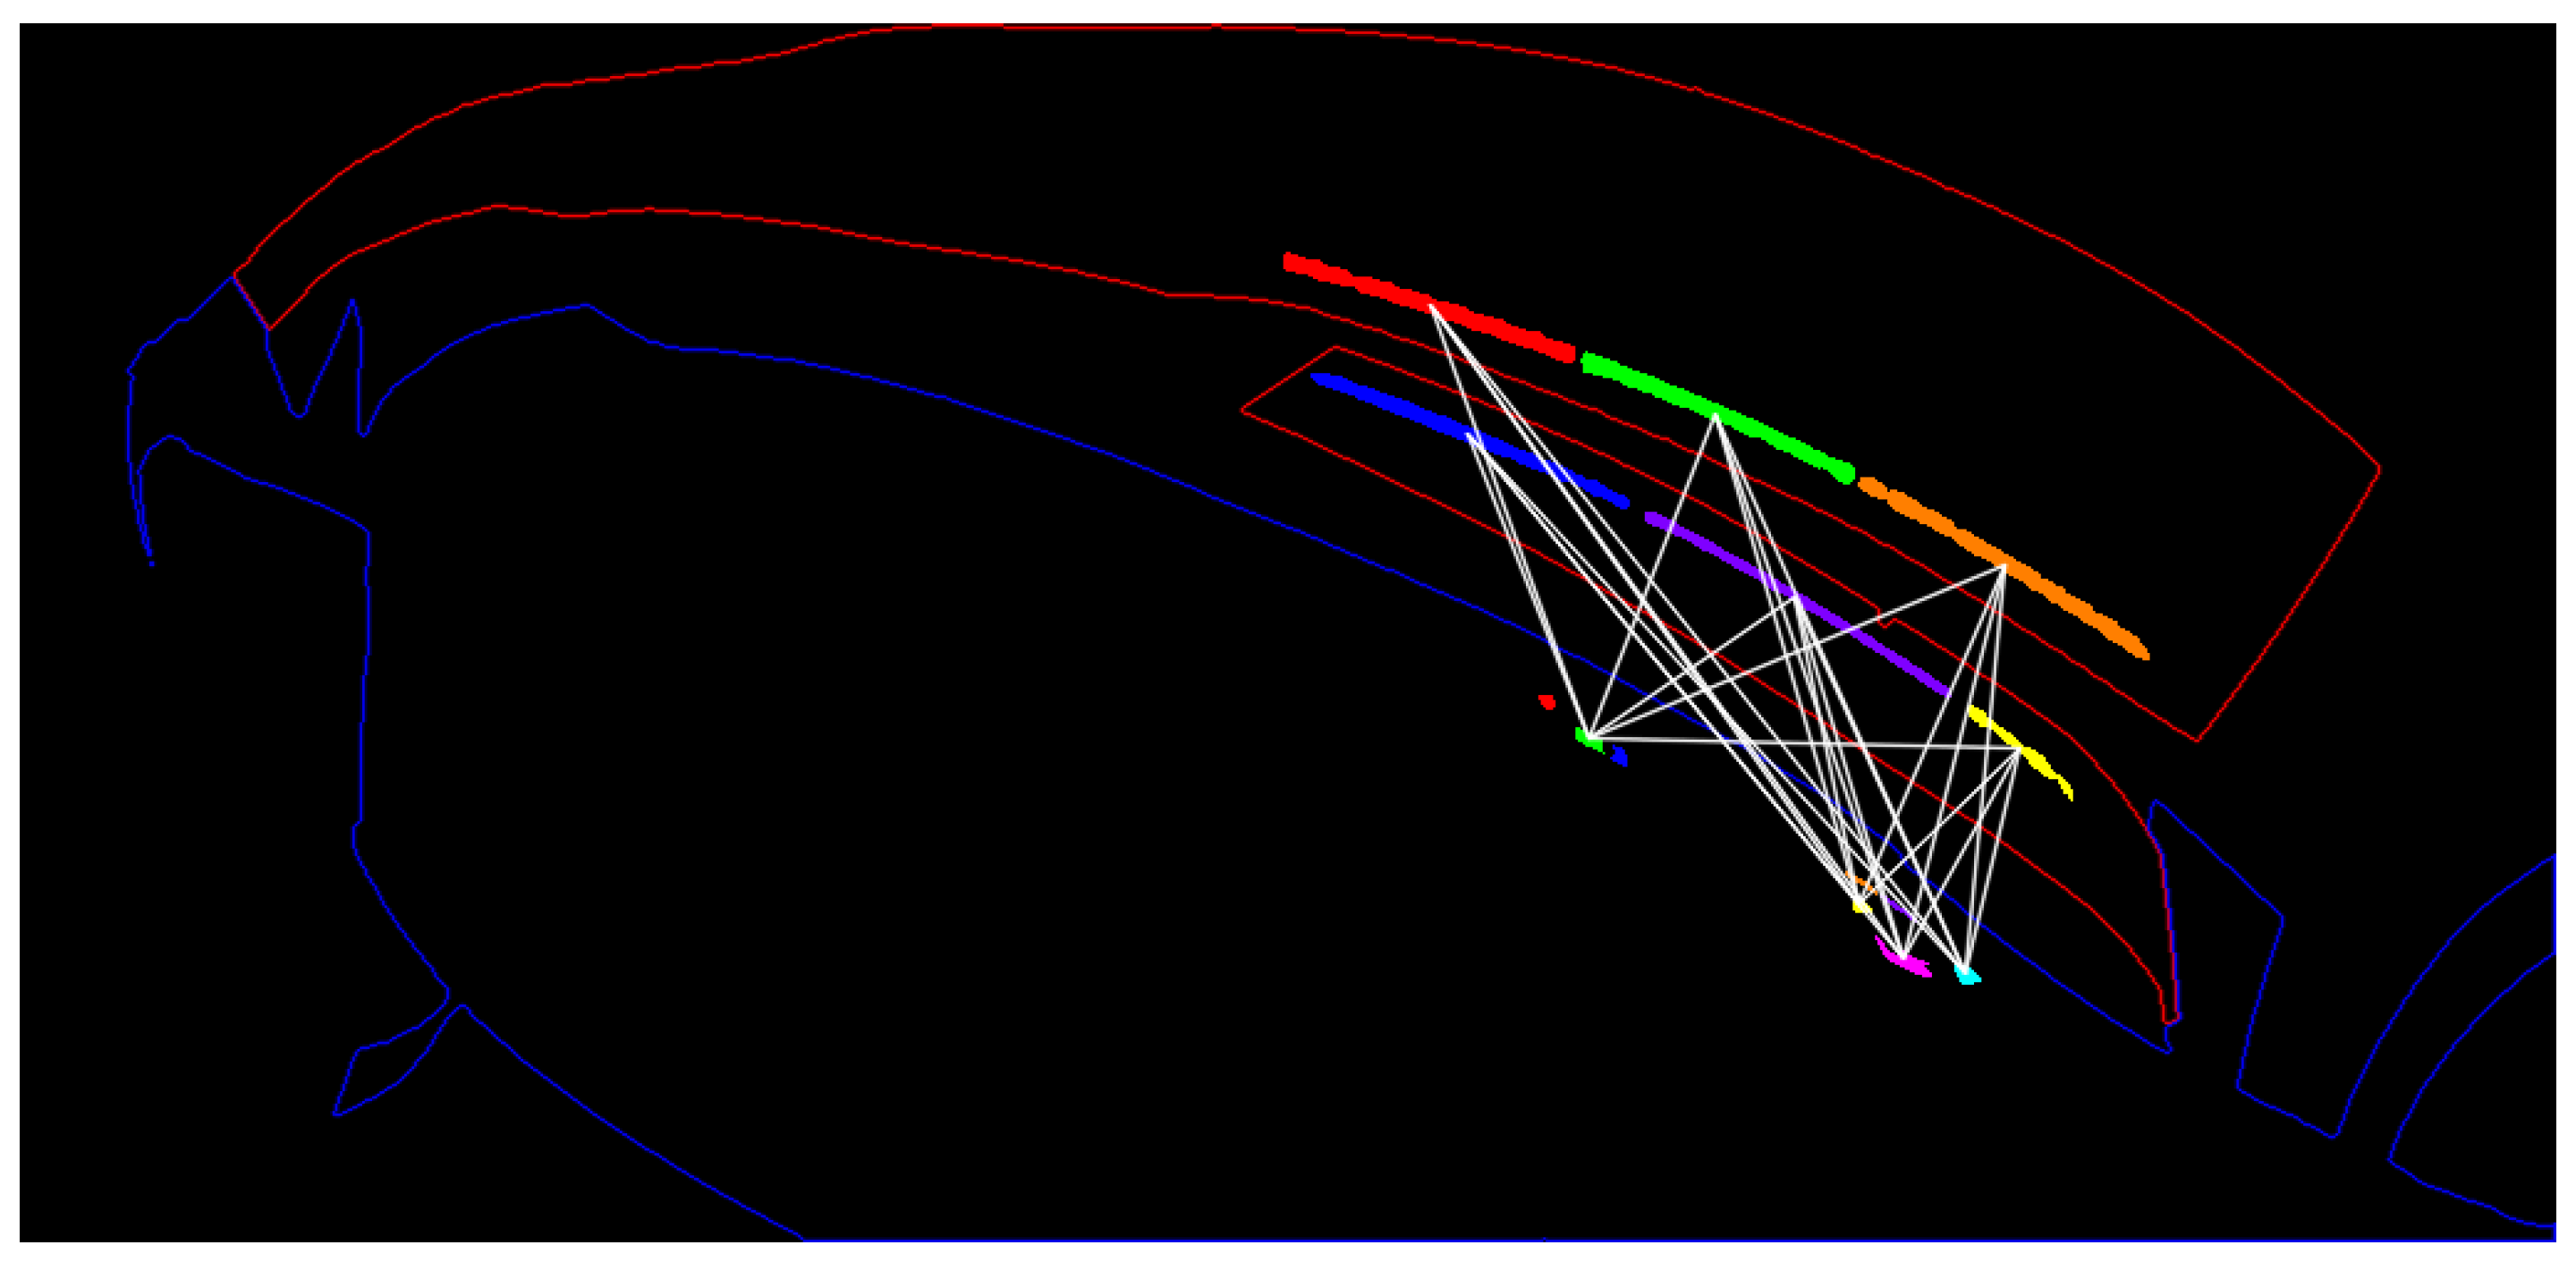
Energies 15 02088 g009
Figure 10. Detected reflections between the divertors (upper components with red outline) and the wall heat shields (lower components with blue outline) at timestamp 2017.11.14 16:39:49.696,637,440 UTC. The highly correlated blobs are connected by lines.
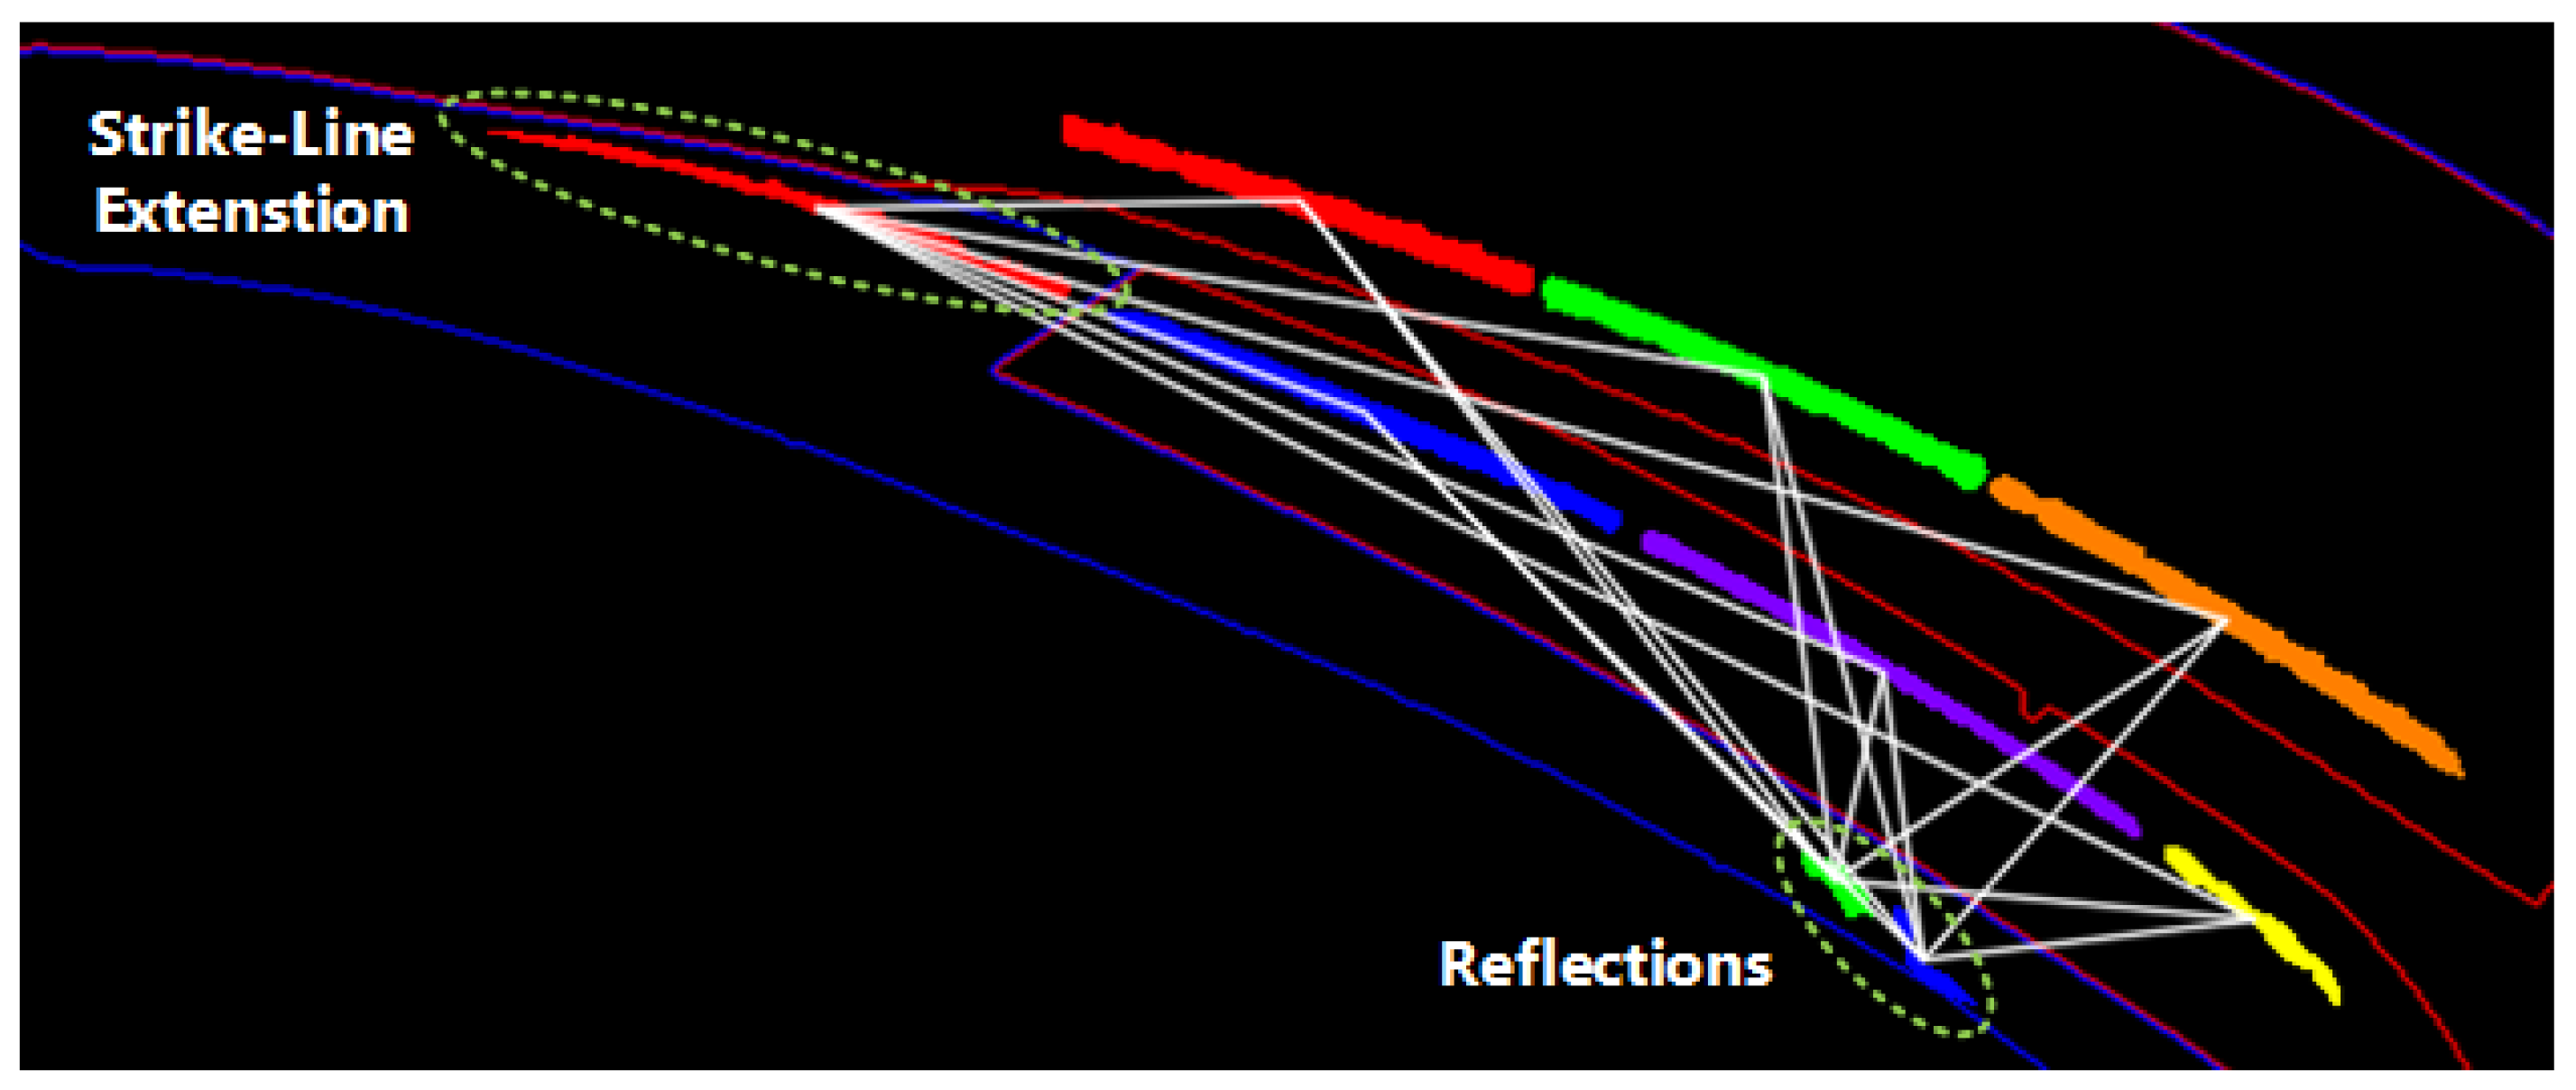
Energies 15 02088 g010
Figure 11. Detected reflections between the divertors and the vertical baffle at timestamp 2017.11.14 16:39:49.696,637,440 UTC.
Energies 15 02088 g011
Figure 12. Normalised Cross Correlations (NCC) on a Sliding Time Window (SWNCC) evolution between blob R on the wall heat shields and blobs A–F on the divertors.
Energies 15 02088 g012
Figure 13. (a) Source calibrated frame normalised to 8-bits for display purposes. (b) Processed frame in the range 100 °C–700 °C.
Energies 15 02088 g013
Figure 14. Visualisation algorithm pipeline. The algorithm returns a coloured image with improved visibility of heat loads on the PFCs. Each step is annotated as to whether a GPU or GPU is used for computations.
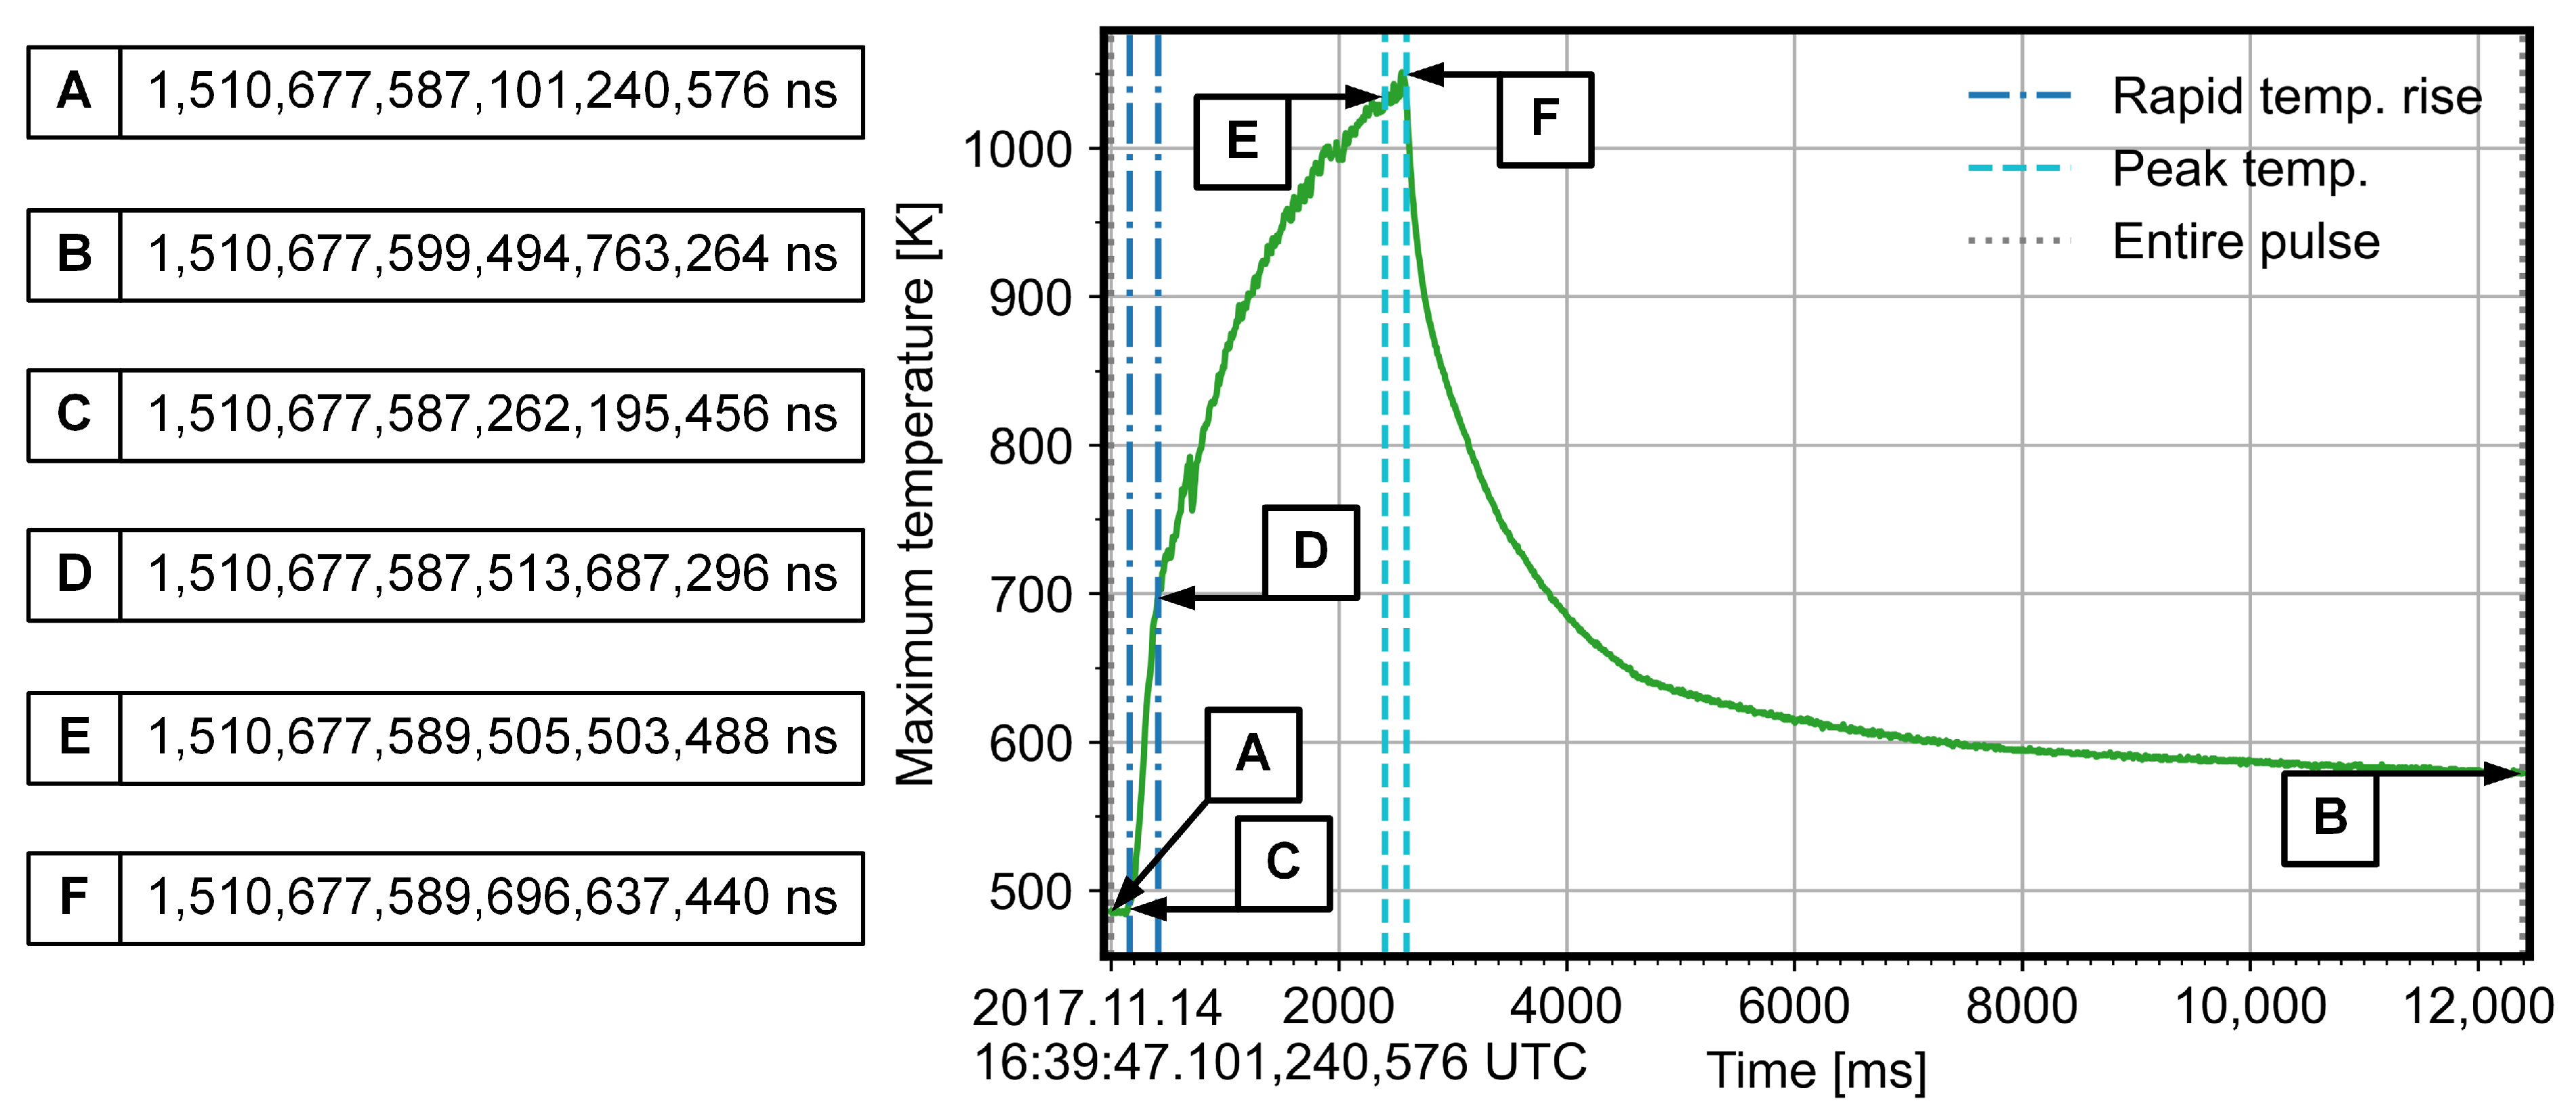
Energies 15 02088 g014
Figure 15. Evolution of the maximum temperature throughout the pulse 20171114.053 (AEF20) with the signified intervals. The temperature was sampled inside the Field of View (FoV) after applying a 3 × 3 median filter that refers to steps one to three in the visualisation algorithm.
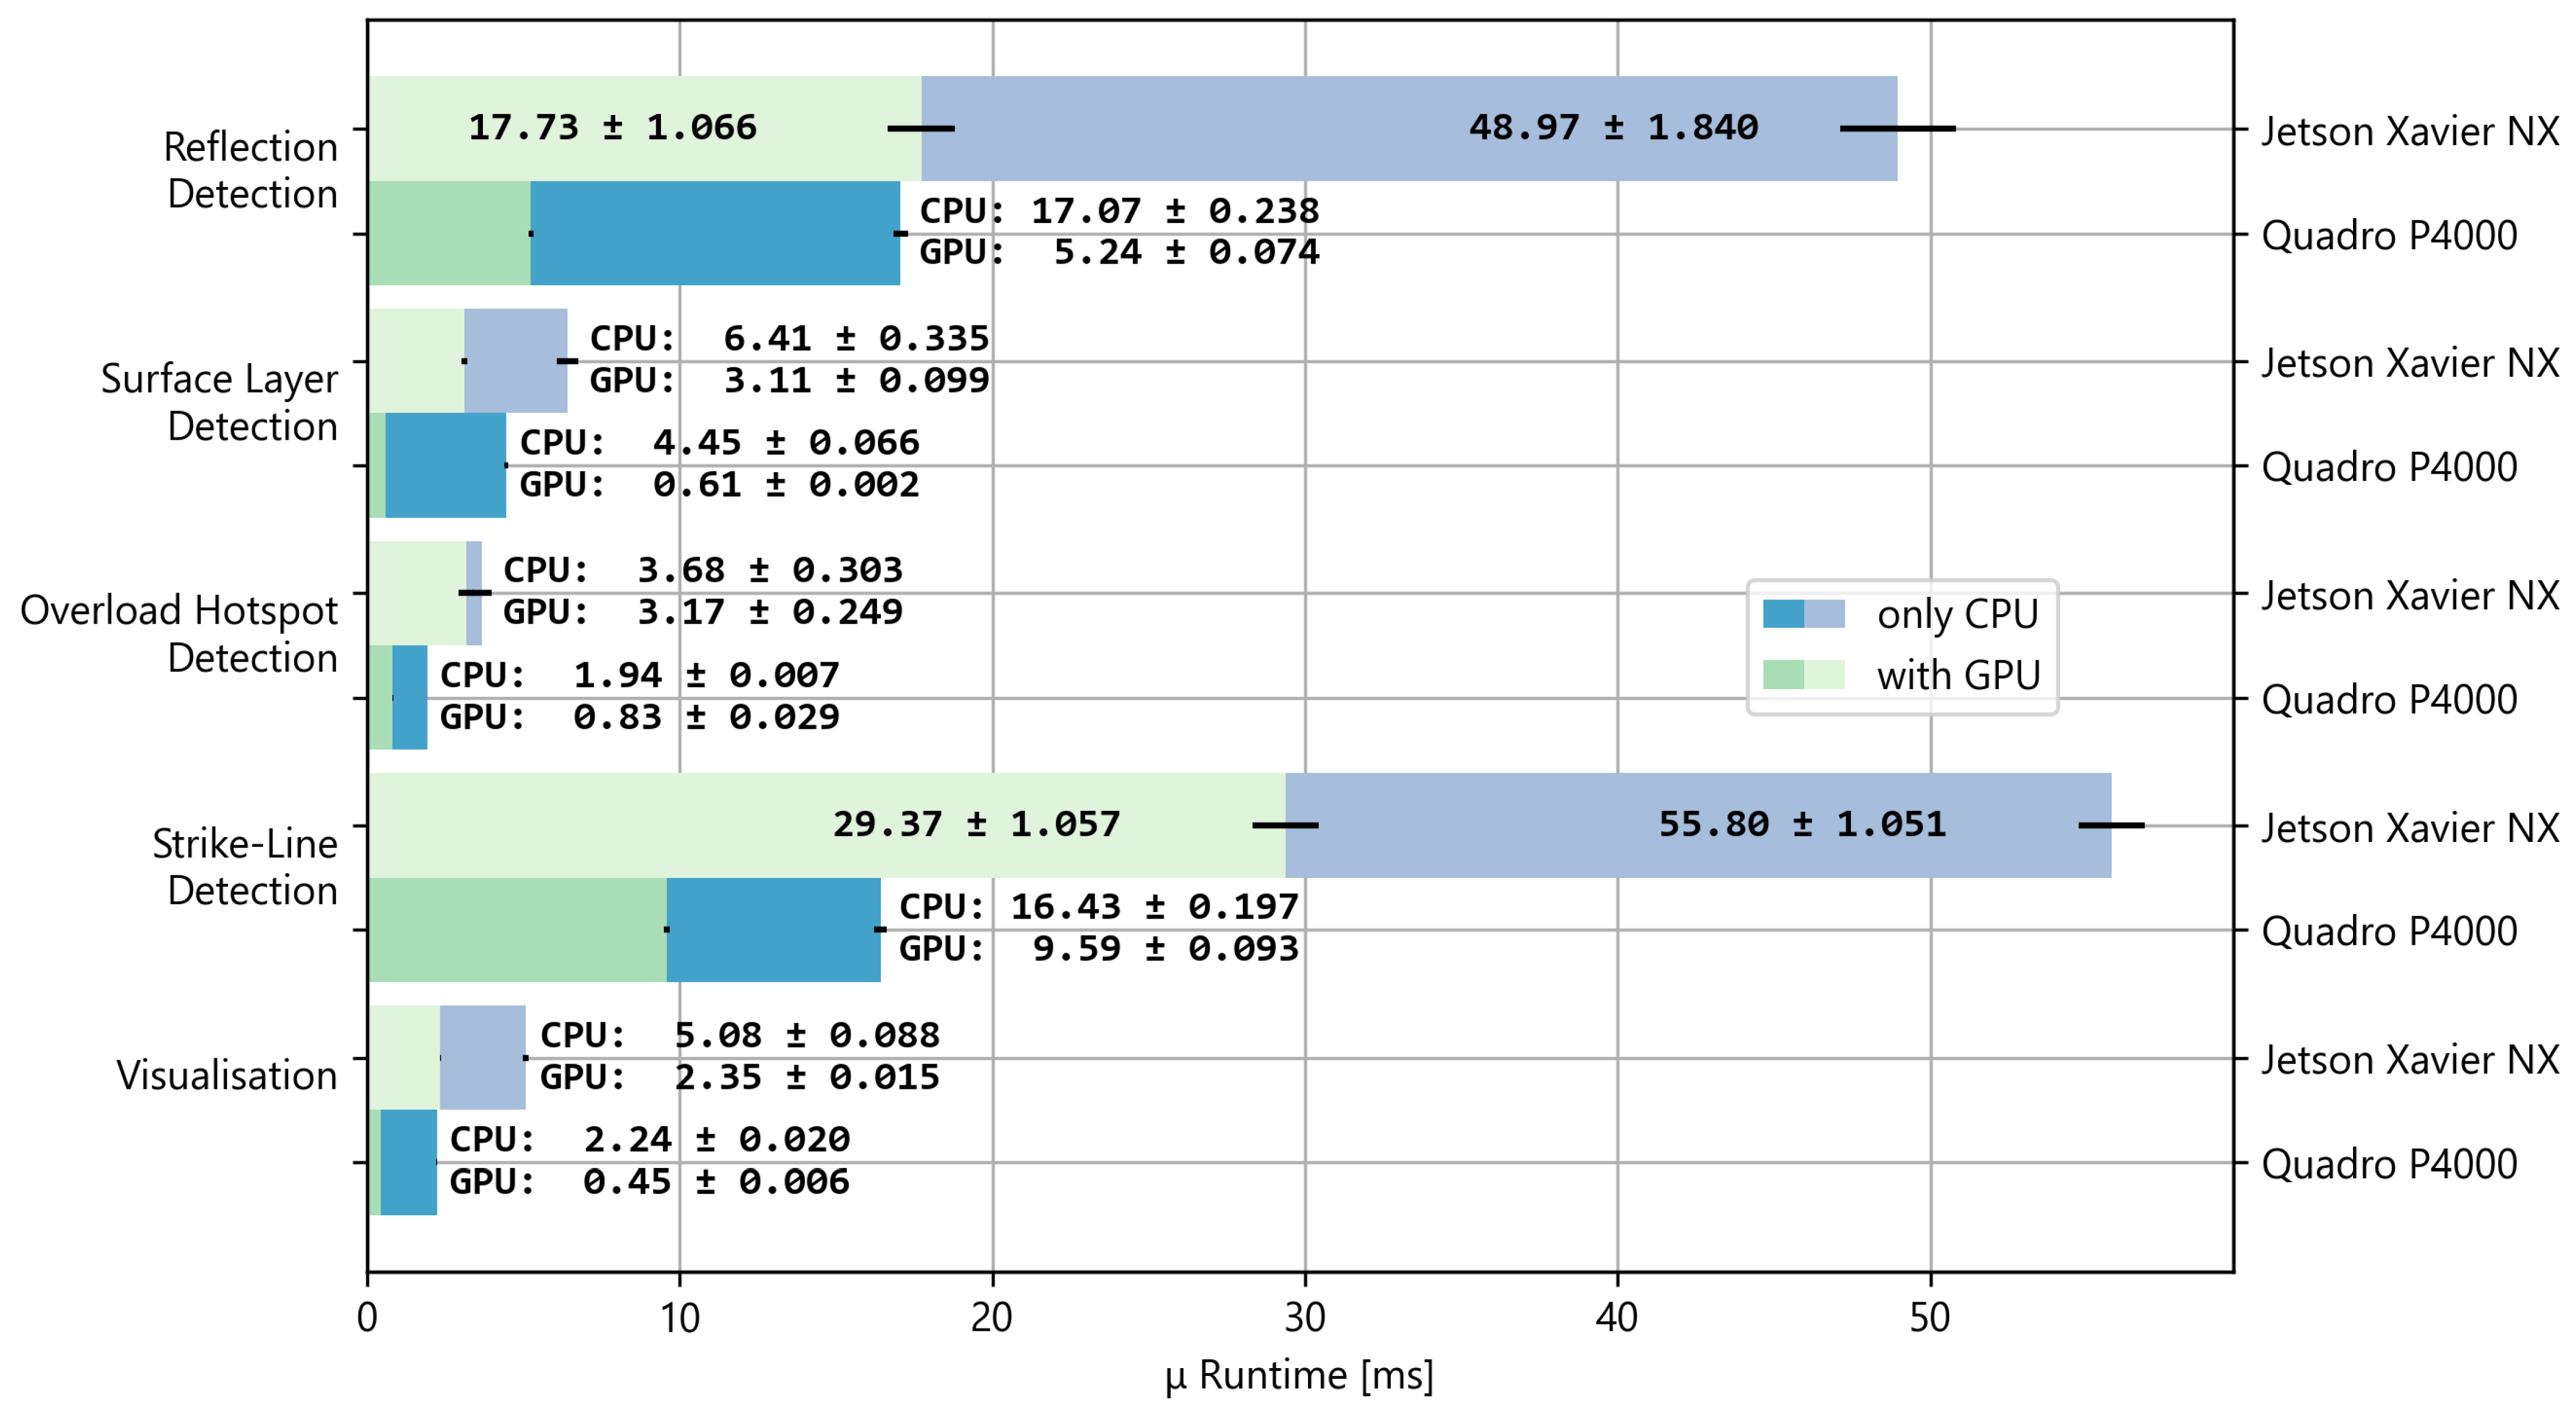
Energies 15 02088 g015
Figure 16. Average runtime measurements for the implemented Infrared (IR) image-processing algorithms. Black horizontal lines represent a standard deviation of an average runtime.
Energies 15 02088 g016
Figure 17. (a) Our results; (b) Results from the literature optimised for F2-score; (c) Ground-truth masks. Images from the 20171114.053 (AEF20) dataset are in the top row, images from the 20180927.025 (AEF20) dataset are in the bottom row. White (1’s) pixels correspond to positive and black (0’s) to negative segmentation labels.
Energies 15 02088 g017
Table 1. NVIDIA Jetson Xavier NX technical specification.
FeatureDescription
GPU384-core Volta @ 1.1 GHz (memory shared with RAM)
CPU6-core NVIDIA Carmel ARM v8.2 @ 2 × 1.9 GHz | 6 × 1.4 GHz (NVPModel)
RAM8 GB 128-bit LPDDR4x @ 1600 MHz | 51.2 GB/s
PCIeGen 4
PowerUp to 15 W
Table 2. NVIDIA Jetson Xavier NX maximum performance CPU modes.
NVPModel IDOnline CoresCore Frequency [MHZ]
021900
261400
Table 3. Technical specification of the benchmark setup based on the NVIDIA Quadro P4000.
FeatureDescription
GPU1792-core Pascal Quadro P4000 8 GB GDDR5 @ 1.7GHz
CPU4-core Intel Core i7-4771 @ 3.50 GHz
RAM2 × 4 GB 64-bit DDR3 @ 1333 MHz
PCIeGen 3
Power105 W (GPU) + 84 W (CPU)
Table 4. Performance of the sequential and parallel strike-line segmentation algorithms for different power modes and GPU/CPU implementations on the NVIDIA Jetson Xavier NX.
GPU [ms]CPU [ms]
ImplementationNVPModel 0NVPModel 2NVPModel 0NVPModel 2
μ σ μ σ μ σ μ σ
Sequential29.371.05736.820.87855.801.05171.810.968
Parallel41.342.52633.121.45860.261.47360.731.515
Table 5. Performance of the top-hat morphological filter for an 8-bit image of a resolution of 1024 ×768 and a structuring element of size of 13 × 13 on the NVIDIA Jetson Xavier NX.
ImplementationDevice μ [ms] σ [ms]
OpenCVGPU10.480.065
NPPGPU10.110.063
vHGW (CUDA kernel)GPU1.330.057
OpenCVCPU3.600.993
Table 6. F-score metrics for the result computed with the implemented algorithm and the result from the literature.
Discharge F 1 F 2
Our implementation
20171114.053 (AEF20)0.810.83
20180927.025 (AEF20)0.560.52
R. Clemente [7]
20171114.053 (AEF20)0.760.75
20180927.025 (AEF20)0.480.67
Publisher’s Note: MDPI stays neutral with regard to jurisdictional claims in published maps and institutional affiliations.

