
EGR and Emulsified Fuel Combination Effects on the Combustion, Performance, and NOx Emissions in Marine Diesel Engines

1
Interdisciplinary Graduate School of Engineering Sciences, Kyushu University, Fukuoka 816-8580, Japan
2
Faculty of Engineering, Kafrelsheikh University, Kafrelsheikh 33511, Egypt
*
Authors to whom correspondence should be addressed.
Energies 2023, 16(1), 336; https://doi.org/10.3390/en16010336
Submission received: 11 December 2022
/
Revised: 22 December 2022
/
Accepted: 23 December 2022
/
Published: 28 December 2022
(This article belongs to the Special Issue Computational and Data-Driven Modeling of Combustion in Reciprocating Engines or Gas Turbines)
Abstract
:Techniques such as exhaust gas recirculation (EGR) and water-in-fuel emulsions (WFEs) can significantly decrease NOx emissions in diesel engines. As a disadvantage of adopting EGR, the afterburning period lengthens owing to a shortage of oxygen, lowering thermal efficiency. Meanwhile, WFEs can slightly reduce NOx emissions and reduce the afterburning phase without severely compromising thermal efficiency. Therefore, the EGR–WFE combination was modeled utilizing the KIVA-3V code along with GT power and experimental results. The findings indicated that combining EGR with WFEs is an efficient technique to reduce afterburning and enhance thermal efficiency. Under the EGR state, the NO product was evenly lowered. In the WFE, a considerable NO amount was created near the front edge of the combustion flame. Additionally, squish flow from the piston’s up–down movement improved fuel–air mixing, and NO production was increased as a result, particularly at high injection pressure. Using WFEs with EGR at a low oxygen concentration significantly reduced NO emissions while increasing thermal efficiency. For instance, using 16% of the oxygen concentration and a 40% water emulsion, a 94% drop in NO and a 4% improvement in the Indicated Mean Effective Pressure were obtained concurrently. This research proposes using the EGR–WFE combination to minimize NO emissions while maintaining thermal efficiency.
1. Introduction
Marine transportation, primarily driven by the diesel engine, represents 90% of the global trade sector [1]. Marine transportation consumes 300 million tons of oil annually [2] and contributes 2.89% of global emissions [3]. Those exhaust gas emissions negatively impact the global environment. The main components in exhaust gas emissions are nitrogen, water vapor and carbon dioxide, which are not toxic, apart from their impact on global warming [4,5]. In addition to those emissions, the combustion process results in relatively tiny amounts of other undesirable emissions: carbon monoxide, particulate matter, and NOx. The atmosphere contains various nitrogen oxides, including N2O, NO, NO2, NO3, N2O4, and N2O5 [6]. When discussing nitrogen oxides, the term “NOx” is commonly used to refer to nitrous oxide (N2O), nitrogen monoxide (NO), and nitrogen dioxide (NO2), all of which are considered “fresh” nitrogen oxides from a photochemical perspective as they enter the atmosphere in their specific gaseous states [7]. Combustion processes, which include the high temperatures required to create nitrogen oxides, produce these gases. Mainly, NOx emitted from diesel engines is “thermal NOx”, produced from direct reactions of nitrogen and oxygen in the high-temperature atmosphere [8]. Nearly all of the NOx produced by combustion processes is NO by 95%, with only a tiny portion being NO2 by 5% [6].
After being released to the ambient, NOx can react with organic matter releasing Ozone, leading to lung damage, and reducing lung function, especially for children and the elderly [6]. Meanwhile, respiratory exposure to nitrogen oxides for a long time may lead to asthma [9]. For those effects, the International Maritime Organization (IMO) strictly regulated the emissions as recommended in MARPOL Annex VI to reduce NOx emissions by 75% in Tier III [10,11]. Such an intensive emission reduction is almost impossible for ship engines without any technical measures. Therefore, some technologies have been implemented to decrease NOx formation in the last decade [12], including fuel additives [13], fuel blending [14], Double-Stage Turbocharging, Fuel Injection Strategy [15], Direct Water Injection (DWI), dual-fuel combustion strategy [16,17], Scavenging Air Moisturizing (SAM), Selective Catalytic Reduction (SCR) [18], nonthermal plasma (NTP) [19], Seawater Flue Gas Desulphurization (SWFGD) [20,21], exhaust gas recirculation (EGR) [22,23,24], and water-in-fuel emulsions (WFE) [25,26,27].
Exhaust gas recirculation (EGR) is a technique used to reduce nitrogen oxide (NOx) concentrations in internal combustion engines [28]. It recirculates a portion of the engine’s exhaust gas back to the combustion chamber, mixed with the incoming air and fuel mixture. This process lowers the amount of oxygen available for combustion, reducing the peak combustion temperatures that can lead to NOx formation. EGR can reduce NOx emissions by up to 90% [29] through three main mechanisms [30]: the thermal effect, which refers to the reduction in peak combustion temperature due to the presence of EGR [31]; the dilution effect, which refers to the dilution of the air–fuel mixture with exhaust gas, lowering oxygen concentration and combustion temperatures [32]; and the chemical effect, which refers to the reaction of EGR with NOx in the exhaust gas to form less harmful compounds such as nitrogen and water [32]. However, EGR can also increase the risk of knocking, prolong after-burning, and lead to higher levels of carbon monoxide, soot, unburned hydrocarbons, and particulate matter. Using water-in-fuel emulsions can increase brake thermal efficiency and reduce NOx emissions, but also increase CO emissions. Both EGR and water approaches have drawbacks, including low combustion rates and flame propagation. The specific conditions of the engine, including temperature history, boundary conditions, and operating characteristics, can also affect the combustion process and emissions production. Zhang et al. [33] studied a simulation of the properties of the in-cylinder soot on the oxidation performance in the EGR condition. The simulation concentrated on the oxidation-dominant phase reporting an increase in the in-cylinder soot oxidation rate. EGR slows soot oxidation by decreasing flame temperature and oxygen and OH concentrations throughout the combustion. Using a variety of biodiesels, Jaliliantabar et al. [34] examined the effects of pilot diesel timing and the EGR system on decreasing exhaust emissions. The study’s findings showed that the engine’s reaction to varying injection strategies and EGR applications was affected by the fuel’s different chemical and physical properties. Using the coffee methyl-ester reduced the combustion duration by 17.7% compared to diesel. EGR and pilot injection (up to 86% and 29.3%, respectively) reduced NOx emission, but the combustion quality was altered due to changes in the combustion efficiency.
Mukhtar et al. [35] used an emulsified fuel with different biodiesel and ethanol percentages as a fuel for a single-cylinder diesel engine. The results revealed that the in-cylinder pressure and the heat released rate for the test fuel exceeded the pure diesel’s values. Because of evaporation, the HRR profile showed a negative value in the ignition delay phase. The study’s most important finding is that the load shortening of the test fuel ignition delay period exhibited proof of the micro-explosion phenomena happening without load, peak HRR, or combustion pressure. Park and Oh [36] studied flame visualization, fundamental combustion characteristics, and emissions of the emulsion fuel. Emulsion fuel reduced nitrogen oxide emissions by 19.6% and smoke by 66.3%, respectively. The emulsion fuel showed higher in-cylinder pressure and heat release rate than the diesel fuel. Additionally, the combustion duration was shorter by 12.3% than the pure diesel. Abdollahi et al. [37] studied the effect of the nano-emulsion biodiesel fuel on the combustion and emission characteristics of the single-cylinder diesel engine. The results indicate that nano-emulsion fuel boosted diesel engine power and torque by 4.84% and 4.65% compared to diesel fuel. Emissions of CO, UHC, NOx and soot opacity were reduced by approximately 10% using nano-emulsion fuel. However, there was a 7% increase in CO2 emissions. Gad et al. [38] performed a comprehensive study on the influence of different blends of mandarin peel waste oil with diesel on the diesel engine. Then, the study was extended to predict the impact of enriching the blends with propanol considering EGR implementation. The results showed a decreased HHR, CO, HC, and smoke opacity, and the NOx emissions increased significantly.
Although some researchers studied WFEs and EGR, the detailed combustion process and NOx reduction mechanism in the WFE–EGR combination are still not well understood. As known, it is a competitive and challenging matter to calculate the NOx distribution or in-cylinder gas compositions versus crank angle by only analyzing measured data from experiments. Hence, A numerical calculation code was used to reveal the combustion mechanisms with the WFE–EGR combination. This paper is organized as follows: Early model calibration involved testing various EGR and WFE modes in an RCEM (Rapid Compression Expansion Machine) and obtaining shots, pressure measurements, and emissions data from in-cylinder combustion. Additionally, study two EGR system methods—Constant Air Suction (CAS) and Constant Oxygen Charge (COC)—utilizing a 1D GT power simulation model and next, initiating and verifying the KIVA-3V code against the experimental data and using the calibrated model to simulate the combustion process and NOx emissions. The novelty of this study was primarily demonstrated in two following aspects. Firstly, a simulation platform based on the KIVA-3V code was established and utilized to calibrate the EGR and WFEs with a newly developed code to simulate the emulsified fuel. Secondly, the produced code was utilized to investigate a variety of EGR–WFE combinations and their impacts on in-cylinder combustion and NOx emissions. The objectives of this study are to (a) reveal combustion processes and NOx reduction mechanisms under the WFE/EGR conditions; (b) calculate the emulsified fuel concentration to shorten the afterburning duration in the EGR method; (C) and determine the effect of injection timing, pressure, and nozzle diameter on the WFE examined. From these techniques, the WFE is expected to solve the problem of afterburning and improve thermal efficiency with a high NOx reduction ratio.
2. Materials and Methods
In this study, the combination of the EGR and water-in-fuel emulsion (WFE) techniques has been studied with a constant total heat release. This study starts with an experimental investigation of the EGR and WFEs and their combinations then this study was extended to cover a wide range of percentage combinations using the KIVA-3V code. The EGR cases were performed experimentally using three oxygen concentrations (21%, 18.3%, and 16.3%) by diluting the intake air with pure nitrogen at a constant injection pressure rating of 150 MPa, as shown in Table 1.
This research work considered an engine outline to calculate the amount of inert gas and oxygen in the intake, exhaust, and recirculated exhaust gases. Figure 1 illustrates the mass balance of the intake and exhaust of a non-EGR supercharged diesel engine operating with an air intake mass flow rate of 100 units. To make this methodology feasible, some assumptions were considered. (1) The mass oxygen concentration in the air is assumed to be 20%, and the other is considered inert gas with 80%. (2) The mass increase due to fuel is ignored. (3) The combustion is assumed to be complete, and the generated H2O and CO2 were added to the inert gas, ignoring the mass of C and H. (4) The mass oxygen concentration after complete combustion is assumed to be 10%, neglecting the effect of load. It is worth highlighting that the numerator represents the amount of inert gas, and the denominator represents the amount of oxygen. However, it does not mean that it is a fraction.
- Constant Air Suction: CAS
The engine intake in CAS is kept the same as in the non-EGR case. Additionally, the mass ratio between the inert gases and the oxygen in the recirculated exhaust gas is as same as in the non-EGR case. The increased coefficient of flow passing through the engine is set to α. The CAS mass balance and two examples of α (1.25 and 1.5) are shown in Figure 2. When the increase coefficient (α) equals 1.25, the mass balance shows that 25% of EGR is required to reach 18% oxygen concentration in the intake air. While the calculations show that to reach an oxygen concentration of 16.7% with α equals 1.5, a 50% EGR should be ensured.
- Constant Oxygen Charge (COC)
In this case, the intake air volume can be reduced until the oxygen mass in the air supply is equal to the oxygen mass in the air intake in the case of non-EGR. In the COC, the air intake can be reduced until it becomes equal to that of non-EGR, and this reduction factor is considered β. At the same time, the x and y could be calculated from Equations (1) and (2). Figure 3 shows the mass balance in the case of COC with two examples of reduction factor (β) 0.9 and 0.86. from the figure, when applying a reduction factor β = 0.9 and recirculating 20% of the exhaust gases, 18% of the oxygen concentration could be reached. The most valuable results were obtained when applying a reduction factor of 0.86, which allows using a low rate of EGR, reaching 28% to 16.7% of the oxygen concentration in the in-cylinder content.
In this section, the GT power environment was used to construct a 1D simulation model of a marine diesel engine [31]. Indicated thermal efficiency (ITE), brake-specific fuel consumption (BSFC), and a residual gas fraction (RGF) can all be reliably calculated using GT power [30]. Based on the configuration of the RCEM in the lab, a full 1D simulation model was constructed. The test RCEM’s 1D GT power simulation model is shown in Figure 4. The engine is modeled using GT power code, and the simulation results are compared to those from an actual engine test bench. Generally, the 1D GT power model depends heavily on geometry, regulation, and performance. The 1D simulation model, therefore, includes boundary conditions based on data, including the bore, stroke, compression ratio, valve diameter, valve lift, valve timing, and turbocharger maps [32] of the test engine. The results of a 1D GT power simulation are susceptible to boundary conditions, such as shape, regulation, and performance. Therefore, in this study, the software was fed geometry and design data from the construction charts and the RCEM sensors, including the test engine’s bore, stroke, compression ratio, and injection timing. This study applied the Shell Global Combustion Model (SGCOM), which is a detailed, multi-zone combustion model that can accurately predict combustion analytics, as well as performance and emissions, in both spark-ignition (SI) and compression-ignition (CI) engines.
Two cases of WFEs with 0, 25, and 40 v/v% of water presence were applied. The fuel is premixed with 0.1% glycerin, while the water is premixed with 0.9% pharmaceutically active ingredient (Sorbitan monolaurate) to stabilize the water dispersion [39]. As shown in Figure 5, the water-in-fuel emulsion was performed mechanically by adding the precious percentages of additives in each tank and mixing both mixtures mechanically. Moreover, a circular homogenizer was applied to instantaneously mix the fuel with the water before being supplied to the RCEM. In the last cases of the experimental study, four cases of EGR–WFE combinations were tested. When applying WFEs, as the total volume of emulsified fuel is larger than the gas oil, the injection period, injection pressure, or diameter of the nozzle hole have to be increased. All three cases were applied in this study, as shown in Table 2. The injection duration was extended from 25.4 to 33.3 or 37.4 °CA in Case 1. The injection pressure of 80 to 125 and 150 MPa in Case 2. The nozzle hole diameter is from 0.5 to 0.6 mm in Case 3. In Case 3, only injectors with 0.5 or 0.6 mm nozzle holes were available for the experiment.
Figure 6a shows the applied RCEM as an experimental apparatus in this study, while Figure 6b illustrates its schematic layout. The RCEM with specifications listed in Table 3 was designed to visualize the combustion process in medium or large-sized ship engines. The RCEM is speeded up to 350 rpm using an auxiliary (75 kW) electric motor. An inverter (Model FRENIC 5000P11 from Fuji Electric Co., Ltd., Tokyo, Japan) is mounted on the electric motor to regulate its speed. A preheating and pressurizing heat tank is connected to the RCEM to maintain constant initial conditions (temperature and pressure) inside the cylinder (within ± 0.1 bar ± 5 °C). A Kistler piezoelectric pressure sensor, Model 6061B, is used to measure the pressure inside the cylinder. The RCEM has two injectors mounted on the cylinder head. In this study, one of them is actuated. Both injectors incorporate electronic fuel injection, which allows for precise regulation of injection parameters such as pressure, timing, period, and duration via adjustments to the injectors’ medium working pressure and pulse width. The RCEM is attached to an exhaust gas analyzer model HORIBA MEXA-7100FX to measure the emission concentrations in the exhaust gases.
The high-speed camera with specifications listed in Table 4 was used for shooting the direct flame in the combustion chamber. Figure 7 shows the outline of the optics configuration. Parallel light beams are generated by passing the laser beam through a concave mirror before entering the combustion chamber. For this reason, the initial concave mirror was located about 3 m from the primary laser. A half mirror was placed between the first concave mirror and the combustion chamber so the high-speed camera could take direct photos of the reflected beams from the ongoing combustion inside the cylinder.
Despite the widespread use of optical experiments meant to improve experiment analysis, the data received directly from combustion pictures remain exceedingly scarce. Many scientists have used the two-color method (TCM) [40,41] on combustion pictures to get around this restriction. Combustion pictures may be used to determine flame temperature using the TCM. Processing the combustion images using the TCM can provide a local concentration value for the flame temperature, soot, and NOx emissions [40]. To measure flame temperature, this study uses two luminance temperatures at specific wavelengths emitted by soot particles in diesel flame. Because the analysis is performed at two distinct wavelength spots, it is known as the ‘TCM’. Figure 8a illustrates applying the TCM by analyzing the emitted light to the blue and red radiation. Figure 8b shows an example of producing the two-color method photos from the direct photos captured from the in-cylinder combustion using a high-speed camera Model FASTCAM SA4. The captured photos were analyzed based on the color of each pixel. The exposing condition in filming the flame was adjusted appropriately, considering the digital RGB values in the actual flame pictures. RGB values are 0–255, and they could occasionally reach their peaks if the selected condition is inappropriate. So, the exposing condition was decided so that the value obtained from the brightest point in the flame picture would be kept lower than 255. The temperature differences between soot particles and the surrounding combustion gas were considered to be minor. The temperature of soot particles is calculated from radiations from two different wavelengths as in Equation (3) which is a derivative form from Hottel-Broughton equation where is second radiation constant in Plank’s law, : constant (1.38 at visible light range), T is the absolute temperature of the soot particles, is the blue wavelength which was set to 450 nm. is the red color wavelength which was set to 620 nm.
3. The Numerical Study
In the simulation study, the simulation study was performed with four chosen cases in which the ratio of water to fuel was 0, 10, 25, and 40. In contrast, the initial oxygen concentration span was 16–21% with a unity step. This chosen span provided four intersection cases between the experimental and simulated study. KIVA is a 3D Computational Fluid Dynamics (3D-CFD) program created by Los Alamos National Laboratory. KIVA-3V is the third Fortran77-based version of KIVA which can calculate combustion processes in various engines and engine running parameters. Although KIVA is a helpful program for combustion calculations, combustion under WFE conditions cannot be estimated using the standard KIVA code because the emulsified fuel with WFEs is not considered. As a result, a novel model explaining emulsified fuel was established in this work. This is known as the fuel–water concentric spherical model. Figure 9 depicts emulsified fuel droplets as concentric spheres with two layers; the outer layer is the fuel that evaporates first. The water droplet in the inner layer evaporates when the fuel is entirely vaporized. The fuel–water concentric sphere model describes a heterogeneous combination of fuel and water and emulsified fuel evaporation. This model assumed two types of droplets (fuel and water/fuel) droplets as shown in Figure 9, and the ratio between the fuel and water/fuel droplets describes the water emulsion percentage.
KIVA uses the Blob Method that assumes fuel is injected as spheres whose diameter is the same as the nozzle hole of the fuel injector. The radius of the water sphere to the fuel–water concentric sphere is set to a constant, determined by users’ input data, and which fuel sphere or fuel–water concentric sphere is injected. The total water-to-fuel ratio in WFEs is adjusted by changing the injection frequency of fuel–water concentric spheres. The fuel–water concentric sphere model modified the break-up model used in KIVA-3V. The break-up model consists of two analysis models: the Kelvin-Helmholtz (KH model) [42] and the Rayleigh–Taylor break-up model (RT model) [43]. KH model is the primary break-up model in which fuel droplets break up due to unstable surface waves made by the aerodynamic forces, and new tiny droplets are formed. The wavelength of the unstable surface wave in the KH model is so small that the new droplets which split off the parent droplet are treated as the spheres of only fuel. RT model is the secondary break-up model in which the droplets break up due to the drag force made by the relative velocity between the droplet and air. In the modified evaporation model, if the amount of the vaporized fuel is larger than the amount of existing fuel in the droplet, the time step is divided into smaller ones not to break the mass balance of fuel. The subroutine program calculating evaporation was modified to implement this study’s evaporation process.
Validity Assessments of Numerical Analysis Calculation
This study used an RCEM to conduct the experimental tests for EGR, WFEs, and their combinations. The simulation was performed using KIVA-3V with the fuel–water concentric sphere model. The values of the constants in the analysis model were considered the same among all the calculation conditions. The initial conditions, such as the water–fuel ratio and initial oxygen concentration, were set to the same values as those in the experiments. The computational domain of RCEM in a KIVA-3V calculation is shown in Figure 10. The total number of the calculated cells is 76,000, and the minimum length of the cells in the combustion chamber is 5 mm. This study set the maximum time step in a calculation to 4 μs. The collision of droplets was not considered for the calculations.
Figure 11 compares the experimental and calculated values for NOx emissions. From the figure, the estimated NOx emissions for most cases are the same, with a marginal shift in the case of a 40% water emulsion. This agreement means that the applied KIVA-3V in this paper can accurately estimate the NOx emissions for the water emulsion. Meanwhile, Figure 12 compares the heat release rate for the experimental and calculated cases. The figure shows that the Heat Release rate profile for the calculations is compatible with the experiments’ cases with some slight error peaks at approximately 15 °CA which can not affect the significant profile. The figure indicates that the heat release rate decreased in all WFE cases after the injection. Using WFEs improved the afterburning period in both the experiments and calculations.
4. Uncertainty Analyses
Experimental test results are subject to some error and uncertainty. The precision of an experiment can be influenced by factors such as the observations, the design of the experiment, the testing equipment used, the experimental conditions, the calibration of the equipment, the environment, and the results obtained. An uncertainty analysis was conducted to verify the experimental results’ reliability and accuracy. A summary of the experimental errors and uncertainties is provided in Table 5. Analytical methods were used to foretell the random fluctuations in the measured values using Equation (4).
where is the uncertainty of the measured parameters; is the error in the independent variables.
5. Results and Discussion
Typically, diesel fuel, once injected into the engine cylinder, is self-ignited due to the high temperature and pressure of the ambient. Before the start of the combustion, the air entrained the spray body providing the oxidizing oxygen. On the surface of the diesel spray, the entrained air is quite intensive, leading to a lean mixture, while the core of the combustion is rich due to the minor air entrained in the spray body [44]. The air–fuel ratio variety over the spray body is the main reason for producing the soot and NOx. Several researchers have extensively studied and mapped this variation for local temperatures versus equivalence ratio [45]. Based on this map, the NOx and soot emissions highly depend on the local temperatures and the local equivalence ratio, roughly the start to be emitted at 2200 K at rich spots. Figure 13 illustrates the flame temperature distribution for the direct experimental photos analyzed by TCM. The temperature distributions in the combustion flame have some voids area because the TCM calculated the distribution based on the summation from back to front.
The figure shows that the gas oil’s high-temperature spots became less dense as the initial oxygen concentration decreased. For instance, 95% of pixels on the spray body in the case of no EGR (21% O2) recorded more than 2200 K, while 65% of the spray body reached this extent at 18.3% O2, and only 8% of the spray combustion temperature recorded more than 2200 k at 16.3% O2 case. Additionally, the same effect can be noticed in the water emulsion cases, which is evident when comparing the (WFE25 with 21% O2) case with the other cases. The number of pixels recording 2200 K decreased from 95% to 74% and 6% in the case of the gas oil, WFE25 with 21% O2, and (WFE25 with 21% O2), respectively. The superpositioning (combining the EGR and WFE) leads to a significant reduction in the flame temperature, recording 3% of the pixels exceeding 2200 K in the case of WFE25 with 18.3% O2, while in the other three cases, the local temperatures were decreased below 2100 K. When applying EGR, the amount of carbon dioxide and water molecules increased [46]. As carbon dioxide and water vapor heat are higher than the air, they absorb more heat from the flame, decreasing the combustion temperature. Additionally, introducing the inert gases (carbon dioxide and water vapor) decreases the interaction between the spray surface and the oxidizer (oxygen into the ambient), which leads to a slower oxidation reaction slowing flame speed [47]. On the other hand, the flame temperature is reduced with WFEs because the latent heat of additional water evaporation decreases the flame temperature and diminishes the high-temperature spots [36]. When combining both EGR and WFEs, the local spot temperatures of the flame show a reduction due to the intensive effect of the EGR on the flame speed and the high latent heat of the water.
Figure 14 shows the temperature and NO fraction distributions if the injection duration time changed in the WFE. The upper graph shows the flame temperature calculated by the TCM from the direct photographs of the combustion flame. The mid and lower graphs indicate the temperature and NO mass fraction distributions, which were imaged from the calculation results by the visualization software, Ensight 8.2. From the figure, it can be noticed that the temperatures in the calculations did not show a decrease as the water ratio increased, even though in the two-Color method, the flame temperature has been noticed to decrease drastically. The calculations showed that the temperature was high near the right-side wall of the combustion chamber as the combustion area extended, growing the burned gas at high temperatures. Although the flame temperature in the upper pictures seems lower in the EGR and WFE cases than the pure gas oil, the NO emissions were utterly different in both cases. The distributions of NO mass fraction that KIVA-3V calculates indicate that most NO was produced at the front edge of the combustion flame. At the same time, the amount of produced NO was reduced uniformly in the case of EGR. It was found from the KIVA-3V calculation results that there are significant differences in NOx reduction mechanisms between EGR and WFEs. The amount of NO product was reduced dramatically and uniformly with the EGR. Lower oxygen concentration in EGR conditions leads to lower flame temperature. It results in the synergetic effect of reducing the amount of NO formation because it depends on the temperature and concentration of nitrogen and oxygen, according to the Zeldovich mechanism [28]. Although the flame temperature in the WFE cases looks lower, it is found that the area where the temperature was high and the amount of NO product was large existed at the front edge of the combustion flame. The NO formation area was shifted to the front edge of the combustion flame as the water ratio increased in the WFE case.
Figure 15 shows the in-cylinder pressure profiles in the CAS and COC cases versus the crank angle. From the figure, the in-cylinder profile is highly affected by the EGR rate in the CAS case compared to the COC case. The charging pressure affects the maximum in-cylinder peak pressure. Additionally, introducing the EGR in the intake manifold can affect the in-cylinder combustion as the high content of carbon dioxide increases the heat capacity of the in-cylinder ambient, decreasing the flame speed and leading to lower combustion temperature. In the CAS case, the charging pressure increase leads to an impact on the combustion peak pressure. In contrast with the COC case, the increase in the charging pressure leads to a slight increase in the combustion peak pressure.
Figure 16 illustrates the heat release rate versus crank angle for EGR and WFE cases. Moreover, the heat release rate is calculated from the first low in thermodynamics for the single-zone combustion model [1]. The heat release at the late crank angle indicates afterburning, affecting thermal efficiency. The afterburning becomes longer as the oxygen concentration decreases when applying the EGR method. The low oxygen concentration slows the fuel-oxygen chemical reaction rate, leading to increased residual fuel till the late crank angle, at which the cylinder temperature is significantly cooled down. As a result, the heat release continued until the late crank angle. In contrast, the afterburning phenomenon is diminished when applying WFEs. WFEs improve fuel–air mixing due to the increased momentum of emulsified fuel by additional water mass. At the same time, WFEs have a secondary effect that can slightly reduce the contact area between the fuel and ambient, leading to decreased fuel–air mixing. Meanwhile, the dominant factor is momentum; thus, the most fuel was consumed effectively, and a few amounts of fuel remained after the injection. Zhao et al. [48] reported that EGR increased the combustion duration and the afterburning phase. Pan et al. [49] noticed an increase in the ignition delay and the HHR peaks when applying the EGR.
Figure 17 shows the NOx emissions concentrations in the exhaust gas for the different EGR–WFE combination cases based on the experimental results. Generally, applying the EGR decreased the NOx emissions from 642 to 182 and 62 ppm in the case of (18.3% and 16.3) oxygen concentration, respectively, recording reduction percentages of 71.7% and 90%. At the same time, applying WFEs with 25% and 40% leads to reducing NOx emissions from 642 to 630 ppm and 443 ppm with a 2% and 31% reduction rating. The decrease in the NOx emissions when applying emulsion could be referred to as the enhancement in the fuel spray momentum, which increases the fuel and air mixing, leading to better combustion. Additionally, the micro explosion of the water can enhance the fuel atomization as the water droplets in the diesel spray could reach the superheated condition before the diesel fuel. After the combustion starts, the heat releases, leading to the evaporation of any residual water. This evaporation heat decreases combustion temperature and NOx formation. In the EGR case, the reduction in the NOx formation results from the decreasing nitrogen molecules, which could interact with the oxygen in the ambient on the circumference of the diesel spray. When applying the water addition as emulsified fuel with the EgR, the NOx emissions decreased in the same trend. For instance, in the case of 16.3% oxygen content, the NOx emissions decreased by 91.7% and 93% when applying 25% and 40% of water content based on the pure diesel case. This reduction could be attributed to the decreased oxygen content in the cylinder, which decreases the possibility of nitrogen-oxygen interaction and the enhancement in the spry diesel momentum, in addition to the decrease in the flame temperature as the water absorbs the heat in the form of latent heat to evaporate. Pan et al. [49] reported that applying the EGR can decrease NOx emissions, especially in low and medium loads, and almost no effect at high loads.
Figure 18 illustrates the CO and HC emissions from the RCEM under different oxygen percentages in the RCEM. Generally, Carbon monoxide (CO) emissions are often the result of incomplete combustion, which can be caused by low cylinder temperatures and low oxygen concentrations that slow down local oxidation reactions. Unburned hydrocarbons (HC) can be emitted for several reasons [32]. One reason is that an unburned mixture in the cylinder can escape through the exhaust valve during the gas exchange process due to valve overlap. Another reason is that the unburned mixture can be compressed into crevices in the combustion chamber and released when the exhaust valves open [31]. A third reason is that the unburned mixture can be absorbed into the lubricating oil used to lubricate the piston and piston rings and released during the expansion stroke, especially during cold start conditions. Crevices in the combustion chamber can play a significant role in forming HC emissions. The CO and HC emissions increased with the increase in the EGR (decrease in the oxygen percentage) due to the decrease in the combustion velocity and the flame quenching in the crevices [32].
Figure 19 illustrates an estimated NO emission reduction percentage compared to the EGR–WFE gas oil combination. The preponderance portion of NOx released by diesel engines is “thermal NO”, which is generated by direct interactions of nitrogen and oxygen in a high-temperature environment [8]. As a result, this section calculates the NO emissions in the cylinder. When the oxygen content was less than 18%, the amount of NO product was lowered by more than 75% in all scenarios. The decrease in NO became more visible at each EGR level as the amount of the water emulsion increased, implying that the impact of NO reduction when using EGR was improved when coupled with WFEs. In the pressure scenario, when combined with WFE10, WFE25, and WFE40, the reduction in NO at 16% O2 was (91%, 91.6%, and 94%). Meanwhile, the Indicated Mean Effective Pressure (IMEP) was calculated in this study. In almost all cases, the IMEP decreased by more than 5%; this could be attributed to the longer injection period, which can result in a more dispersed fuel–air mixture in the combustion chamber, leading to a less efficient combustion process. A more dispersed mixture may not burn as effectively, resulting in a lower IMEP. In addition, a longer injection period can also result in a higher heat loss to the cylinder walls, which can also lower the IMEP [14]. The 5% IMEP reduction requires much-increased engine propulsion and fuel costs. As a result, using WFEs under 18.0% oxygen concentration is advantageous, especially in the pressure case. When the oxygen concentration was 16%, the additional water ratio was 40%, and the injection pressure increased, the amount of NO product lessened by 94%, with a 4% rise in the IMEP. This was the only scenario that fulfilled the NO reduction and the increased IMEP criteria. Wang et al. [50] reported that in some cases, when the EGR cooling temperature increases, the NOx and brake-specific fuel consumption increases.
6. Conclusions
EGR and WFE have long been regarded as effective methods for decreasing NOx emissions from diesel engines. Because of the low oxygen concentration in EGR, the duration of afterburning increases, lowering thermal efficiency. In the meantime, WFEs improves fuel–air mixing due to increased momentum from the additional water mass, resulting in better combustion and shorter afterburning. This research, experimental tests were performed to study the effect of EGR, WFEs, and their combinations on diesel combustion using an RCEM. Then, this study was extended to cover more comprehensive percentages in the EGR case implementing two EGR systems: Constant Air Suction (CAS) and Constant Oxygen Charge (COC) utilizing a 1D GT power simulation model. Meanwhile, a numerical KIVA-3V code was used to reveal the WFE–EGR combination combustion mechanisms. Lastly, the calibrated model simulated the combustion process and NOx emissions. The results are as follows:
- In the CAS, the EGR rate rapidly increases as the required oxygen concentration decreases, resulting in higher charging pressure.
- In COC, the decrease in intake volume at a high EGR rate alleviates the problem, and in EGR, the problem is the decrease in thermal efficiency at a high EGR.
- The EGR rate in the COC case is highly affected by the in-cylinder profile compared to the CAS case.
- The flame temperature in the no EGR case (21%O2) exceeded 2400 K while a few spots reached this extent at 17% O2 case, and almost no spots at that high limit were noticed at 15% O2 case.
- The KIVA-3V code calculation results reveal that the amount of NO product was reduced consistently over the whole combustion flame under the EGR condition.
- WFEs produce low NOx due to the drop in combustion temperature caused by the latent heat of water evaporation.
- In the case of an initial oxygen concentration of 16% and an extra water ratio of 40%, the calculation results revealed that the NO reduction reached 94%.
- The IMEP increased by 4%. If the WFE is combined with the EGR in the improved injection pressure configuration, it is possible to achieve a significant reduction in NO while retaining thermal efficiency.
Author Contributions
E.A., conceptualization, methodology, software, validation, formal analysis, investigation, resources, data curation, and writing—original draft preparation; H.T., conceptualization, methodology, software, validation, formal analysis, investigation, resources, data curation, writing—review and editing, supervision, and project administration. All authors have read and agreed to the published version of the manuscript.
Funding
This research received no external funding.
Data Availability Statement
Data are available upon request.
Conflicts of Interest
The authors declare no conflict of interest.
Abbreviations
| ATDC | After Top Dead Center |
| CAS | Constant Air Suction |
| COC | Constant Oxygen Charge |
| CCD | Charge-Coupled Device |
| EGR | Exhaust Gas Recirculation |
| IMEP | Indicate Mean Effective Pressure |
| IMO | International Maritime Organization |
| RCEM | Rapid Compression Expansion Machine |
| TCM | Two-Color Method |
| TDC | Top Dead Center |
| WFE10 | Water-in-Fuel Emulsion, 10% water, and 90% fuel, v/v%. |
| WFE25 | Water-in-Fuel Emulsion, 25% water, and 75% fuel, v/v%. |
| WFE40 | Water-in-Fuel Emulsion, 40% water, and 60% fuel, v/v%. |
Nomenclature
| Heat release rate based on crank angle, J/deg. | Specific heat ratio | ||
| Pressure-change per crank angle, MPa/deg. | Crank angle, degree | ||
| Volume-change rate per crank angle, m3/deg | V | Instantaneous in-cylinder volume, m3 | |
| Instantaneous in-cylinder pressure, MPa | Tb | The black body temperature, K | |
| Monochromatic radiance, W/(m2·μm) |
References
- Abdelhameed, E.; Tashima, H. Experimental investigation on methane inert gas dilution effect on marine gas diesel engine performance and emissions. Energy Sources, Part A Recover. Util. Environ. Eff. 2022, 44, 3584–3596. [Google Scholar] [CrossRef]
- Zincir, B.; Deniz, C.; Tunér, M. Investigation of environmental, operational and economic performance of methanol partially premixed combustion at slow speed operation of a marine engine. J. Clean. Prod. 2019, 235, 1006–1019. [Google Scholar] [CrossRef]
- Bilgili, L.; Celebi, U.B. Developing a new green ship approach for flue gas emission estimation of bulk carriers. Measurement 2018, 120, 121–127. [Google Scholar] [CrossRef]
- De Simio, L.; Iannaccone, S. Gaseous and particle emissions in low-temperature combustion diesel–HCNG dual-fuel operation with double pilot injection. Appl. Energy 2019, 253, 113602. [Google Scholar] [CrossRef]
- Cameretti, M.C.; De Robbio, R.; Mancaruso, E.; Palomba, M. CFD Study of Dual Fuel Combustion in a Research Diesel Engine Fueled by Hydrogen. Energies 2022, 15, 5521. [Google Scholar] [CrossRef]
- Talebizadeh, P.; Babaie, M.; Brown, R.; Rahimzadeh, H.; Ristovski, Z.; Arai, M. The role of non-thermal plasma technique in NOx treatment: A review. Renew. Sustain. Energy Rev. 2014, 40, 886–901. [Google Scholar] [CrossRef] [Green Version]
- Førby, N.; Thomsen, T.B.; Cordtz, R.F.; Bræstrup, F.; Schramm, J. Ignition and combustion study of premixed ammonia using GDI pilot injection in CI engine. Fuel 2023, 331, 125768. [Google Scholar] [CrossRef]
- Wang, Y.; Zhou, X.; Liu, L. Theoretical investigation of the combustion performance of ammonia/hydrogen mixtures on a marine diesel engine. Int. J. Hydrogen Energy 2021, 46, 14805–14812. [Google Scholar] [CrossRef]
- Hossain, A.K.; Refahtalab, P.; Omran, A.; Smith, D.I.; Davies, P.A. An experimental study on performance and emission characteristics of an IDI diesel engine operating with neat oil-diesel blend emulsion. Renew. Energy 2020, 146, 1041–1050. [Google Scholar] [CrossRef]
- Puškár, M.; Kopas, M.; Puškár, D.; Lumnitzer, J.; Faltinová, E. Method for reduction of the NOX emissions in marine auxiliary diesel engine using the fuel mixtures containing biodiesel using HCCI combustion. Mar. Pollut. Bull. 2018, 127, 752–760. [Google Scholar] [CrossRef]
- Theotokatos, G.; Stoumpos, S.; Bolbot, V.; Boulougouris, E. Simulation-based investigation of a marine dual-fuel engine. J. Mar. Eng. Technol. 2020, 19, 5–16. [Google Scholar] [CrossRef]
- Deng, J.; Wang, X.; Wei, Z.; Wang, L.; Wang, C.; Chen, Z. A review of NOx and SOx emission reduction technologies for marine diesel engines and the potential evaluation of liquefied natural gas fuelled vessels. Sci. Total. Environ. 2021, 766, 144319. [Google Scholar] [CrossRef] [PubMed]
- Jiaqiang, E.; Zhang, Z.; Chen, J.; Pham, M.; Zhao, X.; Peng, Q.; Zuo, W.; Yin, Z. Performance and emission evaluation of a marine diesel engine fueled by water biodiesel-diesel emulsion blends with a fuel additive of a cerium oxide nanoparticle. Energy Convers. Manag. 2018, 169, 194–205. [Google Scholar] [CrossRef]
- Kim, H.J.; Park, S.H.; Lee, C.S. Impact of fuel spray angles and injection timing on the combustion and emission characteristics of a high-speed diesel engine. Energy 2016, 107, 572–579. [Google Scholar] [CrossRef]
- Yoon, W.H.; Kim, J.Y.; Ha, J.S. Optimization of Fuel Injection Nozzles for the Reduction of NOx Emissions in Medium-speed Marine Diesel Engines (Diesel Engines, Performance and Emissions, NOx Strategies). Proc. Int. Symp. Diagn. Model. Combust. Intern. Combust. Engines 2004, 6, 81–86. [Google Scholar] [CrossRef]
- Hariharan, D.; Krishnan, S.R.; Srinivasan, K.K.; Sohail, A. Multiple injection strategies for reducing HC and CO emissions in diesel-methane dual-fuel low temperature combustion. Fuel 2021, 305, 121372. [Google Scholar] [CrossRef]
- Cameretti, M.C.; De Robbio, R. Raffaele Tuccillo Performance Improvement and Emission Control of a Dual Fuel Operated Diesel Engine. In Proceedings of the 13th International Conference on Engines & Vehicles, Capri Napoli, Italy, 10–14 September 2017; pp. 24–66. [Google Scholar]
- D’Aniello, F.; Arsie, I.; Pianese, C.; Stola, F. Development of an Integrated Control Strategy for engine and SCR system basedon effective EGR rate. IFAC-PapersOnLine 2020, 53, 14034–14039. [Google Scholar] [CrossRef]
- Kuwahara, T.; Yoshida, K.; Kuroki, T.; Hanamoto, K.; Sato, K.; Okubo, M. Pilot-Scale Aftertreatment Using Nonthermal Plasma Reduction of Adsorbed NOx in Marine Diesel-Engine Exhaust Gas. Plasma Chem. Plasma Process. 2014, 34, 65–81. [Google Scholar] [CrossRef]
- Yang, S.; Pan, X.; Han, Z.; Zhao, D.; Liu, B.; Zheng, D.; Yan, Z. Removal of NOx and SO2 from simulated ship emissions using wet scrubbing based on seawater electrolysis technology. Chem. Eng. J. 2018, 331, 8–15. [Google Scholar] [CrossRef]
- Zhou, J.; Ma, J.; Wang, Z. Experimental study on removal performance of SO2 and NOx in marine exhaust gas using seawater/urea peroxide solution and analysis of ions concentration change. Fuel Process. Technol. 2022, 227, 107133. [Google Scholar] [CrossRef]
- Wang, P.; Tang, X.; Shi, L.; Ni, X.; Hu, Z.; Deng, K. Experimental investigation of the influences of Miller cycle combined with EGR on performance, energy and exergy characteristics of a four-stroke marine regulated two-stage turbocharged diesel engine. Fuel 2021, 300, 120940. [Google Scholar] [CrossRef]
- Zhang, W.; Feng, T.; Li, Z.; Chen, Z.; Zhao, J. EGR thermal and chemical effects on combustion and emission of diesel/natural gas dual-fuel engine. Fuel 2021, 302, 121161. [Google Scholar] [CrossRef]
- Ni, P.; Wang, X.; Li, H. A review on regulations, current status, effects and reduction strategies of emissions for marine diesel engines. Fuel 2020, 279, 118477. [Google Scholar] [CrossRef]
- Yuan, X.; Ding, X.; Leng, L.; Li, H.; Shao, J.; Qian, Y.; Huang, H.; Chen, X.; Zeng, G. Applications of bio-oil-based emulsions in a DI diesel engine: The effects of bio-oil compositions on engine performance and emissions. Energy 2018, 154, 110–118. [Google Scholar] [CrossRef]
- Gopidesi, R.K.; Premkartikkumar, S.R. Evaluating the hythane/water diesel emulsion dual fuel diesel engine characteristics at various pilot diesel injection timings. Mater. Today Proc. 2021. [Google Scholar] [CrossRef]
- Aghbashlo, M.; Tabatabaei, M.; Khalife, E.; Najafi, B.; Mirsalim, S.M.; Gharehghani, A.; Mohammadi, P.; Dadak, A.; Shojaei, T.R.; Khounani, Z. A novel emulsion fuel containing aqueous nano cerium oxide additive in diesel–biodiesel blends to improve diesel engines performance and reduce exhaust emissions: Part II—Exergetic analysis. Fuel 2017, 205, 262–271. [Google Scholar] [CrossRef]
- Wang, Z.; Zhang, F.; Xia, Y.; Wang, D.; Xu, Y.; Du, G. Combustion phase of a diesel/natural gas dual fuel engine under various pilot diesel injection timings. Fuel 2021, 289, 119869. [Google Scholar] [CrossRef]
- Liu, X.; Wang, H.; Zheng, Z.; Yao, M. Numerical investigation on the combustion and emission characteristics of a heavy-duty natural gas-diesel dual-fuel engine. Fuel 2021, 300, 120998. [Google Scholar] [CrossRef]
- Wang, J.; Duan, X.; Wang, W.; Guan, J.; Li, Y.; Liu, J. Effects of the continuous variable valve lift system and Miller cycle strategy on the performance behavior of the lean-burn natural gas spark ignition engine. Fuel 2021, 297, 120762. [Google Scholar] [CrossRef]
- Wang, J.; Duan, X.; Liu, Y.; Wang, W.; Liu, J.; Lai, M.-C.; Li, Y.; Guo, G. Numerical investigation of water injection quantity and water injection timing on the thermodynamics, combustion and emissions in a hydrogen enriched lean-burn natural gas SI engine. Int. J. Hydrogen Energy 2020, 45, 17935–17952. [Google Scholar] [CrossRef]
- Duan, X.; Liu, Y.; Liu, J.; Lai, M.-C.; Jansons, M.; Guo, G.; Zhang, S.; Tang, Q. Experimental and numerical investigation of the effects of low-pressure, high-pressure and internal EGR configurations on the performance, combustion and emission characteristics in a hydrogen-enriched heavy-duty lean-burn natural gas SI engine. Energy Convers. Manag. 2019, 195, 1319–1333. [Google Scholar] [CrossRef]
- Zhang, W.; Song, C.; Lv, G.; Bi, F.; Qiao, Y.; Wang, L.; Zhang, X. Properties and oxidation of in-cylinder soot associated with exhaust gas recirculation (EGR) in diesel engines. Proc. Combust. Inst. 2021, 38, 1319–1326. [Google Scholar] [CrossRef]
- Jaliliantabar, F.; Ghobadian, B.; Carlucci, A.P.; Najafi, G.; Mamat, R.; Ficarella, A.; Strafella, L.; Santino, A.; De Domenico, S. A comprehensive study on the effect of pilot injection, EGR rate, IMEP and biodiesel characteristics on a CRDI diesel engine. Energy 2020, 194, 116860. [Google Scholar] [CrossRef]
- Mukhtar, M.; Hagos, F.Y.; Aziz, A.R.A.; Abdulah, A.A.; Karim, Z.A.A. Combustion characteristics of tri-fuel (diesel-ethanol-biodiesel) emulsion fuels in CI engine with micro-explosion phenomenon attributes. Fuel 2022, 312, 122933. [Google Scholar] [CrossRef]
- Park, J.; Oh, J. Study on the characteristics of performance, combustion, and emissions for a diesel water emulsion fuel on a combustion visualization engine and a commercial diesel engine. Fuel 2022, 311, 122520. [Google Scholar] [CrossRef]
- Abdollahi, M.; Ghobadian, B.; Najafi, G.; Hoseini, S.; Mofijur, M.; Mazlan, M. Impact of water–biodiesel–diesel nano-emulsion fuel on performance parameters and diesel engine emission. Fuel 2020, 280, 118576. [Google Scholar] [CrossRef]
- Gad, M.S.; He, Z.; El-Shafay, A.S.; El-Seesy, A.I. Combustion characteristics of a diesel engine running with Mandarin essential oil -diesel mixtures and propanol additive under different exhaust gas recirculation: Experimental investigation and numerical simulation. Case Stud. Therm. Eng. 2021, 26, 101100. [Google Scholar] [CrossRef]
- Mukhtar, M.N.A.; Hagos, F.Y.; Noor, M.M.; Mamat, R.; Abdullah, A.A.; Aziz, A.R.A. Tri-fuel emulsion with secondary atomization attributes for greener diesel engine—A critical review. Renew. Sustain. Energy Rev. 2019, 111, 490–506. [Google Scholar] [CrossRef]
- Choi, M.; Mohiuddin, K.; Kim, N.; Park, S. Investigation of the effects of EGR rate, injection strategy and nozzle specification on engine performances and emissions of a single cylinder heavy duty diesel engine using the two color method. Appl. Therm. Eng. 2021, 193, 117036. [Google Scholar] [CrossRef]
- Jeon, J.; Park, S. Effect of injection pressure on soot formation/oxidation characteristics using a two-color photometric method in a compression-ignition engine fueled with biodiesel blend (B20). Appl. Therm. Eng. 2018, 131, 284–294. [Google Scholar] [CrossRef]
- Kakoee, A.; Gharehghani, A. Comparative study of hydrogen addition effects on the natural-gas/diesel and natural-gas/dimethyl-ether reactivity controlled compression ignition mode of operation. Energy Convers. Manag. 2019, 196, 92–104. [Google Scholar] [CrossRef]
- Lu, Y.; Pan, J.; Fan, B.; Otchere, P.; Chen, W.; Cheng, B. Research on the application of aviation kerosene in a direct injection rotary engine-Part 1: Fundamental spray characteristics and optimized injection strategies. Energy Convers. Manag. 2019, 195, 519–532. [Google Scholar] [CrossRef]
- Aoyagi, T.; Abdelhameed, E.; Tsuru, D.; Tashima, H. Experimental and Numerical Considerations of Air Entrainment Process of Diesel Spray. Int. Conf. Liq. At. Spray Syst. 2021, 1. [Google Scholar] [CrossRef]
- Glassman, I.; Yetter, R.A. Diffusion Flames; Academic Press: Burlington, ON, Canada, 2008; pp. 311–377. [Google Scholar]
- Li, X.; Zhen, X.; Wang, Y.; Liu, D.; Tian, Z. The knock study of high compression ratio SI engine fueled with methanol in combination with different EGR rates. Fuel 2019, 257, 116098. [Google Scholar] [CrossRef]
- Verma, S.; Das, L.M.; Kaushik, S.C.; Bhatti, S.S. The effects of compression ratio and EGR on the performance and emission characteristics of diesel-biogas dual fuel engine. Appl. Therm. Eng. 2019, 150, 1090–1103. [Google Scholar] [CrossRef]
- Zhao, J.; Fu, R.; Wang, S.; Xu, H.; Yuan, Z. Fuel economy improvement of a turbocharged gasoline SI engine through combining cooled EGR and high compression ratio. Energy 2022, 239, 122353. [Google Scholar] [CrossRef]
- Pan, M.; Qian, W.; Zheng, Z.; Huang, R.; Zhou, X.; Huang, H.; Li, M. The potential of dimethyl carbonate (DMC) as an alternative fuel for compression ignition engines with different EGR rates. Fuel 2019, 257, 115920. [Google Scholar] [CrossRef]
- Wang, Z.; Zhou, S.; Feng, Y.; Zhu, Y. EGR modeling and fuzzy evaluation of Low-Speed Two-Stroke marine diesel engines. Sci. Total. Environ. 2020, 706, 135444. [Google Scholar] [CrossRef]
Figure 1.
The mass balance for a non-EGR supercharged diesel engine.
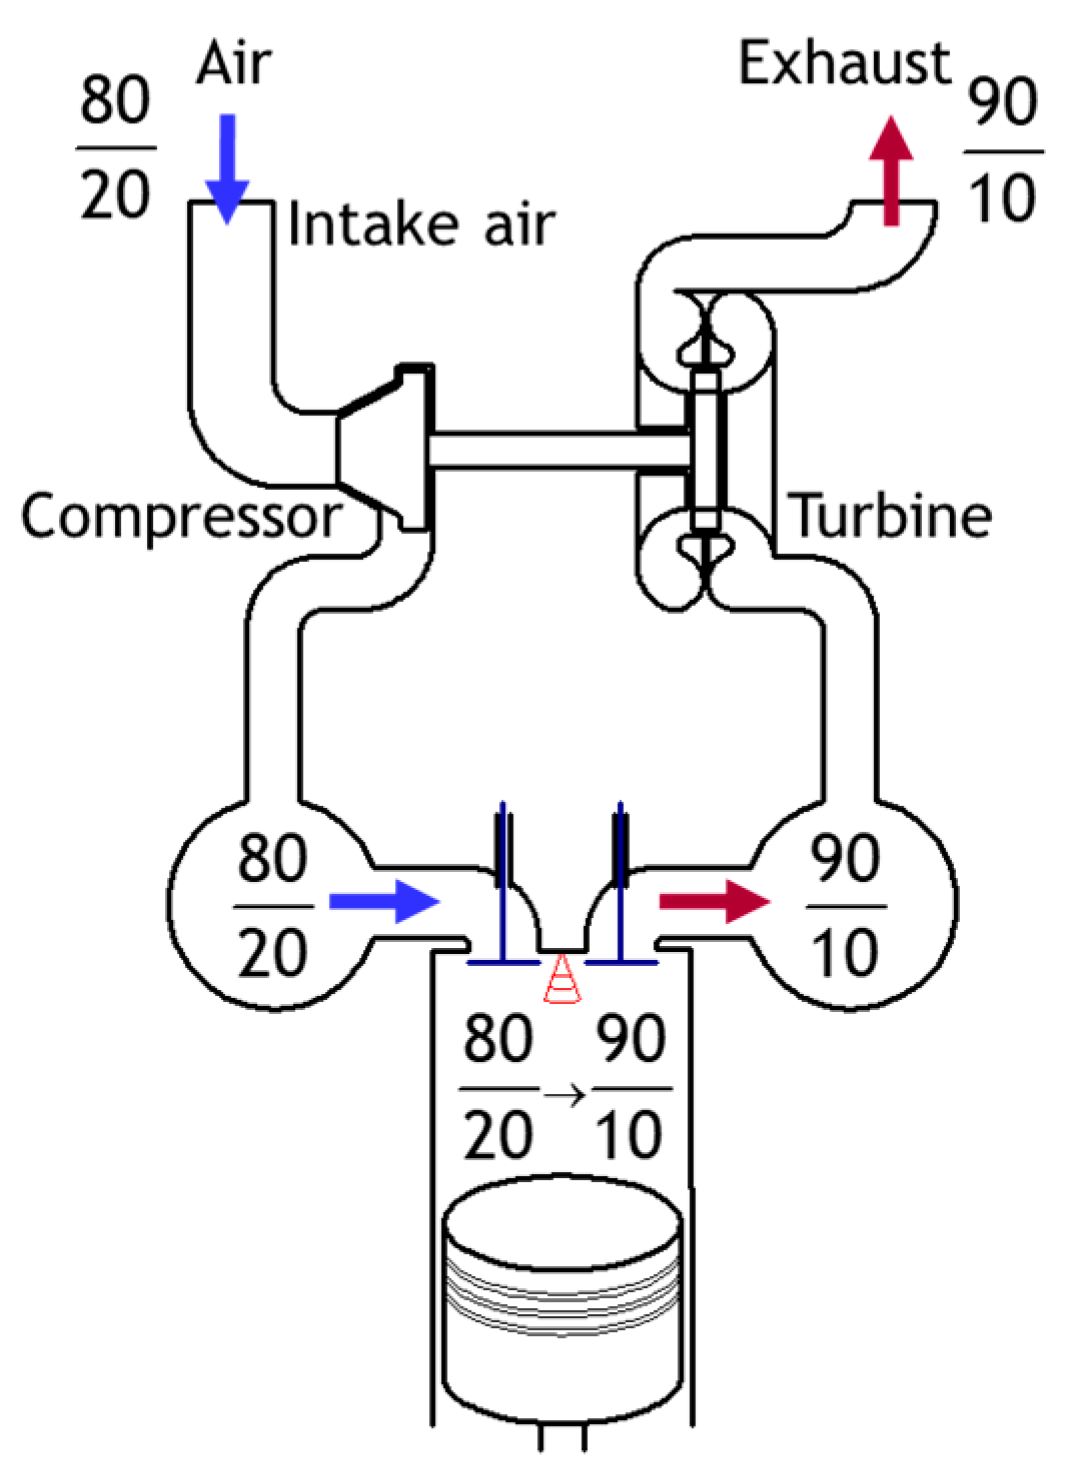
Figure 2.
Mass balance of a diesel engine with EGR in the CAS case.

Figure 3.
Mass balance of a diesel engine with EGR in the COC case.

Figure 4.
Diesel engine model simulated using G.T. Power (with and without EGR); The ‘EGR Blower*’ has not been applied in this model.
Figure 4.
Diesel engine model simulated using G.T. Power (with and without EGR); The ‘EGR Blower*’ has not been applied in this model.

Figure 5.
The instantaneous emulsion system before injection.
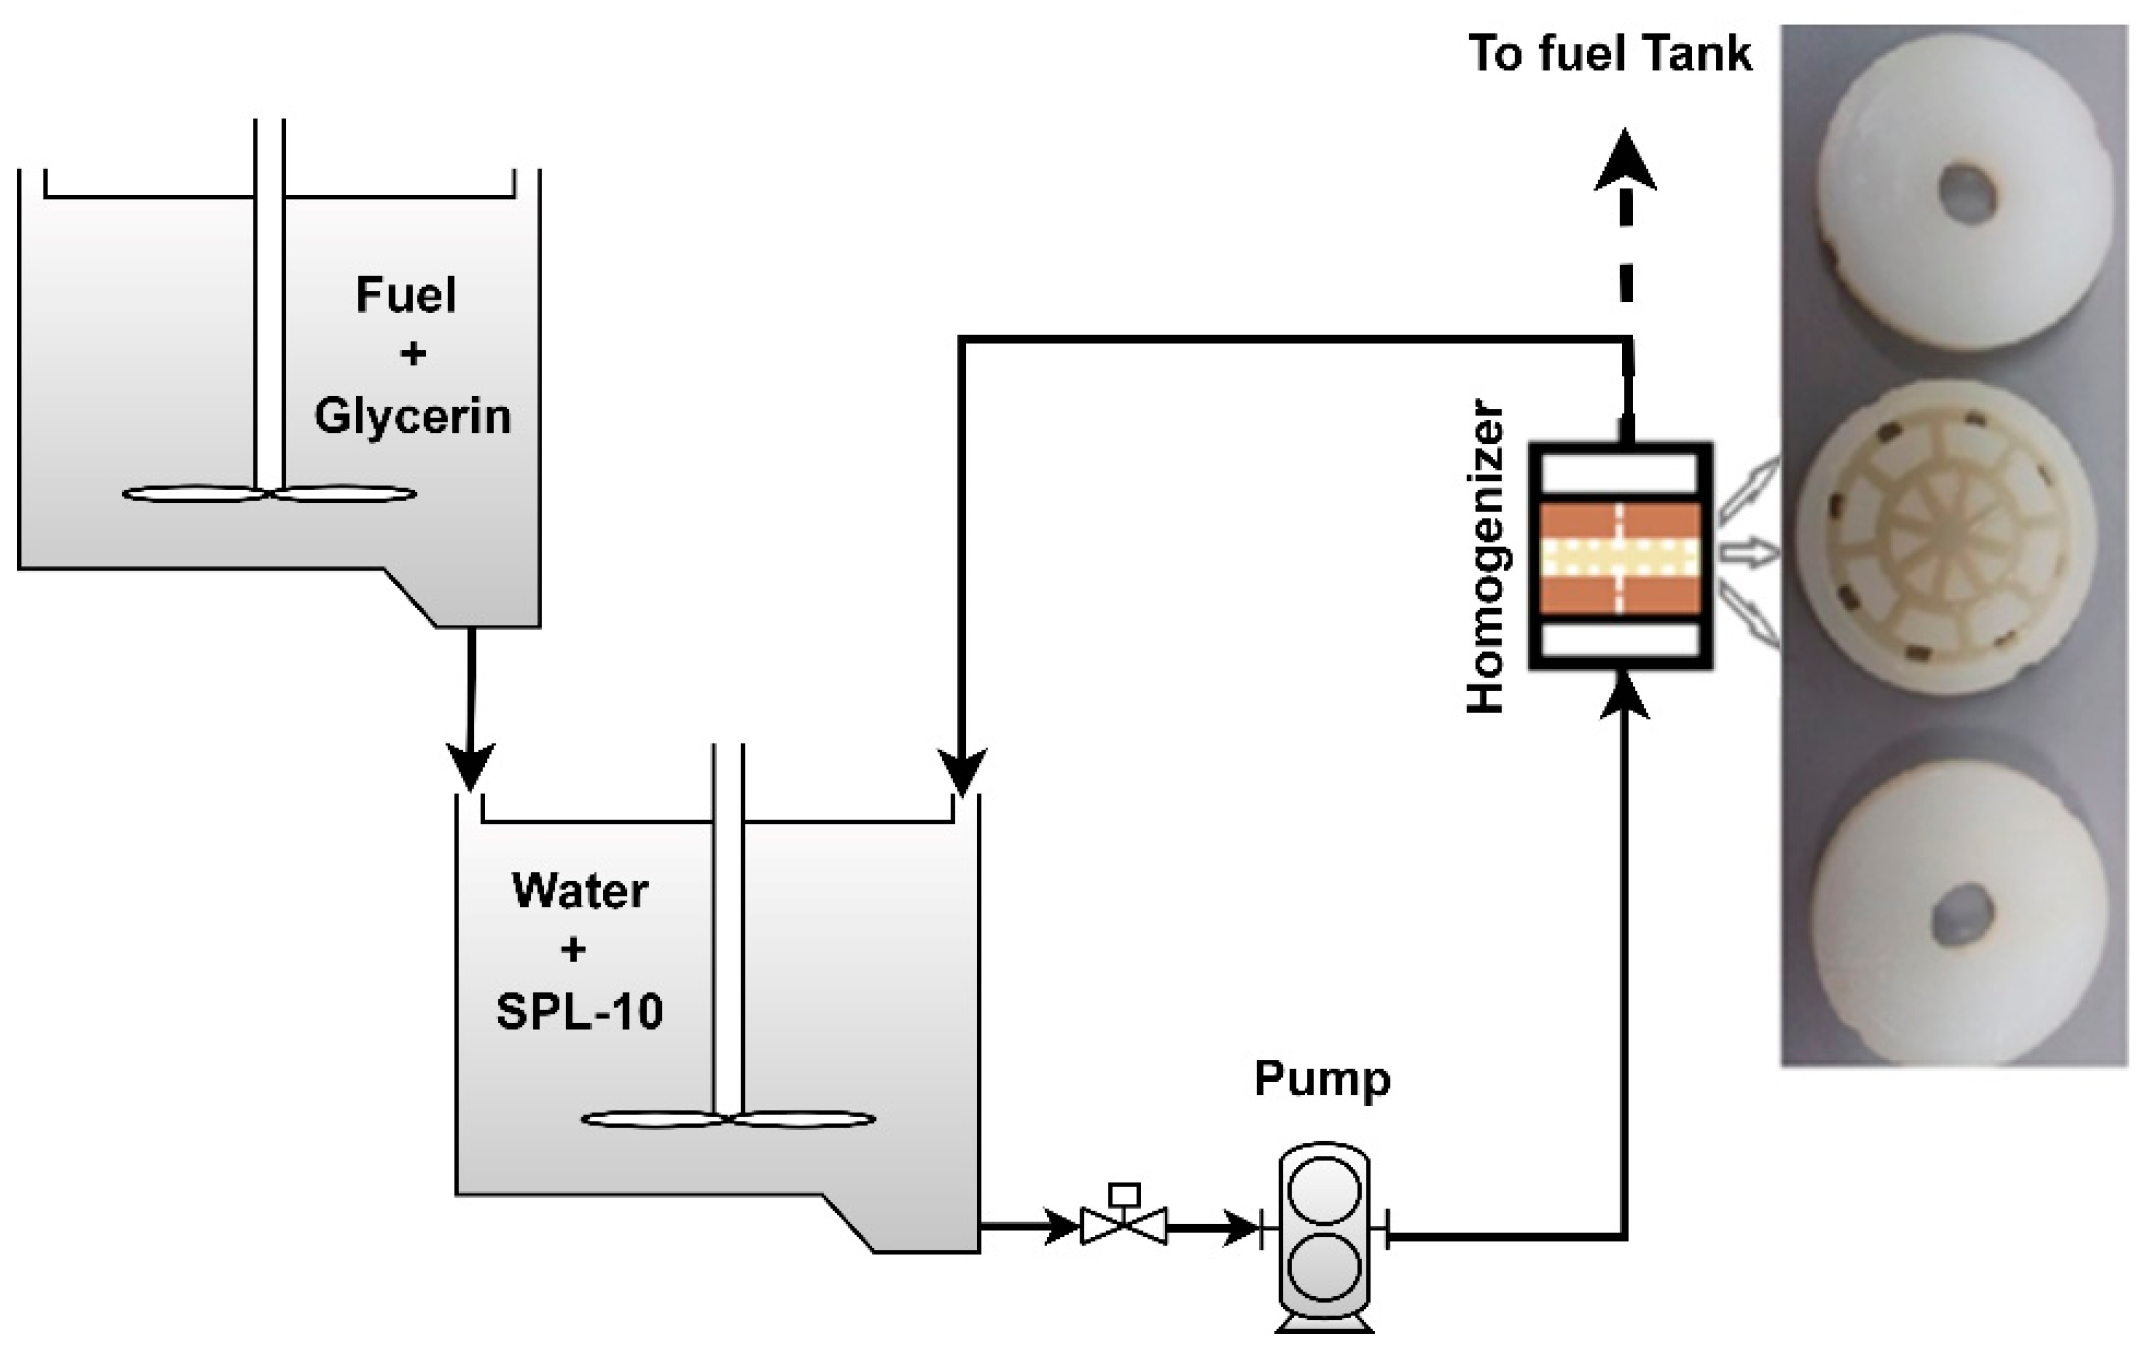
Figure 6.
Experimental layout: (a) front picture of RCEM (b) RCEM schematic.

Figure 7.
The optical system configuration.

Figure 8.
Two-color method definition and the application process. (a) the explanation of the picture analysis (b) an example of the results with the source photo.
Figure 8.
Two-color method definition and the application process. (a) the explanation of the picture analysis (b) an example of the results with the source photo.

Figure 9.
Fuel–water evaporation model process.

Figure 10.
The computational domain of RCEM applied in KIVA-3V.

Figure 11.
NOx emissions in the WFE calculations versus the experiments.

Figure 12.
Heat release rate versus crank angle in both experiment and calculated cases: (a) the heat release rate for: (a) the gas oil as a base case, (b) the duration case, (c) the pressure case, and (d) the diameter case.
Figure 12.
Heat release rate versus crank angle in both experiment and calculated cases: (a) the heat release rate for: (a) the gas oil as a base case, (b) the duration case, (c) the pressure case, and (d) the diameter case.


Figure 13.
Flame temperature distributions calculated by the two-color method at 10 °CA ATDC.

Figure 14.
The calculated flame temperature and NO compared to the actual photos at 10 °CA ATDC.

Figure 15.
In-cylinder pressure versus crank angle for different EGR cases (a) CAS (b) COC.

Figure 16.
Experimental heat release rate versus crank angle for the two applied cases: (a) EGR and (b) WFEs.
Figure 16.
Experimental heat release rate versus crank angle for the two applied cases: (a) EGR and (b) WFEs.

Figure 17.
NOx emissions concentration in the case of EGR–WFE combination.

Figure 18.
CO and HC emissions concentration in the case of EGR.

Figure 19.
NO reduction and IMEP calculations for EGR–WFE combinations: (a) injection duration, (b) the pressure case, and (c) the diameter case.
Figure 19.
NO reduction and IMEP calculations for EGR–WFE combinations: (a) injection duration, (b) the pressure case, and (c) the diameter case.


Table 1.
Experimental conditions in EGR.
| Exhaust Gas Recirculation | ||||
| Initial oxygen concentration [vol%] | 21.0 | 18.3 | 16.3 | |
| Timing of injection start [deg. ATDC] | −5.2 | −5.1 | −5.1 | |
| Injection duration [deg.] | 20.3 | 20.7 | 20.6 | |
| EGR–WFE Combinations | ||||
| Initial Oxygen concentration [vol%] | 18.3 | 16.3 | ||
| Fuel | WFE25 | WFE40 | WFE25 | WFE40 |
| The ratio of water to fuel [vol%] | 25 | 40 | 25 | 40 |
| Timing of injection start [deg. ATDC] | −4.8 | −5.2 | −4.8 | −5.2 |
| Injection duration [deg.] | 24.6 | 29.3 | 25.1 | 29.4 |
Table 2.
Experimental conditions of the WFE.
| Base | Case 1 | Case 2 | Case 3 | |||
|---|---|---|---|---|---|---|
| Initial Oxygen Concentration [vol%] | 21.0 | |||||
| Fuel | Gas Oil | WFE25 | WFE40 | WFE25 | WFE40 | WFE40 |
| The ratio of water to fuel [vol%] | 0 | 25 | 40 | 25 | 40 | 40 |
| Timing of injection start [deg. ATDC] | −3.1 | −4.4 | −4.4 | −6.3 | −7.0 | −3.1 |
| Injection duration [deg.] | 25.4 | 33.3 | 37.4 | 28.7 | 29.6 | 25.9 |
| Injecting pressure [Mpa] | 80 | 80 | 125 | 150 | 80 | |
| Diameter of nozzle hole [mm] | 0.5 | 0.6 | ||||
Table 3.
RCEM specifications.
| Engine Type | 4-Stroke |
|---|---|
| Number of cylinders | 1 |
| Bore × stroke | 240 × 260 mm |
| Clearance volume (Upper, lower) | 200 × 66 × 80 mm3 |
| 240 mm × 5.4 mm | |
| Size of the quartz window | 200 × 50 × 100 mm3 (×2) |
| Engine speed | 350 rpm |
| Compression ratio | 9.54 |
| Initial charge conditions | 0.59 MPa, 423 K |
Table 4.
Specifications of the high-speed camera and optical settings.
| Camera Type | FASTCAM SA4 |
|---|---|
| Lens | AF-S VR Micro-Nikkor F2.8 f105 mm |
| Image sensor | CMOS image sensor |
| Resolution | 832 × 225 pixels |
| Frame rate/Exposure | 20,000 fps/5.8 μs |
| Recording color depth | RBG, each 12 bit |
| Shutter method | Electronic shutter |
Table 5.
The uncertainty in the measurements and the calculations.
| Instrument | Range | Accuracy | Uncertainty (%) |
|---|---|---|---|
| Injection pressure sensor | 0–5000 bar | ±5 bar | ±0.4 |
| Intake pressure sensor | 0–2 bar | ±0.006 bar | ±0.25 |
| In-cylinder pressure sensor | 0–250 bar | ±0.125 bar | ±0.5 |
| CO | 0–100 ppm | 5 ppm | ±0.2 |
| HC | 10–20,000 ppm | 10 ppm | ±0.2 |
| NOx | 10–10,000 | 10 ppm | ±0.25 |
| Calculated quantities | Uncertainty (%) | ||
| Flame temperature (TCM) | 0.3% | ||
| Flame temperature (calculated) | 2.5% | ||
| IMEP | 1.3% | ||
| NO | 1.5% | ||
Disclaimer/Publisher’s Note: The statements, opinions and data contained in all publications are solely those of the individual author(s) and contributor(s) and not of MDPI and/or the editor(s). MDPI and/or the editor(s) disclaim responsibility for any injury to people or property resulting from any ideas, methods, instructions or products referred to in the content. |
© 2022 by the authors. Licensee MDPI, Basel, Switzerland. This article is an open access article distributed under the terms and conditions of the Creative Commons Attribution (CC BY) license (https://creativecommons.org/licenses/by/4.0/).
Share and Cite
MDPI and ACS Style
Abdelhameed, E.; Tashima, H. EGR and Emulsified Fuel Combination Effects on the Combustion, Performance, and NOx Emissions in Marine Diesel Engines. Energies 2023, 16, 336. https://doi.org/10.3390/en16010336
AMA Style
Abdelhameed E, Tashima H. EGR and Emulsified Fuel Combination Effects on the Combustion, Performance, and NOx Emissions in Marine Diesel Engines. Energies. 2023; 16(1):336. https://doi.org/10.3390/en16010336
Chicago/Turabian StyleAbdelhameed, Elsayed, and Hiroshi Tashima. 2023. "EGR and Emulsified Fuel Combination Effects on the Combustion, Performance, and NOx Emissions in Marine Diesel Engines" Energies 16, no. 1: 336. https://doi.org/10.3390/en16010336
Note that from the first issue of 2016, this journal uses article numbers instead of page numbers. See further details here.