
Development Potential Assessment for Wind and Photovoltaic Power Energy Resources in the Main Desert–Gobi–Wilderness Areas of China


Global Energy Interconnection Development and Cooperation Organization, Beijing 100031, China
*
Author to whom correspondence should be addressed.
Energies 2023, 16(12), 4559; https://doi.org/10.3390/en16124559
Submission received: 17 March 2023
/
Revised: 8 May 2023
/
Accepted: 18 May 2023
/
Published: 7 June 2023
(This article belongs to the Topic Clean Energy Technologies and Assessment)
Abstract
:The large-scale centralized development of wind and PV power resources is the key to China’s dual carbon targets and clean energy transition. The vast desert–Gobi–wilderness areas in northern and western China will be the best choice for renewable energy development under multiple considerations of resources endowment, land use constraints, technical conditions, and economic level. It is urgent to carry out a quantitative wind and PV resource assessment study in desert–Gobi–wilderness areas. This paper proposed a multi-dimensional assessment method considering the influence of the power grid and transportation infrastructure distributions, which includes three research levels, namely, the technical installed capacity, the development potential, and the development cost. Nine main desert–Gobi–wilderness areas were assessed. The wind and PV technical installed capacities were 0.6 TW and 10.7 TW, and the total development potentials were over 0.12 TW and 1.2 TW, with the full load hours of 2513 and 1759 and the average development costs of 0.28 CNY/kWh and 0.20 CNY/kWh. Finally, this paper proposed the meteorological–electrical division distribution. A case study in the Kubuqi and Qaidam Deserts was carried out on wind–wind and wind–PV collaborative development across different meteorological–electrical divisions, which can reduce by 58% the long-term energy storage capacity and decrease the total system LCOE from 0.488 CNY/kWh to 0.445 CNY/kWh.
1. Introduction
The global energy crisis and climate change have accelerated the rapid development of renewable energy (RE) in the world. Vigorously developing and utilizing wind and solar power energy is not only an inevitable choice to promote social sustainable development but also an important measure to achieve the strategic goal of “carbon peaking and carbon neutralization” [1,2,3,4]. At present, China continues to accelerate the energy transition, putting the large-scale RE development in a prominent position and actively implementing the clean substitution of low-carbon clean energy such as wind and solar power for high-carbon fossil energy such as coal, oil, and natural gas. In general, China’s hydropower resources to be developed are relatively limited, and its biomass resources are not rich and with a relatively high cost. The geothermal and marine energy power generation technology have yet to be broken through. In addition, there are increasingly stringent safety requirements for nuclear power. Therefore, from the perspective of resources endowment, technology maturity, and economic cost, the key to speed up the clean transition is the large-scale centralized development of wind and solar power energy.
In the past decade, China’s RE capacities have developed rapidly, and the installed capacity of wind, photovoltaic, and other RE power generation has reached new highs, as shown in Figure 1. It can be predicted that with the generation technology progress and the scale effect in the future, the cost will drop, forming a positive incentive and further promoting the wind and solar power development in the medium and long term [5,6]. Under multiple considerations of resources endowment, land use constraints, technical conditions, economic level, desertification control, and sustainable development of local society, especially compared with the densely populated central and eastern China, the vast deserts, stone desert, Gobi, and wilderness areas (referred to as “desert–Gobi–wilderness areas”) in northern and western China will be the best choice for the large-scale centralized development of wind and PV resources [7]. The National Development and Reform Commission of China and the National Energy Administration of China have proposed to “achieve the total installed capacity of wind and solar power reach 1200 GW by 2030” [8,9,10,11]. Therefore, it is urgent to carry out quantitative assessment and distribution research on the wind and PV resources in the main desert–Gobi–wilderness areas in China and clarify the critical issues of where, how many, and what the cost levels of the wind and PV power resources in such areas are.
However, it is a systematic problem from the concept to the quantitative assessment of resources and then to the actual development: it is not only a power meteorological problem related to the endowment and characteristics of RE resources but also a technical problem that needs to consider the development and utilization conditions and technical progress and a social problem that considers the impact of human social activities and economic benefits. At present, there are few studies on the quantitative assessment of wind and PV power resources under the scenario of vigorously developing the desert–Gobi–wilderness areas. As a result, the development potential, cost analysis, and technical site selection scheme at the practical level are not clear, and it is difficult to provide corresponding support for planning decision and policy making. Among the published papers worldwide, some studies on the development, utilization, and consumption of RE power can be used for reference.
Many research institutions have carried out relevant studies on the assessment models of wind and PV resources and the quantitative calculation for specific or limited areas, which can be divided into two categories from geographical and economic views. From the geographical view, the most important thing is to determine the natural wind/solar conditions near the earth’s surface, as precisely as possible. Usually, field experimental measurements and numerical simulations are adopted for predicting the climate effects for wind/solar conditions [12,13,14]. Recently, more attention has been paid to building more elaborate regional climate models to evaluate the interactions between power plants and the environment [15,16,17]. For the specific cases, Rong Zhu from the China Meteorology Administration assessed the distribution of wind energy resources and the technical available amount in the country [18,19] but failed to carry out a quantitative assessment of the development costs in combination with technical and economic forecasting. Liping Sun of China Energy Investment Corporation carried out the analysis of China’s solar energy resource development potential, provided the interval values of PV power generation hours with the optimum tiled angles for each province, and analyzed the interval value of the internal rates of return of the projects’ development in each province based on actual data and information [20]. Qiao Zhao of China Power Construction Corporation analyzed the distribution and output characteristics of wind and PV resources in Guizhou Province [21]. However, the above research focused on the characteristics of resource endowment. Next, the technical-related and economic-related factors should be taken into consideration before making policies and constructions, including the restrictions of technical level, land cover, topography, geology, and other factors on development, and attempts have been made on site selections [22,23,24]. The Commonwealth Scientific and Industrial Research Organization of Australia, the National Renewable Energy center of Spain, the Canadian Meteorological Agency, the Danish Risoe National Laboratory, the National Renewable Energy Laboratory of the United States, and other institutions have carried out national-level wind and solar resources assessments based on the observation data of meteorological stations or numerical simulation data; however, most of the research focuses on the characteristics and distribution of resource endowment, such as wind speed/power density [25,26,27,28,29,30] or improving processing and analysis methods of resource data [31,32]. IRENA and other institutions have completed the assessment of wind energy resources in Africa [33,34], considering the land covers for excluding unsuitable areas such as cities and farmland. The energy administration of northern Ontario carried out the analysis of environmentally sensitive areas and estimated the technical development areas and amount of installed capacity [35]. However, in general, the assessment of wind and PV resources in the wide area focuses on the analysis of resource reserves and land use and lacks a quantitative calculation of the economy, and no team has yet carried out special research on resource assessment in desert–Gobi–wilderness areas. The existing research on these areas always focuses on analyzing the ecosystem and geomorphic changes or resource characteristics in a single area [36,37,38,39,40,41,42].
In view of the deficiencies of the above research, this paper aims to comprehensively consider the natural, technical, economic, and other factors of the desert–Gobi–wilderness areas, starting from the quantitative assessment model, relying on GIS analysis and the platform tool, and through multi-level and multi-criteria quantitative analysis to realize the systematic calculation of wind and PV development potentials in the main desert–Gobi–wilderness areas of China and carry out the case study on the collaborative optimization development of wind and PV energy, so as to fill the above research gap and provide direct support for the planning decision. Specifically, this paper carries out the following three major research innovations:
- (1)
- The assessment models and principles of wind and PV resources considering the infrastructure distribution in desert–Gobi–wilderness areas are proposed, including three research levels: technical installed capacity, priority development potential, and development cost.
- (2)
- The definition of the desert–Gobi–wilderness area and the research scope of nine main areas are proposed. Based on GIS technology, the refined technical and economic assessment is realized with a spatial resolution of 500 m.
- (3)
- The meteorological–electrical divisions of wind and solar resources in China are proposed by analyzing the long-term meteorological data, realizing the case study on the collaborative optimization development of wind and PV power bases.
The above research will help to clarify the wind and PV power potential and economic level of the desert–Gobi–wilderness areas in China, which has certain guiding significance for engineering practice and can provide reference for planning decision and policy making.
2. Research Methods
2.1. Study Scope
From 2021 to now, the National Development and Reform Commission and the National Energy Administration of China have clearly proposed to speed up the planning and development of large-scale wind and solar power bases focusing on the desert–Gobi–wilderness areas. According to the relevant geographical and ecological definitions and main research concerns, this paper proposes the definition of desert–Gobi–wilderness areas: the barren areas that is bare ground or covered by sand and gravel, with dry climate, low precipitation, sparse vegetation, and small biomass, such as the desert, stony desert, salt desert, pebble cobble desert, Gobi, wasteland, and others in general cognition. These areas are mainly distributed in the north and west and often rich in wind and solar energy resources. According to the geographical division, they are mainly located in the Inner Mongolia Plateau, Ordos Plateau, Alxa Plateau, Hexi Corridor plain, and other geomorphic units, which are mainly distributed in Xinjiang, Gansu, Inner Mongolia, Qinghai and other provinces [36].
This paper focuses on seven deserts including the Kubuqi, Ulan Buh, Tengger, Badain Jaran, Gurbantunggut, Kumtag, and Qaidam Deserts and two Gobi regions including Hainan district of Qinghai Province and the north of the Tianshan Mountains, a total of nine main desert–Gobi–wilderness areas in China, to carry out the wind and PV resource assessment and priority development potential evaluation of large-scale bases.
For a long time, there have been some disputes over the geographical boundaries of these nine areas. In this paper, based on the research of the China Geological Survey [37], Longzhen Lin of Beijing Forestry University [38], Peng Jia of Lanzhou University [39], Yiming Feng of the Chinese Academy of Forestry Sciences [40], Jianyu Liu [41], Guolin Yang of Lanzhou Jiaotong University [42], Yujie Xu of the Chinese Academy of Sciences [43], and other institutions and scholars, the main study scope of the nine main desert–Gobi–wilderness areas is provided with high-resolution satellite image data, as shown in Figure 2.
2.2. Assessment Methods
The research team has been engaged in the assessment of RE resources for a long time [2,44,45] and has established quantitative models for the assessment of global wind and solar energy resources by selecting three main indicators, namely, theoretical reserves, technical installed capacity, and development cost, which concern the influence of the power grid and transportation infrastructures distribution. For this study, technical installed capacity and development cost were more suitable and valuable.
2.2.1. Technical Installed Capacity
The key for the assessment was to exclude the undevelopable areas due to resource endowment, conservation areas, altitude and sea depth, land cover, and other restrictions, calculate the available area Aavl, then consider the impact of a different land cover, set the land use coefficient, and calculate the effective installed area Aeft. The detailed methods and parameters can be seen in the technical monograph in [44,45].
where η is the land use coefficient, Asum is the total area of the assessment areas, and Acon, Ares, Aalt, and Aland are the areas excluded for conservation areas restrictions, poor resources, high-altitude restrictions, and land cover restrictions, respectively.
For the wind energy assessment, the influence of the terrain gradient difference on the installed capacity per unit area was determined by setting the gradient influence factor α. For the technical potential installed capacity PTPGWind, it was necessary to calculate the effective installed capacity area and the actual installed capacity of each grid in the area, calculate the annual average wind speed in the standard state as a technical indicator, and calculate the annual hourly power generation sequence according to the typical wind turbine power curve using the interpolation method, so as to obtain the annual power generation QTPGWind. More details of the typical wind turbines’ power curves chosen in this study can be found in reference [45], appendix Figure A1.
where, Punit_wind is the wind power installed capacity per unit area, and PWindj is the normalized power generation of a typical wind turbine at the hour j.
For the assessment of PV resources, the area with a terrain gradient greater than 30° was difficult to develop and needed to be excluded. To evaluate the technical developable capacity of PTPGPV, it was necessary to calculate the installed capacity first, that is, to obtain the total capacity power of the photovoltaic power generation modules arranged per unit area based on the equipment parameters and optimal arrangement method under the current technical conditions. The accumulation of the product of the effective installed area and installed density of all grid points in the assessment area is the amount of PV technical installed capacity. Further considering the losses caused by temperature, shelter, equipment loss, and other factors, the hourly photovoltaic power generation can be calculated, and then the annual power generation QTPGPV can be obtained.
where Punit_PV is the installed capacity of photovoltaic power generation per unit area, PPVj is the unit installed PV power generator’s output after considering reduction and losses in the jth hour, GTI is the global tilted irradiance, ξ is the component power temperature coefficient with a value of −0.4%, k is the loss coefficient of PV array with a value of 0.85 in this study, and T is the local ambient temperature in degrees Celsius.
2.2.2. Development Costs
The levelized cost of energy (LCOE) was used to evaluate the development cost, which was closely related to the equipment and construction cost, financial parameters, and infrastructure conditions that affected the economy. Each geographical grid was regarded as an independent unit to calculate separately. References [5,6,46,47] introduce the comprehensive multiple linear regression prediction method and the correlation analysis prediction method based on the deep self-learning neural network algorithm to carry out the technical and non-technical cost prediction models, respectively. Among them, it is noteworthy that the research has realized the quantitative analysis of the distribution of the power grid and transportation facilities on the development cost, using the data of 147 national AC and DC backbone transmission networks established by the GEIDCO [44], the dataset of the global highway network released by the socio-economic data and application center of NASA, and the data of the planned road network in China’s national highway network planning (2022–2035). Combined with GIS analysis, different transmission mode selections, grid connection distances under different voltage levels, and off-site access road distances at various grid points, the cost impact of grid and off-site traffic connection was quantitatively calculated.
where LCOEi is the total LCOE for the ith grid point with the unit of CNY/kWh, which is composed of three parts: the technical cost LCOEgenerationi for equipment and construction, the grid connection cost LCOEgridi, and the off-site transportation cost LCOEroadi. PTPGi is the technical potential installed capacity, and QTPGi is the annual power generation. CEQ and CINSTL are the equipment cost and the construction and installation cost per kilowatt, respectively, N is the operation life of the power station, and r is the discount rate. Mn and Fn are the operation and maintenance costs and financial costs of the nth year, respectively. VR is the residual value of the power station. Lgirdi is the nearest distance between the ith grid point and the power grid facilities of each voltage level, and ηgird is the nonlinear path coefficient. Cgird is the grid connection cost per unit installed capacity unit distance after the transmission mode selection with the unit of CNY/(kW·km). Lroadi is the distance between the ith grid point and the nearest highway facilities, and Croad is the traffic cost per unit installed capacity unit distance with the unit of CNY/(kW·km).
2.2.3. Digital Platform Tool
The Global Renewable-Energy Exploitation Analysis Platform (GREAN) established by the research team was based on the global resource–geographic–social database and the multi-dimensional refined assessment model, which can realize the systematic assessment and rapid online calculation of hydropower, wind power, and photovoltaic power generation resources worldwide.
Reference [2] introduces the research on the cost increment of carbon neutrality in China’s power system based on the GREAN platform, which is carried out in cooperation with Tsinghua University and Harvard University. Reference [48] introduces the research on the green hydrogen development potential and economic analysis in China. Reference [49] introduced that the GREAN platform, as a typical global meteorological energy service case, can promote the development of RE and was included in the global annual report of the World Meteorological Organization in October 2022.
2.3. Assessment Principles of Desert–Gobi–Wilderness Areas
At present, there is no unified standard for the classification and geographical boundaries of the desert–Gobi–wilderness areas. In addition, these areas are distributed in different provinces and regions in the vast northern part, with obvious geomorphic differences. It is necessary to put forward the specific areas, assessment principles, and relevant quantitative parameters according to the local conditions on the basis of the abovementioned RE resources assessment model. Therefore, this paper puts forward three research levels, namely, the technical installed capacity assessment of the whole region, the development potential, and the cost assessment of the priority regions.
- (1)
- Technical Installed Capacity Assessment Principle
According to the differences of surface characteristics and development conditions of desert–Gobi–wilderness areas, it is necessary to consider different influencing factors, such as resource endowment, land cover, conservation areas, altitude restriction, and so on, and put forward the assessment principles. Table 1 provides the main indicators and recommended parameters.
- ①
- Eliminate the areas with unsatisfactory resource endowment. Due to the increasing large-scale level of wind turbines and the continuous improvement of hub height, the wind speed resource data at two elevations of 100 m and 150 m height were used in the assessment. The total horizontal radiation GHI was used for the photovoltaic assessment. Combined with the engineering construction practice, the areas with annual average wind speeds less than 5 m/s or areas with GHIs less than 1000 kWh/m2 were regarded as low-resource areas, which are not suitable for large-scale development.
- ②
- Eliminate all types of national conservation areas, including natural ecology, wildlife, and natural resources conservation areas.
- ③
- Exclude the high-altitude areas that are not suitable for development under the current technical level and the plateau with an altitude of more than 4000 m; the air is thin, the wind power density is reduced, and most of them are distributed with glaciers and permafrost. The construction of the power generation base is difficult, which may seriously affect the natural environment and is not suitable for development.
- ④
- Bare ground and sparse low shrubs are the two typical land covers in the desert–Gobi–wilderness areas, and the recommended land use coefficient is 100%. Grassland, forests, cultivated land, wetlands, swamps, cities, ice, and snow are not suitable for centralized development.
- ⑤
- Considering the distribution and mobility characteristics of desert–Gobi–wilderness areas in China, the mobile sandy land and semi-mobile sandy land are difficult for engineering construction and should be excluded. As the most widely distributed category, the desert can be divided into four types according to its mobility characteristics: mobile sandy land, semi-mobile sandy land, semi-fixed sandy land, and fixed sandy land [50]. The surface landscape characteristics of mobile and semi-mobile sandy land are shifting dunes and sand, which is distributed continuously in a large area and generally causes it to be difficult to construct power bases.
- ⑥
- The area with a terrain gradient greater than 30° is not suitable for development due to its difficulty and poor economy under the current technical level and should be excluded.
- ⑦
- In combination with the detailed investigation and data collection of the specific desert–Gobi–wilderness areas, the mineral areas, scenic spots, military-sensitive areas, and other areas that are not suitable for development can be further excluded.
- (2)
- Priority Development Potential Assessment Principles
Take the region located in the edge of desert–Gobi–wilderness areas, along the crossed highway, around the villages and other populated areas as the priority development areas, and assess the development potential of wind and photovoltaic power. The assessment principles are as follows. Table 2 and Table 3 show the composition and the recommended parameters of the initial development investment and the recommended values of the financial parameters.
- ①
- According to the principle of easy to difficult and phased development, 5 km, 10 km, and 20 km were selected as the distance thresholds to determine the scope of the priority development areas and then assess the technical installed capacity of wind and photovoltaic power in the area as the priority development potential.
- ②
- Focusing on the technical costs of the equipment and infrastructure, combined with the situation of existing projects, and considering the reasonable non-technical costs (mainly including land use, up-front costs, etc., accounting for 10–15%), the comprehensive development and construction costs in 2025 were predicted.
- ③
- The off-site transportation costs and grid connection costs of the power bases were included in the total development cost, and the LCOE under level year was calculated.
3. Wind and PV Assessment
3.1. Development Potential Assessment of Wind Resources
The annual average wind speed in nine major desert–Gobi–wilderness areas was about 5.7 m/s at 100 m height. The total amount of technical installed capacity was more than 600 GW, with a full load hour of 2600. The distribution of technical available areas for wind power development and full load hours is shown in Figure 3. Mainly affected by the wind resource endowment, the four deserts including the Badain Jaran, Ulan Buh, Kubuqi, and Tengger Deserts and the Gobi region at the northern foot of the Tianshan Mountains had a wider space distribution with full load hours generally higher than average level, up to more than 2800. Based on the wind speed data at 150 m height, the technical installed capacity was increased to 750 GW, and the average full load hours exceeded 3070.
The technical available areas located in the edge of desert–Gobi–wilderness areas, along the crossed highway, around the villages and other populated areas with a distance less then 5 km can be regarded as the priority development areas. The nine desert–Gobi–wilderness areas had priority development areas of 27,000 km2, accounting for 9% of the total area, with the priority development potential of about 120 GW and full load hours of 2513. According to the investment economic level in 2025, the average cost was 0.28 CNY/kWh.
According to the phased development principle from easy to difficult, 5 km, 10 km, and 20 km were selected as the distance thresholds to determine the scope of priority development areas, which accounted for 9%, 16%, and 27%, respectively. The development potentials were 120, 210, and 350 GW. Table 4 shows the detailed potential assessment results.
3.2. Development Potential Assessment of Photovoltaic Resources
The GHI in the nine main desert–Gobi–wilderness areas was 1677 kWh/m2. The total scale of PV technical installed capacity was more than 10.7 TW, and the full load hour was 1747, which was significantly higher than the 1650 value of all desert–Gobi–wilderness areas in China. The distribution of technical available areas for PV power development and full load hours is shown in Figure 4.
The PV priority development areas with 5 km distance thresholds in nine desert–Gobi–wilderness areas was 36,000 km2, accounting for 12% of the total area, with the priority development potential of about 12 TW and full load hours of 1759. According to the investment economic level in 2025, the average cost was 0.20 CNY/kWh. Moreover, 5 km, 10 km, and 20 km were selected as the distance thresholds, and the priority development areas accounted for 12%, 21%, and 28%, respectively. The development potential was 12, 21, and 30 TW, respectively. Table 5 shows the detailed PV development potential assessment results.
3.3. Development Suitability Evaluation of Large-Scale Wind and PV Power Bases
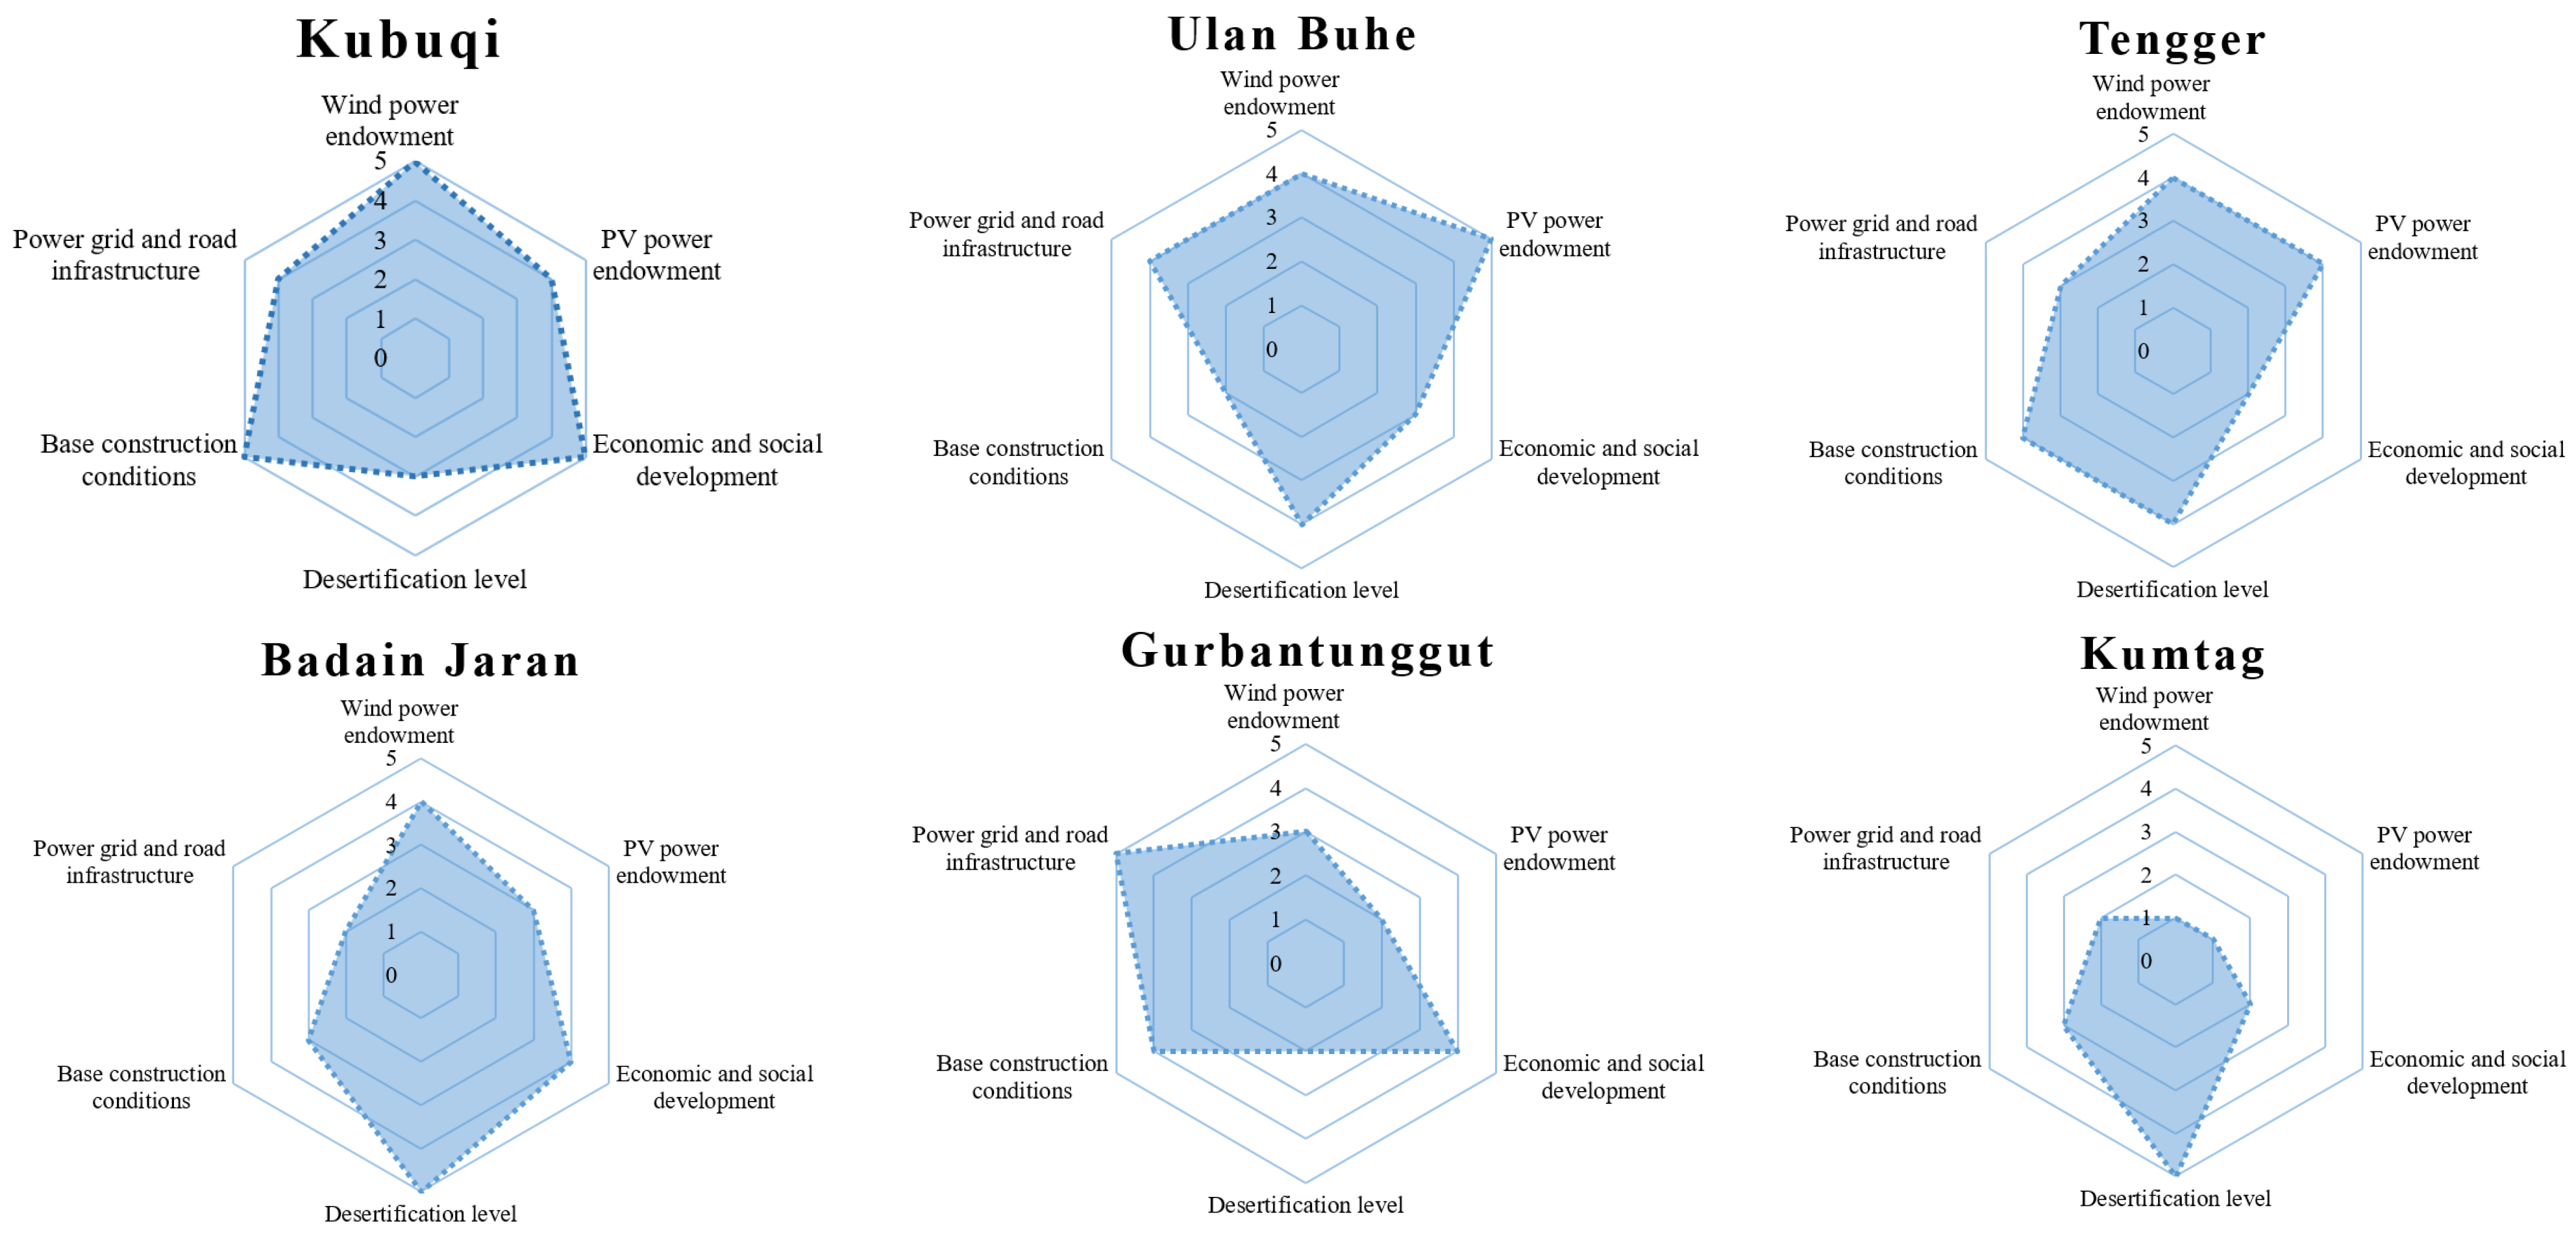
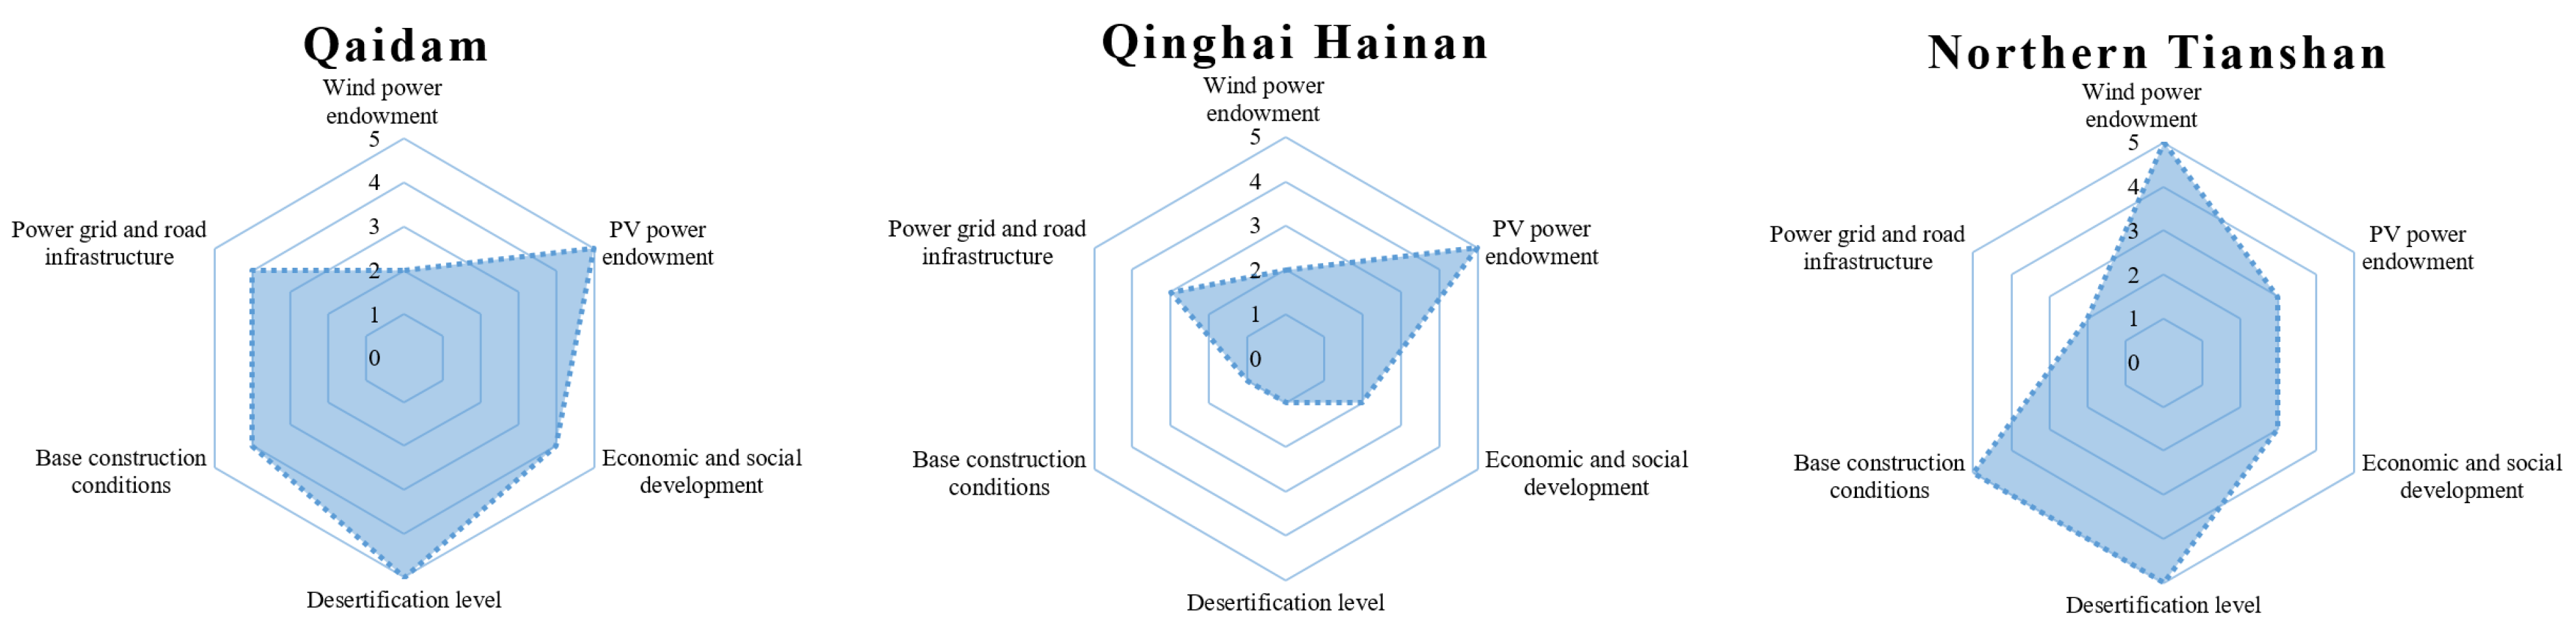
The layout planning and site selection of large-scale wind and PV power bases in the desert–Gobi–wilderness areas need to consider many aspects of influence. This paper carries out a comprehensive comparative analysis to evaluate the suitability in six aspects: the wind and PV power resource endowment, economic and social development, desertification level, base construction conditions, power grid, and road network infrastructure conditions. The development suitability radar maps are shown below.
- (1)
- Wind Power Endowment
There were great differences of wind resources in these nine areas. The average wind speeds in the Kubuqi and Badain Jaran Deserts with good resource conditions were more than 6.4 m/s, while the average wind speed in the Gurbantunggut Desert was less than 5 m/s, which led to a small technical available area and relatively low equipment utilization hours. For wind development, the Tianshan Mountain Gobi had the highest full load hours, reaching 2824, and the average development cost was 0.25 CNY/kWh. The four regions of the Kubuqi Badain Jaran, Ulan Buh, and Tengger Desert had full load hours of 2400 and above, and the costs were less than CNY 0.28, which had excellent economy. For Kumtag, Qaidam, and Hainan Gobi, due to the limitations of high altitude, poor resources, and other conditions, the costs were higher than 0.33 CNY/kWh with relatively poor economy. As an example, the distribution map of the wind speed, the probability histogram of the wind speed, and the LCOE distribution in the priority development areas with a 20 km distance threshold of the Kubuqi Desert are shown in Figure 5.
- (2)
- PV Power Endowment
In terms of PV resources, the average annual GHIs were 1463–1821 kWh/m2, which were significantly higher than the national average. Among them, the GHI of the Qaidam Desert, the Badain Jaran Desert, the Ulan Buh Desert, and the other five regions was more than 1710 kWh/m2, with good resource endowment, The average GHI in the Gurbantunggut Desert was relatively low, less than 1500 kWh/m2. For PV development, the full load hours in the Qaidam Desert reached 1876, but limited by the general infrastructure conditions, the LCOE was 0.18 CNY/kWh. The full load hours of the Kubuqi, Ulan Buh, and Tengger Deserts exceeded 1770, and the costs were less than 0.19 CNY/kWh. Restricted by poor resources and traffic conditions, the LCOEs in Kumtag and Gurbantunggut were higher than 0.24 CNY/kWh. As an example, the distribution map of GHI, the average daily GHI histogram, and the LCOE distribution in the priority development areas with a 20 km distance threshold of the Qaidam Desert are shown in Figure 6.
- (3)
- Economic and Social Development
The nine desert–Gobi–wilderness areas are located in Inner Mongolia, Xinjiang, and Qinghai Province. Theses administrative regions are inhabited by ethnic minorities, mainly including the Mongolian, Kazak, Tibetan, Uygur, and Hui. The main local pillar economic industries include tourism, minerals, and energy development. Due to the small population, the per capita GDP and per capita disposable income of the administrative regions are mostly higher than the national average. However, from the perspective of urbanization development, the urbanization level of the two Gobi areas is relatively low, at about 34–44%, while the urbanization rate of other areas has basically reached a relatively high level of about 60% with the promotion of poverty alleviation and desertification control. In the future, with the large-scale development of renewable resources in these areas, the land resources with no economic value at present can be fully utilized and turned into energy oases. This will not affect the lives of local people and the production of animal husbandry but can provide more employment opportunities for local people bring tax and other fiscal revenue to the local government.
- (4)
- Desertification Level
According to the type and distribution of land covers, the percentage of desert, Gobi, and other bare ground in the total area is taken as the key index to quantitatively analyze the desertification level. In general, the larger the proportion of bare land, the higher the degree of desertification, and the impact of large-scale development on human production and life is smaller. However, at the same time, the construction will experience more difficulty, the operation and maintenance costs will be higher, and they will always face a difficult ecological restoration.
The nine desert–Gobi–wilderness areas are mainly covered by bare ground, with a total area of 200,000 km2, accounting for 67% of the total. Sparse shrubs cover an area of about 840 km2, which is also suitable for wind and PV development. Grassland is also widely distributed, covering an area of 87,000 km2, accounting for about 30%. However, taking the Gurbantunggut Desert as an example, further combined with satellite image analysis, it can be seen that the grassland identified by remote sensing in the region is actually sparse and short-lived desert plants, which are very different from the general beautiful grassland scenery and are also suitable for large-scale development. In general, the desertification levels of Kumtag, Badain Jaran, Qaidam, and the northern Tianshan Mountains are almost 100%, and the desertification levels of Ulan Buh and Tengger are also more than 80%, as can be seen in Figure 7.
- (5)
- Base construction conditions
The site selection of bases needs to avoid several restrictive factors, such as populated areas, conservation areas, steep mountains, active earthquake regions, high-altitude areas, unstable strata, etc. Overall, none of the nine areas are located in conservation areas. All areas are sparsely populated and on generally flat terrain, with an average population density of less than 10 people/km2. Kubuqi, the northern Tianshan Mountains, and the Qaidam Desert have good ground flatness. As the northern Ulan Buh Desert is adjacent to Langshan Mountain in Inner Mongolia and the Danxia landform ridge in Qinghai, the maximum terrain gradient is more than 40°. The strata are mainly composed of loose sedimentary rocks and siliciclastic sedimentary rocks. Except for the occasional historical earthquakes in Hainan prefecture, Qinghai, Kubuqi, and the adjacent areas around the Tengger, there are no historical earthquake records, and the geological structure is stable. It is preliminarily judged that there are no disruptive technical factors affecting the large-scale development.
- (6)
- Power Grid and Road Infrastructure
One or more 220 kV and above AC transmission lines pass through Ulan Buh, Qaidam, Kumtag, Gurbantonggut, and other deserts, as well as Hainan Prefecture, with good grid conditions. The Kubuqi, Tengger, and Badain Jaran Deserts and the northern Tianshan Mountains Gobi are adjacent to 220 kV and above AC transmission lines within 70 km. In terms of road network infrastructure, one or more provincial and national roads have been built crossed the nine desert–Gobi–wilderness areas except the Kumtag Desert, and several highways have been built across Kubuqi, Gurbantonggut, and Badain Jaran and the northern Tianshan Mountains Gobi, laying a good foundation for base construction. The distribution of power grid and transportation infrastructure in the Kubuqi Desert and surrounding areas is shown in Figure 8.
- (7)
- Comprehensive Analysis of Radar Maps
According to the following radar maps, as shown in Figure 9, Kubuqi and Ulan Buh have been evaluated highly in many aspects, such as showing a high level of economic and social development, excellent resource endowment, and good construction conditions. The northern Tianshan Mountain Gobi is suitable for large base construction. However, the surrounding power grid and road network infrastructure conditions need to be improved, and compared with PV, the wind resources in the region are excellent. The above three areas have good development suitability and are suitable for priority development.
The Tengger Desert has good resources, a high desertification level, and good base construction conditions, but the regional economic and social development is not good. In the Badain Jaran Desert, the economic and social development level is high, the wind and PV resource endowment is excellent, and the ground exposure is high, but the surrounding infrastructure conditions need to be improved. The Qaidam Desert has good construction conditions, relatively good infrastructure conditions, and excellent photovoltaic resources but poor wind resources. The development suitability of the above three areas is good.
Figure 9.
Evaluation of suitability radar maps of the nine main desert–Gobi–wilderness areas.
4. Wind–PV Collaborative Development Considering Meteorological Characteristics
4.1. Necessity of Wind–PV Collaborative Development
As we know, wind and PV power resources have strong volatility and unpredictability due to the randomness of natural factors (temperature, air density, wind speed, solar radiation, etc.) [51,52], which require a large capacity of energy storage (ES) equipment to stabilize the fluctuations and achieve stable power output, leading to a high investment cost level of the total system [2]. However, in the wide space area, the output curve of large-scale RE power generation clusters has certain rules. In other words, in addition to the two dimensions of resource variety and time, the renewable power output characteristics also have the regularity of geographical distribution. If the output complementary characteristics of wind–wind and wind–PV in different regions, which show seasonal and intra-day features, can be characterized and used, it can improve power generation quality and promote RE consumption [53]. References [54,55,56] point out that it is an important way to improve the security and economy of the power system with a high proportion of renewable energy in the future by cooperating with large-scale base optimization layout, energy storage, and power grid plan and giving play to their complementary benefits. Therefore, how to visually and graphically represent the temporal and spatial distribution characteristics of wind and PV power generation will help to carry out reasonable and efficient wind–PV collaborative development, reduce the overall volatility of power generation, mitigate the impact of wind solar grid integration, reduce the demand for flexible resources, and improve the economic level.
4.2. Meteorological–Electrical Division
The typical annual data were reconstructed from the global ERA5 reanalysis data (40 years, 1979–2018) and the global ISD meteorological station data (120 years, 1901–2021), and the monthly average wind speed and monthly average solar radiation were used to carry out the RE meteorological analysis. Based on the climate zoning concept in atmospheric physics and meteorology research, combined with the empirical orthogonal function method and spatial clustering analysis method, this paper analyzes the temporal and spatial distribution characteristics of China’s wind and solar resources, clarifies the distribution laws contained in the massive long-term meteorological data, and obtains the meteorological–electrical division, as shown in Figure 10.
According to the correlation analysis of the wind speed time series data, on the monthly average time scale, China’s land region presented the regular distribution of four typical modes, which were characterized by strong summer–light winter, light summer–strong winter, strong spring–light autumn, and light spring–strong autumn. For example, the Qaidam Desert in Xinjiang Province is divided by the tectonic belt at the Qilian Mountain southern foot into two regions with different wind characteristics, as strong summer–light winter and strong spring–light autumn. The two regions are only more than 50 km apart in space. If the large-scale wind power base layout can cover these two regions at the same time, the considerable wind–wind collaborative development benefits can be obtained. Moreover, the Gansu and Qinghai provinces span three different divisions within 200 km. When planning the renewable bases, the consideration of cross-division layout will achieve great benefits.
As for solar energy, the annual variation of surface irradiance in China had a high consistency, which increased or decreased seasonally. However, considering the spatial distribution correlation, there were three typical meteorological–electrical divisions of PV power. Most of the central and northern regions were characterized by strong summer–light winter. The southwest boundary showed strong spring–light autumn characteristics, which were related to the local cloudy weather all year round. The southeast region showed a strong negative correlation, as the light spring–strong autumn characteristics.
4.3. Case Study of Across-Division Development
The Kubuqi Desert is located in the wind meteorological–electrical division characterized as strong spring–light autumn, which was selected for wind and PV development while allocating the suitable capacity of ES equipment as plan 1. The Qaidam Desert is located in the strong summer–light winter division. The comparative research will be carried out to develop a certain wind power replacing part of the wind power in the Kubuqi Desert as plan 2. At the same time, the PV power in Kubuqi will develop continually, and ES equipment will be also allocated. In this study, the power generation and transmission system model named GOPT was used, and the detailed function description can be seen in reference [2,44,57]. Based on the analysis completed by the GREAN platform and the GOPT model, the optimization calculations of two plans were carried out, as shown in Table 6, which compared the power system’s comprehensive cost for different wind–PV collaborative development plans across different meteorological–electrical divisions. The calculation results are shown as follows. Figure 11 and Figure 12 show the typical weekly and annual power balance results of plan 1 and plan 2.
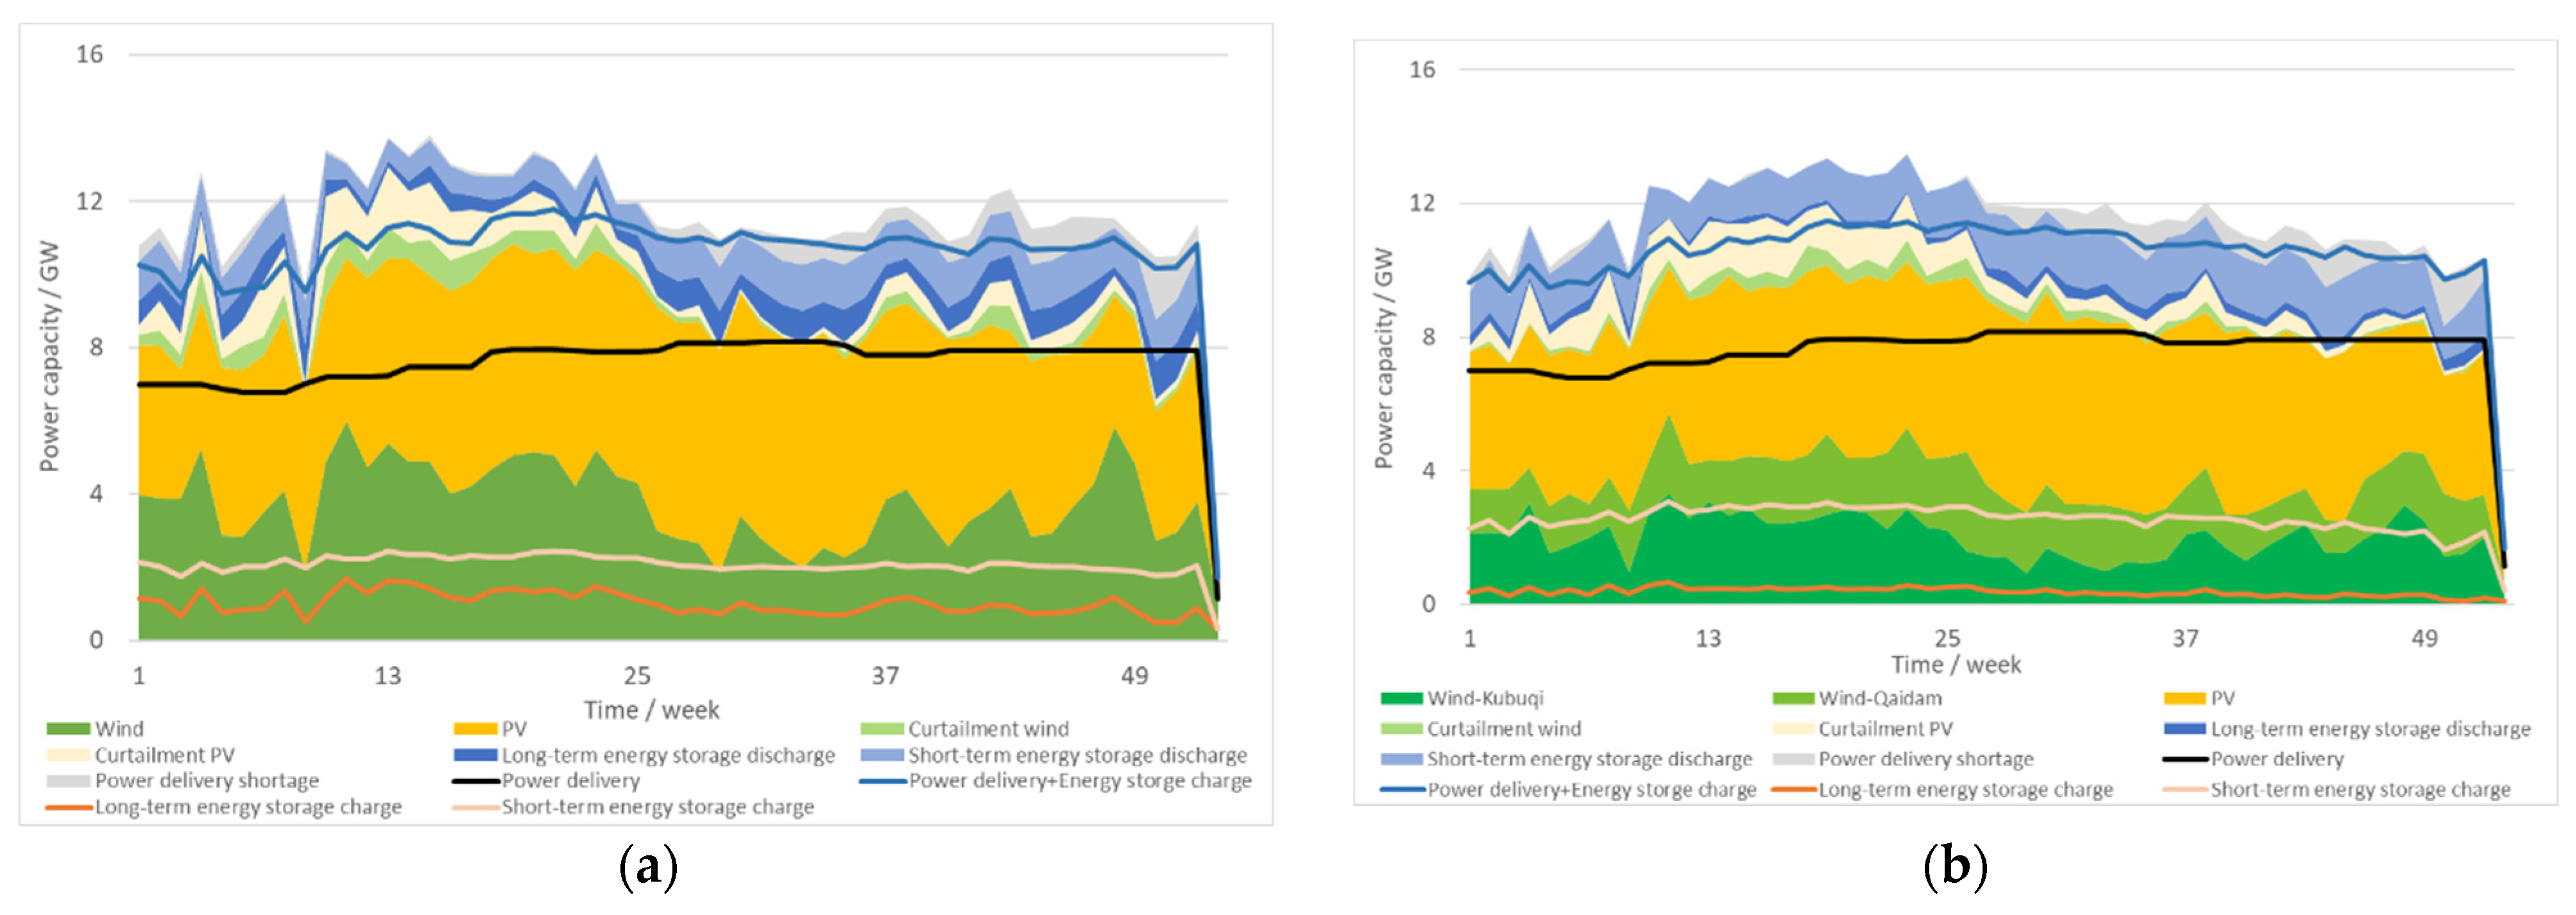
On the premise of the same power transmission demand and the total installed RE capacity, when 6 GW of wind power from the Qaidam Desert in the strong summer–light winter meteorological–electrical division was developed to replace the wind power in the Kubuqi Desert in the strong spring–light autumn division, the demand for ES capacity was effectively reduced, from 10.315 GW to 9.755 GW, especially for the long-term ES, only 42% of the original. As can be seen in Figure 11, the orange line represents the charge of long-term ES, and its maximum value in annual power balance results decreased more obviously than the typical weekly power balance. Moreover, the annual cost was significantly reduced from CNY 12.7 billion to CNY 8.8 billion, a decrease of about 40%, and the LCOE of total system was reduced from 0.49 CNY/kWh to 0.45 CNY/kWh, which effectively improved the economy of RE development and realized significant wind–wind and wind–PV collaborative development benefits. The results show that the collaborative development of wind and solar energy across different meteorological–electrical divisions can reduce the volatility of the output and the capacity demand of long-term ES equipment. This case study can verify the correctness and rationality of the meteorological–electrical division results in China provided ins this paper.
5. Discussion and Conclusions
- (1)
- Renewable energy development in desert–Gobi–wilderness areas is the best choice under multiple considerations. First, the key to accelerating the clean transformation in China is the large-scale development of RE, while the wind and solar resources are mainly concentrated in the northern and western areas, especially in the vast desert–Gobi–wilderness areas. Second, with the continuous progress of power generation technology, the cost is falling rapidly. Third, the energy density of the unit land area for wind or PV power generation is low, so the base construction needs a large area. In particular, the land occupation area of a PV power station with the same power generation is about five to 10 times that of wind farms and 200–300 times that of thermal power plants. As the population and economic activities in eastern and central China are concentrated, land resources specially provided for wind and PV bases are very limited. The vast desert–Gobi–wilderness areas have high wind speed, strong irradiances, and no limitations of forestry, cultivated land, mining, water, and other restrictions, which can provide sufficient land space, while achieving efficient land use, promoting local economic development and helping desert control.
- (2)
- The desert–Gobi–wilderness areas are rich in wind and PV resources and will be the key development areas in the near future. In this paper, seven deserts including Kubuqi, Ulan Buh, Tengger, Badain Jaran, Gurbantunggut, Kumtag, and Qaidam and two Gobi regions in Hainan prefecture of Qinghai Province and the northern foot of the Tianshan Mountains were selected to carry out resource assessment and development potential calculations. The total amount of wind technical installed capacity was more than 600 GW, and the total amount of PV was more than 10,700 GW. Considering the edge of the desert area, along the highway, villages, and other densely populated areas as the priority development area, the wind energy development potential was about 120 GW, with full load hours of 2513, and the PV development potential was about 1.2 TW, with full load hours of 1759. According to the economic level in 2025, the average costs of wind and PV power development were 0.28 CNY/kWh and 0.20 CNY/kWh. Furthermore, with the development of large-scale and low-speed wind turbines and the improvement of operation and maintenance technology in desert–Gobi–wilderness areas, the full load hours especially in the low-wind areas will increase, and the LCOE will decline obviously.
- (3)
- The influence of meteorological–electrical divisions will effectively enhance the collaborative benefits of RE development. Therefore, the rational layout of large-scale wind and PV power bases in vast spaces could reduce the volatility of power generation. So, the intuitive and visual understanding of resource characteristics and geographical distributions is key. In this paper, based on the massive long-term meteorological data, combined with the EOF and spatial clustering analysis methods, the wind and PV resource meteorological–electrical characteristic divisions in China were proposed for the first time. Moreover, with a case study in the Kubuqi and Qaidam Deserts, the collaborative development of wind–wind and wind–PV resources across different meteorological–electrical divisions reduced the capacity requirement of long-term energy storage from 1.815 GW to 0.755 GW, with a decline of 58%, and the total system LCOE decreased from 0.488 CNY/kWh to 0.445 CNY/kWh, nearly 10%.
In general, the development potential assessment results of wind and PV resources in China’s main desert–Gobi–wilderness areas provided by this paper can provide decision support for related provinces to develop these advantageous RE resources and formulate clean energy transition plans. The meteorological–electrical divisions in China can provide new ideas and decision-making references for the large-scale base planning in relevant regions.
Author Contributions
Conceptualization, J.X.; methodology, J.W.; software, J.X.; validation, J.W.; formal analysis, J.W.; resources, J.X. and J.H.; writing—original draft preparation, J.W. and X.L.; writing—review and editing, J.W.; visualization, J.W. and X.L.; supervision, J.X. and J.H.; funding acquisition, J.X. All authors have read and agreed to the published version of the manuscript.
Funding
This work was supported by the National Natural Science Foundation of China (Agent-based modeling and analysis on evolution of the energy technology system for alternative fuel vehicles, Grant No. 72131007).
Data Availability Statement
The data presented in this study are available on request from the corresponding author.
Conflicts of Interest
The authors declare no conflict of interest.
References
- Global Energy Interconnection Development and Cooperation Organization. The Road to Global Carbon Neutrality; China Electric Power Press: Beijing, China, 2021. [Google Scholar]
- Zhuo, Z.; Du, E.; Zhang, N.; Nielsen, C.P.; Lu, X.; Xiao, J.; Wu, J.; Kang, C. Cost increase in the electricity supply to achieve carbon neutrality in China. Nat. Commun. 2022, 13, 3172. [Google Scholar] [CrossRef] [PubMed]
- IPCC. Special Report on Global Warming of 1.5 °C; Cambridge University Press: Cambridge, UK, 2018. [Google Scholar]
- IRENA. Global Energy Transformation: A Roadmap to 2050; International Renewable Energy Agency: Masdar City, Abu Dhabi, 2018. [Google Scholar]
- Sun, W.; Xiao, J.; Hou, J.; Jin, C.; Nie, Y. Investment Cost Forecasting for Low Carbon Power System Planning Considering Technical Progress and Scale Effect. IEEE Access 2022, 10, 114153–114164. [Google Scholar] [CrossRef]
- Hou, J.; Sun, W.; Xiao, J.; Jin, C.; Du, E.; Huang, J. Collaborative Optimization of Key Technology Progress and Low Carbon Transition of Power System. Autom. Electr. Power Syst. 2022, 46, 1–9. (In Chinese) [Google Scholar]
- Global Energy Interconnection Development and Cooperation Organization. Research on Asian Renewable Energy Development and Investment; China Electric Power Press: Beijing, China, 2020. [Google Scholar]
- Interpretation of Implementation Plan on Promoting High-Quality Development of New Energy in the New Era. China Electric Power News, 31 May 2022.
- Wang, Q.D. New energy development model of Inner Mongolia under the new situation. North. Econ. 2022, 7, 17–20. [Google Scholar]
- Hao, W. Continuous policy support and continuous heating up of scenic large base construction. New Energy Sci. Technol. 2022, 9, 35–36. [Google Scholar]
- Wuming, Y.; Gang, L. New methods, new ideas and new achievements in the research of exploitable capacity of Xinjiang wind and solar power resource. Wind Energy 2022, 7, 56–62. [Google Scholar]
- Yuan, J. Wind energy in China: Estimating the potential. Nat. Energy 2016, 1, 16095. [Google Scholar] [CrossRef]
- Kwon, S.D. Uncertainty analysis of wind energy potential assessment. Appl. Energy 2010, 87, 856–865. [Google Scholar] [CrossRef]
- Yang, L.; Gao, X.; Lv, F.; Hui, X.; Ma, L.; Hou, X. Study on the local climatic effects of large photovoltaic solar farms in desert areas. Sol. Energy 2017, 144, 244–253. [Google Scholar] [CrossRef]
- Chang, R.; Yan, Y.; Wu, J.; Wang, Y.; Gao, X. Projected PV plants in China’s Gobi Deserts would result in lower evaporation and wind. Sol. Energy 2023, 256, 140–150. [Google Scholar] [CrossRef]
- Heusinger, J.; Broadbent, A.M.; Sailor, D.J. Georgescu. Introduction, evaluation and application of an energy balance model for photovoltaic modules. Sol. Energy 2020, 195, 382–395. [Google Scholar] [CrossRef]
- Li, Y.; Kalnay, E.; Motesharrei, S.; Rivas, J.; Kucharski, F.; Kirk-Davidoff, D.; Zeng, N. Climate model shows large-scale wind and solar farms in the Sahara increase rain and vegetation. Science 2018, 361, 1019–1022. [Google Scholar] [CrossRef] [Green Version]
- Zhu, R.; Wang, Y.; Xiang, Y.; Sun, C.; Chang, R.; Hu, G.; Gao, Z. Study on climate characteristics and development potential of wind resources in China. Acta Energy Sol. Sin. 2021, 42, 409–418. [Google Scholar]
- China Meteorological Administration. The Detail Investigation and Assessment Report of Wind Energy Resource in China; Meteorological Press: Beijing, China, 2014; Volume 3, pp. 86–90, 108–122. [Google Scholar]
- Sun, L.; Fang, M.; Song, Z.; Yi, X. Analysis of Solar Energy Resources and Research on Investment Potential in China. Energy Sci. Technol. 2022, 20, 9–14+18. [Google Scholar]
- Zhao, Q.; Zhang, R.; Song, X.; Yu, S. Analysis on the Distribution and Output Characteristics of Wind Power and Photovoltaic Resources in Guizhou Province. Water Power 2022, 48, 81–91. [Google Scholar]
- Kumar, A.; Sah, B.; Singh, A.R.; Deng, Y.; He, X.; Kumar, P.; Bansal, R.C. A review of multi criteria decision making (MCDM) towards sustainable renewable energy development. Renew. Sustain. Energy Rev. 2017, 69, 596–609. [Google Scholar] [CrossRef]
- Latinopoulos, D.; Kechagia, K. A GIS-based multi-criteria evaluation for wind farm site selection. A regional scale application in Greece. Renew. Energy 2015, 78, 550–560. [Google Scholar] [CrossRef]
- Chaouachi, A.; Covrig, C.F.; Ardelean, M. Multi-criteria selection of offshore wind farms: Case study for the Baltic States. Energy Policy 2017, 103, 179–192. [Google Scholar] [CrossRef]
- Coppin, P.A.; Ayotte, K.A.; Steggel, N. Wind Resource Assessment in Australia–A Planners Guide; Wind Energy Research Unit, CSIRO: Canberra, Australian, 2003. [Google Scholar]
- Alpine Windharvest. Development of Information Base Regarding Potentials and the Necessary Technical, Legal and Socio-Economic Conditions for Expanding Wind Energy in the Alpine Space; Alpine Windharvest Partnership Network: Salzburg, Austria, 2005. [Google Scholar]
- Rodrigo, J.S.; Arroyo RA, C.; Witha, B.; Dörenkämper, M.; Gottschall, J.; Avila, M.; Sile, T. The New European Wind Atlas Model Chain. J. Phys. Conf. Ser. 2020, 1452, 12087. [Google Scholar] [CrossRef]
- Yu, W.; Benoit, R.; Girard, C.; Glazer, A.; Lemarquis, D.; Salmon, J.R.; Pinard, J.P. Wind Energy Simulation Toolkit (WEST): A Wind Mapping System for Use by the Wind Energy Industry. Wind Eng. 2006, 30, 15–33. [Google Scholar] [CrossRef]
- Troen, I.; Petersen, E.I. European Wind Atlas; Roskilde Riso National Laboratory: Roskilde, Denmark, 1989. [Google Scholar]
- Ayotte, K.W.; Davy, R.J.; Coppin, P.A. A Simple Temporal and Spatial Analysis of Flow in Complex Terrain in the Context of Wind Energy Modelling. Bound.-Layer Meteorol. 2001, 98, 275–295. [Google Scholar] [CrossRef]
- Davidson, M.R.; Zhang, D.; Xiong, W.; Zhang, X.; Karplus, V.J. Modelling the potential for wind energy integration on China’s coal-heavy electricity grid. Nat. Energy 2016, 1, 16086. [Google Scholar] [CrossRef]
- Ye, L.; Chen, X.Y.; Jin, J.X. Measure-Correlate-Predict Assessment Method of Wind Energy Resource Considering Wind Power Density and Wind Direction. Autom. Electr. Power Syst. 2019, 43, 24–32. [Google Scholar]
- Hermann, S.; Miketa, A.; Fichaux, N. Estimating the Renewable Energy Potential in Africa: A GIS-Based Approach; International Renewable Energy Agency: Masdar City, Abu Dhabi, 2014. [Google Scholar]
- International Renewable Energy Agency. Estimating the Renewable Energy Potential in Africa [R/OL]. (2014-8-1) [2021-1-18]. Available online: https://www.Irena.org/publications/2014/Aug/Estimating-the-Renewable-Energy-Potential-in-Africa-A-GIS-based-approach (accessed on 29 August 2022).
- Albadi, M.H.; El-Saadany, E.F. Wind Power in Ontario: An Economical Valuation. In Proceedings of the 2007 IEEE Canada Electrical Power Conference, Montreal, QC, Canada, 25–26 October 2007. [Google Scholar] [CrossRef]
- Shen, Y.; Wang, X.; Cong, R.; Lu, Q. Eco-geographical zoning of deserts and gobi in China. J. Arid Land Resour. Environ. 2013, 27, 1–13. [Google Scholar]
- 1:10000000 Scale Desertification Land Distribution Mapset of China, Produced by China Aero Geophysical Survey and Remote Sensing Center for Land and Resources and released by China Geological Survey. Available online: http://westdc.westgis.ac.cn (accessed on 29 August 2022).
- Lin, L.; Chen, Y.; Ma, W.; Lin, Z.; Yu, Q. Evolution and driving forces of ecosystem pattern in Kubuqi Desert of northern China. J. Beijing For. Univ. 2021, 43, 108–123. [Google Scholar]
- Peng, J.; Naiang, W.; Hongyi, C. A study on the range and area of Ulan Buh Desert based on 3S technology. J. Arid Land Resour. Environ. 2015, 29, 131–138. [Google Scholar]
- Feng, Y.M.; Wu, B.; Zhou, N.; Che, T.T.; Wang, F.; Cong, R.C.; Lu, Q. Gobi Classification system based on remote sensing image recognition. J. Desert Res. 2013, 33, 635–641. [Google Scholar]
- Liu, J.; Nie, H.; Xiao, C.; Shang, B.; Li, W.; Ji, X. Evolution of sandy desertification in North China from 2010 to 2018. Geol. Surv. China 2021, 8, 25–34. [Google Scholar]
- Yang, G.; Sun, X.; Hu, D.; Suo, X.; Shao, M.; Cao, C. The application of GRACE data to the analysis of the temporal and spatial changes of water reserves and the drought characteristics of Qaidam Basin. J. Navig. Position. 2023, 11, 107–112. [Google Scholar]
- Xv, Y.; Liu, B.; Sun, A.; Wang, K.; Li, D.; Zhao, H. Research progress of Holocene environmental evolution in the Gurbantuggut Desert and its surrounding areas. Arid. Land Geogr. 2023, 46, 550–562. [Google Scholar]
- Global Energy Interconnection Development and Cooperation Organization. Research on Global Renewable Energy Development and Investment; China Electric Power Press: Beijing, China, 2020. [Google Scholar]
- Wu, J.; Xiao, J.; Hou, J.; Sun, W.; Li, P.; Lyu, X. A multi-criteria methodology for wind energy resource assessment and development at an intercontinental level: Facing low-carbon energy transition. IET Renew. Power Gener. 2023, 17, 480–494. [Google Scholar] [CrossRef]
- Global Energy Interconnection Development and Cooperation Organization. The Development and Outlook of Clean Energy Power Generation Technology; China Electric Power Press: Beijing, China, 2020. [Google Scholar]
- Niu, D.; Sun, L.; Zhou, Y.; Li, P.; Tian, Z.; Wu, J.; Sun, W. Investment estimation model of medium to large-sized hydropower projects based on GRA-IPSO-BPNN. J. Glob. Energy Interconnect. 2020, 4, 404–411. [Google Scholar]
- Wu, J.; Xiao, J.; Hou, J.; Zhang, J.; Jin, C.; Han, R. Generation Potential and Economy Analysis of Green Hydrogen in China. In Proceedings of the 2022 IEEE 5th International Electrical and Energy Conference (CIEEC), Nanjing, China, 27 May 2022; pp. 4477–4482. [Google Scholar]
- World Meteorological Organization. 2022 State of Climate Services: Energy; World Meteorological Organization: Geneva, Switzerland, 2022. [Google Scholar]
- Wang, J.; Wang, Y.; Yan, C.; Qi, Y. 1:100000 Scale Desert Distribution Mapset of China, Provided by Environmental & Ecological Science Data Center for West China, National Natural Science Foundation of China. Available online: http://westdc.westgis.ac.cn (accessed on 29 August 2022).
- François, B.; Hingray, B.; Raynaud, D.; Borga, M.; Creutin, J.D. Increasing climate-related-energy penetration by integrating run-of-the river hydropower to wind/solar mix. Renew. Energy 2016, 87, 686–696. [Google Scholar] [CrossRef]
- Jin, C.; Xiao, J.; Hou, J.; Jiang, H.; Zhang, J.; Lv, X.; Shi, X. Cross-regional electricity and hydrogen deployment research based on coordinated optimization: Towards carbon neutrality in China. Energy Rep. 2022, 8, 13900–13913. [Google Scholar] [CrossRef]
- Jin, C.; Ren, D.; Xiao, J.; Hou, J.; Du, E.; Zhou, Y. Optimization Planning on Power System Supply-Grid-Storage Flexibility Resource for Supporting the “Carbon Neutrality” Target of China. Electr. Power 2021, 54, 164–174. [Google Scholar]
- Jiang, H.; Du, E.; Jin, C. Optimal planning of multi-time scale energy storage capacity of cross-national interconnected power system with high proportion of clean energy. Proc. CSEE 2021, 41, 2101–2115. [Google Scholar]
- Zhang, N.; Dai, H.; Hu, Z.; Shen, B. A source-gridload coordinated planning model considering system flexibility constraints and demand response. Electr. Power 2019, 52, 61–69. [Google Scholar]
- Xu, T.H.; Lu, Z.X.; Qiao, Y.; An, J. High penetration of renewable energy power planning considering coordination of source-load-storage multi-type flexible resources. J. Glob. Energy Interconnect. 2019, 2, 27–34. [Google Scholar]
- Du, E.; Zhang, N.; Kang, C.; Xia, Q. A high-efficiency network-constrained clustered unit commitment model for power system planning studies. IEEE Trans. Power Syst. 2018, 34, 2498–2508. [Google Scholar] [CrossRef]
Figure 1.
Changes in the installed scale of wind power and photovoltaic power generation in China in the past decade. (a) Wind power generation. (b) Photovoltaic power generation.
Figure 1.
Changes in the installed scale of wind power and photovoltaic power generation in China in the past decade. (a) Wind power generation. (b) Photovoltaic power generation.

Figure 2.
The geographical distribution of nine main desert–Gobi–wilderness areas.
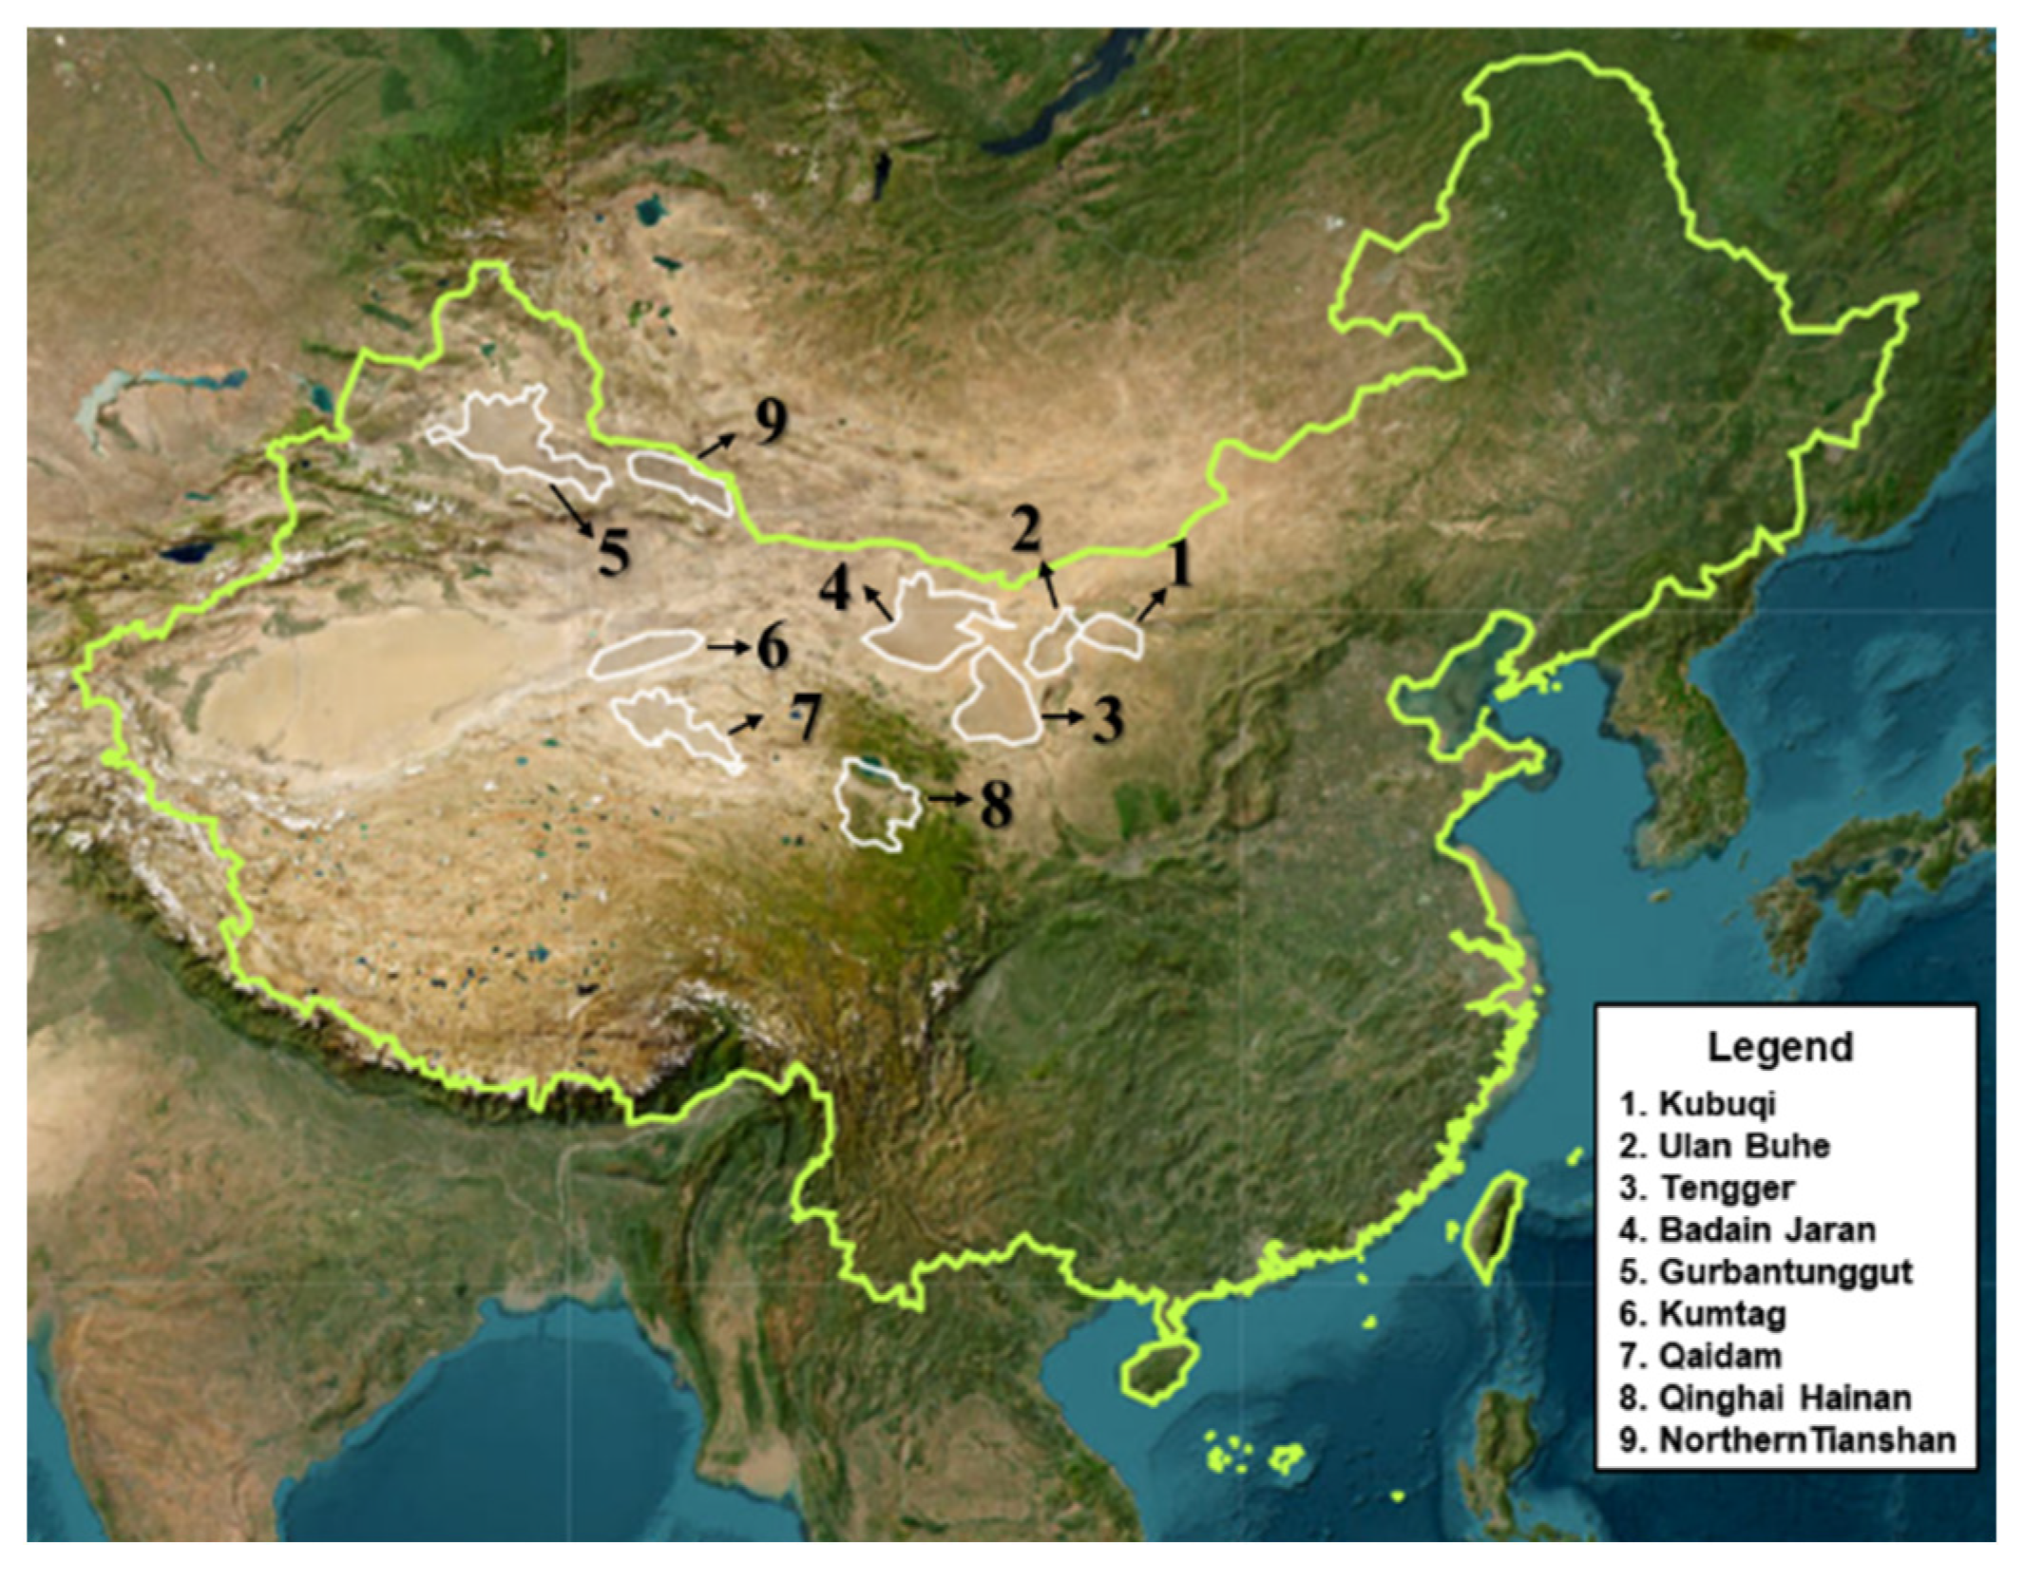
Figure 3.
Distribution of technical available areas for wind power development and full load hours in the nine main desert–gobi–wilderness areas.
Figure 3.
Distribution of technical available areas for wind power development and full load hours in the nine main desert–gobi–wilderness areas.
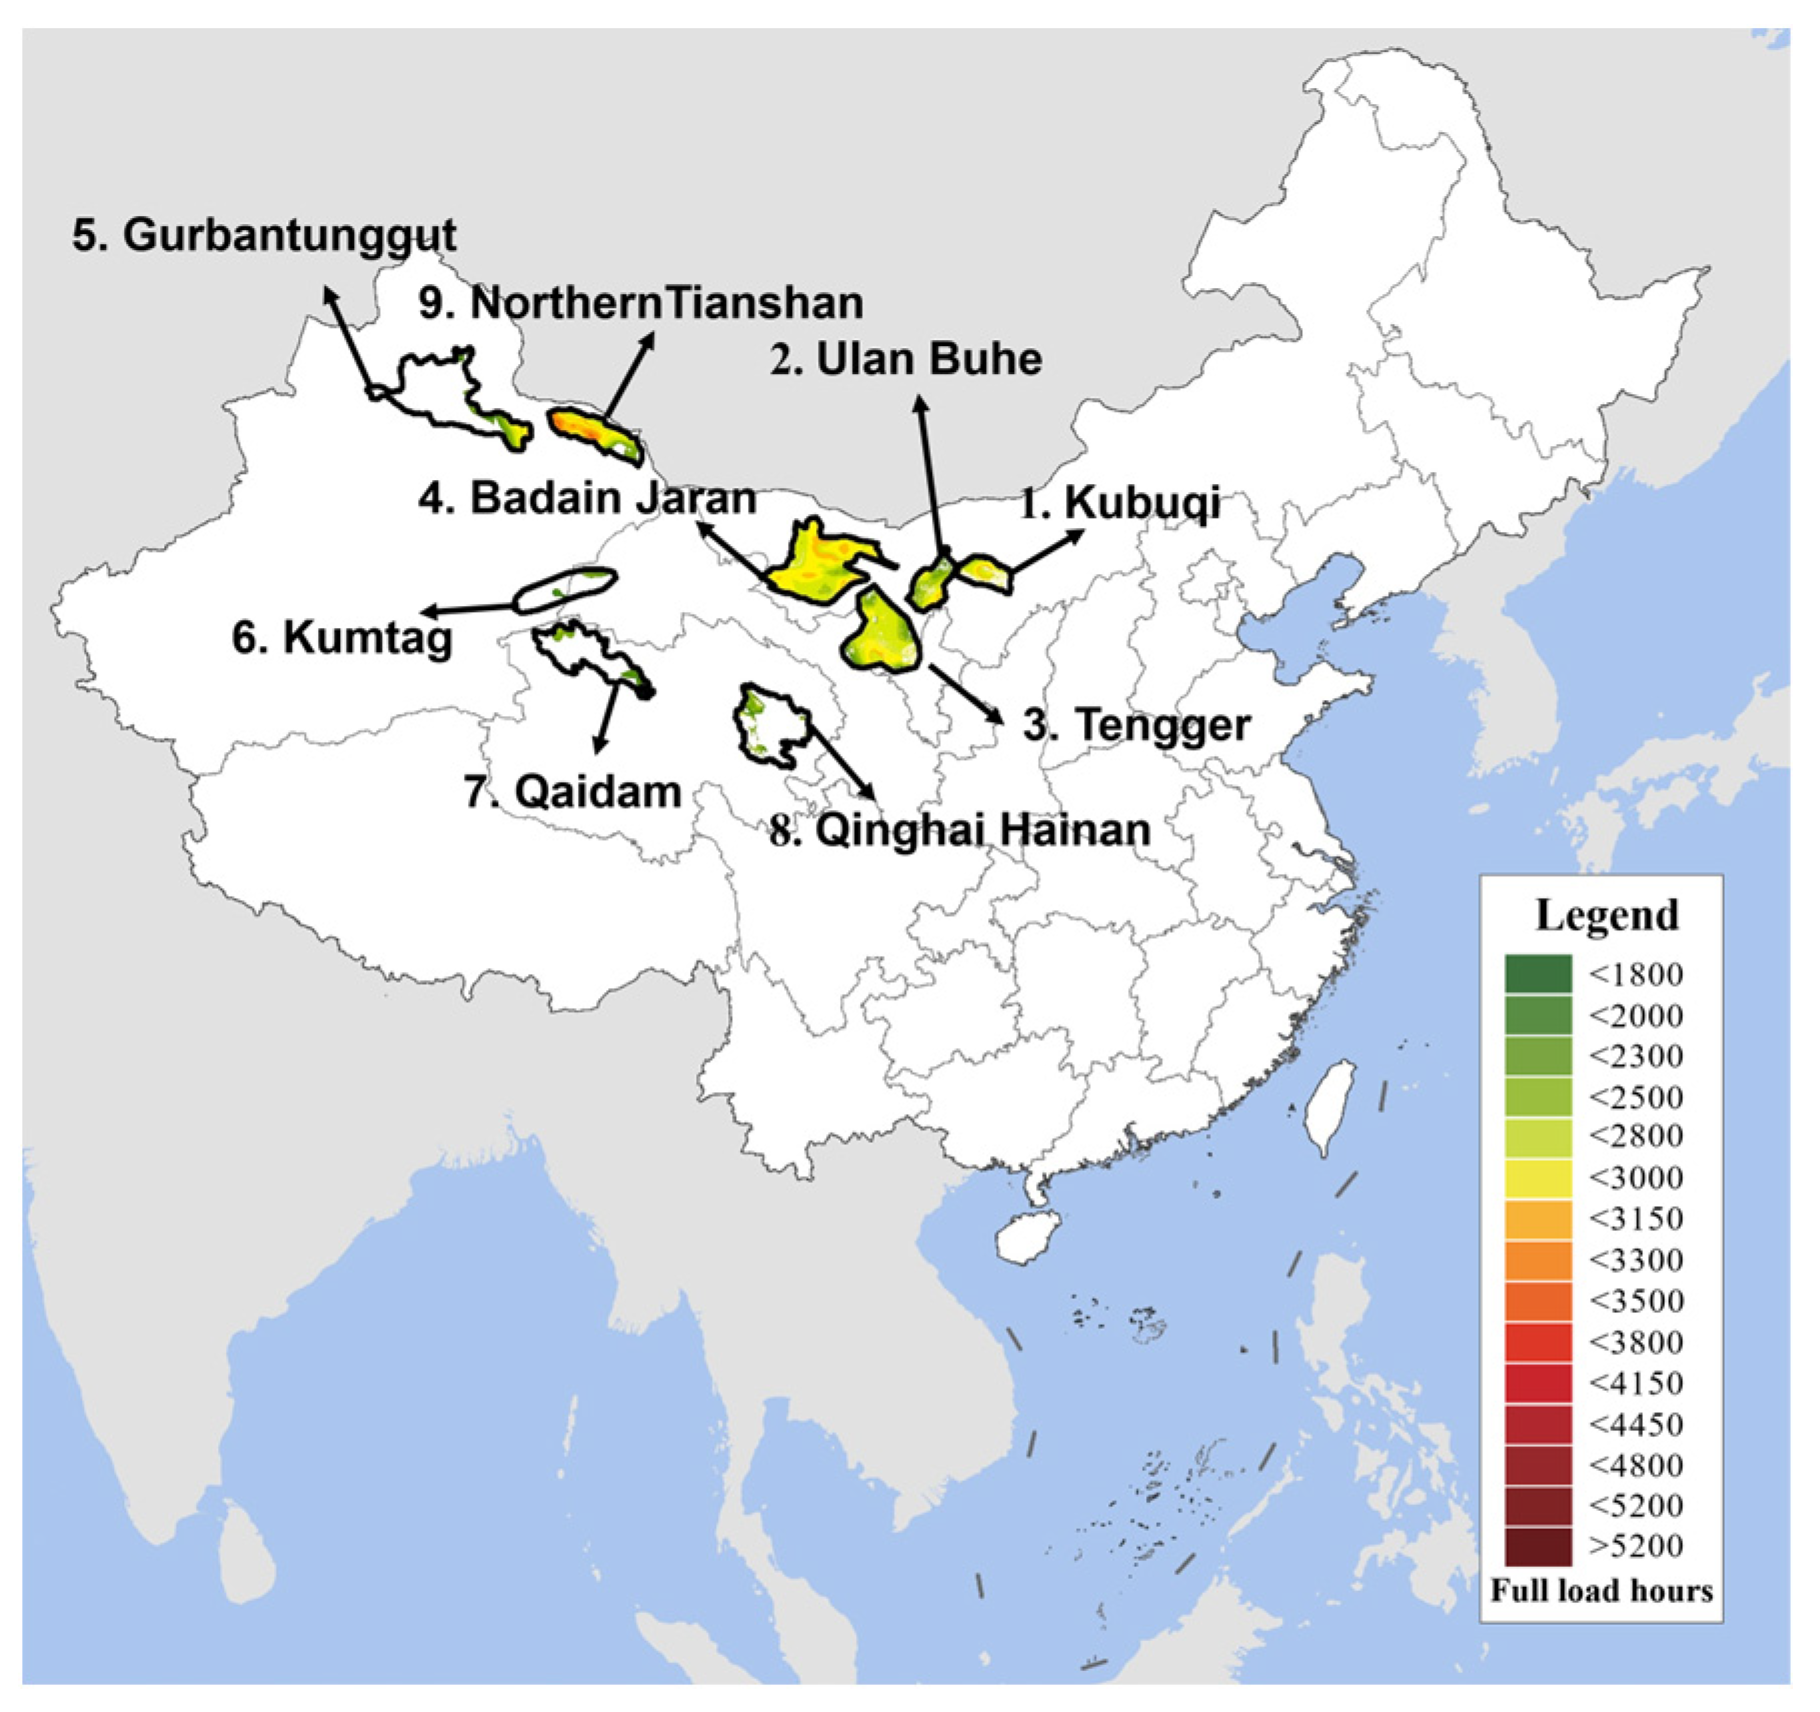
Figure 4.
Distribution of technical available areas for PV power development and full load hours in the nine main desert–Gobi–wilderness areas.
Figure 4.
Distribution of technical available areas for PV power development and full load hours in the nine main desert–Gobi–wilderness areas.
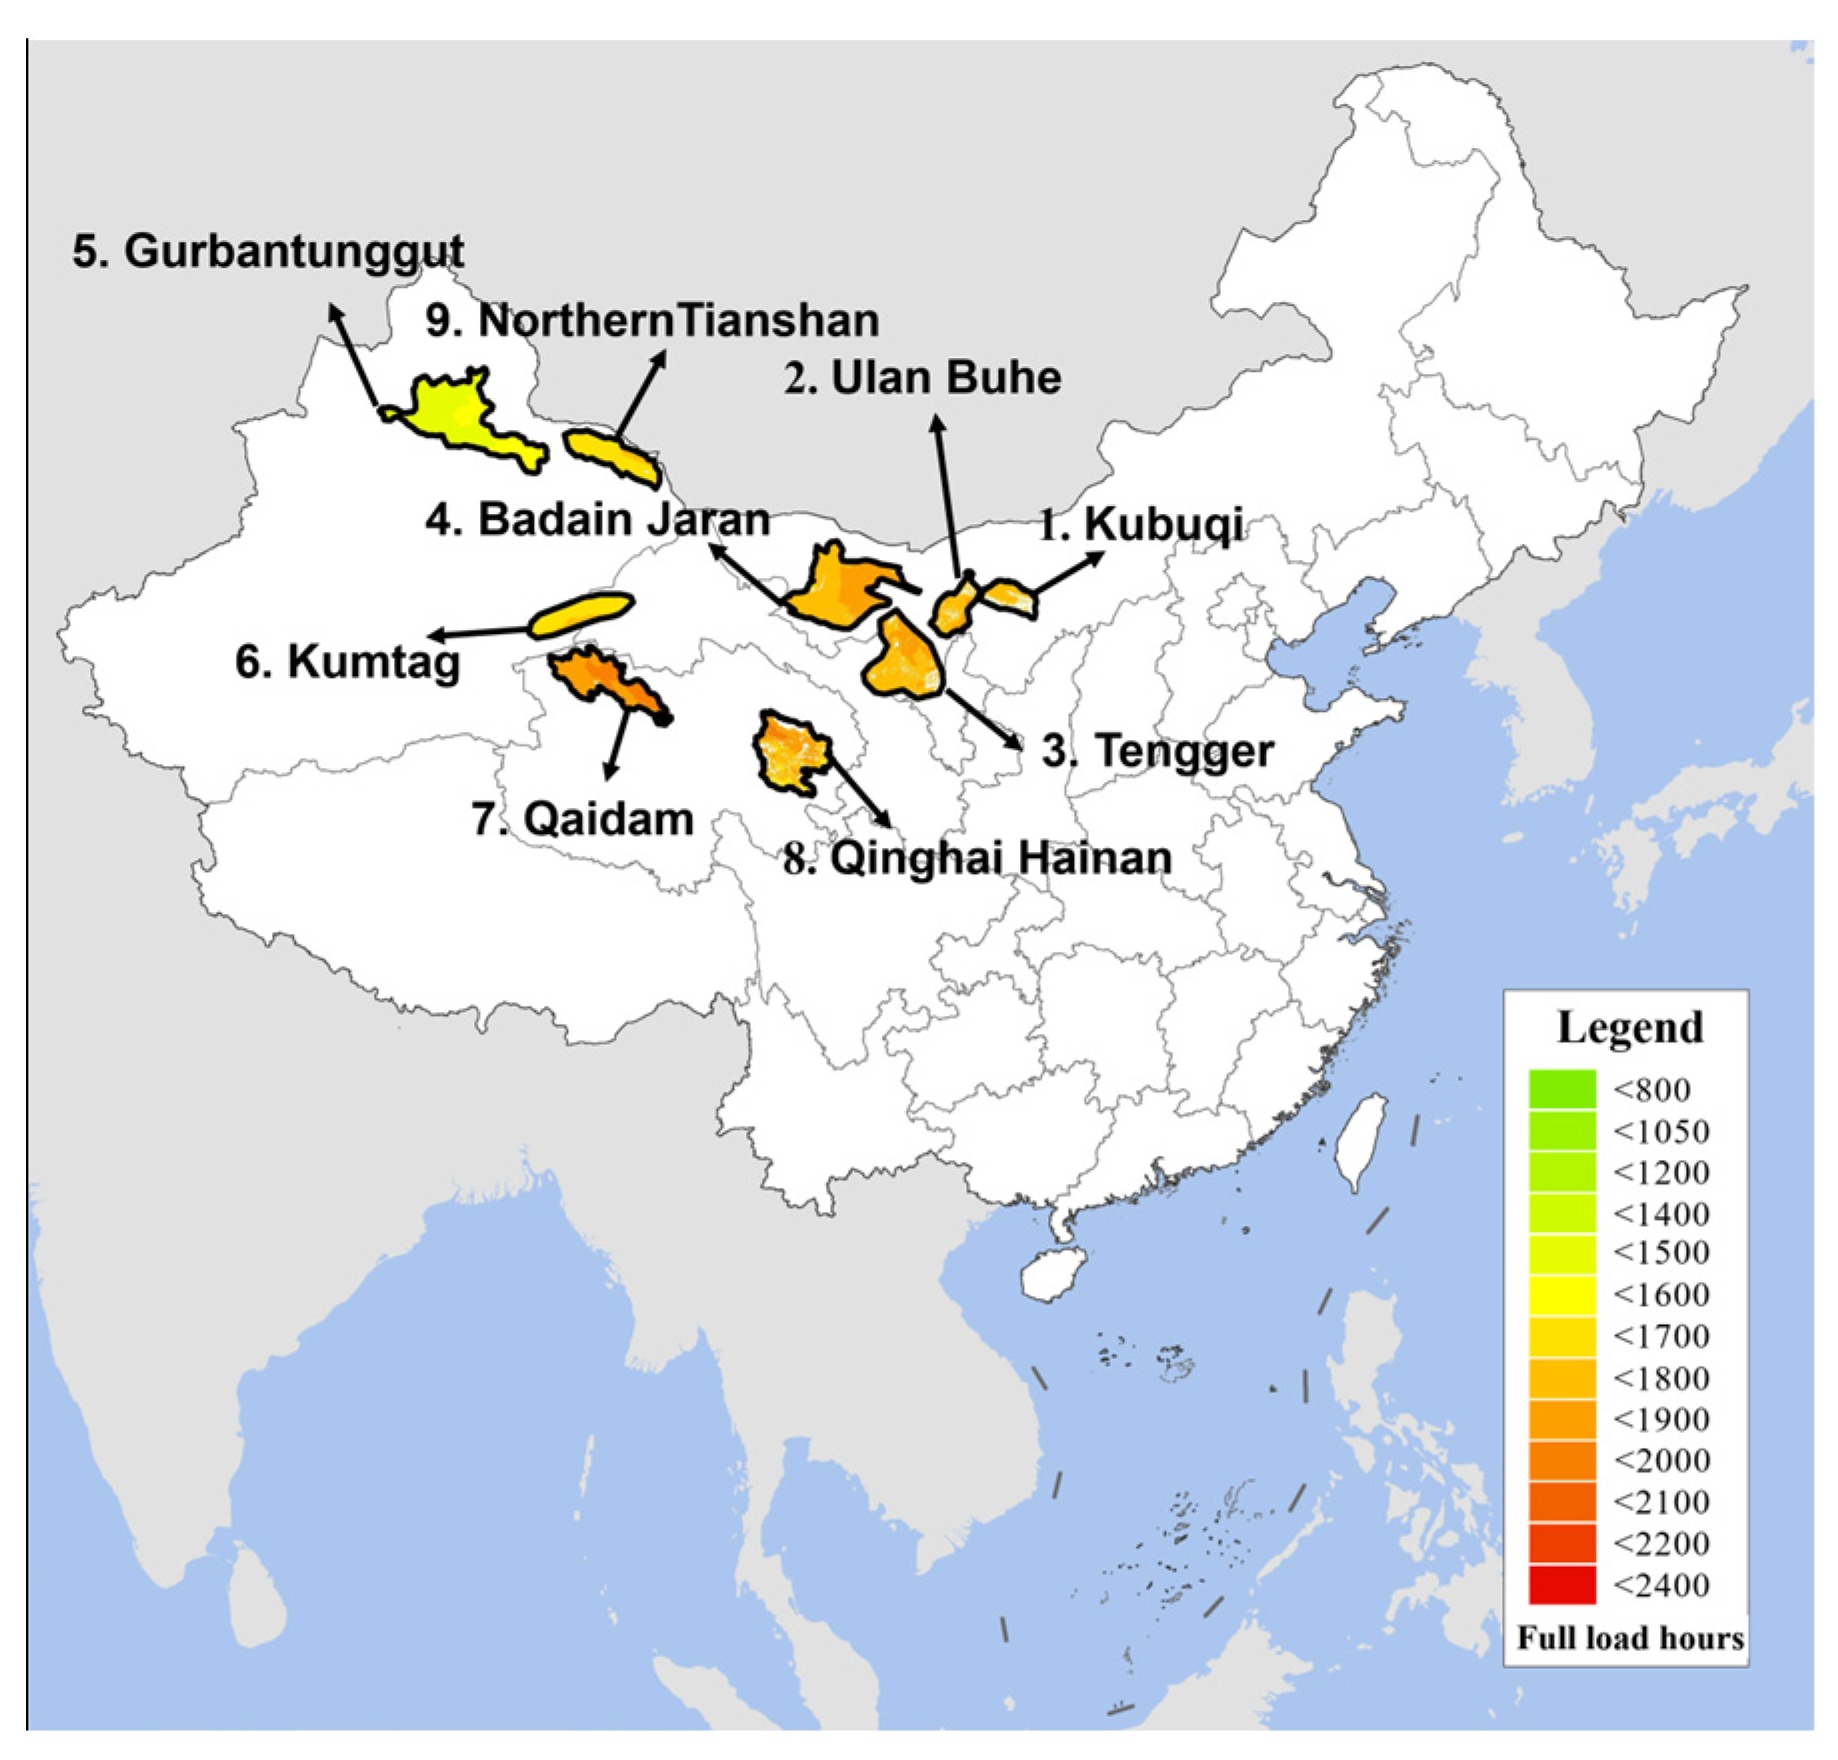
Figure 5.
Wind power endowment analysis in the Kubuqi Desert. (a) Wind speed. (b) Probability histogram of wind speed. (c) LCOE distribution in the priority development areas with 20 km distance threshold.
Figure 5.
Wind power endowment analysis in the Kubuqi Desert. (a) Wind speed. (b) Probability histogram of wind speed. (c) LCOE distribution in the priority development areas with 20 km distance threshold.

Figure 6.
PV power endowment analysis in the Qaidam Desert. (a) GHI. (b) Histogram of average daily GHI. (c) LCOE distribution in the priority development areas with 20 km distance threshold.
Figure 6.
PV power endowment analysis in the Qaidam Desert. (a) GHI. (b) Histogram of average daily GHI. (c) LCOE distribution in the priority development areas with 20 km distance threshold.
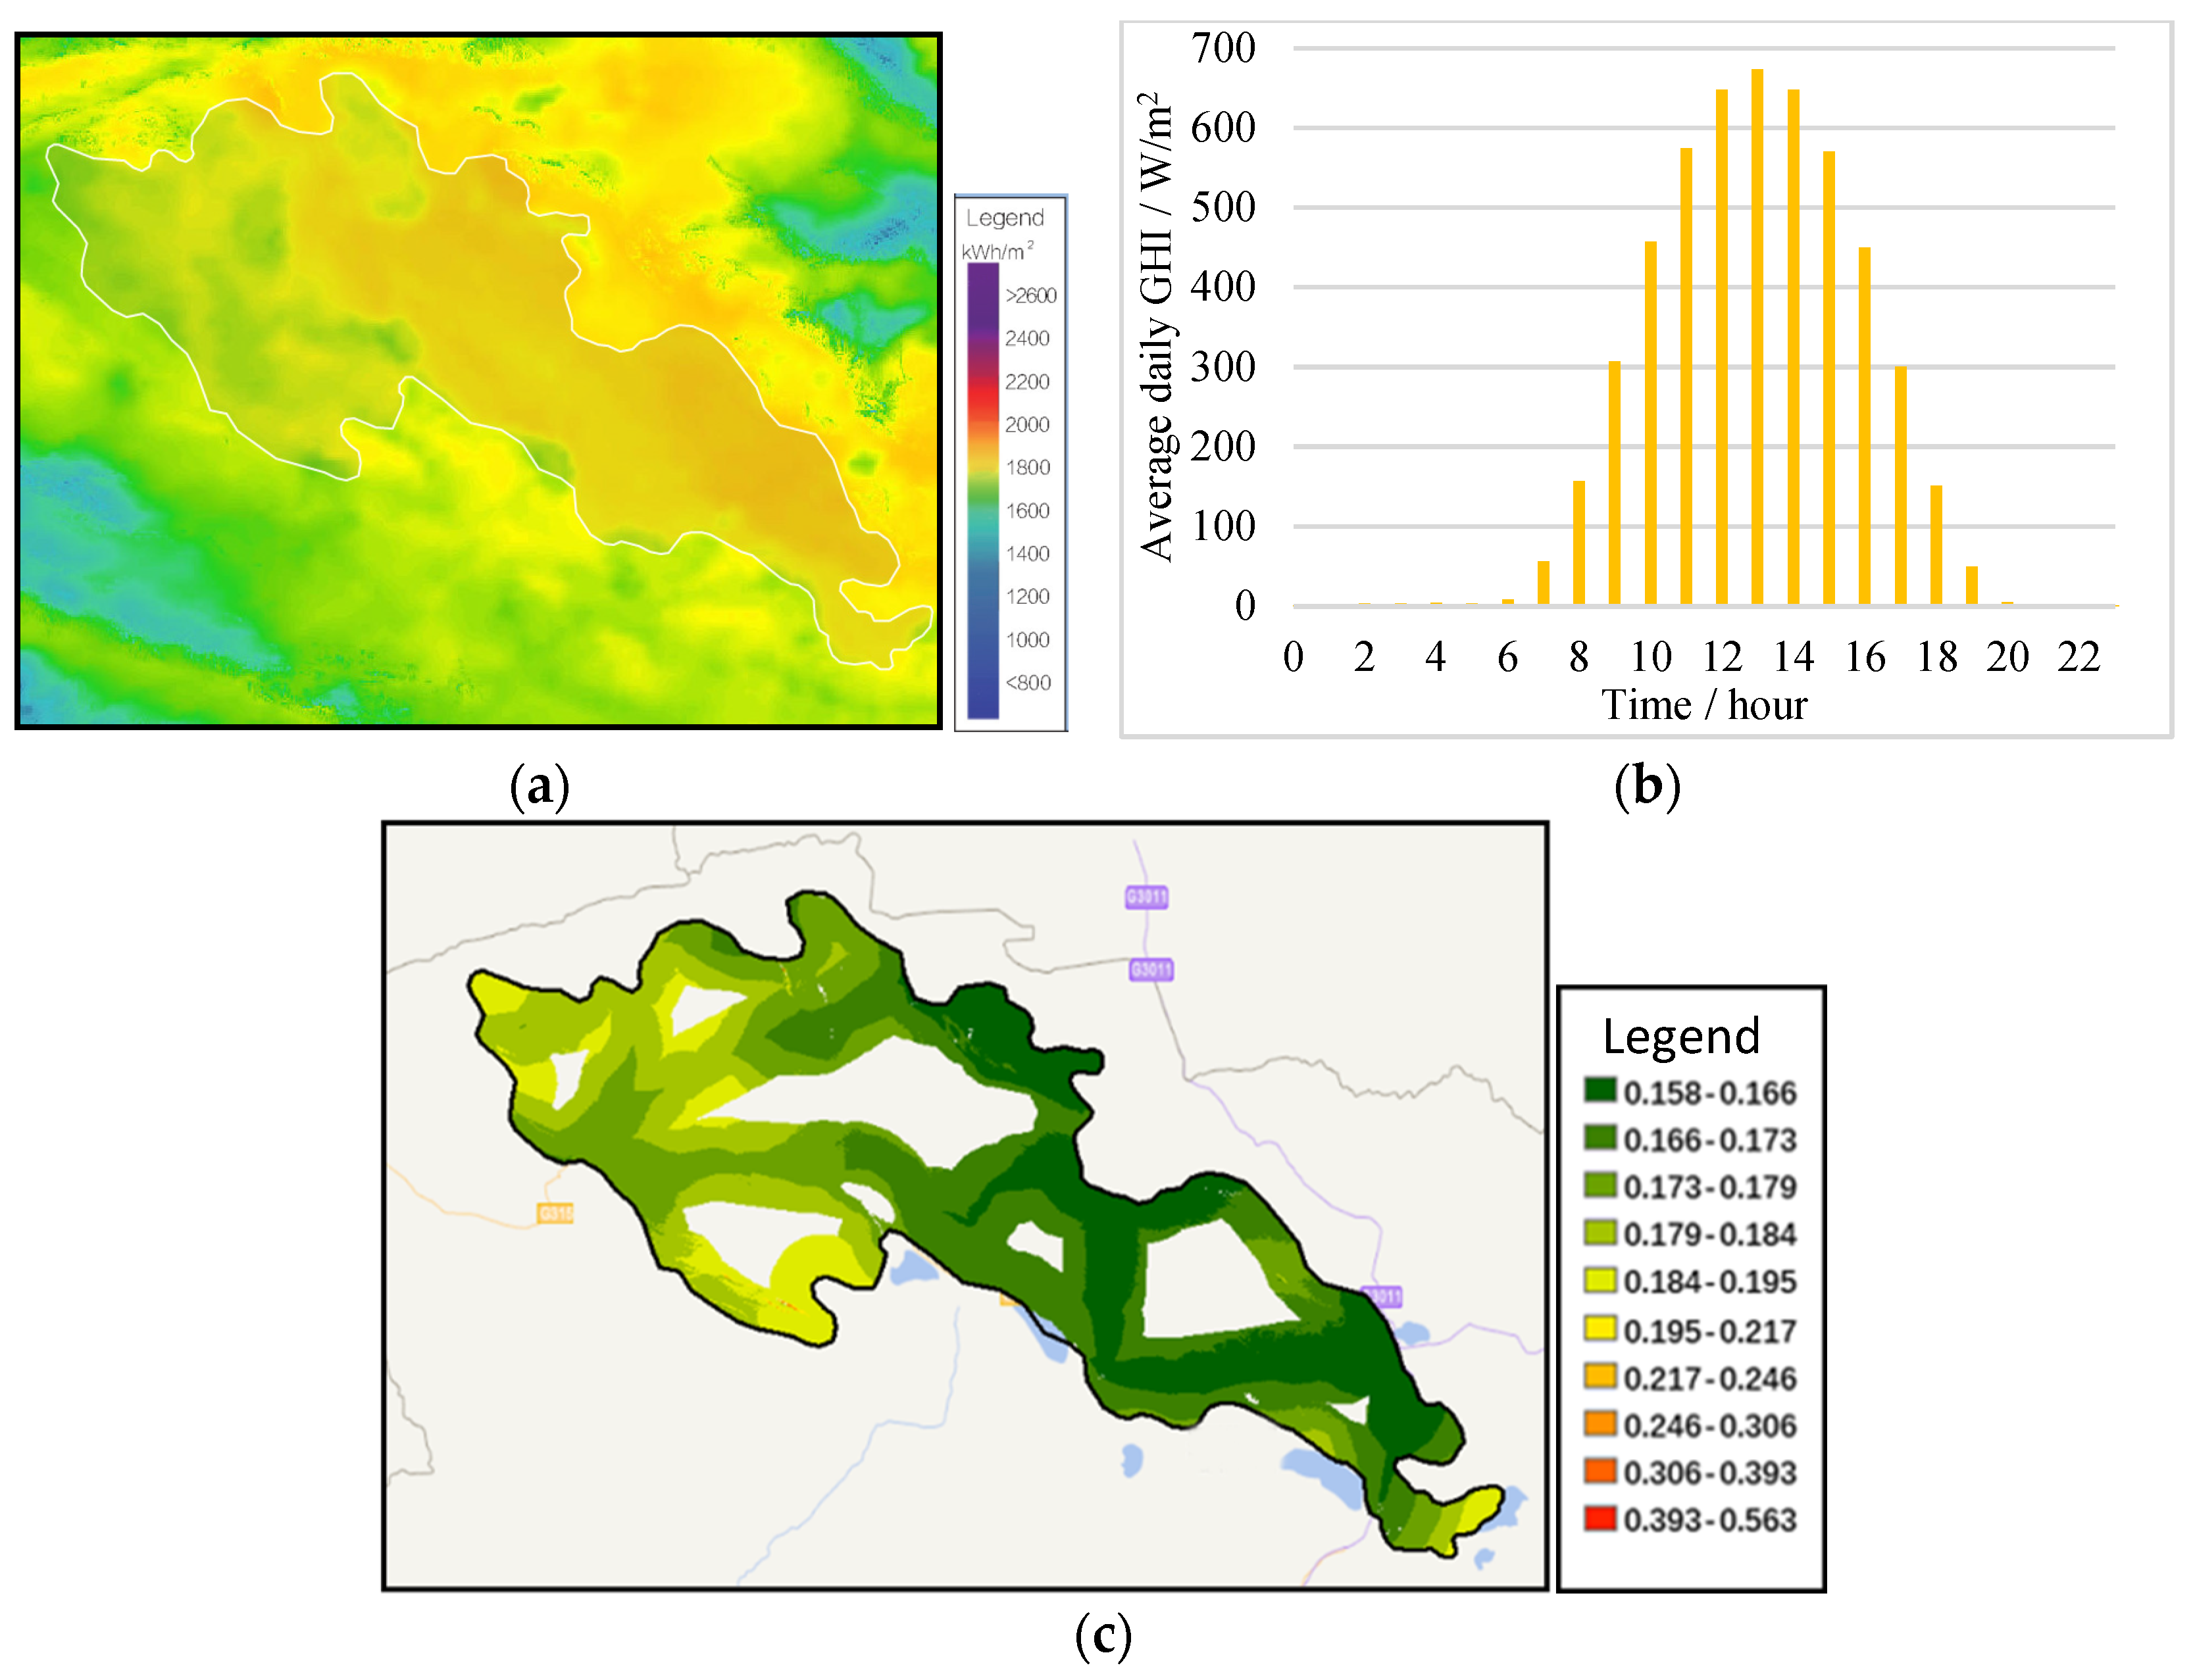
Figure 7.
Land cover distribution in typical deserts.
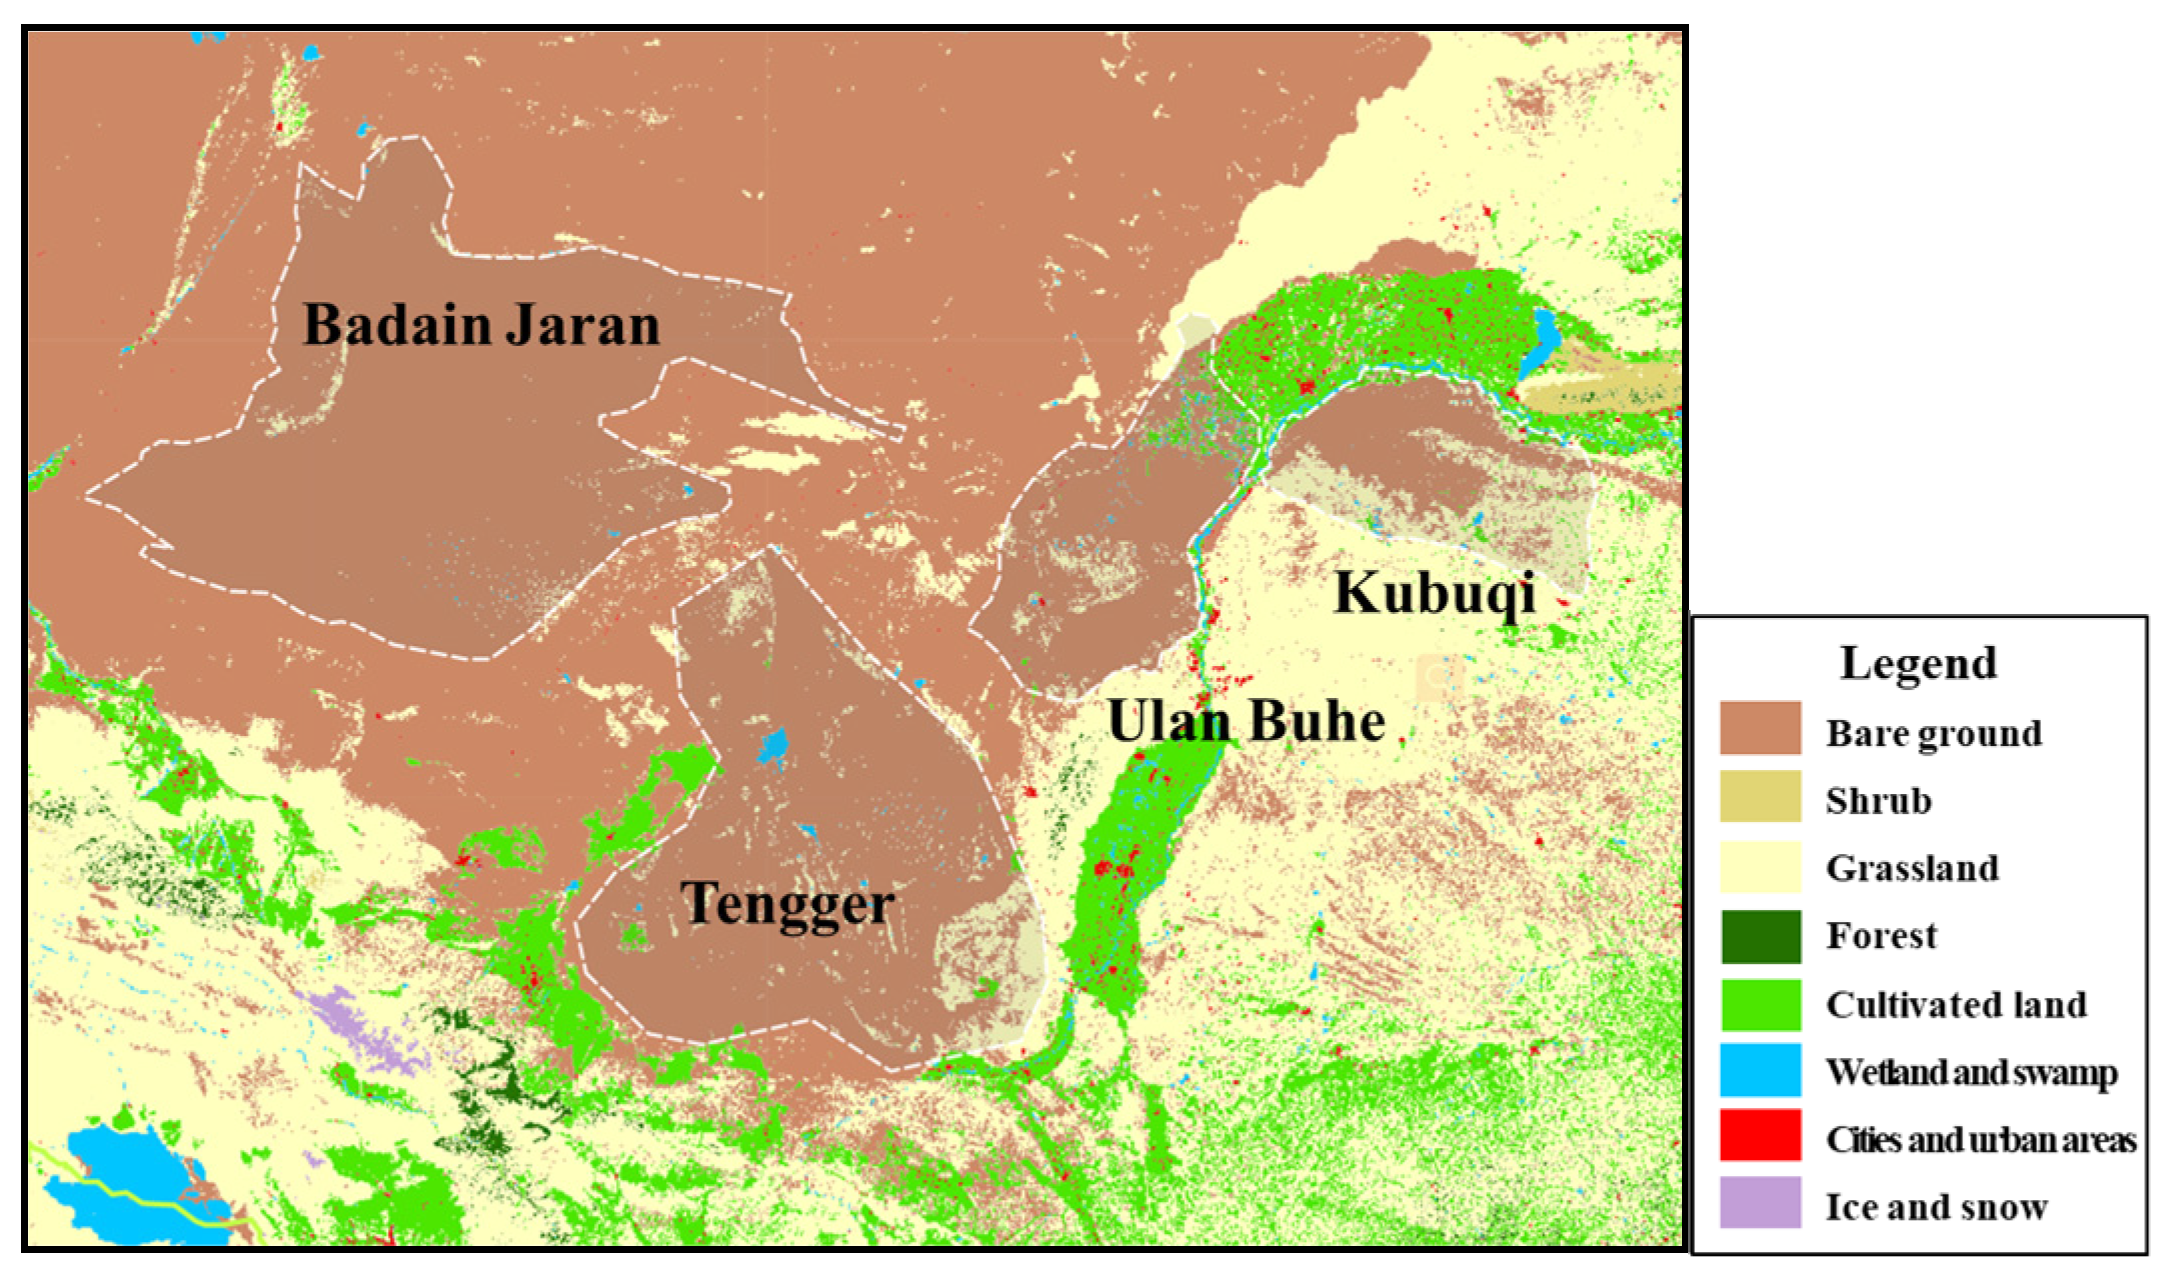
Figure 8.
Distribution of power grid and transportation infrastructure in the Kubuqi Desert and sur-rounding areas.
Figure 8.
Distribution of power grid and transportation infrastructure in the Kubuqi Desert and sur-rounding areas.

Figure 10.
Distribution of meteorological–electrical divisions of China’s wind and PV resources. (a) Wind resource meteorological–electrical divisions in China. (b) PV power resource meteorological–electrical divisions in China. (c) Four typical monthly wind power output curves. (d) Three typical monthly PV power output curves.

Figure 11.
Typical weekly power balance results of plan 1 and plan 2. (a) Plan 1: 13 GW wind and 28 GW PV power in Kubuqi. (b) Plan 2: 6 GW wind in Qaidam, and 7.2 GW wind and 28.3 GW PV in Kubuqi.
Figure 11.
Typical weekly power balance results of plan 1 and plan 2. (a) Plan 1: 13 GW wind and 28 GW PV power in Kubuqi. (b) Plan 2: 6 GW wind in Qaidam, and 7.2 GW wind and 28.3 GW PV in Kubuqi.
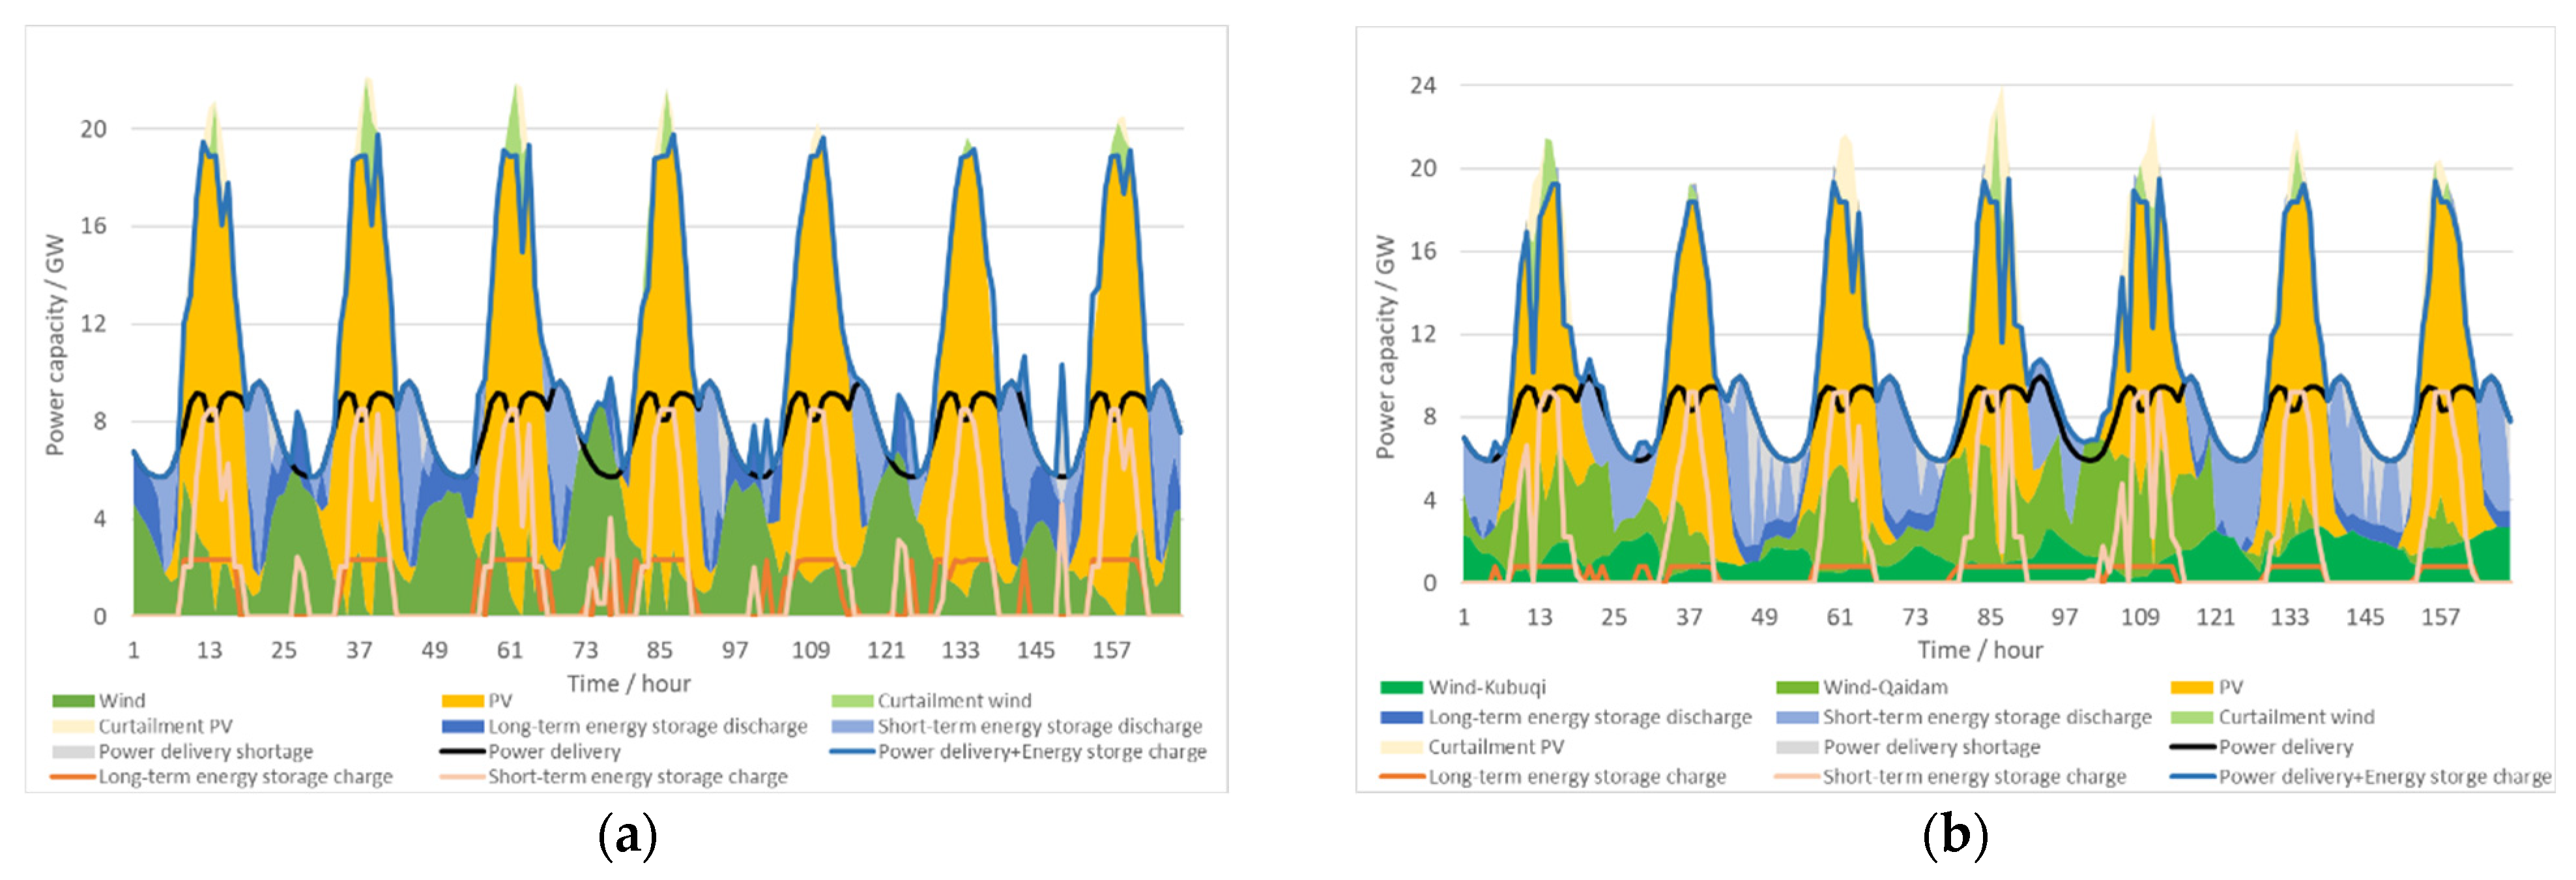
Figure 12.
Annual power balance results of plan 1 and plan 2. (a) Plan 1: 13 GW wind and 28 GW PV power in Kubuqi. (b) Plan 2: 6 GW wind in Qaidam and 7.2 GW wind and 28.3 GW PV in Kubuqi.
Figure 12.
Annual power balance results of plan 1 and plan 2. (a) Plan 1: 13 GW wind and 28 GW PV power in Kubuqi. (b) Plan 2: 6 GW wind in Qaidam and 7.2 GW wind and 28.3 GW PV in Kubuqi.

Table 1.
Main indicators and recommended parameters used in wind and PV resource assessment model of technical potential installed capacity in desert–Gobi–wilderness areas.
Table 1.
Main indicators and recommended parameters used in wind and PV resource assessment model of technical potential installed capacity in desert–Gobi–wilderness areas.
| Type | Restriction | Threshold Value | Land Use Coefficients η | |
|---|---|---|---|---|
| Wind | PV | |||
| Resource restrictions | Annual average wind speed | >5 m/s | - | - |
| Global horizontal irradiance | >1000 kWh/m2 | - | - | |
| Technical development restrictions | Wind land elevation | <4000 m | - | - |
| PV land elevation | <4500 m | |||
| Conservation area restrictions | Natural ecosystem | Unsuitable | 0% | 0% |
| Wildlife | Unsuitable | 0% | 0% | |
| Natural relics | Unsuitable | 0% | 0% | |
| Natural resources | Unsuitable | 0% | 0% | |
| Others | Unsuitable | 0% | 0% | |
| Land cover restrictions | Bare ground | Suitable | 100% | 100% |
| Shrub | Suitable | 100% | 100% | |
| Grassland | Unsuitable | 0% | 0% | |
| Forest | Unsuitable | 0% | 0% | |
| Cultivated land | Unsuitable | 0% | 0% | |
| Wetland and swamp | Unsuitable | 0% | 0% | |
| Cities and urban areas | Unsuitable | 0% | 0% | |
| Ice and snow | Unsuitable | 0% | 0% | |
| GIS Slope | - | >30° | 0% | 0% |
Table 2.
Main investment parameters for wind and PV resource assessment in desert–Gobi–wilderness areas.
Table 2.
Main investment parameters for wind and PV resource assessment in desert–Gobi–wilderness areas.
| Number | Investment Composition for Wind Resources | Total Cost (CNY/kW) | Investment Composition for PV Resources | Total Cost (CNY/kW) |
|---|---|---|---|---|
| 1 | Equipment and installation cost | 4144 | Equipment and installation cost | 3087 |
| 1.1 | Generator and blade | 2912 | PV module | 1400 |
| 1.2 | Tower | 525 | Support bracket | 357 |
| 1.3 | Installation | 182 | Installation | 749 |
| 1.4 | Others | 525 | other | 581 |
| 2 | Construction and others | 1393 | Construction and others | 161 |
| 2.1 | Foundation and other buildings | 665 | Management costs | 14 |
| 2.2 | Management costs | 161 | Design fee | 35 |
| 2.3 | Others | 567 | Others | 112 |
| Total | 5537 | Total | 3248 | |
Table 3.
Main financial parameters for development cost study of wind and PV resources in desert–Gobi–wilderness areas.
Table 3.
Main financial parameters for development cost study of wind and PV resources in desert–Gobi–wilderness areas.
| Number | Financial Parameters | Wind | PV |
|---|---|---|---|
| 1 | Loan term | 7 years | 7 years |
| 2 | Loan proportion | 70% | 70% |
| 3 | Loan rate | 3% | 3% |
| 4 | Construction period | 1 year | 1 year |
| 5 | Service life | 20 years | 20 years |
| 6 | Residual value proportion | 0% | 0% |
| 7 | Operation and maintenance proportion | 3.5% | 1.5% |
Table 4.
Wind development potential assessment results in the nine main desert–Gobi–wilderness areas.
Table 4.
Wind development potential assessment results in the nine main desert–Gobi–wilderness areas.
| Name | Total Area (km2) | Wind Speed (m/s) | Technical Installed Capacity (GW) | Priority Development with Distance of 5 km | LCOE (CNY/kWh) | |||
|---|---|---|---|---|---|---|---|---|
| Development Area (km2) | Development Potential (MW) | Full Load Hours | ||||||
| 1 | Kubuqi | 12,518 | 6.4 | 31.3 | 1404 | 6808 | 2428 | 0.26 |
| 2 | Ulan Buh | 15,525 | 6.04 | 58.5 | 3666 | 16,615 | 2487 | 0.27 |
| 3 | Tengger | 42,678 | 6.2 | 164.2 | 3066 | 14,380 | 2426 | 0.28 |
| 4 | Badain Jaran | 51,614 | 6.48 | 170.1 | 6657 | 29,031 | 2760 | 0.28 |
| 5 | Gurbantunggut | 50,536 | 4.84 | 45.0 | 2336 | 10,784 | 2274 | 0.3 |
| 6 | Kumtag | 22,688 | 4.99 | 11.3 | 519 | 2060 | 2230 | 0.34 |
| 7 | Qaidam | 35,007 | 5.25 | 27.5 | 2400 | 10,216 | 2051 | 0.34 |
| 8 | Qinghai Hainan | 43,559 | 5.38 | 15.2 | 2196 | 6540 | 2049 | 0.33 |
| 9 | Northern Tianshan | 20,308 | 6.42 | 80.6 | 4361 | 19,078 | 2824 | 0.25 |
| Total | 294,433 | 5.7 | 603.6 | 26,605 | 1,155,112 | 2513 | 0.28 | |
Table 5.
PV development potential assessment results in the nine main desert–Gobi–wilderness areas.
| Name | GHI (kWh/km2) | Technical Installed Capacity (GW) | Priority Development with Distance of 5 km | LCOE (CNY/kWh) | |||
|---|---|---|---|---|---|---|---|
| Development Area (km2) | Development Potential (MW) | Full Load Hours | |||||
| 1 | Kubuqi | 1711 | 280 | 1404 | 8630 | 1770 | 0.19 |
| 2 | Ulan Buh | 1739 | 548 | 2129 | 90,850 | 1781 | 0.19 |
| 3 | Tengger | 1730 | 1690 | 1038 | 47,530 | 1783 | 0.20 |
| 4 | Badain Jaran | 1760 | 1930 | 2593 | 102,870 | 1793 | 0.22 |
| 5 | Gurbantunggut | 1463 | 1550 | 8442 | 83,700 | 1491 | 0.24 |
| 6 | Kumtag | 1679 | 900 | 1313 | 51,990 | 1691 | 0.24 |
| 7 | Qaidam | 1821 | 1670 | 4307 | 210,520 | 1876 | 0.18 |
| 8 | Qinghai Hainan | 1672 | 1520 | 10,104 | 445,440 | 1801 | 0.19 |
| 9 | Northern Tianshan | 1637 | 642 | 4797 | 148,510 | 1674 | 0.22 |
| Total | 1677 | 10,730 | 36126 | 1,190,040 | 1759 | 0.20 | |
Table 6.
Calculation results of the wind and PV collaborative development plans across meteorological–electrical divisions.
Table 6.
Calculation results of the wind and PV collaborative development plans across meteorological–electrical divisions.
| Collaborative Development Plans | Plan 1: Wind and PV in Kubuqi, with Energy Storage (4 h, 90% Efficiency) | Plan 2: Wind and PV in Kubuqi, Wind in Qaidam, with Energy Storage (4 h, 90% Efficiency) | ||
|---|---|---|---|---|
| Technical indicators | Transmission scale (MW) | 10,000 | 10,000 | |
| Transmission full load hours | 6000 | 6000 | ||
| Guarantee rate | 95% | 95% | ||
| Curtailment rate | 10% | 10% | ||
| Capacity (GW) | Renewable energy | 13 GW wind and 28 GW PV in Kubuqi | 6 GW wind in Qaidam and 7.2 GW wind and 28.3 GW PV in Kubuqi | |
| Energy storage capacity | Short term | 8.5 | 9 | |
| Long term | 1.815 | 0.755 | ||
| Cost and full load hour | LCOE (CNY/kWh) | 0.488 | 0.445 | |
| Energy storage cost (CNY/kWh) | 0.669 | 0.590 | ||
| Energy storage hours | Short term | 1057 | 994 | |
| Long term | 3849 | 3898 | ||
| Annual cost of wind and PV power (billion CNY) | 14.95 | 15.08 | ||
| Annual cost of energy storage equipment (billion CNY) | 12.60 | 8.81 | ||
Disclaimer/Publisher’s Note: The statements, opinions and data contained in all publications are solely those of the individual author(s) and contributor(s) and not of MDPI and/or the editor(s). MDPI and/or the editor(s) disclaim responsibility for any injury to people or property resulting from any ideas, methods, instructions or products referred to in the content. |
© 2023 by the authors. Licensee MDPI, Basel, Switzerland. This article is an open access article distributed under the terms and conditions of the Creative Commons Attribution (CC BY) license (https://creativecommons.org/licenses/by/4.0/).
Share and Cite
MDPI and ACS Style
Wu, J.; Xiao, J.; Hou, J.; Lyu, X. Development Potential Assessment for Wind and Photovoltaic Power Energy Resources in the Main Desert–Gobi–Wilderness Areas of China. Energies 2023, 16, 4559. https://doi.org/10.3390/en16124559
AMA Style
Wu J, Xiao J, Hou J, Lyu X. Development Potential Assessment for Wind and Photovoltaic Power Energy Resources in the Main Desert–Gobi–Wilderness Areas of China. Energies. 2023; 16(12):4559. https://doi.org/10.3390/en16124559
Chicago/Turabian StyleWu, Jiawei, Jinyu Xiao, Jinming Hou, and Xunyan Lyu. 2023. "Development Potential Assessment for Wind and Photovoltaic Power Energy Resources in the Main Desert–Gobi–Wilderness Areas of China" Energies 16, no. 12: 4559. https://doi.org/10.3390/en16124559
Note that from the first issue of 2016, this journal uses article numbers instead of page numbers. See further details here.