Article

Reconfiguration of Distribution Networks with Simultaneous Allocation of Distributed Generation Using the Whale Optimization Algorithm

1
Department of Electrical Engineering, São Paulo State University, Brasil Avenue, Ilha Solteira 15385-000, Brazil
2
Department of Engineering, São Paulo State University, Barrageiros Avenue, Rosana 19274-000, Brazil
*
Author to whom correspondence should be addressed.
Energies 2023, 16(12), 4560; https://doi.org/10.3390/en16124560
Submission received: 4 May 2023 / Revised: 24 May 2023 / Accepted: 29 May 2023 / Published: 7 June 2023
(This article belongs to the Special Issue Sizing and Allocation Strategies of Renewable Distributed Generations)

Abstract

:
The economic interest in power loss minimization and regulatory requirements regarding voltage levels in distribution systems are considered. In this paper, a computational technique to assist in the optimization of the power losses and voltage characteristic in the steady state through distribution network reconfiguration and the location and size of the distributed generators is addressed. The whale optimization algorithm (WOA) is chosen to perform this task since it can explore the sizeable combinatorial search space of the problem, which is also nonlinear and nonconvex. The purpose of this study is to mitigate power losses; voltage ranges are borne in mind as the problem restrictions. The proposals for solving the issue are evaluated using a specialized power flow algorithm. The algorithm is implemented in MATLAB and the 33-bus and 69-bus grids are employed to assess the performance of the approach. The results indicate that the WOA method outperforms regarding power loss reduction and voltage characteristic improvement in the concurrent integration of distribution network reconfiguration and distributed generators compared with the four metaheuristics shown in the results section.

1. Introduction

Sectionalizing switches and tie switches are used in radiality distribution systems to isolate faults, recover the power supply, and reconfigure the network. Distribution network reconfiguration (DNR) aims to acquire the finest system performance mode to mitigate power losses, balance load, ameliorate voltage characteristics, and enhance network reliability, which the mentioned switches make possible while all network constraints are satisfied.
The penetration of distributed generators (DGs) in distribution systems is increasing because of energy market liberalization, environmental concerns, and expansion of technology. The installation of DGs leads to a decrease in active power losses, an improvement in voltage profile, an increase in reliability, and a total yield of power delivery. However, suppose the optimum placement and capacity of DG resources are not chosen correctly, in that case, the network performance will decrease, the network will become unstable, the power losses will increase, and the voltage levels will be higher than the operational standards. Therefore, in the distribution system, decreasing power losses and improving the voltage curve are the basic principles that can be solved by performing DNR and allocating DGs optimally.
The problem of DNR has an essential role in distribution network performance that has been widely perused. The network parameters are required in traditional model-based methods to derive the optimal distribution network configuration. DGs are small electrical energy sources built with different capacities of up to 10 megawatts, in which the primary energy source is renewable or nonrenewable, and they are coupled to the distribution network directly or at the place of consumption. If integrated into the network, their effect will be more significant in the distribution network. Many studies on reconfiguration and allocation of DGs concentrate on various aspects of the problem.
The authors of [1] propose an adaptive cuckoo search algorithm (ACSA) to simultaneously reconfigure the system and determine the location and size of DGs to minimize the active power losses and increase the voltage stability. The state space of each tie switch is found by graph theory to mitigate the infeasible system topologies in each step of the optimizing procedure. According to the obtained results, the proposed method performs better than other methods regarding the power loss reduction and voltage profile improvement. In [2], a uniform voltage distribution-based constructive reconfiguration algorithm (UVDA) is presented to mitigate the power losses and improve the voltage curve through system reconfiguration with concurrent DG location and size. The acquired outcomes show that the suggested algorithm is able to quickly discover the optimum solution in large distribution networks. Ref. [3] investigates a modified plant growth simulation algorithm (MPGSA) to decrease power losses and improve voltage characteristics. The proposed approach simultaneously analyzes the reconfiguration and allocation of DG. This method guides the sequential search while altering the objective function and converges quickly. In [4], the paper develops the issue of system reconfiguration and DG location. A stochastic fractal search (SFS) method is employed to mitigate power losses and improve voltage curve. This strategy finds the optimal solution with fast convergence and high quality and is applicable for large distribution systems. Ref. [5] presents an approach that simultaneously emphasizes the optimal location and capacity of capacitor banks, DGs, and reconfiguration of the radial distribution networks. The proposed algorithm is the first utilization of the suggested quasi-reflection-based slime mold algorithm (QRS-MA), tested in three networks. The purposes of the paper are to optimize the power losses, cumulative voltage deviation, index of reliability, and total cost of network. The paper introduces a power flow that is effectively improved to determine a solution without consecutive bus numbering of the radiality distribution grid. The proposed strategy outperforms in terms of convergence curve compared with other strategies and obtains better results.
Furthermore, the authors of [6] present a new strategy that enhances voltage stability, minimizes power losses, increases maximum network loading, and maintains the acceptable voltage characteristic of radiality distribution networks through the optimal placement of DGs, DNR, and PVQ bus voltage control considering the supply of variable reactive power at the P bus. Thus, a multi-objective function is defined. The suggested algorithm is the gray wolf optimization (GWO) technique. Ref. [7] simultaneously deals with the reconfigurable system and the placement and capacity of distributed energy resources in radiality grids by considering a state-of-the-art quasi-oppositional chaotic neural network algorithm (QOCNNA). It aims to mitigate active power losses and stabilize the voltage in distribution systems such as 33-bus, 69-bus, and 118-bus grids. The proposed methodology can find good quality solutions with quick convergence and small standard deviation and also provides good coordination between exploration and exploitation. Ref. [8] develops an enhanced marine predators algorithm (EMPA) to reconfigure the distribution network and allocate DGs simultaneously. EMPA manages a multi-objective pattern for power loss reduction and the index enhancement of the voltage stability at various loading levels. The tests are conducted using three networks. The authors of [9] propose a reconfigurable distribution network procedure combined with DGs, which includes protective devices. The study optimally reconfigures the system and calculates the DG capacity to minimize power losses and guarantee proper operation of protection devices under conditions of normality and fault. The 33-bus, 69-bus, and 118-bus grids are tested by the firefly algorithm (FA) and an evolutionary programming (EP) method. The conclusion that can be drawn is that the FA outperforms the EP as an optimizing implement to acquire the optimum result in this suggested approach.
Ref. [10] presents a novel design to rearrange the configuration and determine the placement and capacity of DGs in the distribution grids with regard to minimizing system losses and ameliorating power quality through the novel antlion optimizer. As a result, the suggested method improves the power quality indicators and reduces the power losses in the studied networks. Ref. [11] solves the problem of minimizing the technical losses through distribution network reconfiguration and renewable distributed generations with regard to fault limits. A modern random mixed-integer second-order cone programming scheme is suggested based on scenario, which leads to the distribution system operation with radial and closed-loop configurations. The proposed method provides robust and good-quality solutions and can also maintain system short-circuit currents within allowable limits and protection system coordination and meet equipment isolation levels. The authors of [12] develop a method for random rearrangement of the distribution grid, taking into account sustainability, associated loads, and renewable distributed generation with regard to photovoltaic combined with distributed generation (PV-DG) and small hydropower plant combined with distributed generation (SHPP-DG). The purpose is to mitigate active power losses and the number of switching operations and increase the voltage stability margin. A knee point-driven evolutionary method and a three-point-based approximation approach are applied to mitigate the network instability caused by enhancing PV-DG and SHPP-DG penetration levels. The obtained results show that the suggested model can be implemented in actual networks in the presence of distributed generations.
In [13], the study solves the problem of minimizing power losses through reconfiguration along with DG and ESS. A new hybrid metaheuristic procedure, known as the chaotic golden flower algorithm (CGFA), is suggested for smart cities. The suggested strategy performs better than other strategies regarding convergence speed and power loss reduction. The authors of [14] offer a simultaneous solar-distributed generator (Solar-DG) and distribution static compensator (DSTATCOM) in distribution system reconfiguration based on adaptive particle swarm optimization (APSO) and a combination of GWO and PSO. A new optimization of multiple objectives, such as real and reactive power losses, voltage variations, line current fault level, and network reliability, is proposed. In addition, diverse costs are considered, including the expense of repair, losses, and unsupplied energy. It can be concluded that the GWO-PSO approach works more excellently than the APSO algorithm and other methods mentioned in the literature. In [15], the paper solves the problem of decreasing the power losses and voltage alterations and balancing the feeder load using the concurrent reconfigurable feeder and optimal distributed generator placement. The enhanced artificial immune systems (EAIS) method and fuzzy logic are suggested. The acquired results illustrate that the suggested approach is efficacious and powerful.
Ref. [16] offers a distribution network reconfiguration procedure according to the model-free reinforcement learning (RL) strategy that utilizes the NoisyNet deep Q-learning network (DQN). The purpose of the paper is to minimize the power losses and improve the voltage curve. The authors conclude that, without adjusting the exploration parameters, they can automatically perform the exploration, accelerating the education proceeding and improving the optimizing operation. Moreover, the acquired outcomes illustrate the suggested approach performs better than other ε -greedy-based DQN approaches regarding lower voltage deviation and power loss reduction. Ref. [17] presents a strategy in which the iterative branch exchange and clustering methods are combined. The paper aims to mitigate the power losses and increase the voltage levels through a reconfigurable system. The results obtained with this work perform better than other techniques. In [18], the authors introduce various convex models to optimally and maximally penetrate based on DG application in radiality distribution networks. The optimization problem looks for the high penetration of DG, least energy losses, and voltage curve improvement. In [19], the authors improve the conventional reconfiguration approach using the theory of dynamic microgrids to obtain a superior operating possibility against critical islanding. Moreover, the microgrid layout of the network with generalizable reconfiguration intention is supported by a risk-averse two-stage mixed-integer conic program design. The paper aims to save costs.
Ref. [20] specifies the DGs’ places, capacities, and power coefficients using a genetic algorithm and particle swarm optimization. The combination of renewable energies, including photovoltaics and wind turbines, with the distribution system is the primary purpose. These resources are used significantly to reduce the yearly energy losses and voltage variations in the distribution system. Consequently, wind turbines perform better than photovoltaic systems. The superiority of particle swarm optimization over genetic algorithms is proven because it provides high-quality solutions, converges faster, and is executed in the shortest time. Ref. [21] provides a method based on a convex–concave approach to estimate the imbalance performance limits of three-phase nonrenewable distributed generators. The purpose of the work is to test and plan advanced distribution circuit configurations to adapt maximum photovoltaic penetration while investigating power quality worries. A two-step optimization model is suggested [22]. The paper envisions a futurity distribution grid along with the huge DG penetration and a digitalization communication platform. A novel three-phase imbalance-based power flow method is optimally expanded to analyze a stable network to decrease the expense of serviced loads in a distribution system [23].
The author of [24] proposes a new artificial hummingbird algorithm (AHA) to optimally allocate DGs based on biomass in a radiality distribution system. The purpose of the paper is to decrease real power losses and voltage deviation in three test systems. The exploration and exploitation processes are improved by the suggested approach, which leads to the improvement of the search space and prevents becoming stuck in the local optimum. In [25], the paper investigates the minimization of the power losses and voltage deviation through allocating DGs considering a powerful modified forensic-based investigation (mFBI) approach. In addition, the most enforceable weighting agents in the multi-objective function are created by an analytical hierarchy process (AHP) strategy. The suggested technique is an effective and practical solution. In [26], a reconfigurable approach of a consecutive system based on the state is developed through a Markov decision process (MDP) pattern, which aims to reduce the curtailment of the renewable DG and load shedding under operating restrictions. Existing DG power outputs and the network configuration at any given time are shown as the status of Markov. Two networks are applied to prove the correctness of the suggested scheme. As a result, real-time configuration rearrangement approaches assisting the beheld network status can be implemented. The authors of [27] propose a new approach to plan the flexible distribution network with line hardening and allocate DGs according to a two-step random optimization to decrease the load-shedding expenses against natural disasters. The second step coordinates the resources in each microgrid using the master–slave control strategy. As a result, the expenses of load shedding can be reduced by 63% during the course of strong storms by forming the microgrid and reconfiguring the network. Ref. [28] considers conventional volt-var control instruments, DNR, and smart photovoltaic inverters coordinately and effectively to save energy. The proposed algorithm is a modified binary gray wolf optimization (MBGWO) method implemented on balanced and unbalanced distribution networks.
In [29], the distribution network reconfiguration capabilities increase considering the optimum connection of storage lines. The proposed model is a scenario-based convex programming model for operation cost reduction and the non-supplied energy reduction. The prominent difference of the proposed method with the previous methods is that the linear logical limitations of the desired formula are considered for reconfiguration after the fault. Two test networks are implemented. The results demonstrate the cost minimization of the power generation and non-supplied energy. Ref. [30] presents a data-driven batch-constrained RL procedure to solve the problem of dynamic distribution system reconstruction. The suggested RL approach is taught to decline the network operation expense and the difference between the network reconfiguration control politics under assessment and the historic operation strategy without interaction with the distribution system. The results on four distribution systems illustrate that the suggested method performs better than advanced RL methods. The authors of [31] offer an economic planning pattern of mobile energy storage system (MESS) assisted equivalent reconfiguration method (ERM). The problem of the grid–traffic coupling is altered into the distribution system problem. The work aims to enhance the distribution grid operator benefit. Furthermore, the MESS improves the income of the distribution network operator and significantly upgrades the renewable energy absorption while maintaining the node voltage within the acceptable limit and guaranteeing the secure performance of the network.
In [32], cascaded failure containment (CFC) raises the failure flexibility in a microgrid (MG) based on solving the optimal load flow considering frequency variation by means of network reconfiguration. The proposed strategy balances an MG with the biggest active power load and reduces the network fluctuation hazard and the maximum index of the line stability. The CFC outperforms the other methods mentioned in the literature. Ref. [33] presents a protective model based on a group classifier without communication for the DC microgrid, compatible with network reconfiguration and climate alternation. Online identification of system configuration and stochastic modeling of solar radiation and wind velocity provide adaptability and immunity against climate change. The suggested procedure is appropriate for the reliable performance of fault diagnosis/categorization duties and segment identification under dynamic changes in system configuration and climate conditions. Ref. [34] proposes a distribution network reconfiguration based on safe restrictions by integrating wind power plants and energy storage systems (ESSs) to reduce the economic expense of the power plant. A standard branch and bound algorithm analyzes a mixed-integer non-linear programming issue. According to the results, an appropriate loading margin ensures the grid safety in critical situations and the output power of the wind power plant is controlled; the network loads are provided by the planning of ESSs.
In this paper, the WOA is used to reconfigure the distribution system, locate DGs, and determine the size of DGs, aiming to decrease the active power losses and meliorate the voltage characteristic. The suggested approach is experimented using the 33-bus and 69-bus grids with four various cases. According to the results of WOA, a comparison is made between the suggested strategy and other strategies, including the ACSA [1], UVDA [2], MPGSA [3], and SFS methods [4]; the acquired results demonstrate that WOA works better than other methods.
This work contributes to the implementation of the following:
  • The WOA is implemented for the power loss reduction and the voltage curve improvement through the reconfiguration with the simultaneous allocation of DGs;
  • Tests are conducted using the 33-bus and 69-bus grids in various cases by means of the WOA;
  • A comparison is performed between the results acquired by WOA and the solutions presented by other techniques and the proposed method further reduces the power losses and further improves the voltage profile. As a result, it shows the superiority of WOA over other methods.
The rest of this article is arranged as follows: Section 2 describes the problem formulation; Section 3 describes the DNR problem solution method; Section 4 presents the WOA; Section 5 presents the implementation of the WOA for DNR considering DG allocation; Section 6 presents the tests and results of the WOA for the 33-bus and 69-bus grids; Section 7 presents the conclusion of the paper.

2. Problem Formulation

This work aims to minimize a distribution network’s losses through the reconfiguration and allocation (locate and size) of DGs. The suggested procedure for solving the issue is the WOA metaheuristic. In this context, presenting the problem’s mathematical model is unnecessary. Instead, the metaheuristic generates a solution proposal and the quality and feasibility of the proposal are verified by solving a power flow problem for radial systems. Figure 1 shows an illustrative radial distribution network [35].

2.1. Objective Function

One of the main benefits of reconfiguring the system with the simultaneous allocation of distributed generations is to decrease the power losses in the distribution grid.
Equation (1) defines the total network power losses.
P loss = P G P D
where P loss is the overall power loss of the system; P G is the total real power injection at the substation and DGs; P D is the total real power load.
In addition, bus voltage and voltage stability are increased by erecting DGs in the distribution grid.
The objective function ( F ) of the problem is to decrease the real power losses, which is presented in Equation (2).
minimize   F = P loss

2.2. Constraints

The constraints of the problem are as follows:
  • The obtained voltage magnitudes must not exceed the permissible limits, as presented in Equation (3);
V m i n V i V m a x ;      i = 1 , 2 , , N b u s
where V i is the voltage value at bus i ; V m i n is the minimum acceptable bus voltage magnitude; V m a x is the maximum permissible bus voltage magnitude; N b u s is the total number of buses in the system.
2.
The distribution grid must maintain its radiality topology and, after reconfiguration, must supply all loads;
3.
The amount of power produced by the DGs must be within the permissible limits, as shown in Equation (4);
P D G m i n , i P D G , i P D G m a x , i ;      i = 1 , 2 , , N D G
where P D G , i is the real power output of the DG unit at node i ; P D G m i n , i is the minimum size of the DG unit at node i ; P D G m a x , i is the maximum size of the DG unit at node i ; N D G is the number of DGs that can be connected to the system.
4.
The nonlinear equations represent Kirchhoff’s current and voltage laws, i.e., the formulas of the power flow problem. The power flow analysis calculates the power losses for each topology with DGs.

3. DNR Problem Solution Method

3.1. Basic Loop

The proposal of fundamental loops (FLs) allows for building an array of matrix forms; the branches belonging to each fundamental loop appear in each row of the matrix. The number of rows of this matrix is equivalent to the number of basic loops, i.e., it is equivalent to the number of open branches to generate a radial topology (see illustrative examples presented in Table 1 and Table 2). This matrix allows the generation of radial topologies efficiently.

3.2. Radiality Constraint Checking

The radiality configuration of the distribution system must be checked after determining the FLs. The radiality form of the system configuration is checked using the incidence matrix A . First, the reference bus and the tie switches, which in matrix A include the first column and rows related to those switches, respectively, are removed. The network configuration is a radial topology when the remainder of the matrix A is square; its determinant equals 1 or −1 [4].

4. Whale Optimization Algorithm

The WOA metaheuristic was introduced in 2016 [36]. It is based on how humpback whales hunt krill and other small fish. Their hunting method, called the bubble-net attacking manner, is unique; according to this method, whales make bubbles in a circular path or the shape of a “9” around the hunt.
The WOA is modeled considering the following steps:
  • Enclosing the hunt;
  • Bubble-net attacking manner;
  • Looking for the hunt.

4.1. Enclosing the Hunt

The WOA considers the prey as the present finest solution because the state space cannot identify the optimal location in advance. As a result, other search factors attempt to upgrade their situations relative to the finest rummage factor that is initially determined. This behavior is described in Equations (5)–(8).
X t + 1 = X * t A · D
D = | C · X * t X t |
A = 2 · a · r a
C = 2 · r
where the location vector of the best solution and location vector are indicated by X * and X , respectively; t is the present repetition; A and C are coefficient vectors; a is a vector with decreasing numbers from 2 to 0; r is a stochastic vector with elements within the interval [ 0 , 1 ] .

4.2. Bubble-Net Attacking Manner

There are two approaches to this hunting method.

4.2.1. Shrinking Encircling Mechanism

Here, A [ a , a ] , where A is reduced from 2 to 0 during the iterations. A location is placed randomly in the interval [ 1 , 1 ] . The main location and the location of the present best factor determine the new location of A that is placed between them. Figure 2 demonstrates the feasible locations from ( X , Y ) toward ( X * , Y * ) that can be obtained by 0 A 1 in a two-dimensional space using Equation (7).

4.2.2. Helix Updating Situation

The spiral Equation (9) is employed to imitate the helix-shaped motion shown in Figure 3.
X t + 1 = D · e b l · cos 2 π l + X * ( t )
Whales hunt the prey using the two-mentioned methods, with a 50% eventuality of hunting in each method, as shown in Equation (10).
X t + 1 =     X * t A · D if   p < 0.5 D · e b l · cos 2 π l + X * ( t )   if   p 0.5
where the distance between the whale and the hunt (the finest solution acquired heretofore) is indicated by D = X * t X t . b is equal to one. l is a stochastic number in the range [ 1 , 1 ] . p is a stochastic value in the range [ 0 , 1 ] . Figure 3 illustrates the helix position approach for updating the solution shown in Equation (10).

4.3. Looking for the Hunt

The location of the search factor is upgraded regarding a stochastically selected rummage factor in place of the finest rummage factor explored so far to obtain a global search, as presented in Equations (11) and (12).
D = | C · X r a n d X |
X t + 1 = X r a n d A · D
where X r a n d is the vector of the random location (a random whale) selected from the present solutions. Figure 4 represents the flowchart for the WOA algorithm.

5. Implementation of the WOA for DNR Considering the Allocation of DG

5.1. Initialization

The flowchart of the WOA for the DNR issue with concurrent DG allocation is illustrated in Figure 5. The element i , X i , of the population demonstrates a solving vector that consists of three segments. The number of open switches ( S W i ) is considered the first part considering the fundamental loop lists. The numbers of determined buses ( x D G , i ) to which the DGs are connected are represented in the second part. The elements in the first and second parts are integer values. The third part shows the capacity of DGs ( P D G , i ). Therefore, these parts form the structure to specify the open switches, the location, and the capacities of DGs, as shown in Equation (13).
X i = [ S W 1 , , S W N T i e , x D G , 1 , , x D G , N D G , P D G , 1 , , P D G , N D G ]
In the WOA, the solutions are stochastically produced within the specified boundaries. Thus, the variables of the initial solution proposals are generated, as shown in Equations (14)–(16).
S W i = round S W m i n , i + rand 0,1 · S W m a x , i S W m i n , i i = 1 , , N T i e
x D G , i = round x D G m i n , i + rand 0,1 · x D G m a x , i x D G m i n , i i = 1 , , N D G
P D G , i = P D G m i n , i + rand 0,1 · P D G m a x , i P D G m i n , i i = 1 , , N D G
where S W m i n , i and S W m a x , i equal the i t h fundamental loop vector length; S W i is the sequential number of each switch in the i t h fundamental loop; N T i e and N D G are the number of open switches and the number of DGs, respectively.
It should be noted that, in Equation (14), a branch should be disconnected according to the matrix arrangement information shown in Section 3.1, as specified in Table 1 and Table 2. Equation (15) identifies the bus in which the DG must be allocated; Equation (16) identifies the generation level of DG.

5.2. Overall Procedure

The DNR with the simultaneous allocation of DGs is implemented using the WOA as follows:
Step 1: initialize population size ( N p ) and the maximum number of iterations ( i t m a x ).
Step 2: Specify the basic loops of the distribution system (see Section 3.1). Determine the inferior and superior ranges for each loop.
Step 3: check the radiality condition of the solution (see Section 3.2); if it is not radial, find another solution until the radial condition is met.
Step 4: Calculate the fitness function in Equation (1) by performing power flow calculations and determine the minimum power losses. Begin the repetition counter from t 1 .
Step 5: upgrade the position of the whales using Equations (9)–(12).
Step 6: Check the radiality condition (see Section 3.2). If the solution is not radial, find another solution until the radial condition is met, determine the fitness function by performing power flow calculations according to Equation (1), and determine the minimum power losses.
Step 7: if the obtained fitness function is lower, substitute the finest solving with the previous finest solving.
Step 8: Let t t + 1 . If t < i t m a x , increase the number of iterations and return to Step 5. If t i t m a x , print the results and stop the algorithm.

6. Tests and Results

To assess the WOA efficiency, tests are performed using the 33-bus and 69-bus grids, demonstrated in Figure 6 and Figure 7, respectively. The algorithm is implemented in MATLAB R2018a and run on a computer with a 1.80 GHz Intel® Core™ i7-8565U (DELL, São Paulo, Brazil) processor and 16 GB of RAM. In this study, the load flow analysis is executed by means of the backward–forward sweep approach. The population size for each system is 50 and the maximum number of repetitions for the 33-bus and 69-bus grids are equal to 300 and 400, respectively. As described in Section 3.1, the FLs are found in the mentioned networks. In addition, the voltage magnitudes at buses are limited, as presented in Equation (17).
0.93 V i 1.05 ;      i = 1 , 2 , , N b u s
where the limits are in p.u.; V i is the value of the voltage magnitude at bus i ; N b u s is the overall number of buses.
For the optimal location and size of DGs, three DGs are considered; the capacity range of each DG is shown in Equation (18).
10 P D G , i P D 6 ;      i = 1 , 2 , 3
where the limit is in kW; P D G , i is the size of the i t h DG; P D is the overall real power demand of the grid.
Four cases are taken into account to evaluate the efficiency of the WOA:
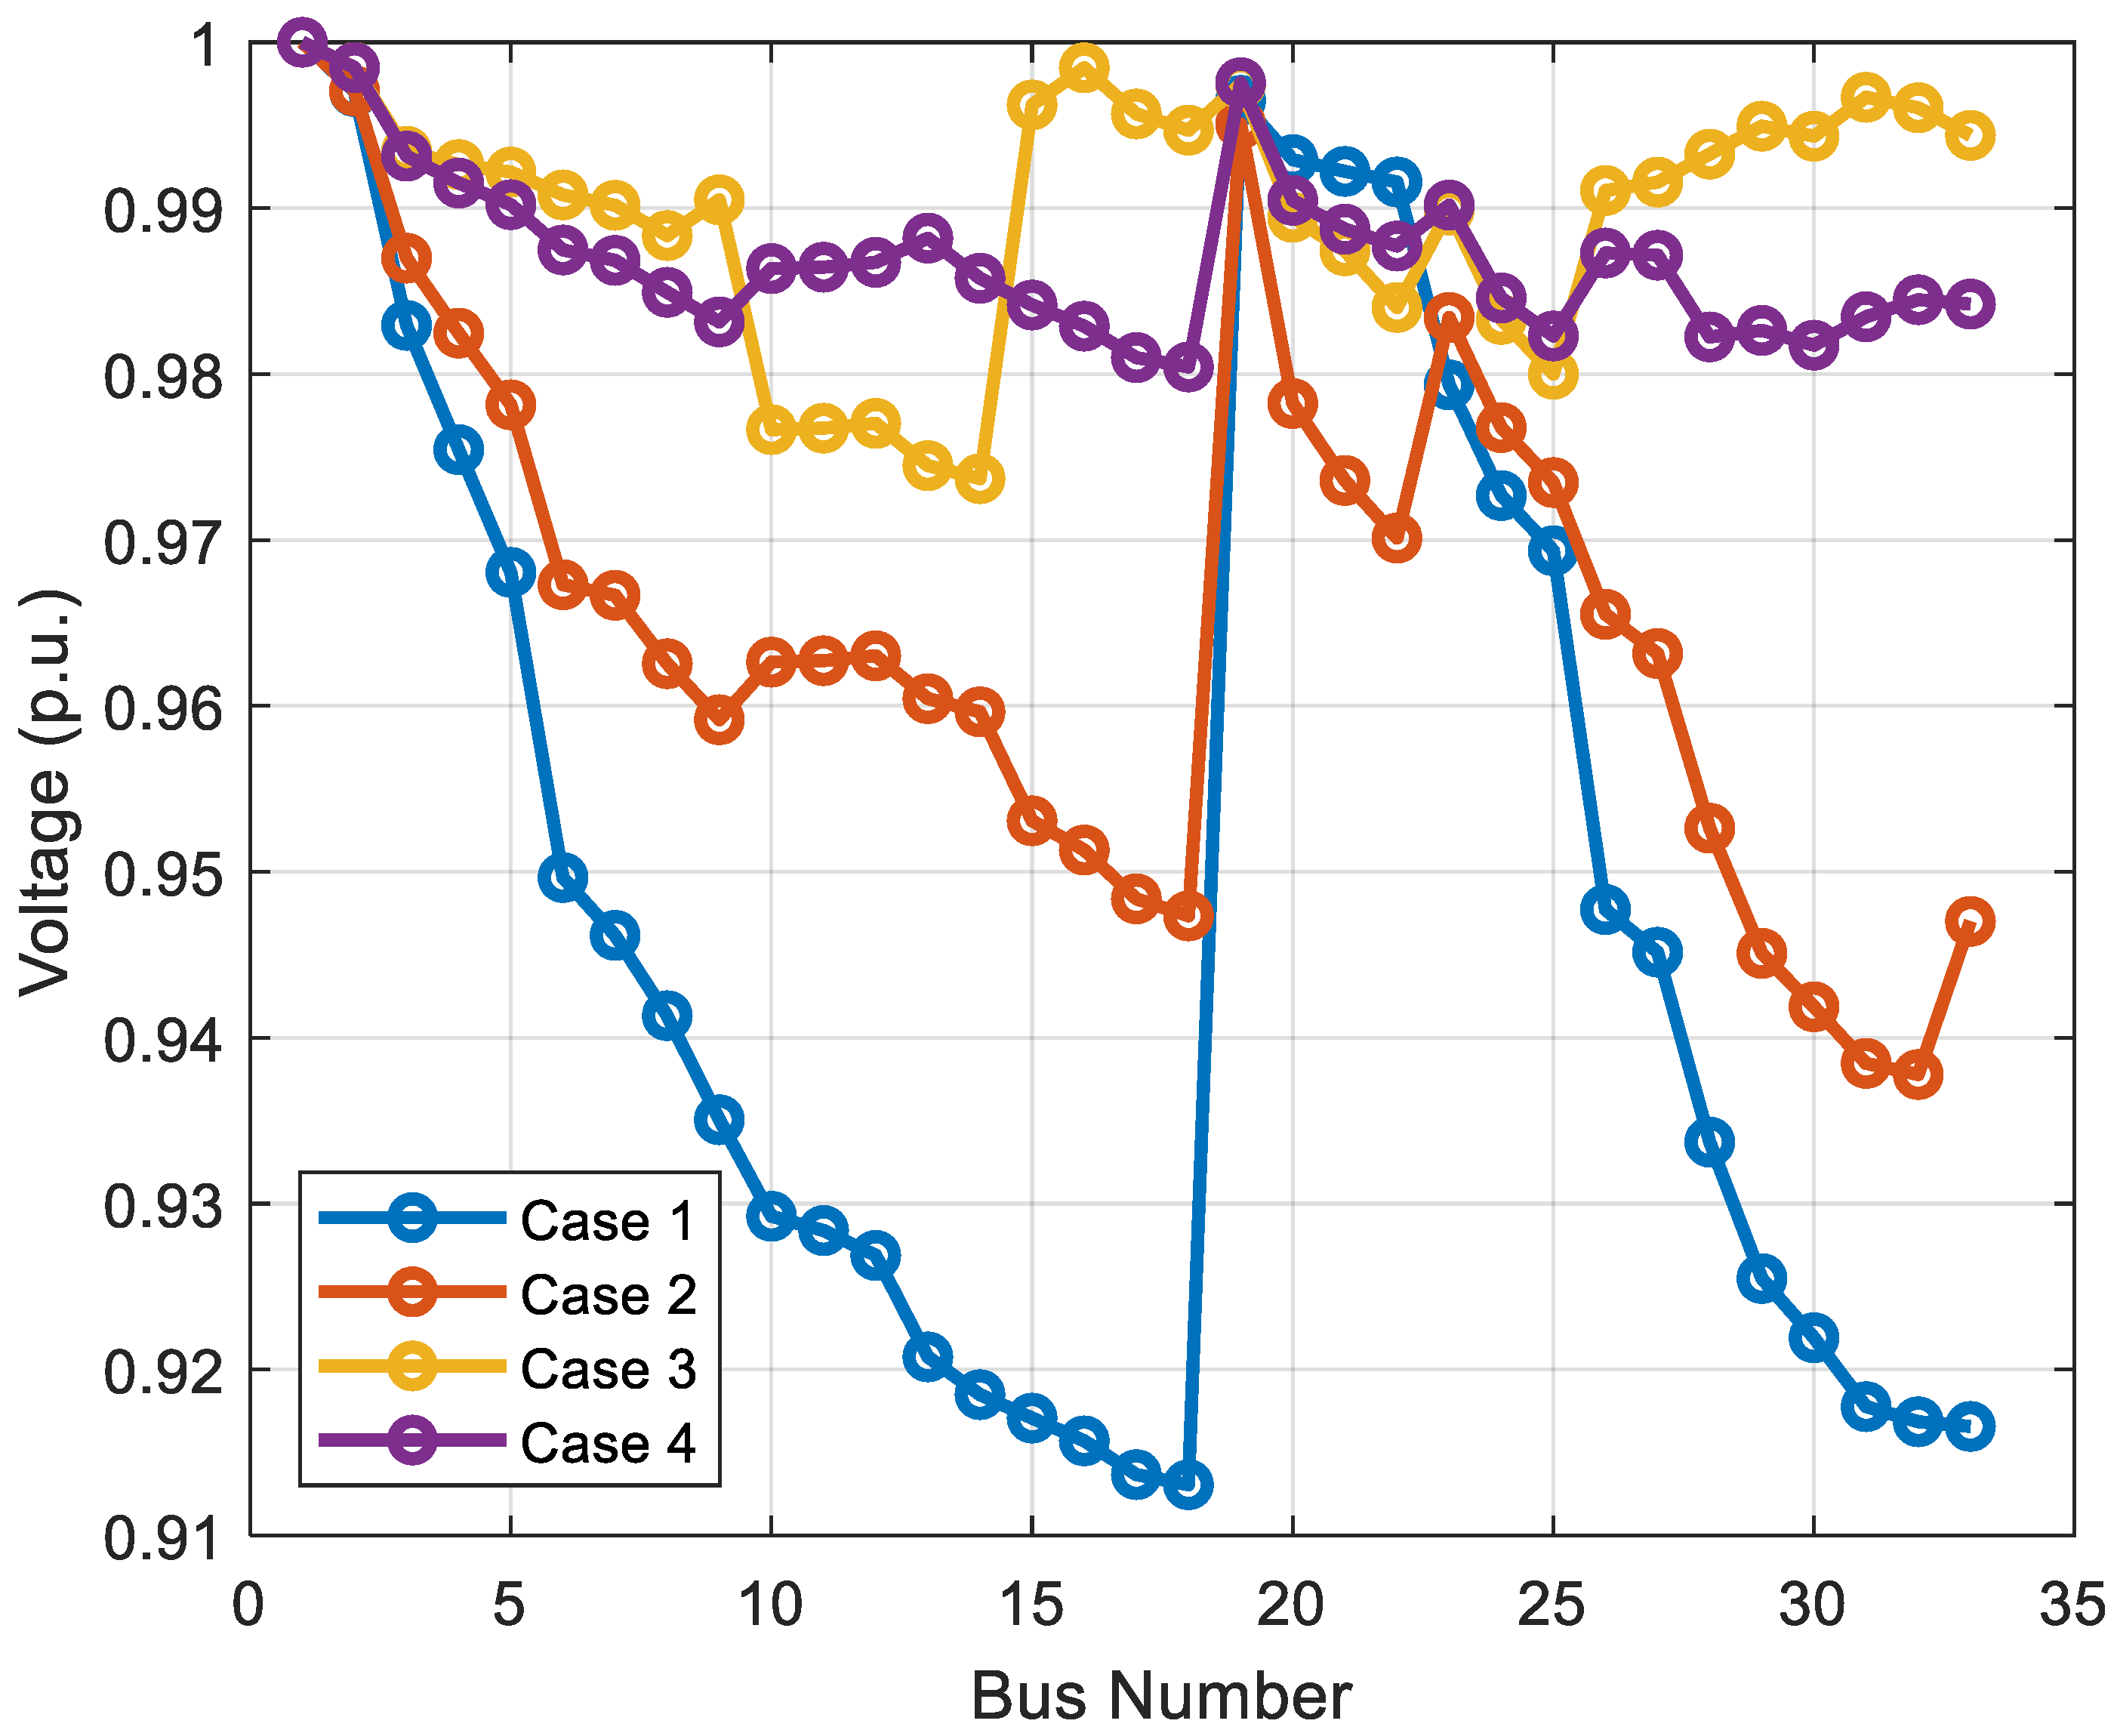
  • Case 1: base case (without DNR and DGs);
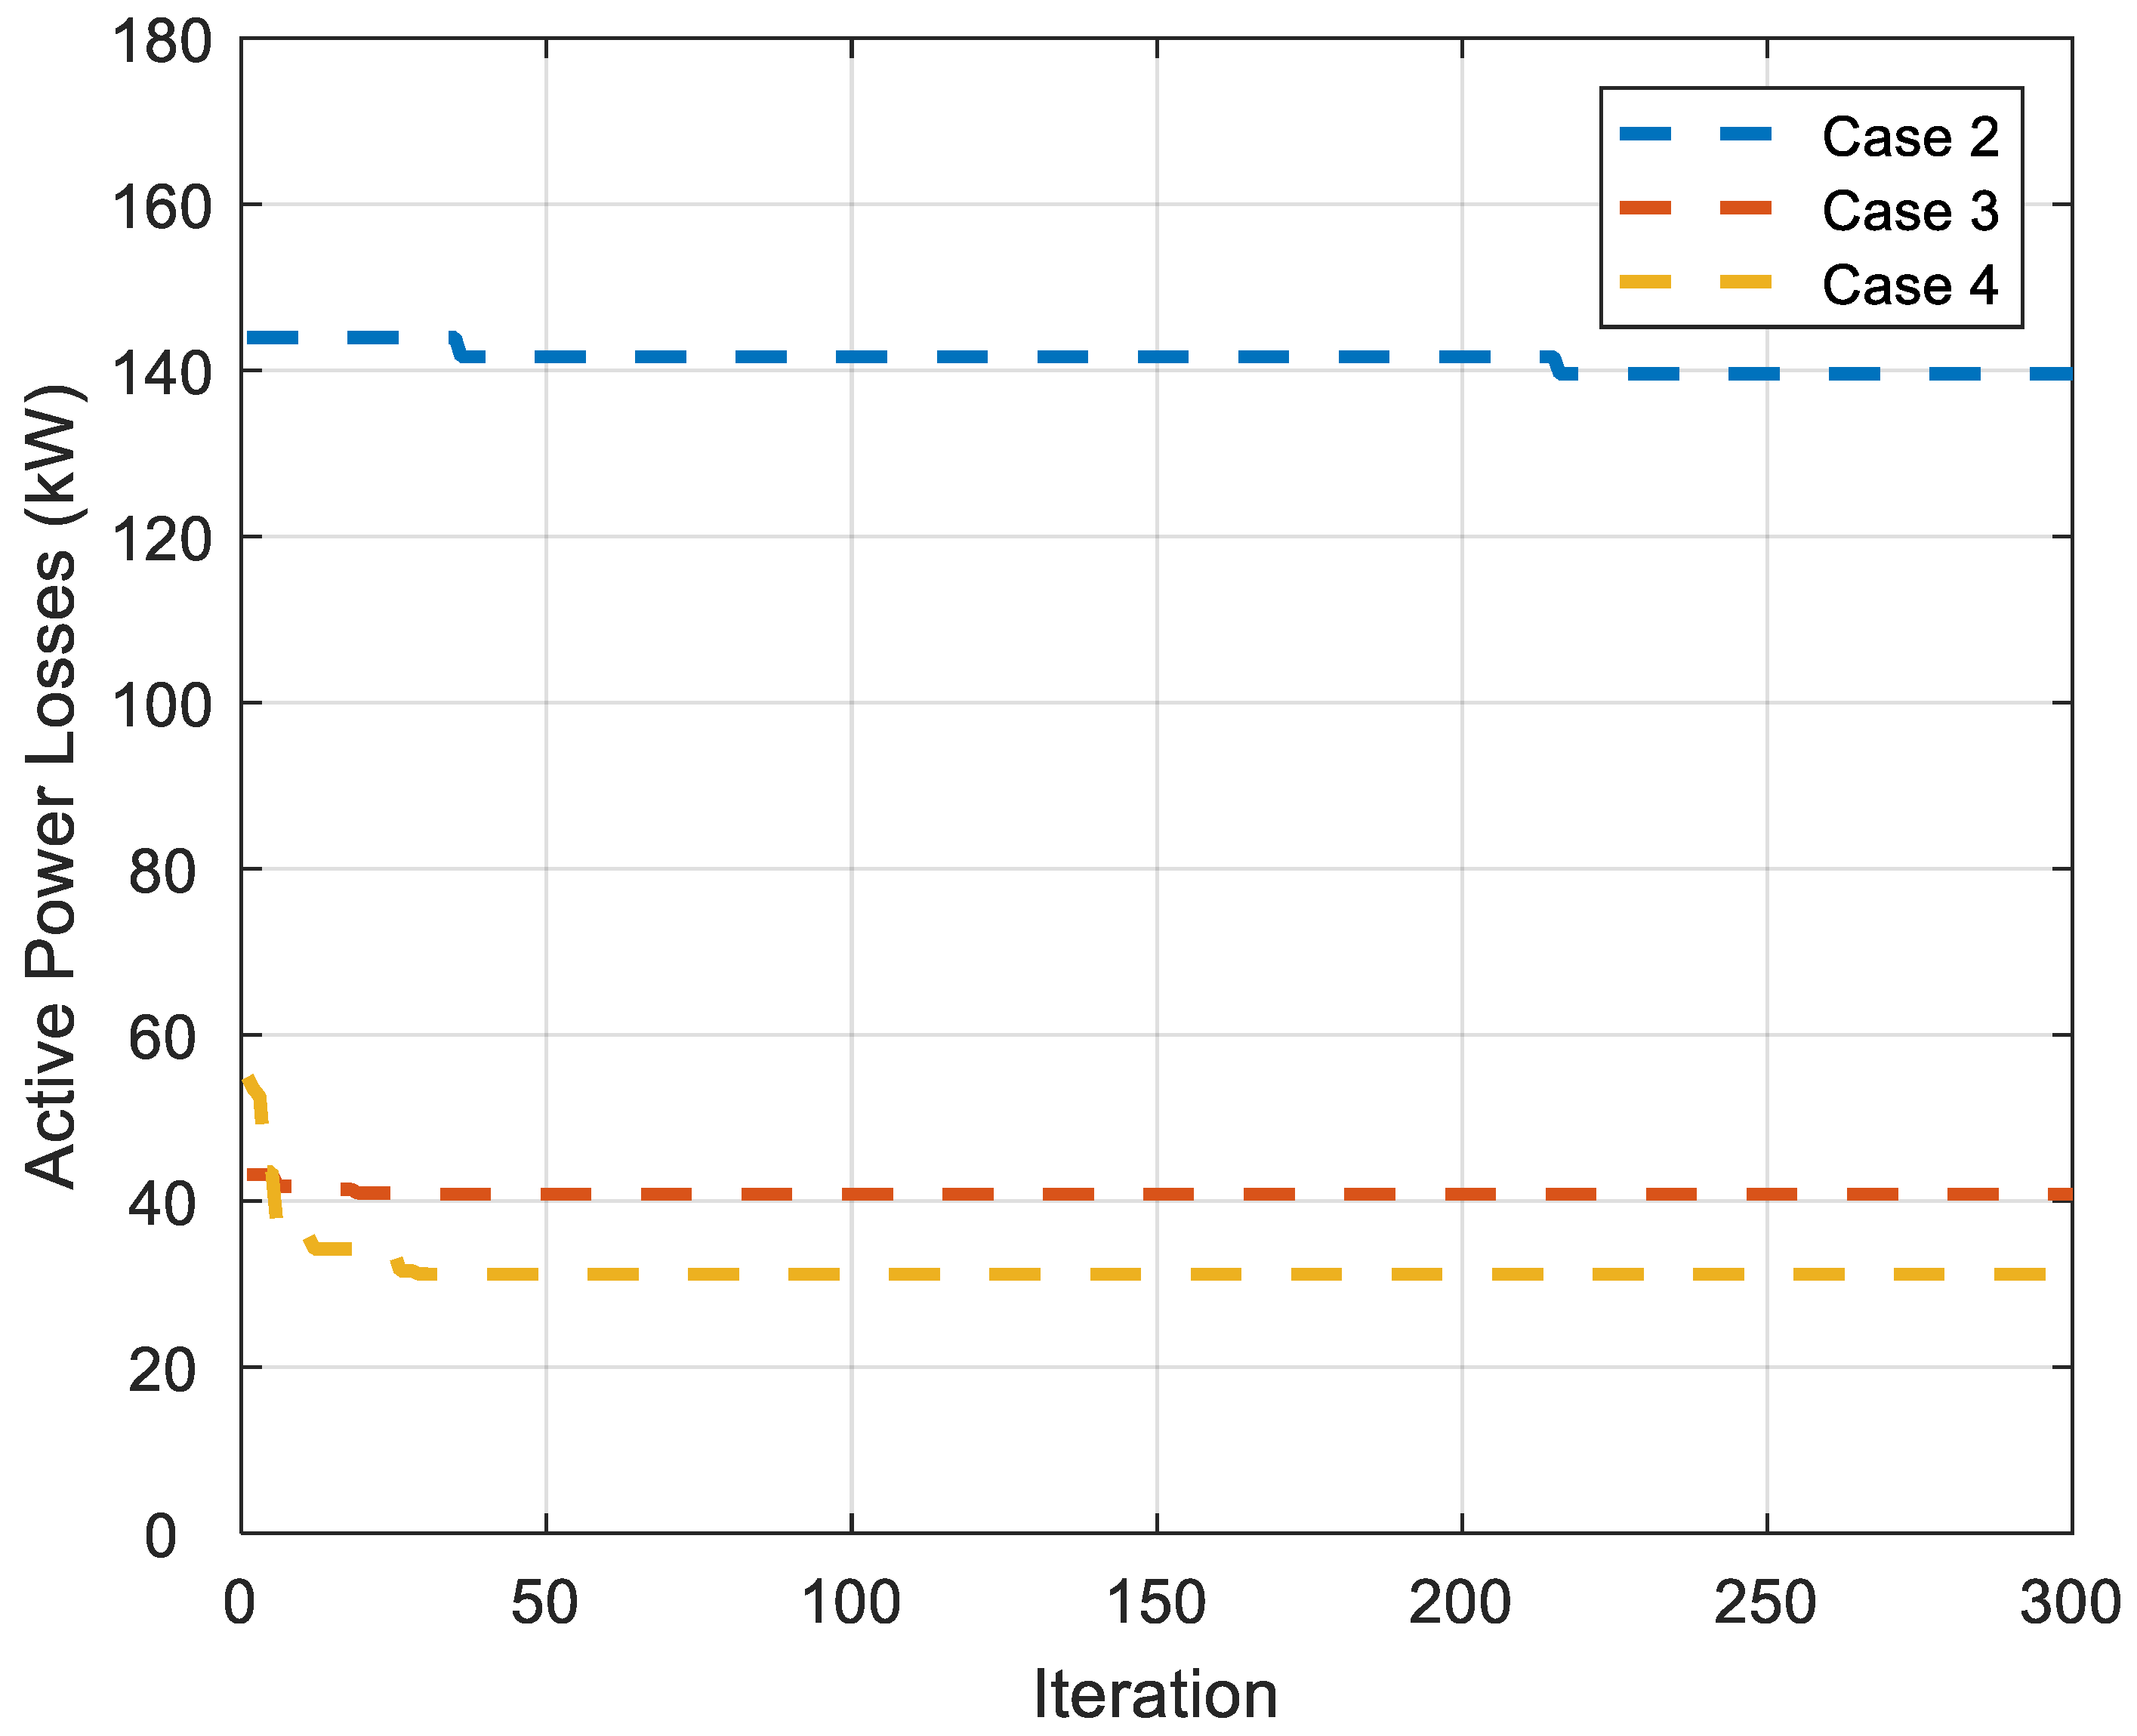
  • Case 2: only reconfiguration is performed;
  • Case 3: the optimum placement and capacity of 3 DGs are performed after reconfiguration according to the result of Case 2;
  • Case 4: the reconfiguration and the optimum placement and capacity of 3 DGs are performed simultaneously.

6.1. 33-Bus Grid

The 33-bus grid is a medium voltage distribution network with 37 lines. In addition, there are 32 disconnect switches and five tie lines [37]. The overall real and non-real power demands are 3715 kW and 2300 kVAr, respectively. The system’s nominal voltage is 12.66 kV. The maximum capacity of each DG unit is 619.17 kW. Figure 6 illustrates the 33-bus grid; the basic loops of the system are presented in Table 1. For comparing the efficiency of the WOA technique with other techniques, ACSA [1], UVDA [2], MPGSA [3], and SFS [4] methods are considered.
Table 3 shows that the power losses for the primary configuration, i.e., Case 1, are 202.68 kW. The primary configuration power losses are mitigated to 139.55 kW, 40.80 kW, and 31.17 kW in Cases 2, 3, and 4, respectively, representing reductions of 31.15%, 79.87%, and 84.62%, respectively. Figure 8 demonstrates the comparison of the voltage curves of the four cases. The minimum voltage magnitudes obtained for Cases 1 to 4 are 0.9131 p.u., 0.9378 p.u., 0.9737 p.u., and 0.9804 p.u., respectively. In addition, the execution times of Cases 1 to 4 are 0.2 s, 4265.4 s, 3926.5 s, and 4764.6 s, respectively. Table 3 shows that the power loss minimization percentage and voltage characteristic amelioration for Case 4 are more significant than the other cases.
Figure 9 shows the evolution of the WOA for Cases 2 to 4. The evolution curve of Case 2 is optimized around the 250th iteration. The evolution curves of Cases 3 and 4 reach the best solution around the 50th iteration.
As shown in Table 3, a comparison is made between the WOA and other methods. The optimal switches of Case 2 opened by the WOA are 7, 9, 14, 32, and 37. The power losses of the WOA are similar to the UVDA, MPGSA, and SFS, but the difference in the power losses of the proposed algorithm with ACSA is very insignificant. In Case 3, which has 3 DGs connected to the grid, the WOA method determines buses 16, 29, and 31 as the best places to connect the DGs; the three DGs operate at the limit of 619.2 kW.
The distinction of the WOA from other approaches is that the power losses of Case 3 are significantly lower for the WOA. The WOA considers the reconfiguration and connection of 3 DGs in Case 4, in which DGs are connected to buses 13, 29, and 32; the sizes of the DGs are 614.0 kW, 610.0 kW, and 613.0 kW, respectively. The WOA also opens switches 7, 8, 9, 27, and 36 to reconfigure the network. The results of Case 4 obtained by the WOA are more desirable in terms of power loss reduction compared with ACSA and SFS. Still, the obtained values are almost similar in terms of minimum voltage magnitude. The proposed WOA further optimizes the results of Cases 2 to 4 and provides better results for the 33-bus grid (see Table 3).

6.2. 69-Bus Grid

The 69-bus grid is a medium voltage distribution network with 73 lines. In addition, there are 68 sectionalizing switches and five tie lines [37]. The overall real and non-real power demands are 3801.9 kW and 2694.1 kVAr, respectively. The system’s nominal voltage magnitude is 12.66 kV. Figure 7 illustrates the 69-bus grid, while the basic loops of the network are presented in Table 2. The maximum size of each DG unit is 633.7 kW.
Table 4 shows that the value for the power losses for the primary configuration, i.e., Case 1, is 224.96 kW. The primary configuration power losses are decreased to 99.80 kW, 28.05 kW, and 19.49 kW in Cases 2, 3, and 4, respectively, which present reductions of 55.64%, 87.53%, and 91.34%. The minimum voltage magnitudes for Cases 1 to 4 are 0.9090 p.u., 0.9427 p.u., 0.9707 p.u., and 0.9820 p.u., respectively. In addition, the execution times of Cases 1 to 4 are 0.3 s, 27,553.3 s, 14,310.7 s, and 27,902.1 s, respectively. Table 4 shows that the power loss minimization percentage and voltage characteristic amelioration for Case 4 are more significant than the other cases.
For all cases, the voltage characteristics are illustrated in Figure 10 and the convergence characteristics of the suggested procedure are demonstrated in Figure 11. The evolution curves of Cases 2, 3, and 4 reach the optimal solution around the 100th iteration.
For comparing the efficiency of the WOA technique with other techniques, ACSA [1], UVDA [2], and SFS [4] methods are considered (see Table 4). The best switches of Case 2 opened by the WOA are 12, 57, 61, 69, and 70. The difference in the power losses for the solution obtained by the suggested approach is insignificant when compared with the other approaches. The WOA method in Case 3, which has 3 DGs connected to the grid, determines buses 27, 60, and 61 as the best places to connect the DGs to them; the three DGs operate at the limit of 572.0 kW, 205.0 kW, and 633.7 kW, respectively. The difference between the WOA and other methods is that the power losses for the solution obtained by the WOA for Case 3 are significantly lower than the results obtained by the other methods. The WOA considers the reconfiguration and connection of 3 DGs in Case 4, where the DGs are connected to buses 62, 63, and 64; the sizes of DGs are 633.7 kW, 496.0 kW, and 607.0 kW, respectively. The WOA also opens switches of branches 10, 12, 20, 21, and 58 to reconfigure the network. The result of Case 4 obtained by WOA is more desirable in terms of power loss reduction when compared with ACSA and SFS. Still, the obtained values are almost similar in terms of minimum voltage magnitude. The proposed WOA further optimizes the results of Cases 2 to 4 and provides better results for the 69-bus grid (see Table 4).

7. Conclusions

In this article, the WOA simultaneously reconfigures the distribution network and optimizes DG location and size.
Reducing real power losses in distribution systems is the primary purpose, which improves the voltage profile. Furthermore, four cases, e.g., primary configuration without DNR and DGs, only DNR, DG allocation after DNR, and DNR and DG allocation simultaneously, are considered. The WOA is an efficient and robust metaheuristic procedure that rapidly converges in all considered cases.
The proposed algorithm is tested using 33-bus and 69-bus grids. The finest real power loss mitigation obtained with the WOA is 84.62% and 91.34% in 33-bus and 69-bus grids, respectively, corresponding to Case 4 (DNR with simultaneous DG location and size). The superiority and efficiency of the WOA method is evident in all cases compared with other methods such as SFS, MPGSA, UVDA, and ACSA. Therefore, the WOA is an effective procedure for performing system reconfiguration with the concurrent allocation of DGs.
Future research could be the integration of a battery energy storage system considering grid reliability, annual operation cost, and voltage deviation.

Author Contributions

Conceptualization, E.M.; methodology, E.M.; software, E.M.; validation, E.M., S.A., L.H.M. and R.R.; formal analysis, E.M.; investigation, E.M. and S.A.; resources, E.M. and S.A.; data curation, E.M. and S.A.; writing—original draft preparation, E.M.; writing—review and editing, E.M., S.A., L.H.M. and R.R.; visualization, E.M.; supervision, L.H.M. and R.R.; project administration, R.R.; funding acquisition, R.R. All authors have read and agreed to the published version of the manuscript.

Funding

This work was supported by the Coordination for the Improvement of Higher Education Personnel (CAPES), Finance Code 001, the Brazilian National Council for Scientific and Technological Development (CNPq), grant 305852/2017-5, and the São Paulo Research Foundation (FAPESP), under grants 2015/21972-6 and 2018/20355-1.

Data Availability Statement

Not applicable.

Conflicts of Interest

The authors declare no conflict of interest.

Nomenclature

Functions
F Objective function of the problem
Indices
n ,   i Indices for buses
Parameters
S L , n Complex power injected at bus   n
P L , n Real power injected at bus   n
Q L , n Non−real power injected at bus   n
V n Voltage magnitude at bus   n
I L , n Current extracted at bus   n
P D Total active power load
P G Active power injection at the substation and DGs
P l o s s Overall real power losses of the system
V i Voltage magnitude at bus   i
V m i n Minimum acceptable bus voltage magnitude
V m a x Maximum acceptable bus voltage magnitude
N b u s Overall number of buses in the system
P D G , i Real power output of the DG unit   i
P D G m i n , i Minimum size of the DG unit   i
P D G m a x , i Maximum size of the DG unit   i
N D G Number of DG units
X * Location vector of the best solution
X Location vector
t Present iteration
A ,   C Coefficient vectors
r Random vector
D ,   D Distance between a whale and the prey
a Vector with decreasing values from 2 to 0
b Constant value
p Random number
X r a n d Random whales in the current iteration
X i Initial population
N p Number of solutions in the population
N T i e Number of tie switches
S W i Status of switch   i

References

  1. Nguyen, T.T.; Truong, A.V.; Phung, T.A. A novel method based on adaptive cuckoo search for optimal network reconfiguration and distributed generation allocation in distribution network. Int. J. Electr. Power Energy Syst. 2016, 78, 801–815. [Google Scholar] [CrossRef]
  2. Bayat, A.; Bagheri, A.; Noroozian, R. Optimal siting and sizing of distributed generation accompanied by reconfiguration of distribution networks for maximum loss reduction by using a new UVDA-based heuristic method. Int. J. Electr. Power Energy Syst. 2016, 77, 360–371. [Google Scholar] [CrossRef]
  3. Rajaram, R.; Kumar, K.S.; Rajasekar, N. Power system reconfiguration in a radial distribution network for reducing losses and to improve voltage profile using modified plant growth simulation algorithm with distributed generation (DG). Energy Rep. 2015, 1, 116–122. [Google Scholar] [CrossRef] [Green Version]
  4. Tran, T.T.; Truong, K.H.; Vo, D.N. Stochastic fractal search algorithm for reconfiguration of distribution networks with distributed generations. Ain Shams Eng. J. 2020, 11, 389–407. [Google Scholar] [CrossRef]
  5. Biswal, S.R.; Shankar, G.; Elavarasan, R.M.; Mihet-Popa, L. Optimal allocation/sizing of DGs/capacitors in reconfigured radial distribution system using quasi-reflected slime mould algorithm. IEEE Access 2021, 9, 125658–125677. [Google Scholar] [CrossRef]
  6. Barnwal, A.K.; Yadav, L.K.; Verma, M.K. A multi-objective approach for voltage stability enhancement and loss reduction under PQV and P buses through reconfiguration and distributed generation allocation. IEEE Access 2022, 10, 16609–16623. [Google Scholar] [CrossRef]
  7. Tran, T.V.; Truong, B.-H.; Nguyen, T.P.; Nguyen, T.A.; Duong, T.L.; Vo, D.N. Reconfiguration of distribution networks with distributed generations using an improved neural network algorithm. IEEE Access 2021, 9, 165618–165647. [Google Scholar] [CrossRef]
  8. Shaheen, A.M.; El-Sehiemy, R.A.; Kamel, S.; Elattar, E.E.; Elsayed, A.M. Improving distribution networks’ consistency by optimal distribution system reconfiguration and distributed generations. IEEE Access 2021, 9, 67186–67200. [Google Scholar] [CrossRef]
  9. Rahim, M.N.A.; Mokhlis, H.; Bakar, A.H.A.; Rahman, M.T.; Badran, O.; Mansor, N.N. Protection coordination toward optimal network reconfiguration and DG sizing. IEEE Access 2019, 7, 163700–163718. [Google Scholar] [CrossRef]
  10. Moghaddam, M.J.H.; Kalam, A.; Shi, J.; Nowdeh, S.A.; Gandoman, F.H.; Ahmadi, A. A new model for reconfiguration and distributed generation allocation in distribution network considering power quality indices and network losses. IEEE Syst. J. 2020, 14, 3530–3538. [Google Scholar] [CrossRef]
  11. Macedo, L.H.; Home-Ortiz, J.M.; Vargas, R.; Mantovani, J.R.S.; Romero, R.; Catalão, J.P.S. Short-circuit constrained distribution network reconfiguration considering closed-loop operation. Sustain. Energy Grids Netw. 2022, 32, 100937. [Google Scholar] [CrossRef]
  12. Shukla, J.; Panigrahi, B.K.; Ray, P.K. Stochastic reconfiguration of distribution system considering stability, correlated loads and renewable energy based DGs with varying penetration. Sustain. Energy Grids Netw. 2020, 23, 100366. [Google Scholar] [CrossRef]
  13. Swaminathan, D.; Rajagopalan, A.; Montoya, O.D.; Arul, S.; Grisales-Noreña, L.F. Distribution network reconfiguration based on hybrid golden flower algorithm for smart cities evolution. Energies 2023, 16, 2454. [Google Scholar] [CrossRef]
  14. Saw, B.K.; Bohre, A.K.; Jobanputra, J.H.; Kolhe, M.L. Solar-DG and DSTATCOM concurrent planning in reconfigured distribution system using APSO and GWO-PSO based on novel objective function. Energies 2023, 16, 263. [Google Scholar] [CrossRef]
  15. Alonso, G.; Alonso, R.F.; Souza, A.C.Z.Z.D.; Freitas, W. Enhanced artificial immune systems and fuzzy logic for active distribution systems reconfiguration. Energies 2022, 15, 9419. [Google Scholar] [CrossRef]
  16. Wang, B.; Zhu, H.; Xu, H.; Bao, Y.; Di, H. Distribution network reconfiguration based on NoisyNet deep Q-learning network. IEEE Access 2021, 9, 90358–90365. [Google Scholar] [CrossRef]
  17. Pereira, E.C.; Barbosa, C.H.N.R.; Vasconcelos, J.A. Distribution network reconfiguration using iterative branch exchange and clustering technique. Energies 2023, 16, 2395. [Google Scholar] [CrossRef]
  18. Akbari, M.A.; Aghaei, J.; Barani, M.; Niknam, T.; Ghavidel, S.; Farahmand, H.; Korpas, M.; Li, L. Convex models for optimal utility-based distributed generation allocation in radial distribution systems. IEEE Syst. J. 2018, 12, 3497–3508. [Google Scholar] [CrossRef]
  19. Cao, X.; Wang, J.; Wang, J.; Zeng, B. A risk-averse conic model for networked microgrids planning with reconfiguration and reorganizations. IEEE Trans. Smart Grid 2020, 11, 696–709. [Google Scholar] [CrossRef]
  20. Purlu, M.; Turkay, B.E. Optimal allocation of renewable distributed generations using heuristic methods to minimize annual energy losses and voltage deviation index. IEEE Access 2022, 10, 21455–21474. [Google Scholar] [CrossRef]
  21. Tan, Y.; Wang, Z. Incorporating unbalanced operation constraints of three-phase distributed generation. IEEE Trans. Power Syst. 2019, 34, 2449–2452. [Google Scholar] [CrossRef]
  22. Jothibasu, S.; Dubey, A.; Santoso, S. Two-stage distribution circuit design framework for high levels of photovoltaic generation. IEEE Trans. Power Syst. 2019, 34, 5217–5226. [Google Scholar] [CrossRef]
  23. Meng, F.; Chowdhury, B.; Chamanamcha, M. Three-phase optimal power flow for market-based control and optimization of distributed generations. IEEE Trans. Smart Grid 2018, 9, 3691–3700. [Google Scholar] [CrossRef]
  24. Fathy, A. A novel artificial hummingbird algorithm for integrating renewable based biomass distributed generators in radial distribution systems. Appl. Energy 2022, 323, 119605. [Google Scholar] [CrossRef]
  25. Tolba, M.A.; Houssein, E.H.; Eisa, A.A.; Hashim, F.A. Optimizing the distributed generators integration in electrical distribution networks: Efficient modified forensic-based investigation. Neural Comput. Appl. 2023, 35, 8307–8342. [Google Scholar] [CrossRef]
  26. Wang, C.; Lei, S.; Ju, P.; Chen, C.; Peng, C.; Hou, Y. MDP-based distribution network reconfiguration with renewable distributed generation: Approximate dynamic programming approach. IEEE Trans. Smart Grid 2020, 11, 3620–3631. [Google Scholar] [CrossRef]
  27. Ghasemi, M.; Kazemi, A.; Gilani, M.A.; Shafie-Khah, M. A stochastic planning model for improving resilience of distribution system considering master-slave distributed generators and network reconfiguration. IEEE Access 2021, 9, 78859–78872. [Google Scholar] [CrossRef]
  28. Pamshetti, V.B.; Singh, S.; Singh, S.P. Combined impact of network reconfiguration and volt-var control devices on energy savings in the presence of distributed generation. IEEE Syst. J. 2020, 14, 995–1006. [Google Scholar] [CrossRef]
  29. Tabares, A.; Puerta, G.F.; Franco, J.F.; Romero, R.A. Planning of reserve branches to increase reconfiguration capability in distribution systems: A scenario-based convex programming approach. IEEE Access 2021, 9, 104707–104721. [Google Scholar] [CrossRef]
  30. Gao, Y.; Wang, W.; Shi, J.; Yu, N. Batch-constrained reinforcement learning for dynamic distribution network reconfiguration. IEEE Trans. Smart Grid 2020, 11, 5357–5369. [Google Scholar] [CrossRef]
  31. Sun, W.; Qiao, Y.; Liu, W. Economic scheduling of mobile energy storage in distribution networks based on equivalent reconfiguration method. Sustain. Energy Grids Netw. 2022, 32, 100879. [Google Scholar] [CrossRef]
  32. Bawayan, H.; Younis, M. Mitigating failure propagation in microgrids through topology reconfiguration. Sustain. Energy Grids Netw. 2020, 23, 100363. [Google Scholar] [CrossRef]
  33. Tiwari, S.P.; Koley, E.; Ghosh, S. Communication-less ensemble classifier-based protection scheme for DC microgrid with adaptiveness to network reconfiguration and weather intermittency. Sustain. Energy Grids Netw. 2021, 26, 100460. [Google Scholar] [CrossRef]
  34. Nikkhah, S.; Alahyari, A.; Allahham, A.; Alawasa, K. Optimal integration of hybrid energy systems: A security-constrained network topology reconfiguration. Energies 2023, 16, 2780. [Google Scholar] [CrossRef]
  35. Reddy, A.V.S.; Reddy, M.D. Application of whale optimization algorithm for distribution feeder reconfiguration. I-Manag. J. Electr. Eng. (JEE) 2018, 11, 17–24. [Google Scholar] [CrossRef]
  36. Mirjalili, S.; Lewis, A. The whale optimization algorithm. Adv. Eng. Softw. 2016, 95, 51–67. [Google Scholar] [CrossRef]
  37. Soliman, M.; Abdelaziz, A.Y.; El-Hassani, R.M. Distribution power system reconfiguration using whale optimization algorithm. Int. J. Appl. Power Eng. (IJAPE) 2020, 9, 48–57. [Google Scholar] [CrossRef]
Figure 1. An illustrative 6-bus radial distribution network.
Energies 16 04560 g001
Figure 2. Shrunk enclosing strategy in bubble-net rummage.
Energies 16 04560 g002
Figure 3. Spiral updating position mechanism in bubble-net search.
Energies 16 04560 g003
Figure 4. Flowchart of the WOA.
Energies 16 04560 g004
Figure 5. Flowchart of the suggested WOA for distribution system configuration rearrangement with the simultaneous allocation of DGs.
Energies 16 04560 g005
Figure 6. Topology of the 33-bus grid.
Energies 16 04560 g006
Figure 7. Topology of the 69-bus grid.
Energies 16 04560 g007
Figure 8. Voltage curves for the 33-bus grid obtained with the WOA.
Energies 16 04560 g008
Figure 9. Evolution of the WOA for the 33-bus grid.
Energies 16 04560 g009
Figure 10. Voltage curves for the 69-bus grid obtained with the WOA.
Energies 16 04560 g010
Figure 11. Evolution of the WOA for the 69-bus grid.
Energies 16 04560 g011
Table 1. Basic loops of the 33-bus grid.
FLSwitchesLength of the FL
12, 3, 4, 5, 6, 7, 18, 19, 20, 3310
29, 10, 11, 12, 13, 14, 347
38, 9, 10, 11, 21, 33, 357
46, 7, 8, 9, 10, 11, 12, 13, 14, 15, 16, 17, 25, 26, 27, 28, 29, 30, 31, 32, 3621
53, 4, 5, 22, 23, 24, 25, 26, 27, 28, 3711
Table 2. Basic loops of the 69-bus grid.
FLSwitchesLength of the FL
13, 4, 5, 6, 7, 8, 9, 10, 35, 36, 37, 38, 39, 40, 41, 42, 6917
213, 14, 15, 16, 17, 18, 19, 20, 709
311, 12, 13, 14, 43, 44, 45, 69, 719
44, 5, 6, 7, 8, 46, 47, 48, 49, 52, 53, 54, 55, 56, 57, 58, 7217
59, 10, 11, 12, 13, 14, 15, 16, 17, 18, 19, 20, 21, 22, 23, 24, 25, 26, 52, 53, 54, 55, 56, 57, 58, 59, 60, 61, 62, 63, 64, 7332
Table 3. Brief of the results for the 33-bus grid.
CaseItemACSA [1]UVDA [2]MPGSA [3]SFS [4]WOA
1Opened switches33-34-35-36-37
P L (kW)202.68
V m i n (p.u.)0.9131
Time (s)0.2
2Opened switches7-9-14-28-327-9-14-32-377-9-14-32-377-9-14-32-377-9-14-32-37
P L (kW)139.98139.55139.55139.55139.55
Losses reduction (%)30.9331.1531.1531.1531.15
V m i n (p.u.)0.94130.93780.93780.93780.9378
Time (s)4265.4
3Opened switches7-9-14-28-327-9-14-32-377-9-14-32-377-9-14-32-377-9-14-32-37
P D G (kW)/(Bus)539.7/(12)526.0/(12)246.9/(31)931.7/(8)619.2/(16)
504.5/(16)592.0/(15)179.5/(32)1068.2/(24)619.2/(29)
1753.6/(29)1125.0/(30)664.5/(33)950.3/(30)619.2/(31)
P L (kW)58.7966.6092.8758.8840.80
Losses reduction (%)71.0067.1454.1770.9579.87
V m i n (p.u.)0.98020.97580.94820.97410.9737
Time (s)3926.5
4Opened switches11-28-31-33-347-9-14-27-307-8-9-27-36
P D G (kW)/(Bus)964.6/(7)775.3/(22)614.0/(13)
896.8/(18)1285.8/(25)610.0/(29)
1438.1/(25)735.6/(33)613.0/(32)
P L (kW)53.2153.0131.17
Losses reduction (%)73.7573.8584.62
V m i n (p.u.)0.98060.97200.9804
Time (s)4764.6
Table 4. Brief of the results for the 69-bus grid.
CaseItemACSA [1]UVDA [2]SFS [4]WOA
1Opened switches69-70-71-72-73
P L (kW)224.96
Vmin (p.u.)0.9090
Time (s)0.3
2Opened switches14-57-61-69-7014-58-61-69-7014-55-61-69-7012-57-61-69-70
P L (kW)98.5998.5898.6299.80
Losses reduction (%)56.1656.1956.1755.64
V m i n (p.u.)0.94950.94950.94950.9427
Time (s)27,553.3
3Opened switches14-57-61-69-7014-58-61-69-7014-55-61-69-7012-57-61-69-70
P D G (kW)/(Bus)368.6/(12)620.0/(11)537.6/(11)572.0/(27)
1725.4/(61)1378.0/(61)1434.0/(61)205.0/(60)
466.6/(64)722.0/(64)490.3/(64)633.7/(61)
P L (kW)37.2337.8435.1728.05
Losses reduction (%)83.4583.1884.3787.53
V m i n (p.u.)0.98700.98010.98130.9707
Time (s)14,310.7
4Opened switches14-58-61-69-7014-56-61-69-7010-12-20-21-58
P D G (kW)/(Bus)541.3/(11)537.6/(11)633.7/(62)
1724.0/(61)1434.0/(61)496.0/(63)
553.6/(65)490.3/(64)607.0/(64)
P L (kW)37.0235.1619.49
Losses reduction (%)83.5484.3791.34
V m i n (p.u.)0.98690.98100.9820
Time (s)27,902.1
Disclaimer/Publisher’s Note: The statements, opinions and data contained in all publications are solely those of the individual author(s) and contributor(s) and not of MDPI and/or the editor(s). MDPI and/or the editor(s) disclaim responsibility for any injury to people or property resulting from any ideas, methods, instructions or products referred to in the content.

