Article

Evaluation of the Optimal Conditions for Oxygen-Rich and Oxygen-Lean Torrefaction of Forestry Byproduct as a Fuel

1
Department of Interdisciplinary Program in Smart Agriculture, Kangwon National University, Hyoja 2 Dong 192-1, Chuncheon-si 200-701, Republic of Korea
2
Agriculture and Life Science Research Institute, Kangwon National University, Hyoja 2 Dong 192-1, Chuncheon-si 200-701, Republic of Korea
3
Department of Biosystems Engineering, Kangwon National University, Hyoja 2 Dong 192-1, Chuncheon-si 200-701, Republic of Korea
*
Author to whom correspondence should be addressed.
Energies 2023, 16(12), 4763; https://doi.org/10.3390/en16124763
Submission received: 24 April 2023 / Revised: 9 June 2023 / Accepted: 14 June 2023 / Published: 16 June 2023
(This article belongs to the Special Issue Thermochemical Conversions of Biomass and Its Safety Evaluation)

Abstract

:
Wood biomass is an alternative to fossil fuels. However, biomass use has several limitations. Torrefaction, in which reduction conditions prevail to overcome these limitations, has been suggested. Here, torrefaction using different wood chips (Liriodendron tulipifera, Populus canadensis, Pinus rigida, and Pinus koraiensis) was conducted under oxygen-rich and oxygen-lean conditions to determine the effects of oxygen. Torrefaction was conducted at 230–310 °C for 1 h. A mass yield difference of 3.53–20.02% p (percentage point) was observed between oxygen-lean and oxygen-rich conditions. The calorific value increased by a maximum of 50.95% and 48.48% under oxygen-rich and oxygen-lean conditions, respectively. Decarbonization (DC), dehydrogenation (DH), and deoxygenation (DO) occurred in the following order because of dehydration and devolatilization during biomass torrefaction: DO > DH > DC. The calorific value of the torrefied biomass increased linearly with the extent of all three processes. The combustibility index and volatile ignitability were calculated based on proximate composition to suggest the optimal conditions for replacing anthracite and bituminous coal. This study provides suggestions for stable operation in a standard boiler design.

1. Introduction

Globally, the cost of energy sources has been increasing owing to a decrease in supply [1,2]. In the Republic of Korea, 344,499 GWh, accounting for approximately 62% of the total power generated from different energy sources, was generated by a thermal power plant in 2021 (Figure 1). The amount of electricity generated by coal was 196,333 GWh, accounting for 35.6% of the total [3]. Anthracite and bituminous coal consumption for power generation have decreased over the past decade, producing 971 × 103 and 69,094 × 103 tons, respectively, in 2020 [4]. However, these coal-fired power plants have been restricted by environmental problems and government regulations, such as renewable portfolio standards (RPS). Additionally, standard power plants, the primary type of coal-fired power plant, have a calorific value of 6080 kcal/kg (25.46 MJ/kg) coal [5]. This has drawbacks, such as high levels of greenhouse gas emissions, a heavy load on the downstream equipment, and inefficient power production [6].
Biomass has been proposed as an alternative to solid fossil fuels in this context. Compared to coal, biomass is globally distributed and has the advantage of continuous production through agriculture and forestry [7]. Generally, when plants absorb carbon dioxide from the atmosphere through photosynthesis, approximately 50% of it is released back into the atmosphere through respiration (Figure 2a), while the remaining portion is sequestered in plant biomass through growth creating biofuels biomass known as carbon-neutral fuels [8,9]. However, the carbon dioxide previously stored in biomass is transformed into biochar through a process called pyrolysis. It is understood that biochar can persist in the soil for over 100 years, even when incorporated into the soil. This has led to reports suggesting that biochar can achieve carbon negativity, thus contributing to carbon sequestration (Figure 2b) [10]. In addition, in the recent revision of the ⸢Act on the Promotion of the Development, Use, and Diffusion of New and Renewable Energy⸥ and under Article 23-2: a mandatory system for mixing new and renewable energy fuels in 2022, only unused forest biomass burning facilities received a renewable energy certificate (REC) weight of 2.0, which was considered an advantage for unused forest biomasses [11,12]. However, disadvantages associated with agricultural and forestry biomasses include a relatively low calorific value compared with that of coal and difficulty in storage and transportation owing to their hygroscopic properties and low bulk density [13]. Furthermore, during disposal and processing, concerns arise regarding the odor, emission, and leaching of hazardous components [14].
Various studies have been conducted to address these drawbacks. Some studies have been suggested as a solution to address one of the challenges associated with biomass, namely its scattered nature. Hwang et al. developed an efficient agricultural byproduct-collecting device [15]. Kim et al. developed a WiFi-based teleoperation system for forest harvesters to reduce the number of fatalities due to overturning accidents and harvesting costs [16]. To solve low calorific value and ununified characteristics, thermochemical conversion, especially torrefaction, should be one of the ways to overcome the drawbacks. According to Basu et al., torrefaction was described as a thermochemical process that involves heating biomass within a controlled environment that is either inert or has limited oxygen at temperatures ranging from 200–300 °C [17]. Lee et al. torrefied wood chips of coniferous, mixed species and reported that the mass and energy yield was suitable at 240 °C [18]. Silva et al. torrefied eucalyptus wood chips to determine structural and compositional changes during torrefaction [19]. Brachi et al. conducted torrefaction using tomato peel residues for making high-quality solid biofuel using a new bench-scale experiment [20]. Rousset et al. conducted torrefaction under different oxygen concentrations (2%, 6%, 10%, and 12%) and reported that high oxygen concentrations affect the physical and chemical properties of the substrate at 280 °C [21]. Alahakoon et al. conducted a study on the design and development of a double-chamber down draft (DcDD) pyrolysis reactor aimed at continuous biochar production utilizing rice husk [22].
To overcome the problems of low energy yield and high mass reduction of conventional torrefaction, Kim et al. developed surface torrefaction and reported an energy yield of 86.8–95.9% [23]. Mlonka-Mędrala et al. conducted pyrolysis of agricultural waste biomass. Pyrolytic gas was subjected to chemical modeling using Ansys Chemkin-Pro software, and the results were then compared with the experimental findings. Yu et al. reported that the utilization of the decoupled temperature and pressure hydrothermal system, along with the promoting effect of high-pressure water, enabled carbon sub-micron sphere production with smaller diameters. This process was faster and could be carried out at lower temperatures compared to those of previous studies [24]. These conversion processes have their disadvantages. For example, the hydrothermal carbonization of food waste to prepare hydrochar as a fuel often results in hydrochar with poor combustion and mechanical properties [25]. Due to targets on bio-oil, pyrolysis has disadvantages for biochar production [26]. Contrary to this popular view, Basu et al. reported that the effect of oxygen concentration on the calorific value of torrefied biomass products is marginal [27]. Sun et al. reported that torrefaction temperature and oxygen concentration significantly influenced bamboo pyrolysis [28].
Therefore, to resolve these conflicting results, this study aims to investigate the differences in torrefaction between oxygen-rich and oxygen-lean conditions. Furthermore, optimal conditions were suggested based on various evaluation criteria.

2. Materials and Methods

The wood chips used in this study were unused raw timber wood production by-products from harvesting, tree species renewal, and felling for mountain development. Two types of hardwood chips (Liriodendron tulipifera [LT] and Populus canadensis [PC]) and softwood chips (Pinus rigida [LP] and Pinus koraiensis [KP]) were used. Wood chips were provided by the Forest Management Technology Research Center of Pocheon-si, Gyeonggi-do. Table 1 lists the elemental and proximate composition of each biomass type before torrefaction (see Section 2.3.1 and Section 2.3.2 for detailed analyses).

2.1. Thermogravimetric Analysis

A thermogravimetric analyzer (Q500; TA Instruments, New Castle, DE, USA) was used to determine the thermal characteristics of each wood chip. The analysis was conducted at a heating rate of 10 °C/min from 30–850 °C under isothermal conditions for 15 min in the presence of N2 and air, respectively.

2.2. Torrefaction Experiments

Torrefaction experiments were carried out by placing 30 ± 0.5 g of the selected wood chips in a stainless steel crucible (diameter: 75 mm, height: 55 mm). The oxygen-rich torrefaction process was conducted without a lid, whereas the can was covered with a lid during the oxygen-lean torrefaction process. The experiments were performed in an electric furnace (N7/H/B410; Nabertherm GmbH, Lilienthal, Germany). The experiment was conducted for 1 h, and the process temperature ranged from 230–310 °C at 20 °C intervals. In this study, torrefaction was categorized into different levels: light (230 °C), medium (250 °C, 270 °C), and severe (290 °C, 310 °C). To differentiate between samples based on process temperature and oxidative conditions, “O” was added after the abbreviation of the samples processed under oxygen-rich conditions, and only the abbreviation was used for samples processed under oxygen-lean conditions; for instance, torrefied KP under oxygen-rich conditions at 250 °C was named as KPO250. After the experiments, the samples were cooled for 30 min to prevent rapid reactions between the activated samples and oxygen, and the resulting mass reduction was measured [29]. Based on mass reduction, the mass yield was calculated using Equation (1):
M Y   [ % ] = M t o r r M r a w × 100
where MY is the mass yield (%) and Mtorr and Mraw are the mass of biomass after and before torrefaction (g), respectively.

2.3. Fuel Characteristic Evaluation

2.3.1. Elemental Composition Changes

An elemental analyzer (FlashSmart, Thermo Fisher Scientific, Waltham, MA, USA) was used to measure the elemental composition of carbon (C), hydrogen (H), nitrogen (N), and sulfur (S). The oxygen content was calculated using Equation (2). Based on elemental analysis, a Van Krevelen diagram was generated. The CHO index was calculated, which is an indicator of the level of oxidation in a sample [30], where a higher CHO index indicates more oxidized compounds and a lower CHO index indicates that the sample contains molecules that have been reduced after being oxidized. The CHO index can range from −4 to +4 [31].
O   [ % ] = 100 ( C + H + N )
C H O   i n d e x = 2 [ O ] [ H ] [ C ]
where [O], [H], and [C] are the mole fractions of oxygen, hydrogen, and carbon in the sample, respectively.

2.3.2. Proximate Composition Changes

Based on the elemental composition, volatile matter (VM), fixed carbon (FC), and ash content (Ash) were predicted using Equations (4)–(6) [32].
V M = 13.647 0.344 C + 8.902 H + 0.547 O 2.02 N + 3.945 S
F C = 8.714 + 1.029 C 6.273 H + 0.04 O + 0.624 N 1.413 S
A s h = 100 ( V M + F C )
The results obtained using the formula and the measured values are compared and summarized in Table 2.

2.3.3. Calorific Value and Energy Yield

The calorific value was measured three times using a calorimeter (CAL-3K; DDS calorimeters, Randburg, Gauteng, South Africa) to determine the changes in calorific value based on the process temperature. Energy yield (EY) was calculated using Equation (7) to investigate the change in calorific value and to calculate the parameters related to mass loss.
Y   [ % ] = H H V t o r r e f i e d H H V r a w × M Y
HHV represents the higher calorific value (MJ/kg).

2.3.4. Decarbonization, Dehydrogenation, and Deoxygenation

Carbon composition tended to increase with increasing torrefaction severity (i.e., process temperature or time), whereas the hydrogen and oxygen compositions tended to decrease. The amount of carbon in the raw biomass (OC) is expressed as:
O c   [ g ] = W o × ( 100 M C o A s h o ) × 10 2 × Y C , O
where W is the weight of the sample (g), MC is the moisture content (%), and YC is the mass fraction of carbon (%) [33].
In this study, it was assumed that the biomass was completely dried, and the MC was 0. The subscript “O” indicates the raw materials. The amount of residual carbon in the torrefied biomass (RC) was calculated as follows:
R C   [ g ] = W o × M Y × ( 100 M t A t ) × 10 2 × Y C , t
where subscript “t” represents the torrefied residue. Therefore, decarbonization (DC), which shows the carbon loss percentage in the biomass from torrefaction, was defined as follows:
D C   [ % ] = ( 1 R c O c ) × 100
Dehydrogenation (DH) and deoxygenation (DO) can be defined in the same manner.

2.3.5. Combustion Indices

Variations in combustion indices such as fuel ratio (FR), combustibility index (CI), and volatile ignitability (VI) were used to evaluate the torrefaction efficiency and quality of the fuel. These indices were calculated using Equations (11)–(13). FR is the content of fixed carbon divided by that of volatile matter; FR, ranging from 0.5–2.0, is commonly used in coal-fired power plants [34,35]. When the fuel ratio values exceed 2.0, ignition and flame stability issues can arise [36].
F R = F C d b V M d b  
where FR is the fuel ratio, and db is the dry basis.
CI was calculated to determine the combustion characteristics of biomass (Park and Jang, 2013). In thermal power plants, CI is known to be an important consideration in coal mixing. Coal-mixed combustion occurs when the CI exceeds 8.37 MJ/kg and is considered poor when it is <12.56 MJ/kg or >23.02 MJ/kg [35,37].
C I = H H V F R × ( 115 A s h ) × 1 105
where HHV is the higher calorific value (MJ/kg), and CI is the combustibility index (MJ/kg);
VI indicates the available energy provided by the total volatiles, assuming that the fixed carbon constituting the fuel sample is solely made up of pure carbon [35,38,39]. For VI, it is recommended that, at the minimum, the VM should have a specific HHV of at least 14 MJ/kg [40].
V I = H H V d b 0.338 F C d b V M d b + M d b × 100
where VI is the volatile ignitability (MJ/kg), HHV is the higher calorific value (MJ/kg), and MC is the moisture content (%). In this study, MC was not considered, as the calculation of proximate composition was performed on a dry basis.

3. Results and Discussion

3.1. Results of the Thermogravimetric Analysis

The thermogravimetric analysis (TGA) results are presented in Figure 3. In the presence of N2, approximately 10% of the mass was lost at up to 100 °C because of water evaporation. From approximately 200–370 °C, a considerable mass loss was observed. The trend was similar in the presence of air: all biomasses showed great mass reduction at approximately 230–470 °C, although two major mass-loss steps were observed. The first step was from 230–330 °C, representing the decomposition of hemicellulose and cellulose. The second step was from 330–470 °C, likely due to cellulose and lignin combustion. There were no marked mass loss differences among the different biomass types in the first step, but softwood (KP and LP) showed less mass loss in the second step than hardwood (PC and LT). These results are comparable to those of previous studies [41,42].

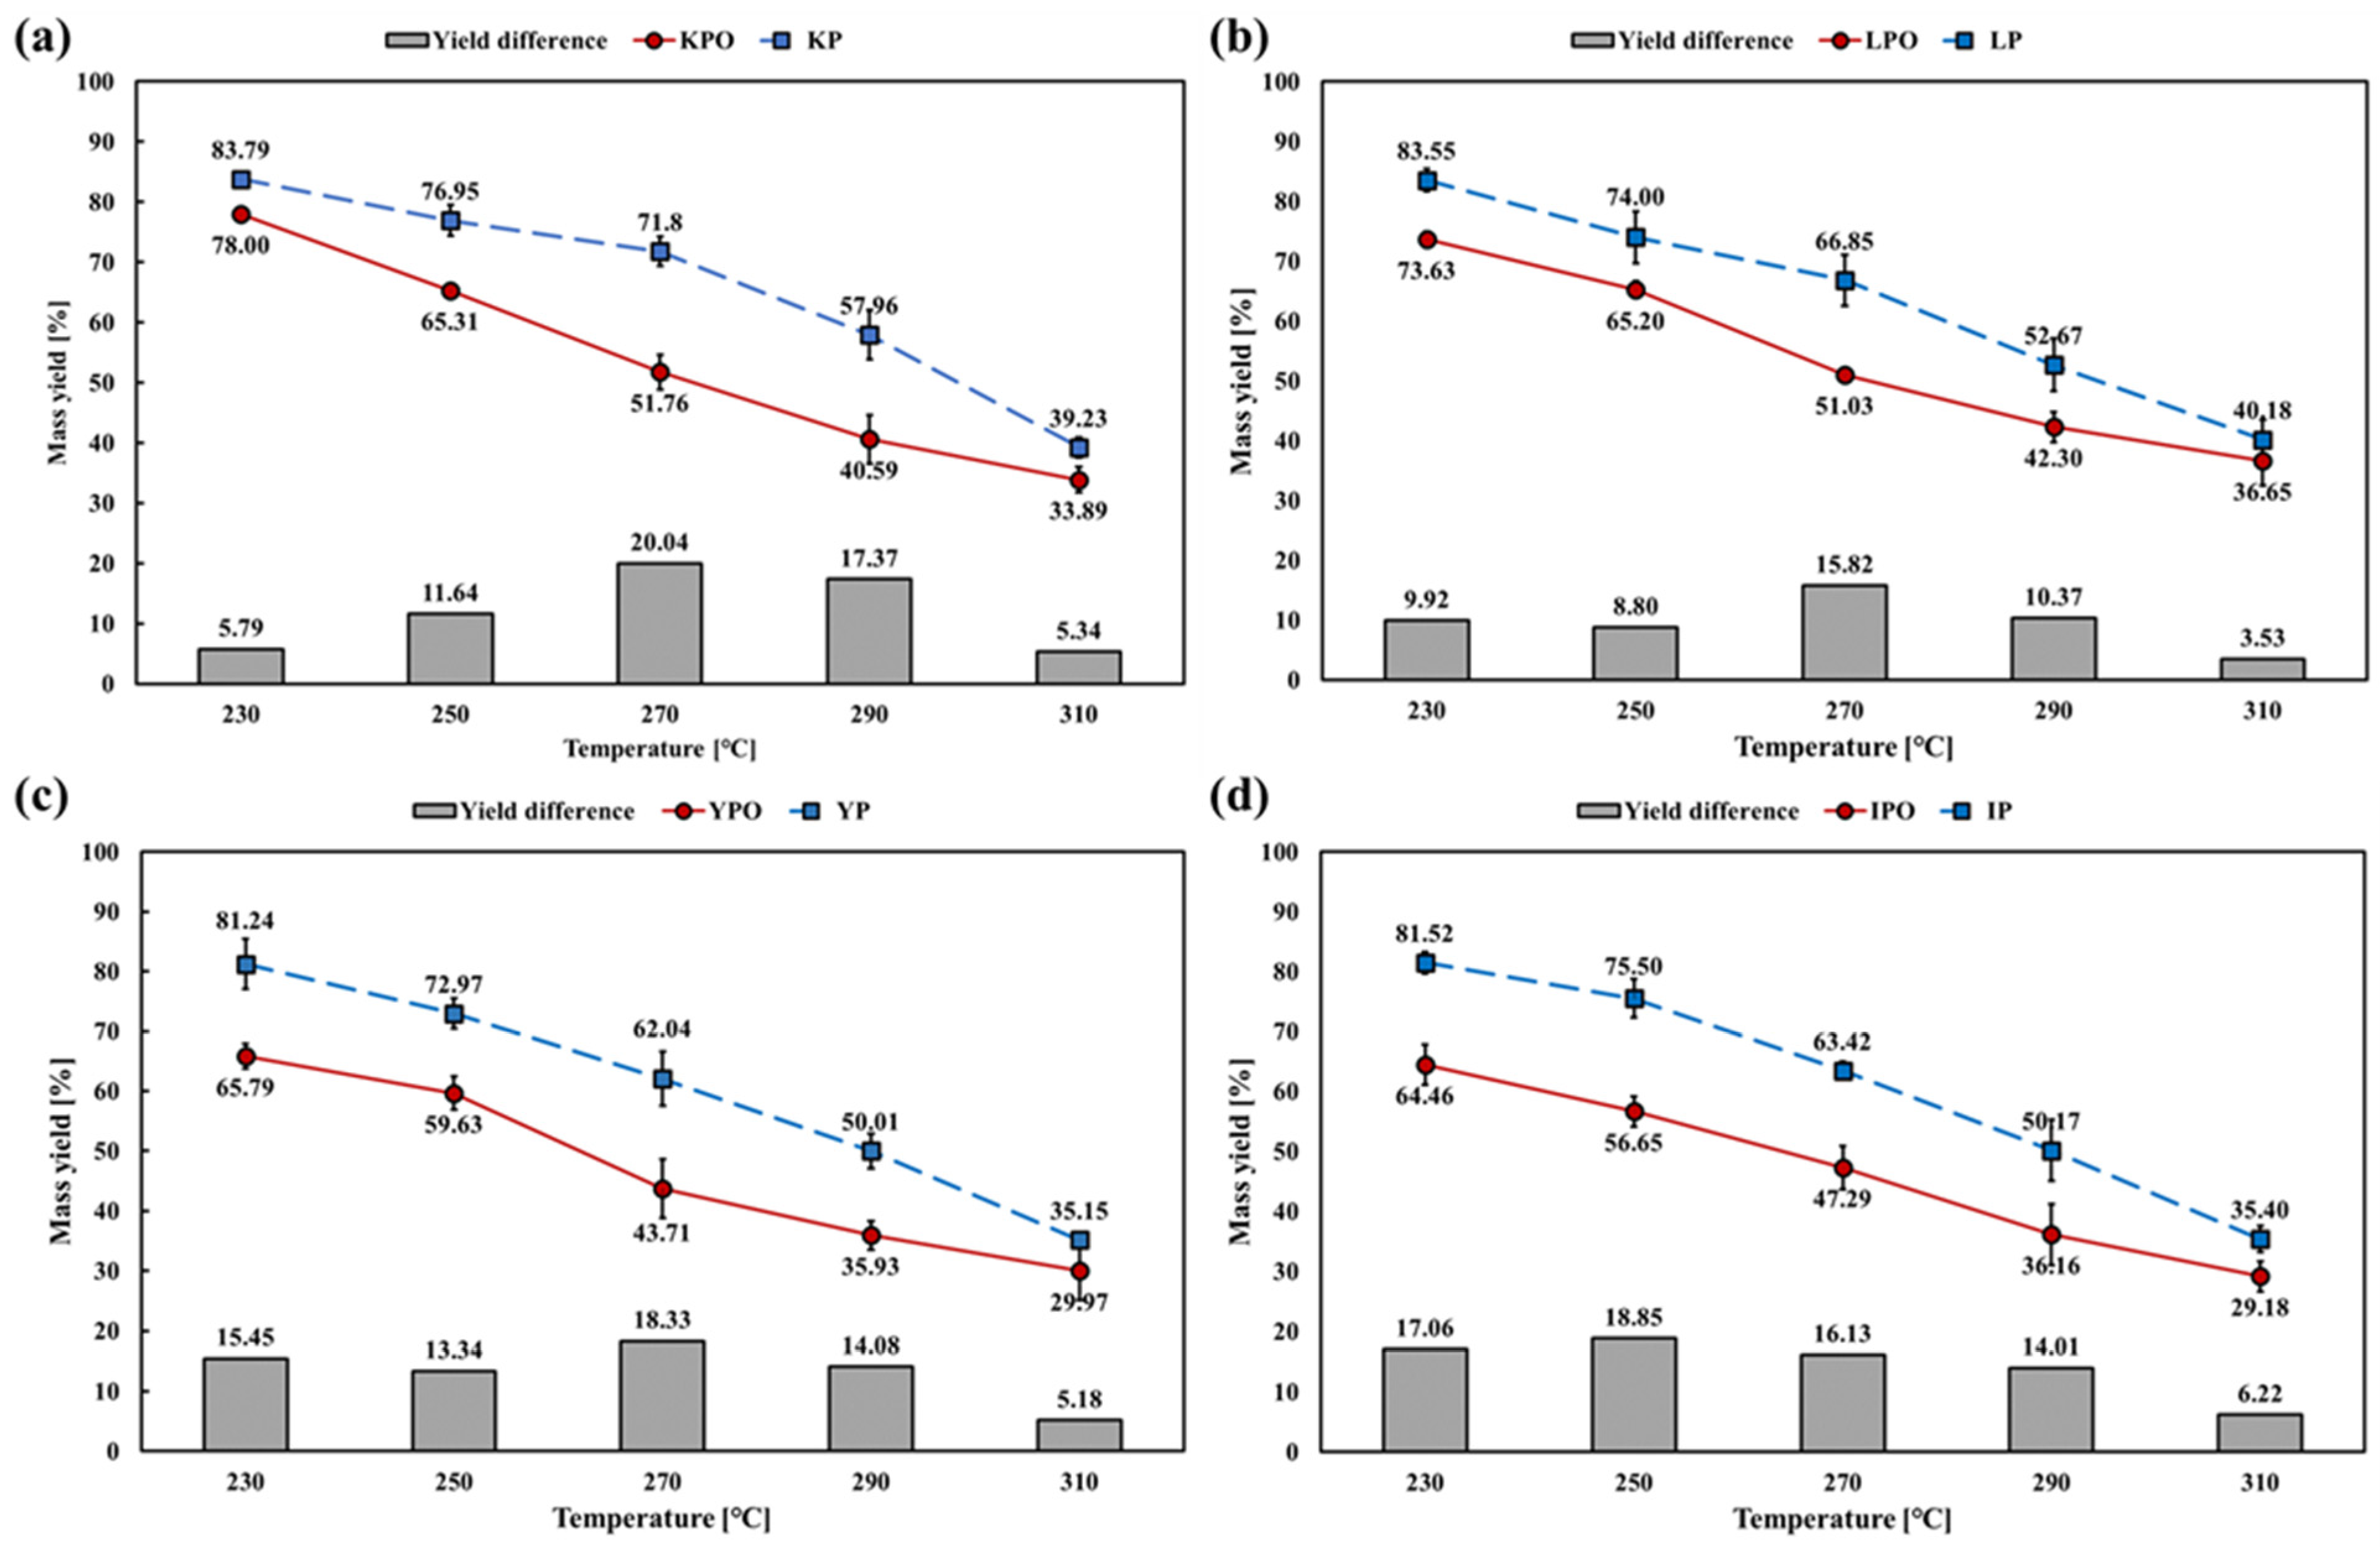
3.2. Effect on Mass Yield

The mass yields are summarized in Figure 4. The mass yield was 78.00–29.18% and 83.79–35.15% under oxygen-rich and oxygen-lean conditions, respectively. The yield difference between the oxygen conditions was 3.53–20.04% p. The maximum difference between oxygen conditions was observed at 270 °C except for LT, which showed the maximum difference at 250 °C. At 310 °C, the difference between oxygen conditions was 3.53–6.22%. Overall, softwood had a higher mass yield than hardwood because of its relatively lower thermal degradability. The mass yield with softwood under oxygen-rich conditions was similar to that under oxygen-lean conditions, the temperature of which was 20 °C higher. However, for hardwood, the mass yield at 230 °C under oxygen-rich conditions was similar to that at 270 °C under oxygen-lean conditions.

3.3. Effect on Fuel Characteristic

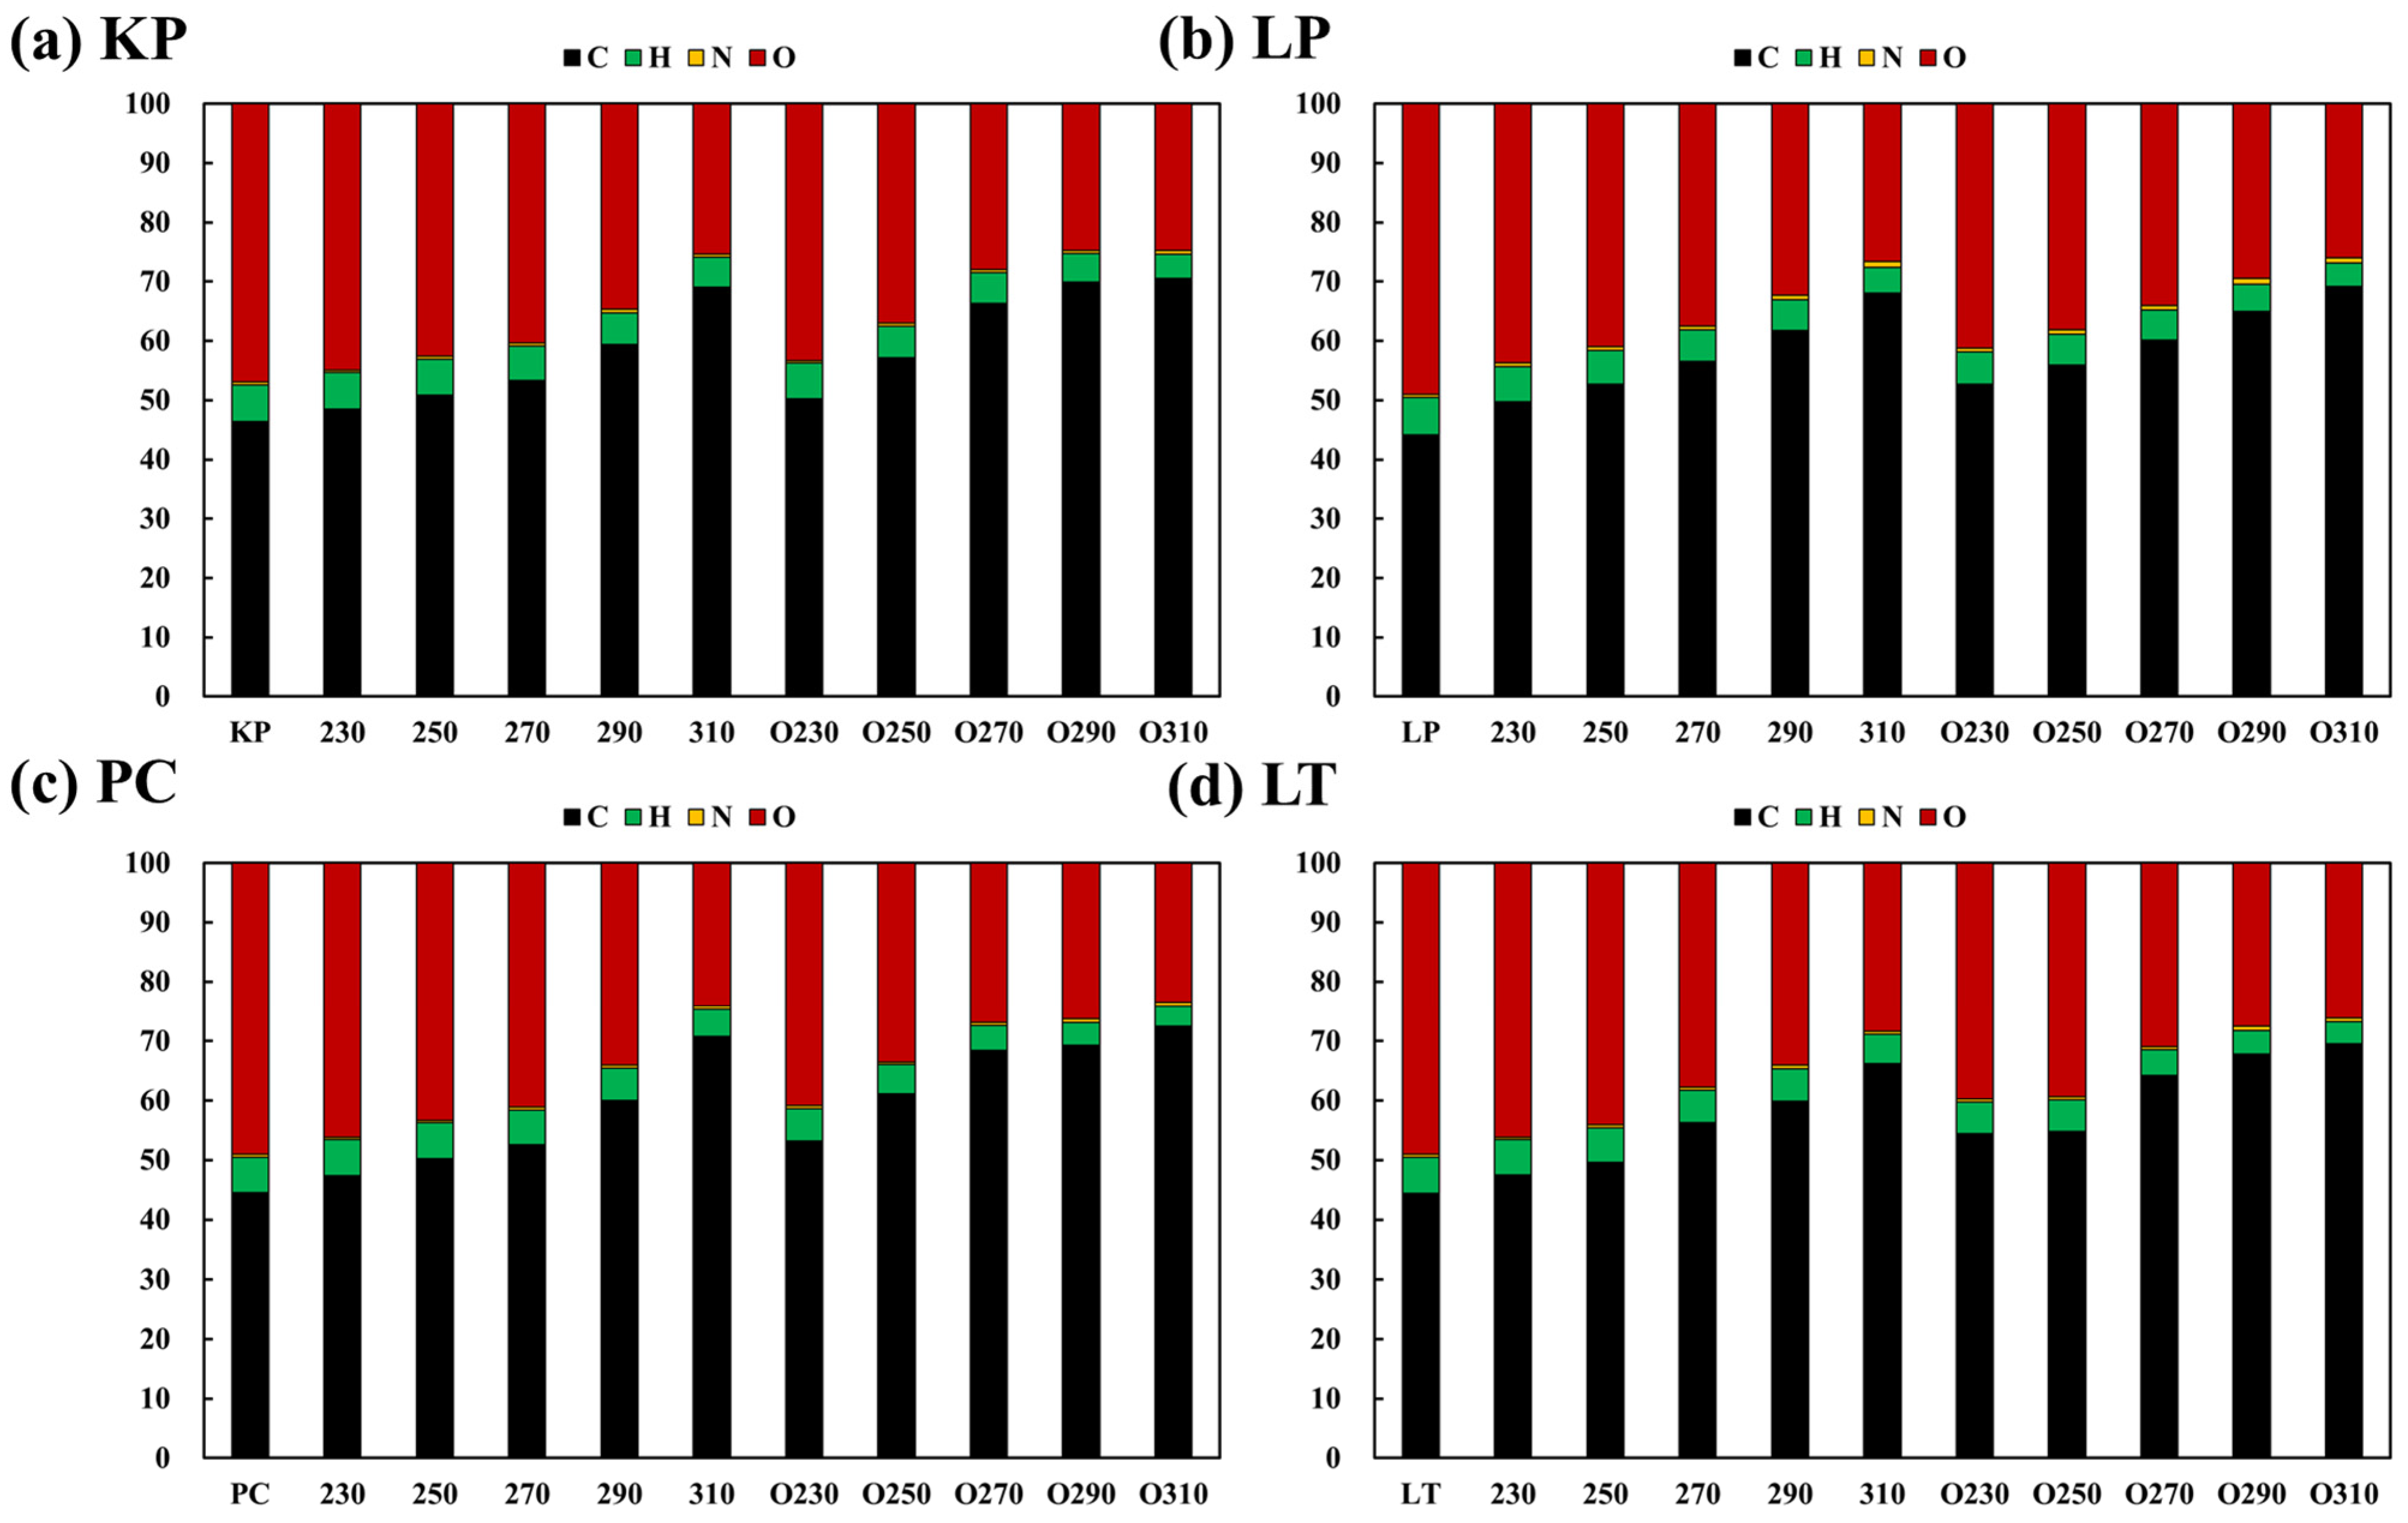
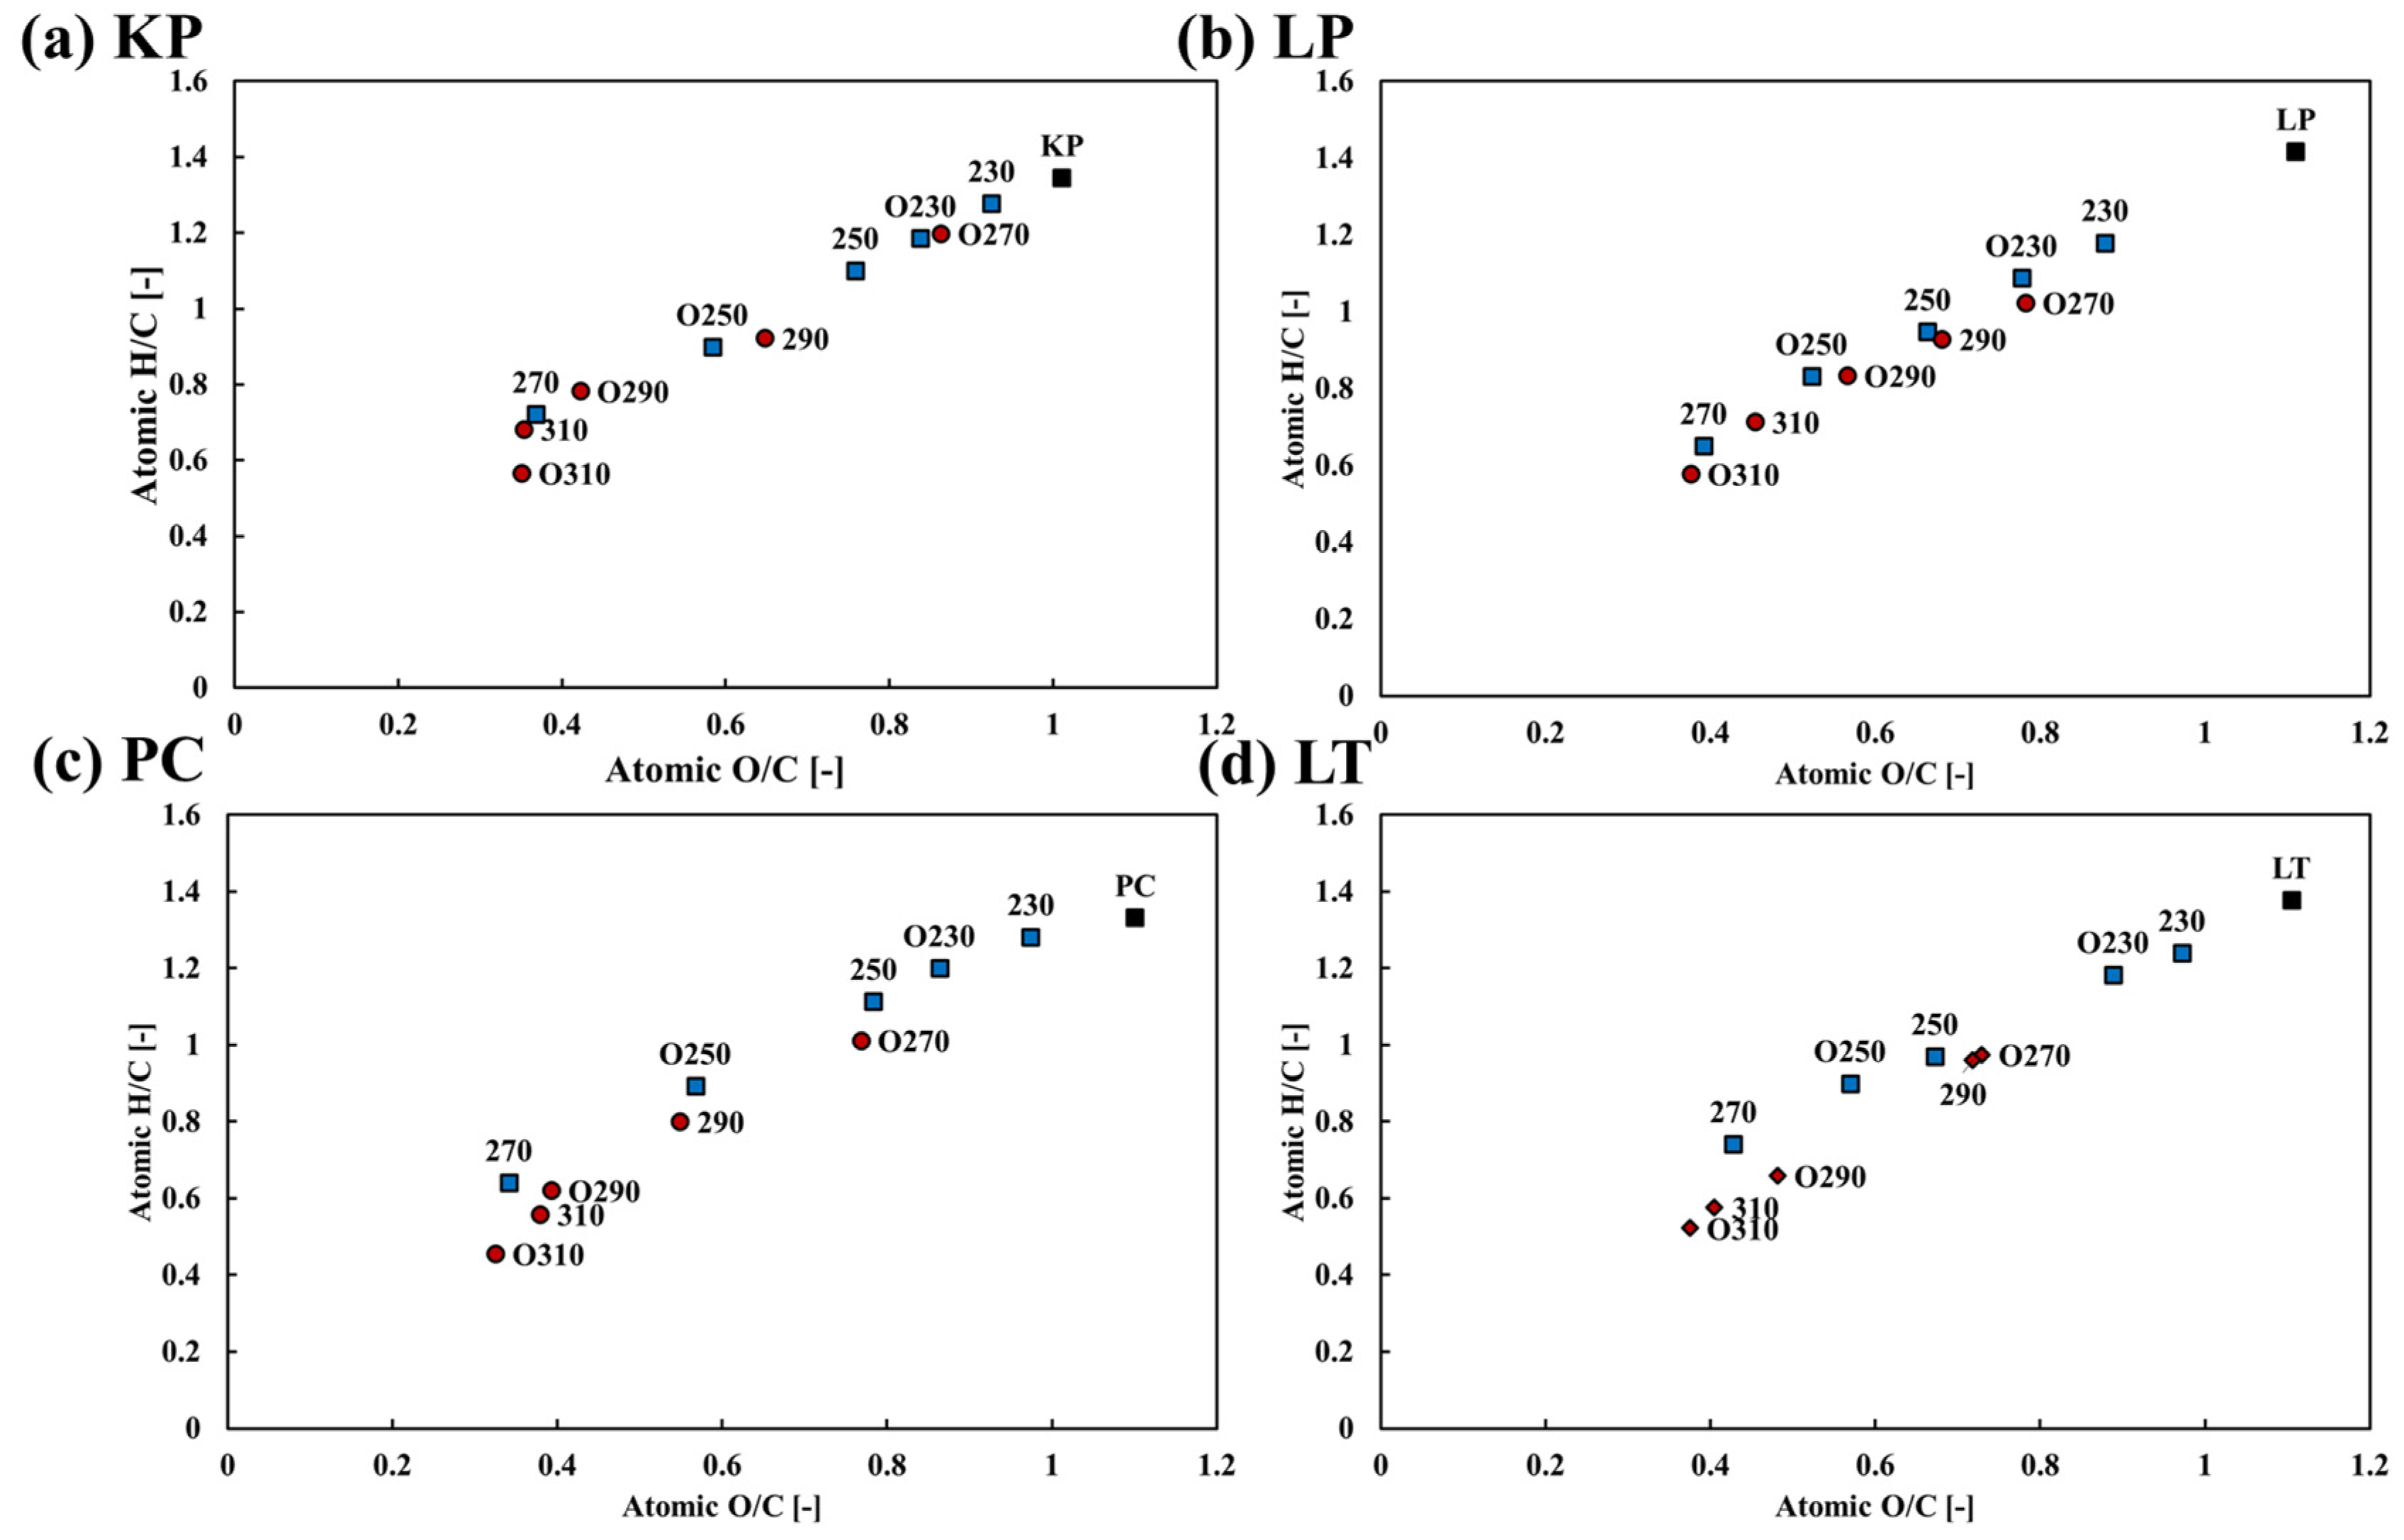
3.3.1. Effect on the Elemental Composition Ratio

As shown in Figure 5, all biomasses showed a gradual increase in the relative carbon content and a decrease in the oxygen composition ratio. The carbon composition ratio increased by 4.65–58.94% under oxygen-lean conditions and 8.32–62.88% under oxygen-rich conditions. The oxygen composition ratio under each condition decreased to 49.21–54.20% and 48.07–53.25% under oxygen-lean and oxygen-rich conditions, respectively. There was no considerable difference between KPO290 and KPO310 owing to a 1% p difference in the carbon component ratio.
In the CHO index, all types of biomasses exhibited a similar growth pattern (Figure 6) KPO230 showed a lower CHO index compared to that of other biomass due to high hydrogen content. Other biomass showed 5.3–5.4% hydrogen content under 230 °C in oxygen-rich conditions; however, KPO hydrogen content was 6%. At over 270 °C in oxygen-rich conditions, LT and PC showed similar results. However, KP and LP showed differences under 310 °C with oxygen-lean conditions. KP310 showed less carbon content (69.11%) and greater hydrogen content (4.987%) compared to that of KPO290, showing carbon and hydrogen contents at 69.98% and 4.78%, respectively. It caused a decrease in the KP310 CHO index. In contrast, LP310 showed greater carbon (68.03%) and less hydrogen content (4.43%) compared to that of LPO290, showing 64.96% carbon and 4.64% hydrogen content.
The Van Krevelen diagram (Figure 7) showed the improved biomass fuel characteristics. A sizable improvement in fuel characteristics was observed under oxygen-rich conditions. Most of the torrefied biomass showed a linear fuel characteristic improvement, whereas KPO showed a nonlinear improvement owing to its small carbon component ratio. The hardwood LTO showed rapid improvements in fuel characteristics between 250 and 270 °C, whereas KPO, LPO, and PCO showed gradual improvements.

3.3.2. Effect on the Proximate Composition Ratio

The calculated proximate compositions of the torrefied biomass are shown in Figure 8. Previous studies have shown that the amount of volatile matter decreases and that of fixed carbon increases in response to increasing torrefaction severity [43,44]. Increasing temperature induces the same response [45]. A decrease in volatile matter content and an increase in fixed carbon content in response to increasing temperature was observed. The volatile matter content decreased from a minimum of 5.13% p to a maximum of 52.20% p. The fixed carbon content increased from 4.58–49.53% p.

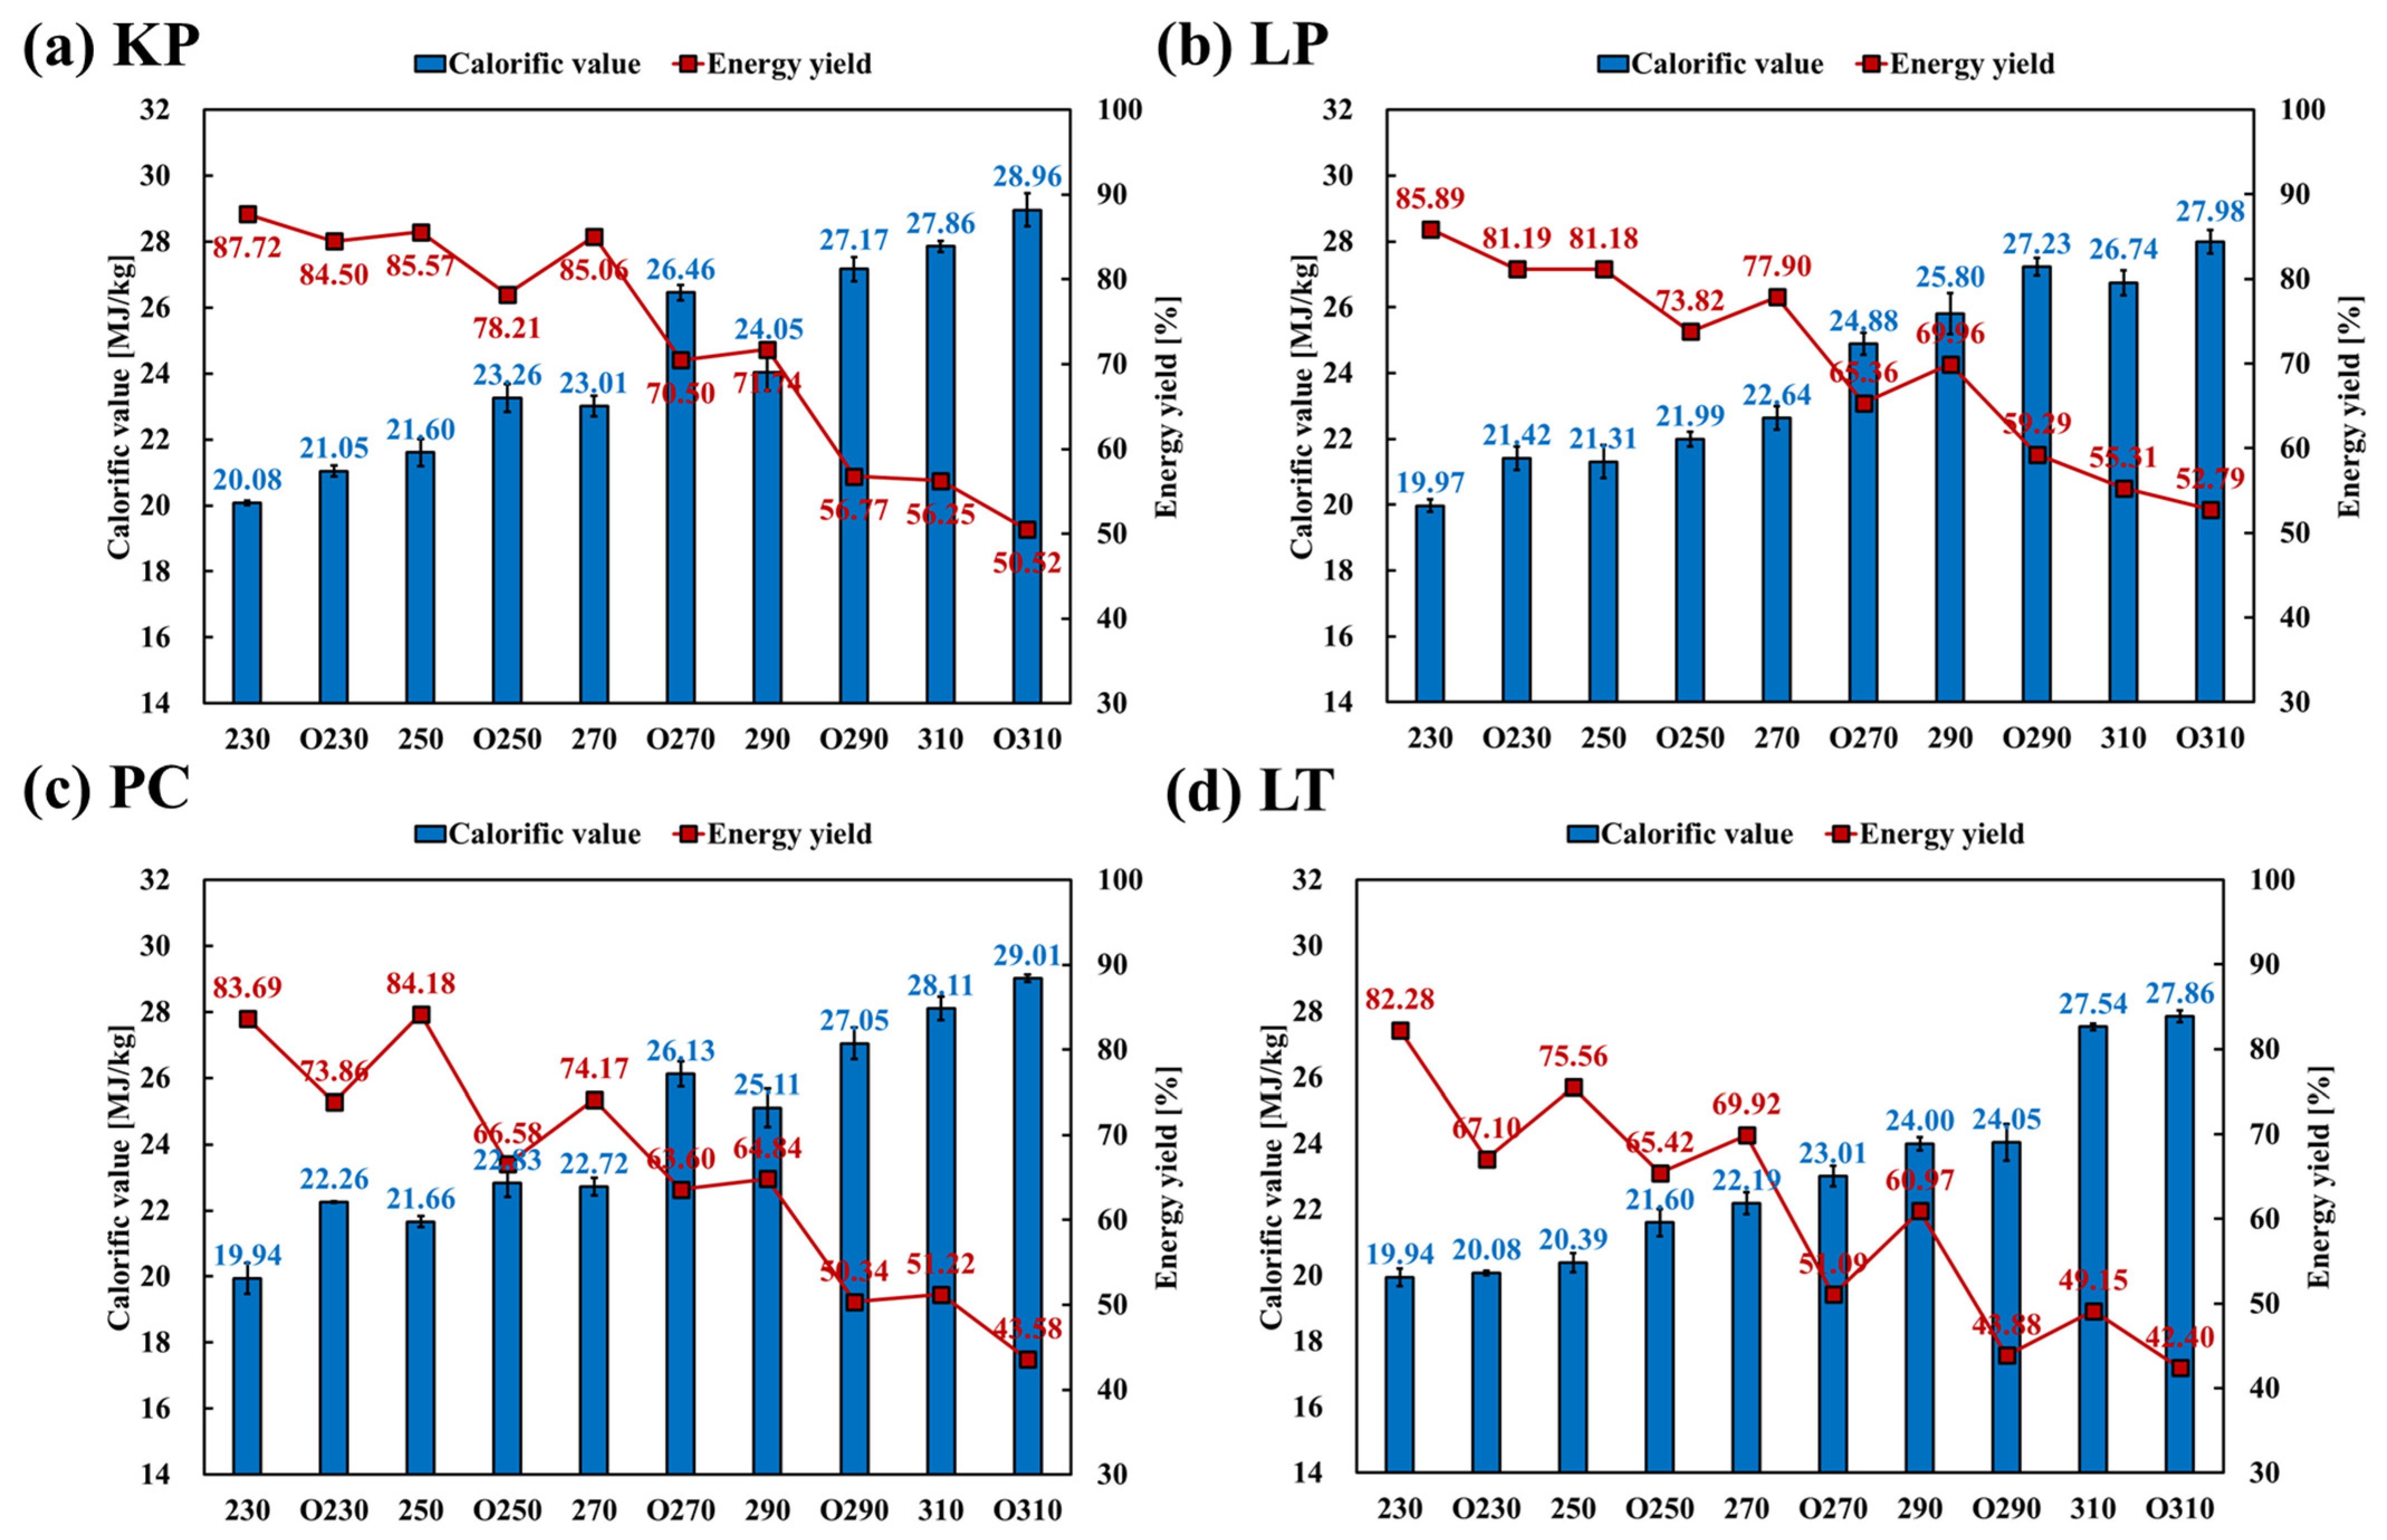
3.3.3. Effect on calorific Value and Energy Yield

Figure 9 provides a summary of calorific value and energy yield changes with respect to the process conditions. The calorific value was found to be higher at elevated temperatures and in oxygen-rich conditions. KP was 20.08–27.86 MJ/kg and 21.05–28.96 MJ/kg in oxygen-lean and oxygen-rich conditions, respectively. Moreover, PC showed the highest calorific value increase, of 19.94–28.11 MJ/kg and 22.26–29.01 MJ/kg, in oxygen-lean and oxygen-rich conditions, respectively.
Based on Duncan’s multiple range test presented in Table 3, KP and LT did not exhibit significant differences between oxygen-rich and oxygen-lean conditions at 310 °C. In general, the calorific value was higher in oxygen-rich conditions compared to that of oxygen-lean conditions. However, there were no significant differences observed among LT230, LTO230, and LT250.
The calorific values of anthracite coal, bituminous coal, and the standardized boiler design were used for comparison, with the respective grades designated as A-, B-, and S. Among the softwoods, Groups A, B, and C met the S-grade, Group D met the B-grade, and Groups E and F met the A-grade. For PC, Groups A, B, C, and D met the S-grade, Groups F, G, and H met the A-grade, and only Group E met the B-grade. Only groups A and B of LT met the S- and B-grades, respectively, despite being hardwood. Groups C, D, and E met grade A. For CV, torrefaction at 230 °C was ineffective in replacing solid fossil fuels.
The energy yields were >75% for KP270, KPO250, PC270, PCO230, LT250, LP270, and LPO230. Regardless of the temperature, the energy yield of the LTO was <70%. A rapid decrease in energy yield was observed at 290 °C between oxygen-lean and oxygen-rich conditions. All biomasses showed approximately 50% energy yield at 290 °C under oxygen-rich conditions and 310 °C under oxygen-lean conditions. Owing to its low calorific value increase relative to the mass decrease, LT showed the lowest energy yield among the biomasses.

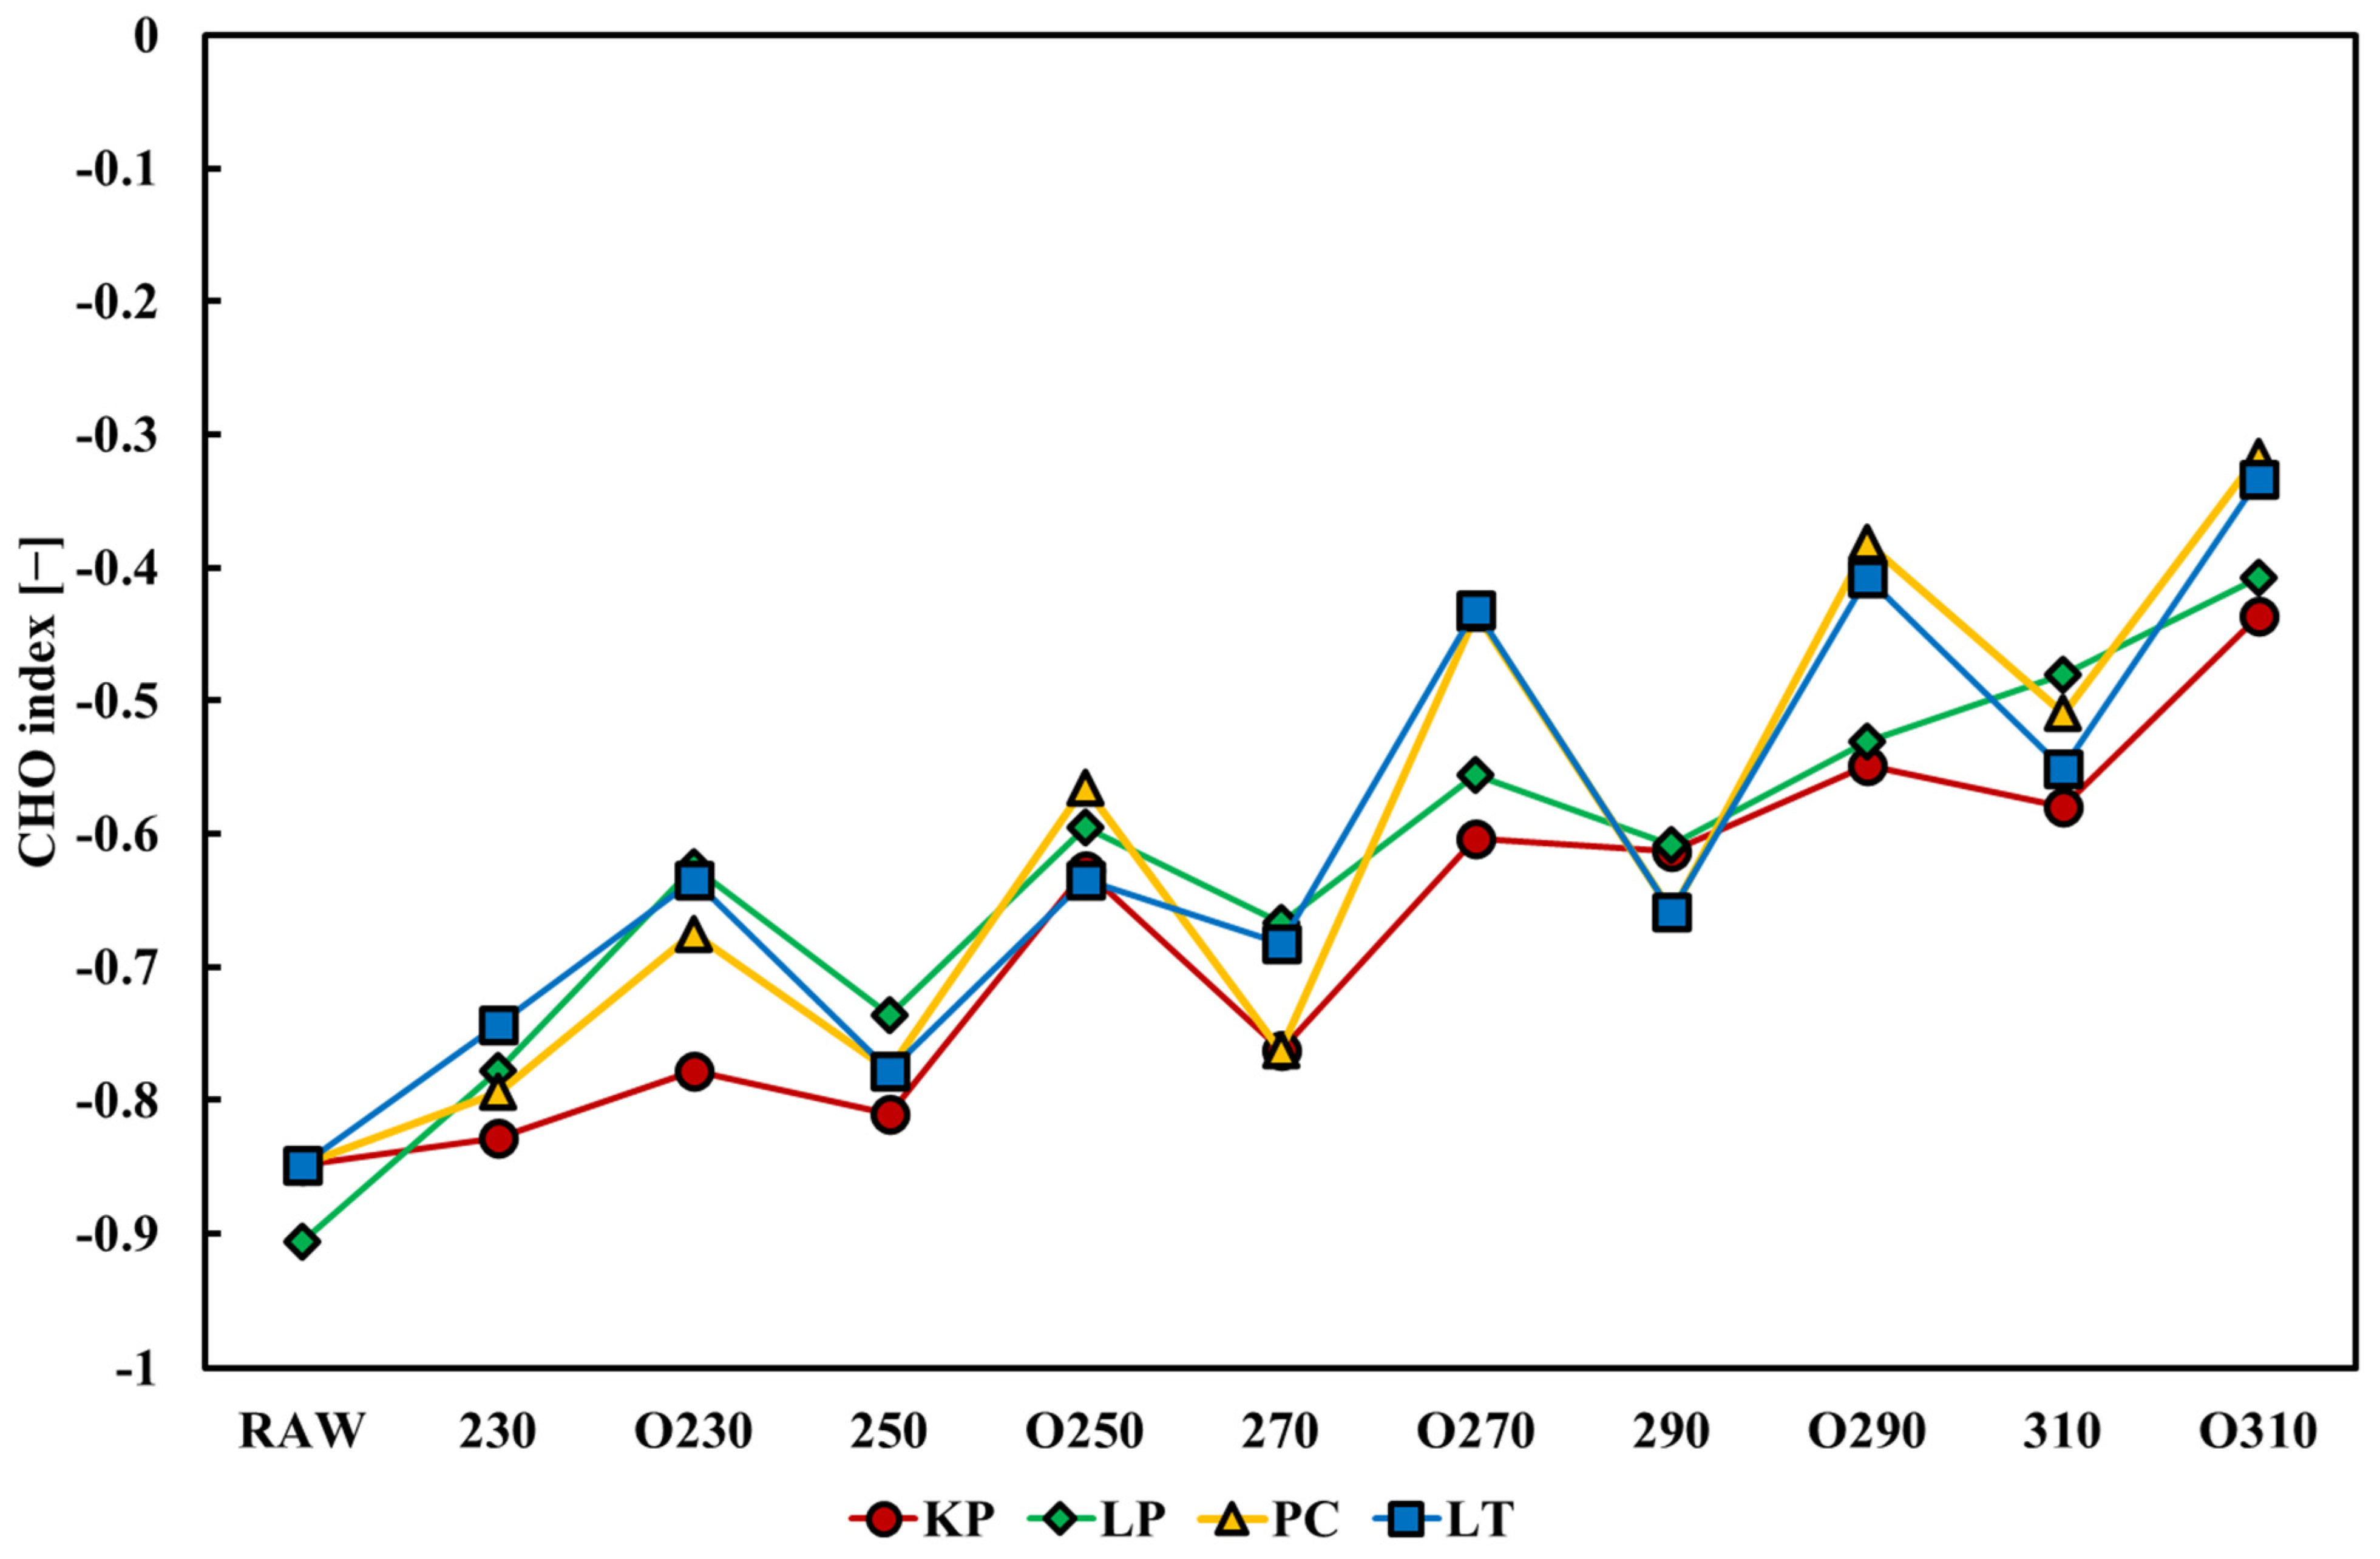
3.3.4. Effect on DC, DH, and DO

The profiles of DC, DH, and DO are shown in Figure 10. An increase in torrefaction temperature from 230–310 °C under oxygen-rich conditions had a mild influence on carbon loss and a remarkable effect on H and O losses. Overall, the DC of softwood ranged from 6.35–49.74%, whereas DH and DO ranged from 16.41–78.83% and 19.51–82.57%, respectively. The DC, DH, and DO ranges of hardwood were 12.56–54.74%, 15.79–84.20%, and 22.61–86.38%, respectively. This finding showed that at least 50.26% carbon could be held in softwood and 45.03% carbon in hardwood. However, only 22–23% and 17–18% of H and O could be held in softwood, respectively, and 16–18% and 14–16% in hardwood, respectively, under the most severe conditions (i.e., at 310 °C under oxygen-rich conditions). It was found that increasing torrefaction severity had a greater influence on DO than DC and DH, as reported previously [33]. Figure 11 shows the plots of HHV versus DC, DH, and DO. In softwood, there was a strong linear relationship between HHV and DC, DH, and DO, especially DO (R2 > 0.96). Among the hardwoods, PC showed a stronger linear correlation than LT. For PC, R2 > 0.92 for all three processes. However, the R2 of LT was 0.865 (DC), 0.7342 (DH), and 0.7714 (DO). These results indicate that the calorific value of torrefied biomass can be predicted from the DC, DH, or DO for all samples except the LT biomass.

3.3.5. Effect on Combustion Indices

Figure 12 summarizes the changes in FR and CI. For untreated samples, the FR was between 0.14–0.21 owing to the high volatile matter content and low fixed carbon of biomass. The fuel ratio increased as the temperature in the torrefaction process increased. Additionally, in the presence of oxygen at the same temperature, a higher FR was observed. Except for LP, the FR of the samples showed changes based on the oxygenated and non-oxygenated conditions, the temperature of which was 20 ℃ higher. However, LP did not show a significant difference between the oxygenated and non-oxygenated conditions compared with the other samples. Moreover, a significant linear increase in FR was observed for all samples from ≥290 °C. Under the most severe condition tested, that is, the 310 °C oxidative process, the FR of PC was the maximum (2.15), whereas the FR of LP was the minimum (1.49). The FR of torrefied softwood showed a maximum increase of 730–816% compared with that of the untreated wood, whereas the hardwood showed a maximum increase of 1214–1260%. FR exceeding 2.0 can cause ignition and flammability issues; therefore, LPO310 was considered unsuitable. The four types of wood chips showed pre-torrefaction CIs ranging from 97.45 MJ/kg for KP to 154.22 MJ/kg for PC. Post torrefaction, the CI of each biomass decreased from 75.32–13.98 MJ/kg. As the process temperature increased, the calorific value increased; however, the FR also increased, thereby decreasing CI. It was observed that the decrease in CI was more severe under oxidative conditions at the same temperature.
Figure 13 summarizes the changes in VI. KP VI was 16.45–25.31 MJ/kg and gradually increased; however, it began decreasing at 290 °C to 18.99 MJ/kg. This was caused by a significant increase in fixed carbon and a decrease in volatile matter, compared to an increase in calorific value. PC showed a rapid decrease in PCO250 compared to that of PC250 and PC270 due to a lower increase in calorific value compared with a significant increase in fixed carbon and a decrease in the volatile matter. Despite the observed decrease caused by these changes, as the process temperature increased and under oxygen-rich conditions, which can be considered more severe, the VI generally showed an increasing trend. However, for LT, a repeated increasing and decreasing trend was observed. Under oxidative conditions at <300 °C, a significant decrease in LT was observed compared with that at the same temperature under the oxygen-lean conditions. The VI of LT230, LT270 and LT290 were 16.49 MJ/kg, 16.94 MJ/kg and 18.86 MJ/kg, respectively, while that of LTO230, LTO270, and LTO290 were 13.97 MJ/kg, 13.60 MJ/kg, and 13.54 MJ/kg, respectively. However, a significant increase was observed in the 310 °C process regardless of the oxygen conditions. Combustion is considered poor if the CI of the material is <12.56 MJ/kg or >23.02 MJ/kg [35]. Therefore, PCO290, PC310, PCO310, KPO310, LTO290, LTO310, LP310, and LPO270 could be used for coal co-firing with a high energy yield. The others are suitable for biomass-only combustion owing to a CI of over 23.02 MJ/kg. It was found that II did not show a consistent trend among the biomasses, as CV, VM, and FC were significantly involved. The VI of LPO250, LT230, LT270, and LTO290 was <14 MJ/kg. Therefore, these conditions can be difficult to implement in boilers effectively.

3.4. Optimal Conditions

In terms of calorific value, regardless of the oxygen condition, KP matched the CV of anthracite and bituminous coals when the process temperature was ≥250 °C. The hardwoods matched the CV of both coals at ≥270 °C under oxygen-lean conditions and at ≥250 °C under oxygen-rich conditions. LT matched the CV of anthracite coal at 250 °C under oxygen-lean conditions and at 270 °C under oxygen-rich conditions. In terms of CI, KPO310, LPO290, LPO310, LTO270, LTO310, PC310, PCO270, PCO290, and PCO310 did not have significant disadvantages of co-firing with coal because of their CV. Other types of biomasses might be appropriate for biomass combustion only. From the perspective of VI, LP290, LT250, LTO230, and LTO270 could not be used effectively in boilers because of their low VI. Therefore, it was suggested that KP250, KPO230, LP250, LPO230, LT270, LTO250, PC250, and PCO230 can be used to replace anthracite coal. KP290, LPO270, LT290, LTO290, and PC290 are suitable substitutes for bituminous coal. The optimal fuel suggestions for stable operation in the standard boiler design are KP310, KPO270, LP310, and LT310. Furthermore, low-quality coal could be improved and co-fired with KPO310, LPO290, LPO310, LTO310, PC310, PCO270., PCO290 and PCO310. The optimal conditions are summarized in Table 4.

4. Conclusions

The aim of this study was to investigate the feasibility of using biomass from forest byproducts as a fuel source in oxygen gasification processes, compared to traditional pyrolysis. The study aimed to determine the potential for biomass gasification under different process conditions. The results confirmed that biomass calorific value could exceed that of the coal currently used in coal-fired power plants, indicating the potential for biomass as a viable alternative fuel source. The conclusions of this study can be summarized as follows:
(1).
In this study, the process temperature and oxygen conditions remarkably affected the torrefaction of unused forestry byproduct wood chips. Hardwood and softwood showed 5.18–18.85% p and 3.53–20.04% p of mass yield difference between oxygen-rich and oxygen-lean conditions, respectively.
(2).
Under oxygen-rich conditions, the carbon composition ratios of hardwood and softwood increased by 62.88% and 56.45%, respectively. The maximum increase in the relative carbon proportion of each wood type under oxygen-lean conditions were 49.21% and 53.97%, respectively.
(3).
A maximum CV increase of 50.95% under oxygen-rich conditions (from 19.18 MJ/kg to 28.96 MJ/kg) and 48.48% under oxygen-lean conditions (from 19.18 MJ/kg to 27.98 MJ/kg) was observed.
(4).
For hardwoods, KP and LP, the energy yields ranged from 59.25–87.72% and 55.31–85.89%, and from 50.52–84.50% and 52.79–81.19% under oxygen-lean and oxygen-rich conditions, respectively. In contrast, for softwoods, PC and LT, the energy yields were lower compared to those of hardwoods, showing 51.22–83.69% and 49.15–82.28%, and 43.58–73.86% and 42.40–67.10% under oxygen-lean and oxygen-rich conditions, respectively.
(5).
Decarbonization, dehydrogenation, and deoxygenation were observed in the range of 6.35–53.84%, 15.79–84.20%, and 19.51–86.38%, respectively.; these indices increased linearly with the calorific value.
(6).
The higher the temperature, the more favorable the CI for coal co-firing, similar to that under oxygen-rich conditions. II was excellent in most cases (excluding LP290, LT250, LTO230, and LTO270).
The optimum conditions for replacing anthracite coal were KP250, KPO230, LP250, LPO230, LT270, LTO250, PC250, and PCO230, and those for replacing bituminous coal were KP290, LPO270, LT290, LTO290, and PC290. KP310, KPO270, LP310, and LT310 were suggested for the stable operation of the standard boiler. Although the above results were obtained based on calorific values, it should be noted that biomass ash differs from coal in terms of its composition and properties. Therefore, further long-term combustion experiments with actual torrefied biomass are necessary to investigate its feasibility as a replacement fuel in practical applications.

Author Contributions

Conceptualization, S.Y.P., S.J.K. and D.H.K.; methodology, S.Y.P. and K.C.O.; validation, S.Y.P.; investigation, S.Y.P., S.J.K. and L.H.C.; formal analysis, S.Y.P., S.J.K., K.C.O. and Y.K.J.; writing—original draft, S.Y.P. and D.H.K.; writing—review and editing, S.Y.P. and D.H.K.; data curation, L.H.C.; writing—review and editing, D.H.K.; supervision, D.H.K. All authors have read and agreed to the published version of the manuscript.

Funding

This research was funded by the R&D Program for Forest Science Technology, project number FTIS 2021352B10-2323-AC03 supported by the Korea Forest Service (Korea Forestry Promotion Institute) and the Basic Science Research Program through the National Research Foundation of Korea (NRF) funded by the Ministry of Education, grant number 2021R1A6A1A0304424211.

Data Availability Statement

Not applicable.

Conflicts of Interest

The authors declare no conflict of interest.

References

  1. International Energy Agency. World Energy Outlook 2022; International Energy Agency: Paris, France, 2022. [Google Scholar]
  2. Kim, H. IEA’s Global Energy Demand Forecast; IEA: Ulsan, Republic of Korea, 2022. [Google Scholar]
  3. Chun, T.  Rim Yearbook of Energy Statistics 2021. 2021. Available online: http://www.kesis.net/sub/sub_0003.jsp?M_MENU_ID=M_M_002&S_MENU_ID=S_M_012 (accessed on 16 August 2022).
  4. Electric Power Statistics Information System. Power Generation Fuel Consumption Trend. Available online: https://epsis.kpx.or.kr/epsisnew/selectEkpoBftChart.do?menuId=020100&locale= (accessed on 12 August 2022).
  5. Baek, S.; Park, H.; Ko, S. Economic Evaluation of Coals Imported in Last 3 Years for Power Plant Based on Thermal Performance Analysis. J. Korean Soc. Combust. 2013, 18, 44–53. [Google Scholar] [CrossRef] [Green Version]
  6. Park, J.-H.; Lee, Y.-J.; Song, G.-S.; Park, S.-J.; Kim, J.-G.; Song, K.-H.; Choi, Y.-C. Fuel/Combustion Characterization of Glycerol-Impregnated Hybrid Coal. Proceeding Korea Soc. New Renew. Energy 2016, 178. Available online: https://www.dbpia.co.kr/journal/articleDetail?nodeId=NODE07154924R (accessed on 12 August 2022).
  7. Oh, K.C.; Park, S.Y.; Kim, S.J.; Choi, Y.S.; Lee, C.G.; Cho, L.H.; Kim, D.H. Development and Validation of Mass Reduction Model to Optimize Torrefaction for Agricultural Byproduct Biomass. Renew. Energy 2019, 139, 988–999. [Google Scholar] [CrossRef]
  8. Lee, C.-Y.; Han, S.-K. Production of Biofuels and Biochemicals by Biorefinery. Trans. Korean Hydrog. New Energy Soc. 2016, 27, 702–711. [Google Scholar] [CrossRef] [Green Version]
  9. Yu, S.; Dong, X.; Zhao, P.; Luo, Z.; Sun, Z.; Yang, X.; Li, Q.; Wang, L.; Zhang, Y.; Zhou, H. Decoupled Temperature and Pressure Hydrothermal Synthesis of Carbon Sub-Micron Spheres from Cellulose. Nat. Commun. 2022, 13, 3616. [Google Scholar] [CrossRef] [PubMed]
  10. Lehmann, J. A Handful of Carbon. Nature 2007, 447, 143–144. [Google Scholar] [CrossRef]
  11. The Ministry of Trade Industry and Energy. Act on the Promotion of the Development, Use, and Diffusion of New and Renewable Energy; The Ministry of Trade Industry and Energy: Seoul, Republic of Korea, 2022. [Google Scholar]
  12. Ministry of Trade Industry and Energy. Management and Operation Guidelines for the Mandatory Supply of New and Renewable Energy and the Mandatory Fuel Mixture System; The Ministry of Trade Industry and Energy: Seoul, Republic of Korea, 2022. [Google Scholar]
  13. Kim, S.J.; Oh, K.C.; Park, S.Y.; Ju, Y.M.; Cho, L.H.; Lee, C.G.; Kim, M.J.; Jeong, I.S.; Kim, D.H. Development and Validation of Mass Reduction Prediction Model and Analysis of Fuel Properties for Agro-Byproduct Torrefaction. Energies 2021, 14, 6125. [Google Scholar] [CrossRef]
  14. Vassilev, S.V.; Vassileva, C.G.; Vassilev, V.S. Advantages and Disadvantages of Composition and Properties of Biomass in Comparison with Coal: An Overview. Fuel 2015, 158, 330–350. [Google Scholar] [CrossRef]
  15. Hwang, S.J.; Kim, J.H.; Nam, J.S. Factorial Experiment for the Collecting Device of an Agricultural By-Product Collector. J. Biosyst. Eng. 2020, 45, 422–431. [Google Scholar] [CrossRef]
  16. Kim, G.-H.; Kim, K.-D.; Lee, H.-S.; Choi, Y.-S.; Mun, H.-S.; Oh, J.-H.; Shin, B.-S. Development of Wi-Fi-Based Teleoperation System for Forest Harvester. J. Biosyst. Eng. 2021, 46, 206–216. [Google Scholar] [CrossRef]
  17. Basu, P. Biomass Gasification, Pyrolysis and Torrefaction: Practical Design and Theory, 2nd ed.; Academic Press: Cambridge, MA, USA, 2018; Volume 2. [Google Scholar]
  18. Lee, J.-W.; Kim, Y.-H.; Lee, S.-M.; Lee, H.-W. Torrefaction Characteristics of Wood Chip for the Production of High Energy Density Wood Pellet. Korean Chem. Eng. Res. 2012, 50, 385–389. [Google Scholar] [CrossRef] [Green Version]
  19. da Silva, C.M.S.; Vital, B.R.; Carneiro, A.d.C.O.; Costa, E.V.S.; de Magalhães, M.A.; Trugilho, P.F. Structural and Compositional Changes in Eucalyptus Wood Chips Subjected to Dry Torrefaction. Ind. Crops Prod. 2017, 109, 598–602. [Google Scholar] [CrossRef]
  20. Brachi, P.; Miccio, F.; Miccio, M.; Ruoppolo, G. Torrefaction of Tomato Peel Residues in a Fluidized Bed of Inert Particles and a Fixed-Bed Reactor. Energy Fuels 2016, 30, 4858–4868. [Google Scholar] [CrossRef]
  21. Rousset, P.; MacEdo, L.; Commandré, J.M.; Moreira, A. Biomass Torrefaction under Different Oxygen Concentrations and Its Effect on the Composition of the Solid By-Product. J. Anal. Appl. Pyrolysis 2012, 96, 86–91. [Google Scholar] [CrossRef] [Green Version]
  22. Alahakoon, A.M.Y.W.; Karunarathna, A.K.; Dharmakeerthi, R.S.; Silva, F.H.C.A. Design and Development of a Double-Chamber Down Draft (DcDD) Pyrolyzer for Biochar Production from Rice Husk. J. Biosyst. Eng. 2022, 47, 458–467. [Google Scholar] [CrossRef]
  23. Kim, S.J.; Park, S.; Oh, K.C.; Ju, Y.M.; hoon Cho, L.; Kim, D.H. Development of Surface Torrefaction Process to Utilize Agro-Byproducts as an Energy Source. Energy 2021, 233, 121192. [Google Scholar] [CrossRef]
  24. Yu, S.; Zhao, P.; Yang, X.; Li, Q.; Mohamed, B.A.; Saad, J.M.; Zhang, Y.; Zhou, H. Low-Temperature Hydrothermal Carbonization of Pectin Enabled by High Pressure. J. Anal. Appl. Pyrolysis 2022, 166, 105627. [Google Scholar] [CrossRef]
  25. Sharma, H.B.; Dubey, B.K. Co-Hydrothermal Carbonization of Food Waste with Yard Waste for Solid Biofuel Production: Hydrochar Characterization and Its Pelletization. Waste Manag. 2020, 118, 521–533. [Google Scholar] [CrossRef]
  26. Hernandez-Mena, L.E.; Pecora, A.A.B.; Beraldo, A.L. Slow Pyrolysis of Bamboo Biomass: Analysis of Biochar Properties. Chem. Eng. Trans. 2014, 37, 115–120. [Google Scholar] [CrossRef]
  27. Basu, P.; Dhungana, A.; Rao, S.; Acharya, B. Effect of Oxygen Presence in Torrefier. J. Energy Inst. 2013, 86, 171–176. [Google Scholar] [CrossRef]
  28. Sun, Y.; Sun, Y.; Chen, W.; Wang, S.; Liang, G.; Li, W.; Ma, Z.; Zhang, W. Effect of Torrefaction Temperature and O2 Concentration on the Pyrolysis Behaviour of Moso Bamboo. Bioresources 2020, 15, 6344–6370. [Google Scholar] [CrossRef]
  29. Cruz Ceballos, D.C.; Hawboldt, K.; Hellleur, R. Effect of Production Conditions on Self-Heating Propensity of Torrefied Sawmill Residues. Fuel 2015, 160, 227–237. [Google Scholar] [CrossRef]
  30. Mann, B.F.; Chen, H.; Herndon, E.M.; Chu, R.K.; Tolic, N.; Portier, E.F.; Chowdhury, T.R.; Robinson, E.W.; Callister, S.J.; Wullschleger, S.D.; et al. Indexing Permafrost Soil Organic Matter Degradation Using High-Resolution Mass Spectrometry. PLoS ONE 2015, 10, e0130557. [Google Scholar] [CrossRef] [PubMed]
  31. Cai, J.; He, Y.; Yu, X.; Banks, S.W.; Yang, Y.; Zhang, X.; Yu, Y.; Liu, R.; Bridgwater, A.V. Review of Physicochemical Properties and Analytical Characterization of Lignocellulosic Biomass. Renew. Sustain. Energy Rev. 2017, 76, 309–322. [Google Scholar] [CrossRef] [Green Version]
  32. Park, S.; Kim, S.J.; Oh, K.C.; Cho, L.H.; Kim, D. Developing a Proximate Component Prediction Model of Biomass Based on Element Analysis. Energies 2023, 16, 509. [Google Scholar] [CrossRef]
  33. Chen, Y.C.; Chen, W.H.; Lin, B.J.; Chang, J.S.; Ong, H.C. Impact of Torrefaction on the Composition, Structure and Reactivity of a Microalga Residue. Appl. Energy 2016, 181, 110–119. [Google Scholar] [CrossRef]
  34. Makino, H.; Tanno, K. Coal Combustion for Power Production, 1st ed.; CRC Press: Boca Raton, FL, USA, 2015; pp. 263–265. ISBN 9780367783303. [Google Scholar]
  35. Ohm, T.I.; Chae, J.S.; Kim, J.K.; Oh, S.C. Study on the Characteristics of Biomass for Co-Combustion in Coal Power Plant. J. Mater. Cycles Waste Manag. 2015, 17, 249–257. [Google Scholar] [CrossRef]
  36. Solihull, E.; Williamson, J.; Wigley, F. The Impact of Ash Deposition on Coal Fired Plants. In Proceedings of the Engineering Foundation Conference, Solihull, UK, 20–25 June 1994. [Google Scholar]
  37. Jo, E.-J.; Jin, Y.-G.; Hyeon, W.-S.; Han, H.-G.; Min, S.-U.; Yeo, W.-H. A Study on the Characteristics of Waste Biomass Fuel by the Conditions of Torrefaction and Biomass Mixing Ratio. J. Korea Org. Resour. Recycl. Assoc. 2018, 26, 75–84. [Google Scholar] [CrossRef]
  38. Singh, S.; Chakraborty, J.P.; Mondal, M.K. Torrefaction of Woody Biomass (Acacia Nilotica): Investigation of Fuel and Flow Properties to Study Its Suitability as a Good Quality Solid Fuel. Renew. Energy 2020, 153, 711–724. [Google Scholar] [CrossRef]
  39. Akogun, O.A.; Waheed, M.A. Property Upgrades of Some Raw Nigerian Biomass through Torrefaction Pre-Treatment—A Review. J. Phys. Conf. Ser. 2019, 1378, 032026. [Google Scholar] [CrossRef]
  40. Asthana, A.K. Coal Blending and Its Effects on Boiler Performance. 2015. Available online: https://www.scribd.com/document/331240839/Coal-Blending-and-Its-Effects-on-Boiler-Performance (accessed on 13 March 2023).
  41. Xu, X.; Pan, R.; Chen, R. Comparative Thermal Degradation Behaviors and Kinetic Mechanisms of Typical Hardwood and Softwood in Oxygenous Atmosphere. Processes 2021, 9, 1598. [Google Scholar] [CrossRef]
  42. Kim, Y.M.; Han, T.U.; Hwang, B.A.; Lee, B.; Lee, H.W.; Park, Y.K.; Kim, S. Pyrolysis Kinetics and Product Properties of Softwoods, Hardwoods, and the Nut Shell of Softwood. Korean J. Chem. Eng. 2016, 33, 2350–2358. [Google Scholar] [CrossRef]
  43. Cho, H.S.; Sung, Y.J.; Kim, C.H.; Lee, G.S.; Yim, S.J.; Nam, H.G.; Lee, J.Y.; Kim, S. Bin Study of Oil Palm Biomass Resources (Part 3) Torrefaction of Oil Palm Biomass. J. Korea Tech. Assoc. Pulp Pap. Ind. 2014, 46, 18–28. [Google Scholar] [CrossRef] [Green Version]
  44. Wang, L.; Riva, L.; Skreiberg, Ø.; Khalil, R.; Bartocci, P.; Yang, Q.; Yang, H.; Wang, X.; Chen, D.; Rudolfsson, M.; et al. Effect of Torrefaction on Properties of Pellets Produced from Woody Biomass. Energy Fuels 2020, 34, 15343–15354. [Google Scholar] [CrossRef]
  45. Homdoung, N.; Sasujit, K.; Uttharuan, J.; Tippayawong, N. Influence of Torrefaction Temperature and Time on the Yields and Properties of Torrefied Biomass. Eng. Appl. Sci. Res. 2019, 46, 170–175. [Google Scholar] [CrossRef]
Figure 1. Power generation (in GWh) by energy source in the Republic of Korea in 2021 [3].
Energies 16 04763 g001
Figure 2. Description of (a) carbon neutral and (b) carbon sequestration.
Energies 16 04763 g002
Figure 3. Results of thermogravimetric analysis in the presence of N2 (left) and air (right). KP, Pinus koraiensis; LP, Pinus rigida; PC, Populus canadensis; LT, Liriodendron tulipifera.
Energies 16 04763 g003
Figure 4. Mass yield and yield difference between oxygen-rich (O) and oxygen-lean conditions for (a) Pinus koraiensis, (b) Pinus rigida, (c) Populus canadensis, and (d) Liriodendron tulipifera.
Energies 16 04763 g004
Figure 5. Elemental composition changes of (a) Pinus koraiensis, (b) Pinus rigida, (c) Populus canadensis, and (d) Liriodendron tulipifera after torrefaction at various temperatures (230–310 °C) and under oxygen-lean and oxygen-rich conditions (O).
Energies 16 04763 g005
Figure 6. Changes in CHO index according to process conditions of Pinus koraiensis (KP), Pinus rigida (LP), Populus canadensis (PC), and Liriodendron tulipifera (LT).
Energies 16 04763 g006
Figure 7. Van Krevelen diagram for (a) Pinus koraiensis, (b) Pinus rigida, (c) Populus canadensis, and (d) Liriodendron tulipifera after torrefaction at various temperatures (230–310 °C) and under oxygen-lean and oxygen-rich conditions (O).
Energies 16 04763 g007
Figure 8. Calculated proximate composition of (a) Pinus koraiensis, (b) Pinus rigida, (c) Populus canadensis, and (d) Liriodendron tulipifera after torrefaction at various temperatures (230–310 °C) and under oxygen-lean and oxygen-rich conditions (O). FC, fixed carbon; VM, volatile matter; Ash, ash content.
Energies 16 04763 g008
Figure 9. Calorific value and energy yield of (a) Pinus koraiensis, (b) Pinus rigida, (c) Populus canadensis, and (d) Liriodendron tulipifera after torrefaction at various temperatures (230–310 °C) and under oxygen-lean and oxygen-rich conditions (O).
Energies 16 04763 g009
Figure 10. Profiles of decarbonization (DC), dehydrogenation (DH), and deoxygenation (DO) of (a) Pinus koraiensis, (b) Pinus rigida, (c) Populus canadensis, and (d) Liriodendron tulipifera after torrefaction at various temperatures (230–310 °C) and under oxygen-lean and oxygen-rich conditions (O).
Energies 16 04763 g010
Figure 11. Profiles and linear regression of HHV versus decarbonization (CD), dehydrogenation (DH), and deoxygenation (DO) of (a) Pinus koraiensis, (b) Pinus rigida, (c) Populus canadensis, and (d) Liriodendron tulipifera.
Energies 16 04763 g011
Figure 12. Changes in combustibility index and fuel ratio of (a) Pinus koraiensis, (b) Pinus rigida, (c) Populus canadensis, and (d) Liriodendron tulipifera after torrefaction at various temperatures (230–310 °C) and under oxygen-lean and oxygen-rich conditions (O).
Energies 16 04763 g012
Figure 13. Changes in volatile ignitability of (a) Pinus koraiensis, (b) Pinus rigida, (c) Populus canadensis, and (d) Liriodendron tulipifera after torrefaction at various temperatures (230–310 °C) and under oxygen-lean and oxygen-rich conditions (O).
Energies 16 04763 g013
Table 1. Proximate and ultimate analyses of wood chips.
Ultimate Analysis
[db%]
Proximate AnalysisCalorific Value
[MJ/kg]
CHNO *MC
[%ar]
VM
[%db]
FC
[%db]
Ash
[%db]
KP46.386.240.4846.8915.681.117.21.719.18
LP44.186.260.5349.0325.283.215.21.619.43
PC44.536.100.4448.9327.684.614.41.019.32
LT44.366.110.5149.0113.187.212.10.719.69
KP, Pinus koraiensis; LP, Pinus rigida; PC, Populus canadensis; LT, Liriodendron tulipifera; ar, air-dried basis; db, dry-bassis, MC, moisture content; VM, Volatile matter; FC, Fixed carbon; * oxygen was calculated as 100 − (C + H + N).
Table 2. Result of measured and calculated value of proximate composition.
VM [db%]FC [db%]Ash [db%]
KPMeasured [%]81.1017.201.70
Calculated [%]77.9219.472.61
Difference [%p]3.18−2.27−0.91
LPMeasured [%]83.2015.201.60
Calculated [%]79.9217.202.88
Difference [%p]3.28−2.00−1.28
PCMeasured [%]84.6014.401.00
Calculated [%]78.5118.502.99
Difference [%p]6.09−4.10−1.99
LTMeasured [%]83.2015.201.60
Calculated [%]78.5918.293.13
Difference [%p]4.61−3.09−1.53
KP, Pinus koraiensis; LP, Pinus rigida; PC, Populus canadensis; LT, Liriodendron tulipifera; %p: percentage point.
Table 3. Result of Duncan’s multiple test and calorific value.
NameCVNameCVNameCVNameCV
KPO310 A28.96 (S)LPO310A27.98 (S)PCO310 A29.01 (S)LTO310 A27.86 (S)
KP310A27.86 (S)LPO290 B27.23 (S)PC310 B28.11 (S)LT310 A27.54 (S)
KPO290B27.17 (S)LP310 B26.74 (S)PCO290 C27.05 (S)LTO290 B24.05 (B)
KPO270C26.46 (S)LP290 C25.80 (S)PCO270 D26.13 (S)LT290 B24.00 (B)
KP290D24.05 (B)LPO270 D24.88 (B)PC290 E25.11 (B)LTO270 C23.01 (A)
KPO250E23.26 (A)LP270 E22.64 (A)PCO250F22.83 (A)LT270 D22.19 (A)
KP270E23.01 (A)LPO250 F21.99 (A)PC270 F, G22.72 (A)LTO250 E21.60 (A)
KP250F21.60 (A)LPO230 G21.42 (A)PCO230 G22.26 (A)LT250 F20.39 (-)
KPO230G21.05 (A)LP250 G21.31 (A)PC250 H21.66 (A)LTO230 F20.08 (-)
KP230H20.08 (-)LP230 H19.97 (-)PC230 I19.94 (-)LT230 F19.94 (-)
Superscript letters indicate significant differences. Letters in parentheses indicate the grade. KP, Pinus koraiensis; LP, Pinus rigida; PC, Populus canadensis; LT, Liriodendron tulipifera; all under oxygen-lean conditions; O, oxygen-rich conditions. Numbers in the name indicate temperatures used during torrefaction.
Table 4. Optimum conditions under various criteria for each biomass.
Temp (℃) CVCIVIEYResult CVCIVIEYResult
RAWKP--O--LT--O--
Oxygen-lean230--O----O--
250A-OOA--X--
270A-OX-A-OOA
290B-OOBB-OOB
310S-OOSS-OOS
Oxygen-rich230A-OOA--X--
250A-OO-A-OOA
270S-OOSACOX--
290S-OX-B-OO-
310SCOOXCOSCOO-CO
RAWLP--O- PC--O--
Oxygen-lean230--O- --O--
250A-OOAA-OOA
270A-OX A-OX-
290S-XX B-OO-
310S-OOSSCOO-CO
Oxygen-rich230A-OOAA-OO
250A-OX A-OX-
270B-OOBBCOO-CO
290SCOOXCOBCOO-CO
310SCOOXCOSCOO-CO
S, standardized boiler design; A, anthracite coal; B, bituminous coal; CO, co-firing with coal; KP, Pinus koraiensis; LP, Pinus rigida; PC, Populus canadensis; LT, Liriodendron tulipifera; CV, calorific value, CI, combustibility index; VI, volatile ignitability; EY, energy yield.
Disclaimer/Publisher’s Note: The statements, opinions and data contained in all publications are solely those of the individual author(s) and contributor(s) and not of MDPI and/or the editor(s). MDPI and/or the editor(s) disclaim responsibility for any injury to people or property resulting from any ideas, methods, instructions or products referred to in the content.

