


Can Xylose Be Fermented to Biofuel Butanol in Continuous Long-Term Reactors: If Not, What Options Are There?
by
 , , ,
, , ,
Nasib Qureshi
1,*,
Xiaoqing Lin
2,
Shunhui Tao
2,
Siqing Liu
3,
Haibo Huang
4 and
Nancy N. Nichols
1 1
Bioenergy Research Unit, National Center for Agricultural Utilization Research (NCAUR), Agricultural Research Service (ARS), United States Department of Agriculture (USDA), 1815 N University Street, Peoria, IL 61604, USA
2
Guangdong Provincial Key Laboratory of Plant Resources Biorefinery, School of Chemical Engineering and Light Industry, Guangdong University of Technology, No. 100 Waihuan Xi Road, Panyu District, Guangzhou 510006, China
3
Renewable Products Technology Research Unit, National Center for Agricultural Utilization Research (NCAUR), Agricultural Research Service (ARS), United States Department of Agriculture (USDA), 1815 N University Street, Peoria, IL 61604, USA
4
Department of Food Science & Technology, Virginia Polytechnic Institute and State University, 1230 Washington Street SW, Blacksburg, VA 24061, USA
*
Author to whom correspondence should be addressed.
Energies 2023, 16(13), 4945; https://doi.org/10.3390/en16134945
Submission received: 9 May 2023
/
Revised: 20 June 2023
/
Accepted: 21 June 2023
/
Published: 26 June 2023
(This article belongs to the Special Issue Bio-Waste to Energy and Added Value Products – Challenges and Opportunities)
Abstract
:This study applied concentrated xylose (60–250 g/L) medium to produce butanol (acetone butanol ethanol, or ABE). A control batch fermentation of 61 g/L initial glucose using Clostridium beijerinckii P260 resulted in a productivity and yield of 0.33 g/L·h and 0.43 g/g, respectively. Use of 60 g/L xylose in a batch system resulted in productivity and yield of 0.26 g/L·h, and 0.40 g/g, respectively. In these two experiments, the culture fermented 89.3% glucose and 83.6% of xylose, respectively. When ABE recovery was coupled with fermentation for continuous solvent removal, the culture fermented all the added xylose (60 g/L). This system resulted in a productivity and yield of 0.66 g/L·h and 0.44 g/g, respectively. When the sugar concentration was further increased above 100 g/L, only a small fraction of the sugar was fermented in batch cultures without product removal. However, with simultaneous product removal, all the xylose (150 g/L) was fermented provided the culture was fed with nutrients intermittently. In this system, 66.32 g/L ABE was produced from 150 g/L xylose with a productivity of 0.44 g/L·h and yield of 0.44 g/g. Using the integrated culture system allowed sugar consumption to be increased by 300% (150 g/L). The continuous system using xylose as a feed did not sustain and after 36 days (864 h) of fermentation, it produced only 2–3 g/L ABE. Rather, the culture became acidogenic and produced 4–5 g/L acids (acetic and butyric). This study suggested that xylose be fermented in batch reactors coupled with simultaneous product recovery rather than in continuous reactors.
1. Introduction
To transition to a sustainable global economy, there has been a keen interest among the world’s scientific community to develop and produce biofuels and chemicals economically from renewable and low-cost resources such as whey permeate, sugarcane molasses, cellulosic biomass, orchard and industrial wastes, municipal waste, food waste, and household organic waste [1,2,3,4]. In the world, 180–190 million metric tons of whey permeate is produced each year [5] which contains 49 g/L lactose (milk sugar). Lactose can be fermented to butanol via acetone butanol ethanol (ABE) fermentation employing most of the butanol-producing microbial strains. These strains, primarily Clostridia, do not require supplementation of β-galactosidase enzyme to hydrolyze lactose to glucose and galactose. Sugarcane molasses is another feedstock that can be used to produce ABE. This feedstock contains 50% sucrose (dimer of glucose and fructose). In the world, 65–70 million metric tons of molasses is produced each year. Sucrose can also be fermented to ABE employing butanol/ABE-producing microbial strains and they require no supplementation of invertase enzymes to hydrolyze the disaccharide. Currently, prices of whey permeate and sugarcane molasses are relatively high, and hence, use of these substrates to produce ABE is not considered cost-effective. Another novel fermentation substrate, food waste, is lost as waste (in the US, 103 million tons per year). In addition to this waste, 2.0 billion metric tons of household waste is generated globally each year. These wastes have the potential to be used as feedstocks for energy production by fermentation [4].
Cellulosic biomass or agricultural residue is an abundant feedstock and its component sugars (glucose, xylose, arabinose, galactose, and mannose) can be fermented to butanol and other biofuels [6,7,8,9,10,11,12,13]. In the world, production of 100–146 billion metric tons of biomass is projected each year [14]. It is well known that the production of biofuels from biomass requires pretreatment at high temperature using dilute acid [15], alkali [16], ammonia [17], or hot water [18], followed by enzymatic hydrolysis. For butanol production in batch fermentations, approximately 80–90 g/L biomass is pretreated and hydrolyzed, which results in the release of approximately 55 g/L total sugar (hexoses and pentoses) that is 100% of cellulosic sugar present in the fiber or biomass. For economic reasons, use of biomass greater than 90 g/L [15] is desirable to reduce the process cost, as it would require smaller size pretreatment and hydrolysis reactors. In some of the pretreatment studies, biomass concentration as high as 250 to 300 (25–30%) g/L has been used [18,19]. Use of such a high biomass concentration can result in the production of 75 g/L xylose and over 100 g/L glucose. Such a concentrated mixed sugar solution can be fermented to liquid biofuels.
In our long-term continuous bioreactors in which concentrated hydrolyzed mixed sugar solutions were allowed to ferment, some residual xylose remained unfermented. These residual xylose concentrations were in the range of 3.89 to 7.78 g/L [19,20]. This fermentation stream containing xylose sugar cannot be disposed of or released into the environment as it may cause severe pollution problems such as polluting rivers, streams, and air. Hence, there are two scenarios to ferment this residual xylose: (1) reinoculation of the fermentation broth followed by fermentation, which would result in limited cell growth and butanol production. This xylose would be utilized both for cell growth and butanol fermentation and would result in low butanol concentration, potentially around 2–3 g/L. Recovery of such a low butanol concentration would be energy intensive. Scenario (2): concentration of residual xylose using high flux pervaporation [21] or reverse osmosis [22] membranes. The pervaporation membrane mentioned above is polypropylene membrane and it rejects sugars and allows passage of water and butanol. Using these technologies, 60–250 g/L xylose can be concentrated (Boddu, personal communication, 2022). Fermentation of concentrated sugar to butanol is expected to be beneficial to the environment and butanol’s process economics. The authors are aware that xylose is a plant sugar and its concentration in the hydrolysate depends upon the amount of cellulosic biomass used in the pretreatment and hydrolysis reactors. However, it can be concentrated from dilute solutions by the methods indicated above. Concentrated xylose streams could also be generated by first selectively converting glucose to a fermentation product.
Butanol is a historic biofuel and chemical [23] that can be produced from feedstocks listed in the above paragraphs in batch, fed-batch, or continuous bioreactors. In these reactors, an ABE concentration greater than 30 g/L is rarely achieved due to butanol toxicity to the microbial strain that produces it. Of the 30 g/L ABE, butanol is the main product that usually ranges from 14–20 g/L. At this concentration, it initiates killing the microbial cells. During the initial phase of fermentation, the strain produces acetic and butyric acids that are reassimilated or converted to acetone and butanol during the solventogenic phase. The details of microbial ABE metabolism and biochemistry are beyond the scope of this article and have been published elsewhere [13]. Due to the product toxicity, dilute sugar solutions are used, usually 60 g/L, which results in a large process stream. This toxicity problem can be addressed by simultaneous recovery of ABE/butanol using one of the product-removal techniques [24,25,26,27,28,29] including gas stripping [4,24,25]. There are several advantages to using gas stripping, including not affecting the microbial strain negatively, gases being produced within the reactor, and it does not pose any health hazards. The systems where fermentation and product recovery are combined are called “integrated processes”.
It Is anticipated that the production of butanol from cellulosic biomass on a commercial scale would only be feasible if feedstocks such as agricultural biomass, food wastes, household organic wastes, novel process integration technologies, and superior microbial strains such as Clostridium beijerinckii P260, C. beijerinckii BA101, and newly developed C. tyrobutyricum are used [30,31,32,33]. In this study, C. beijerinckii P260 was used, which can accumulate up to 29 g/L ABE. C. beijerinckii P260 was used in the actual commercial fermentation plant in South Africa which was shut down in 1983 due to a shortage of molasses caused by severe drought [13]. This study is novel because the use of concentrated xylose solutions for ABE fermentation did not exist. Additionally, simultaneous product recovery from such concentrated xylose solutions needs to be developed. Hence, for this study, concentrated xylose solutions in the range 60–150 g/L were fermented, coupled with product recovery. Such high-gravity xylose solutions can be obtained from pervaporation or reverse-osmosis membranes [21,22], as mentioned in the third paragraph of this section.
2. Materials and Methods
2.1. Microbial Strain, Culture Maintenance & Propagation
Clostridium beijerinckii P260 was a generous gift from Professor David Jones from the University of Otago, Dunedin, New Zealand. The culture was maintained as spore suspension in sterile distilled water at 4 °C and was propagated by heat shocking at 75 °C for 2 min in cooked meat medium (CMM; DifcoTM; Becton, Dickinson and Company, Sparks, MD, USA). The propagation medium contained 3.5 g CMM and 0.35–0.60 g glucose (Fisher Scientific, Fair Lawn, NJ, USA) in 35 mL of distilled water contained in a 50 mL PyrexTM screw capped glass bottle. The pellets contained in the bottle were soaked for 15 min before autoclaving at 121 °C for 15 min. Upon autoclaving, the bottle and the CMM medium were cooled to 35 °C. Then, 20–100 µL of spore suspension was heat-shocked at 75 °C for 2 min in a 1.5 mL micro-centrifuge polypropylene tube (Bio Plas, Inc., San Rafael, CA, USA) on a heating block (Cole-Parmer, Vernon Hills, IL, USA) followed by transferring the spores to the bottle. The bottle, with its cap loose, was transferred to an anaerobic jar in which an anaerobic condition was created using gas pack anaerobic envelopes (BD Gas Pak; EZ Anaerobic Container System with Indicator; Becton, Dickinson and Company). The anaerobic jar, with its lid closed finger tight, was placed in an incubator (Innova 4230, New Brunswick Scientific, Edison, NJ, USA) at 35 °C. It took 15–16 h before cell growth was observed, and this was called stage I inoculum.
For next stage (stage II) inoculum, 100 mL medium was prepared with 30 g/L glucose (Fisher Scientific) and 1 g/L yeast extract (Becton, Dickinson & Company) and transferred to a 125 mL screw capped glass bottle. When using mixed substrates such as glucose and xylose, the culture utilizes glucose rapidly as compared to other sugars. When using xylose as a sole carbon source, the strain utilizes it (for cell growth and butanol fermentation) without any lag phase. Hence, it was not considered to use xylose for inoculum development. The bottle was autoclaved at 121 °C for 15 min followed by cooling to 35 °C. To the bottle, 10 mL/L three stock solutions [34] were added. The stock solutions contained mineral (MgSO4·7H2O, 20 g/L; MnSO4·H2O, 1 g/L; FeSO4·7H2O, 1 g/L; and NaCl, 1 g/L), acetate buffer (KH2PO4, 50 g/L; K2HPO4, 50 g/L; and ammonium acetate, 220 g/L), and vitamin (Para-amino benzoic acid, 0.1 g/L; thiamin 0.1 g/L; and biotin 0.001 g/L) solutions. These solutions were separately prepared, filter sterilized, and stored at 4 °C until used. To the bottle, 7 mL of stage I inoculum was added and the bottle was transferred to an anaerobic jar in which an anaerobic environment was created using gas pack envelopes (BD Gas Pak). Then, the jar was placed in an incubator (Innova 4230) at 35 °C for 7–10 h. After cell growth, this was termed stage II inoculum and was used to inoculate 100 mL medium in bottles and 2.5 L bioreactors (BIOFLO 2000 Fermenter, New Brunswick Scientific, New Brunswick, NJ, USA). The precultures were grown on glucose and not on xylose.
2.2. Batch Fermentations
Fermentation studies containing 100 to 250 g/L xylose were performed in 100 mL medium contained in 125 mL screw-capped bottles. The bottles containing various concentrations of xylose (Sigma-Aldrich Chemicals, St. Louis, MO, USA) and 1 g/L yeast extract (Becton Dickinson & Company) were sterilized at 121 °C for 15 min followed by cooling to 35 °C and adding 1 mL (10 mL/L) each of stock solutions as described above. Then, each bottle was inoculated with 7 mL of stage II inoculum. The inoculated bottles were transferred to an anaerobic jar in which an anaerobic condition was created using a gas pack envelope (BD Gas Pak). Experiments in bottles were performed under static conditions. Vigorous production of fermentation gases (CO2 & H2) causes adequate agitation to mix nutrients, substrate, and microbial cells.
Fermentations coupled with product recovery were performed in a 2.5 L New Brunswick Bioreactor (BIOFLO 2000) containing 1 L medium. To prepare the bioreactor for fermentation and product recovery, 60 or 150 g/L xylose and 1 g/L yeast extract (Becton, Dickinson & Company) were dissolved in distilled water and autoclaved at 121 °C for 15 min. Upon autoclaving the bioreactor, the medium in it was cooled to 35 °C by sweeping oxygen-free nitrogen gas across the medium surface. Then, 10 mL (10 mL/L) each of stock solutions were added and the bioreactor was inoculated with 70 mL of stage II inoculum. Fermentations with product removal were not conducted under mechanical agitation. Agitation provided by fermentation and sparged gases caused adequate mixing to keep the fermentation mixture homogeneous. From the bioreactor, 1 mL samples were taken intermittently followed by cooling them immediately to 4 °C and centrifuging (Eppendorf 5417C, Hamburg, Germany) at 13,000 rpm for 3 min. The supernatant was transferred to a 1.5 mL micro-centrifuge polypropylene tube (Bio Plas, Inc.) and stored at −18 °C until analyzed for xylose and ABE.
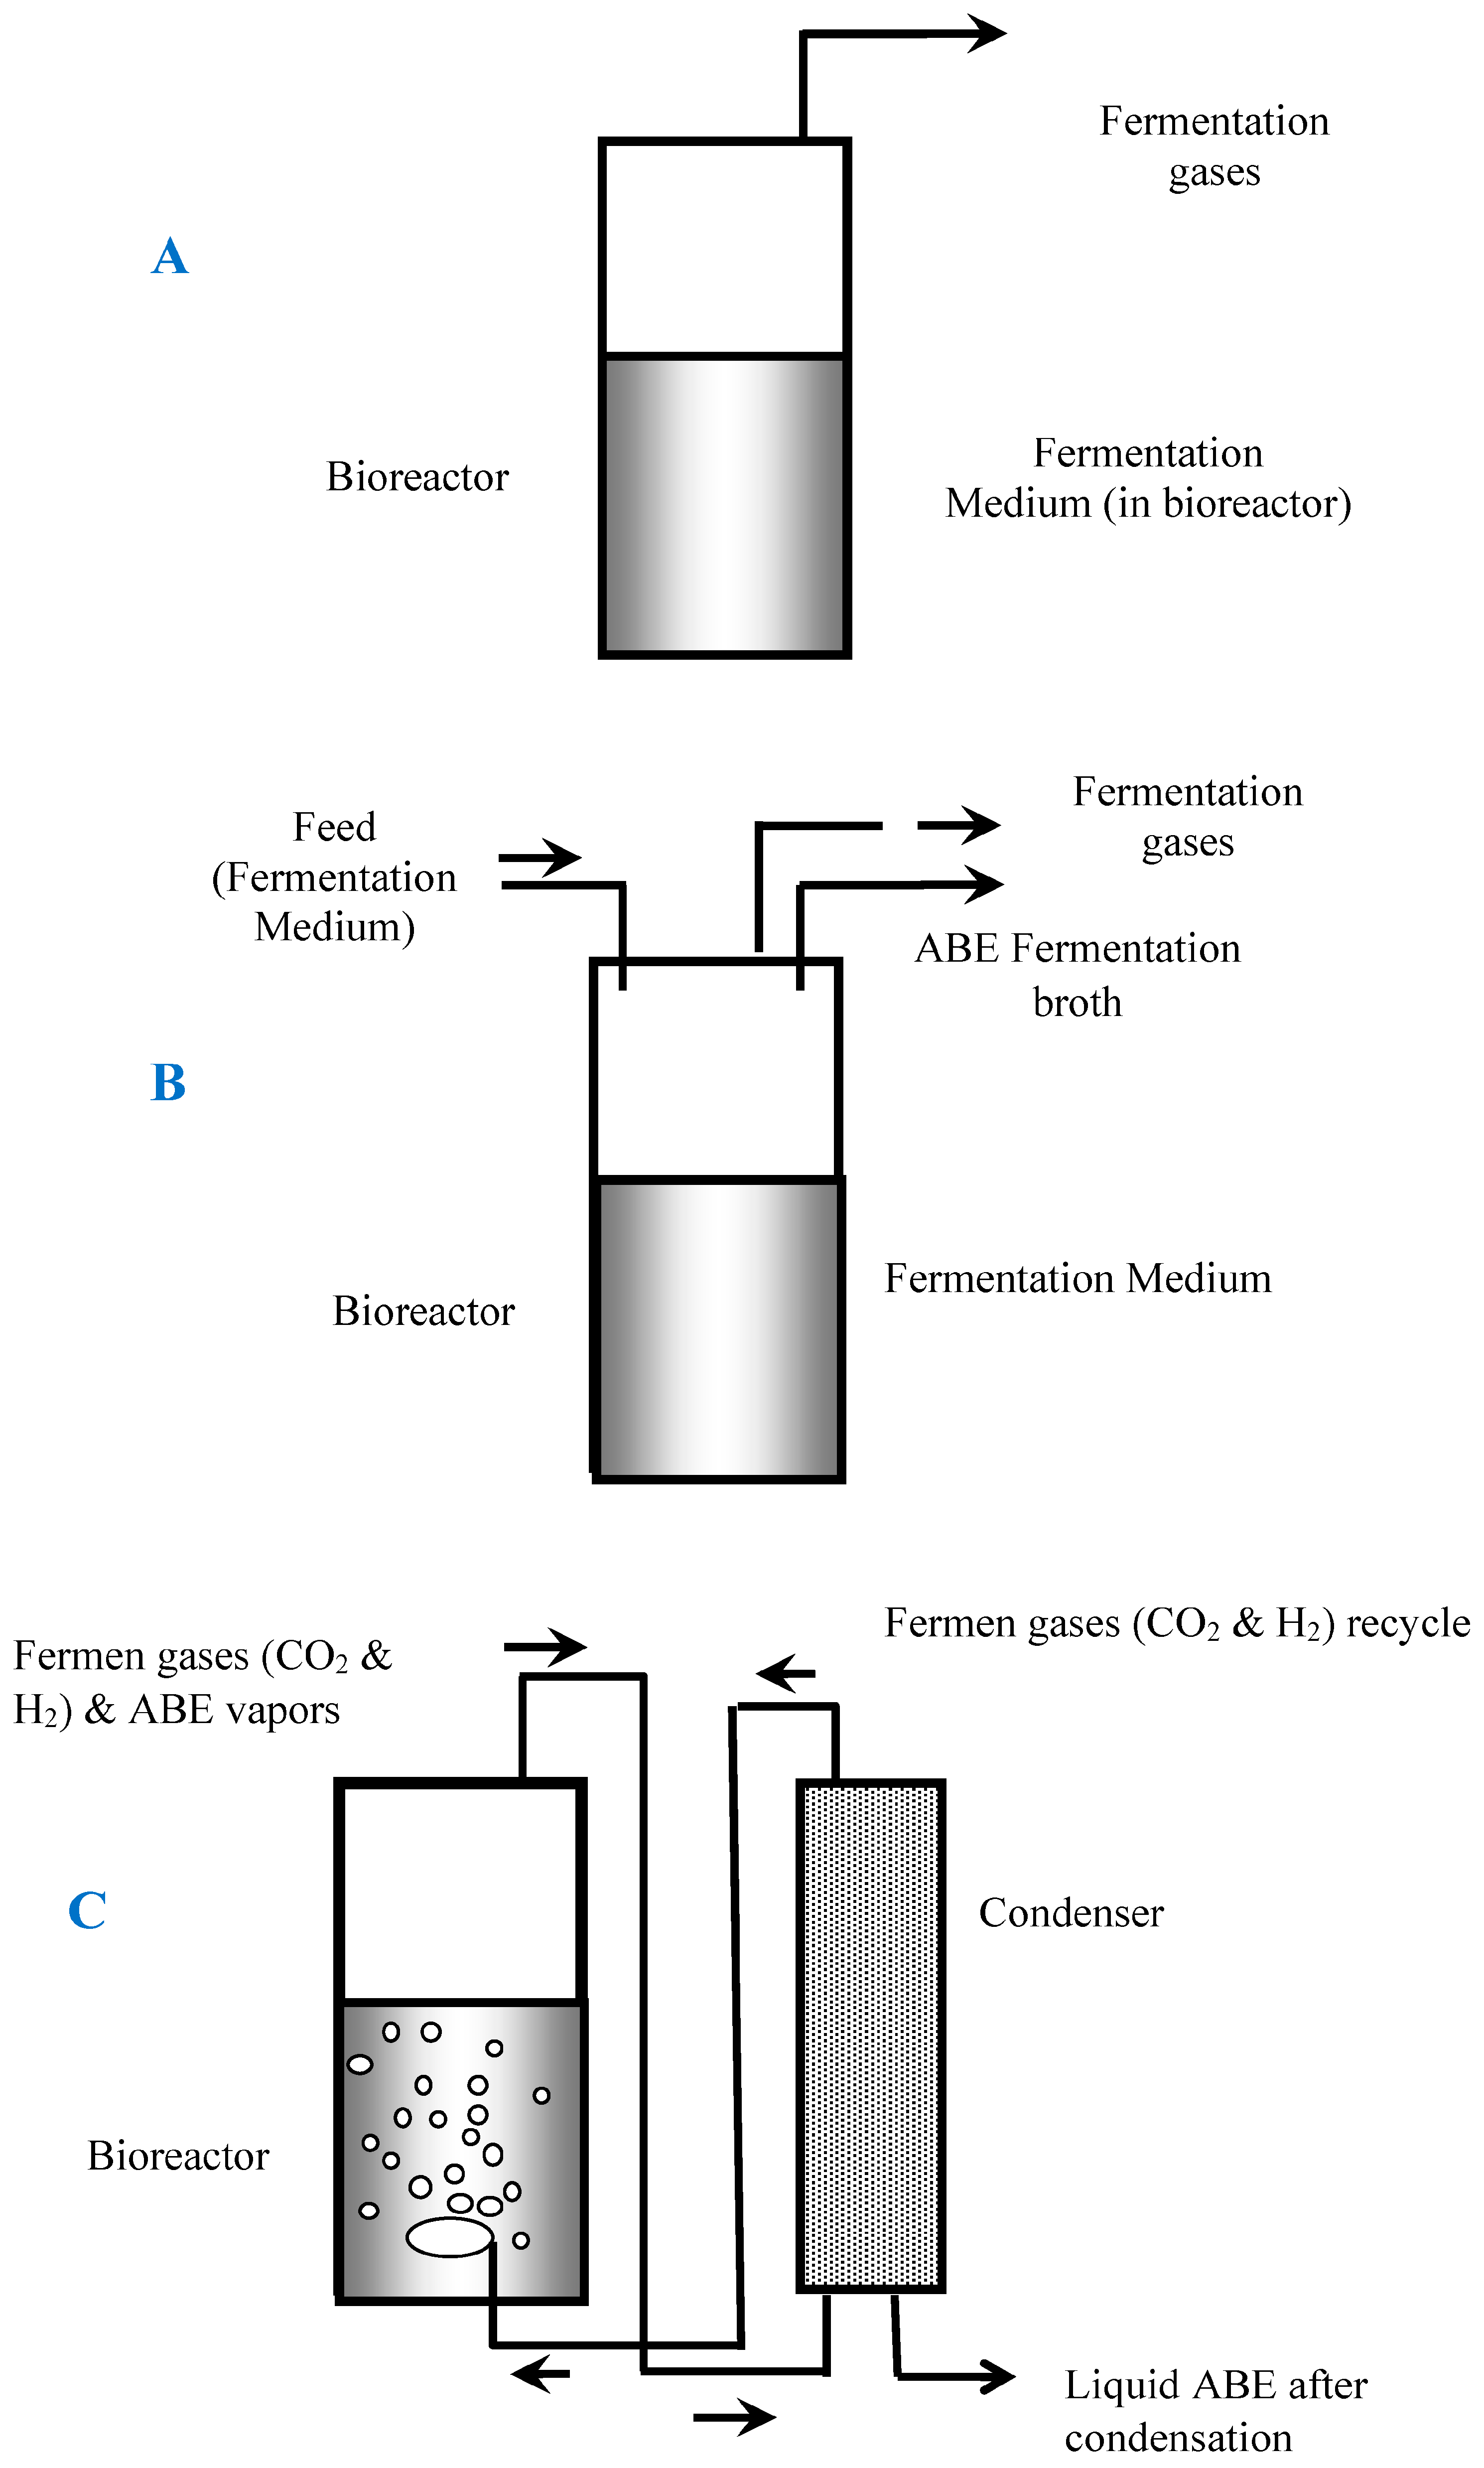
Products (ABE) were recovered by gas stripping from 60 and 150 g/L xylose fermentation broths. Norprene tubing (size 18, Cole Parmer, Vernon Hills, IL, USA) was used to recycle gases from the reactor to the cooling condenser. To recover ABE, fermentation gases (CO2 & H2) were recycled through the fermentation broth at a flow rate of 4 L/min using a twin-head MasterfluxTM peristaltic pump (Cole Parmer). The gases were cooled in a condenser at 1 °C and the condensate was collected in a receiving flask. A simple schematic diagram of production of ABE in a batch reactor is shown in Figure 1A.
2.3. Continuous Fermentations
Continuous fermentation was performed in a 500 mL PyrexTM glass bottle that had ports for feed inlet, fermentation broth outlet, and gas outlet. The working volume in the bottle was kept at 400 mL. The medium in the bottle contained 30 g/L xylose (Sigma-Aldrich) and 1 g/L yeast extract (Becton, Dickinson & Company). Xylose (Sigma-Aldrich) and yeast extract (Becton, Dickinson & Company) solution was autoclaved at 121 °C for 15 min followed by cooling to 35 °C under an oxygen-free nitrogen environment. To the medium, 10 mL/L stock solutions were added after the feed was cooled. The feed flow to the reactor and broth outlet was kept at 6 mL/min using a peristaltic pump (Cole Parmer) and 14 size silicone tubing (Cole Parmer). The fermentation mixture in this reactor was agitated at 50 rpm using a magnetic stir bar (10 mm diameter and 50 mm length). A schematic diagram of this system is shown in Figure 1B. The experiment was run for 36 days (864 h) in continuous mode.
2.4. Quantitation of ABE Losses
To quantify losses of ABE, known concentrations of model solvents (13.29 g/L maximum ABE concentration in 60 g/L xylose fermentation and 12.3 g/L maximum ABE concentration in 150 g/L xylose fermentation) were transferred to the bioreactor in which the liquid level was 1.00 L. Carbon dioxide and hydrogen gases (mixture of gases) from the fermenter were replaced in this experimental set up. A twin-head peristaltic pump (Cole Parmer) and size 18 norprene tubing (Cole Parmer) were used to recover the ABE. The recovery was continued until ABE concentration in the reactor decreased to 9.09 g/L (residual ABE concentration in 60 g/L integrated xylose fermentation recovery experiment) and 2.84 g/L (lowest ABE concentration in 150 g/L xylose fermentation product recovery experiment) in the integrated reactor system. A schematic diagram of this experiment is shown in Figure 1C. After recovery, a material balance was performed; the difference between initial solvents present in the system, and captured and residual ABE, was used to calculate the amount of lost ABE. For accuracy, the length and size of connecting tubing was consistent with the system used to produce ABE. The norprene tubings used to circulate ABE vapors were of low gas diffusion quality; however, they still allowed some diffusion of the solvents and that was necessary to quantify.
2.5. Measuring Rates of Sugar Utilization
The rates of sugar utilization were calculated from our previously published study [35]. To achieve this, tangents were plotted at various points of the graphs and the ds/dt (rate of sugar utilization per h) was calculated for each tangent point. This gave us the rate of sugar utilization in a short span of time. These rates were plotted as bar graphs against fermentation times.
2.6. Analyses
ABE and acids (acetic and butyric) were measured by gas chromatography (GC; 6890N, Agilent Technologies, Wilmington, DE, USA) employing a glass packed column [15,18,20]. These acids are reaction intermediates and are produced by the strain in ABE fermentation. The column initial temperature was maintained at 100 °C and was increased at a rate of 40 °C/min until it reached 180 °C where it was held for 4 min. The GC inlet and FID detector temperatures were kept at 225 and 250 °C, respectively. Prior to injecting the samples to GC, fermentation broth and condensate samples were diluted 4- and 40-fold, respectively. Xylose was measured by high performance liquid chromatography (HPLC) equipped with an autosampler, injector, and refractive index detector (RID). A sugar separation column (Aminex HPX-87P, 300 × 7.8 mm; Bio-Rad Laboratories, Inc., Hercules, CA, USA) was used to measure sugar. The column temperature was maintained at 75 °C and Milli-Q filtered water was used as a solvent at a flow rate of 0.6 mL/min.
ABE productivity was calculated as total ABE produced (g/L) divided by total fermentation time (h) and is expressed as g/L·h. Fermentation time is the difference between the time when fermentation stopped minus the time when the reactor was inoculated. ABE yield was calculated as the total ABE produced divided by the total sugar used (g ABE produced divided by g sugar utilized). Total sugar used is the difference between initial (immediately after inoculation) sugars minus residual sugar and is expressed as g/L. Cell mass was measured by using a correlation between absorbance (λ-540; Beckman Coulter DU800 Spectrophotometer; Brea, CA, USA) vs dried cell mass. Cell mass was dried at 100 °C until a constant weight was obtained. To measure optical density, the sample was diluted 10× with 9 g/L NaCl solution.
The results presented here are an average of two replicates with error margins within the ±5.5% range. Analysis of variance (ANOVA) was used to compare the various treatments (fermentations) (p ≤ 0.05). The two replications of ABE xylose fermentation parameters (total ABE produced, and ABE productivity) were compared to the glucose control for significance (p ≤ 0.05) using a t-test.
3. Results and Discussion
3.1. Control Glucose Batch Fermentation
A control ABE batch fermentation was operated with 61.0 g/L glucose in the bioreactor. This substrate (glucose) is an ideal feedstock for ABE fermentation [28,29]. The fermentation was run for 72 h and during the course of fermentation 23.40 g/L ABE was produced using 54.5 g/L glucose (Figure 2A). This resulted in an ABE yield of 0.43 g/g. At the end of fermentation 6.5 g/L glucose remained unused. In this fermentation, an ABE productivity of 0.33 g/L·h was obtained. The microbial strain produced 3.85 g/L total acids during the early stage of fermentation, which were partly utilized during fermentation (Figure 2B). At the end of fermentation, 1.57 g/L acids remained unused. The individual amounts of acetic and butyric acids were 0.62 and 0.96 g/L, respectively. During fermentation, approximately 2.55 g/L dry cell mass was produced (Figure 2C). The initial pH of the medium was 6.8, which decreased to 5.09 to 5.15. In the solventogenic stage, the microbial strain regulated its own pH.
3.2. Xylose Fermentation in Batch Reactor
Following the control, a fermentation with 60.0 g/L initial xylose using C. beijerinckii P260 was performed. The fermentation was run for 72 h and an ABE concentration of 18.44 g/L was observed (Figure 3A), resulting in a productivity of 0.26 g/L·h. This productivity is 21% lower than glucose fed reactor’s productivity. At the end of the fermentation, 9.80 g/L xylose remained unused (Figure 3A). In this fermentation an ABE yield of 0.40 g/g was achieved. This suggested that in a batch fermentation, this strain can effectively ferment xylose. Production and assimilation of acids are shown in Figure 3B. At 6 h of fermentation, the culture accumulated 3.98 g/L acetic and butyric acids, which were partly utilized by the culture. At 45 h, the total concentration of acids in the fermentation broth was 0.66 g/L. At the end of fermentation, a cell concentration of 2.1 g/L was measured.
3.3. Simultaneous Use of Glucose and Xylose
When using lignocellulosic sugars such as glucose, xylose, arabinose, and galactose, two parameters are of utmost importance: (i) simultaneous use of hexose and pentose; and (ii) rate of utilization of the sugars. To investigate this, an experiment was performed where 15 g/L each of these four sugars was included in the medium [35]. It was noticed that glucose utilization was faster than other sugars. The results on the rates of sugar utilization are compared in Figure 4. At this stage, it is not clear why the strain preferred to use arabinose as compared to xylose as they both are pentose sugars.
3.4. Xylose Fermentation and Simultaneous Product Recovery
In both glucose and xylose batch fermentations (Figure 2A and Figure 3A), utilization of these sugars was incomplete. The possible reasons for not using all the sugars were speculated to be: (i) inhibition due to unknown fermentation products; (ii) inhibition due to reduced water activity; (iii) inhibition due to butanol or ABE; and (iv) lack of nutrients. Initially, inhibition due to unknown fermentation products, lack of nutrients, and reduced water activity were disregarded. Since the most likely cause was considered to be butanol/ABE toxicity, a fermentation was conducted with simultaneous product recovery. To achieve this, the fermentation was run with 60.0 g/L initial xylose concentration, with simultaneous product recovery by gas stripping. Product recovery was initiated at 16 h. As a result of simultaneous product recovery, the culture fermented all the xylose to ABE (Figure 5A) suggesting that product inhibition was the key reason for leaving unused glucose or xylose. Production of acids in this fermentation is presented in Figure 5B. In this experiment, the maximum ABE concentration was 13.29 g/L as opposed to 18.44 g/L in the xylose fermentation without product recovery (Figure 3A), suggesting that 18.44 g/L ABE was toxic to the culture. The simultaneous fermentation and product recovery process was completed in 40 h, as opposed to non-integrated xylose fermentation, which took 72 h to complete. At the end of the integrated fermentation in which product was recovered, the ABE concentration was 9.09 g/L. During product recovery, three condensates were collected at 23, 40, and 47 h (Table 1). At these times, the volumes of the condensates were 24, 103, and 44 mL, with total ABE concentrations of 85.84, 97.54, and 53.65 g/L, respectively. The total amount of recovered ABE from the condensates was 14.47 g, thus totaling 26.51 g (9.09 g remained in 1 L of fermentation broth and 2.95 g lost by diffusion of solvent through the connecting tubing) ABE for the entire process. In this xylose fermentation and product recovery system, overall productivity and yield were 0.66 g/L·h and 0.44 g/g, respectively. This productivity is 200% higher than the control fermentation, which is due to relieving product inhibition because of simultaneous recovery of toxic products.
3.5. Osmotic Stress Due to Concentrated Xylose
Next, in order to observe the effect of osmotic stress associated with high concentrations of xylose on the microbial strain, fermentations were conducted with 100 to 250 g/L initial xylose (Figure 6A). At 100 and 150 g/L xylose, 20.41, and 18.89 g/L ABE were produced, respectively. Increasing sugar concentration further (200 and 225 g/L) severely inhibited ABE production. At these sugar concentrations, 4.79 and 2.79 g/L ABE were produced, respectively. At a sugar concentration of 250 g/L, poor cell growth occurred, and no ABEs were produced. Acid production at various initial xylose concentrations is presented in Figure 6B. At 100 g/L initial xylose concentration, total acid production was 0.55 g/L. At sugar concentrations of 200 and 250 g/L, 5.36 and 5.30 g/L total acids were produced, respectively.
For these experiments, ABE productivities and yields are presented in Figure 6C. At a sugar concentration of 100 g/L, a productivity of 0.28 g/L·h was observed. At a xylose concentration of 150 g/L, ABE productivity and yield were 0.25 g/L·h and 0.37 g/g, respectively. Increasing xylose concentrations further resulted in a dramatic decrease in productivity and yield. Sugar utilization rates are presented in Figure 6D. At an initial xylose concentration of 100 g/L, the rate of sugar utilization was 0.72 g/L·h, which is close to the sugar utilization rate (0.67 g/L·h) observed for 150 g/L xylose fermentation. As xylose concentration increased to 200 g/L, sugar utilization rate decreased to 0.40 g/L·h. Although at 250 g/L xylose, no butanol or ABE was produced, a small fraction of sugar was fermented to acids (see above). At a high sugar concentration, xylose in this case, cell growth and metabolism of the microbial strain is slowed down. However, as xylose concentration is decreased due to its utilization, cellular metabolism is increased. Overall, the average rate of sugar utilization and solvent production stays the same. It is viewed that the use of concentrated sugar solution results in a smaller size reactor and reduced process streams, thus resulting in favorable process economics.
3.6. Butanol Production in Integrated Batch Reactor from Concentrated Xylose
At 150 g/L initial xylose, only 18.89 g/L ABE was produced from 51.1 g/L xylose, and most of the sugar went unused (99.0 g/L residual sugar). In order to utilize all the provided sugar, ABE had to be removed simultaneously to relieve product inhibition, as was performed earlier and presented in Figure 5A. Hence, an experiment was devised where ABE were simultaneously removed from the system (Figure 7A). The fermentation began with 150 g/L xylose, because of the strong substrate inhibition observed at 200 and 225 g/L. In this reactor system, gas stripping was started at 16 h. At 51 h, when xylose concentration was 85.0 g/L, the strain stopped ABE production. At this time, the total ABE in the reactor was 9.23 g/L.
Three reasons were speculated upon for the arrest of fermentation: (i) inhibition due to ABE, (ii) lack of nutrients, and (iii) inactivation of strain’s xylose metabolism on prolonged fermentation of this sugar. The ABE inhibition was disregarded as a possibility, as this strain can accumulate up to 18–29 g/L ABE [36]. To confirm that nutrient limitation was the reason for the arrested fermentation, 20 mL of fermentation broth was withdrawn and was either allowed to continue fermentation or fresh nutrients were added and re-inoculated, as described in Table 2 (Runs A & B). When further nutrients (1 g/L yeast extract and 10 g/L stock solutions (vitamins, buffer, and minerals)) were added, the culture produced 25.65 g/L ABE (9.52 g/L acetone, 15.29 g/L butanol, 0.84 g/L ethanol), thereby supporting the hypothesis that fermentation ceased because of nutrient deficiency.
Hence, to continue fermentation in the reactor, the cell mass was removed by centrifugation and nutrients at the above level were added followed by re-inoculating the reactor at 92 h. At 113 h, when the total ABE was 9.87 g/L, recovery by gas stripping was restarted. Fermentation was continued with product recovery until 167 h when the culture ceased fermentation. At this time, 40 mL fermentation broth was withdrawn and processed as presented in Table 2 (Runs C, D, E, and F). After 48 h of fermentation, the culture produced 23.21 g/L ABE (Run D; 6.84 g/L acetone, 15.68 g/L butanol, and 0.68 g/L ethanol). Reducing nutrients by 50% of the level mentioned above resulted in the production of 19.56 g/L ABE (Run E; 6.44 g/L acetone, 12.50 g/L butanol, and 0.63 g/L ethanol). This indicated fermentation stopped due to a lack of nutrients and hence, their supplementation (1 g/L yeast extract, and 10 mL/L stock solutions) was necessary for continuation of fermentation. Since fermentation stopped due to nutrient limitation, reason (iii) (inactivation of xylose metabolism) was disregarded, and this knowledge was used to continue the fermentation as below.
At 168 h, when the unfermented xylose concentration was 34.97 g/L, the reactor was fed with nutrients (yeast extract 1 g/L and stock solutions 10 mL/L) and the whole culture was reinoculated with fresh inoculum. Prior to inoculation and supplementation with nutrients, the cell mass was removed by centrifugation. Gas stripping was started again at 174 h. By 191 h, the culture had utilized all the sugar. The organic acids production profile for the fermentation is shown in Figure 7B. In Figure 7A,B, the fluctuations in solvents and acids concentrations are seen. These fluctuations in product concentration occur due to varying active cell mass concentration. In butanol or ABE fermentation, four types of cell mass exist and they are known as the active solventogenic cell mass that produces ABE, cell mass that supports cell growth, cells that neither support ABE production nor cell growth but require maintenance energy, and dead cell mass [37]. They are characteristic of ABE fermentation and such fluctuations have been reported previously [38]. The amounts of condensates at various times are presented in Table 3.
From the concentrated xylose fermentation, 30.37 g ABE was recovered in the condensate, 28.65 g was lost through the connecting tubing, and 7.30 g was present in the fermentation broth, thus totaling 66.32 g. This is 283% of the ABE produced in control glucose fermentation. The actual fermentation time was 150 h (191 h minus 41 h when there was no fermentation activity in the reactor). This resulted in a productivity and yield of 0.44 g/L·h and 0.44 g/g, respectively. This productivity and yield are higher (productivity 176%, yield 119%) than obtained in the 150 g/L non-integrated xylose fermentation (productivity 0.25 g/L·h, yield 0.37 g/g). The theoretical yield of ABE is 0.40 g/g. In this experiment (integrated 150 g/L xylose fermentation), we obtained a higher yield. The possible reason for a higher yield may be the use of a carbon source present in yeast extract and stock solutions for product formation. Buffer (stock solution) contains a considerable amount of acetate that can be converted to acetone or butanol or both. These studies suggest that fermentation of concentrated xylose solution is possible when the culture is provided with intermittent supplementation of nutrients such as yeast extract and stock solutions. In our opinion, use of concentrated sugar solution does not reduce the rate of product recovery.
In a system like this, loss of solvents occurs in two ways: (i) with the exiting CO2 and H2 gases; and (ii) by diffusion through the connecting tube. During ABE fermentation, a significant amount of gases are produced that carry ABE through the exit line. On a mass balance, over 50% carbon is lost due to its conversion to CO2. Based on a previous study [35], the losses that occurred in this system (150 g/L xylose) were quantified to be 28.65 g. A schematic diagram of quantification of ABE losses is shown in Figure 1C and a method or description has been given in the Materials & Methods Section 2.4.
There are several product recovery techniques that can be used to recover ABE from fermentation broth. These techniques include adsorption, gas stripping, liquid–liquid extraction, perstraction, pervaporation, vacuum fermentation, supercritical CO2 extraction, and reverse osmosis [24,25,26,27,28,29]. Among these, adsorption, gas stripping, vacuum, and pervaporation are superior to others as they do not adversely affect microbial strains and are economical to use in laboratory and pilot scale experiments [26]. Recovery of ABE from fermentation broth by gas stripping has been studied using fermentation gases (CO2 & H2) that are produced in the system. For these reasons, gas stripping was selected here. There are several advantages of the use of gas stripping as a product removal technique and they have been mentioned in the Section 1 of this paper.
In these studies, we were successful at using 150 g/L xylose, which is 300% greater than that consumed in the non-integrated batch reactor, and produced 66.32 g/L ABE. This equated to reduced water usage and size of waste stream by a factor of 3. Reduced process water consumption, wastewater generation, and lower capital and operating costs are expected to economically benefit butanol production. As a comparison, in a 60 g/L xylose-fed non-integrated batch reactor, 18.44 g/L ABE was produced with an ABE yield of 0.40 g/g.
3.7. Butanol Production in Continuous Stirred Tank Reactor (CSTR)
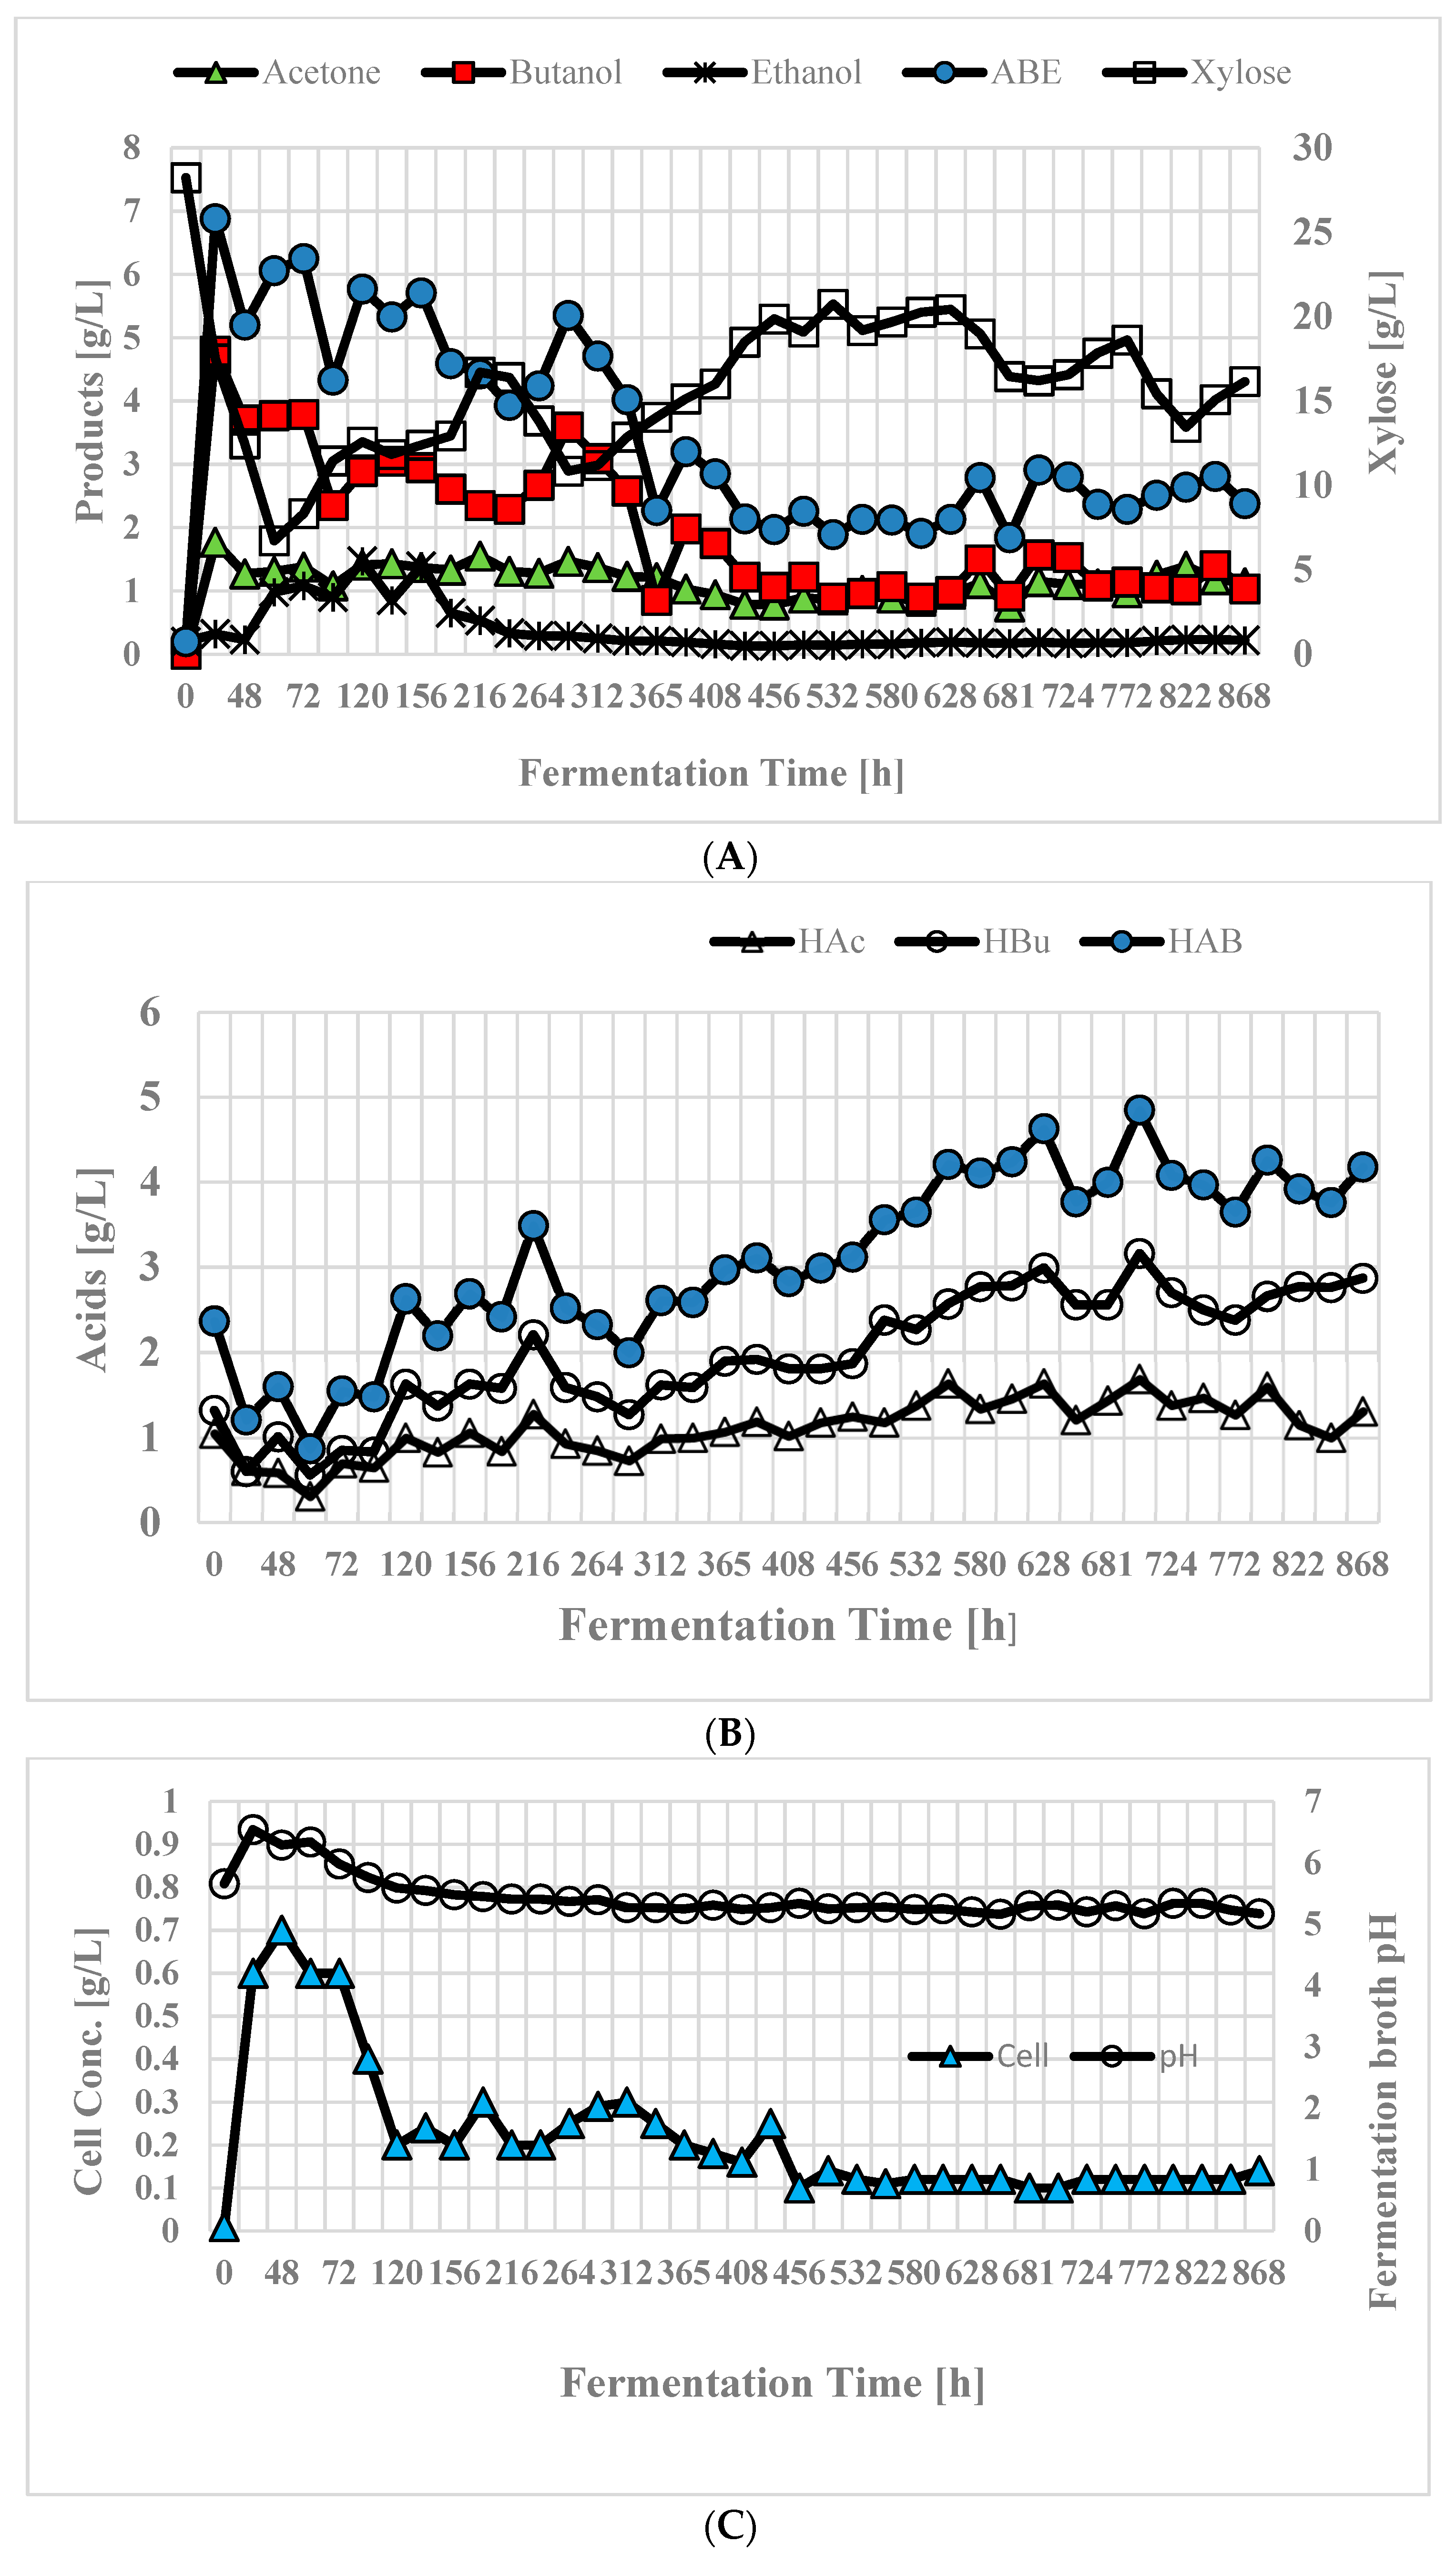
In our previous integrated fermentation product removal systems in which cellulosic biomass was used, the culture failed to utilize all the xylose present in the reactor [19,20]. Other than xylose, all other sugars were used by the strain. To investigate why the strain did not use all the xylose and how much ABE the reactor would produce, a CSTR was devised. The results of this system are shown in Figure 8A. Over the course of 36 days (864 h), butanol concentration declined until it reached approximately 2.00 g/L, while the acid concentration increased. At the end of 36 days (864 h) the concentration of acids averaged approximately 4 g/L (Figure 8B). In the beginning stages of fermentation, cell concentration grew to 0.60–0.70 g/L then declined to 0.10 g/L. Both cell concentration and pH are presented in Figure 8C. This and other systems that failed to use xylose [19,20] suggest that the butanol-producing strain loses xylose fermenting capability in continuous long-term fermentations operated under the present conditions of feed rate and pH. It is likely that slightly changing these conditions may decrease acidogenesis and increase solventogenesis. However, at this stage, the only economical or useful options are to use high xylose concentration batch reactor systems where the product is recovered simultaneously.
3.8. Comparison with Other Xylose Fermentation Systems
Among the many scientists who studied the production of butanol from xylose [39,40,41], the studies performed by Xin et al. [39] are relevant to our studies as they reported similar levels of ABE production, productivity, and yield, of 21.40 g/L, 0.35 g/L·h, and 0.36 g/g, respectively. These authors used dilute xylose solution (60 g/L) for ABE fermentation. They also used the same concentration of glucose solution and reported 21.10 g/L ABE, with a productivity of 0.34 g/L·h and yield of 0.35 g/g. Productivity and yield are two important factors from kinetics and economics points of view in ABE fermentation. In our 60 g/L xylose fermentation (similar substrate level) with simultaneous product recovery, a productivity of 0.66 g/L·h was obtained, which is 89% percent higher than Xin et al. [39]. The ABE yield of 0.44 g/g reported here is 22% higher than reported by Xin et al. [39]. The objective of this study has been achieved for fermentation of a concentrated xylose stream and the results obtained are summarized in Table 4.
4. Conclusions
A batch reactor was operated with 60 g/L initial xylose in the feed without product recovery. The performance of this reactor was compared with another system in which a simultaneous product was recovered. The latter reactor system was found to be 2.5 times (250%) more productive than the previous one. The microbial strain, C. beijerinckii P260, was capable of growing and fermenting 225–250 g/L xylose. Under the present conditions of feed rate and pH, the CSTR that was operated for 36 days (864 h) was not found to be solventogenic. Our findings suggest that it would be beneficial to ferment concentrated xylose solution in batch mode with simultaneous product recovery by gas stripping rather than in continuous mode. Since this study on fermentation of concentrated xylose was successful, in future, we intend to use actual biomass (sweet sorghum bagasse) for the production of butanol or ABE employing C. beijerinckii P260.
Author Contributions
N.Q.—Conceptualization, performing part of experiments, writing manuscript; X.L.—conducting experiments and writing manuscript; S.T.—review and writing; S.L.—review and editing; H.H.—review and editing; N.N.N.—review, editing, and supervision. All authors have read and agreed to the published version of the manuscript.
Funding
This research was supported by the U.S. Department of Agriculture, Agricultural Research Service (ARS) (CRIS Project Numbers: 5010-41000-163-00D & 5010-41000-189-00D).
Data Availability Statement
All data generated during this study are presented in this article.
Acknowledgments
N.Q. would like to thank Bruce Dien of USDA, ARS, Peoria, IL for reading this article and providing critical comments which improved the quality of the paper. N.Q. would also like to thank David Jones (Otago University, Dunedin, New Zealand) for his generous gift of C. beijerinckii P260.
Xiaoqing Lin contributed to this manuscript while working as a visiting scientist at the USDA, ARS, NCAUR, Bioenergy Research Unit, located in Peoria, IL, USA. X.L. would like to thank the financial support of the National Natural Science Foundation of China (21978053), the Key Area R&D Program of Guangdong Province (2020B0101070001).
Mention of trade names or commercial products in this article is solely for the purpose of providing scientific information and does not imply recommendation or endorsement by the United States Department of Agriculture. USDA is an equal opportunity provider and employer.
Conflicts of Interest
The authors declare no conflict of interest.
References
- Chow, C.-F.; Lam, C.-S.; Lau, K.-C.; Gong, C.-B. Waste-to-Energy: Production of fuel gases from plastic waste. Polymers 2021, 13, 3672. [Google Scholar] [CrossRef] [PubMed]
- AbdElhafez, S.E.; Taha, T.; Mansy, A.E.; El-Desouky, E.; Abu-Saied, M.A.; Eltaher, K.; Hamdy, A.; Fawal, G.L.; Gamal, A.; Hashim, A.M.; et al. Experimental optimization with the emphasis on techno-economic analysis of production and purification of high value-added bioethanol from sustainable corn stover. Energies 2022, 15, 6131. [Google Scholar] [CrossRef]
- Elsagan, Z.A.; Ali, R.M.; El-Naggar, M.A.; El-Ashtoukhy, E.-S.Z.; AbdElhafez, S.E. New perspectives for maximizing sustainable bioethanol production from corn stover. Ren. Energy 2023, 209, 608–618. [Google Scholar] [CrossRef]
- Qureshi, N. Solvent (Acetone-butanol: AB) production. In Reference Module in Life Sciences; Roitberg, B., Ed.; Elsevier: Oxford, UK, 2017; pp. 1–20. [Google Scholar]
- Buchanan, D.; Martindale, W.; Romeih, E.; Hebishy, E. Recent advances in whey processing and valorisation: Technological and environmental perspectives. Int. J. Dairy Technol. 2023, 76, 291–312. [Google Scholar] [CrossRef]
- Zheng, X.; Xian, X.; Hu, L.; Tao, S.; Zhang, X.; Liu, Y. Efficient short-time hydrothermal depolymerization of sugarcane bagasse in one-pot for cellulosic ethanol production without separation, water washing, and detoxification. Bioresour. Technol. 2021, 339, 125575. [Google Scholar] [CrossRef]
- Liu, Y.; Zheng, X.; Tao, S.; Hu, L.; Zhang, X.; Lin, X. Process optimization for deep eutectic solvent pretreatment and enzymatic hydrolysis of sugar cane bagasse for cellulosic ethanol fermentation. Renew. Energy 2021, 177, 259–267. [Google Scholar] [CrossRef]
- Mukherjee, M.; Goswami, G.; Mondal, P.K.; Das, D. Biobutanol as a potential alternative to petroleum fuel: Sustainable bioprocess and cost analysis. Fuel 2020, 278, 118403. [Google Scholar] [CrossRef]
- Kushwaha, D.; Srivastava, N.; Prasad, D.; Mishra, P.K.; Upadhyay, S.N. Biobutanol production from hydrolysates of cyanobacteria Lyngbya limnetica and Oscillatoria obscura. Fuel 2020, 271, 117583. [Google Scholar] [CrossRef]
- Dürre, P. New insights and novel developments in clostridial acetone/butanol/isopropanol fermentation. Appl. Microbiol. Biotechnol. 1998, 49, 639–648. [Google Scholar] [CrossRef]
- Zverlov, V.V.; Berezina, O.; Velikodvorskaya, G.A.; Schwarz, W.H. Bacterial acetone and butanol production by industrial fermentation in the Soviet Union: Use of hydrolyzed agricultural waste for biorefinery. Appl. Microbiol. Biotechnol. 2006, 71, 587–597. [Google Scholar] [CrossRef]
- Jin, Q.; An, Z.H.; Damle, A.; Poe, N.; Wu, J.; Wang, H.J.; Wang, Z.W.; Huang, H.B. High Acetone-Butanol-Ethanol production from food waste by recombinant Clostridium saccharoperbutylacetonicum in batch and continuous immobilized-cell fermentation. ACS Sustain. Chem. Eng. 2020, 8, 9822–9832. [Google Scholar] [CrossRef]
- Jones, D.; Woods, D. Acetone-butanol fermentation revisited. Microbiol. Rev. 1986, 50, 484–524. [Google Scholar] [CrossRef] [PubMed]
- Balat, M.; Ayar, G. Biomass Energy in the world, use of biomass and potential trends. Energy Sources 2005, 27, 931–940. [Google Scholar] [CrossRef]
- Qureshi, N.; Saha, B.C.; Cotta, M.A. Butanol production from wheat straw hydrolysate using Clostridium beijerinckii. Bioprocess Biosyst. Eng. 2007, 30, 419–427. [Google Scholar] [CrossRef] [PubMed]
- Kim, J.S.; Lee, Y.Y.; Kim, T.H. A review on alkaline pretreatment technology for bioconversion of lignocellulosic biomass. Biores. Technol. 2016, 199, 42–48. [Google Scholar] [CrossRef] [PubMed]
- Morais, A.R.C.; Zhang, J.; Dong, H.; Otto, W.G.; Mokomele, T.; Hodge, D.; Balan, V.; Dale, B.E.; Lukasik, R.M.; da Costa Sousa, L. Development of an ammonia pretreatment that creates synergies between biorefineries and advanced biomass logistics models. Green Chem. 2022, 24, 4443–4462. [Google Scholar] [CrossRef]
- Qureshi, N.; Klasson, K.T.; Saha, B.C.; Liu, S. Butanol production from sweet sorghum bagasse (SSB) with high solids content: Part I—Comparison of hot water pretreatment with dilute sulfuric acid. Biotechnol. Prog. 2018, 34, 960–966. [Google Scholar] [CrossRef]
- Qureshi, N.; Saha, B.C.; Liu, S.; Ezeji, T.C.; Nichols, N.N. Cellulosic butanol biorefinery: Production of biobutanol from high solid loadings of sweet sorghum bagasse—Simultaneous saccharification, fermentation and recovery. Fermentation 2021, 7, 310. [Google Scholar] [CrossRef]
- Qureshi, N.; Saha, B.C.; Cotta, M.A. Butanol production from wheat straw by simultaneous saccharification and fermentation using Clostridium beijerinckii: Part II-Fed batch fermentation. Biomass Bioenergy 2008, 32, 176–183. [Google Scholar] [CrossRef]
- Friedl, A.; Qureshi, N.; Maddox, I.S. Continuous acetone-butanol-ethanol (ABE) fermentation using immobilised cells of Clostridium acetobutylicum in a packed bed reactor and integration with product removal by pervaporation. Biotechnol. Bioeng. 1991, 38, 518–527. [Google Scholar] [CrossRef]
- Mawson, A.J. Consideration of the fermentation of concentrated whey solution for ethanol production. In Fermentation Technologies: Industrial Applications; Yu, P.L., Ed.; Elsevier Applied Science: London, UK, 1990; pp. 264–270. [Google Scholar]
- Aquino, R.D. Biobutanol on the horizon. Chem. Eng. Prog. 2007, 103, 10. [Google Scholar]
- Ennis, B.; Marshall, C.; Maddox, I.S.; Paterson, A. Continuous product recovery by in-situ gas stripping/condensation during solvent production from whey permeate using Clostridium acetobutylicum. Biotechnol. Lett. 1986, 8, 725–730. [Google Scholar] [CrossRef]
- Maddox, I.S. The acetone-butanol-ethanol fermentation: Recent progress in technology. Biotechnol. Genet. Eng. Rev. 1989, 7, 189–220. [Google Scholar] [CrossRef]
- Groot, W.; van der Lans, R.; Luyben, K.C.A.M. Technologies for butanol recovery integrated with fermentations. Process Biochem. 1992, 27, 61–75. [Google Scholar] [CrossRef]
- Garcia, A.; Innotti, E.L.; Fischer, J.L. Butanol fermentation liquor production and separation by reverse osmosis. Biotechnol. Bioeng. 1986, 28, 785–791. [Google Scholar] [CrossRef] [PubMed]
- Yang, X.; Tsai, G.-J.; Tsao, G.T. Enhancement of in situ adsorption on the acetone-butanol fermentation by Clostridium acetobutylicum. Sep. Technol. 1994, 4, 81–92. [Google Scholar] [CrossRef]
- Roffler, S.; Blanch, H.; Wilke, C. In-situ recovery of butanol during fermentation—Part 1: Batch extractive fermentation. Bioprocess Eng. 1987, 2, 1–12. [Google Scholar] [CrossRef]
- Alsaker, K.V.; Spitzer, T.R.; Papoutsakis, E.T. Transcriptional analysis of spo0A overexpression in Clostridium acetobutylicum and its effect on the cell’s response to butanol stress. J. Bacteriol. 2004, 186, 1959–1971. [Google Scholar] [CrossRef] [Green Version]
- Annous, B.; Blaschek, H. Isolation and characterization of α-amylase derived from starchgrown Clostridium acetobutylicum ATCC 824. J. Ind. Microbiol. Biotechnol. 1994, 13, 10–16. [Google Scholar]
- Formanek, J.; Mackie, R.; Blaschek, H. Enhanced butanol production by Clostridium beijerinckii BA101 grown in semidefined P2 medium containing 6 percent maltodextrin or glucose. Appl. Environ. Microbiol. 1997, 63, 2306–2310. [Google Scholar] [CrossRef] [Green Version]
- Zhang, J.; Zong, W.; Hong, W.; Zhang, Z.-T.; Wang, Y. Exploiting CRISPR-Cas system for multiplex genome editing in Clostridium tyrobutyricum and engineer the strain for high-level butanol production. Metab. Eng. 2018, 47, 49–59. [Google Scholar] [CrossRef] [PubMed]
- Qureshi, N.; Blaschek, H.P. Butanol recovery from model solution/fermentation broth by pervaporation: Evaluation of membrane performance. Biomass Bioenergy 1999, 17, 175–184. [Google Scholar] [CrossRef]
- Qureshi, N.; Li, X.; Hughes, S.R.; Saha, B.C.; Cotta, M.A. Production of acetone butanol ethanol from corn fiber xylan using Clostridium acetobutylicum. Biotechnol. Prog. 2006, 22, 673–680. [Google Scholar] [CrossRef] [PubMed]
- Qureshi, N.; Saha, B.; Liu, S.; Harry-O’kuru, R. Production of acetone–butanol–ethanol (ABE) from concentrated yellow top presscake using Clostridium beijerinckii P260. J. Chem. Technol. Biotechnol. 2020, 95, 614–620. [Google Scholar] [CrossRef]
- Qureshi, N.; Paterson, A.H.J.; Maddox, I.S. Model for continuous production of solvents from whey permeate in a packed bed reactor using cells of Clostridium acetobutylicum immobilized by adsorption onto bonechar. Appl. Microbiol. Biotechnol. 1988, 29, 323–328. [Google Scholar] [CrossRef]
- Huang, W.-C.; Ramey, D.E.; Yang, S.-T. Continuous production of butanol by Clostridium acetobutylicum immobilized in a fibrous bed bioreactor. Appl. Biochem. Biotechnol. 2004, 113–116, 887–898. [Google Scholar] [CrossRef] [PubMed]
- Xin, F.; Wu, Y.R.; He, J. Simultaneous fermentation of glucose and xylose to butanol by Clostridium sp. strain BOH3. Appl. Environ. Microbiol. 2014, 80, 4771–4778. [Google Scholar] [CrossRef] [PubMed] [Green Version]
- Zheng, J.; Tashiro, Y.; Yoshida, T.; Gao, M.; Wang, Q.; Sonomoto, K. Continuous butanol fermentation from xylose with high cell density by cell recycling system. Bioresour. Technol. 2013, 129, 360–365. [Google Scholar] [CrossRef] [PubMed]
- Xiao, H.; Li, Z.; Jiang, Y.; Yang, Y.; Jiang, W.; Gu, Y.; Yang, S. Metabolic engineering of D-xylose pathway in Clostridium beijerinckii to optimize solvent production from xylose mother liquid. Metab. Eng. 2012, 14, 569–578. [Google Scholar] [CrossRef]
Figure 1.
Schematic diagrams of ABE (acetone, butanol, ethanol) production from xylose employing C. beijerinckii P260. (A) Batch reactor—the reactor is filled with sugar solution prior to inoculation; (B) Continuous reactor without product recovery—the reactor is fed continuously with sugar solution and fermentation broth is removed from the reactor at the same flow rate as the feed; and (C) Concentrated sugar medium batch reactor with simultaneous product removal by gas stripping. (C) was also used to measure solvent losses through the connecting tubing. Fermen gases—Fermentation gases.

Figure 2.
Production of ABE from glucose in a control batch reactor using C. beijerinckii P260. (A) Concentration of glucose and ABE. (B) Concentration of acids in the fermentation broth. (C) Dry cell concentration and pH during fermentation. Abbreviations: HAc—acetic acid, HBu—butyric acid, HAB—total acetic and butyric acids.
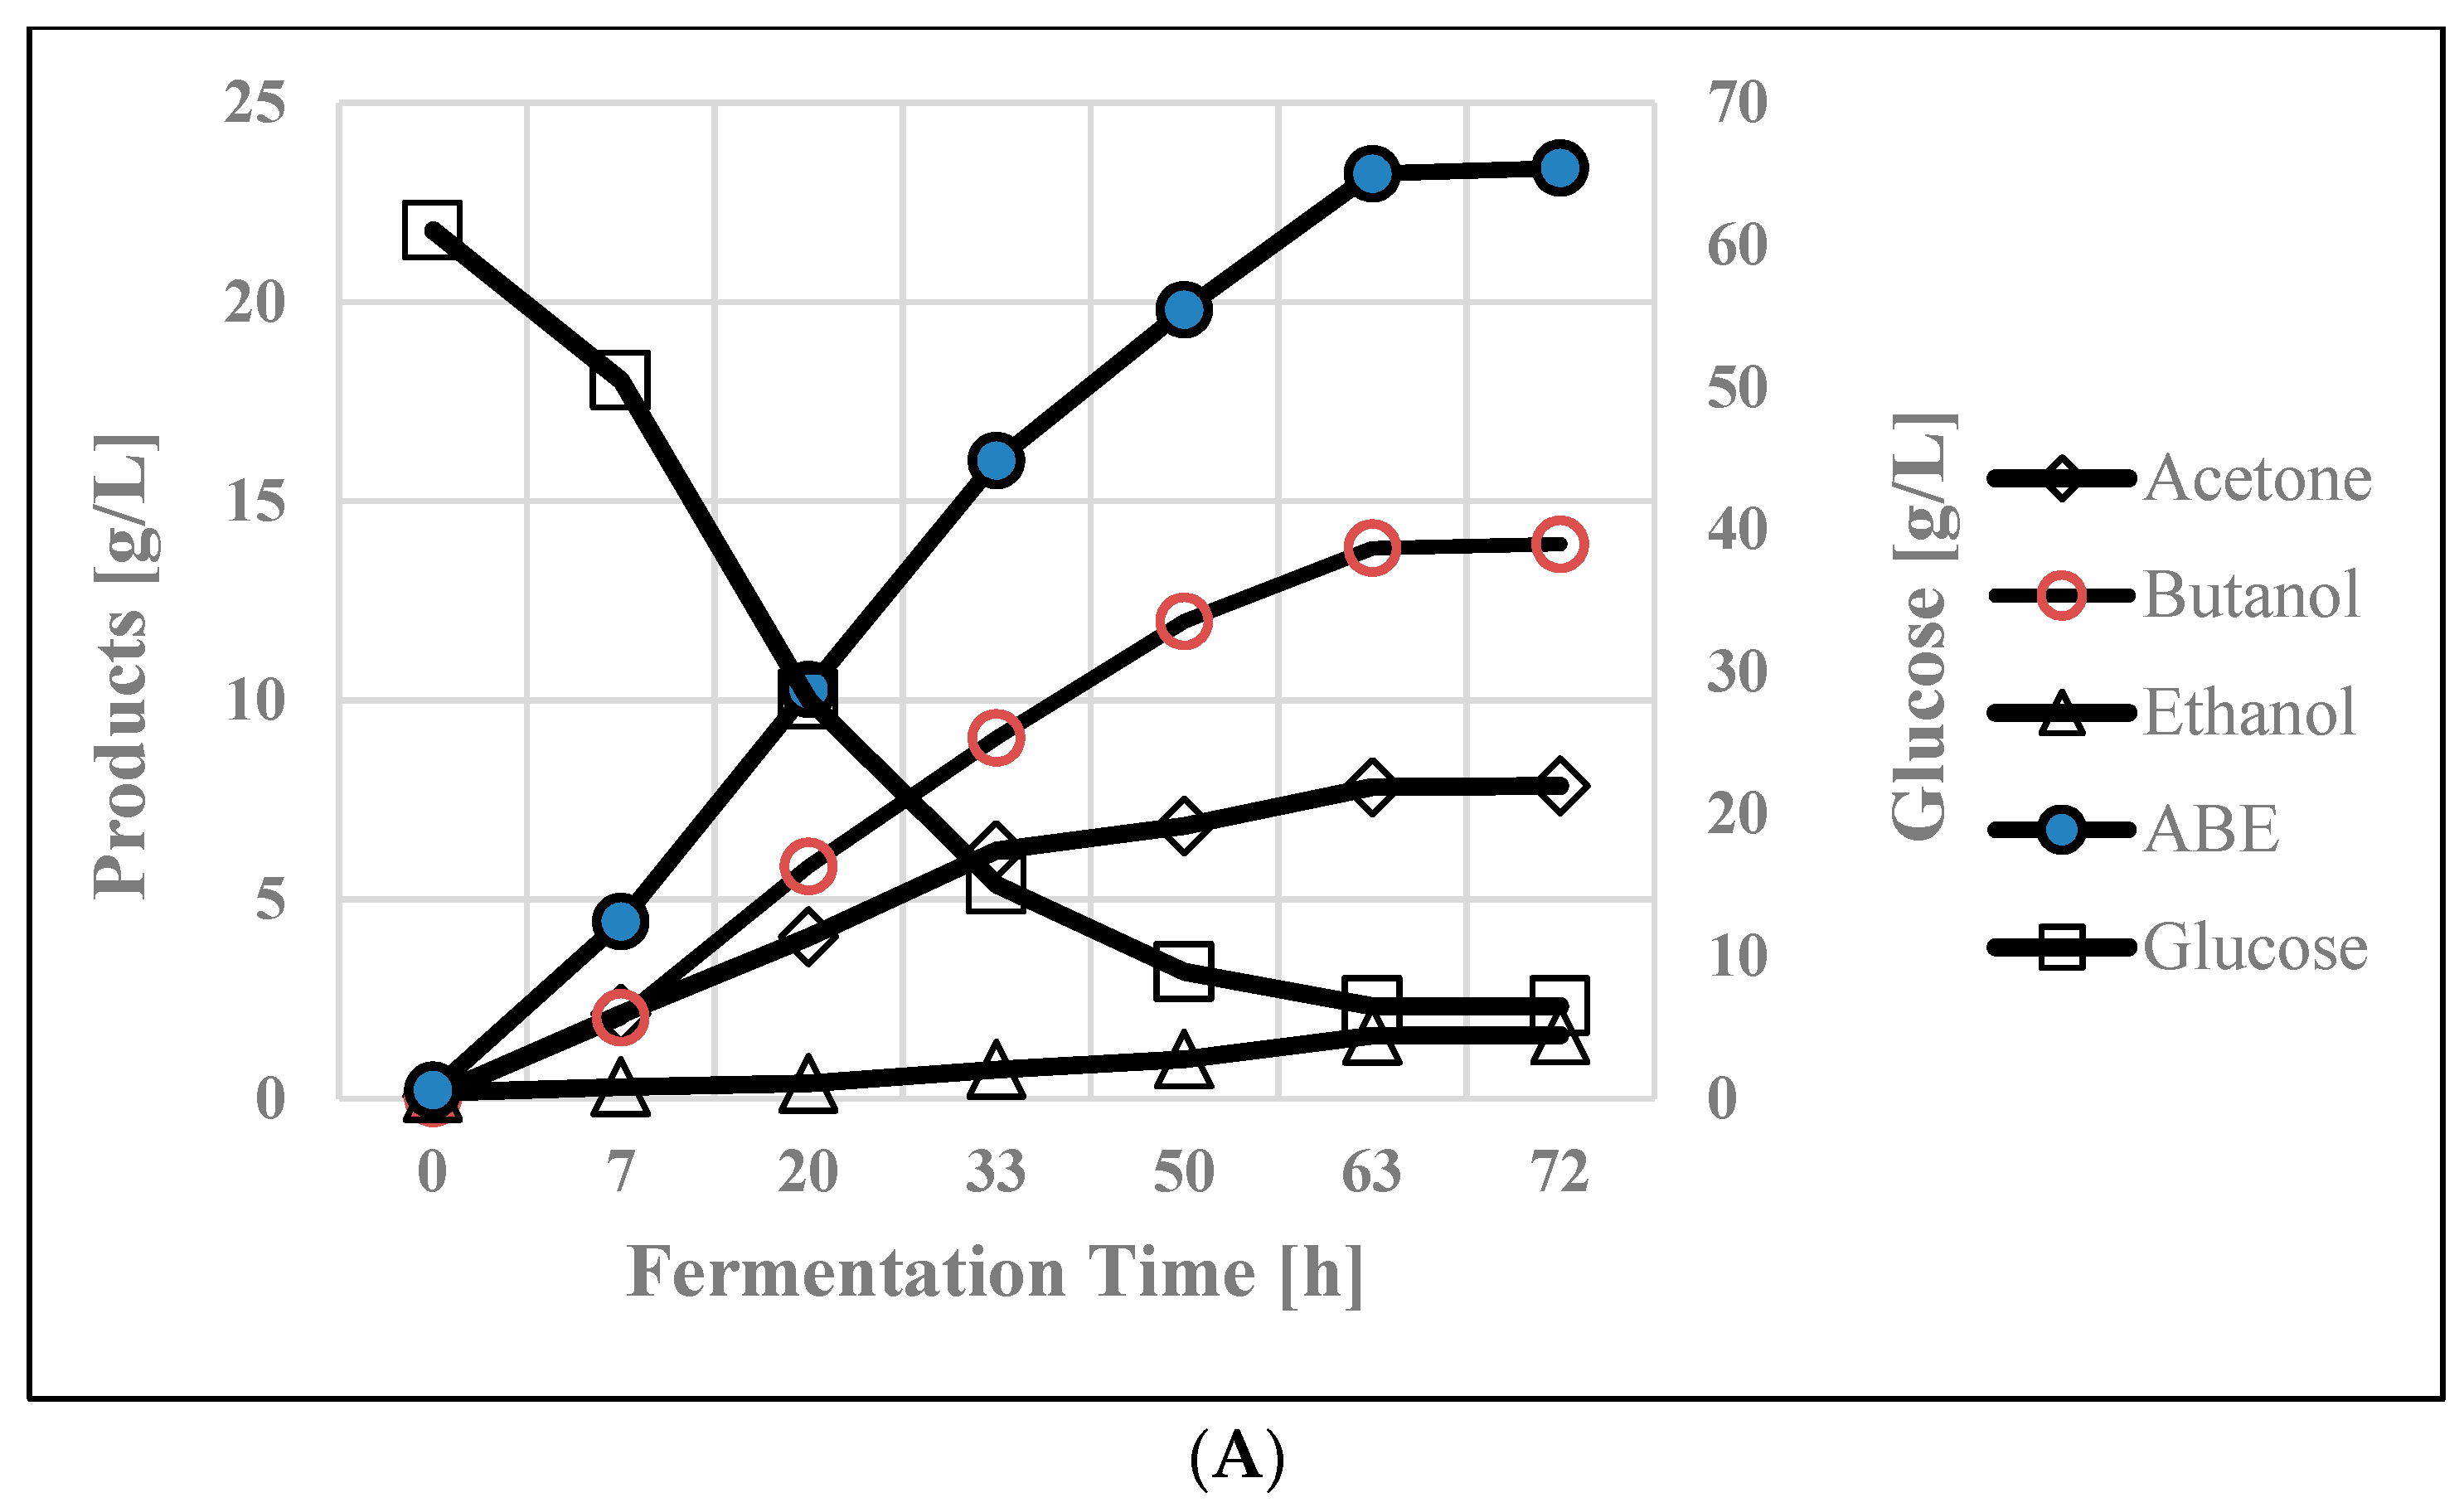
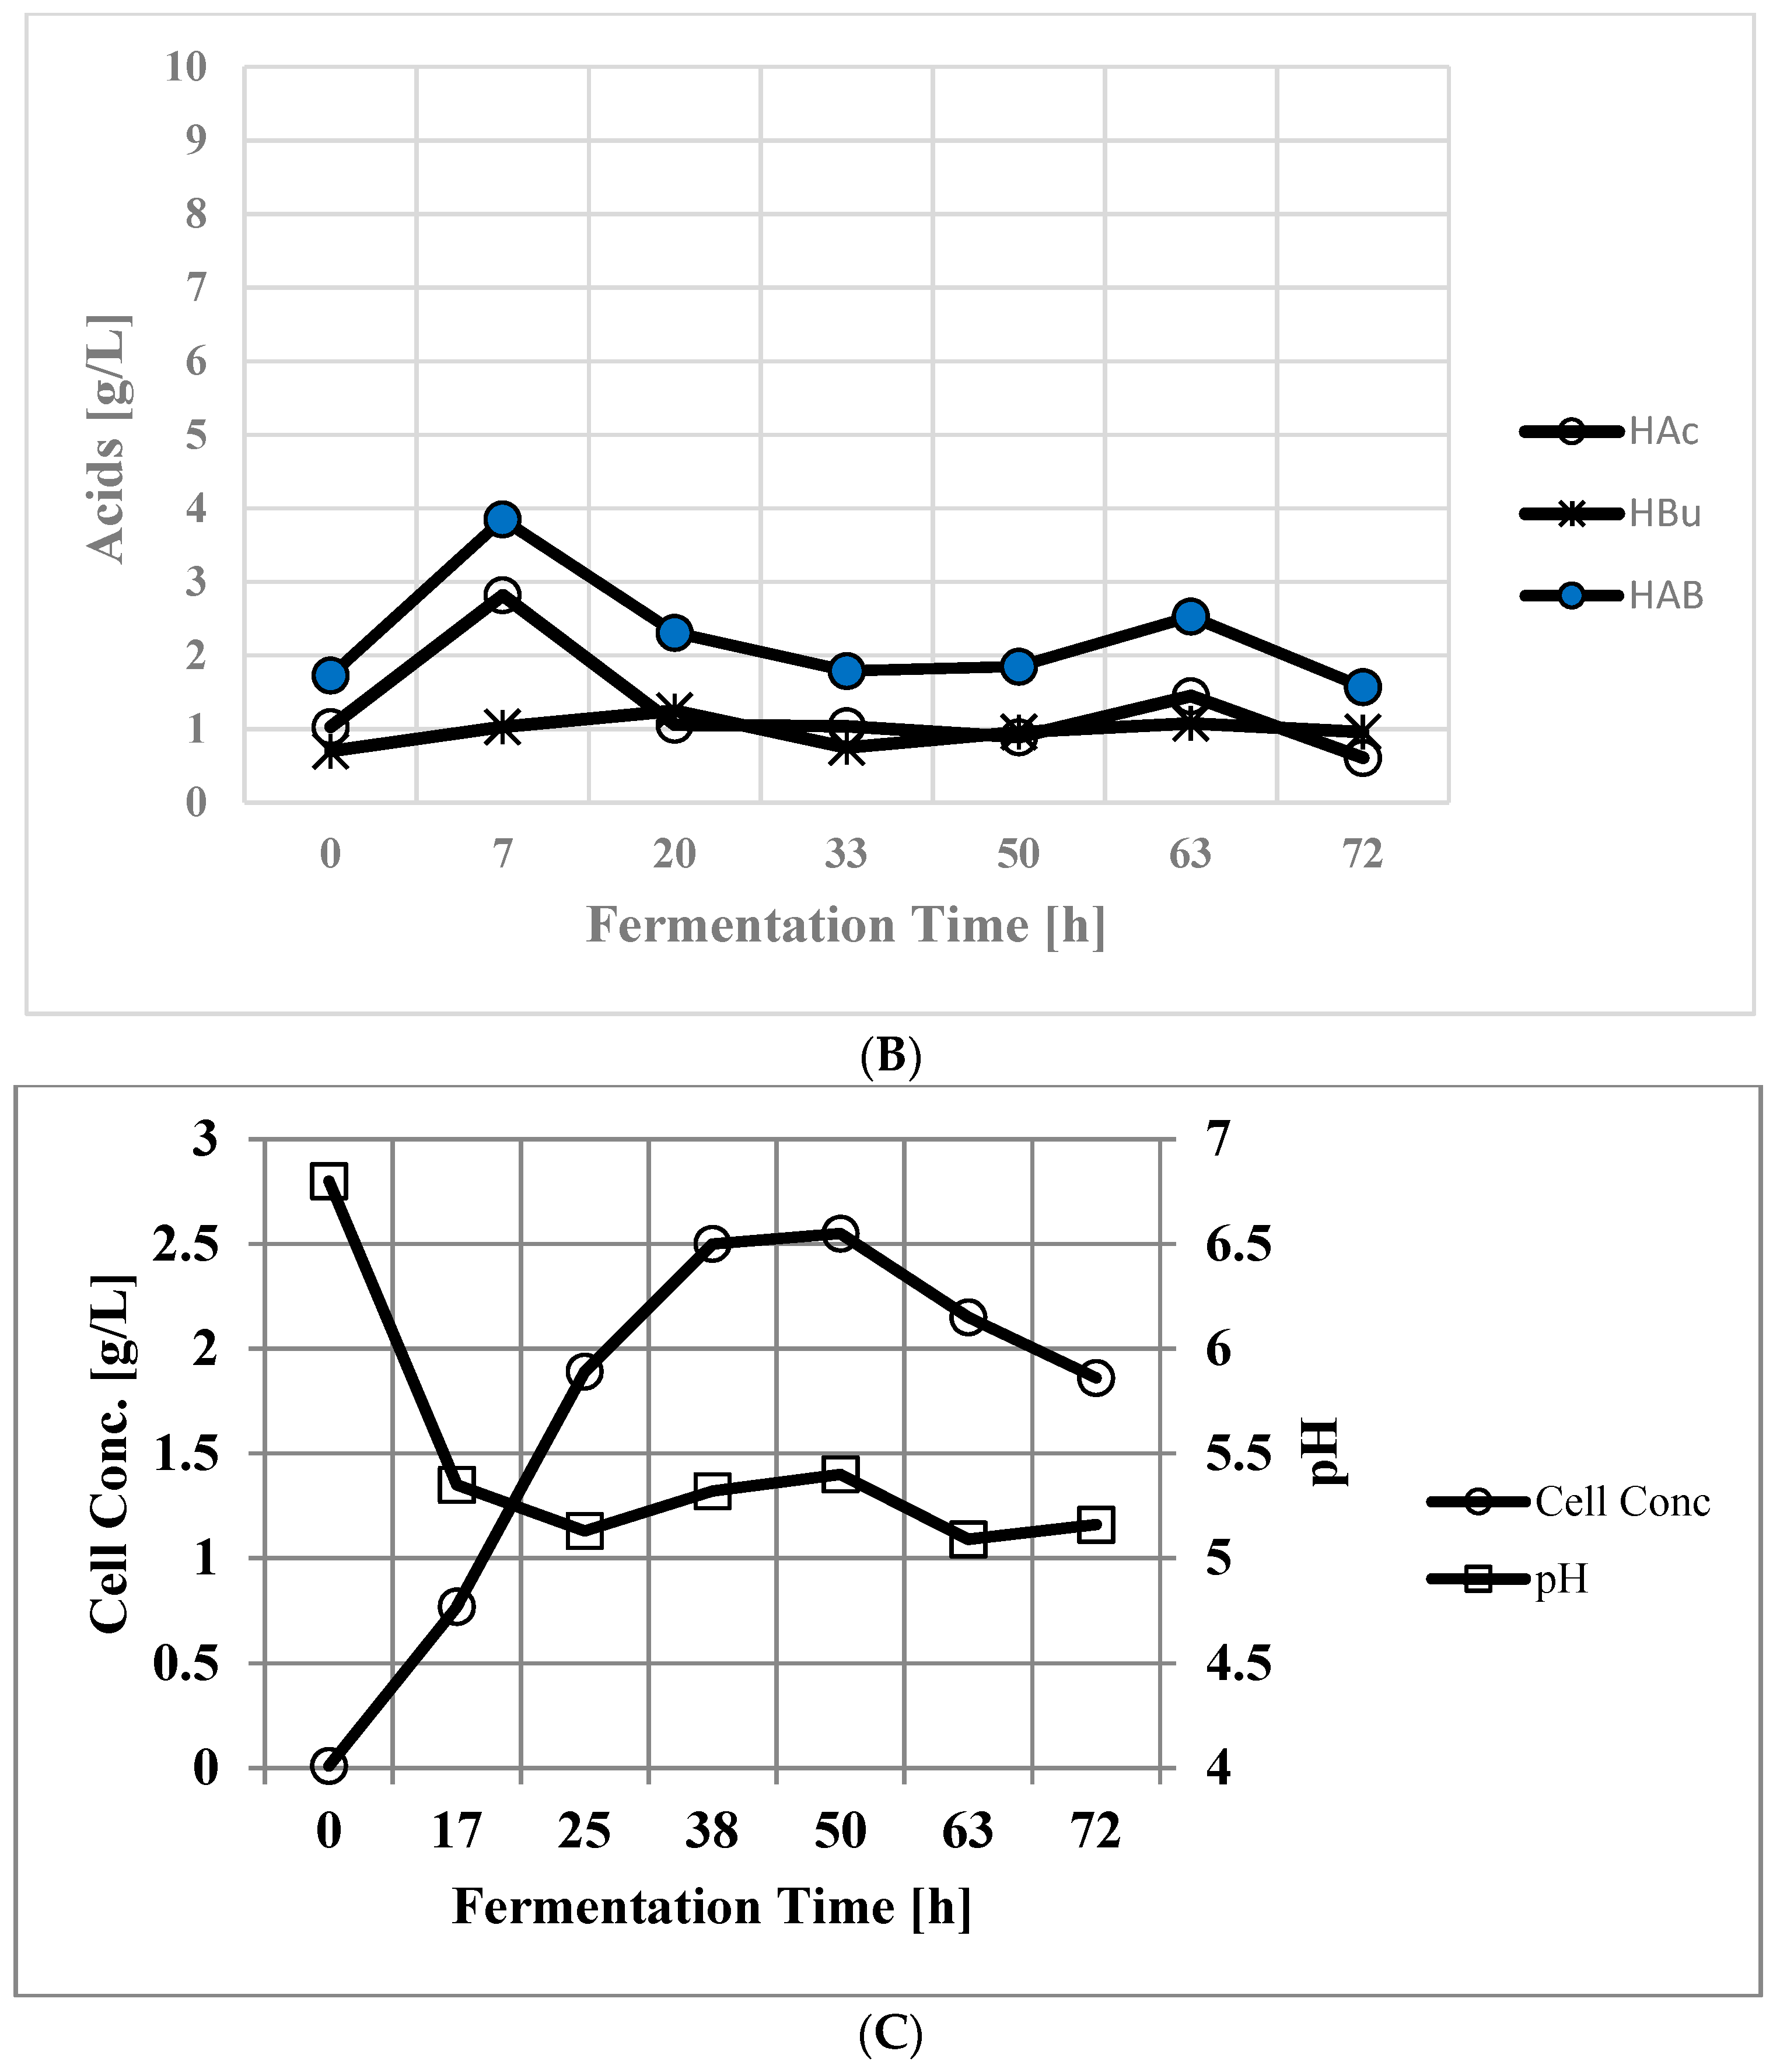
Figure 3.
Production of ABE from xylose in a batch reactor employing C. beijerinckii P260. (A) Xylose concentration and products; (B) Acids during fermentation. Abbreviations as in legend of Figure 2.
Figure 3.
Production of ABE from xylose in a batch reactor employing C. beijerinckii P260. (A) Xylose concentration and products; (B) Acids during fermentation. Abbreviations as in legend of Figure 2.
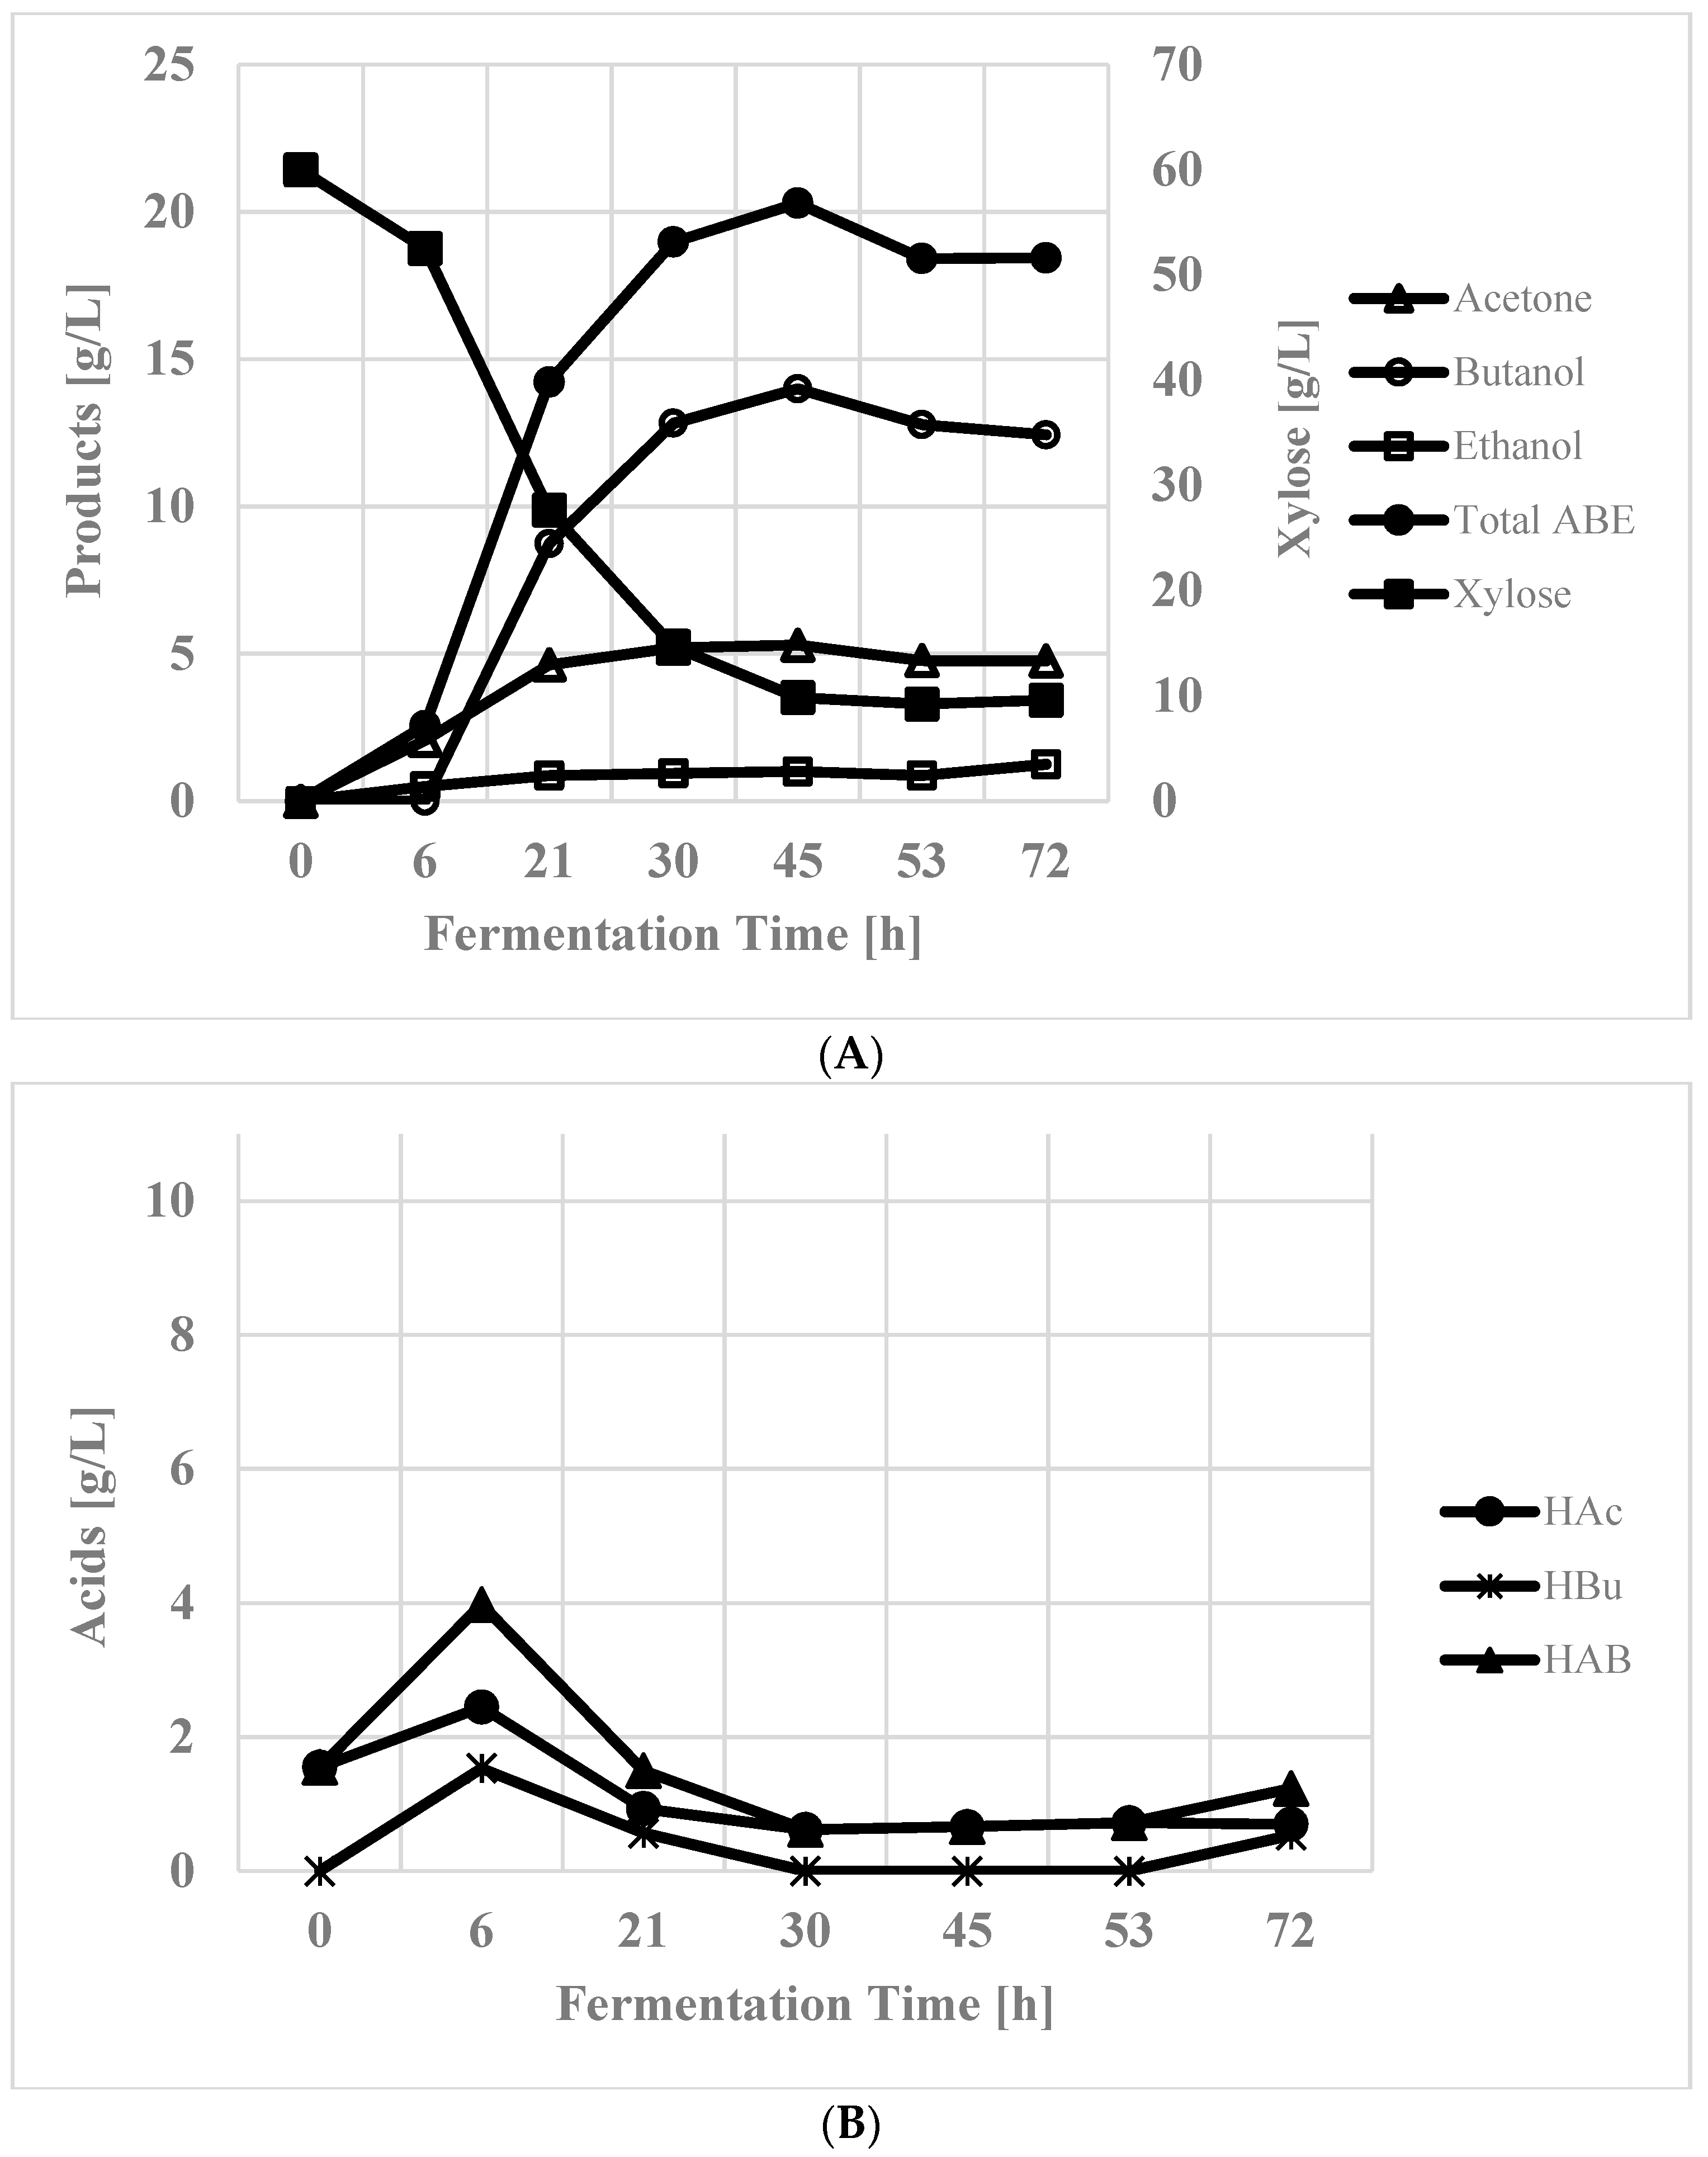
Figure 4.
Rates of various sugar utilization at various fermentation times. Glu—glucose, arab—arabinose, xyl—xylose, and gal—galactose.
Figure 4.
Rates of various sugar utilization at various fermentation times. Glu—glucose, arab—arabinose, xyl—xylose, and gal—galactose.
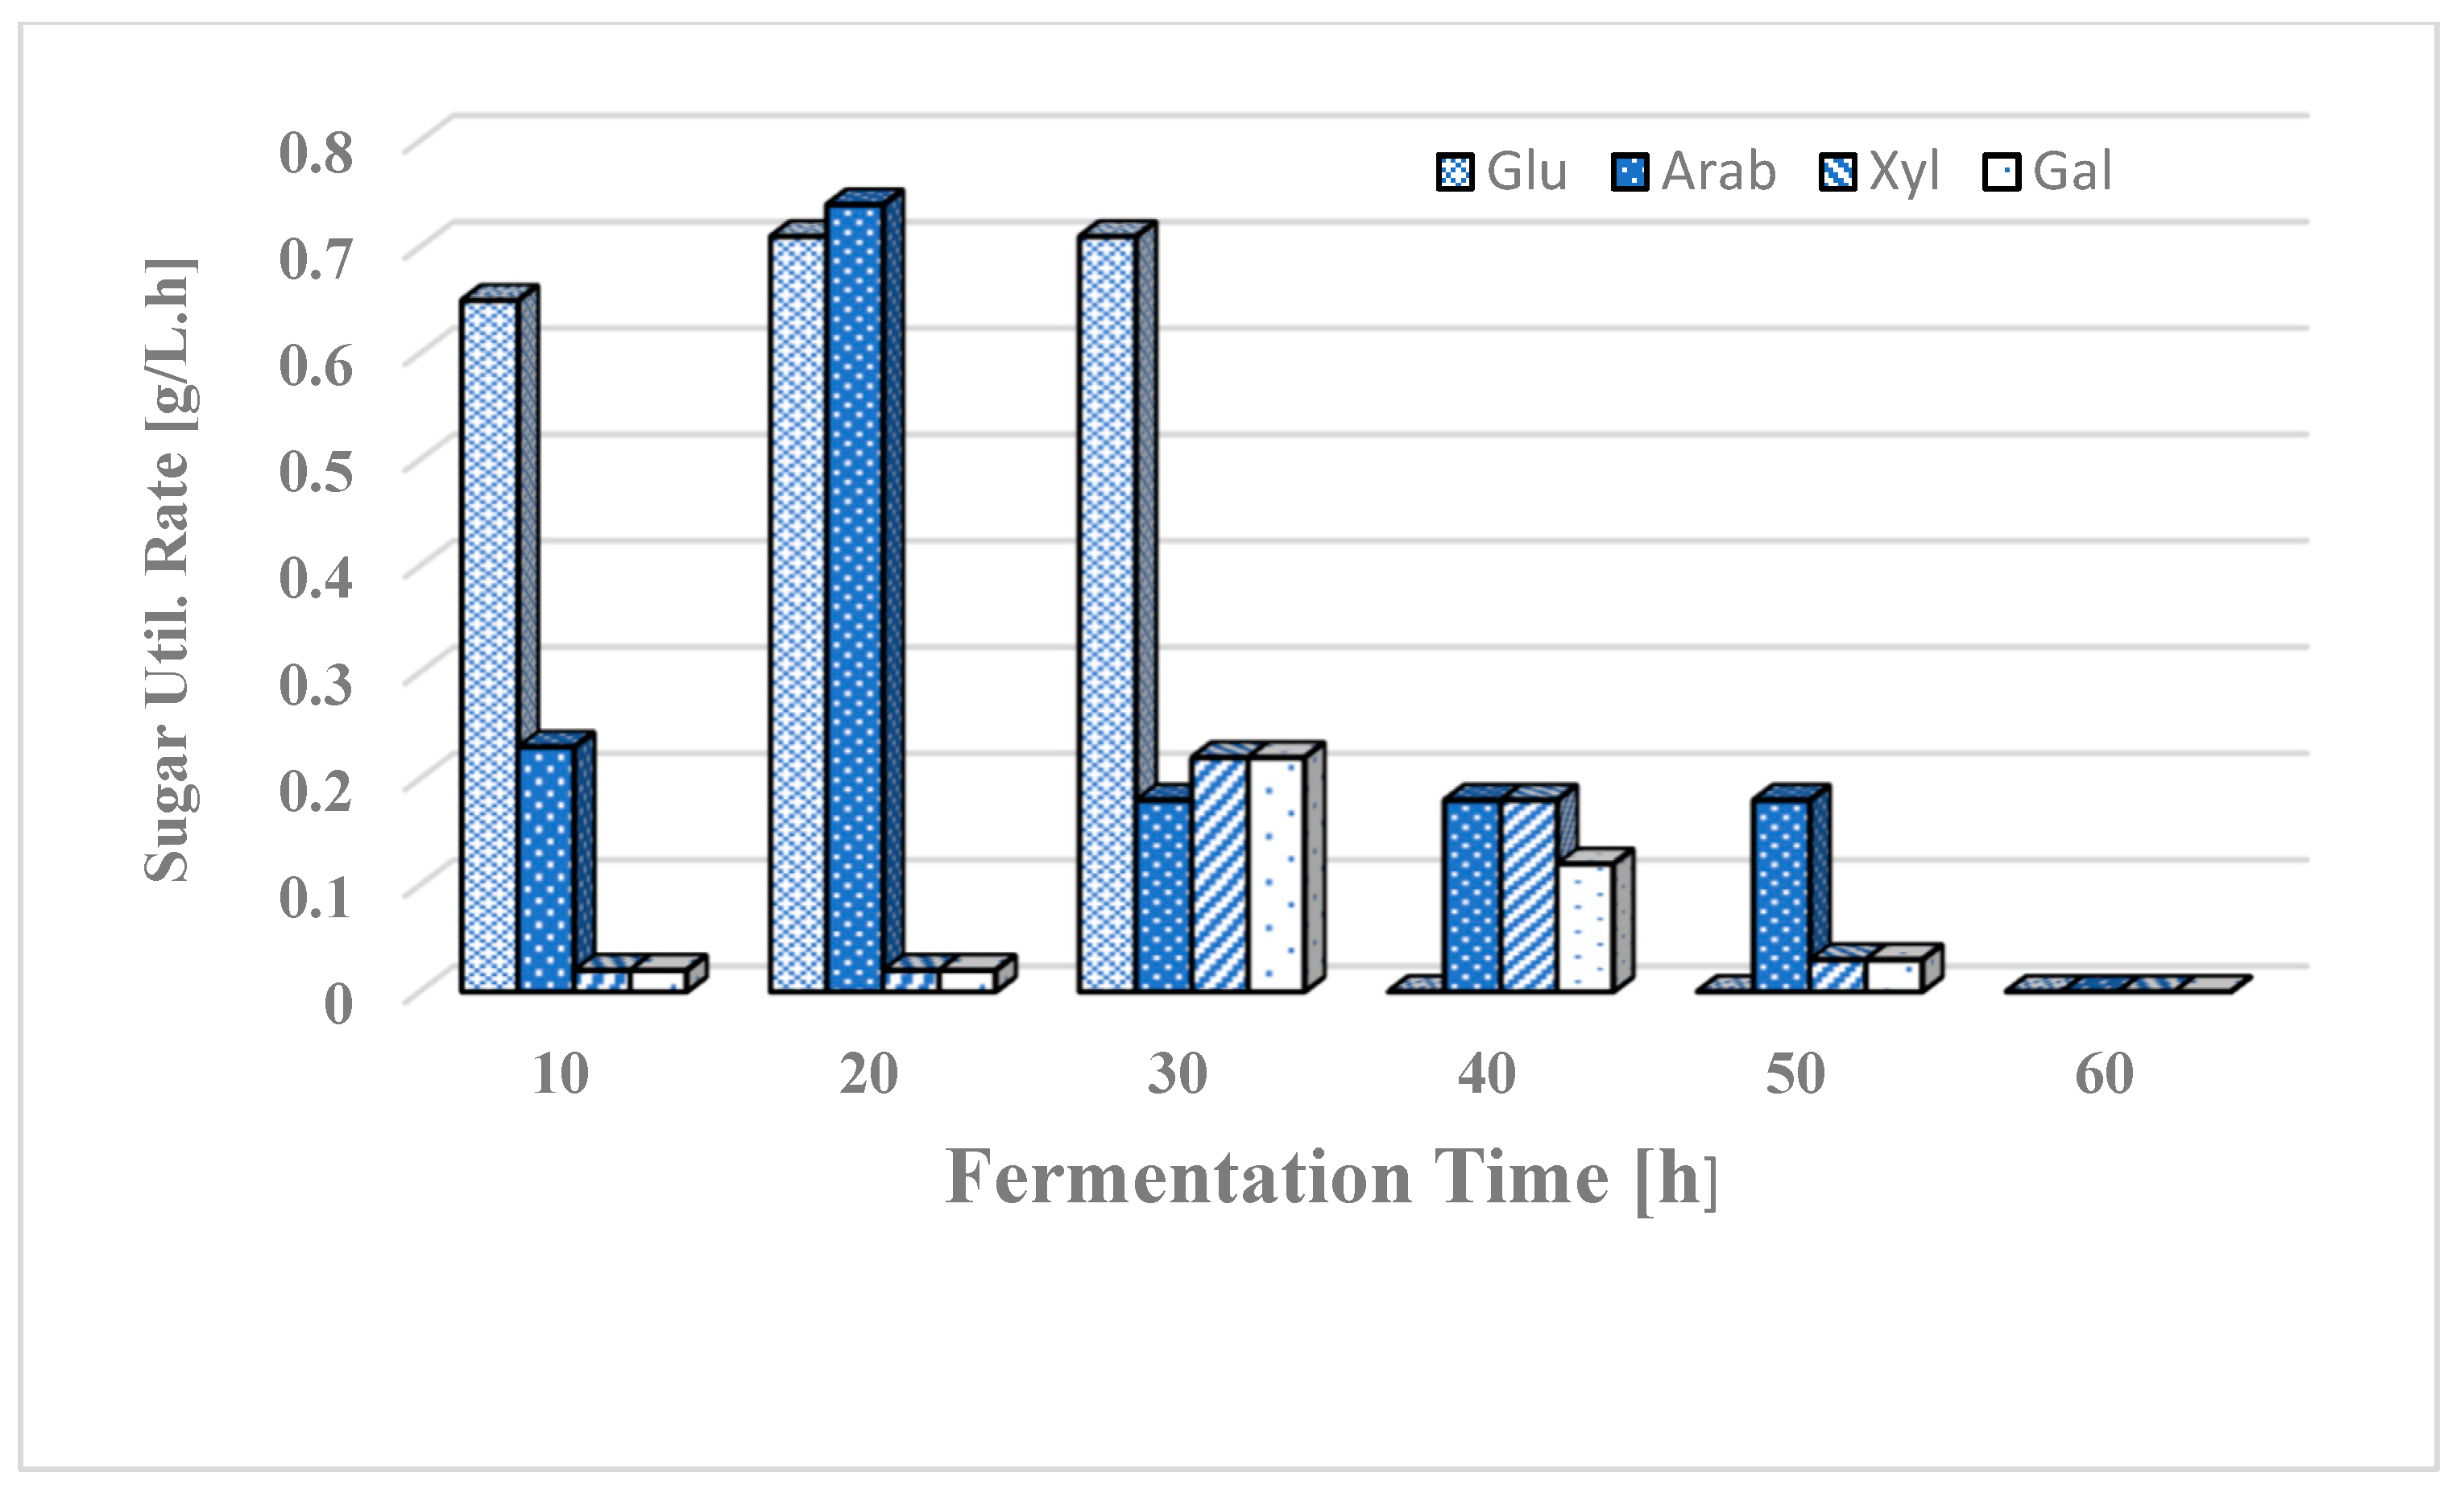
Figure 5.
Production of ABE from xylose and simultaneous product recovery in a batch reactor using C. beijerinckii P260. (A). Products and xylose at various fermentation times; (B) Concentration of acids at different fermentation times. The arrow indicates the time when product recovery was initiated. Abbreviations as in Figure 2.
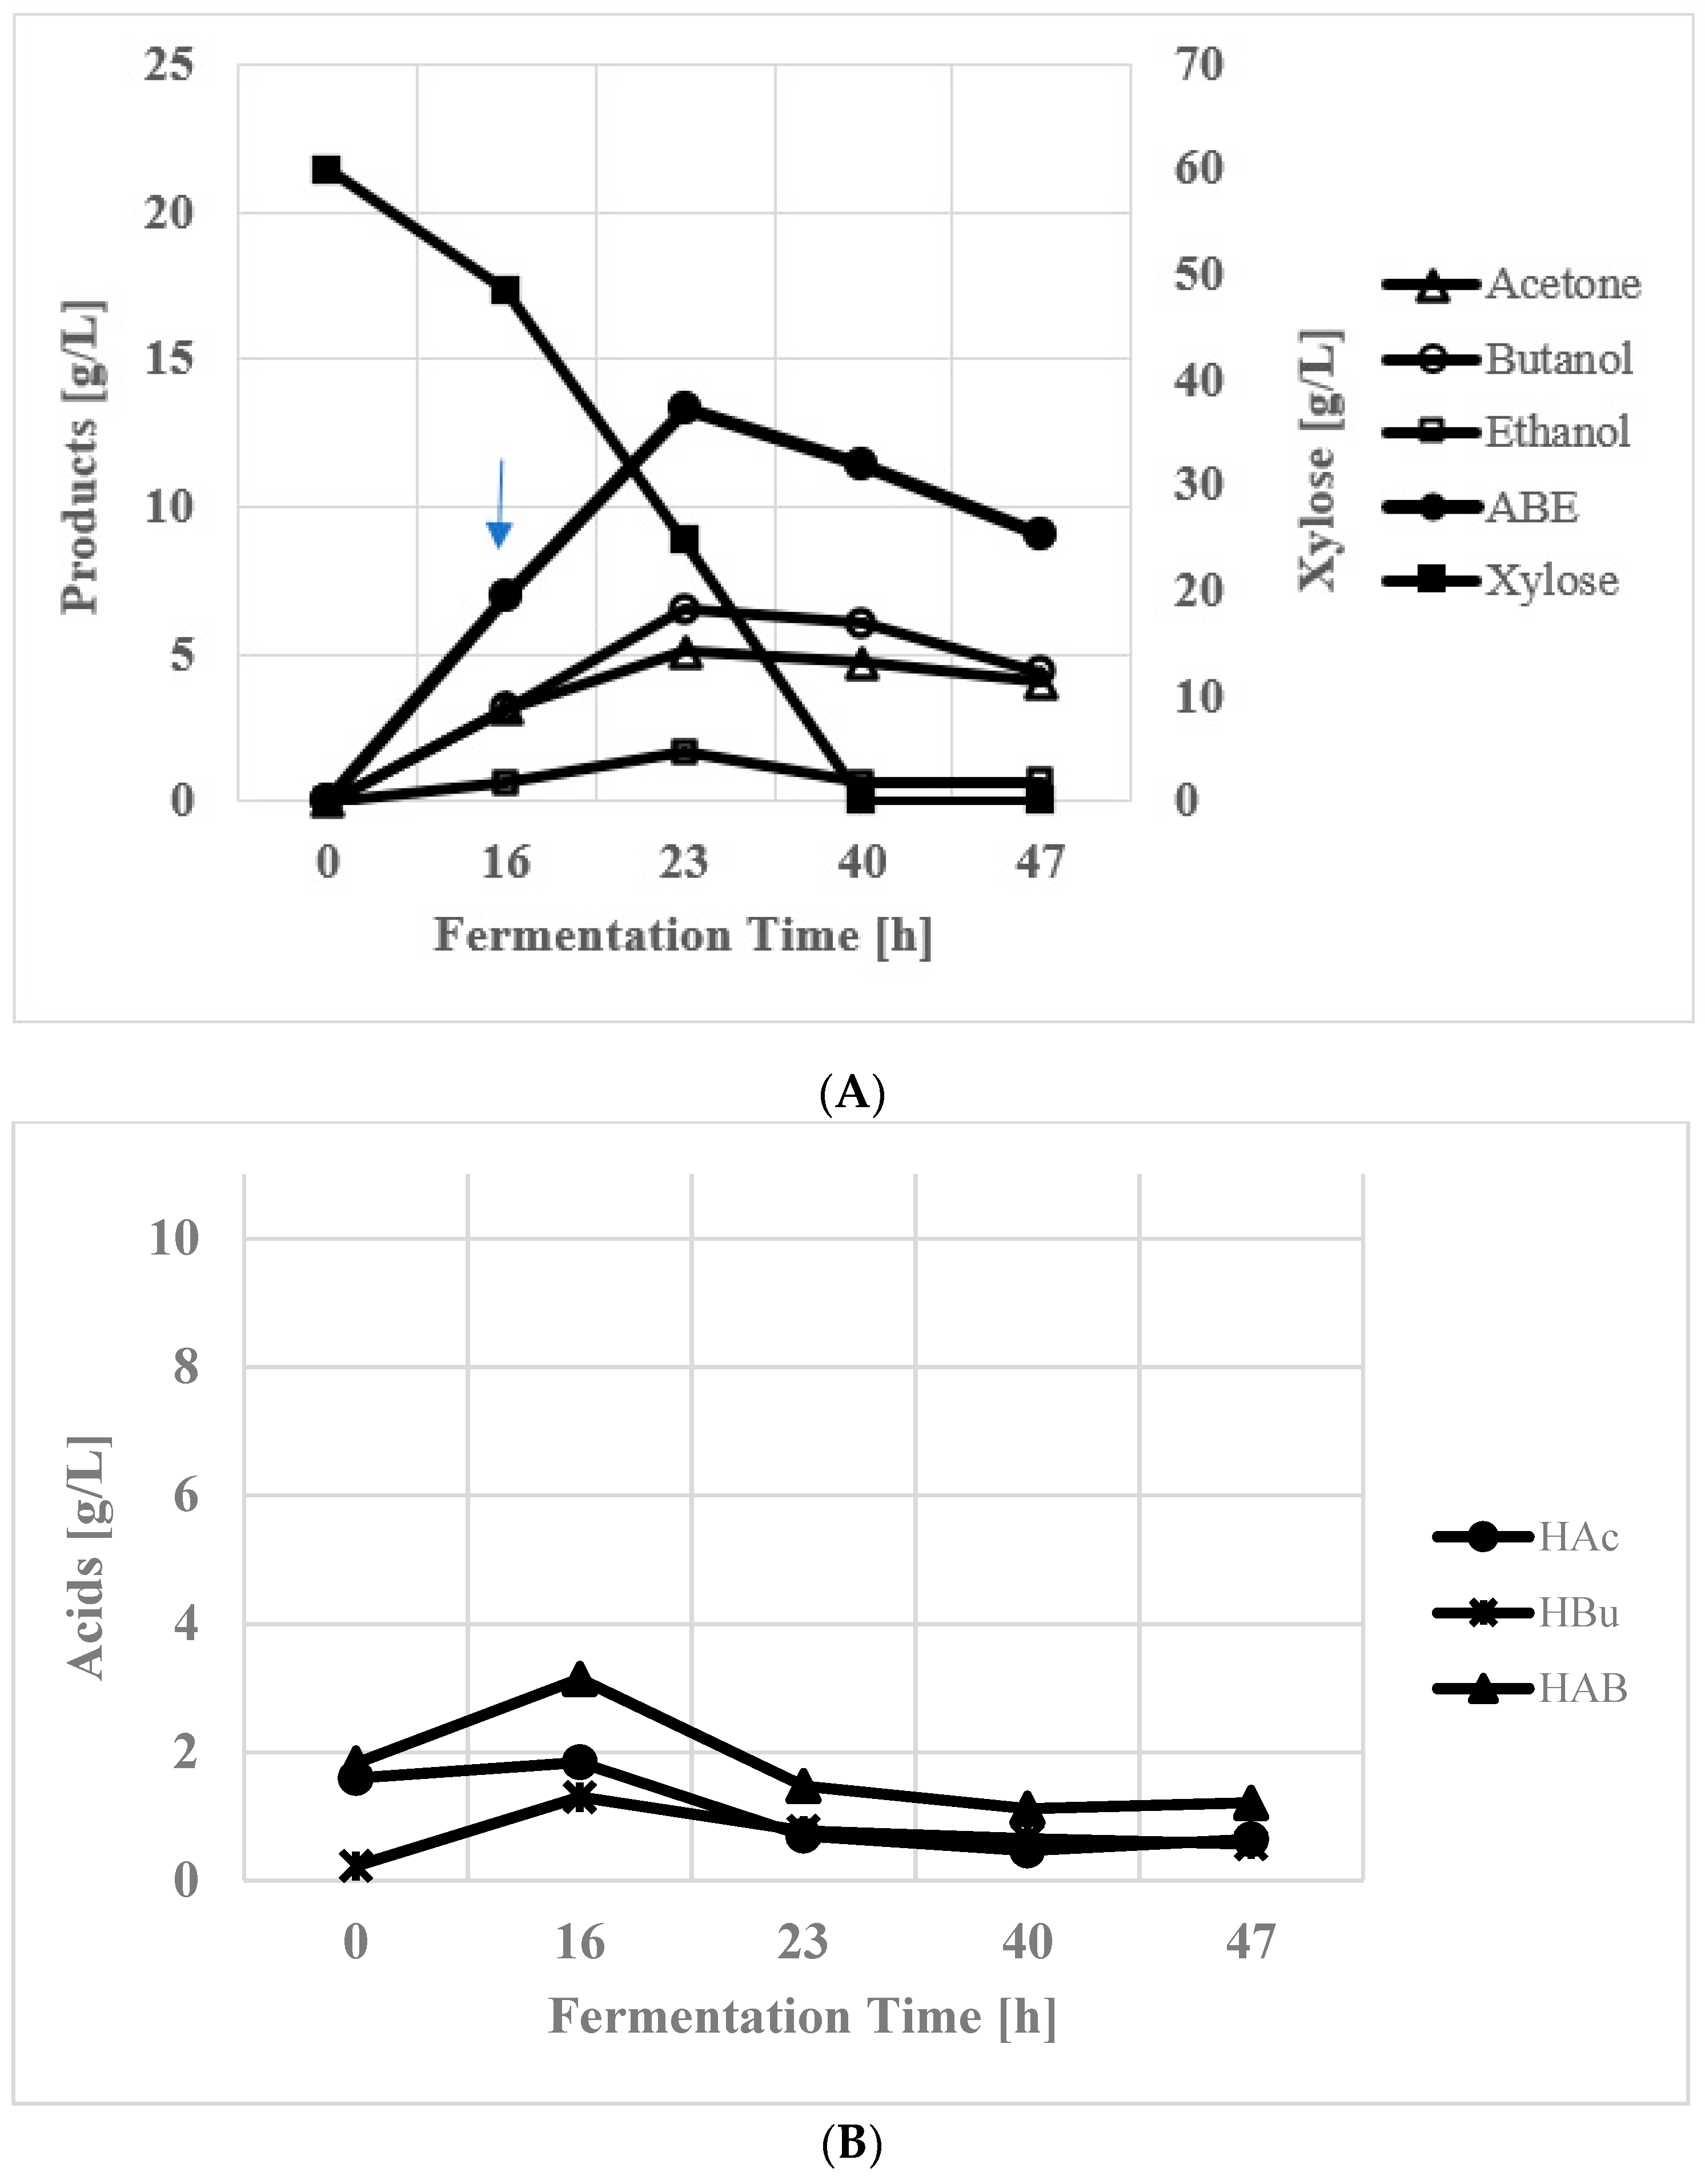
Figure 6.
Production of ABE from concentrated xylose (100–250 g/L) in batch fermentations using C. beijerinckii P260. (A) Xylose concentration vs Products; (B) Xylose vs Acids; (C) Xylose vs Productivity and Yield; and (D) Xylose utilization rate during fermentations. Abbreviations as in Figure 2. Prod—productivity; Util.—utilization.
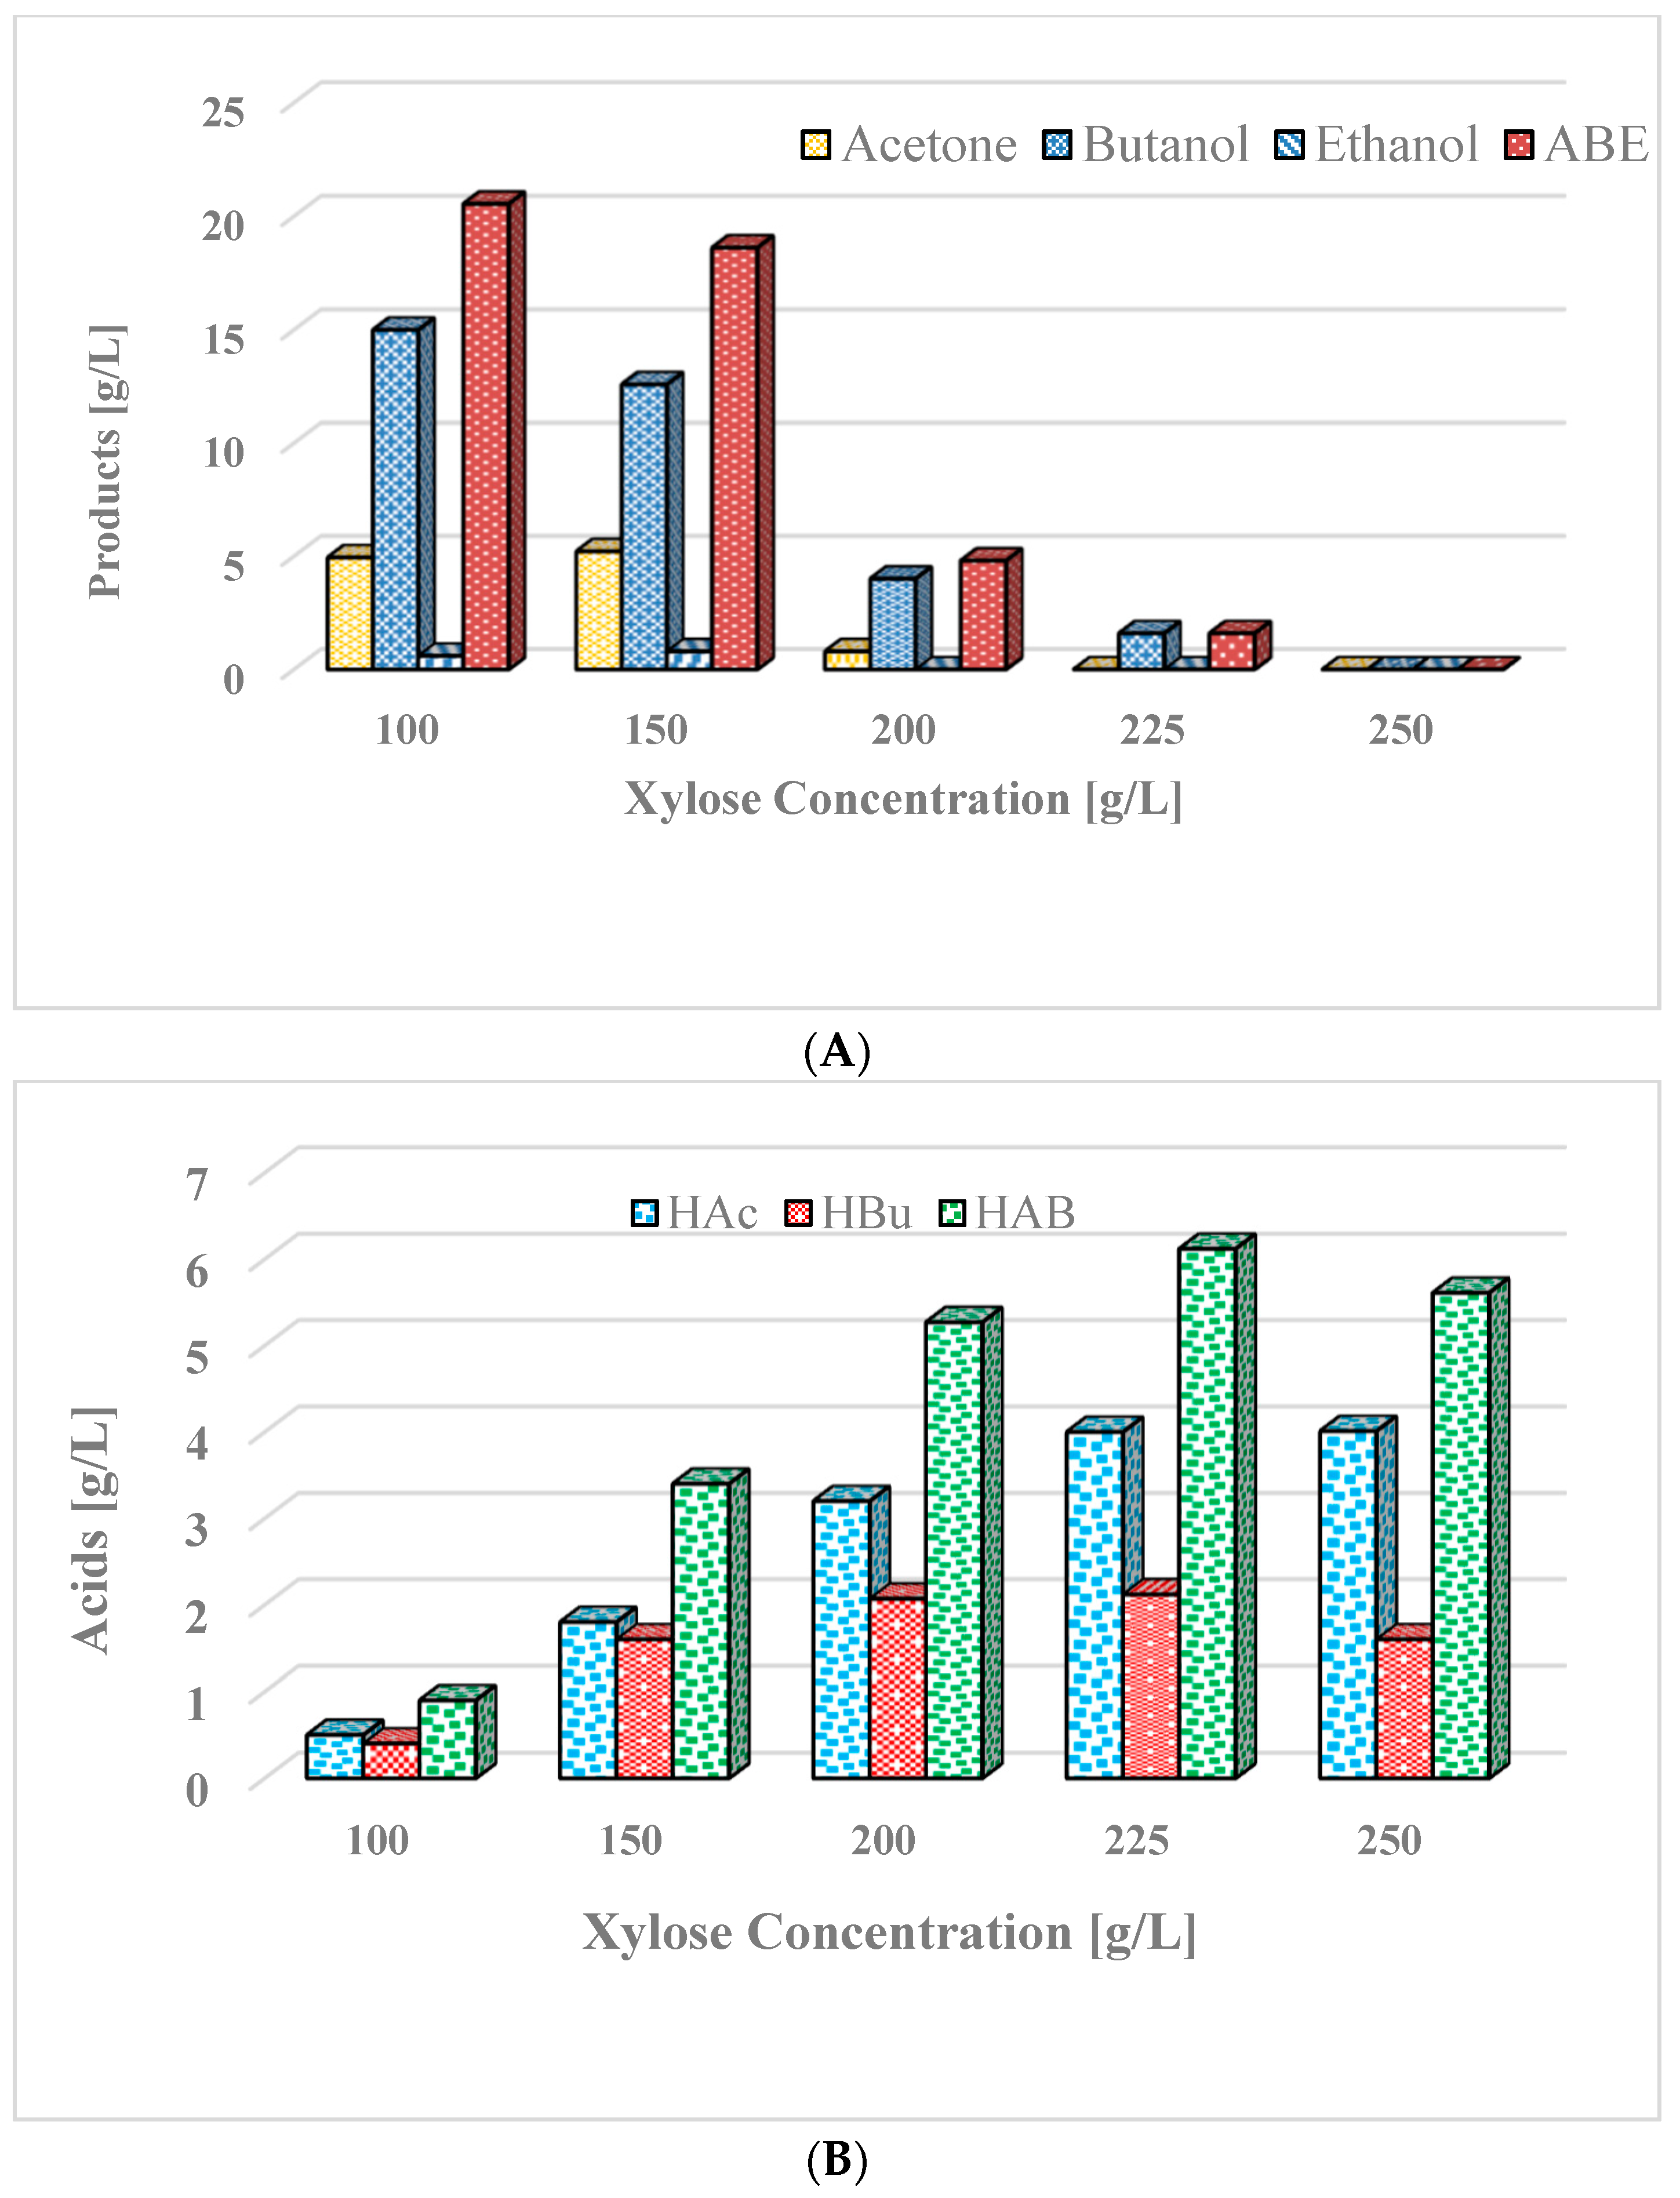
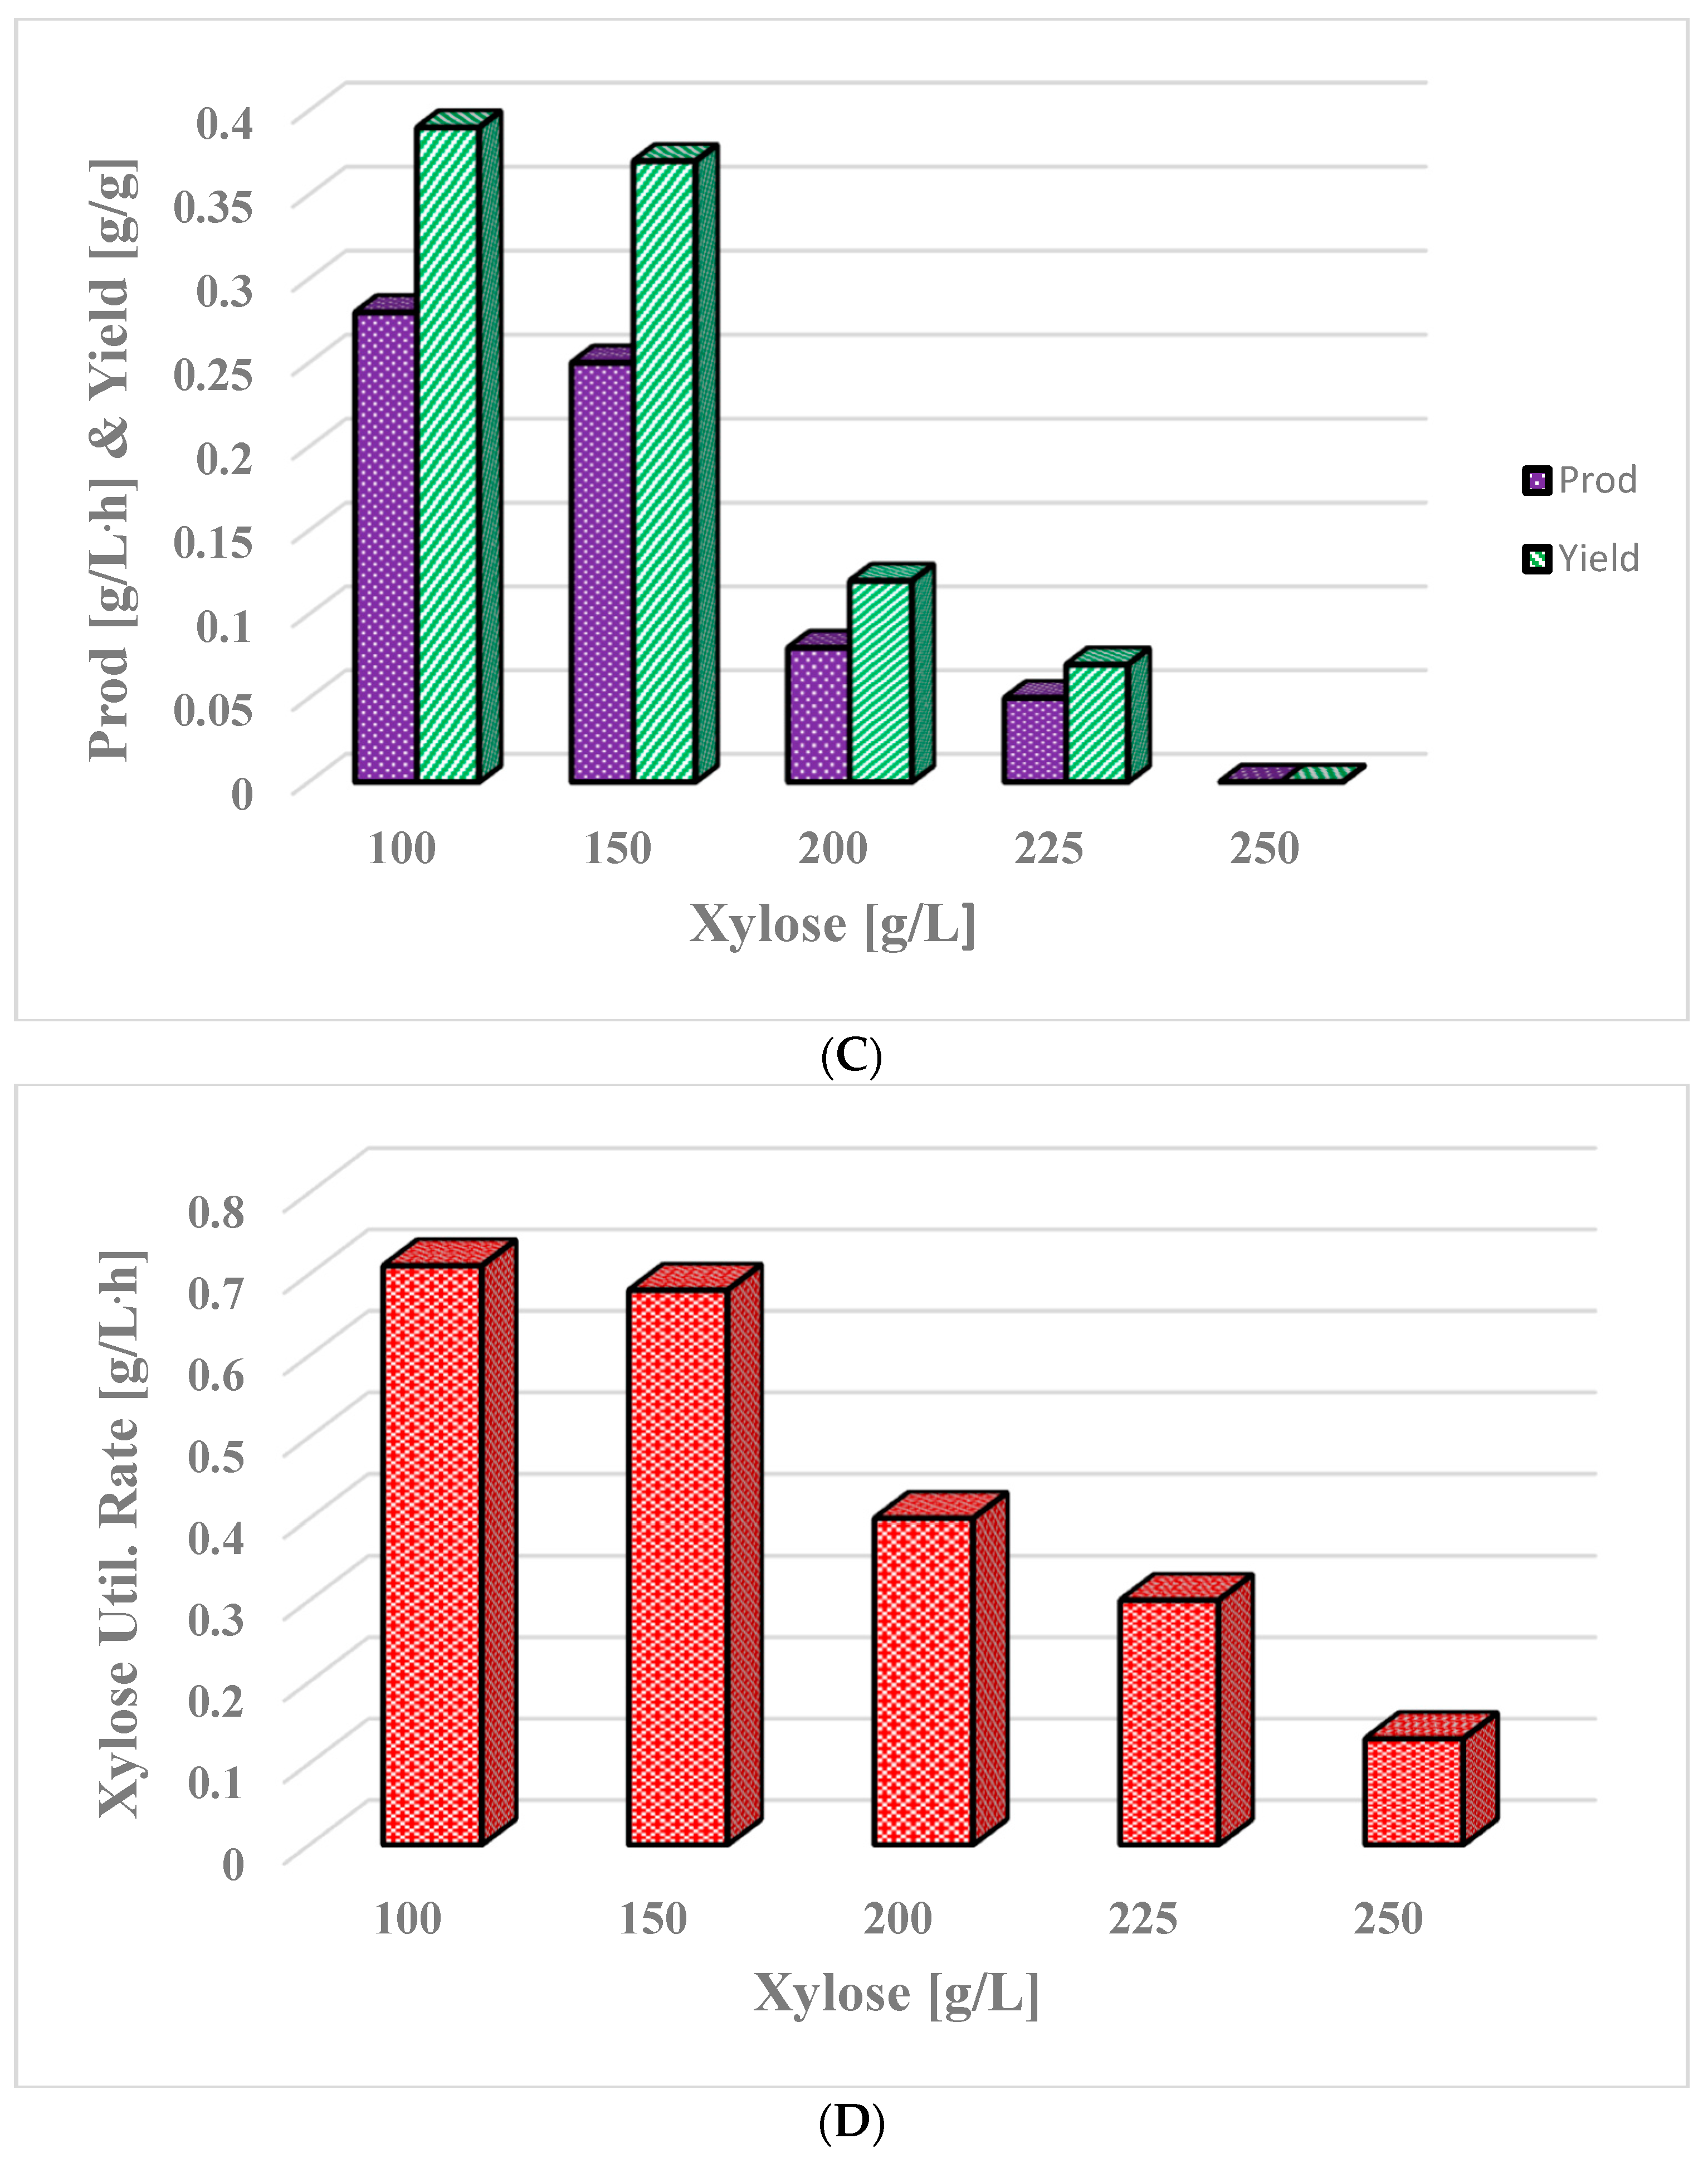
Figure 7.
Production of ABE from 150 g/L xylose medium in an integrated fermentation product recovery system by gas stripping using C. beijerinckii P260. (A) Products and xylose concentrations during fermentation (arrows indicate the times (16, 113, and 174 h) when product recovery was initiated); nutrients were added at 0, 92, and 168 h; (B) Fermentation times vs acids. (C) Fermentation time vs cell concentration. Conc.—concentration. 1 & arrow indicate when cell mass was removed by centrifugation and 2 & arrow indicate when the reactor was inoculated and nutrients were added to the reactor.

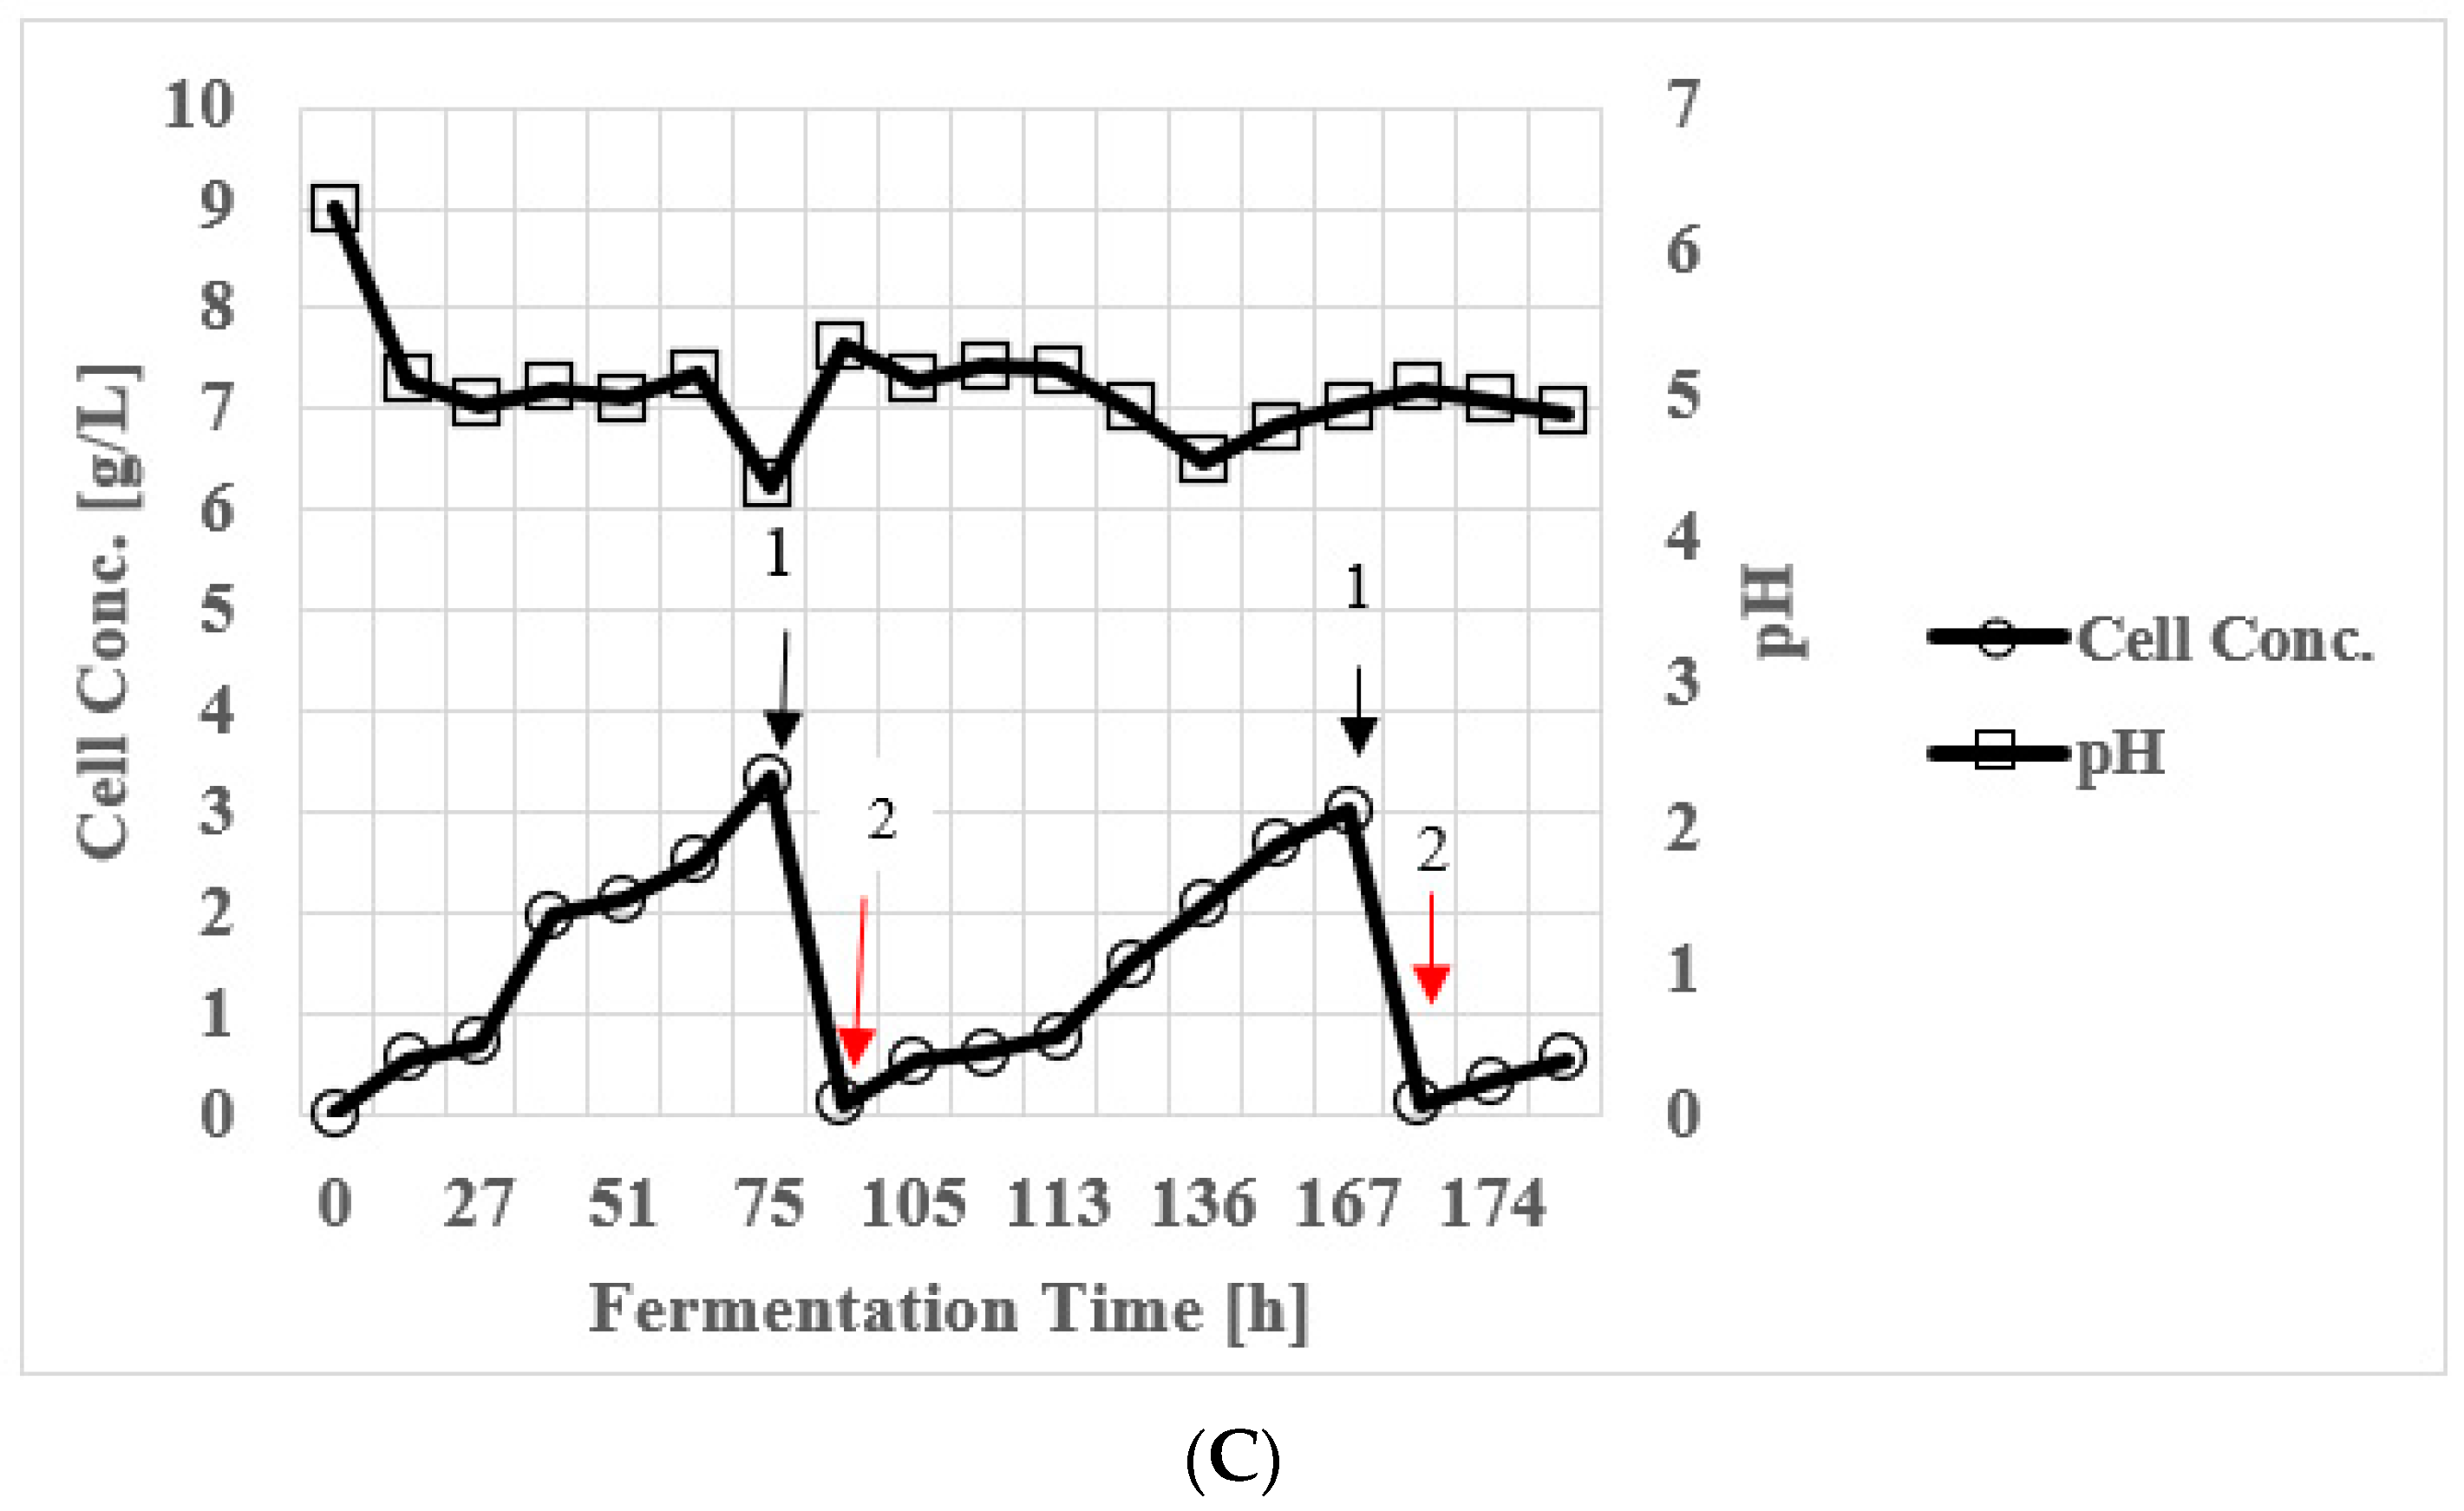
Figure 8.
Production of ABE from xylose in a continuous bioreactor fed with xylose as a substrate employing C. beijerinckii P260. (A) Fermentation time vs products and xylose. (B) Fermentation time vs acids; (C) Fermentation time vs dry cell concentration and pH. Conc.—concentration. Abbreviations as in Figure 2.

Table 1.
Condensate amounts and concentration of ABE in 60 g/L xylose fermentation coupled with product recovery by gas stripping.
Table 1.
Condensate amounts and concentration of ABE in 60 g/L xylose fermentation coupled with product recovery by gas stripping.
| Time [h] | Cond. vol [mL] | Acetone [g/L] | Butanol [g/L] | Ethanol [g/L] | ABE [g/L] |
|---|---|---|---|---|---|
| 23 | 24 | 23.00 | 59.00 | 3.84 | 85.84 |
| 40 | 103 | 27.59 | 68.31 | 1.69 | 97.59 |
| 47 | 44 | 16.00 | 35.55 | 2.10 | 53.65 |
Cond. vol—condensate volume.
Table 2.
Processing of fermentation broth to produce ABE from xylose after fermentation stopped.
| Exp. | Volume [mL] | Centrifuged | pH Adjusted | YE Added [g/L] | Stocks Added [mL/L] | Anaerobic Condition Created | Inoculated with New Inoculum | ABE Produced [g/L] |
|---|---|---|---|---|---|---|---|---|
| Processing after 51 h when fermentation ceased | ||||||||
| A | 10 | No | 5.2 | No | No | Yes | Yes | 4.64 |
| B | 10 | Yes 1 | 6.0 | Yes, 1.0 | Yes, 10 | Yes | Yes | 25.65 |
| Processing after 167 h when fermentation ceased | ||||||||
| C | 10 | No | 5.2 | No | No | Yes | Yes | 5.16 |
| D | 10 | Yes 1 | 6.0 | Yes, 1.0 | Yes, 10 | Yes | Yes | 23.21 |
| E | 10 | Yes 1 | 6.0 | Yes, 0.5 | Yes, 5 | Yes | Yes | 19.56 |
| F | 10 | Yes 1 | 6.0 | No | No | Yes | Yes | 5.62 |
1—Clear liquid was fermented, and cell mass was discarded; Exp.—Experiments to identify the reason for cessation of fermentation. Experiments A, B were when fermentation stopped after 51 h, and C, D, E, and F were after fermentation stopped at 167 h.
Table 3.
Condensate amount and concentration of ABE in 150 g/L xylose fermentation coupled with product recovery by gas stripping.
Table 3.
Condensate amount and concentration of ABE in 150 g/L xylose fermentation coupled with product recovery by gas stripping.
| Time [h] | Cond. vol. [mL] | Acetone [g/L] | Butanol [g/L] | Ethanol [g/L] | ABE [g/L] |
|---|---|---|---|---|---|
| 43 | 93 | 21.07 | 31.80 | 2.11 | 54.98 |
| 51 | 48 | 22.84 | 30.71 | 1.83 | 55.38 |
| 68 | 109 | 19.98 | 24.02 | 1.75 | 45.75 |
| 75 | 44 | 14.78 | 13.92 | 1.07 | 29.77 |
| 92 | 99 | 6.84 | 5.85 | 0.00 | 12.69 |
| 113 | 32 | 22.33 | 25.09 | 0.55 | 47.97 |
| 129 | 100 | 33.30 | 53.49 | 0.94 | 87.73 |
| 136 | 50 | 19.31 | 23.81 | 0.50 | 43.62 |
| 153 | 91 | 11.98 | 16.18 | 0.85 | 29.01 |
Cond. vol.—condensate volume. In the condensate HAc (acetic acid) & HBu (butyric acid), concentrations were 0.0 g/L.
Table 4.
A summary of ABE production from glucose/xylose with and without simultaneous product recovery in batch reactors employing C. beijerinckii P260 a.
Table 4.
A summary of ABE production from glucose/xylose with and without simultaneous product recovery in batch reactors employing C. beijerinckii P260 a.
| Experiment/ Substrate | Initial xyl [g/L] | Residual xyl [g/L] | ABE Produced [g/L] | Productivity [g/L·h] | Yield [g/g] | Simultaneous Product Recovery |
|---|---|---|---|---|---|---|
| Control glu/ Experiment 1 | 61.0 * | 6.5 * | 23.40 | 0.33 | 0.43 | No |
| Experiment 2/ xylose | 60.0 | 9.8 | 18.44 b | 0.26 b | 0.40 | No |
| Experiment 3/ xylose | 60.0 | 0.0 | 26.50 b | 0.66 b | 0.44 | Yes |
| Experiment 4/ xylose | 100.0–250.0 | 52.5–243.0 | 20.4–0.00 | 0.28–0.00 | 0.43–0.00 | No |
| Experiment 5/ xylose | 150.0 | 0.00 | 66.30 b | 0.44 b | 0.44 | Yes |
- Significant F-tests from ANOVA were obtained indicating differences between the runs for total ABE (p < 0.0001) and ABE productivity (p < 0.0001).
- b Experiment comparisons within a column that are significantly different than the control at the 0.05 level based on t-tests. Total ABE produced in experiment 5 is different than experiment 1 (control). Productivity in experiment 3 and 5 are different than experiment 1.
- a Some of the results presented in this summary table were taken from tables and figures.
- * glu—glucose was used in the control experiment.
- xyl—xylose.
- Experiment 1 was glucose control. Experiment 2 was xylose fermentation without recovery. Experiment 3 xylose fermentation with simultaneous product recovery. Experiment 4 was 100–250 g/L xylose fermentation (no product recovery) and Experiment 5 was 150 g/L xylose fermentation with simultaneous product recovery.
Disclaimer/Publisher’s Note: The statements, opinions and data contained in all publications are solely those of the individual author(s) and contributor(s) and not of MDPI and/or the editor(s). MDPI and/or the editor(s) disclaim responsibility for any injury to people or property resulting from any ideas, methods, instructions or products referred to in the content. |
© 2023 by the authors. Licensee MDPI, Basel, Switzerland. This article is an open access article distributed under the terms and conditions of the Creative Commons Attribution (CC BY) license (https://creativecommons.org/licenses/by/4.0/).
Share and Cite
MDPI and ACS Style
Qureshi, N.; Lin, X.; Tao, S.; Liu, S.; Huang, H.; Nichols, N.N. Can Xylose Be Fermented to Biofuel Butanol in Continuous Long-Term Reactors: If Not, What Options Are There? Energies 2023, 16, 4945. https://doi.org/10.3390/en16134945
AMA Style
Qureshi N, Lin X, Tao S, Liu S, Huang H, Nichols NN. Can Xylose Be Fermented to Biofuel Butanol in Continuous Long-Term Reactors: If Not, What Options Are There? Energies. 2023; 16(13):4945. https://doi.org/10.3390/en16134945
Chicago/Turabian StyleQureshi, Nasib, Xiaoqing Lin, Shunhui Tao, Siqing Liu, Haibo Huang, and Nancy N. Nichols. 2023. "Can Xylose Be Fermented to Biofuel Butanol in Continuous Long-Term Reactors: If Not, What Options Are There?" Energies 16, no. 13: 4945. https://doi.org/10.3390/en16134945
Note that from the first issue of 2016, this journal uses article numbers instead of page numbers. See further details here.