

Adaptive Energy Management of Big Data Analytics in Smart Grids

Department of Electrical Engineering, University Institute of Technology, Rajiv Gandhi Prodyogiki Vishwavidyalaya Bhopal, Bhopal 462033, Madhya Pradesh, India
*
Author to whom correspondence should be addressed.
Energies 2023, 16(16), 6016; https://doi.org/10.3390/en16166016
Submission received: 17 July 2023
/
Revised: 5 August 2023
/
Accepted: 8 August 2023
/
Published: 17 August 2023
(This article belongs to the Special Issue Advanced Machine Learning and Big Data Technologies for Smart Cities and Grids)
Abstract
:The smart grid (SG) ensures the flow of electricity and data between suppliers and consumers. The reliability and security of data also play an important role in the overall management. This can be achieved with the help of adaptive energy management (AEM). This research aims to highlight the big data issues and challenges faced by AEM employed in SG networks. In this paper, we will discuss the most commonly used data processing methods and will give a detailed comparison between the outputs of some of these methods. We consider a dataset of 50,000 instances from consumer smart meters and 10,000 attributes from previous fault data and 12 attributes. The comparison will tell us about the reliability, stability, and accuracy of the system by comparing the output of the various graphical plots of these methods. The accuracy percentage of the linear regression method is 98%; for the logistic regression method, it is 96%; and for K-Nearest Neighbors, it is 92%. The results show that the linear regression method applied gives the highest accuracy compared to logistic regression and K-Nearest Neighbors methods for prediction analysis of big data in SGs. This will ensure their use in future research in this field.
1. Introduction
In the world of smart grid technology, adapting is key. We embrace the challenge with determination, unlocking the potential of adaptive energy management for a sustainable future. Big data analytics help predict future failures and problems associated with the grid from historical data, making the grid a smart grid. Using big data analytics, we envision a grid that thrives on innovation and efficiency, empowering us to navigate complexities and illuminate the way forward. With resilience and ingenuity, we transform challenges into opportunities and obstacles into stepping stones. Let us embrace the power of adaptive energy management to shape a brighter tomorrow for generations to come. A grid is an interconnection system between electricity suppliers and consumers. A smart grid is an advanced power system [1] that ensures electricity demand reliably and economically. The advantage of a smart grid over a normal grid system is the installation of advanced digital information and communication technologies [2]. This new technology gives the smart grid increased efficiency [3], improved reliability, increased resilience, and enhanced customer participation. The overall advantage is in the reduction in overall expenses and the improvement in the reliability of the system. With a power system equipped with a smart grid, future developments can be made in terms of electric vehicles and other developments. For the successful and reliable operation of smart grids, big data analytics is the need of the hour. In such a vast power system, it is impossible to collect data from across the feeders as well as from sources. The answer to this question is adaptive energy management [4]. This management can be achieved by collecting data from sources like smart meters. The installation of a SCADA system will help to collect the data. Energy management systems (EMS) play a critical role in smart grids. They help to optimize the flow of electricity by monitoring and controlling the demand and supply of energy. EMS can be used to (a) balance supply and demand, (b) improve efficiency, (c) integrate renewable energy, and (d) provide customer participation. An energy management system (EMS) in a smart grid includes the following components: (a) data acquisition from a variety of sources, including sensors, meters, and control devices; (b) data analysis tools to process the collected data and to identify trends and patterns; (c) decision-making tools to make recommendations about how to optimize the flow of electricity; and (d) communication with other systems in the smart grid, such as the distribution management system (DMS) and the supervisory control and data acquisition (SCADA) system [5]. All these systems and tools work only when reliable data is collected from sources and implemented in the smart grid. For this, data mining and predictive tools are essential for the effective management and utilization of data. An adaptive energy management system takes data from the previous hour, week, or month and gives predictions based on data about future short-term power supply and consumption forecasting. Load forecasting is more complex in smart grids than in traditional grids. This is because smart grids are more dynamic and have a wider range of variables that can affect load demand. For example, in smart grids, load demand can be affected by weather, electricity prices, and consumer behavior. A vast amount of data are produced, and the need for storage of these data is prevalent. For this purpose, some cloud computing techniques are used, as shown in Figure 1. The energy demand worldwide is anticipated to rise by 25% in 2040. As a result, there is a growing need for a more effective and sustainable energy grid. Utilizing big data analytics can assist in enhancing the efficiency and sustainability of smart grids by optimizing power flows, decreasing peak demands, and integrating renewable energy sources. In Asia, India and China are currently making significant investments in smart grid infrastructure. By utilizing big data analytics, India’s smart grid can become more efficient and sustainable, while simultaneously meeting the increasing energy demands of the country and reducing greenhouse gas emissions by 40% by 2030. The Indian government has announced plans to invest USD 1 trillion into a smart grid infrastructure in the coming decade. The effective use of big data analytics can aid in maximizing the benefits of this investment and meeting the nation’s increasing energy demands. In this paper, we enhance the various techniques used for enhancing adaptive energy management. For this purpose, effective management of data is a must. This provides useful insights into big data analytic (BDA) technologies [6] and methodologies that need further investigation in the context of adaptive energy management (AEM), demand forecasting, and dynamic pricing. We consider several methods for this management and prediction and will conduct a detailed comparison of the methods. We consider a dataset of 50,000 instances from consumer’s smart meter data and 10,000 attributes from previous faults data, and 12 attributes. The detailed comparison will tell us about the reliability and stability of the system by comparing the output of the various graphical plots of these methods. The rest of the paper is organized as follows: Section 1 gives an introduction and insight into data processing techniques for AEM in SGs. Section 2 focuses on a literature review of techniques for big data analytics in smart grids. Section 3 explains big data issues, addressing adaptive energy management. Section 4 explains data mining and machine learning techniques related to big data in smart grids. Section 5 gives a prediction analysis and discusses the implementation of techniques. Section 6 shows the results of the paper, and Section 7 shows the conclusion and future works.
2. Literature Review
Over the past few years, many architectures and theories have been proposed to handle data problems involving big data in smart grids. The following methodology shown in Figure 2 was adopted for this study:
2.1. Energy Management
Energy management developments were studied, and [7] a comprehensive study was conducted on big data compression techniques for smart meters. First, the functions and application challenges of big data in the development of smart grid and electric power are introduced, and then the functions and benefits of big data in smart meters are analyzed. Finally, this study focuses on data compression methods that can be used for smart meter big data and discusses their evaluation. The recent developments [8] provide a comprehensive comparison between the current grid and the future grid, outlining the essential requirements for implementing a smart grid in Iran. The process of establishing the smart grid in Iran and its roadmap in this country are also discussed. Finally, the challenges associated with implementing this concept and their possible solutions are addressed in the power grid of Iran. Using developments in energy management by [9], this paper seeks to uncover the factors that may drive the development of smart grids in India. Surveys, interviews, and workshops were conducted with prominent academics, researchers, and industry experts in the energy field to analyze various components of the smart grid. Using the Integrated Soft System Methodology (SSM) approach, this study uses thematic analysis and fuzzy cognitive mapping to gain a deeper understanding of the complex interactions between participants. These research findings indicate that technology development and consumer acceptance are key factors for effective smart grid implementation. To complement this journey, the authors of [10] presented data migration strategies that have been proposed to manage various data sources, such as IoT devices, video cameras, and drones. The proposed approach also takes the data into account for processing and data storage. It also considers the technical limitations related to data processing in big data environments. This paper also looks at data modeling from a business intelligence perspective and a data science perspective. Blockchain-based technology is introduced [11] to prevent identity theft. The proposed approach can minimize the possibility of identity-based security breaches in smart devices. This paper describes a model for the identification of IoT devices in smart grids based on blockchain technology. The implementation of device identification and authentication based on blockchain technology is given to validate the model in decentralized power networks. A multi-objective particle swarm optimization algorithm (MOPSO-CM) with a competing mechanism has been proposed to solve this problem [12]. This balances registration completeness and accuracy and introduces CM, which is used for particle updates. There is also a pairwise competition in the current generation herd. Additionally, an instance-based hybrid similarity measure is used to distinguish heterogeneous ontology units. The OAEI test dataset, 13 smart grid Ontology Matching Tasks, and five energy smart grid Ontology Matching Tasks for testing were used. The experimental results showed that MOPSO-CM can effectively deal with the matching problem of various heterogeneous ontologies and determine the consistency of its ESG ontologies with high quality. A unified smart grid model [13] was proposed to design the operation and demonstrated, through a simulation study and comparison with multi-objective particle swarm optimization, epsilon bounding and flexural techniques. The Monte Carlo technique is used for modeling a renewable energy source’s uncertain output. Power theft detection using consumption data from smart meters [14] to help and evaluate power companies to solve the above problems and overcome obstacles such as limited energy and unexpected power consumption was proposed but was deemed as bad energy management. Specifically, the Deep CNN model effectively performs its two tasks: distinguishing between non-periodic energies while preserving the general characteristics of power consumption data. This is shown by the research results. The Deep CNN model outperforms previous models and has the highest accuracy in detecting energy theft. A comprehensive analysis [15] of the latest advances in combining artificial intelligence and blockchain to enable the scheduling, management, optimization, privacy, and security of smart grid and power distribution automation systems was conducted. One key aspect of our research is the real-time analysis of the physical layer of smart grids. We also propose a framework for a unified and abstracted state space, which includes a defense hierarchy to prevent malicious attacks in real time.
2.2. Technologies Used in Big Data Implementation
Technologies used were as briefed in [16], that is, as an anonymous big data batch verification method for power injection via vehicle network, and a 5G smart grid slice was proposed based on a novel high-efficiency CL-AS (Certificateless Aggregate Signature) algorithm. The proposed system allows for the authentication of all anonymous offers in batches without endangering the privacy of the participants. Furthermore, we prove that the method is safe if the discrete logarithmic problem (DLP) cannot be solved as a performance evaluation proves that it is more efficient than similar systems. The advent of the Internet of Things (IoT) [17] simplifies monitoring, communication, and data processing between smart things, connecting everything in the world, this will encourage SG officials and researchers to make the most of their IoT technology in SGs. This research paper summarizes various related efforts to highlight the benefits of IoT-enabled SGs and their anticipated gaps. This article proposed a comprehensive multi-layered approach to categorize different applications of this IoT technology within SG. Exploring these IoT opportunities at each architectural layer facilitates the role of each technology and how it relates to others. In addition, open questions and future measures to realize IoT-enabled SG are also discussed in this paper. Ref. [18] proposed a feature selection model for SG environments based on the artificial hummingbird (AHB) algorithm with optimal DL matching stability prediction (AHBFS-ODLSP). The AHBFS-ODLSP model is mainly concerned with the design of AHB-based feature selection methods. In addition, a Multiheaded-Self Attendant Long Short-Term Memory (MHSA-LSTM) prediction system is currently being developed for stability prediction. Consequently, the SOS (Symbiotic Organism Search) optimization technique fits the hyperparameters of the MHSA-LSTM model. The design of the AHBFS and SOS algorithms has a large impact on how well the MHSA-LSTM model predicts stability. Modifications to the AHBFS-ODLSP model are demonstrated by several simulations, and the results are evaluated in different ways. An adaptive deep neural network (ADNN) [19] was developed to provide demand management in smart grids enabled by IoT. The proposed ADNN combines a deep neural network (DNN) and a squirrel search algorithm (SSA). SSA is used in DNNs to improve efficiency by choosing the best weight coefficients. The proposed method ensures efficient use of energy based on priority levels. Further [20] a scheme is proposed that enables the statistical analysis of privacy-aware multi-dimensional aggregated data (SA-MAD) in smart grid systems with edge computing. We changed the Boneh-Goh-Nissim (BGN) public key cryptosystem to dual-his message encryption mode and combine it with two special hyper-increase sequences to handle the aggregation of multi-dimensional cryptographic data. In addition, we designed identity-based aggregate signatures to ensure the integrity of encrypted data in smart grid systems and used Shamir secret clearance technology as a fault-tolerance mechanism in data transmission from smart meters to the appropriate edge server support. It provides flexibility when performing privacy-sensitive statistical analyses (sum, mean, variance, etc.) on aggregated data and can be easily extended to support covariance and linear regression computations. To predict the stability of the grid [21] a five-step approach using five different machine learning methods is proposed. The penalized linear regression model fitting results show 96% accuracy for the model applied using 70% of the data as a training set; using the random forest model, it showed 84°; and using the decision tree model, it showed 78°. Both the Convolutional Neural Network model and the gradient boosted decision tree model yielded 87% for the classification model. A new study [22], motivated by the gaps identified between requirements and management, was proposed. Cybersecurity in the bi-directional data flow of IoT-enabled smart grids was developed and validated by a model with seven security requirements and 45 security controls. In the future, this model will be verified and validated. This research focuses solely on the cybersecurity of information flows by using security controls designed to combat internet-based threats in IoT-enabled smart grids. One of the most important contributions [23] to the network is the integration of IoT into production facilities that use sustainable energy on many levels. IoT (Internet of Things) devices are becoming an important part of the smart power grid to improve the smart grid for two-way information exchange, improve power quality, and increase reliability. IoT Infrastructure (IOTI) provides a flexible, efficient, and secure platform that provides strategic management to monitor and control different operations in different working conditions. This article discusses cybersecurity for IoT-based power system infrastructure. Comprehensive research is presented, including the nature of IOT, the architectures used for smart grids, future challenges, and more. Various possible passive attacks [24] using statistics are discussed. A reinforcement-learning-based intruder is then developed as an active attack generator and initialized by a modeled passive attack. Attack generation algorithms can simulate network environments and create unclassified attacks. After creating a dynamic attacker, a defense-in-depth framework is developed using Snapshot Ensemble Deep Neural Network and adaptive Deep Auto Encoder network. known and unknown threats were detected. Performance evaluations and real-world simulations proved that the proposed framework can successfully detect both passive and active attacks, and that the accuracy and false positive rate of the developed framework are 98.82% and 97.42%, respectively.
3. Big Data Issues Addressing Adaptive Energy Management
Addressing adaptive energy management (AEM) using big data to overcome various challenges and leverage data-driven approaches to optimize energy consumption, reduce costs, and improve overall efficiency are needed. Here, are some of the main issues and considerations: (a) data collection, (b) data volume, (c) data variety, (d) data velocity, (e) data veracity, (f) data privacy and security, (g) scalability, (h) advanced analytics, (i) predictive modeling [25], (j) integration with IoT and smart devices, (k) energy demand response, (l) optimization algorithms, (m) data visualization, (n) regulatory compliance, and (o) stakeholder engagement.
To manage real-time energy data from various sources, including smart meters, sensors, and weather forecasts, reliable data collection and integration is of the utmost importance. Managing large volumes of data by many devices requires a big data infrastructure capable of handling such large data. Energy data comes from various sources, both structured and unstructured. Structured data comes from sources like smart meters [26]. Unstructured data comes from social media. We need to deal with all this data in real time. This is crucial for effective analysis. Real-time analysis is also important, delayed data analysis might lead to losses. Data quality is also important. Incorrect or inadequate data might lead to losses. In this context, data privacy and security [27] are also important aspects to consider. Proper measures need to be taken so that unauthorized data access and cyber-attacks is prevented [28]. The system involved in data analysis should be capable of adopting new changes, new data sources, and technological advancements. The use of advanced analytics is very important, as utilizing big data analytics, machine learning, and artificial intelligence techniques can help identify patterns, correlations, and anomalies in energy consumption data, enabling better decision making. For this purpose, predictive modeling [29] based on historical data and real-time inputs can anticipate energy consumption patterns. This helps in making pre-adjustments. Incorporating IoT and smart devices [30] allows for the control and monitoring of energy consumption, leading to optimization and energy management. All this enables customers to participate in demand response programs so that they receive incentives during peak periods. This will help in grid stability and cost reduction. According to optimization algorithms [31] can be applied to this data and can help in energy-efficient solutions [32]. All this should be regulated in the market. Big data should also comply with the requirements. End-users should also be involved in decision making for effective energy management strategies.
There are some challenges, as shown in Table 1, that need to be addressed:
This table shows the possible challenges faced when we use big data analytics in a smart grid.
4. Data Mining and Machine Learning Techniques of Big Data in Smart Grid
Predictive analysis methods in big data analytics play an important role in the optimization of smart grids. This ensures reliability and enhanced energy efficiency. A smart grid is a very complex system that generates a very large amount of data from various sources, such as smart meters. To use this data for decision making and planning [34], predictive analytics techniques are deployed. Some of the key methods are (a) machine learning algorithms, (b) time series analysis, (c) anomaly detection, (d) optimization models, (e) data mining, (f) ensemble methods, (g) predictive maintenance, (h) demand response modeling, and (i) real-time data analytics
Data mining [35] and predictive maintenance is the key to the stability of the smart grid. Data mining is the process of using information from a stream of data. This data can be from consumer consumption, electric vehicles, or renewable power [36] injection. This data is not in a usable format, data mining transforms this data from an unusable format to a usable format, which involves the utilization of algorithms. The efficient use of data mining is important for the optimized operation of the smart grid as it affects the decision making of producers and consumers for the overall reliability of the grid. The following are some data mining techniques commonly used in smart grid applications: (a) clustering analysis, (b) classification algorithms, (c) time series analysis, (d) anomaly detection, (e) association rule mining, (f) regression analysis, (g) optimization algorithms, (h) pattern recognition, (i) Natural Language Processing (NLP), and (j) deep learning techniques. The choice of data mining technique is specific to the challenges faced by smart grid systems. These techniques can be used for decision making in smart grid applications.
Clustering is used to group similar data points based on properties. In the context of smart grid, clustering [37] helps in identifying patterns, anomalies, and potential energy consumption profiles for different customer segments. This information can be used for targeted energy-saving programs and load forecasting. Classification techniques are used to classify data into predefined classes or labels. Smart grid can use classification algorithms for tasks such as identifying different device types based on their energy consumption patterns, detecting power theft [38], and classifying customers into different usage groups. The focus of temporal data mining is to extract patterns, trends, and seasonality from temporal data. Anomaly detection techniques help identify anomalies or unusual events in data. In the smart grid, anomalies can indicate equipment malfunctions, security breaches, or energy consumption anomalies that require immediate attention and resolution. Association rule mining is used to find interesting relationships between variables in large data sets. In the context of smart grids, this could include identifying relationships between the energy consumption patterns of different devices and their impact on the overall energy demand. Regression analysis [39] helps establish relationships between dependent and independent variables. In smart grids, regression can be used for load and demand forecasting to understand the impact of various factors on energy consumption. Optimization techniques are applied to optimize various aspects of the smart grid, including B. Power Balancing, Load Balancing, and Resource Allocation. These algorithms aim to improve efficiency and reduce costs by finding the best possible solution under given constraints. Pattern recognition techniques are used to identify repeating patterns or events in data streams. In smart grids, these patterns are useful for demand response management and fault detection. With NLP, you can extract information and gain insight from unstructured data sources, such as maintenance logs, customer feedback, and social media, to better understand customer preferences and sentiments. Deep learning models [40], such as artificial neural networks, can be used to perform complex tasks, such as load forecasting [41], image recognition for asset monitoring, and equipment failure prediction.
For successful load classification and clustering in smart grids, the most popular method is regression analysis and artificial neural networks (ANNs) [42]. ANNs consists of a large number of interconnected processors that can be used to estimate approximate functions, which are dependent on a large number of inputs. This is achieved in ANNs by weighting and transforming suitable inputs by function with the aid of neurons. ANNs help in the classification of load patterns of the consumers, which helps in the appropriate usage of adaptive energy management. Convolutional Neural Networks (CNNs), Recurrent Neural Networks (RNNs), and Generative Adversarial Networks (GANs) are also neural network methods that are widely used nowadays, as shown in Figure 3.
A dataset of 50,000 instances from consumer smart meter data, 10,000 attributes from previous faults data, and 12 attributes were used to predict the stability of the system through three different machine learning methods. For this dataset, the ANN output is as shown in Table 2.
The model training and output are shown in Figure 4.
5. Prediction Analysis and Implementation of Techniques
A dataset of 50,000 instances from consumer smart meter data, 10,000 attributes from previous faults data, and 12 attributes were used to predict the stability of the system through three different machine learning methods.
The model dataset consists of both continuous and discrete values. The “stab” column gives the stability index; accordingly, if stability is positive, it is stable, and if stability is negative, it is unstable along with all those under the “stabf” column.
5.1. Inputs
“Tau1 to tau4” is the time of every network participant value between 0.5 to 10. Here, tau1 gives the supplier node, and tau2 to tau4 gives the consumer nodes.
“P1 to P4” is the power produced by the consumer, positive, and consumed by the customer, negative; the range is negative for p2 to p4 and positive for p1. Therefore, p1 = −(p2 + p3 + p4).
“g1 to g4” gives the price elasticity for demand. The range is between 0.5 and 1. p1 gives values regarding the supplier, and p2 gives values regarding the customer. g here stands for gamma.
5.2. Outputs
“stab” is the real part of the differential equation and is used in the regression model for continuous output.
“stabf” is the discrete labelled output that gives only stable and unstable output.
5.3. Machine Learning Models
Machine learning models, as given by Ref. [43], are algorithms trained on data to make predictions or decisions without being explicitly programmed. These models can analyze large amounts of data, identify patterns, and learn from them to make accurate predictions or take appropriate actions. Some commonly used machine learning models are (i) linear regression, (ii) logistic regression, (iii) Decision Trees, (iv) Random Forests, (v) Support Vector Machines, (SVM) (vi) Naive Bayes, (vii) Neural Networks, (viii) Gradient Boosting Models, (ix) K-Nearest Neighbors (KNN), and (x) Clustering Models. We are discussing three models here: linear regression, logistic regression, and K-Nearest Neighbors.
Stability analysis in the context of machine learning refers to the robustness and reliability of a model’s performance when subjected to training data or hyperparameter changes. Let us compare the stability of linear regression, logistic regression, and K-Nearest Neighbors (KNN), as shown in Table 3:
Table 3 shows a comparison between all three models for prediction analysis.
Therefore, Linear and Logistic Regressions tend to be moderately stable because they are affected by outer parameters, but they provide relatively stable predictions when the distribution of the data is consistent. On the other hand, K-Nearest Neighbors are highly dependent on specific instances of the training data and are less stable, as their predictions can become more unstable when the data changes.
5.3.1. Linear Regression
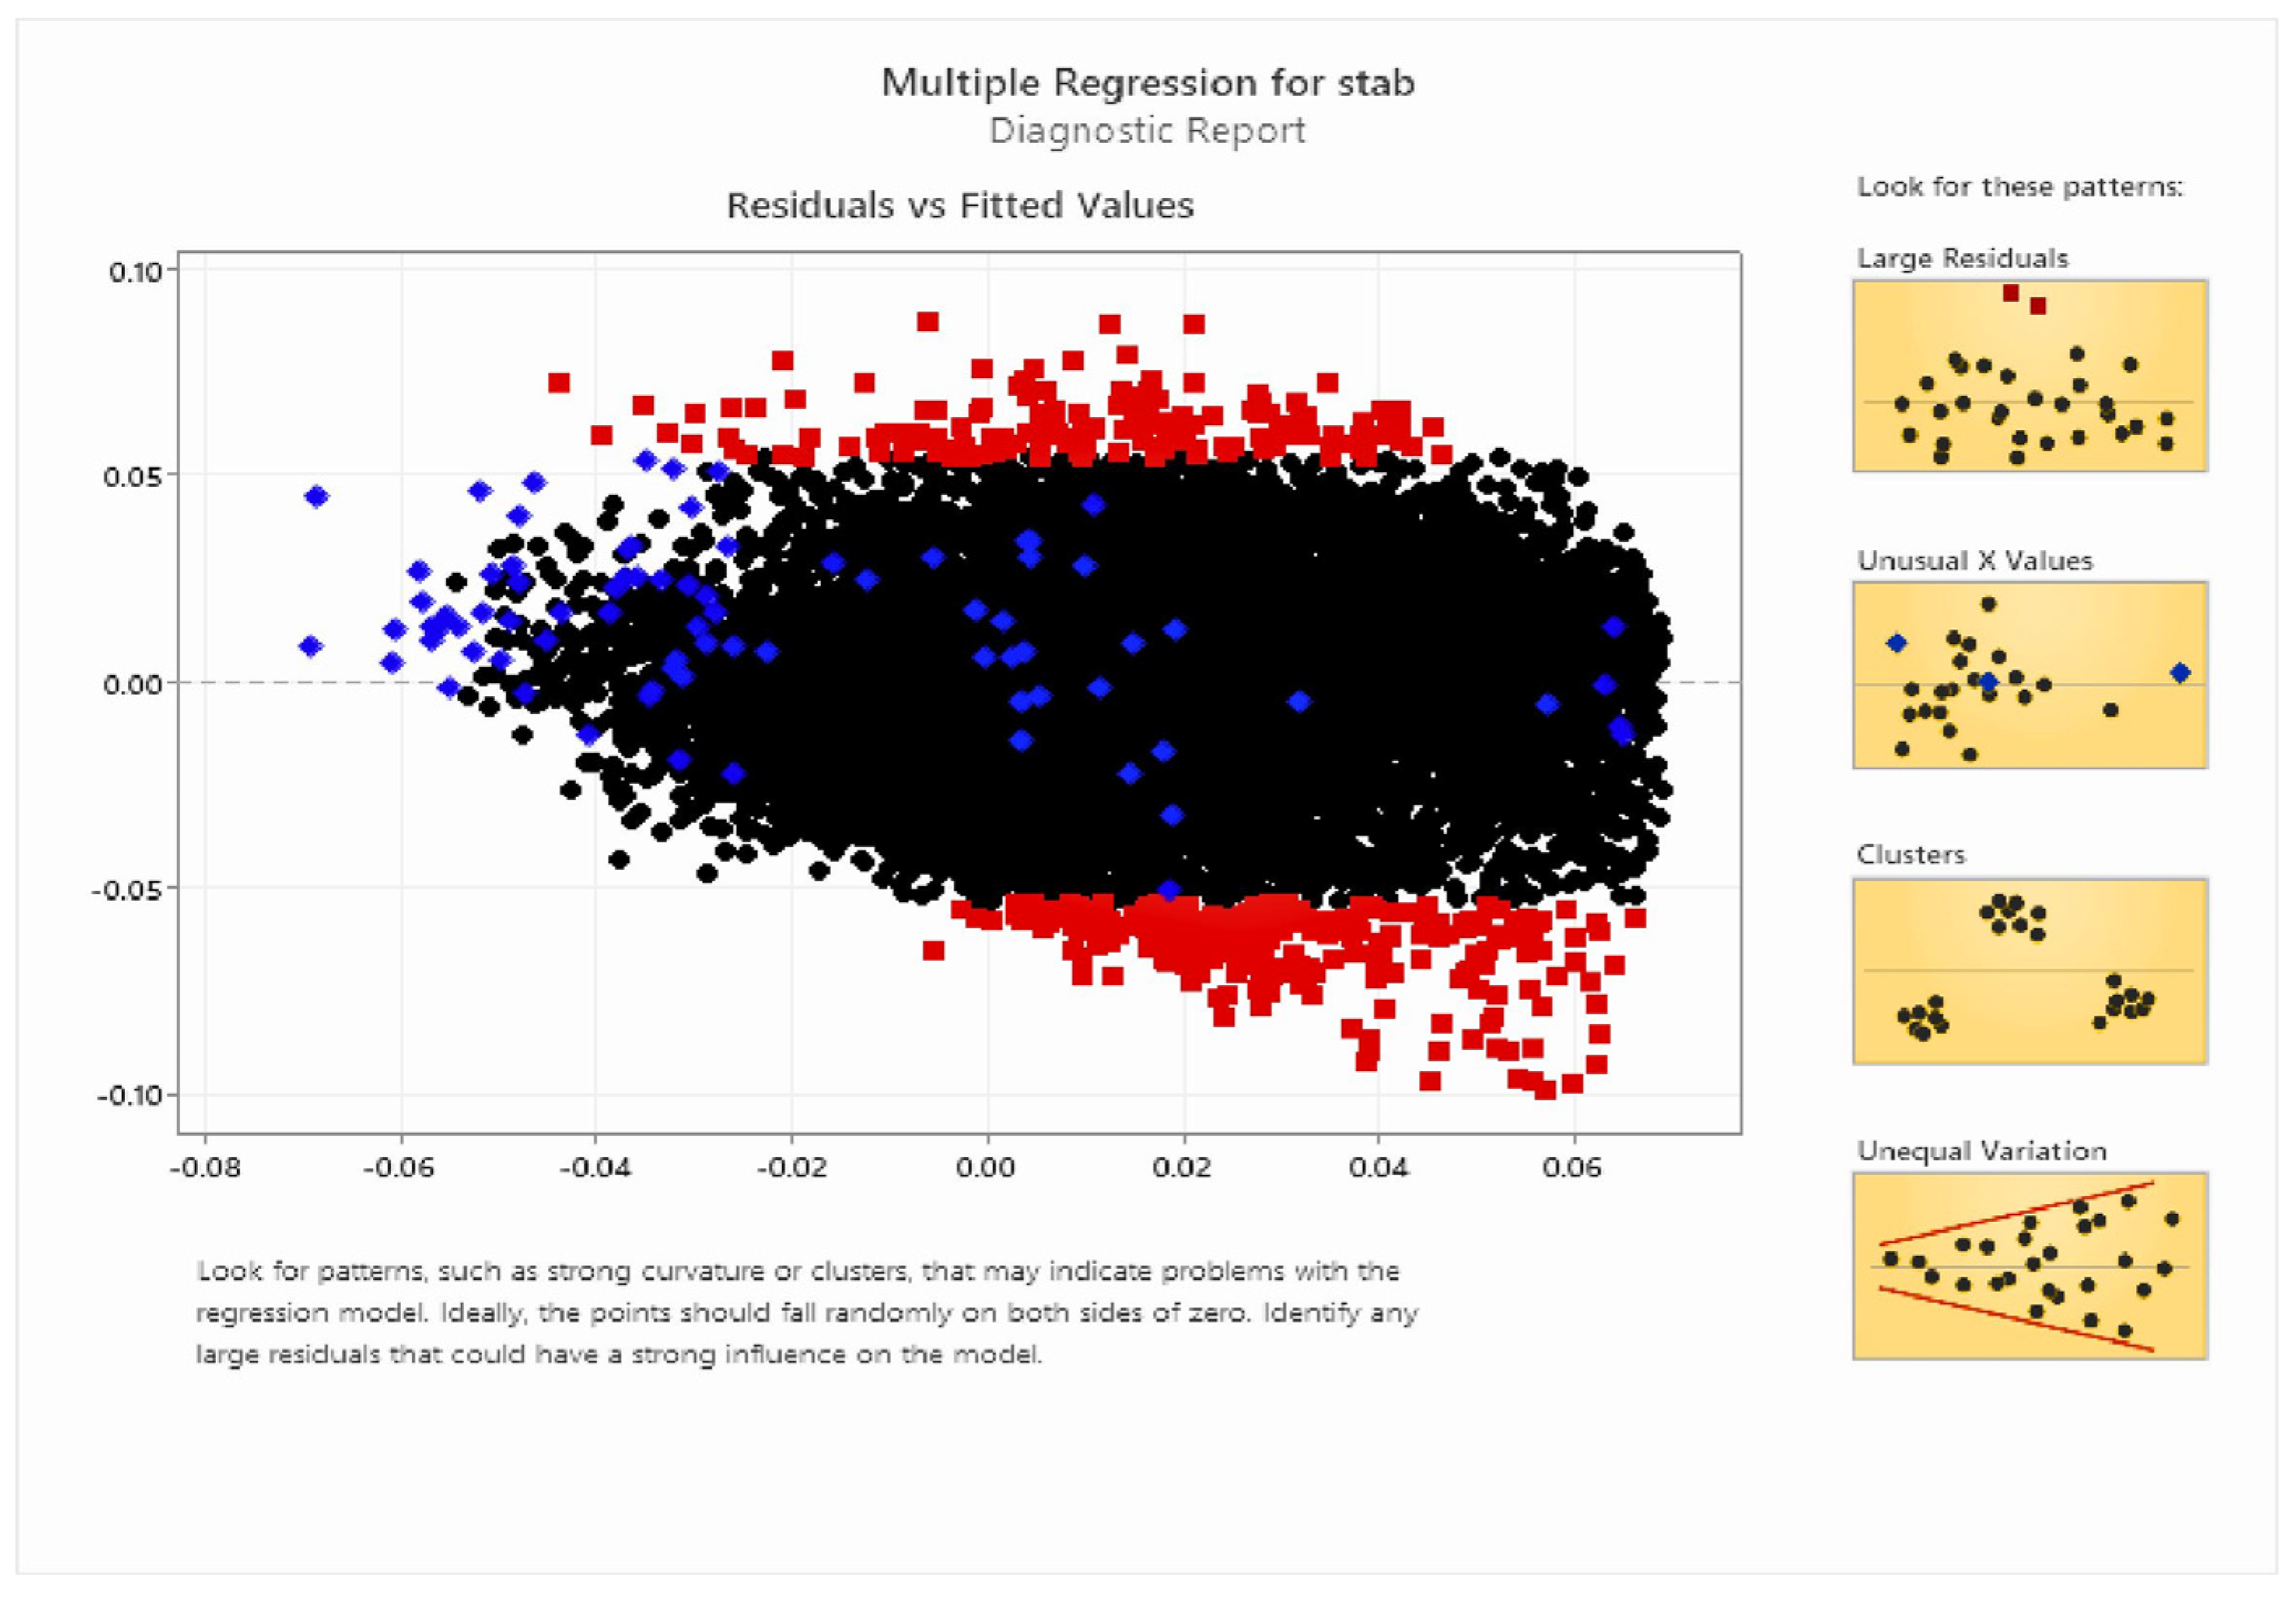
This technique is used to develop a relationship between a dependent variable and one or more independent variables. The purpose of linear regression is to find a linear equation that best fits the observed data points and can be used to make predictions or understand relationships between variables, as shown in Figure 5.
The Assistant highlights large residuals in red for easy spotting. Three of those residuals, shown in light blue because they were selected, appear far below the predicted asking price from the regression analysis. Black are not selected ones.
Outcomes of the output plots for linear regression—A residual plot provides a visual way to diagnose potential problems in a multiple linear regression model and identify areas where the model could be improved. For a good model, the residual plot should show randomness, with the residuals evenly distributed around the horizontal line (y = 0), indicating that the assumptions of the model are reasonably met as shown in Figure 6. In our case, the plot is showing this randomness, and the residuals are evenly distributed around the y-axis. This shows that the stability criteria are met and that our system is stable, as shown in Figure 7.
5.3.2. Logistic Regression
Logistic regression is a statistical model used for binary classification problems to predict a categorical outcome variable that can take only two values, usually 0 and 1. It is a type of regression analysis that models the relationship between dependent variables and one or more independent variables, estimating the probability of the dependent variable belonging to a certain category, as shown in Figure 8.
Method
| Link Function | Logit |
| Rows used | 60,000 |
Response Information
| Variable | Value | Count | |
| stabf | stable | 21,720 | (Event) |
| unstable | 38,280 | ||
| Total | 60,000 |
Regression Equation
P(stable) = exp(−0.072 − 7546 stab)/(1 + exp(−0.072 − 7546 stab))
Coefficients
| Term | Coef | SE Coef | VIF |
| Constant | −0.072 | 0.109 | |
| stab | −7546 | 302 | 1.00 |
Odds Ratios for Continuous Predictors
| Odds Ratio | 95% CI | |
| stab | 0.0000 | (0.0000, 0.0000) |
Model Summary
| Deviance R-Sq | Deviance R-Sq (adj) | AIC | AICc | BIC |
| 99.77% | 99.77% | 186.17 | 186.17 | 204.17 |
Analysis of Variance
| Source | DF | Adj Dev | Adj Mean | Chi-Square | p-Value |
| Regression | 1 | 78,365.1 | 78,365.1 | 78,365.06 | 0.000 |
| stab | 1 | 78,365.1 | 78,365.1 | 78,365.06 | 0.000 |
| Error | 59,998 | 182.2 | 0.0 | ||
| Total | 59,999 | 78,547.2 |
Outcomes of the output plots for logistic regression—The probability value in this case is between 0 and 1 on the y-axis; the y-axis has a certain probability threshold (often 0.5), which is the decision limit. If the predicted probability is above this threshold, the model classifies the event as positive; otherwise, it falls into the negative category. In our case the threshold limit has not been crossed; therefore, it is positive and shows that the system is stable.
5.3.3. K-Nearest Neighbors (KNN)
The K-Nearest Neighbors (K-NN) algorithm is a supervised machine learning algorithm [44] used for both classification and regression tasks. It is a non-parametric method that makes no assumptions about the distribution of the underlying data, as shown in Figure 9. The red line shows the training error rate and the black line shows validation error rate.
Training
| K | Count | RSquare | Misclassification Rate | Misclassifications |
| 1 | 60,000 | 0.72146 | 0.00000 | 0 * |
| 2 | 60,000 | 0.83904 | 0.00000 | 0 |
| 3 | 60,000 | 0.88678 | 0.00000 | 0 |
| 4 | 60,000 | 0.91268 | 0.00000 | 0 |
| 5 | 60,000 | 0.92893 | 0.00000 | 0 |
| 6 | 60,000 | 0.94003 | 0.00000 | 0 |
| 7 | 60,000 | 0.94811 | 0.00000 | 0 |
| 8 | 60,000 | 0.95425 | 0.00000 | 0 |
| 9 | 60,000 | 0.95908 | 0.00000 | 0 |
| 10 | 60,000 | 0.96298 | 0.00012 | 7 |
| Confusion Matrix for Best K = 1. * based on conditions. | ||||
Training
| Actual | Predicted Count | |
| stabf | stable | unstable |
| stable | 21720 | 0 |
| unstable | 0 | 38280 |
| Actual | Predicted Rate | |
| stabf | stable | unstable |
| stable | 1.000 | 0.000 |
| unstable | 0.000 | 1.000 |
Mosaic Plot
Mosaic Plot for K = 1
Training
Outcomes of the output plots for K-Nearest Neighbor—Depending on the value of k (the number of nearest neighbors in the view), the decision boundaries can appear smoother or jagged, as shown in Figure 10. Smaller k-values tend to have more complex decision boundaries, while larger k-values result in smoother decision boundaries. By adjusting the value of k, you can control the trade-off between model bias and variance. Smaller k-values result in low bias but high variance (more sensitive to noise), while larger k-values result in higher bias but low variance (softer decision boundaries). In our case, these values and cases are met, which shows that the system is stable.
If simplicity and interpretability are important, linear regression is a more suitable option. On the other hand, if accuracy is the main concern, logistic regression is the better choice. K-Nearest Neighbors is a great option when training data that does not adequately represent the problem or when the relationship between variables is non-linear.
The equation for the linear regression solution is
(where m = the slope of the line, b = the y-intercept, y = the predicted value, and x = the independent variable).
y = mx + b
The equation for the logistic regression solution is
(where p = the probability of the event occurring, e = the exponential constant, m = the slope of the line, and b = the y-intercept).
p = 1/(1 + e^(−(mx + b)))
The equation for K-Nearest Neighbors is
(where y = the predicted value, f () = the function that calculates the distance between the new data point and the K-Nearest Neighbors, k = the number of nearest neighbors, and x = the new data point).
y = f(x, k)
Linear regression is a simpler equation compared to logistic regression or K-Nearest Neighbors, making it easier to interpret the results. It is also a parametric model that makes assumptions about the relationship between independent and dependent variables, which can improve the accuracy of predictions. When it comes to modelling, there are different approaches to consider. Logistic regression is a parametric model that assumes a certain relationship between independent and dependent variables. It can be useful for classification problems. However, it is more complex and can be challenging to interpret. On the other hand, K-Nearest Neighbors is a non-parametric model that makes no assumptions about the relationship between variables. This allows it to fit a wider range of data. However, it may be less accurate and require more computational power to train. In summary, linear regression is a good choice for linear relationships, while logistic regression is ideal for classification problems. K-Nearest Neighbors is suitable for non-linear relationships or noisy data.
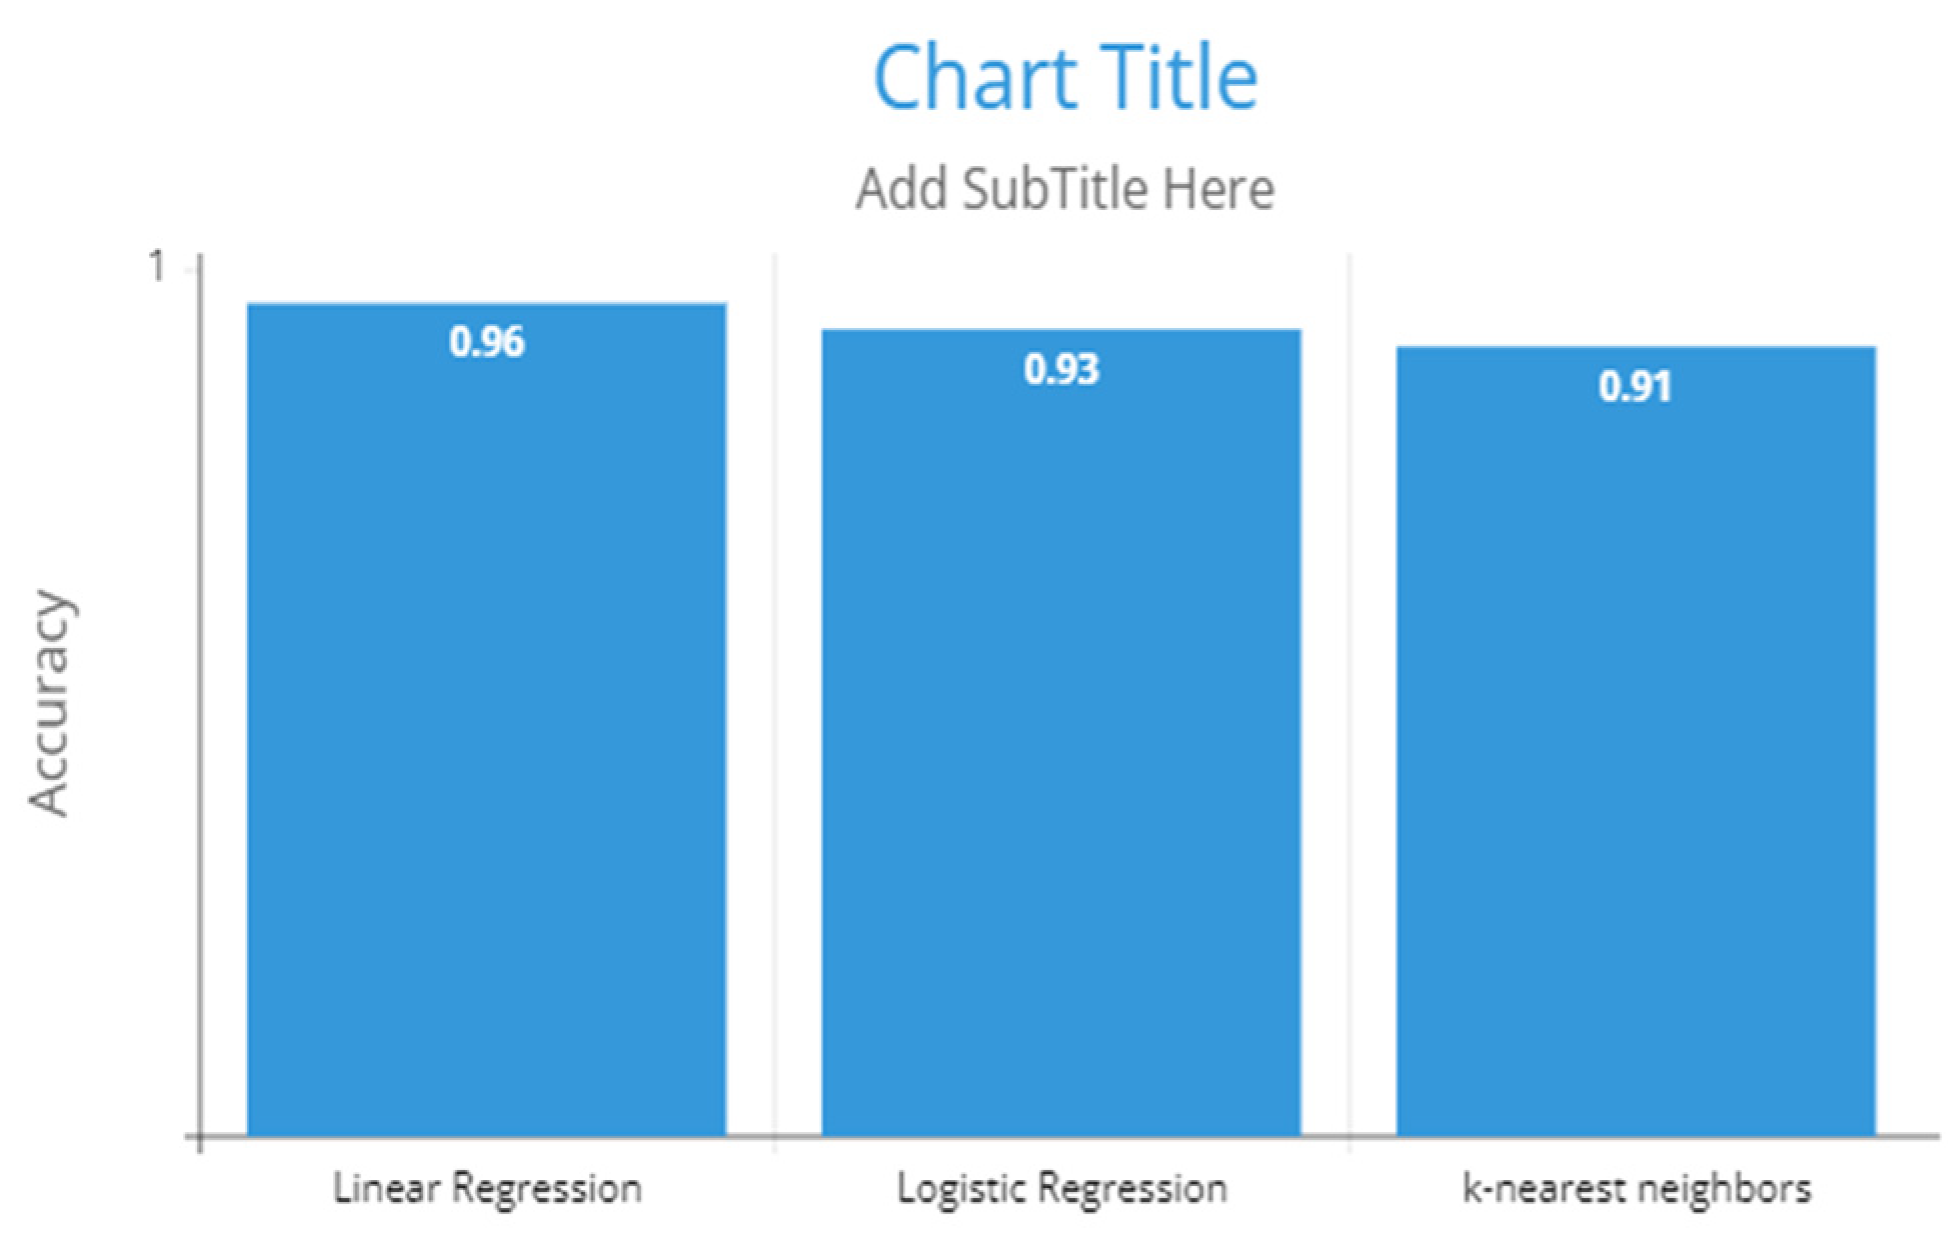
The accuracy of the results was found to be 0.96 for the linear regression method, 0.93 for the logistic regression method, and 0.91 for the K-Nearest Neighbors method. In percentage, the linear regression method is 98%, the logistic regression method is 96%, and the K-Nearest Neighbors is 92%.
| True Label | Predicted Label | Linear Regression | Logistic Regression | K-Nearest Neighbors |
| Positive | Positive | True Positive (TP) | True Positive (TP) | True Positive (TP) |
| Positive | Negative | True Positive (TP) | False Negative (FN) | False Negative (FN) |
| Negative | Positive | True Negative (TN) | True Negative (TN) | False Positive (FP) |
| Negative | Negative | True Negative (TN) | True Negative (TN) | True Negative (TN) |
The confusion matrix shows the number of correct and incorrect predictions made by each model. The diagonal cells show the number of correct predictions, while the off-diagonal cells show the number of incorrect predictions.
In our case, the linear regression model made the correct predictions, followed by the logistic regression model, and then the K-Nearest Neighbors model. However, the difference in performance between the three models is not very significant.
6. Results and Discussion
In this paper, we have compared prediction models namely linear regression, logistic regression, and K-Nearest Neighbors (KNN) for stability, reliability, and accuracy of a smart grid. We consider the dataset of 50,000 instances from consumer smart meter data, 10,000 attributes from previous faults data, and 12 attributes, for which we have considered input and output features of the machine learning model. We have divided this paper into three sections: the first section gives a literature review of the given problem statement; the second section gives the types and analysis of the aforesaid dataset and features, which is an input to the big data analytics for the smart grid via data mining techniques and machine modeling. We have taken out the artificial neural network output for the same. This is important as we obtain information from the stream of data. Finally, a predictive analysis is performed considering the three methods that show the system’s stability, reliability, and accuracy. The accuracy of the results was found to be 0.96 for the linear regression method, 0.93 for the logistic regression method, and 0.91 for the K-Nearest Neighbors method. In percentage, the linear regression method is 98%, the logistic regression method is 96%, and the K-Nearest Neighbors is 92%. The plots from the dataset predict if the system is stable or unstable and ultimately show the accuracy of the system, as shown in Figure 11; this also gives an analysis for future works on dataset collection as well as usage. The limitation of this work is that we have taken only (50,000 + 10,000) instances which is a very low quantity when considering that actual smart grid data instances will be utilized. Therefore, this study can only give direction to future research to be conducted in this field.
7. Conclusions and Future Works
This paper presents three main contributions: Firstly, it offers a comprehensive review of recent works that have explored the use of BDA in energy applications. Secondly, it presents a framework that outlines how BDA could be implemented in smart grids and renewable energy power utilities. Lastly, the paper proposes an approach that utilizes different machine learning methods to predict smart grid stability for BDA. This predictive model can be used to optimize the smart grid settings for various input and output power sources, ultimately enhancing smart grid stability. Future research should focus on addressing these critical recommendations and perspectives:
- (i)
- Customers should be directly involved in grid activities, like entering their own data, and for doing this, special concessions in billing should be given. This will help in maintaining the big data of the grid, and cost effectiveness can be achieved.
- (ii)
- New regulations should be implemented. With the help of IoT and other BDA tools, the customers should be given incentives to use less energy during peak hours.
- (iii)
- The collection of data in real time needs to be accomplished in order to utilize the full capability of BDA.
- (iv)
- Renewable energy source integration needs to be achieved with real-time data for efficient usage.
Author Contributions
Conceptualization, R.G. and K.T.C.; methodology, R.G.; software, R.G.; validation, R.G. and K.T.C.; formal analysis, R.G.; investigation, R.G.; resources, R.G.; data curation, R.G.; writing—original draft preparation, R.G.; writing—review and editing, R.G.; visualization, R.G.; supervision, R.G.; project administration, R.G. All authors have read and agreed to the published version of the manuscript.
Funding
This research received no external funding.
Data Availability Statement
The data that support the findings of this study are available upon request from the corresponding author. The data are not publicly available due to data containing information that could compromise the privacy of the research participants.
Conflicts of Interest
The authors declare no conflict of interest.
References
- Zhang, W.; Liu, S.; Xia, Z. A distributed privacy-preserving data aggregation scheme for smart grid with fine-grained access control. J. Inf. Secur. Appl. 2022, 66, 103118. [Google Scholar] [CrossRef]
- Chang, Y.-C.; Huang, T.-C. An interactive smart grid communication approach for big data traffic. Comput. Electr. Eng. 2018, 67, 170–181. [Google Scholar] [CrossRef]
- Diamantoulakis, P.D.; Kapinas, V.M.; Karagiannidis, G.K. Big Data Analytics for Dynamic Energy Management in Smart Grids. Big Data Res. 2015, 2, 94–101. [Google Scholar] [CrossRef]
- Li, J.; Herdem, M.S.; Nathwani, J.; Wen, J.Z. Methods and applications for Artificial Intelligence, Big Data, Internet of Things, and Blockchain in smart energy management. Energy AI 2023, 11, 100208. [Google Scholar] [CrossRef]
- Hasan, M.K.; Habib, A.A.; Shukur, Z.; Ibrahim, F.; Islam, S.; Razzaque, A. Review on cyber-physical and cyber-security system in smart grid: Standards, protocols, constraints, and recommendations. J. Netw. Comput. Appl. 2023, 209, 103540. [Google Scholar] [CrossRef]
- Mohajeri, M.; Ghassemi, A.; Gulliver, T.A. Fast Big Data Analytics for Smart Meter Data. IEEE Open J. Commun. Soc. 2020, 1, 1864–1871. [Google Scholar] [CrossRef]
- Wen, L.; Zhou, K.; Yang, S.; Li, L. Compression of smart meter big data: A survey. Renew. Sustain. Energy Rev. 2018, 91, 59–69. [Google Scholar] [CrossRef]
- Biabani, M.; Golkar, M.A.; Kasiry, A.H.Z.; Akbari, M. Smart Grid in Iran: Driving Factors, Evolution, Challenges and Possible Solutions. In Proceedings of the 2011 10th International Conference on Environment and Electrical Engineering, EEEIC.EU 2011—Conference Proceedings, Rome, Italy, 8–11 May 2011. [Google Scholar] [CrossRef]
- Archana; Shankar, R.; Singh, S. Development of smart grid for the power sector in India. Clean. Energy Syst. 2022, 2, 100011. [Google Scholar] [CrossRef]
- Ouafiq, E.M.; Raif, M.; Chehri, A.; Saadane, R. Data Architecture and Big Data Analytics in Smart Cities. Procedia Comput. Sci. 2022, 207, 4123–4131. [Google Scholar] [CrossRef]
- Dehalwar, V.; Kolhe, M.L.; Deoli, S.; Jhariya, M.K. Blockchain-based trust management and authentication of devices in smart grid. Clean Eng. Technol. 2022, 8, 100481. [Google Scholar] [CrossRef]
- Xue, X.; Tsai, P.-W. Integrating Energy Smart Grid’s ontologies through multi-objective particle swarm optimization algorithm with competitive mechanism. Sustain. Energy Technol. Assess. 2022, 53, 102442. [Google Scholar] [CrossRef]
- Bolurian, A.; Akbari, H.; Mousavi, S.; Aslinezhad, M. Bi-level energy management model for the smart grid considering customer behavior in the wireless sensor network platform. Sustain. Cities Soc. 2023, 88, 104281. [Google Scholar] [CrossRef]
- Haq, E.U.; Pei, C.; Zhang, R.; Jianjun, H.; Ahmad, F. Electricity-theft detection for smart grid security using smart meter data: A deep-CNN based approach. Energy Rep. 2023, 9, 634–643. [Google Scholar] [CrossRef]
- Khan, A.A.; Laghari, A.A.; Rashid, M.; Li, H.; Javed, A.R.; Gadekallu, T.R. Artificial intelligence and blockchain technology for secure smart grid and power distribution Automation: A State-of-the-Art Review. Sustain. Energy Technol. Assess. 2023, 57, 103282. [Google Scholar] [CrossRef]
- Kamil, I.A.; Ogundoyin, S.O. A big data anonymous batch verification scheme with conditional privacy preservation for power injection over vehicular network and 5G smart grid slice. Sustain. Energy Grids Netw. 2019, 20, 100260. [Google Scholar] [CrossRef]
- Alavikia, Z.; Shabro, M. A comprehensive layered approach for implementing internet of things-enabled smart grid: A survey. Digit. Commun. Netw. 2022, 8, 388–410. [Google Scholar] [CrossRef]
- Raghavendra, S.; Neelakandan, S.; Prakash, M.; Geetha, B.; Asha, S.M.R.; Roberts, M.K. Artificial humming bird with data science enabled stability prediction model for smart grids. Sustain. Comput. Inform. Syst. 2022, 36, 100821. [Google Scholar] [CrossRef]
- Sivarajan, S.; Jebaseelan, S.S. Efficient adaptive deep neural network model for securing demand side management in IoT enabled smart grid. Renew. Energy Focus 2022, 42, 277–284. [Google Scholar] [CrossRef]
- Zhang, X.; Huang, C.; Gu, D.; Zhang, J.; Xue, J.; Wang, H. Privacy-preserving statistical analysis over multi-dimensional aggregated data in edge computing-based smart grid systems. J. Syst. Archit. 2022, 127, 102508. [Google Scholar] [CrossRef]
- Mostafa, N.; Ramadan, H.S.M.; Elfarouk, O. Renewable energy management in smart grids by using big data analytics and machine learning. Mach. Learn. Appl. 2022, 9, 100363. [Google Scholar] [CrossRef]
- Akkad, A.; Wills, G.; Rezazadeh, A. An information security model for an IoT-enabled Smart Grid in the Saudi energy sector. Comput. Electr. Eng. 2023, 105, 108491. [Google Scholar] [CrossRef]
- Alomar, M.A. An IOT based smart grid system for advanced cooperative transmission and communication. Phys. Commun. 2023, 58, 102069. [Google Scholar] [CrossRef]
- Rouzbahani, H.M.; Karimipour, H.; Lei, L. Multi-layer defense algorithm against deep reinforcement learning-based intruders in smart grids. Int. J. Electr. Power Energy Syst. 2023, 146, 108798. [Google Scholar] [CrossRef]
- Oad, A.; Ahmad, H.G.; Talpur, M.S.H.; Zhao, C.; Pervez, A. Green smart grid predictive analysis to integrate sustainable energy of emerging V2G in smart city technologies. Optik 2023, 272, 170146. [Google Scholar] [CrossRef]
- Panthi, M.; Das, T.K. Intelligent Intrusion Detection Scheme for Smart Power-Grid Using Optimized Ensemble Learning on Selected Features. Int. J. Crit. Infrastruct. Prot. 2022, 39, 100567. [Google Scholar] [CrossRef]
- Ghiasi, M.; Niknam, T.; Wang, Z.; Mehrandezh, M.; Dehghani, M.; Ghadimi, N. A comprehensive review of cyber-attacks and defense mechanisms for improving security in smart grid energy systems: Past, present and future. Electr. Power Syst. Res. 2023, 215, 108975. [Google Scholar] [CrossRef]
- Bitirgen, K.; Filik, B. A hybrid deep learning model for discrimination of physical disturbance and cyber-attack detection in smart grid. Int. J. Crit. Infrastruct. Prot. 2023, 40, 100582. [Google Scholar] [CrossRef]
- Kalfarisi, R.; Chew, A.; Cai, J.; Xue, M.; Pok, J.; Wu, Z.Y. Predictive modeling framework accelerated by GPU computing for smart water grid data-driven analysis in near real-time. Adv. Eng. Softw. 2022, 173, 103287. [Google Scholar] [CrossRef]
- Qays, O.; Ahmad, I.; Abu-Siada, A.; Hossain, L.; Yasmin, F. Key communication technologies, applications, protocols and future guides for IoT-assisted smart grid systems: A review. Energy Rep. 2023, 9, 2440–2452. [Google Scholar] [CrossRef]
- Rouzbahani, H.M.; Karimipour, H.; Lei, L. Optimizing scheduling policy in smart grids using probabilistic Delayed Double Deep Q-Learning (P3DQL) algorithm. Sustain. Energy Technol. Assess. 2022, 53, 102712. [Google Scholar] [CrossRef]
- Kabalci, E.; Kabalci, Y. Big Data, Privacy and Security in Smart Grids. In From Smart Grid to Internet of Energy; Elsevier: Amsterdam, The Netherlands, 2019; pp. 309–333. [Google Scholar] [CrossRef]
- Guan, Z.; Si, G. Achieving privacy-preserving big data aggregation with fault tolerance in smart grid. Digit. Commun. Netw. 2017, 3, 242–249. [Google Scholar] [CrossRef]
- Mortaheb, R.; Jankowski, P. Smart city re-imagined: City planning and GeoAI in the age of big data. J. Urban Manag. 2023, 12, 4–15. [Google Scholar] [CrossRef]
- Bai, Y.; Chou, L.; Zhang, W. Industrial innovation characteristics and spatial differentiation of smart grid technology in China based on patent mining. J. Energy Storage 2021, 43, 103289. [Google Scholar] [CrossRef]
- Meegahapola, L.G.; Bu, S.; Wadduwage, D.P.; Chung, C.Y.; Yu, X. Review on Oscillatory Stability in Power Grids with Renewable Energy Sources: Monitoring, Analysis, and Control Using Synchrophasor Technology. IEEE Trans. Ind. Electron. 2021, 68, 519–531. [Google Scholar] [CrossRef]
- Si, C.; Xu, S.; Wan, C.; Chen, D.; Cui, W.; Zhao, J. Electric Load Clustering in Smart Grid: Methodologies, Applications, and Future Trends. J. Mod. Power Syst. Clean Energy 2021, 9, 237–252. [Google Scholar] [CrossRef]
- Zidi, S.; Mihoub, A.; Qaisar, S.M.; Krichen, M.; Abu Al-Haija, Q. Theft detection dataset for benchmarking and machine learning based classification in a smart grid environment. J. King Saud Univ.—Comput. Inf. Sci. 2023, 35, 13–25. [Google Scholar] [CrossRef]
- Baskar, S.; Dhote, S.; Dhote, T.; Akila, D.; Arunprathap, S. Surge detection for smart grid power distribution using a regression-based signal processing model. Comput. Electr. Eng. 2022, 104, 108424. [Google Scholar] [CrossRef]
- Kotsiopoulos, T.; Sarigiannidis, P.; Ioannidis, D.; Tzovaras, D. Machine Learning and Deep Learning in smart manufacturing: The Smart Grid paradigm. Comput. Sci. Rev. 2021, 40, 100341. [Google Scholar] [CrossRef]
- Alemazkoor, N.; Tootkaboni, M.; Nateghi, R.; Louhghalam, A. Smart-Meter Big Data for Load Forecasting: An Alternative Approach to Clustering. IEEE Access 2022, 10, 8377–8387. [Google Scholar] [CrossRef]
- Al-Badi, A.; Khan, A.I. A Sustainable Development Neural Network Model for Big Data in Smart Cities. Procedia Comput. Sci. 2022, 202, 408–413. [Google Scholar] [CrossRef]
- Ahmad, T.; Madonski, R.; Zhang, D.; Huang, C.; Mujeeb, A. Data-driven probabilistic machine learning in sustainable smart energy/smart energy systems: Key developments, challenges, and future research opportunities in the context of smart grid paradigm. Renew. Sustain. Energy Rev. 2022, 160, 112128. [Google Scholar] [CrossRef]
- Rashid, M.; Ahmad, A.J.; Prashar, D. Integration of IoT with Big Data Analytics for the Development of Smart Society. In Artificial Intelligence and Machine Learning in Smart City Planning; Elsevier: Amsterdam, The Netherlands, 2023; pp. 13–27. [Google Scholar] [CrossRef]
Figure 1.
Big Data Analytics Implementation.

Figure 2.
Research methodology for reviewing papers.
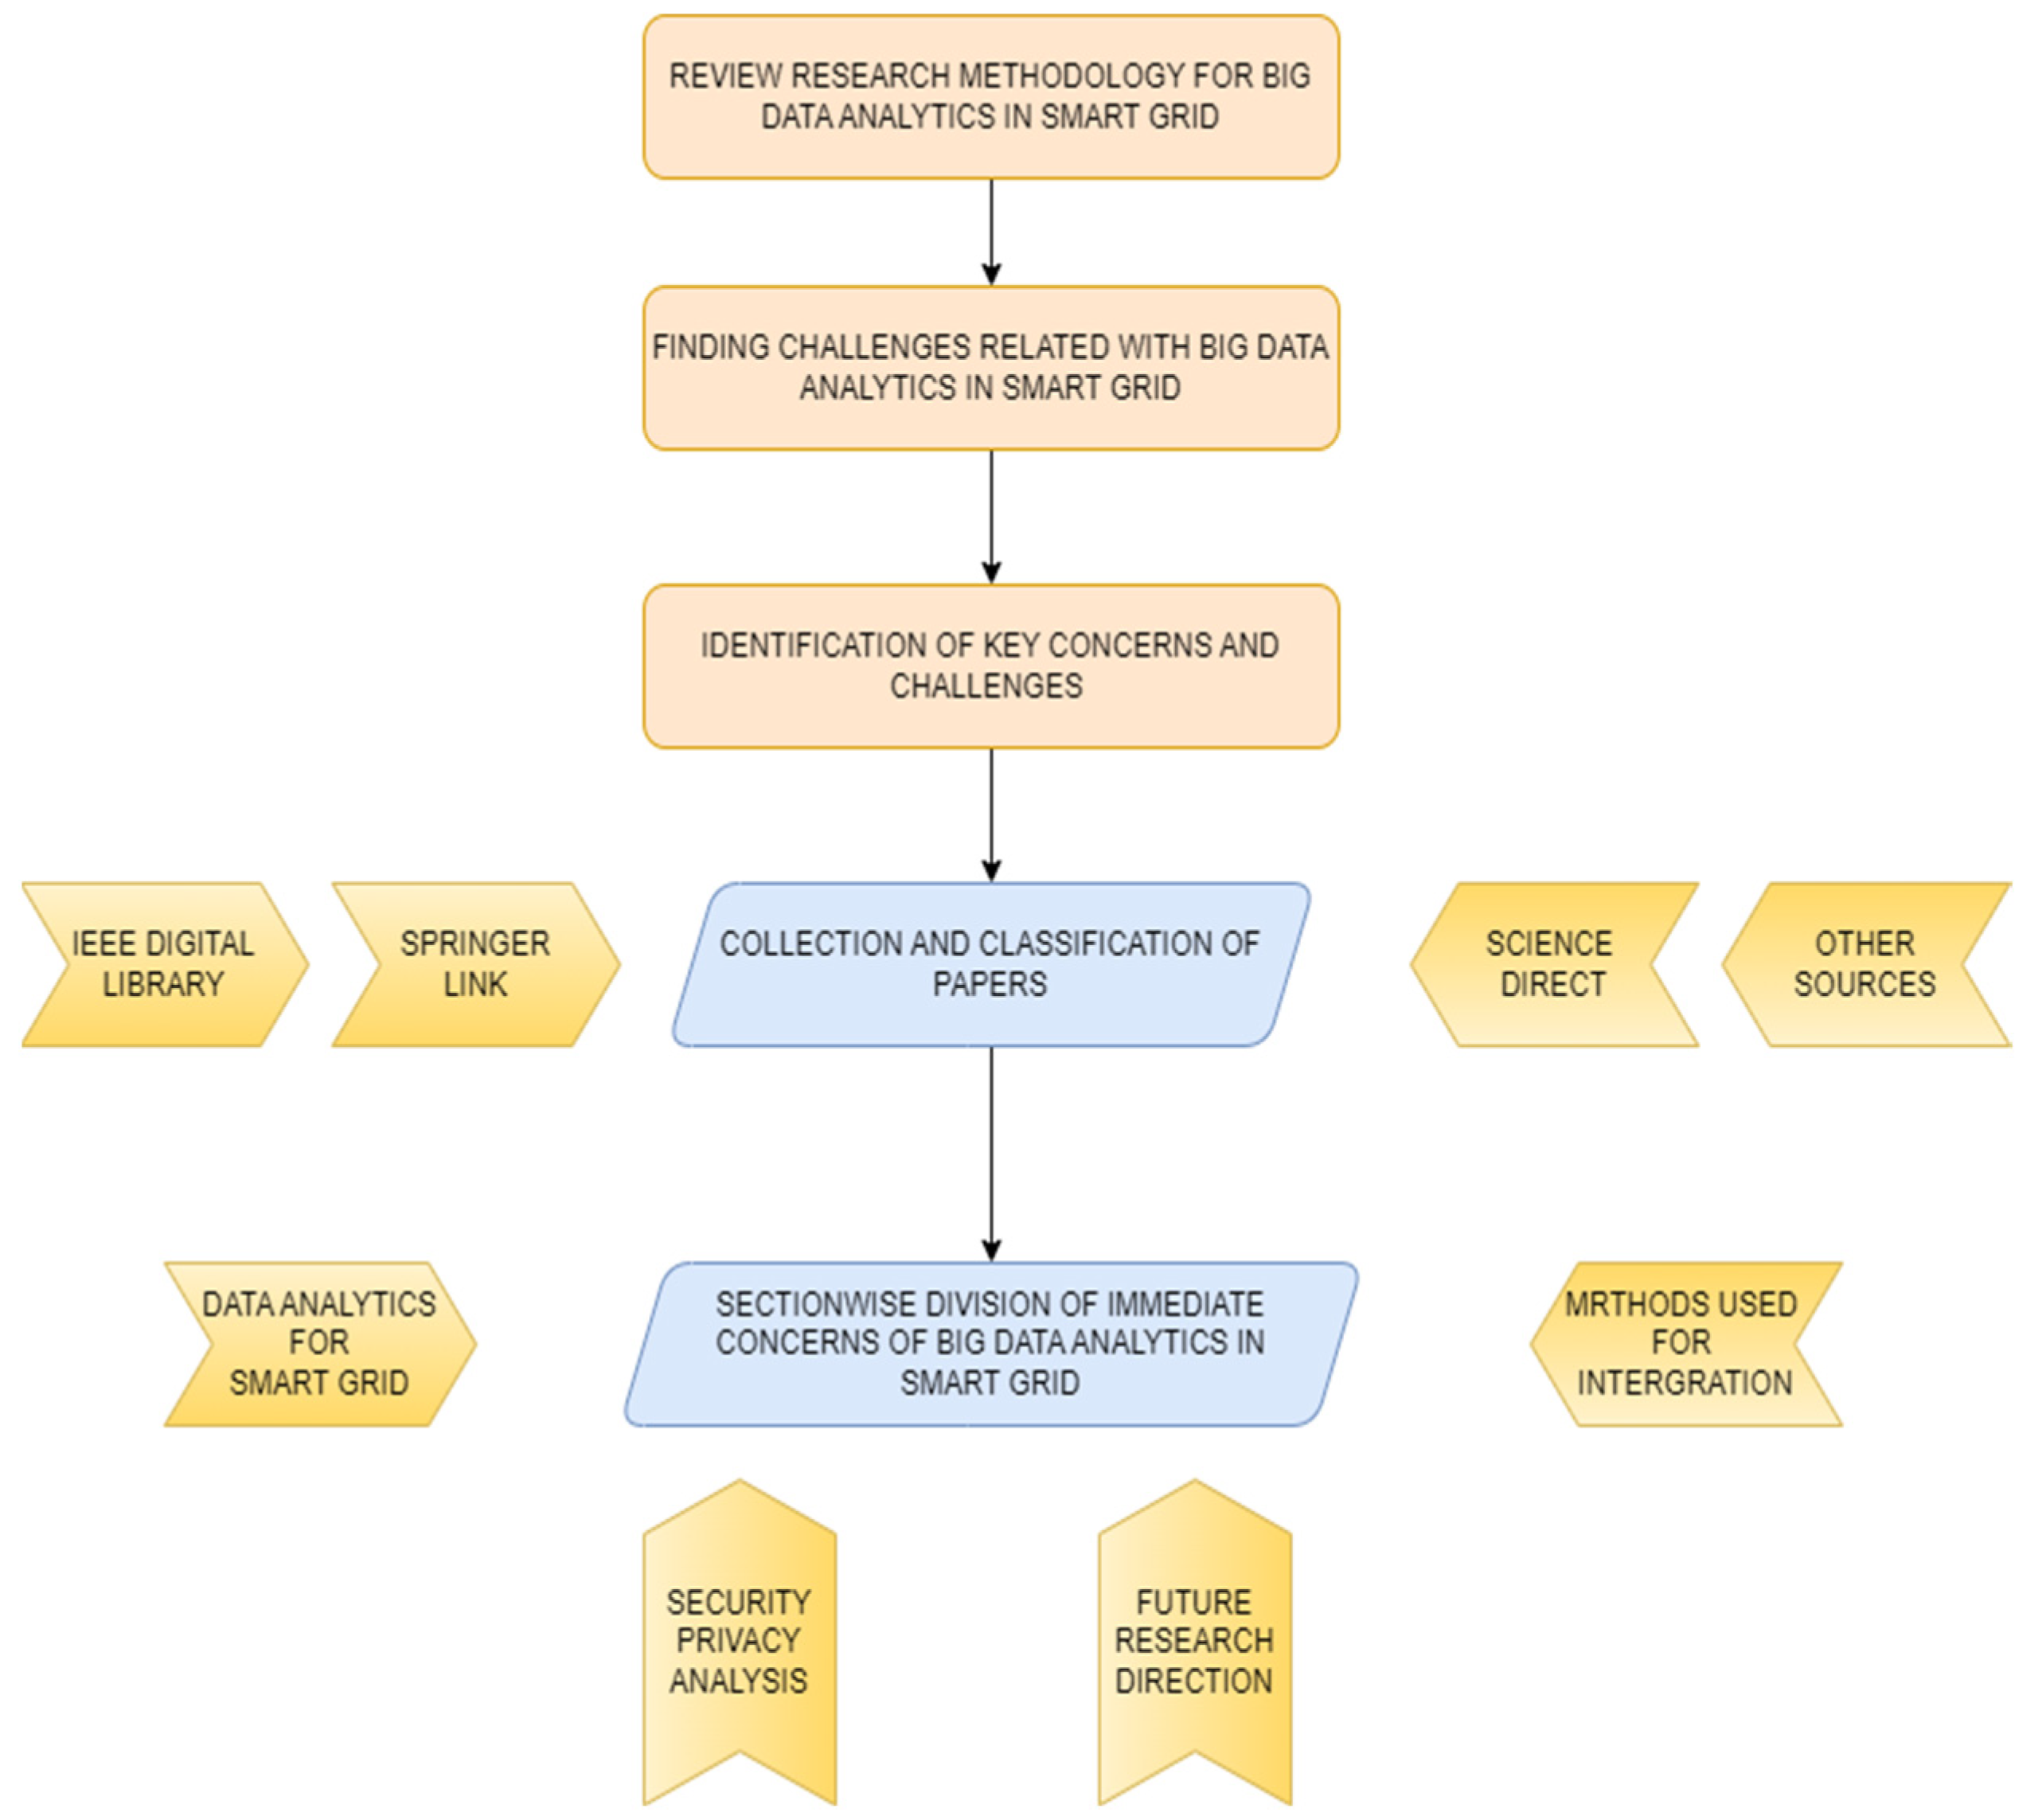
Figure 3.
Venn diagram of big data analytics.
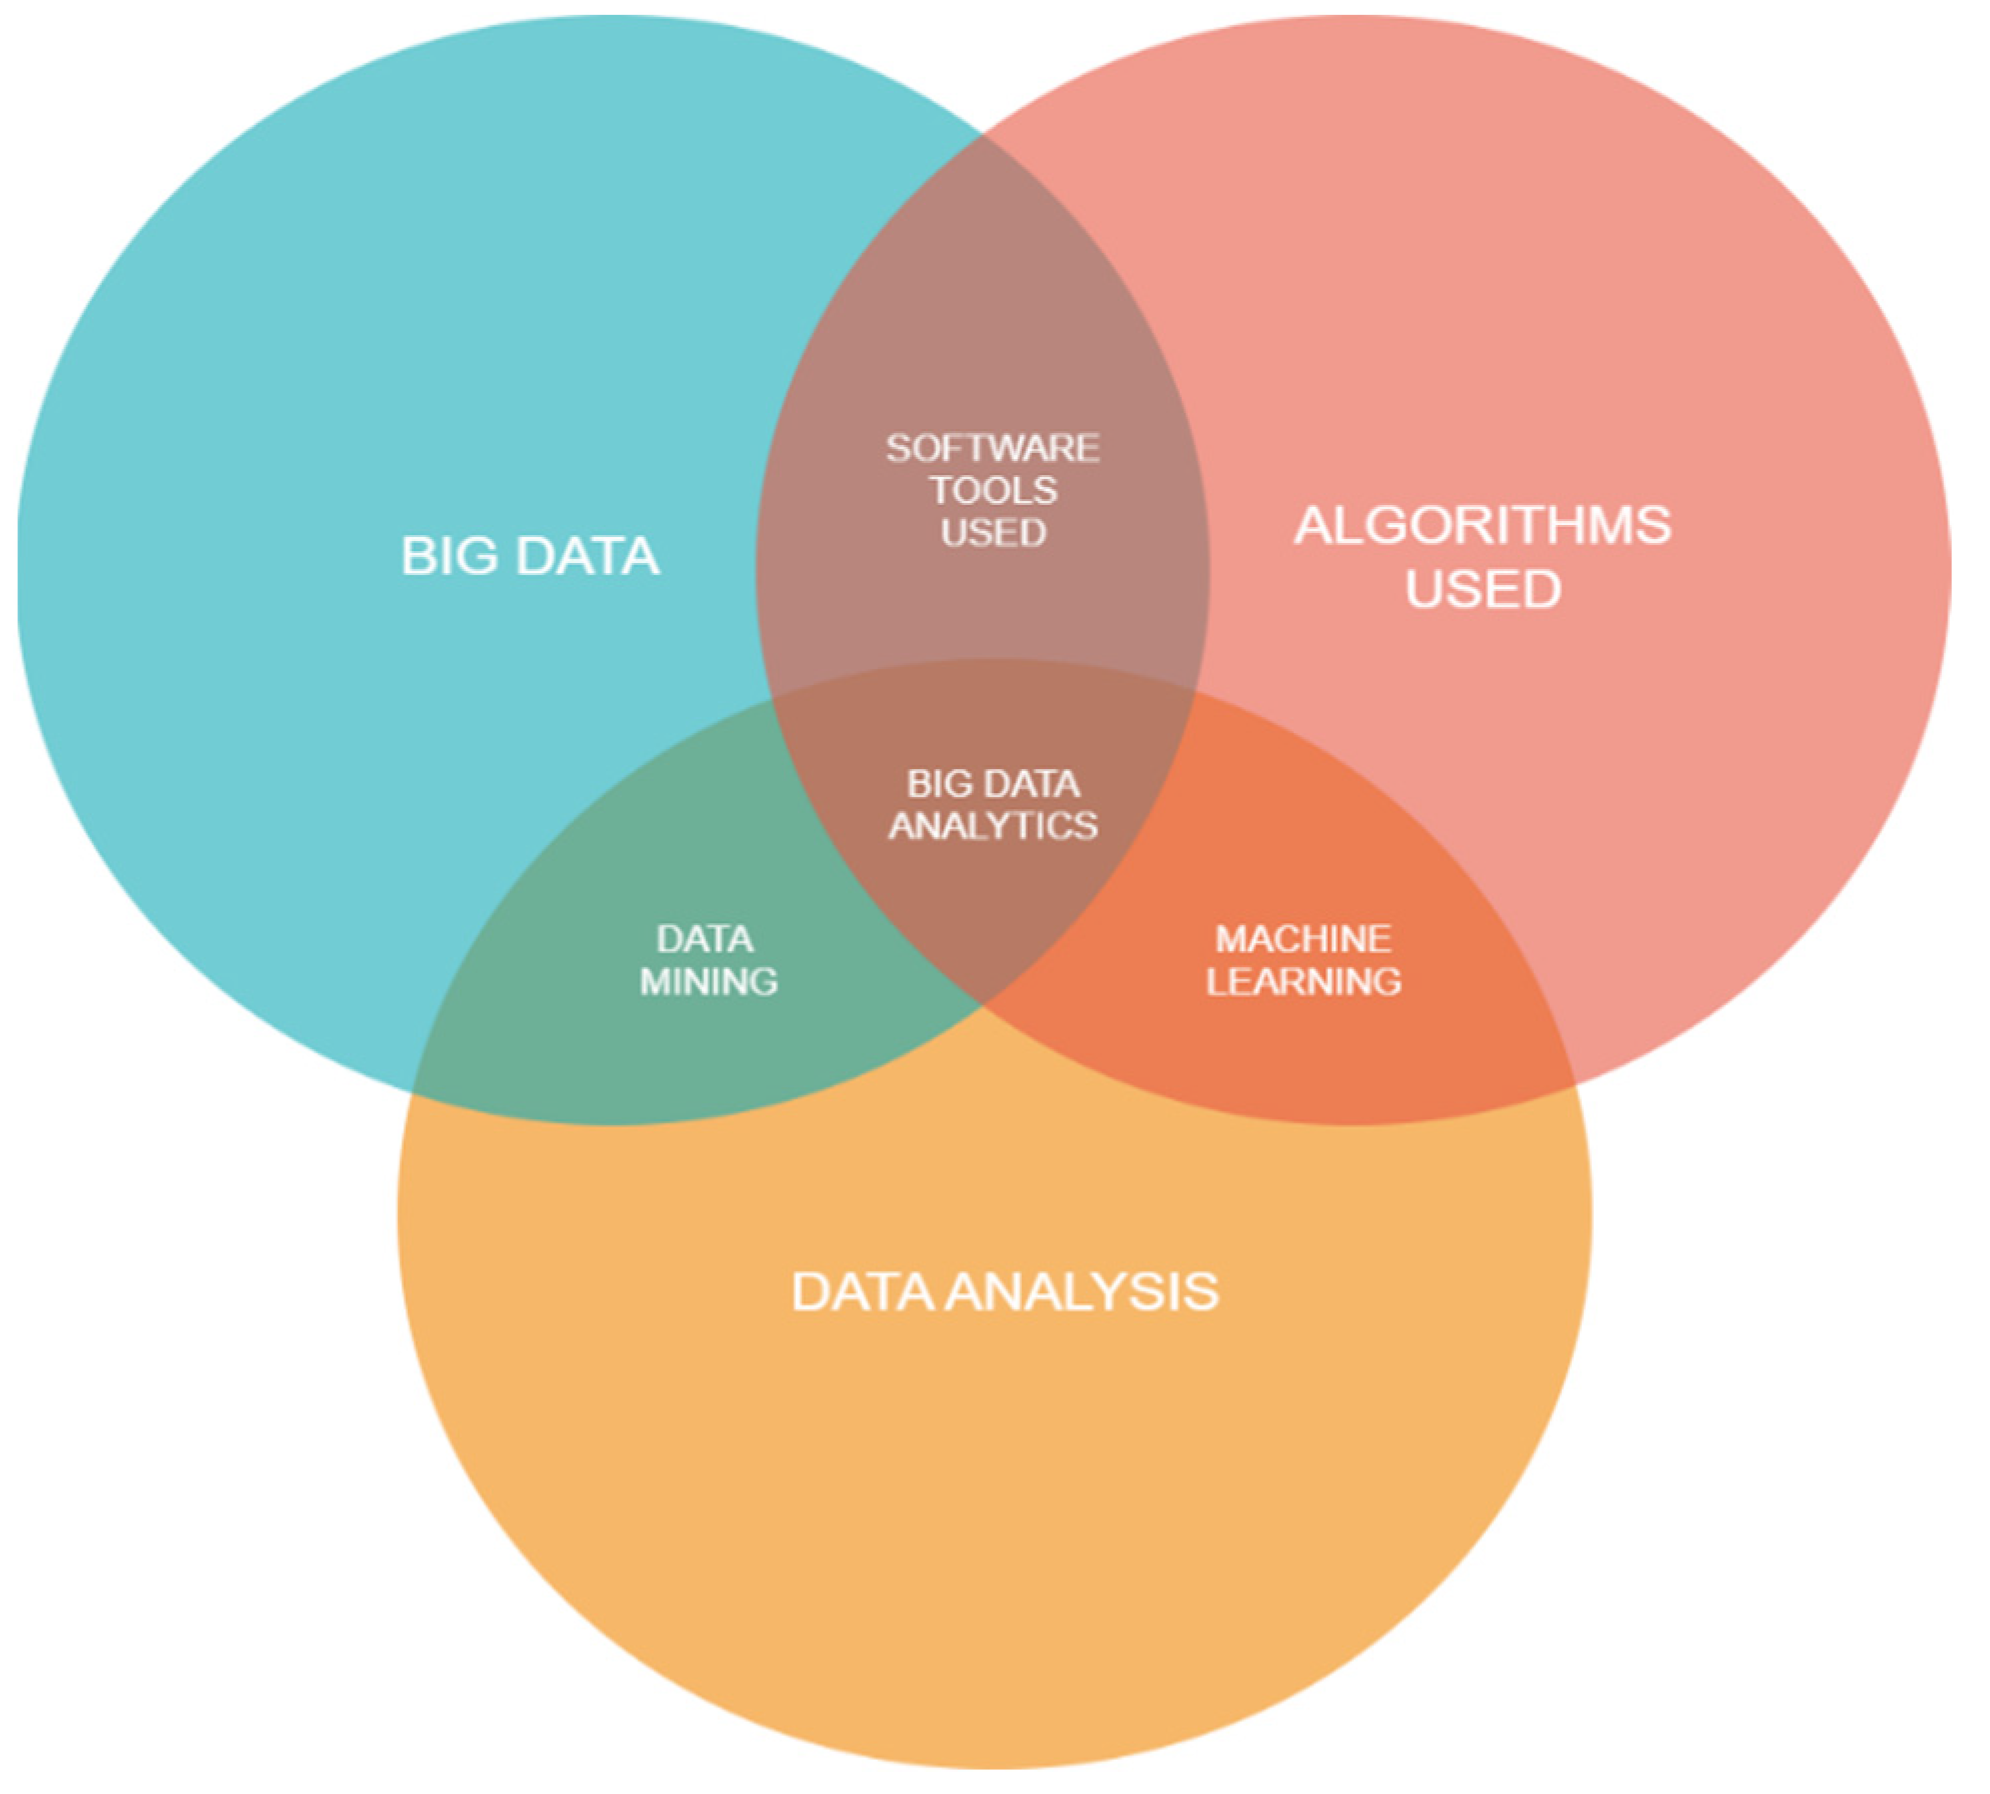
Figure 4.
Model output of the neural network.
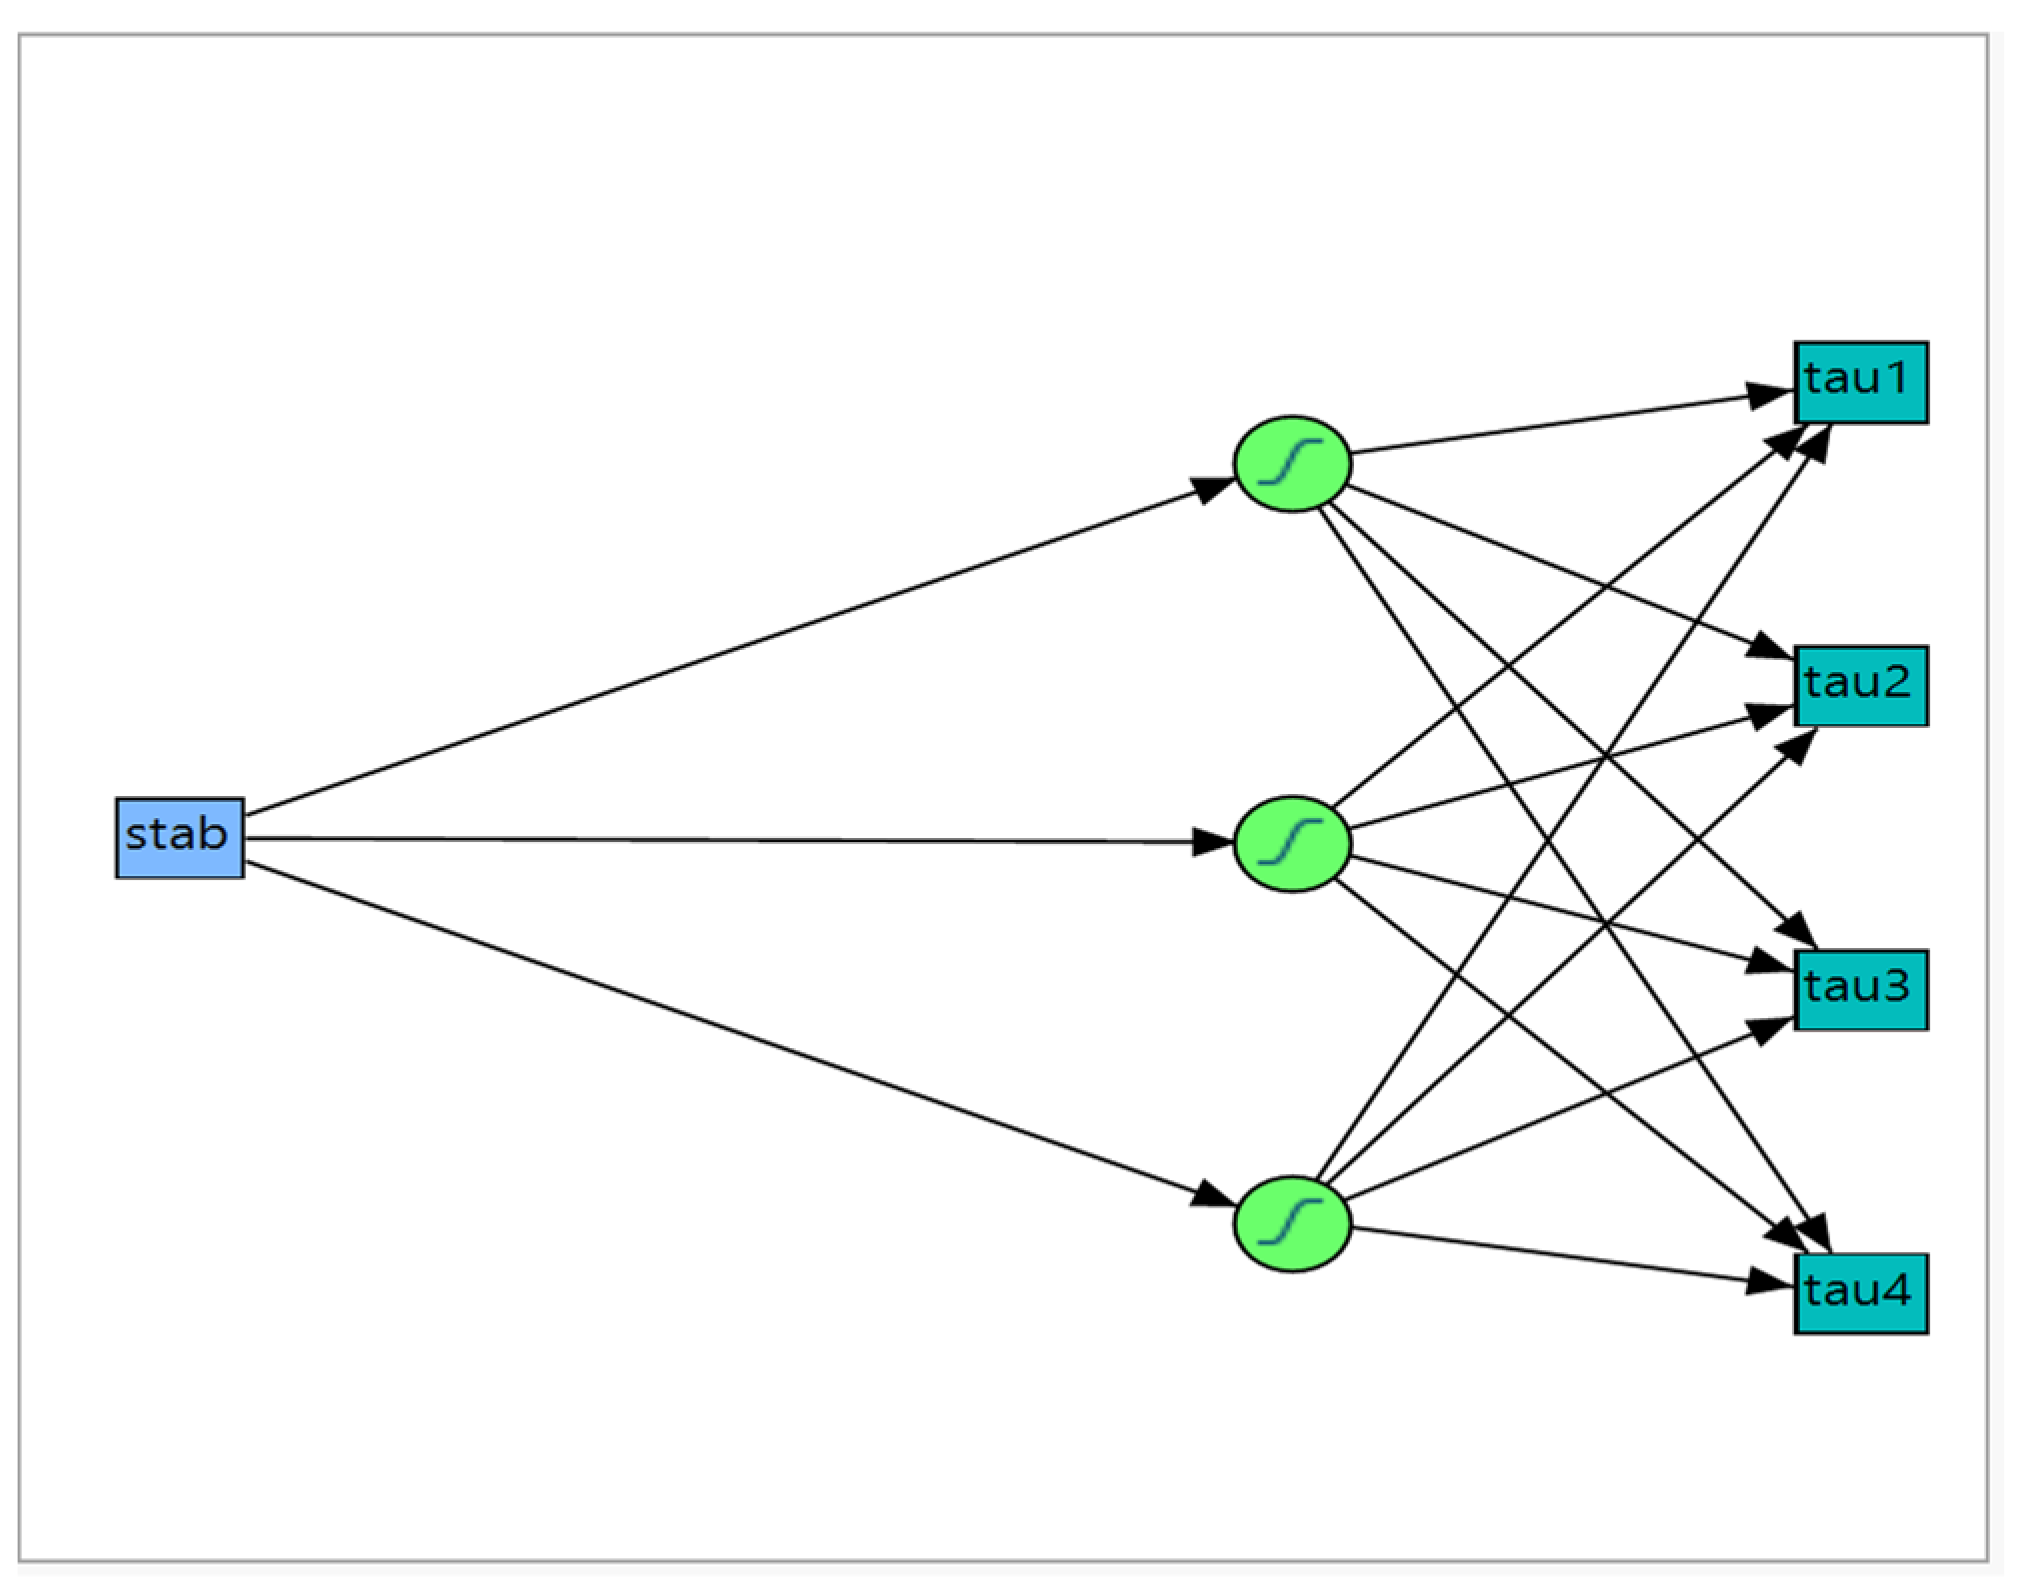
Figure 5.
Multiple regression for stab output (residual vs. fitted values).

Figure 6.
Multiple regression for stab output model building report with parameters.
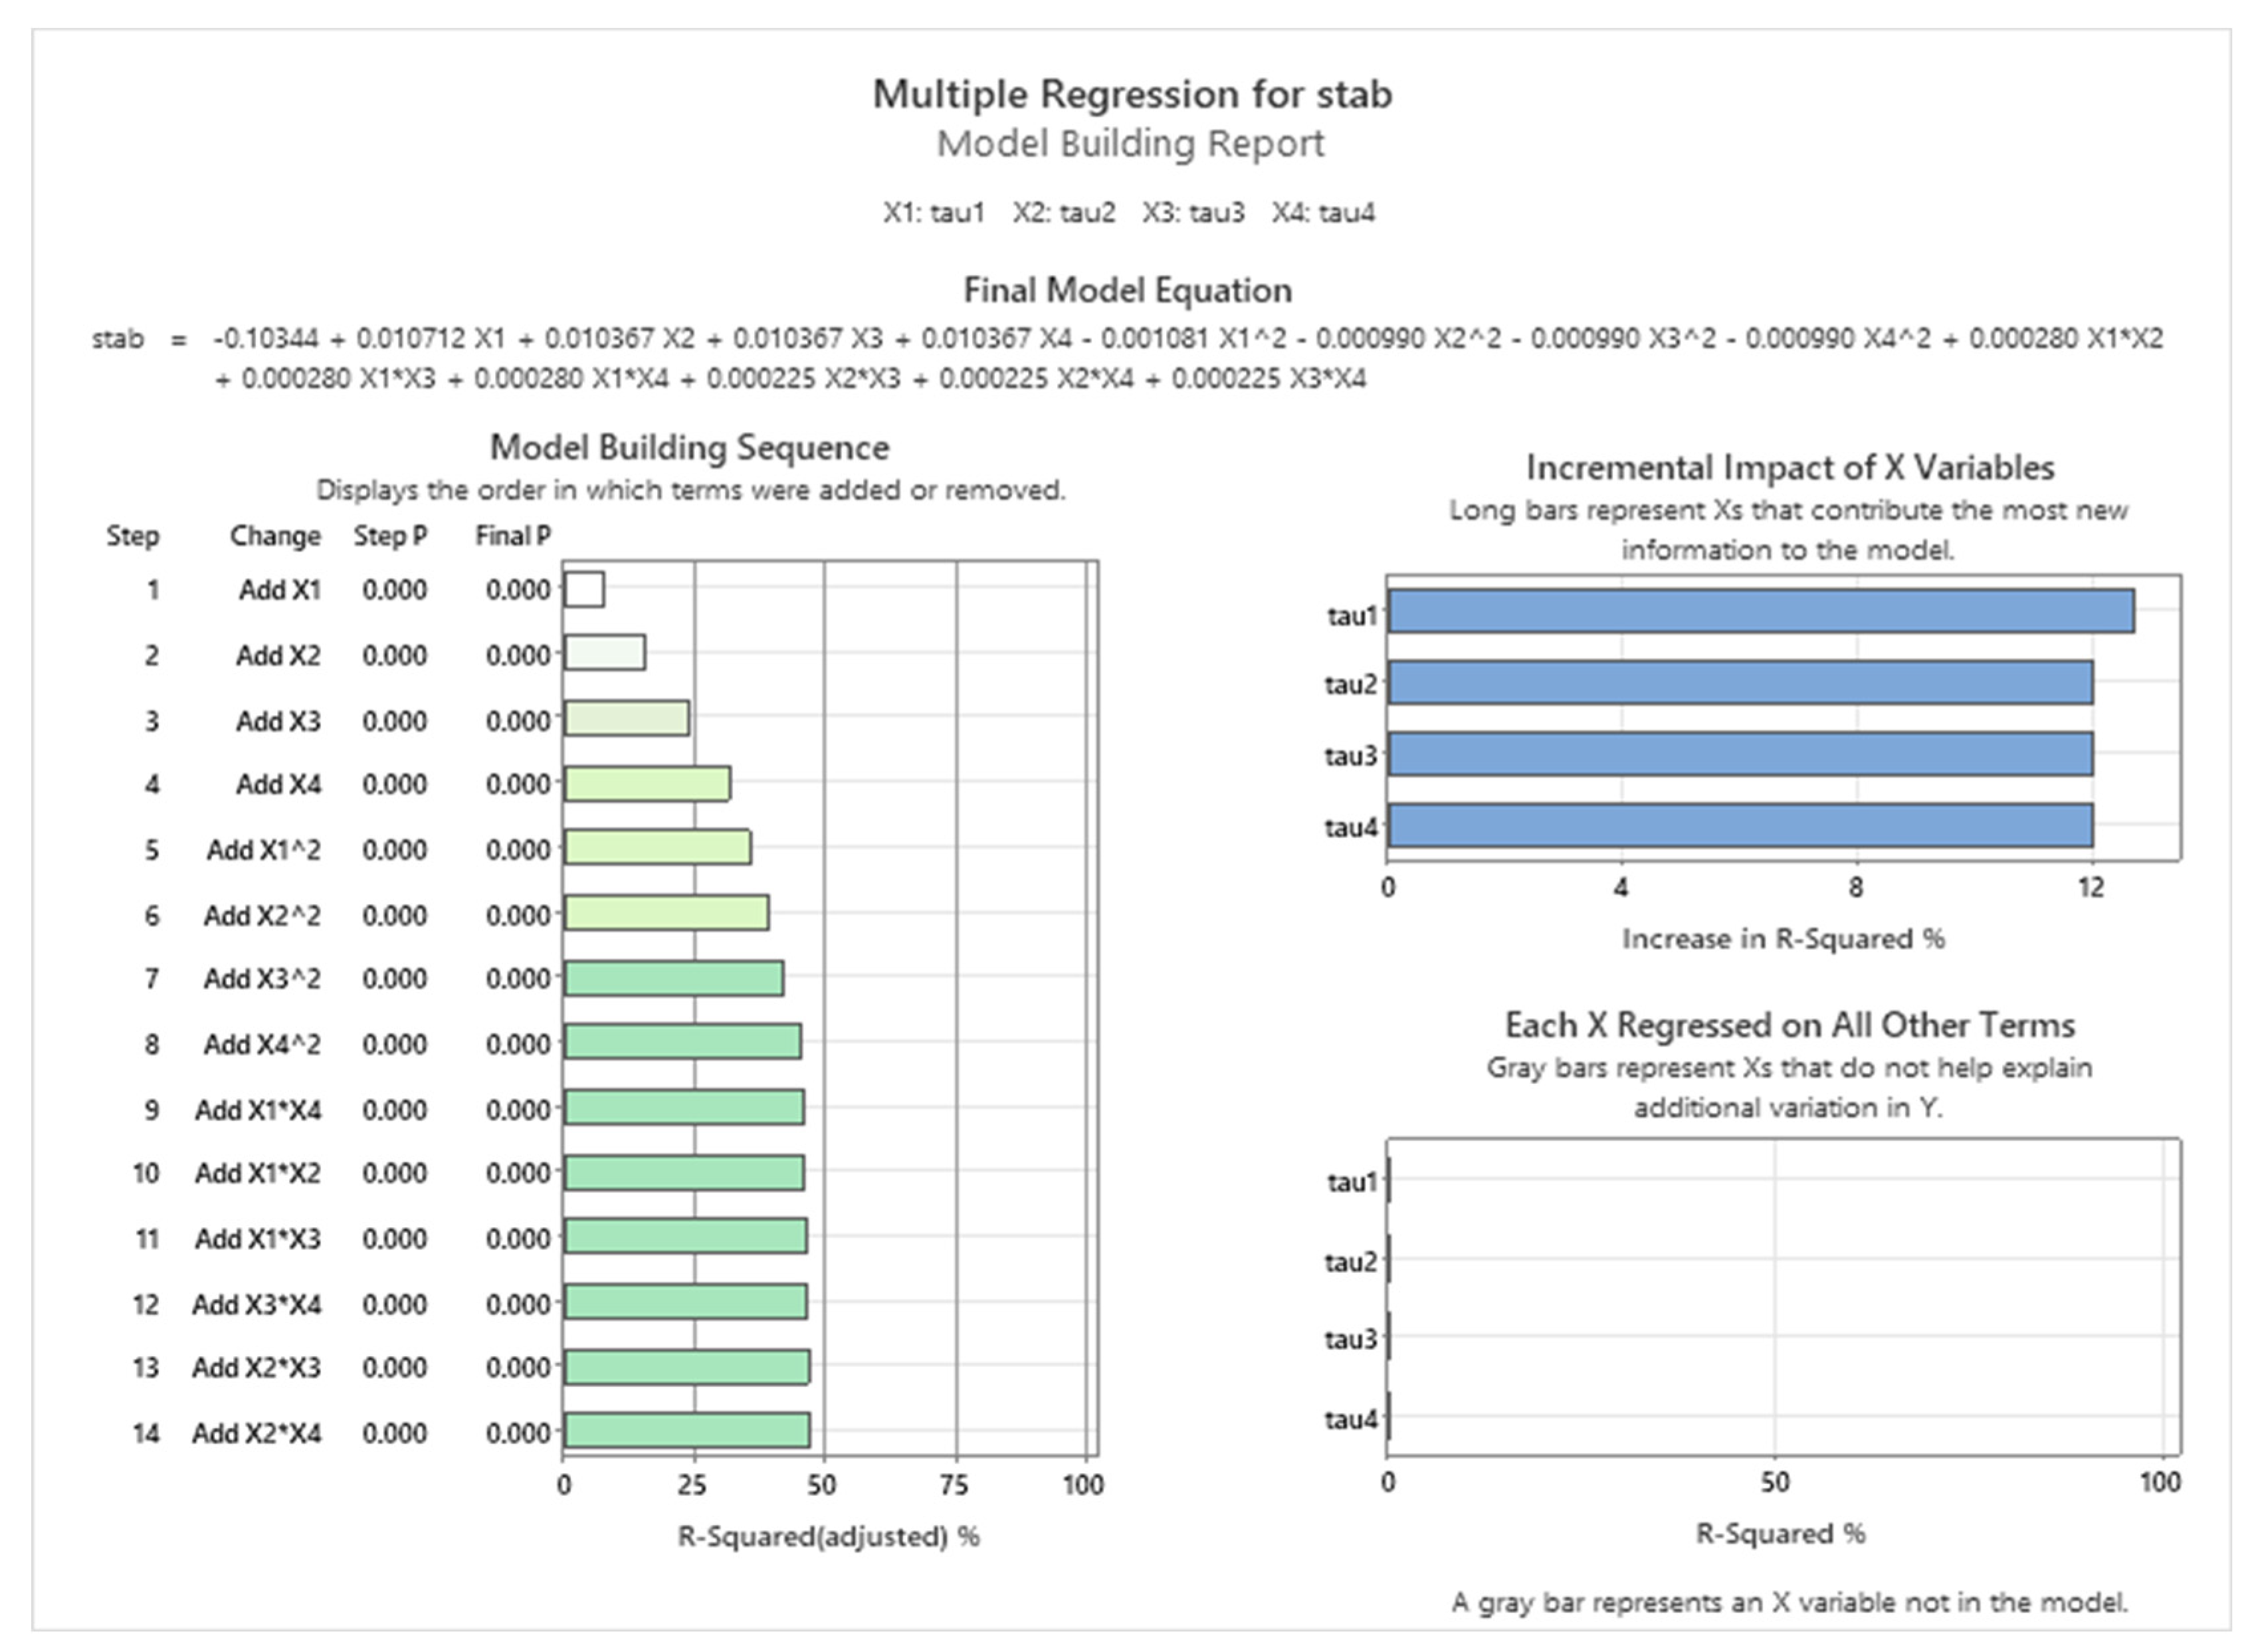
Figure 7.
Multiple regression for stab output prediction and optimization report.

Figure 8.
Binary fitted line plot probability of event vs. stab.
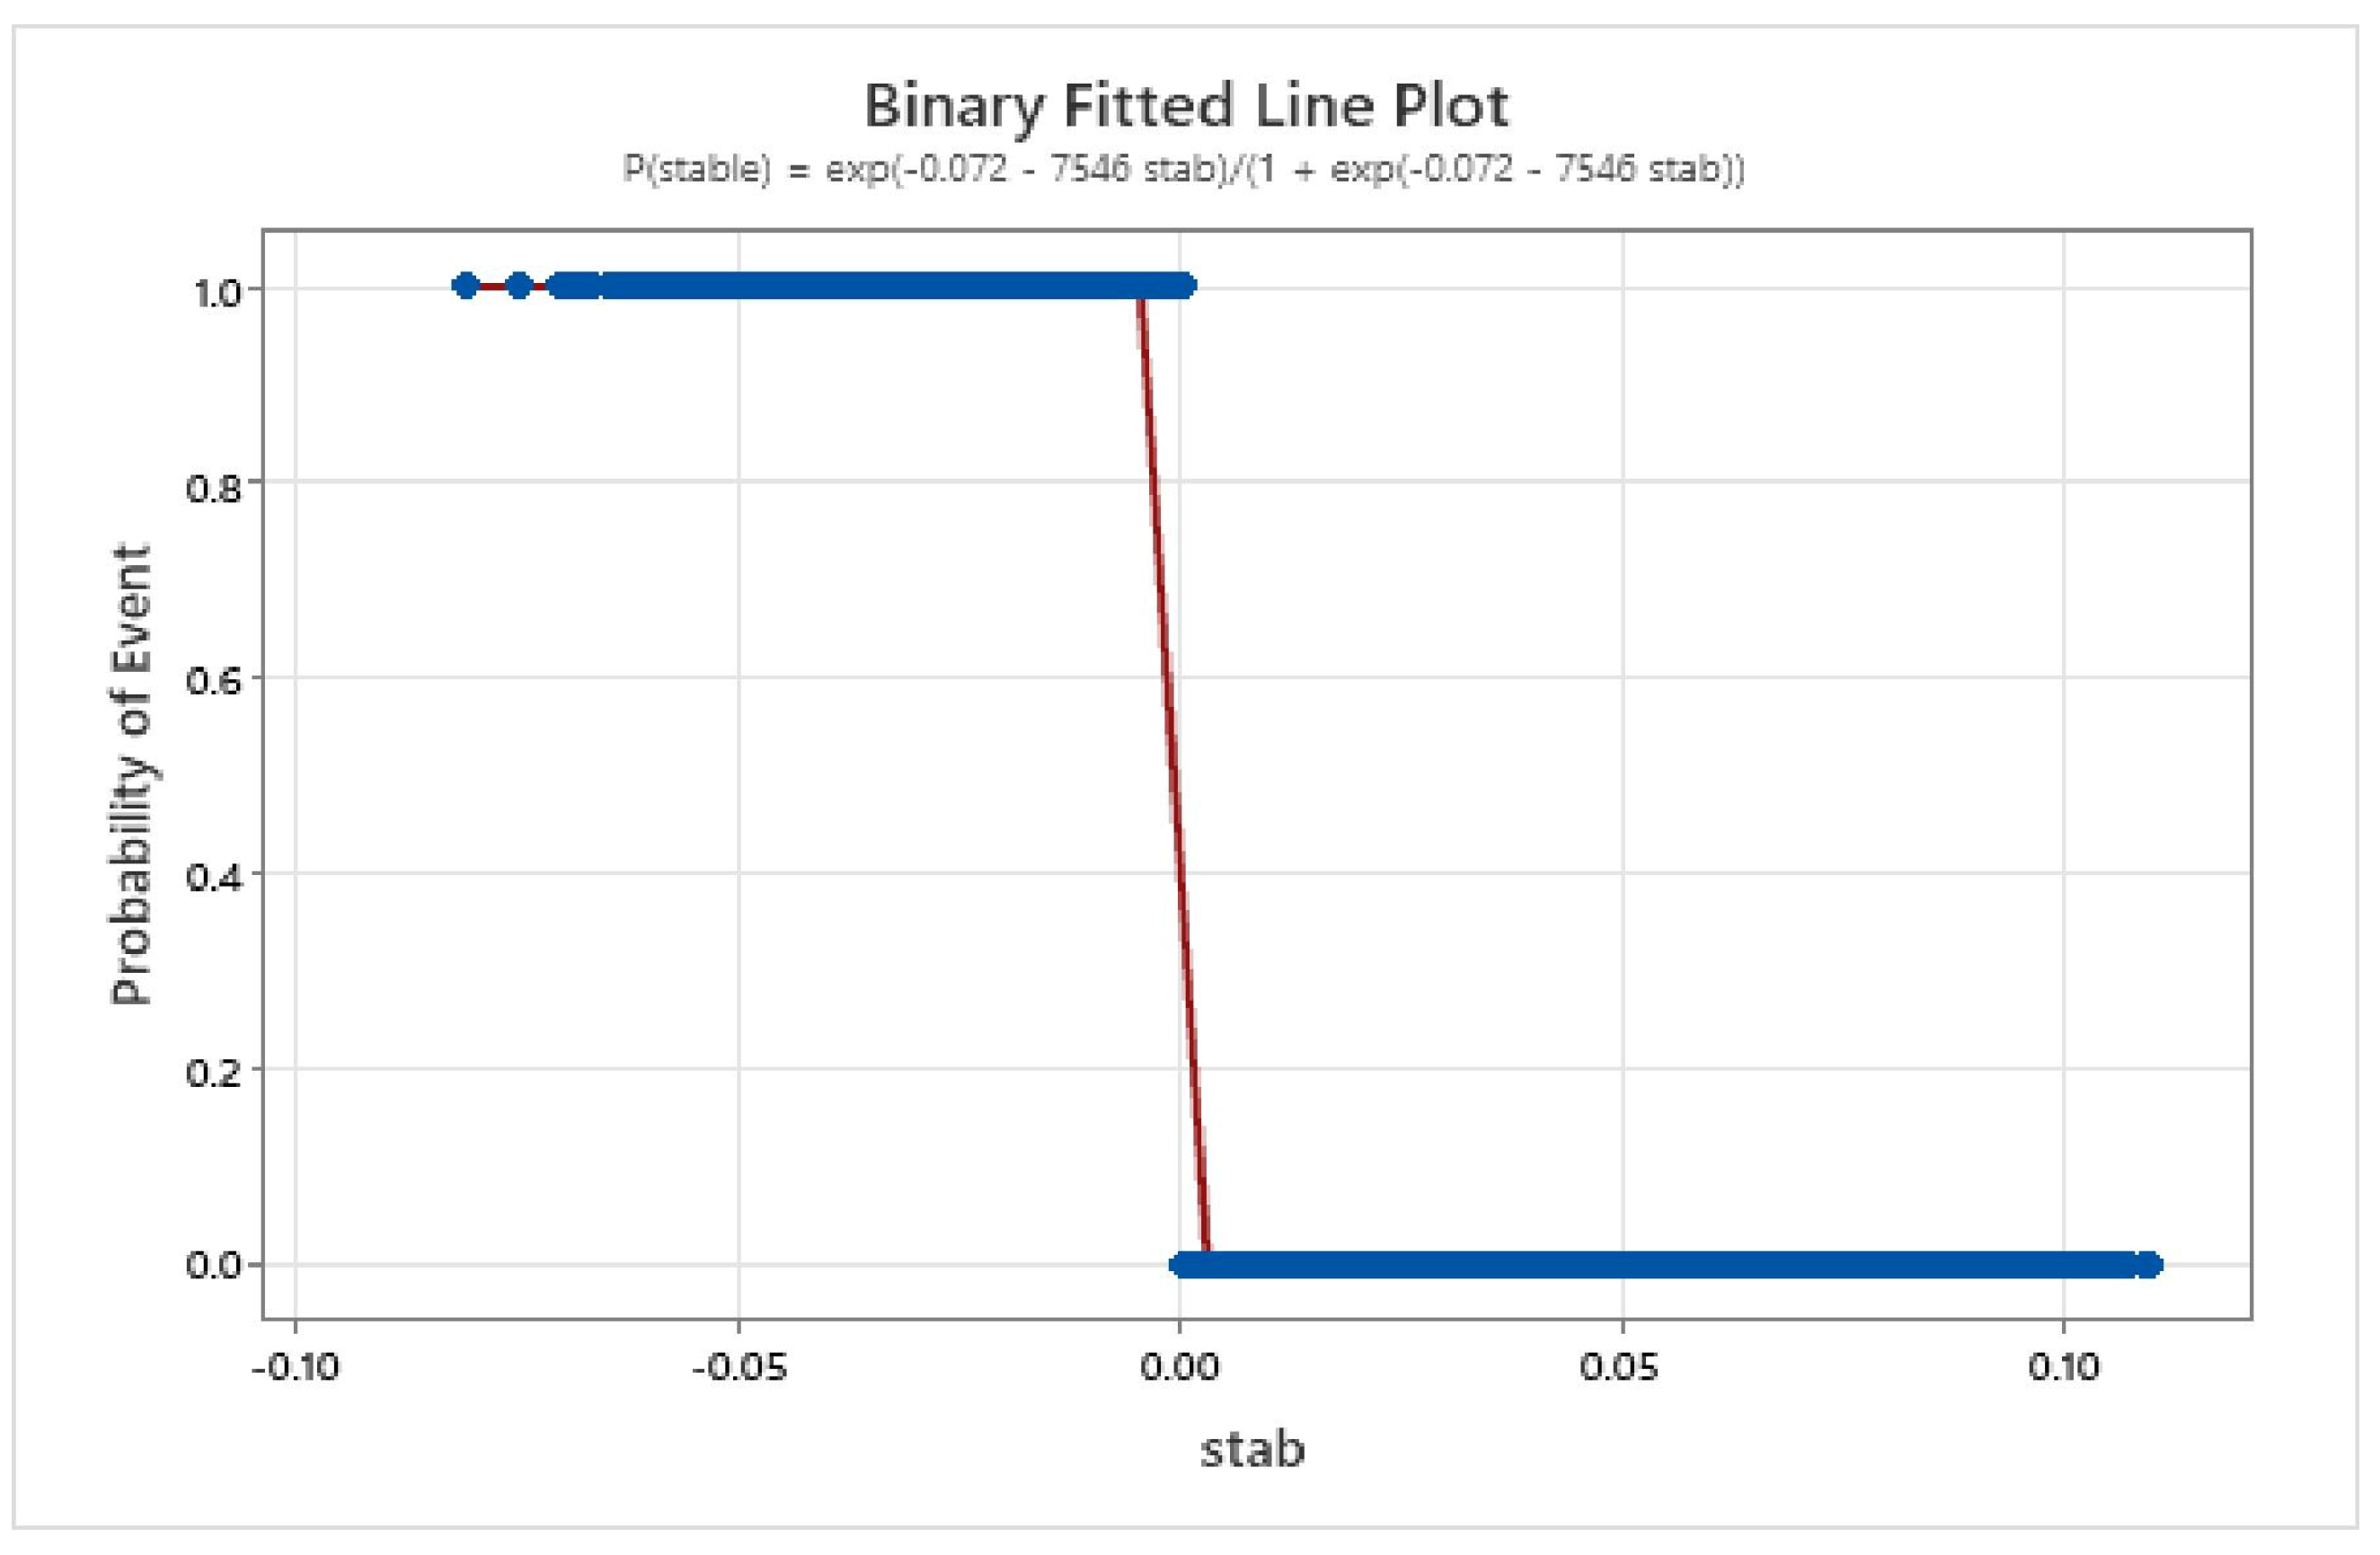
Figure 9.
K-Nearest Neighbors model output.
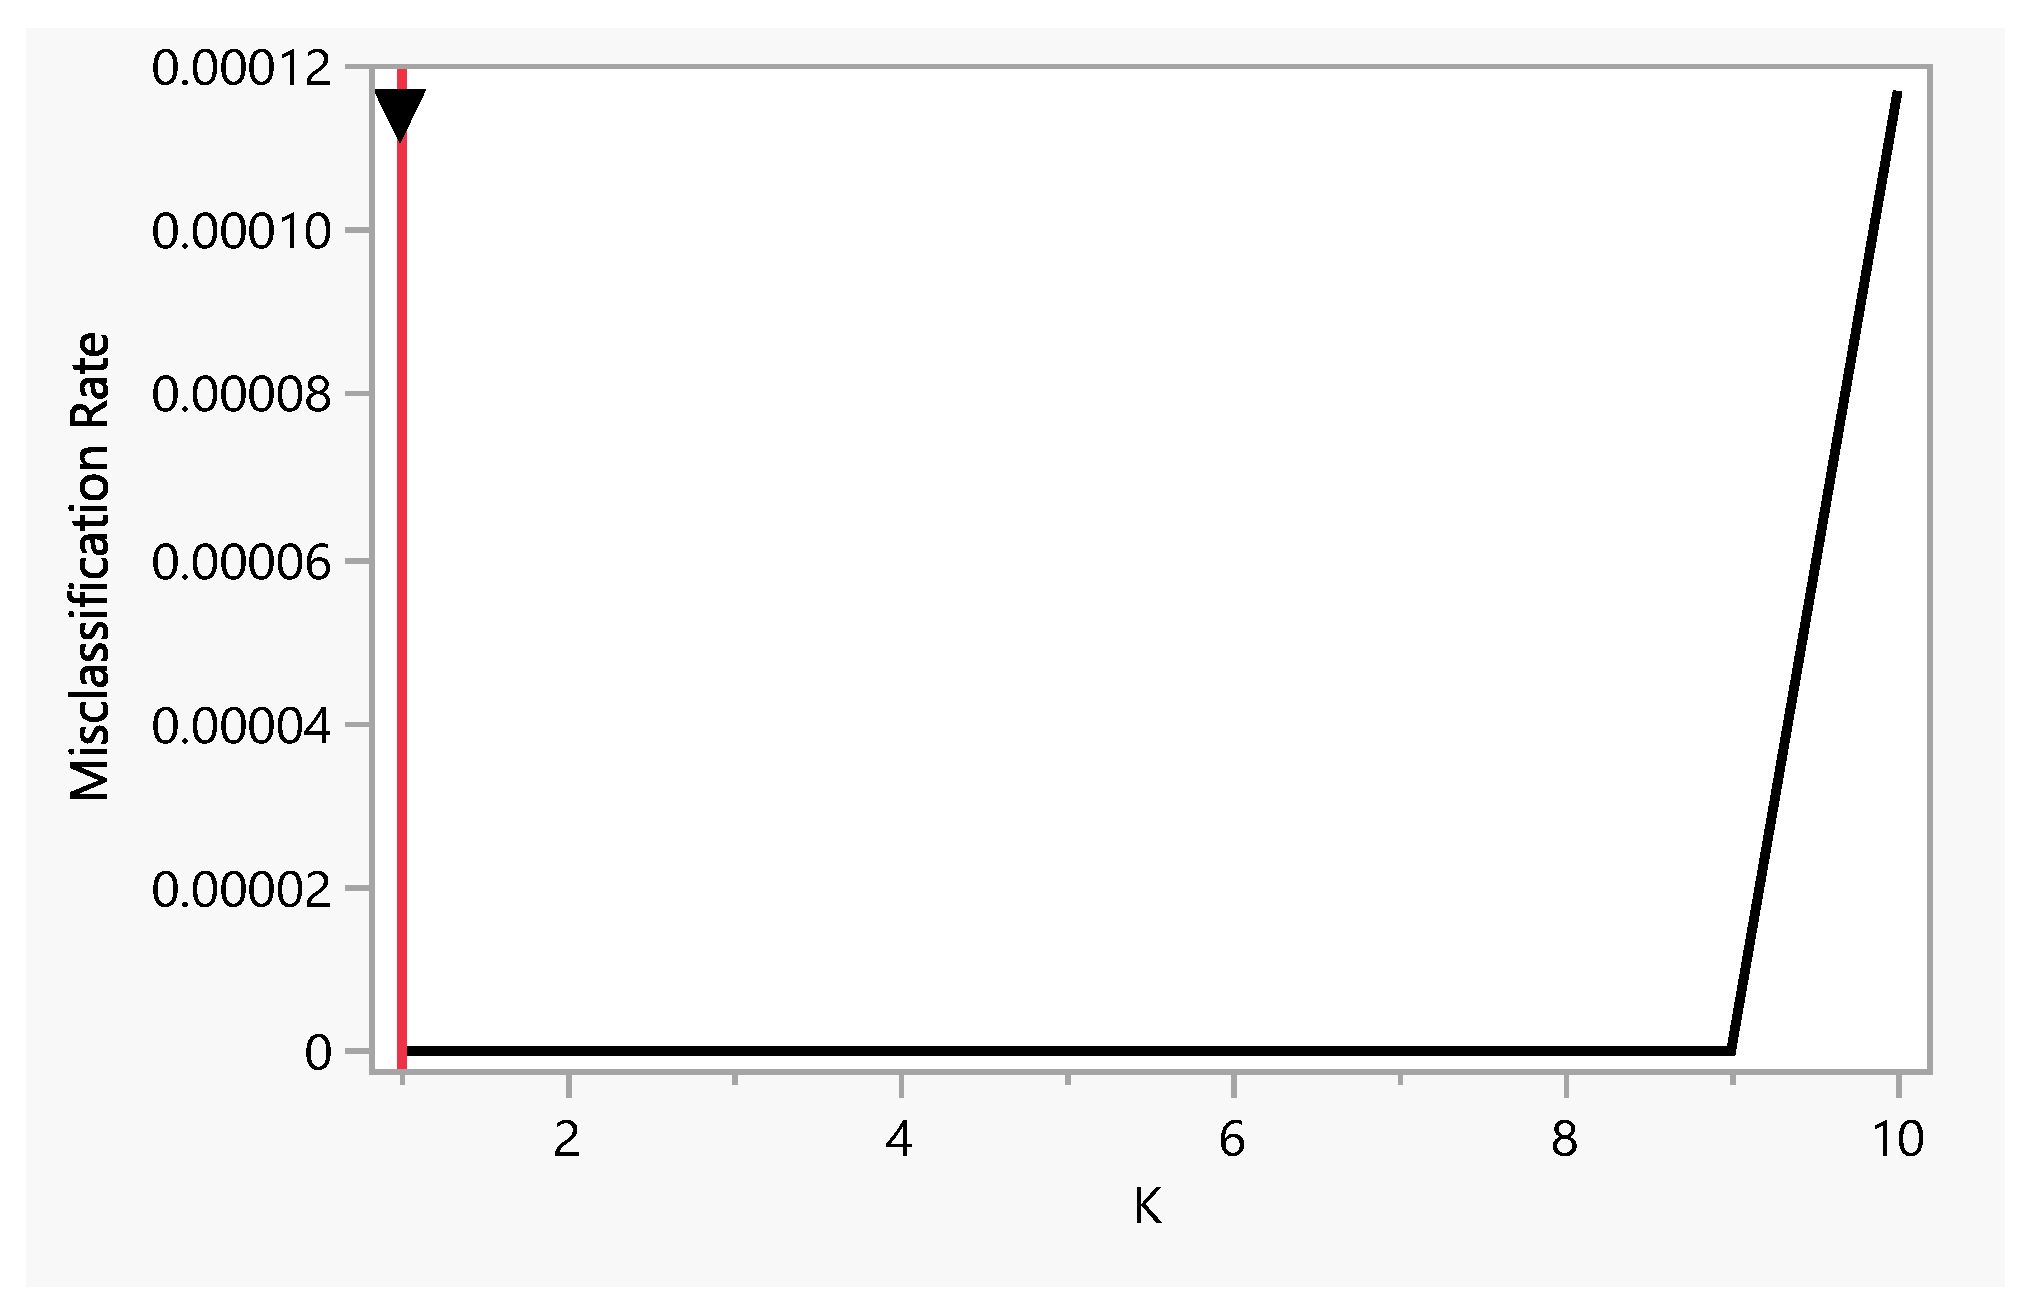
Figure 10.
Mosaic plot for k-Nearest Neighbor prediction vs. actual.
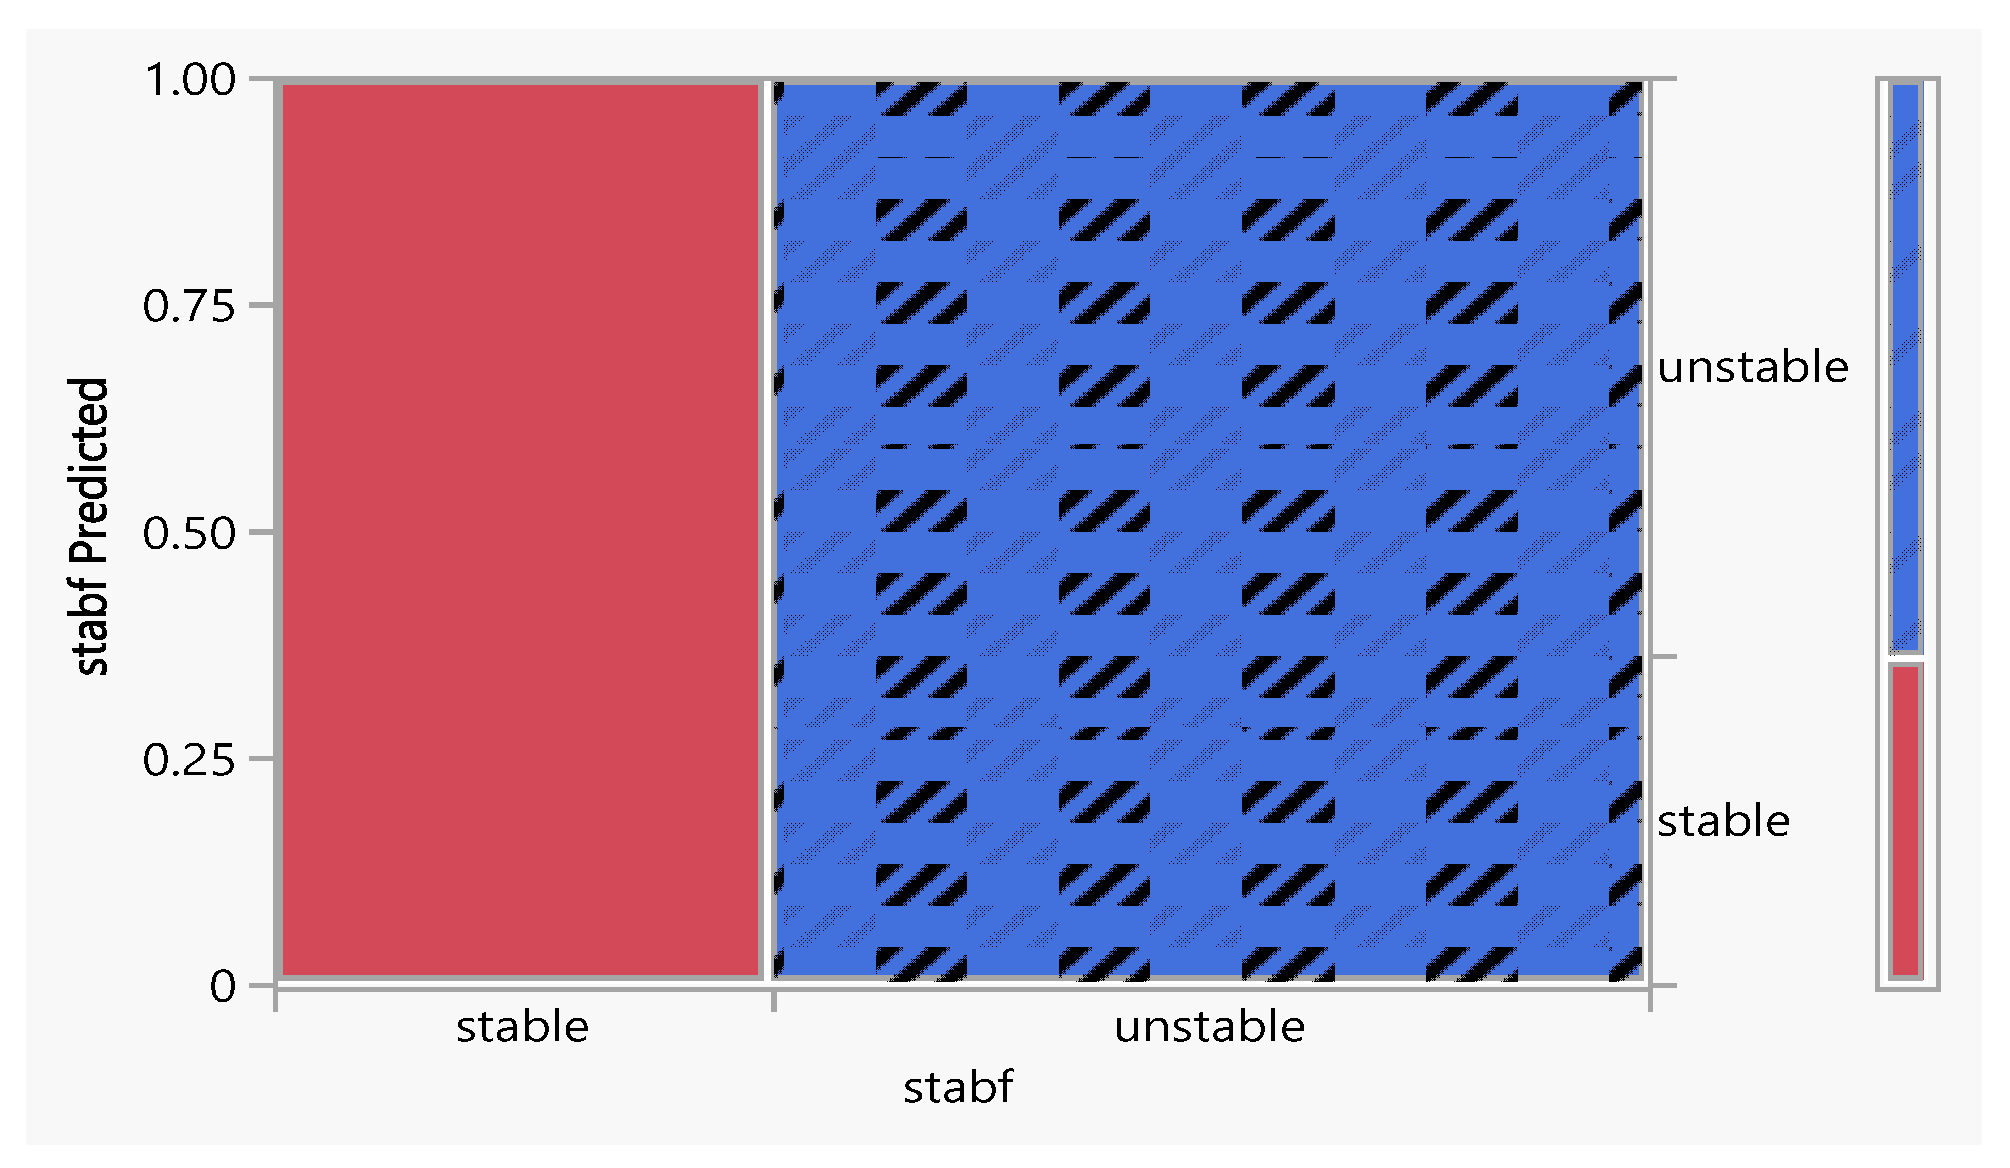
Figure 11.
Considered model accuracy in percentage.

Table 1.
Challenges faced with their solution.
| S. No. | Challenges | Solution to Challenges |
|---|---|---|
| 1 | Data volume and velocity | The solution to this challenge can be reached with the following measures: (a) use cloud computing and distributed storage, (b) use real-time analytics, (c) use data compression techniques, (d) use data sampling techniques, and (e) use parallel processing techniques. |
| 2 | Data quality | The solution to this challenge can be reached with the following measures: (a) use a data quality management tool, (b) involve stakeholders in the data quality process, and (c) continuously monitor data quality. |
| 3 | Privacy and security [33] | The solution to this challenge can be reached with the following measures: (a) use a privacy and security management tool, (b) involve stakeholders in the privacy and security process, and (c) continuously monitor privacy and security. |
| 4 | Cost | The solution to this challenge can be reached with the following measures: (a) careful planning of the project, (b) working with expertise, and (c) continuously monitoring costs. |
| 5 | Skills | For dealing with this challenge, some skills in relevant fields are needed: electrical engineering, power systems, information security, data visualization, and business intelligence. |
Table 2.
Model training data of neural network.
| Stab 1 | Measures | Value | Measures | Value | Stab 2 |
| RSquare | 0.0791332 | RSquare | 0.0792677 | ||
| RASE | 2.6365864 | RASE | 2.6325246 | ||
| Mean Abs Dev | 2.259736 | Mean Abs Dev | 2.2565207 | ||
| −LogLikelihood | 95,541.72 | −LogLikelihood | 95,480.047 | ||
| SSE | 278,077.42 | SSE | 277,221.29 | ||
| Sum Freq | 40,002 | Sum Freq | 40,002 | ||
| Stab 3 | Measures | Value | Measures | Value | Stab 4 |
| RSquare | 0.0784685 | RSquare | 0.0817522 | ||
| RASE | 2.6332954 | RASE | 2.6328099 | ||
| Mean Abs Dev | 2.2575801 | Mean Abs Dev | 2.2572644 | ||
| −LogLikelihood | 95,491.758 | −LogLikelihood | 95,484.382 | ||
| SSE | 277,383.65 | SSE | 277,281.38 | ||
| Sum Freq | 40,002 | Sum Freq | 40,002 |
Table 3.
Comparison and stability output of regression and K-Nearest Neighbors.
| Model | Stability Analysis | Explanation |
|---|---|---|
| Linear Regression | Moderate stability | Linear regression is sensitive to data ambiguities, which can lead to large changes in model parameters. However, if the distribution of the data remains relatively constant, the predictions of the model are stable. |
| Logistic Regression | Moderate stability | Logistic regression has a similar sensitivity as linear regression, which affects the coefficients of the model. With a stable data set, logistic regression provides consistent probabilities and predictions. |
| K-Nearest Neighbors | Low stability | Since the KNN records the training instances directly, the performance of the KNN is highly dependent on the training data. Small changes in the data and other additions/deletions of data points can significantly change the decision limits. This makes KNNs less stable compared to regression models for dynamic or noisy data sets. |
Disclaimer/Publisher’s Note: The statements, opinions and data contained in all publications are solely those of the individual author(s) and contributor(s) and not of MDPI and/or the editor(s). MDPI and/or the editor(s) disclaim responsibility for any injury to people or property resulting from any ideas, methods, instructions or products referred to in the content. |
© 2023 by the authors. Licensee MDPI, Basel, Switzerland. This article is an open access article distributed under the terms and conditions of the Creative Commons Attribution (CC BY) license (https://creativecommons.org/licenses/by/4.0/).
Share and Cite
MDPI and ACS Style
Gupta, R.; Chaturvedi, K.T. Adaptive Energy Management of Big Data Analytics in Smart Grids. Energies 2023, 16, 6016. https://doi.org/10.3390/en16166016
AMA Style
Gupta R, Chaturvedi KT. Adaptive Energy Management of Big Data Analytics in Smart Grids. Energies. 2023; 16(16):6016. https://doi.org/10.3390/en16166016
Chicago/Turabian StyleGupta, Rohit, and Krishna Teerth Chaturvedi. 2023. "Adaptive Energy Management of Big Data Analytics in Smart Grids" Energies 16, no. 16: 6016. https://doi.org/10.3390/en16166016
Note that from the first issue of 2016, this journal uses article numbers instead of page numbers. See further details here.