Article

Physical and Numerical Simulations of Steam Drive and Gravity Drainage Using the Confined Bottom Oil–Water Transition Zone to Develop Super Heavy Oil

Research Institute of Petroleum Exploration and Development, China National Petroleum Corporation, Beijng 100083, China
*
Author to whom correspondence should be addressed.
Energies 2023, 16(17), 6302; https://doi.org/10.3390/en16176302
Submission received: 19 July 2023 / Revised: 23 August 2023 / Accepted: 28 August 2023 / Published: 30 August 2023
(This article belongs to the Special Issue Advances of Heavy Oil Recovery Technologies with Low Carbon-Intensity)

Abstract

:
The existence of the bottom oil–water transition zone (BTZ) greatly impairs the performance of the conventional steam-assisted gravity drainage (SAGD) process and its mitigation measures are very limited. In order to accelerate oil production and decrease the Steam-to-Oil Ratio (SOR), a promising technology involving a steam drive and gravity drainage (SDGD) process by placing dual-horizontal wells with high permeability in the BTZ was systematically studied. This paper conducted two-dimensional (2D) and three-dimensional (3D) physical simulations as well as 2D numerical simulation of the SDGD process to explore the mechanism, potential, and application conditions. The research findings indicate that the SDGD process in the BTZ with enhanced permeability through dilation stimulation can achieve higher oil production and lower SOR than the SAGD process. This process fully leverages the advantage of the BTZ to quickly establish inter-well thermal and hydraulic connectivity. The steam chamber first forms around the injector and then spreads towards the producer. By exerting the horizontal displacement of drained oil, oil production rapidly ramps up and keeps at a high rate under the synergistic effect of steam drive and gravity drainage. These insights enhance our understanding of the mechanism, potential, and application conditions of the SDGD process in the confined BTZ to develop super heavy oil or oil sands.

1. Introduction

SAGD has been successfully applied in developing super heavy oil and oil sand reservoirs. It usually adopts a dual-horizontal well pair with the injector located 5 m above the producer [1]. A bottom oil–water transition zone (BTZ) exists in many super heavy oil or oil sand projects including East Senlac, Cenovus Christina Lake, ConocoPhillips Surmont, Husky Tucker, Nexen Long Lake, Statoil Leismer, International Blackrod projects, and Devon Jackfish, etc. [2]. Although its water saturation is about 50% and its thickness is usually less than 5 m, it still poses serious challenges to production performance and field operation in the SAGD process. On the one hand, it causes high SOR, a low production–injection ratio, and a low oil production rate. On the other hand, the strategy of balancing the operating pressure with the BTZ pressure is often challenging to achieve. When the BTZ pressure is higher than that of the steam chamber, the bottom water will flow into or even quench the steam chamber, lowering the steam chamber temperature and thus reducing the oil’s mobility. Conversely, when the BTZ pressure is lower than that of the steam chamber, both the steam and heated oil will probably leak into the BTZ [3,4].
In order to further mitigate the adverse effect of the BTZ, sidetracking and up-moving the well pairs were sometimes applied, increasing the distance of the producer above the BTZ by about 5 m of vertical offset, to delay the interaction between the steam chamber and the BTZ. However, this leaves a large amount of reserves below the producer [5] and steam flooding after CSS at different water avoidances also causes similar problems [6]. Recent numerical simulations have demonstrated that the THAI in situ combustion process probably causes a surge in the water production rate and a period of low oil production rate [7,8]. Additionally, a method of lowering the producer to the base of the BTZ has been proposed to enhance oil recovery, but it has not been demonstrated in field practice [9].
In particular, a new technology named Bottom-up Gravity-Assisted Pressure Drive (BuGAPD for short) has been proposed by Bitcan Corporation. It involves producing viscous hydrocarbons from a reservoir along the bottom high-mobility zones between wells [10]. However, little follow-up research has been carried out or disclosed, considering that the BTZ is favorable for enhancing steam injection capacity and can be regarded as a high-mobility zone [11,12,13,14], and its permeability can be further enhanced to tens of Darcys by dilation stimulation [15,16,17,18,19,20]. Inspired by this, it is very necessary to conduct in-depth exploration of its mechanisms in comparison with SAGD, its adaptability and limitations, etc.
This paper first conducted 2D physical simulations by placing the injector and the producer in the BTZ to analyze the mechanism of the SDGD process and optimize the well spacing. On this basis, 3D physical simulation was carried out to further explore the steric steam chamber development and production law. In addition, a series of numerical simulations and a sensitivity analysis were conducted to compare the performance of the SDGD process in the BTZ and the conventional SAGD process, and present the application conditions.

2. Methodology

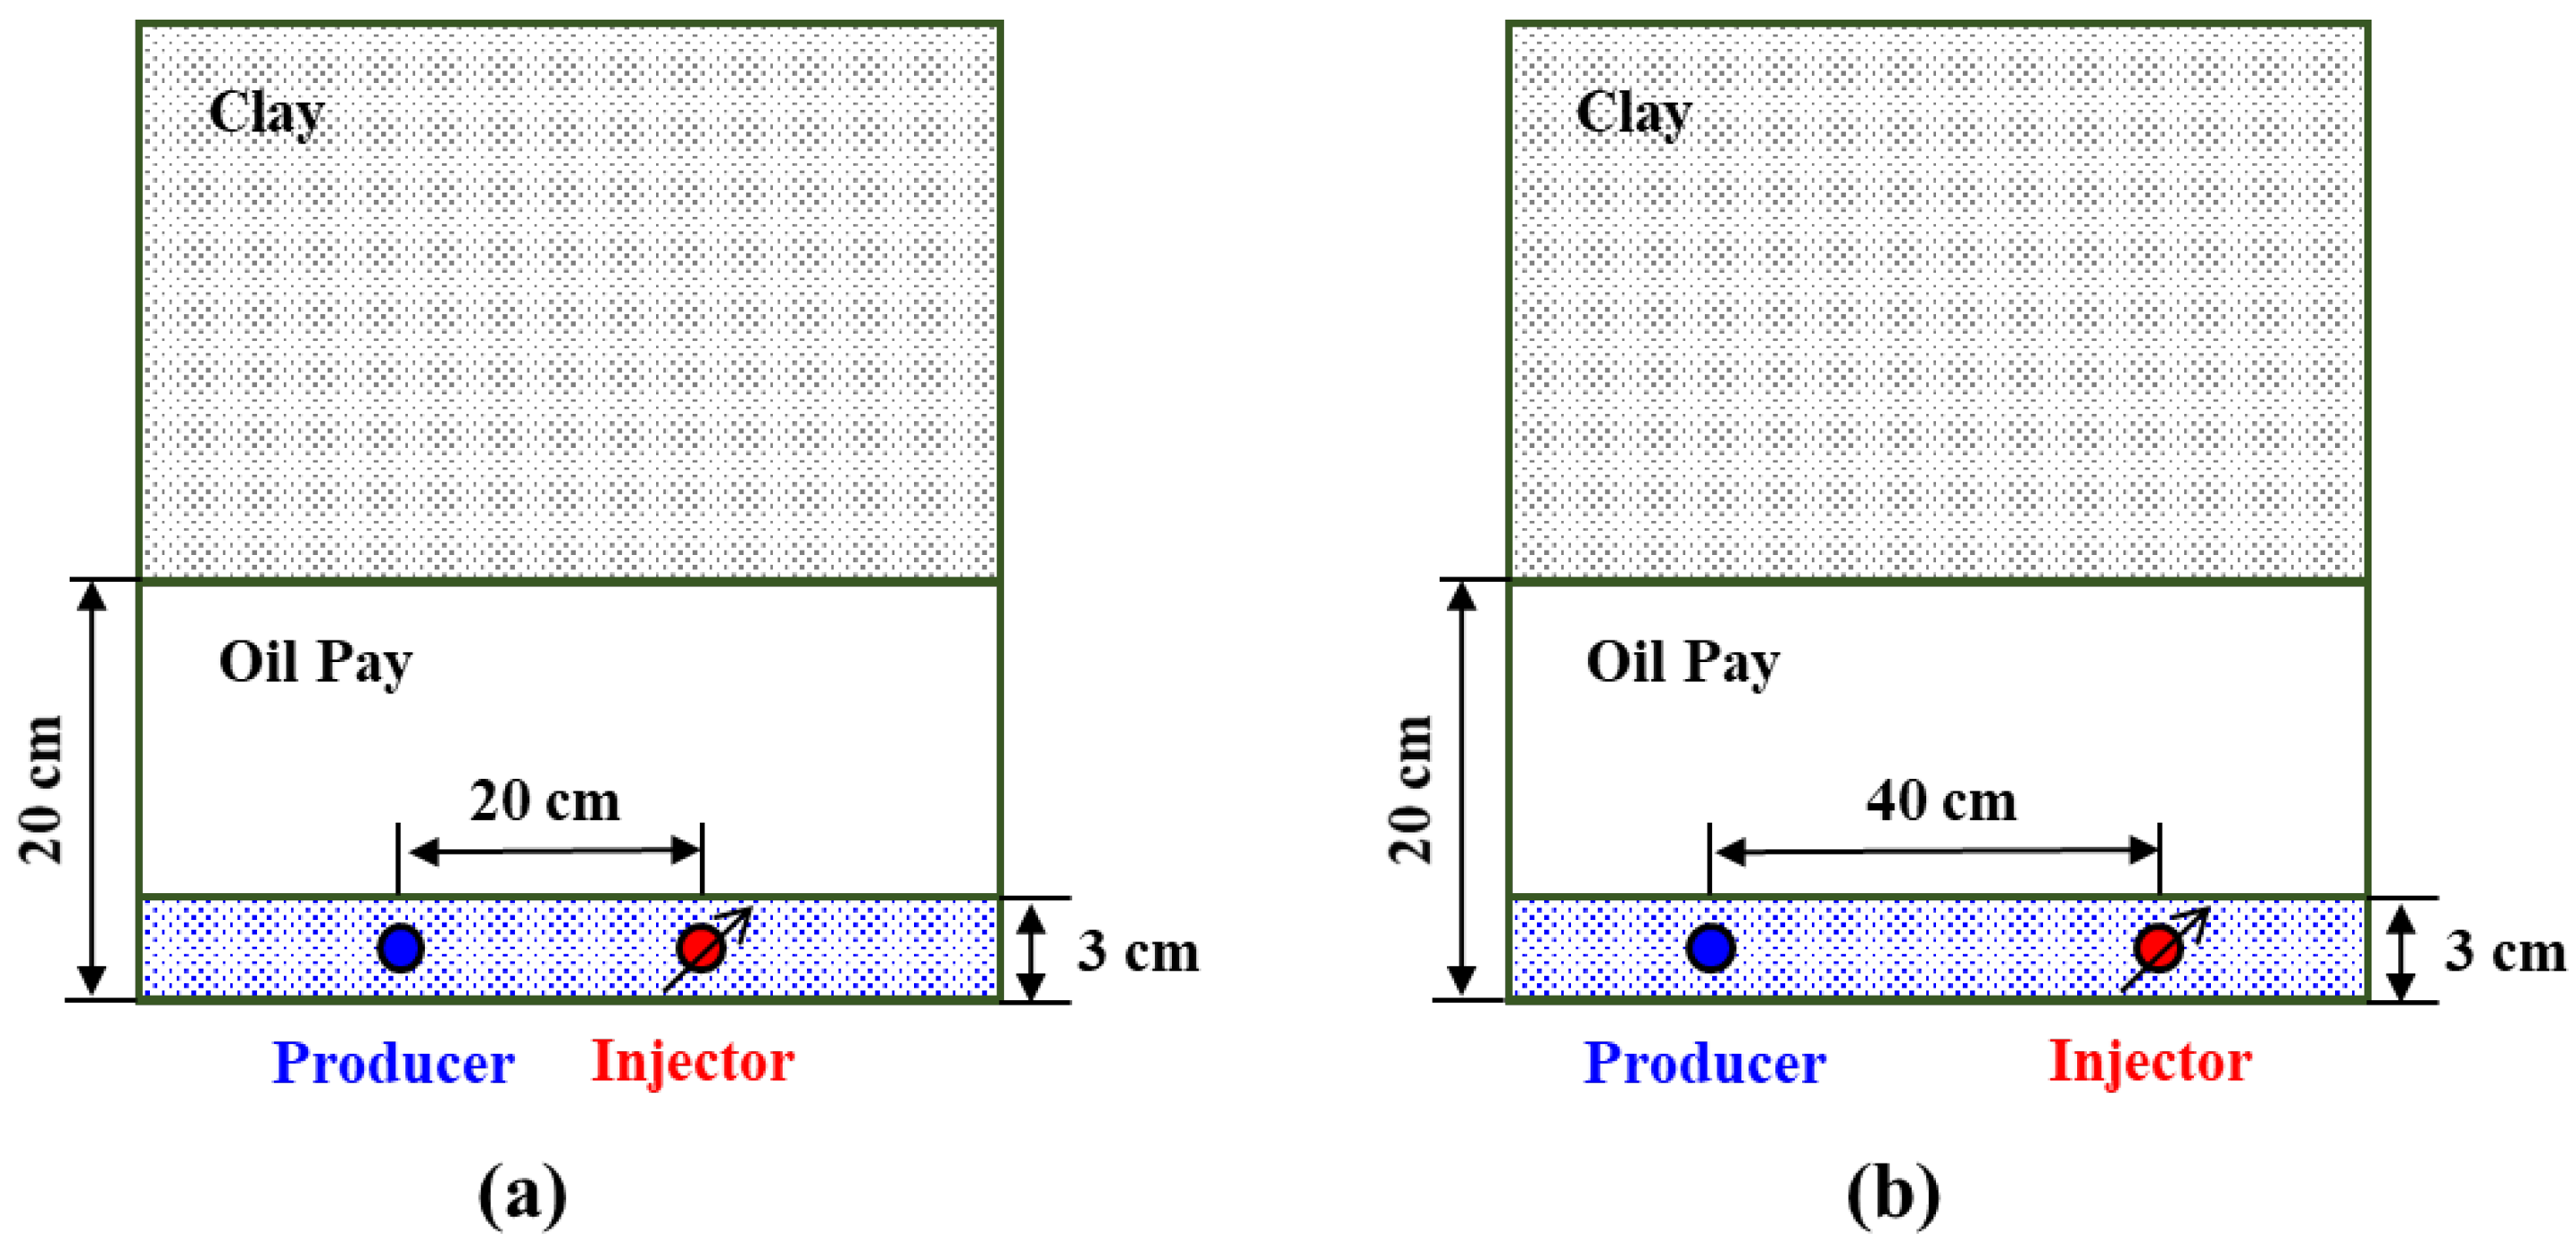
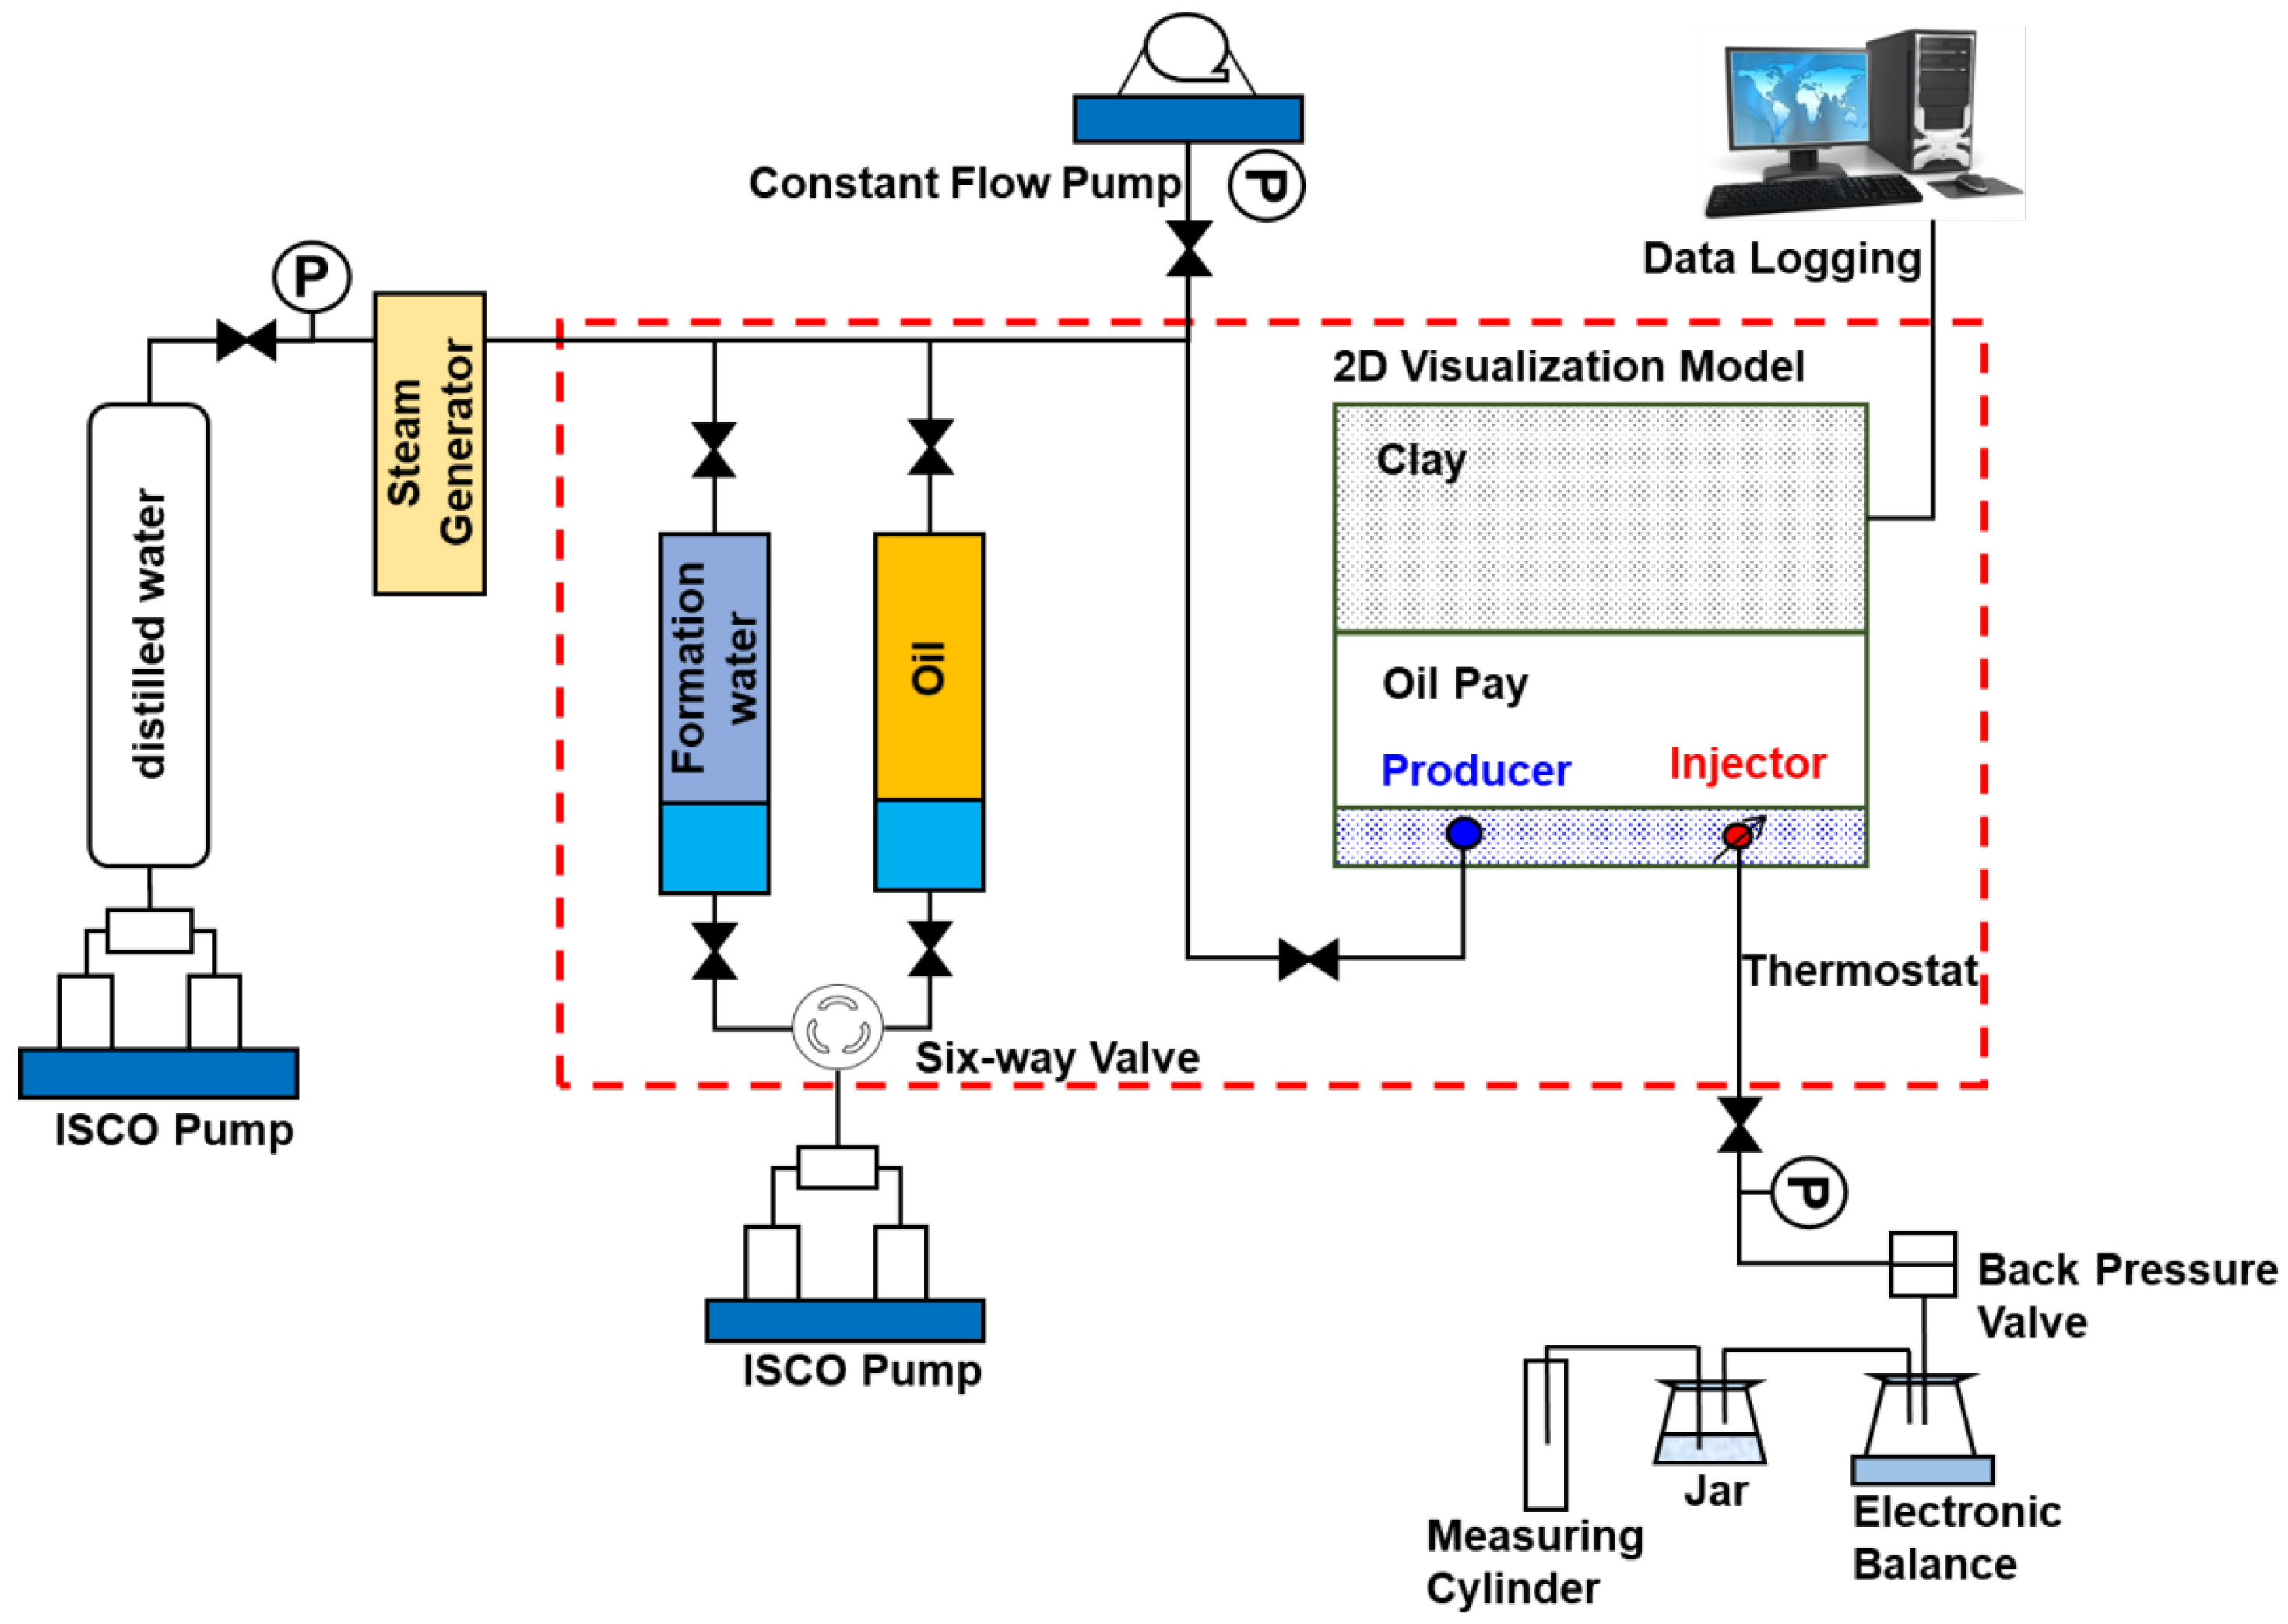
2.1. 2D Physical Simulation Parameters and Procedures

Based on the scaling criteria of geometry, time, and physical mechanisms [1,5], scaled physical model and operation parameters were derived (shown in Table 1). The size of the 2D physical model was 0.5 m × 0.15 m. The oil viscosity was 980 mPa·s at 50 °C. Two schemes of well spacing were simulated including 20 cm and 40 cm.
The sketch map of the 2D physical model is shown in Figure 1. The thicknesses of the oil pay and upper clay layer were 15 cm and 32 cm, respectively. A high-temperature resistant silicon strip with 3 cm width was placed in-between them. The BTZ was 3 cm thick, and its water saturation was 50%. Both the injector and the producer were placed in the BTZ. The horizontal distances between the injector and the producer were 20 cm and 40 cm, respectively. For operating conditions, the steam injection pressure was 1.4 MPa and the back pressure was 1 MPa, corresponding to the steam injection temperature of 190 °C.
The flow chart of 2D physical simulation is illustrated in Figure 2.
The experimental procedures were as follows:
(a)
Before sand packing, a high-temperature resistant silicon strip was preset in the chamber, and the montmorillonite with ultra-fine clay particles was arranged above it to make the model size variable and controllable. According to the experimental scheme, the piston at the back was withdrawn at a distance of 3 cm from the bottom, and then the BTZ was arranged with a thickness of 3 cm and water saturation of 50%. The injector and the producer were pre-deployed at the same height, and a layer of 400 mesh sand screen was set at the well inlet of the producer to prevent sand plugging. Then, the heating rods were arranged near the injector and the producer to preheat the model. The pressure sensors were installed at the outlet and inlet to monitor pressure variation and a back-pressure valve was set at the outlet.
(b)
60–80 mesh quartz sands were prepared. Because high gas–liquid interface tension is detrimental to compacting the sands, during the sand packing process the sands were wetted with a small amount of water to reduce the internal air and compacted layer by layer.
(c)
After packing the sands, the glass plate was covered, and the piston was gradually tightened with the upper and lower valves open to exhaust the air inside the model while the sand layer was compacted. A Vernier caliper was used to measure the piston stroke. When the piston stroke reached about 3 cm, the compaction process stopped and the valve was closed.
(d)
The model was pressurized to test its leak-proof performance.
(e)
After being vacuumed for 6 h, the inside model was saturated with distilled water, and then the heating plate at the back was heated to 50 °C to saturate the oil. The back-pressure valve was open and set at 1 MPa. The total volume of the injected oil was recorded, and then the porosity and oil saturation were calculated.
(f)
After completing the saturated oil, the steam drive was started and the steam injection rate was kept at a water equivalent of 10 mL/min.
(g)
The heating plate was controlled by a program to continuously track and heat the model through the heating system on the back.
(h)
During the experiment process, the data and image acquisition system collected the temperature changes from 81 temperature sensors and the dynamic images of the visual steam chamber development, respectively. Meanwhile, the produced oil and water were collected and recorded.

2.2. 3D Physical Simulation Parameters and Procedures

In order to further analyze the steric steam chamber development and production law of the SDGD process in the BTZ, 3D physical simulation was conducted. In light of the 2D physical simulation results, the well spacing was set as 40 cm. The steam injection pressure and back pressure were controlled at 1.4 MPa and 1.0 MPa, respectively. Similar to 2D physical model, the scaled parameters of the 3D physical model were calculated as follows (Table 2):
In addition to the parameters, the procedures of the 3D physical simulation were almost the same as with the 2D physical simulation.

2.3. Numerical Simulation Settings

Considering the relatively short simulation time and accurate sensitivity analysis, a 2D numerical simulation method was adopted. In the 2D numerical simulations, the typical parameters in Athabasca oil sands were adopted and presented in Table 3. In the basic model, the thickness of the BTZ is 2 m. The injector and producer are placed at the bottom of the BTZ, and the horizontal well spacing is 20 m. The steam injection pressure is 2.5 MPa, and the producer is controlled by 5 °C subcool which reflects the steam–liquid level.
The following research will mention that if the BTZ still maintains similar permeability parameters to the oil reservoir, the SDGD process does not have an advantage over SAGD. Therefore, the subsequent research will focus on the BTZ after dilation stimulation, which helps to form dispersive worm-like microcracks and enhances both the vertical and horizontal permeability between the injector and the producer in relatively shallow oil sand reservoirs with a burial depth of 170–450 m [15,20]. In view of the dilation or hydraulic fracturing stimulation results [15,16,17,18,19,20], the horizontal and vertical permeability of the BTZ are assumed to be 10 D and 6 D, respectively.
Based on the numerical models, the performance of SDGD and conventional SAGD was compared, and a series of sensitivity analysis were carried out including horizontal and vertical well spacing, oil viscosity, shale laminae distribution, and BTZ properties such as its horizontal and vertical permeability, thickness, water saturation, the extend range, etc.

3. Results and Discussion

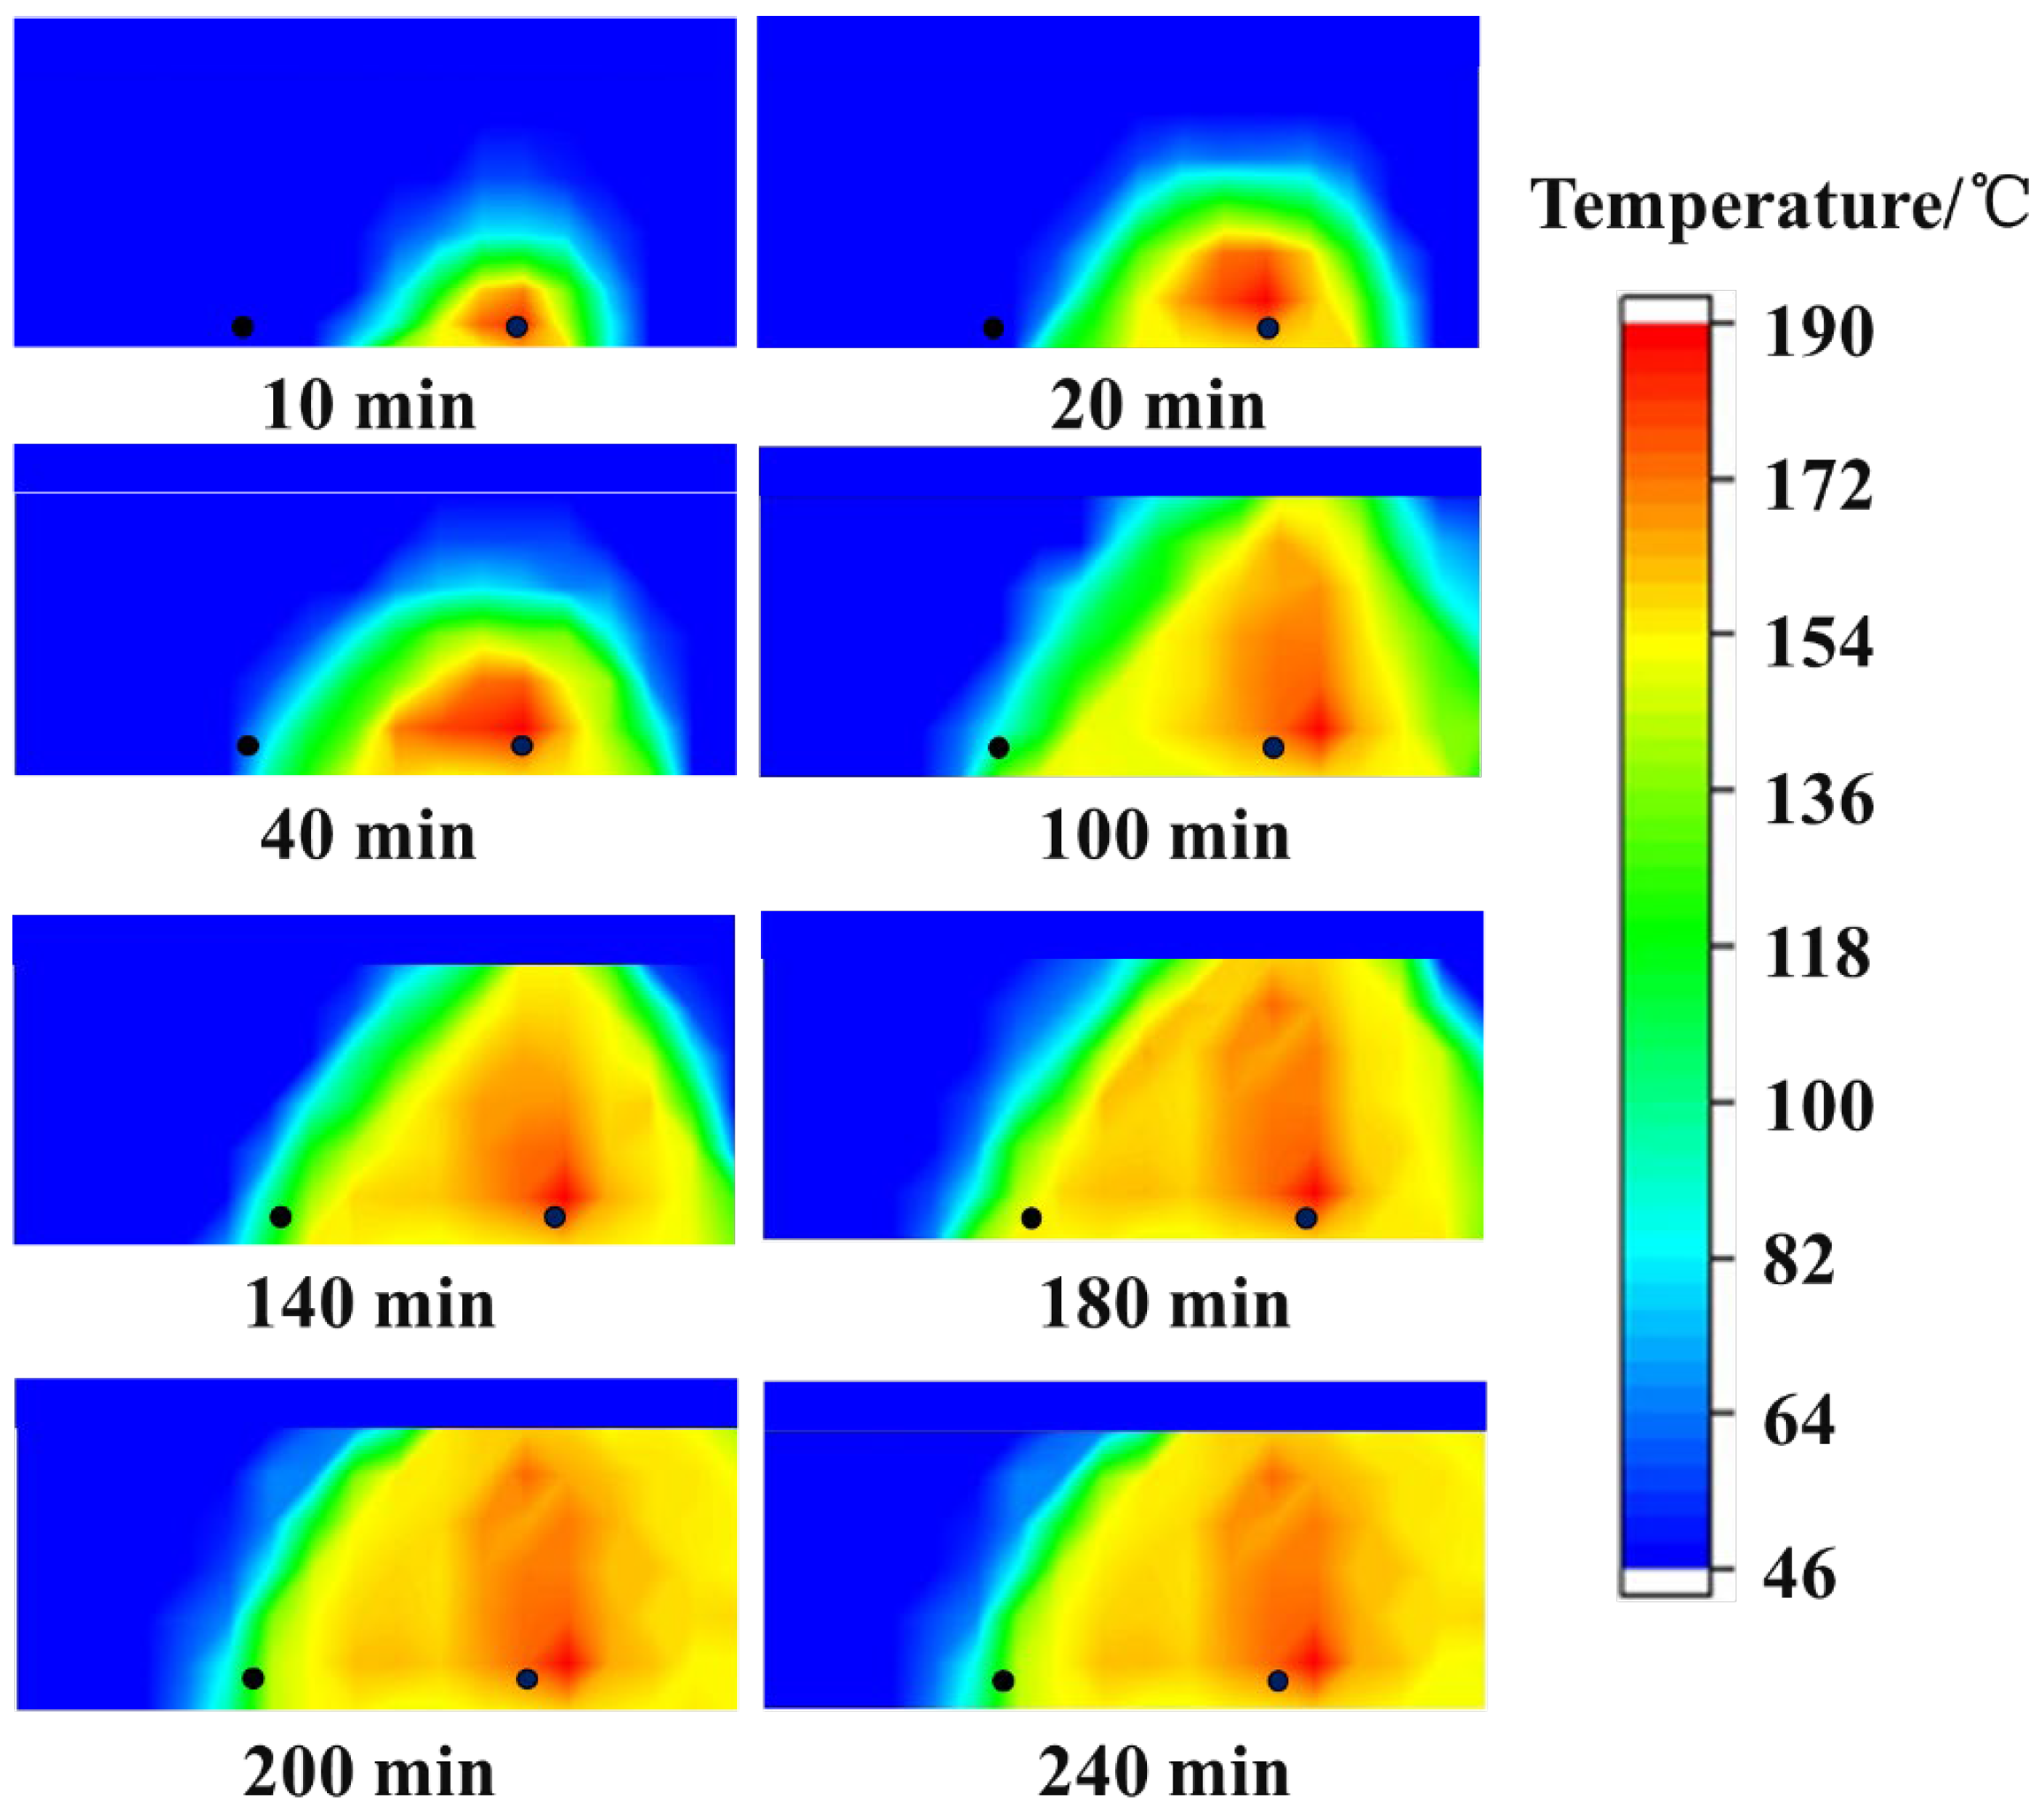
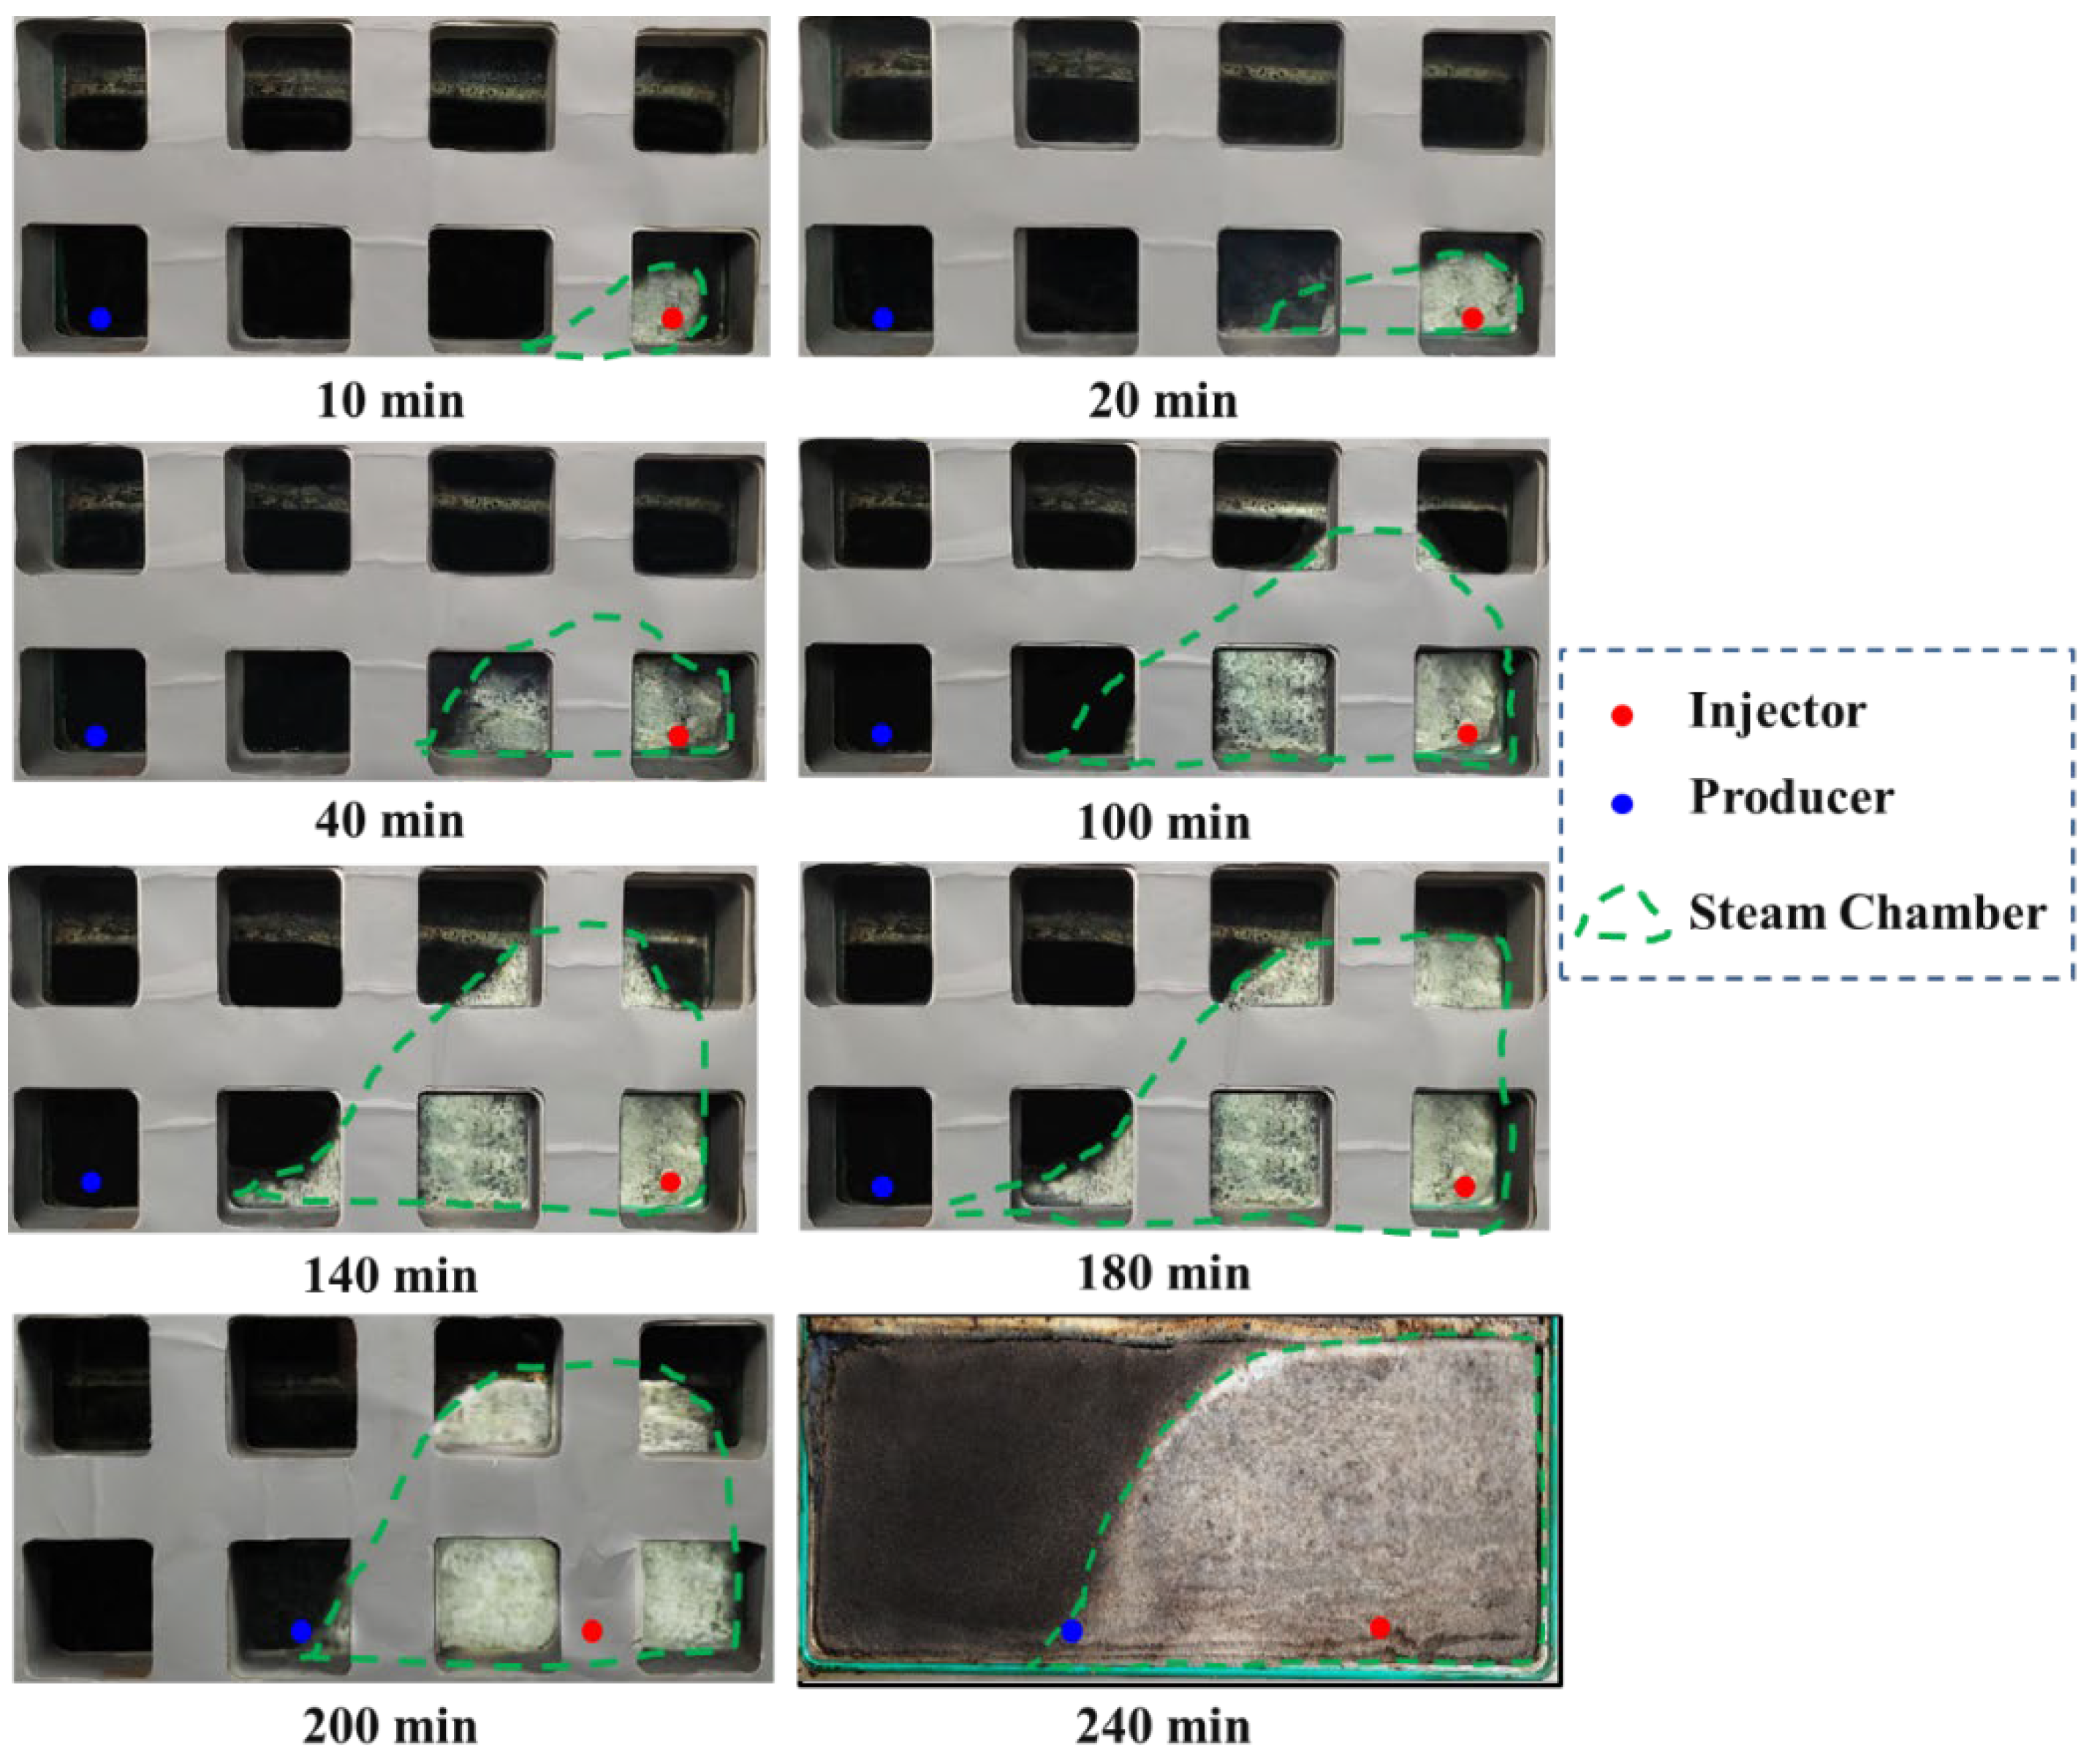
3.1. 2D Physical Simualtions

For the 20 cm well spacing, the steam chamber development versus time reflected by temperature and oil saturation are shown in Figure 3 and Figure 4. The temperature and oil saturation profiles show good consistency, and the steam chamber development can be divided into three stages.
Initially, the steam chamber was first formed near the injector. Under the synergistic effect of the high-mobility zone and the injection–production pressure difference, the steam front gradually moved towards the producer. Apparently, it is necessary to enforce a relatively low inter-well pressure difference to restrict the steam movement speed towards the producer and promote the vertical steam chamber growth.
Then, the vertical steam chamber began to develop under the action of steam override. The heated oil and condensed steam drained downwards to the BTZ and flowed to the producer under the synergistic effect of gravity and inter-well pressure difference. At this time, the steam chamber profile from the injector to the producer presents a downward-dip shape.
Finally, when the steam chamber reached the reservoir top, the lateral steam chamber developed faster and a large amount of heated oil was produced. However, the lateral steam chamber gradually stopped when it approached the vertical line of the producer.
For the 40 cm well spacing, the steam chamber development versus time reflected by temperature and oil saturation are shown in Figure 5 and Figure 6, and they also show good consistency. By comparing the two experimental schemes, when the well spacing increases from 20 cm to 40 cm, the steam chamber development law is basically the same, but the lateral steam chamber development accelerates while the vertical steam chamber growth slightly slows down.
The production indicators for the 20 cm and 40 cm well spacings are presented in Figure 7, Figure 8, Figure 9 and Figure 10, including oil rate, CSOR, water cut, and recovery factor. Compared with the 20 cm well spacing, the 40 cm well spacing achieves a similar and slightly delayed peak oil rate but a longer duration time of stable oil production (Figure 7) and a lower CSOR (Figure 8) and water cut (Figure 9), as well as a higher recovery factor (Figure 10). Therefore, the experimental results demonstrate that a 40 cm well spacing scheme is relatively better.

3.2. 3D Physical Simualtion

Figure 11 presents the lateral steam chamber development for the SDGD process in the BTZ with a 40 cm well spacing. The characteristics of steam chamber development in the early, middle, and late stage are basically consistent with the 2D physical model. Figure 12 also shows good steam chamber conformity along the horizontal section.
In the early stage, the steam chamber was first formed near the injector, and then the steam front gradually moved towards the producer mainly by horizontal steam drive (Figure 11). During this period, oil production rate ramped up rapidly to 9.4 mL/min (Figure 13) and the water cut decreased quickly to 72.4% (Figure 14).
In the middle stage, the vertical steam chamber began to grow, and the top oil was heated by the overlying steam. Under the synergistic effect of steam drive and gravity drainage, the heated oil drained to the BTZ and flowed to the producer (Figure 11). Then, the steam chamber reached the reservoir top and began to develop laterally. During this period, both the daily oil production and water cut were relatively stable, maintaining at about 7.7 mL/min and 77%, respectively (Figure 13 and Figure 14).
In the late stage, the lateral development of the steam chamber slowed down and gradually stopped (Figure 11 and Figure 12). During this wind-down stage, the oil production rate rapidly dropped from 6.2 mL/min to 1.2 mL/min (Figure 13), and the water cut rapidly rose from 80% to 95% (Figure 14).

3.3. 2D Numerical Simulations

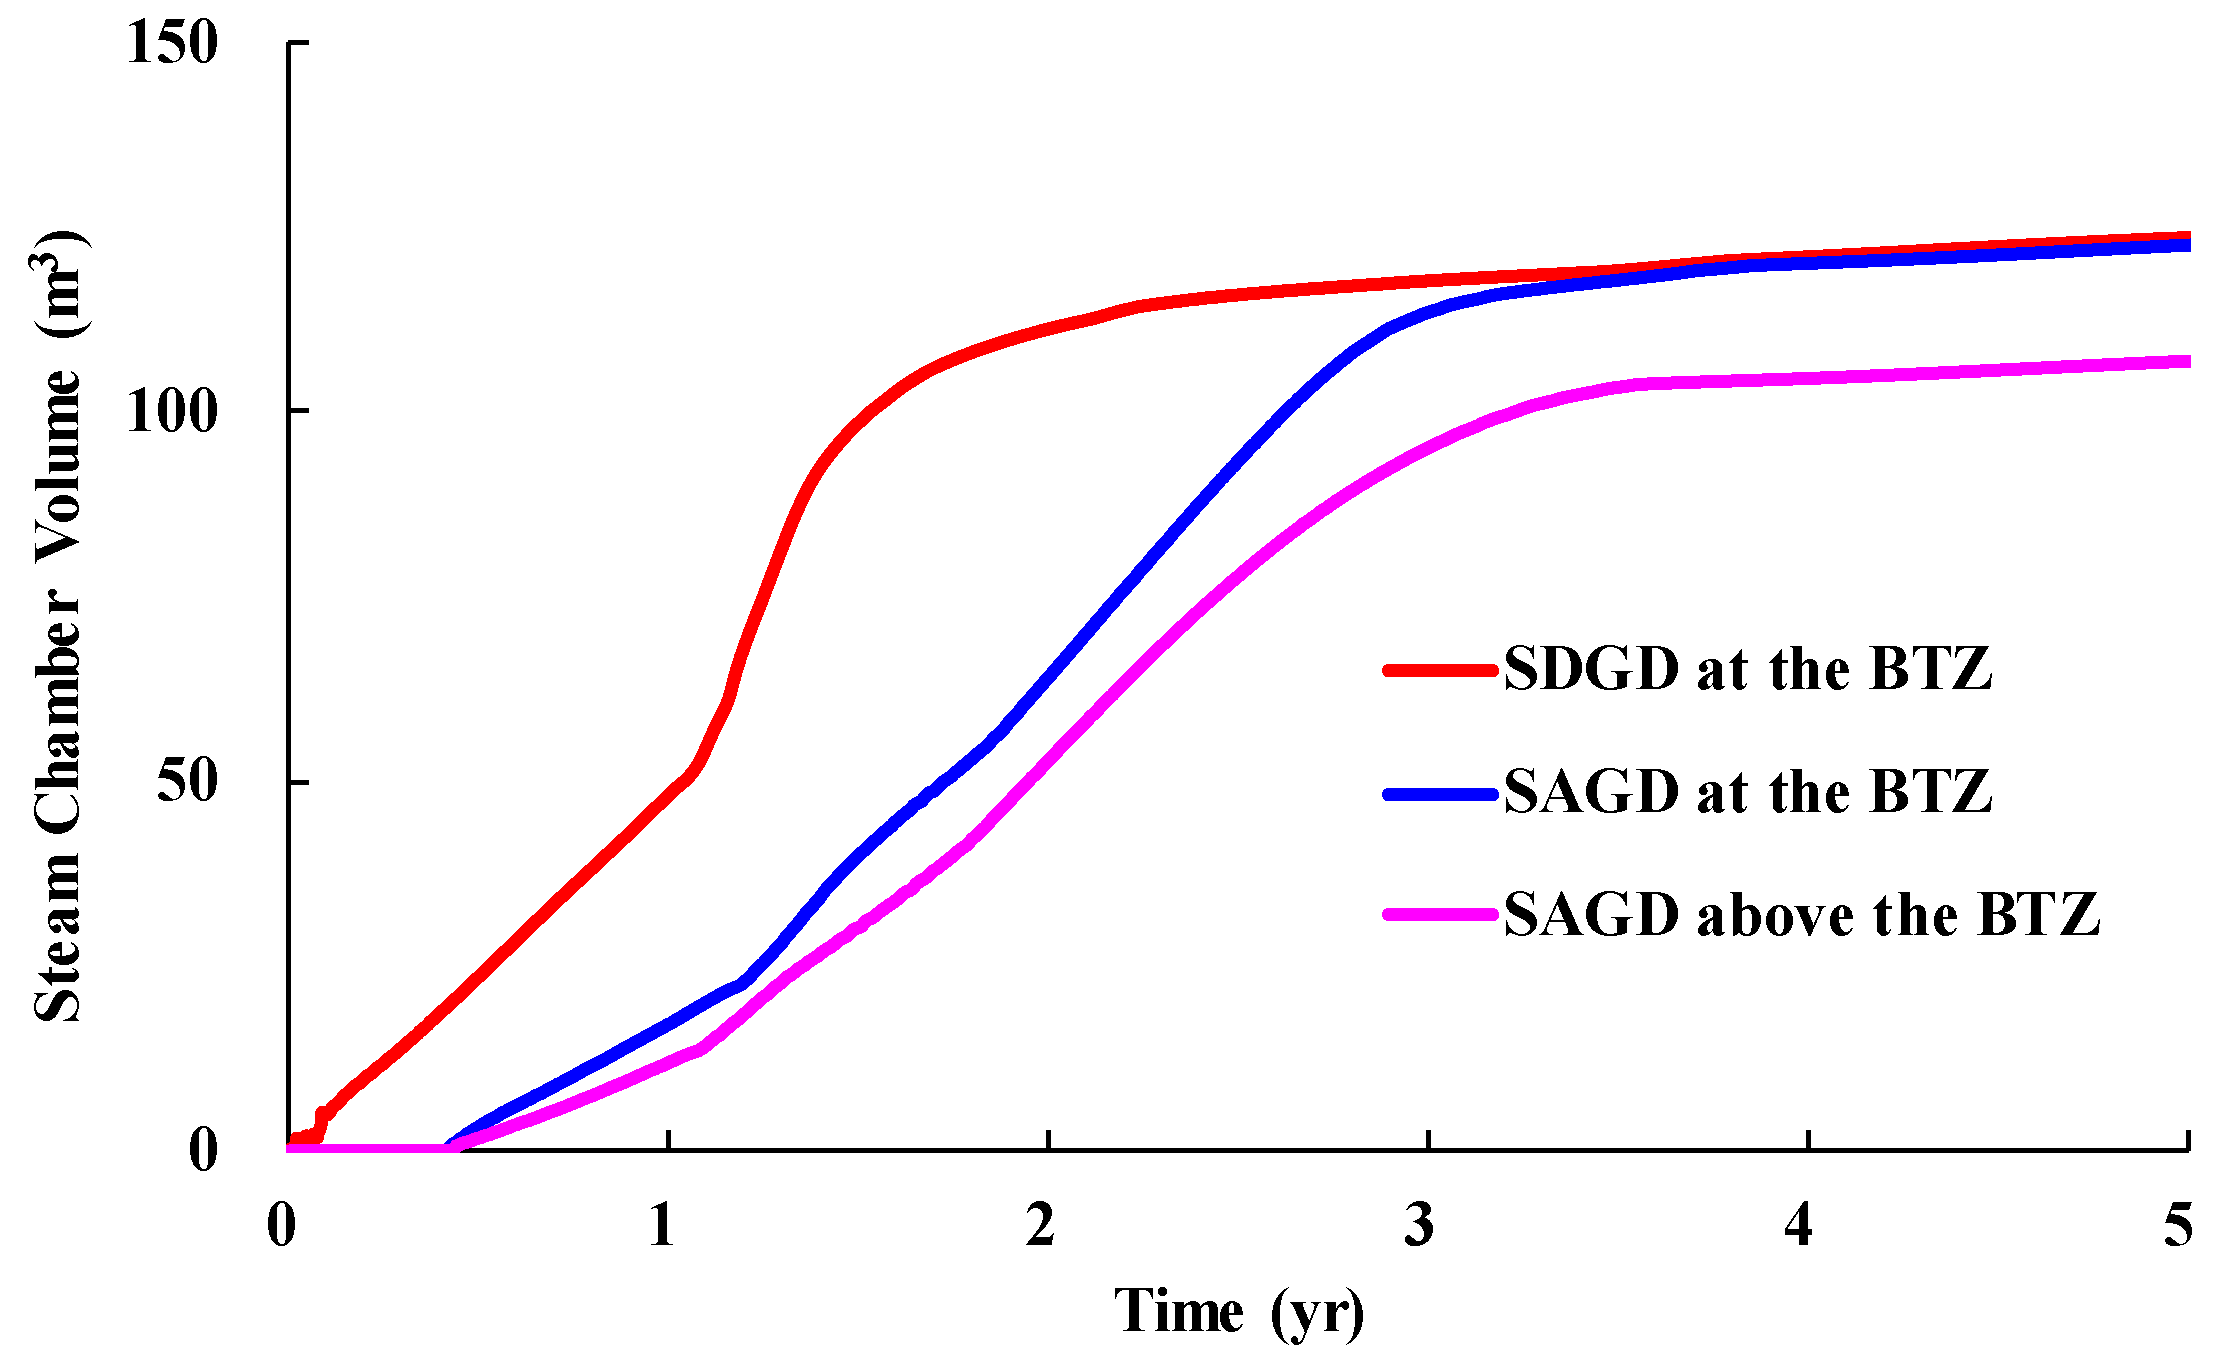
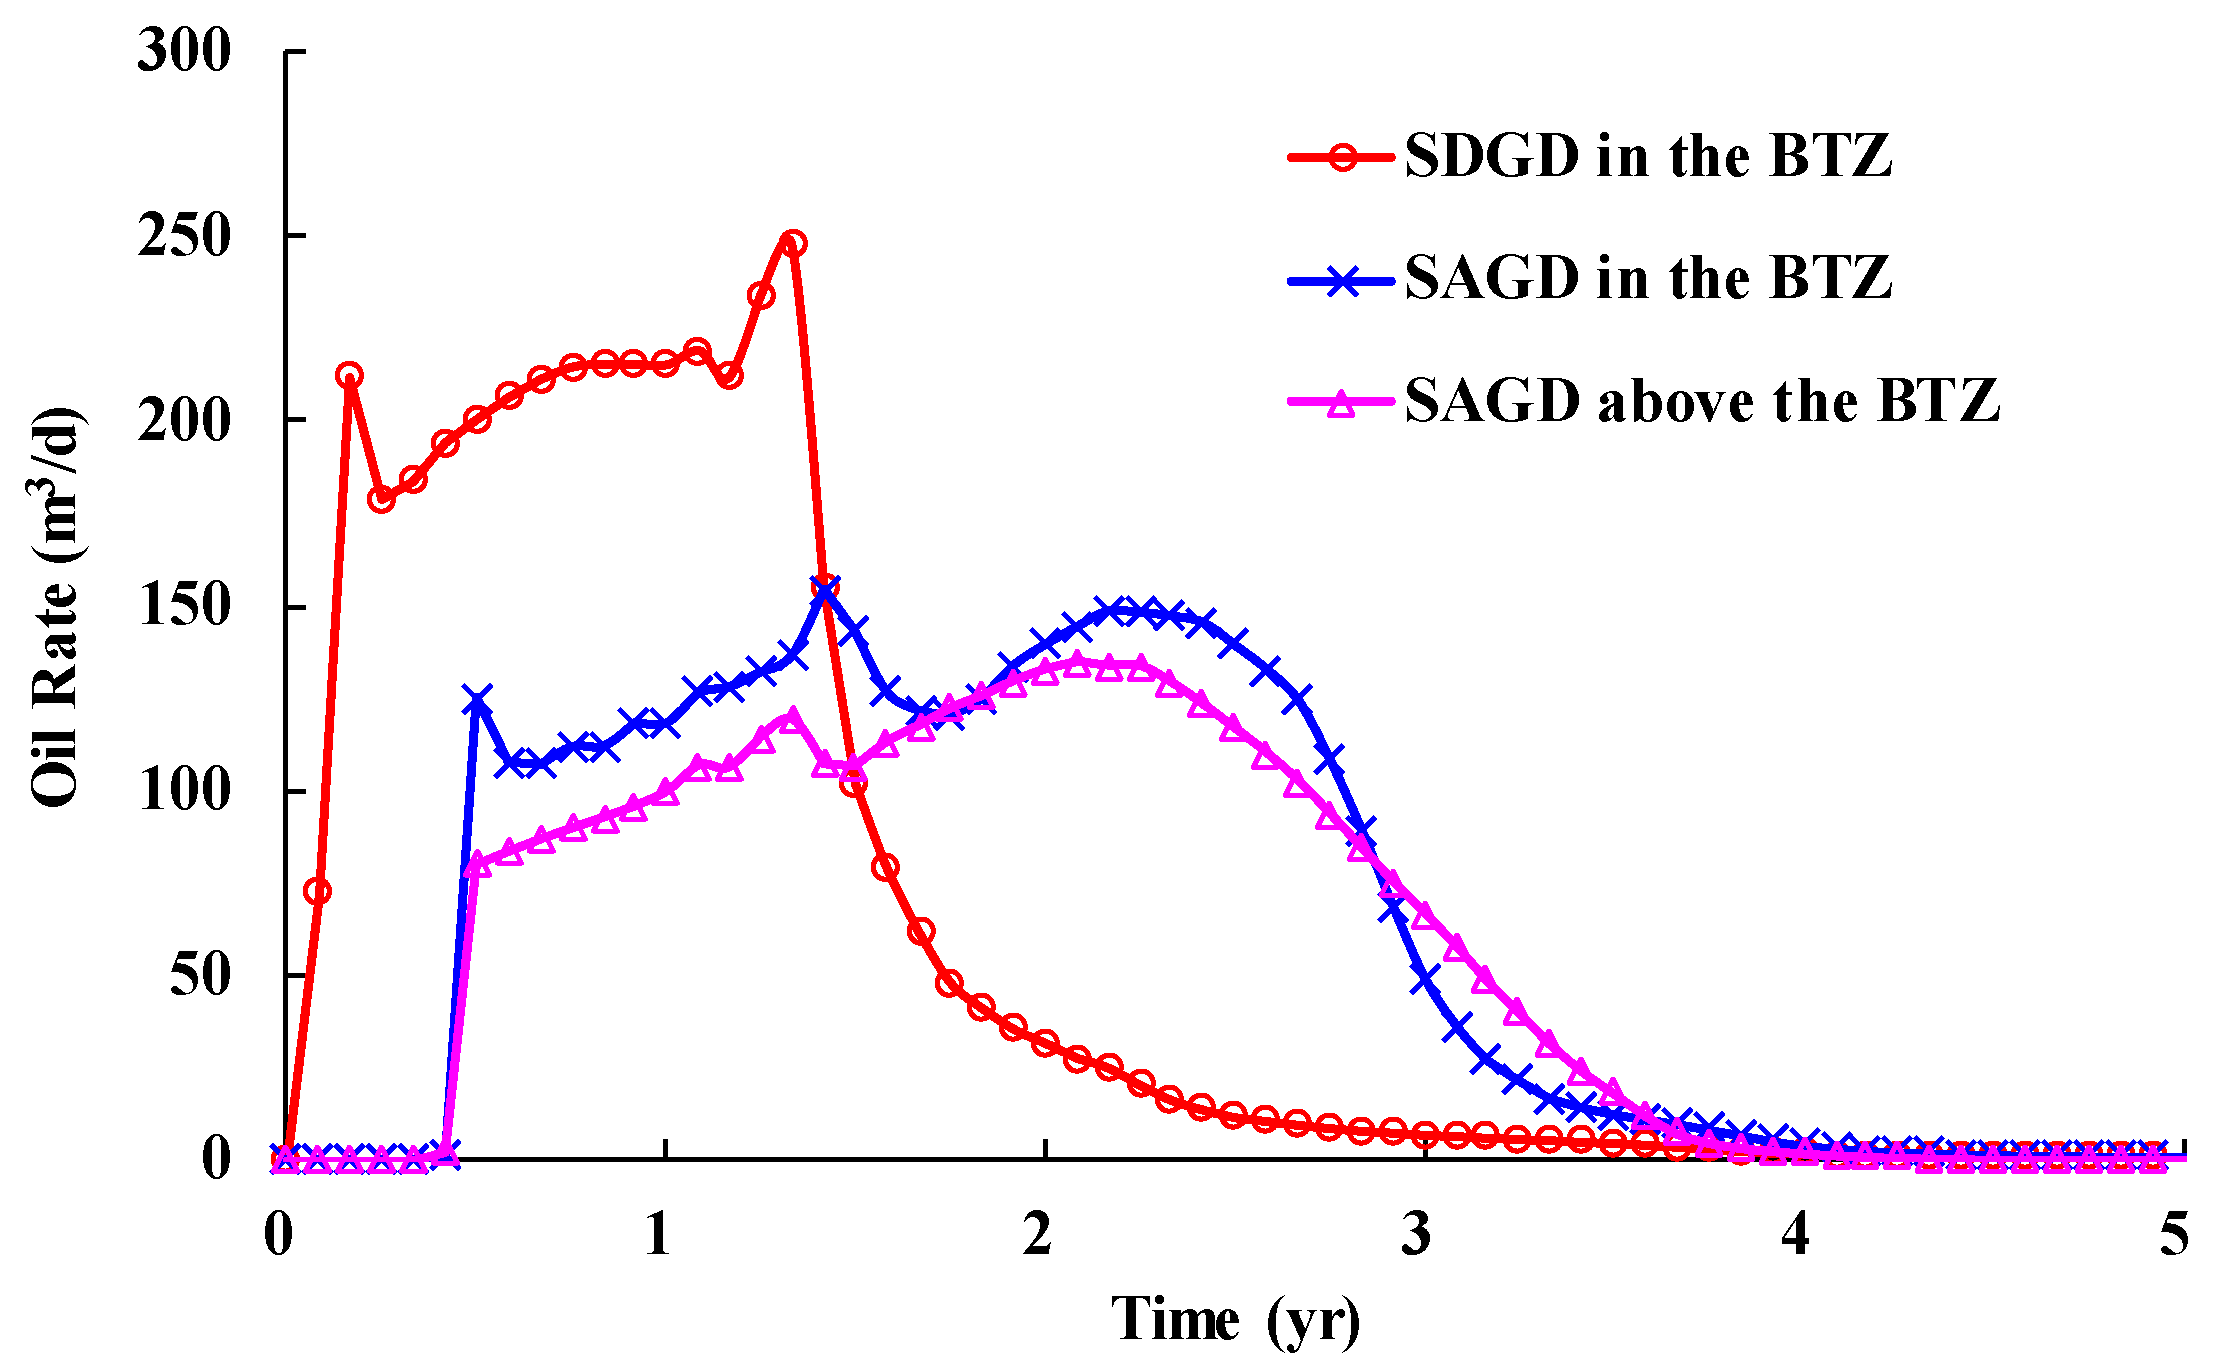
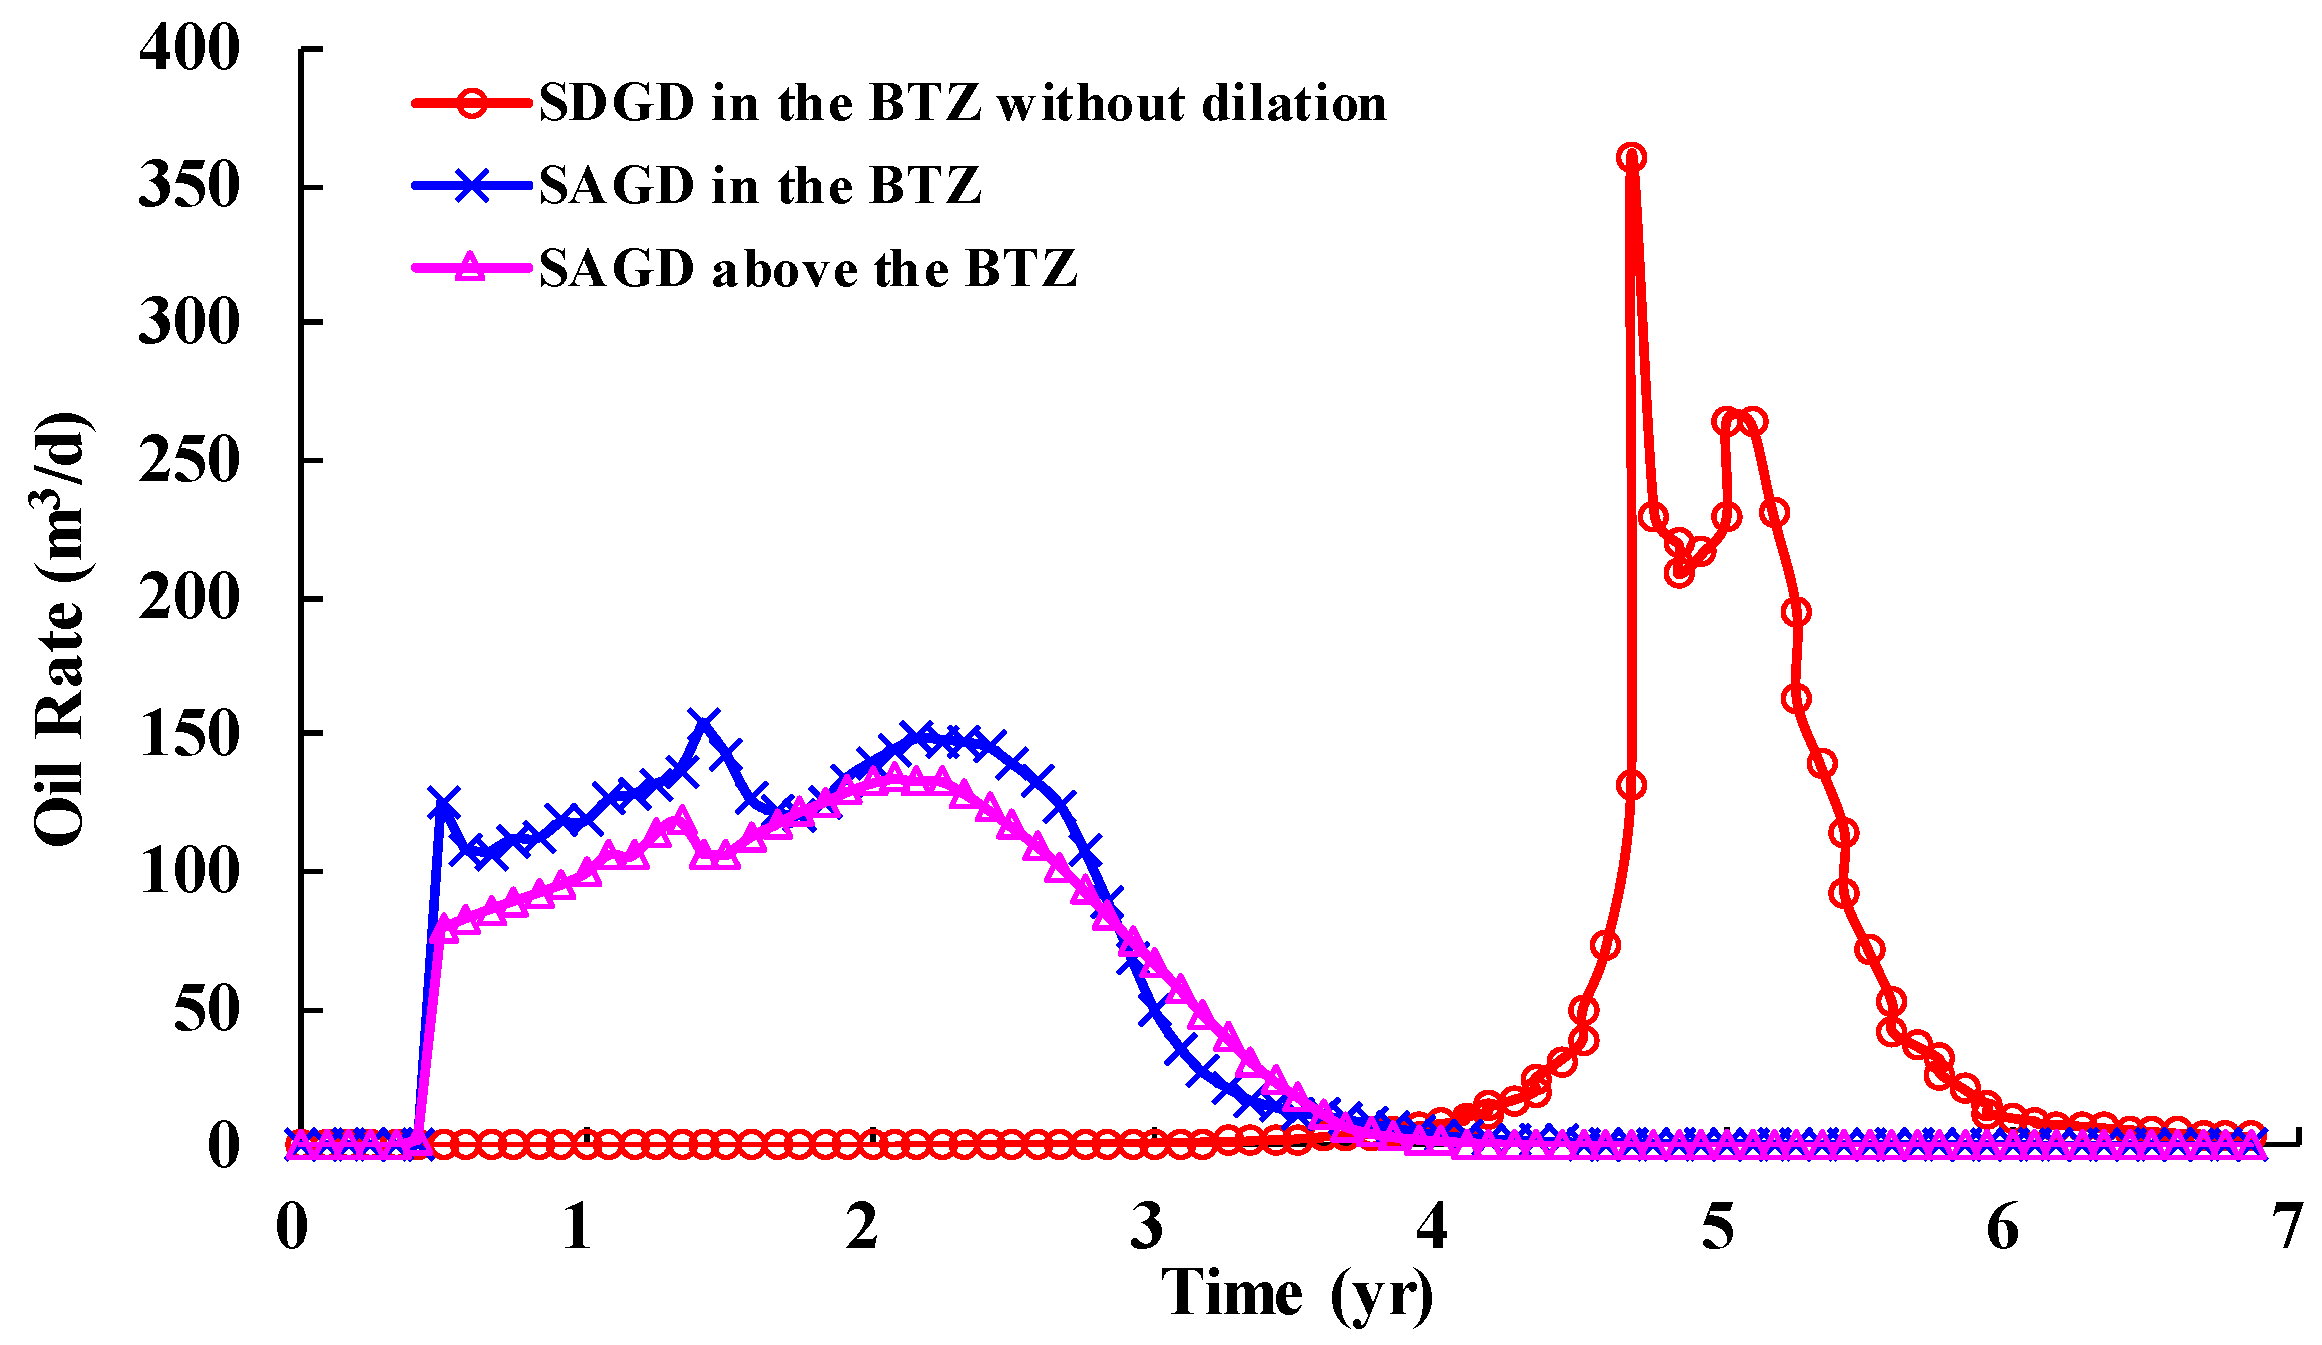
3.3.1. SDGD versus SAGD

Three numerical simulation schemes were designed:
  • SDGD in the BTZ;
  • SAGD with the producer placed in the BTZ;
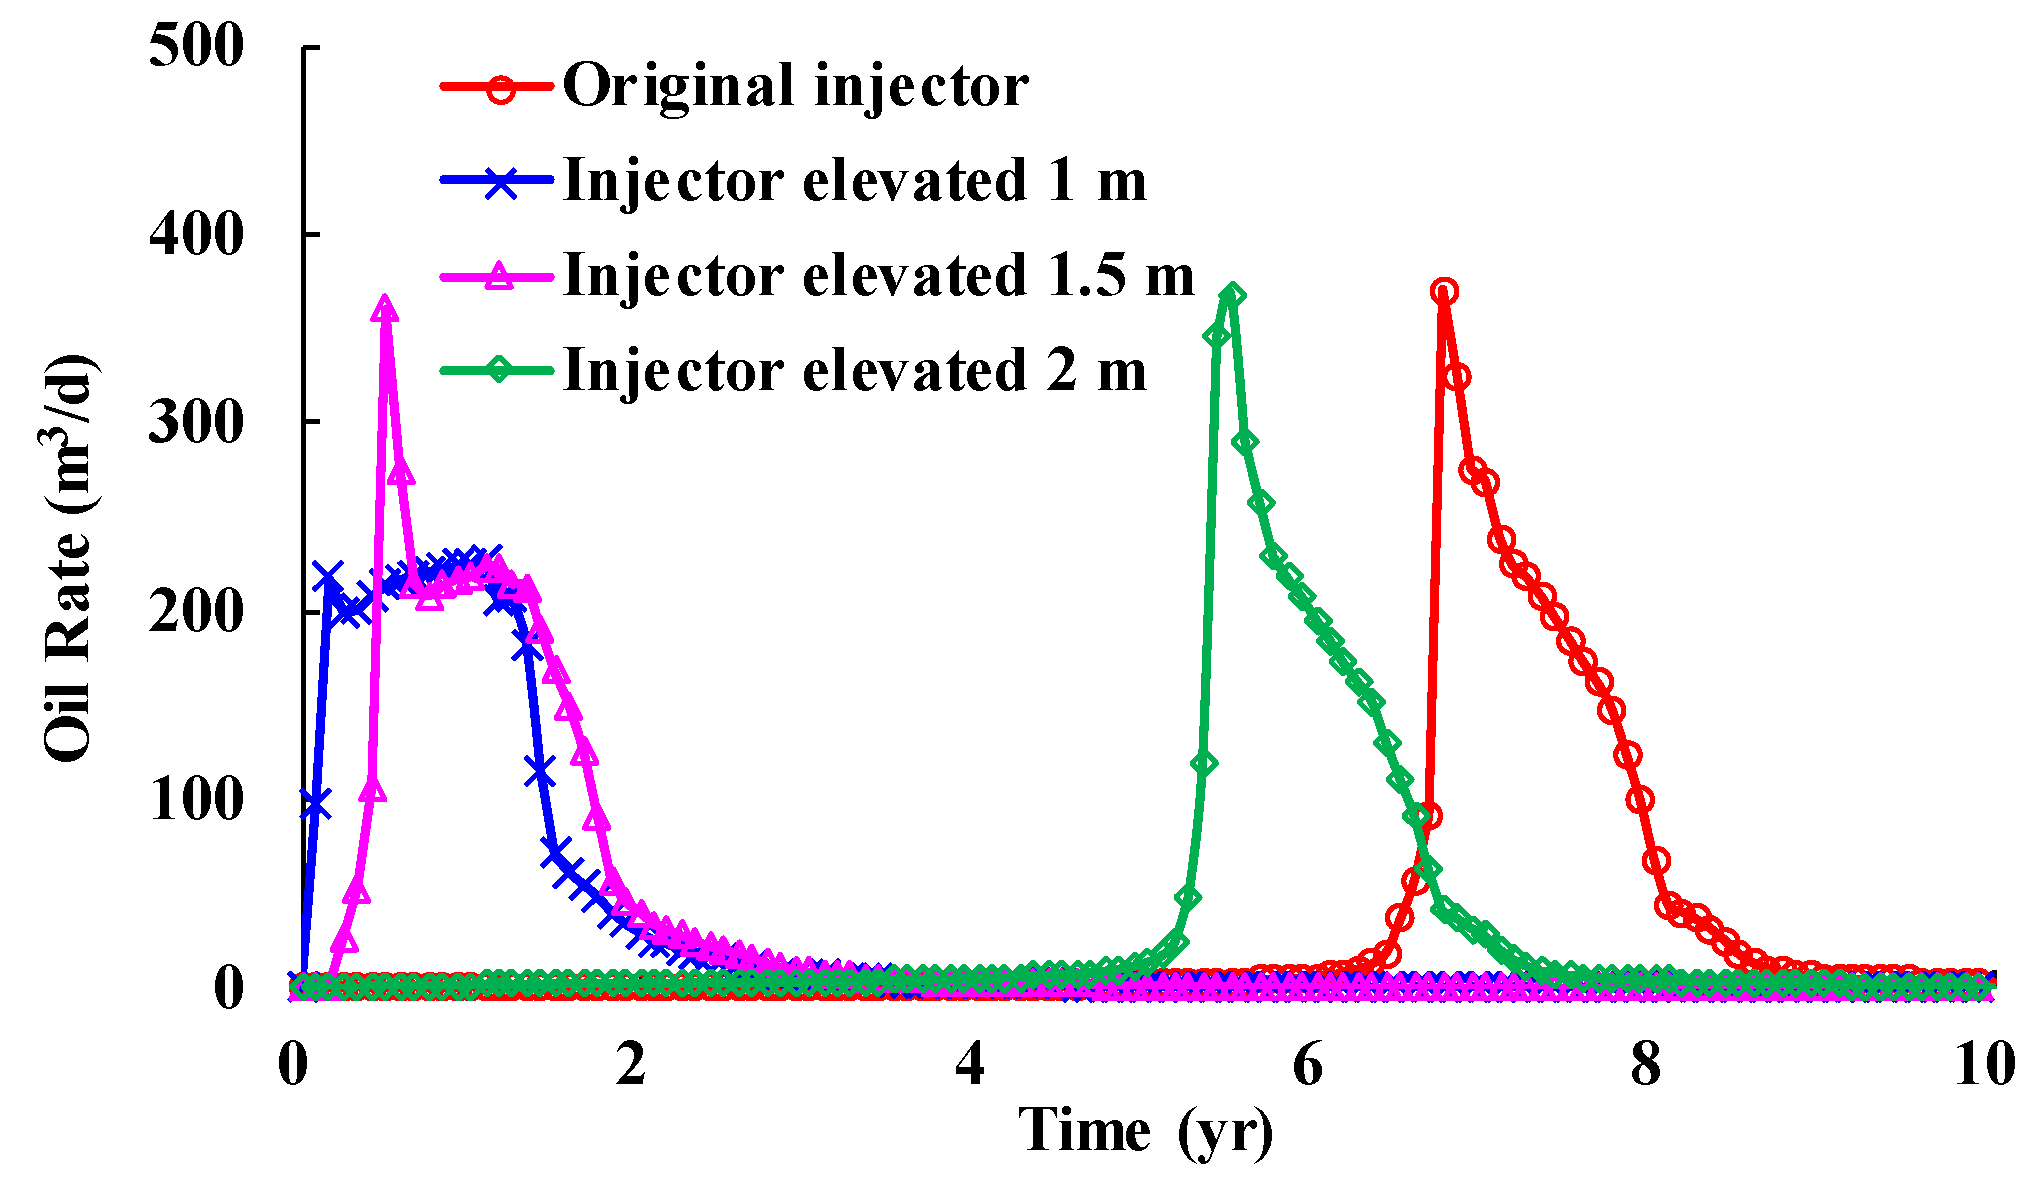
  • SAGD with the producer placed 1 m above the BTZ.
For SDGD, both the injector and producer were placed in the BTZ, while for SAGD, the well spacing was kept at 5 m.
If there is no dilation stimulation in the BTZ, for 20 m well spacing, oil production starts after 4 years, and SAGD is inferior to SDGD (Figure 15). Notably, all the later-mentions of SDGD refer to the BTZ after steam stimulation.
As shown in Figure 16, the steam chamber development law in the SDGD process in the BTZ is basically consistent with the 2D and 3D physical simulations. Compared with SAGD (Figure 17), the flat steam chamber shale reflects faster lateral steam chamber development. When the vertical steam chamber touches the pay top, most of the area has been swept, and this means a larger steam chamber volume is achieved (Figure 18). For two SAGD processes, the oil rate is higher when the producer is placed in the BTZ (Figure 19). By contrast, SDGD in the BTZ achieves a higher oil rate, a larger steam chamber volume, and a lower CSOR than both SAGD processes (Figure 20).

3.3.2. Horizontal and Vertical Well Spacing

To evaluate the influence of well spacing on SDGD performance, the horizontal well spacing was set as 20 m and 25 m, and each involved four vertical well spacings corresponding to the injector elevated by 0 m, 1 m, 1.5 m, and 2 m while the producer was unchanged.
Figure 21 shows that for a 20 m horizontal spacing, the producer starts quickly and achieves a similar oil rate within the vertical spacing of 0–2 m. Conversely, in Figure 22, for a 25 m horizontal spacing, the start-up timing of the producer is delayed by about 6 years for the injector and producer on the same level, or 5 years for the vertical spacing of 2 m. However, it is significantly advanced when the vertical well spacing is 1–1.5 m, and this is because it not only fully utilizes the BTZ to improve steam injection capacity, but also better balances the steam chamber growth around the injector and inter-well displacement effect.

3.3.3. Oil Viscosity

To evaluate the influence of oil viscosity on SDGD performance, based on a 25 m horizontal well spacing, three sets of viscosity–temperature curves were considered: the basic scheme, with overall viscosity decreased by 5 times and 10 times, corresponding to the original viscosity of 5.24 × 10⁶ mPa·s, 1.048 × 10⁶ mPa·s, and 5.24 × 10⁵ mPa·s.
The comparison results show that the start-up timing of the producer was advanced and the peak oil rate was higher with the decrease in viscosity (Figure 23).

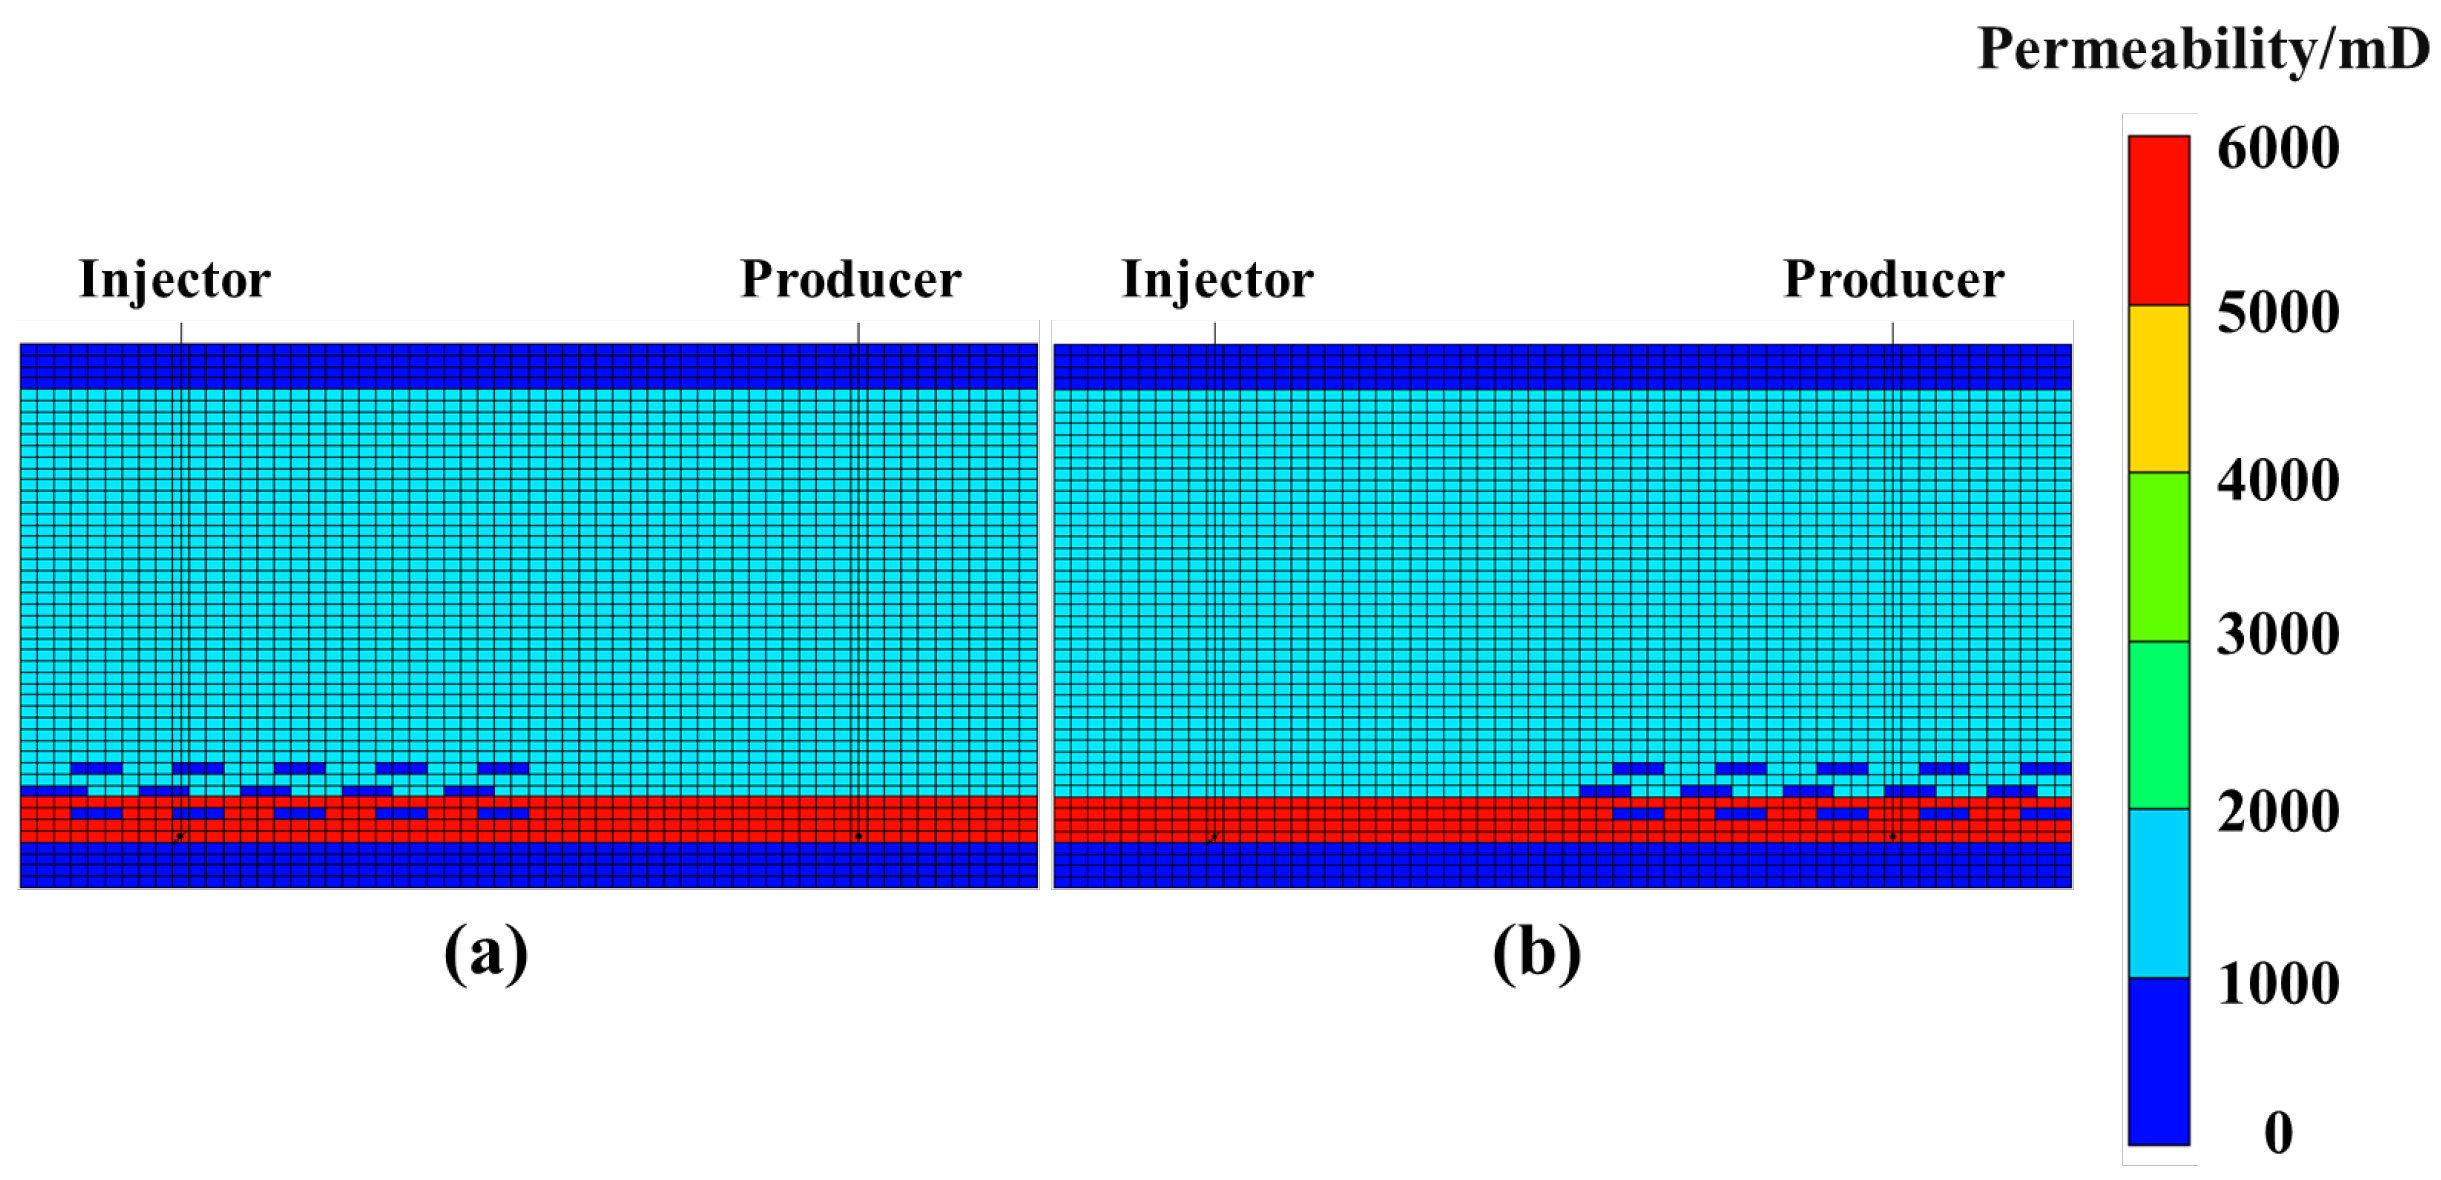
3.3.4. Shale Laminae Distribution

There are usually varying frequencies and locations of shale laminae distributed in the oil sand reservoirs [21]. In order to analyze the influence of shale laminae distribution, two schemes were designed: one with the shale laminae distributed above the injector, and one with the shale laminae distributed above the producer (Figure 24).
Figure 25 and Figure 26 present the comparison of steam chamber development and oil rate between two schemes of shale laminae distribution, respectively. For shale laminae distributed above the injector, the steam chamber can easily bypass the shale laminae due to steam overlay effect. However, for shale laminae distributed above the producer, both steam chamber development and early oil production are delayed due to gravity drainage seriously hindered by the shale laminae, and this causes larger adverse effects than shale laminae distributed above the injector.

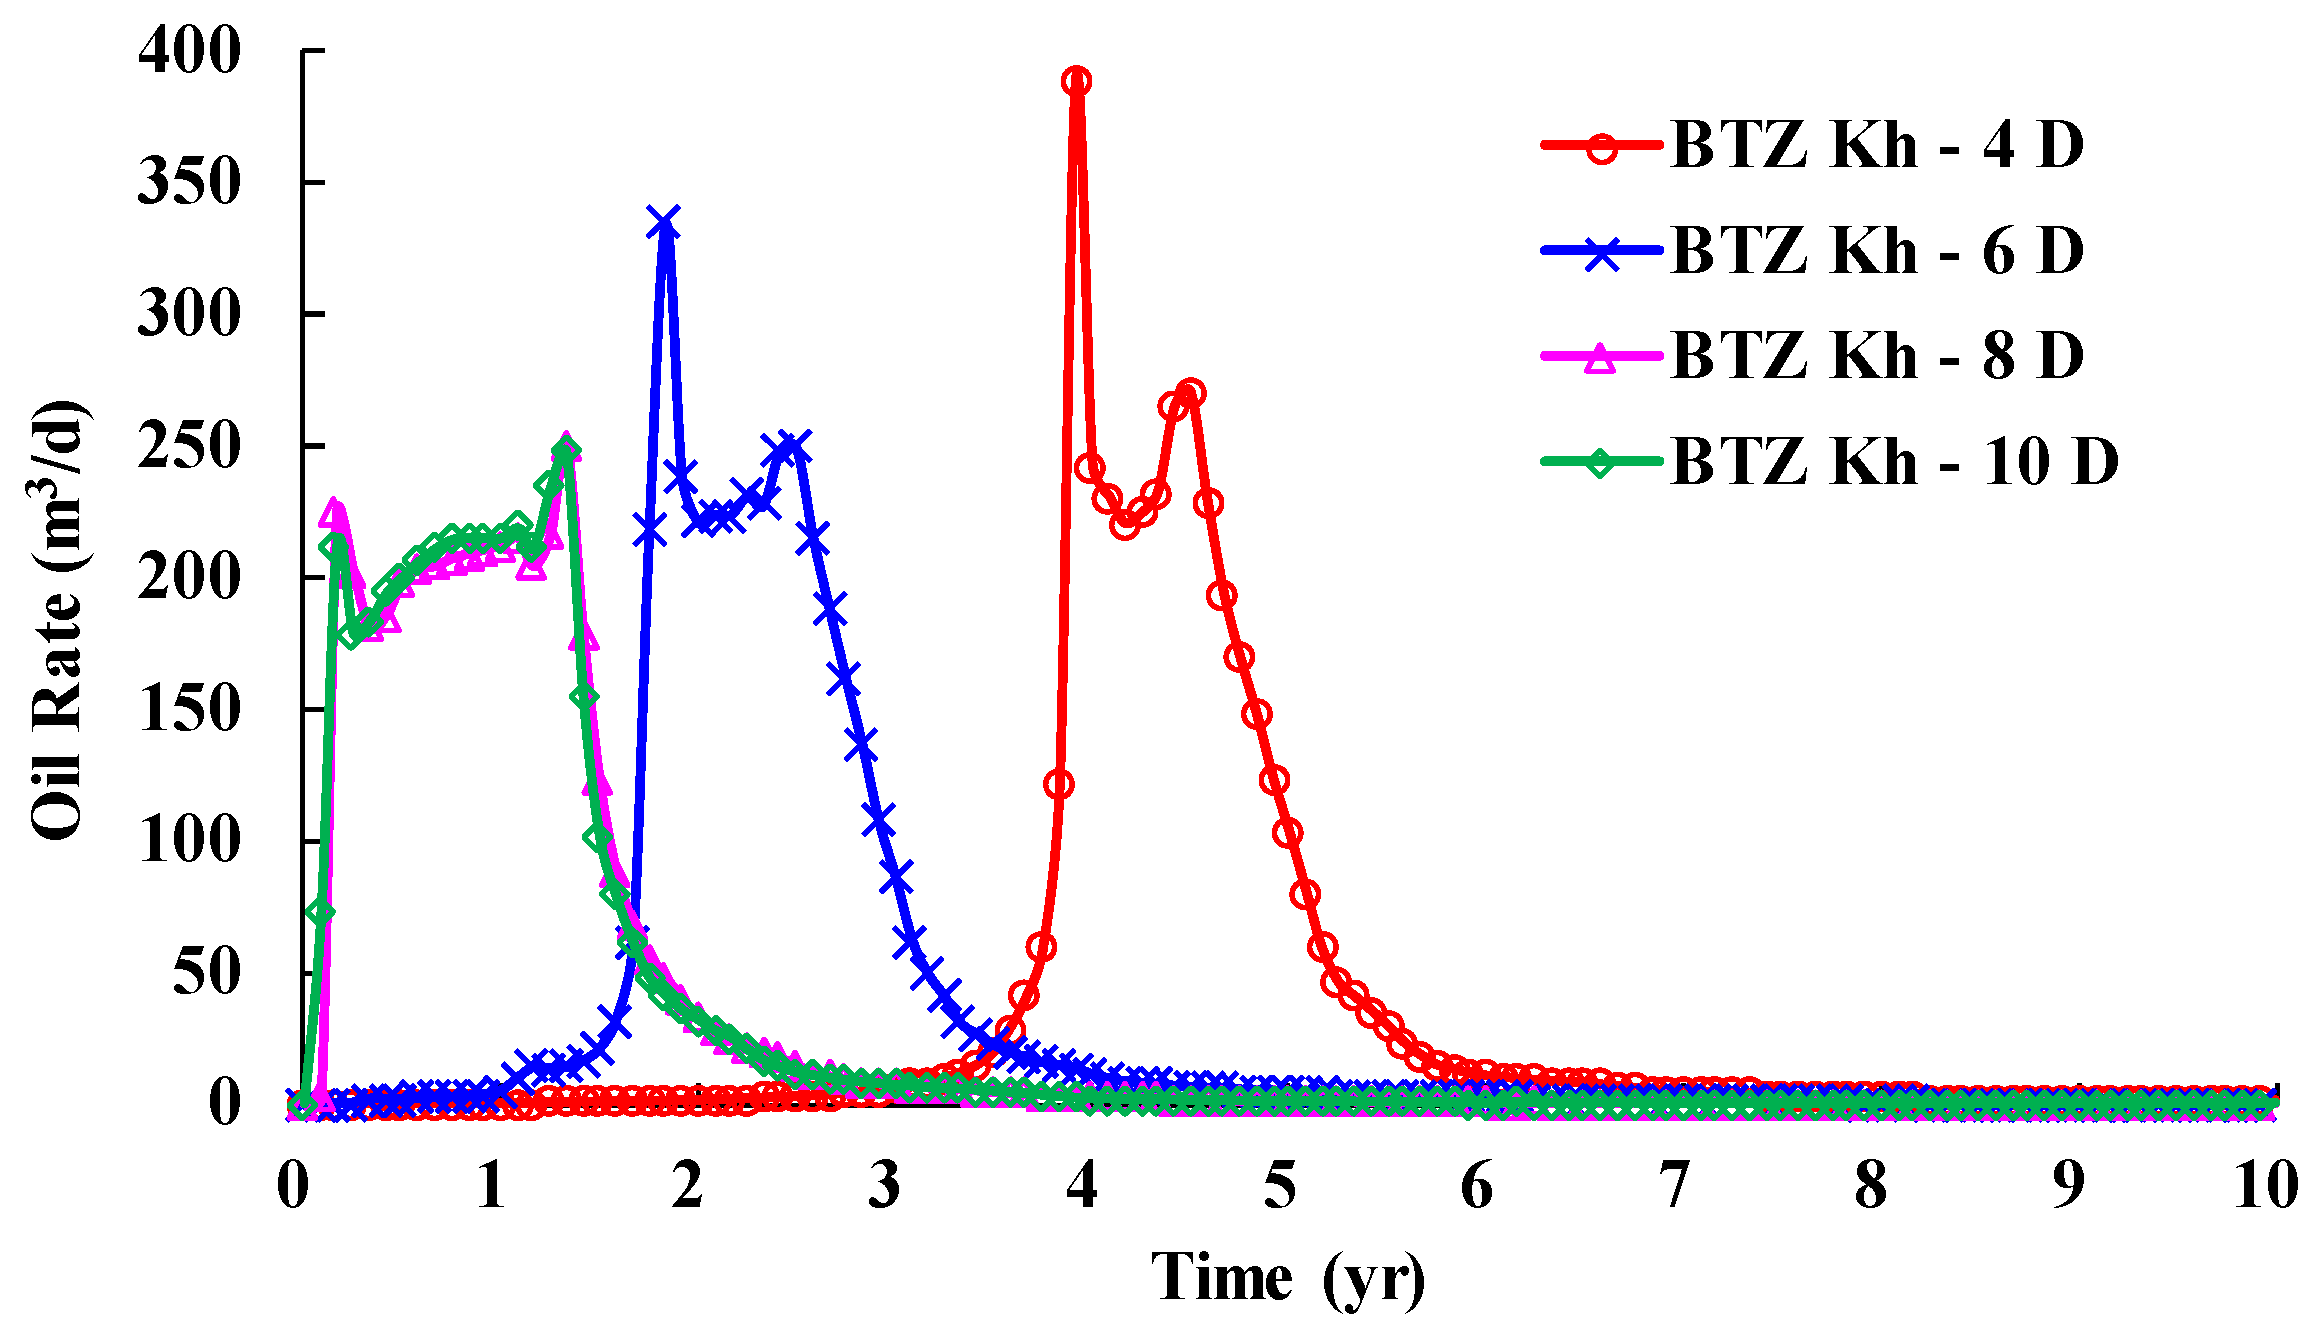
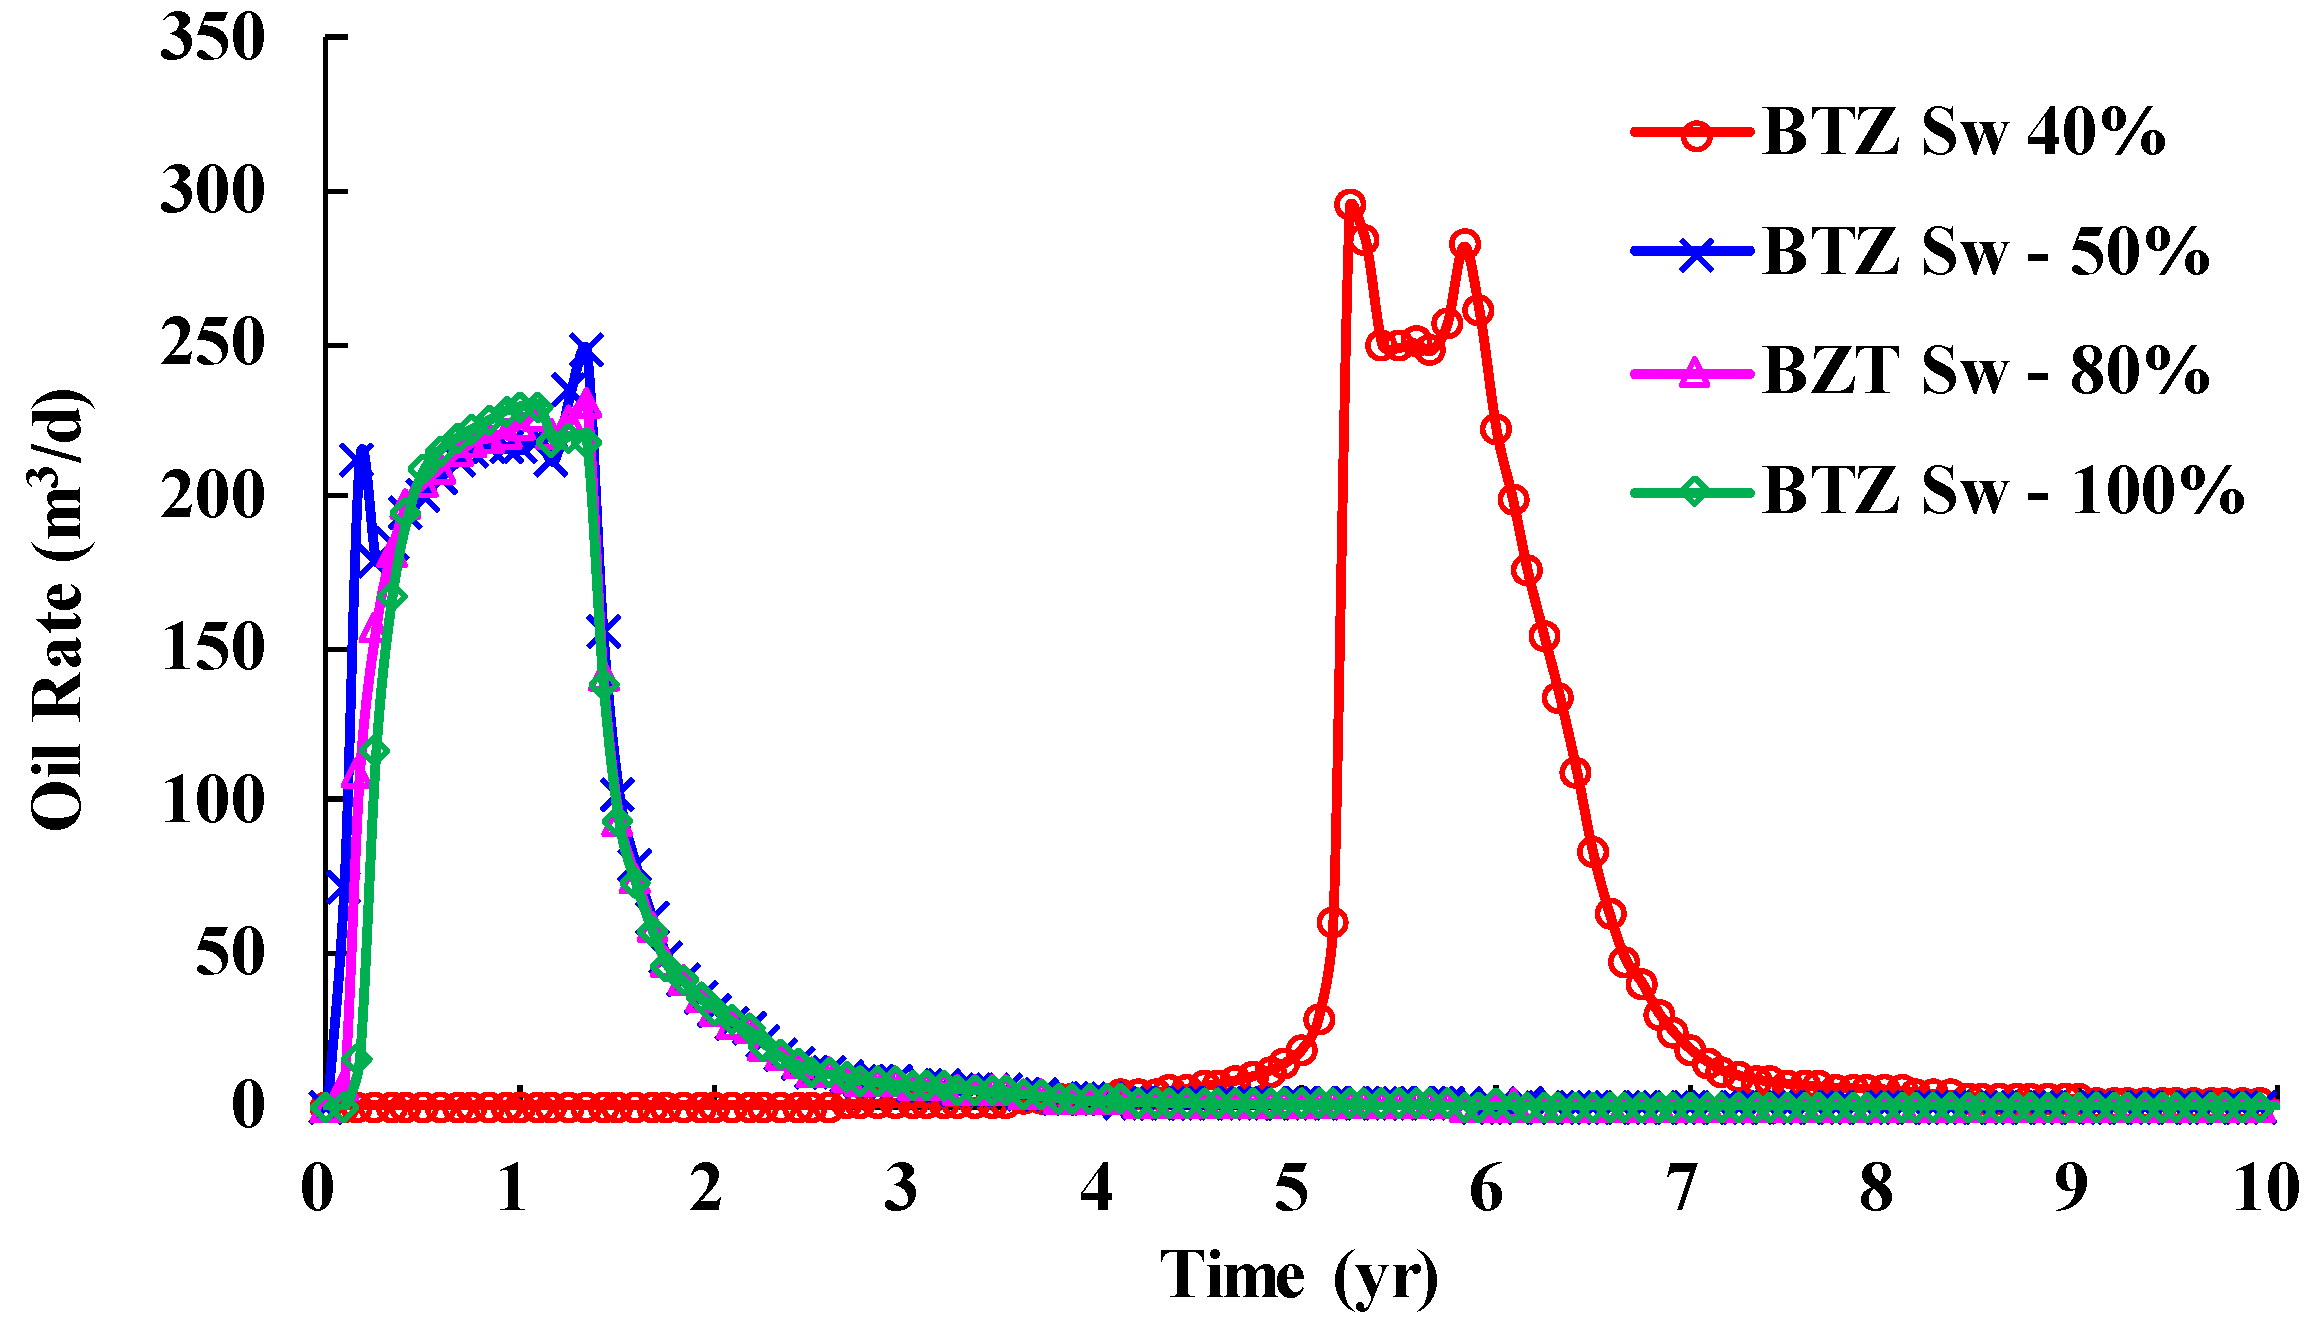
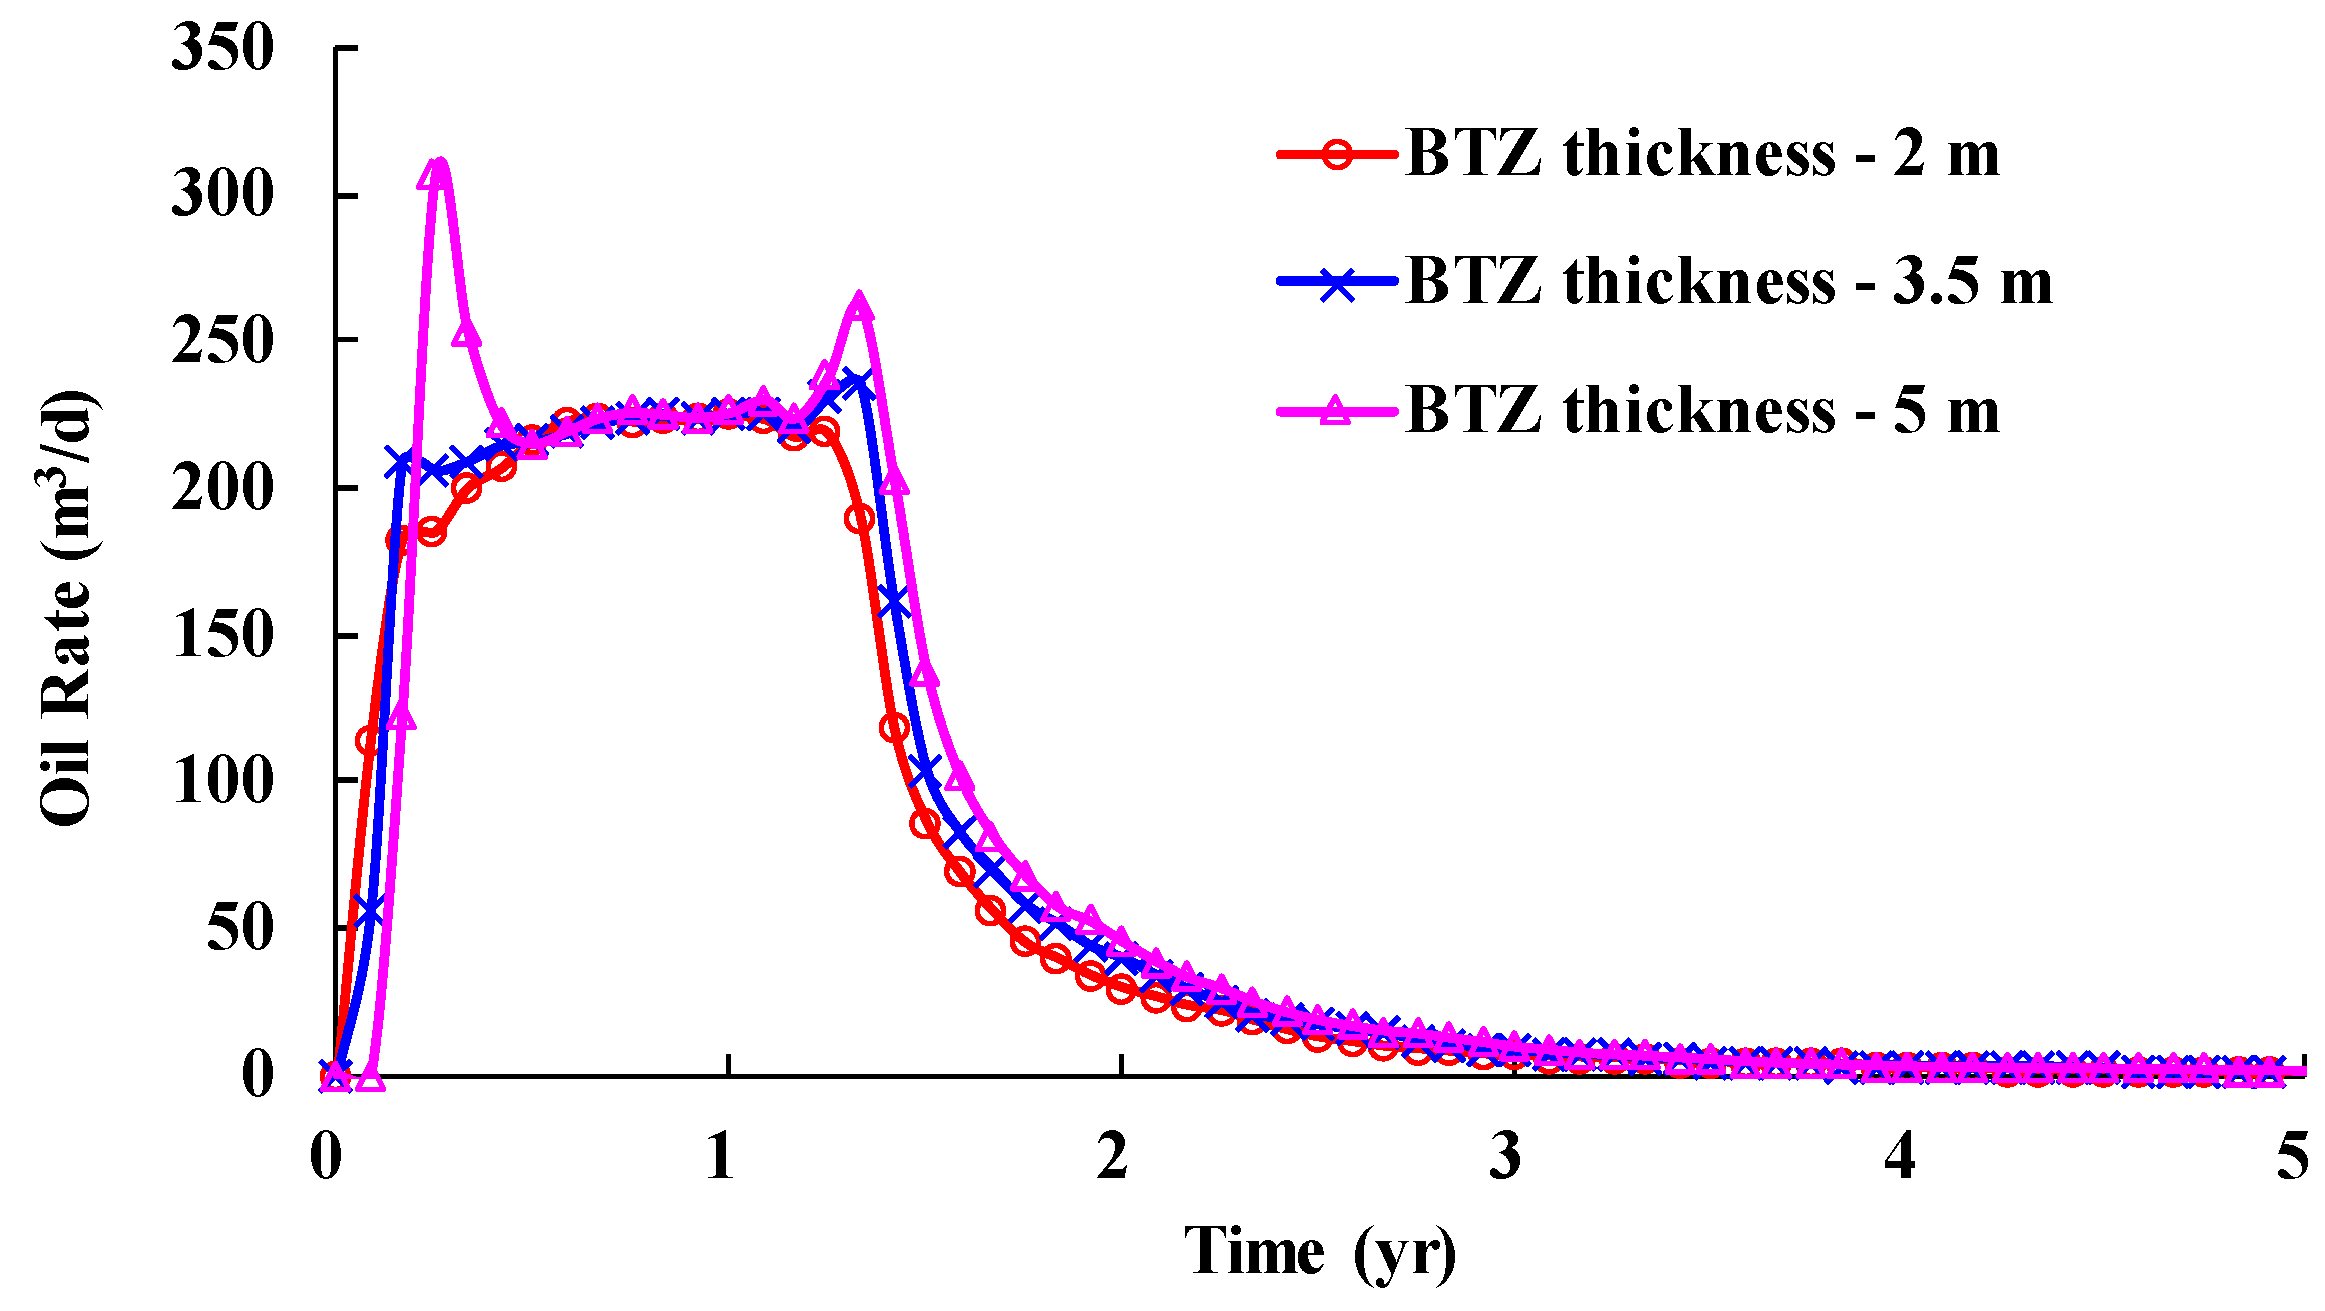
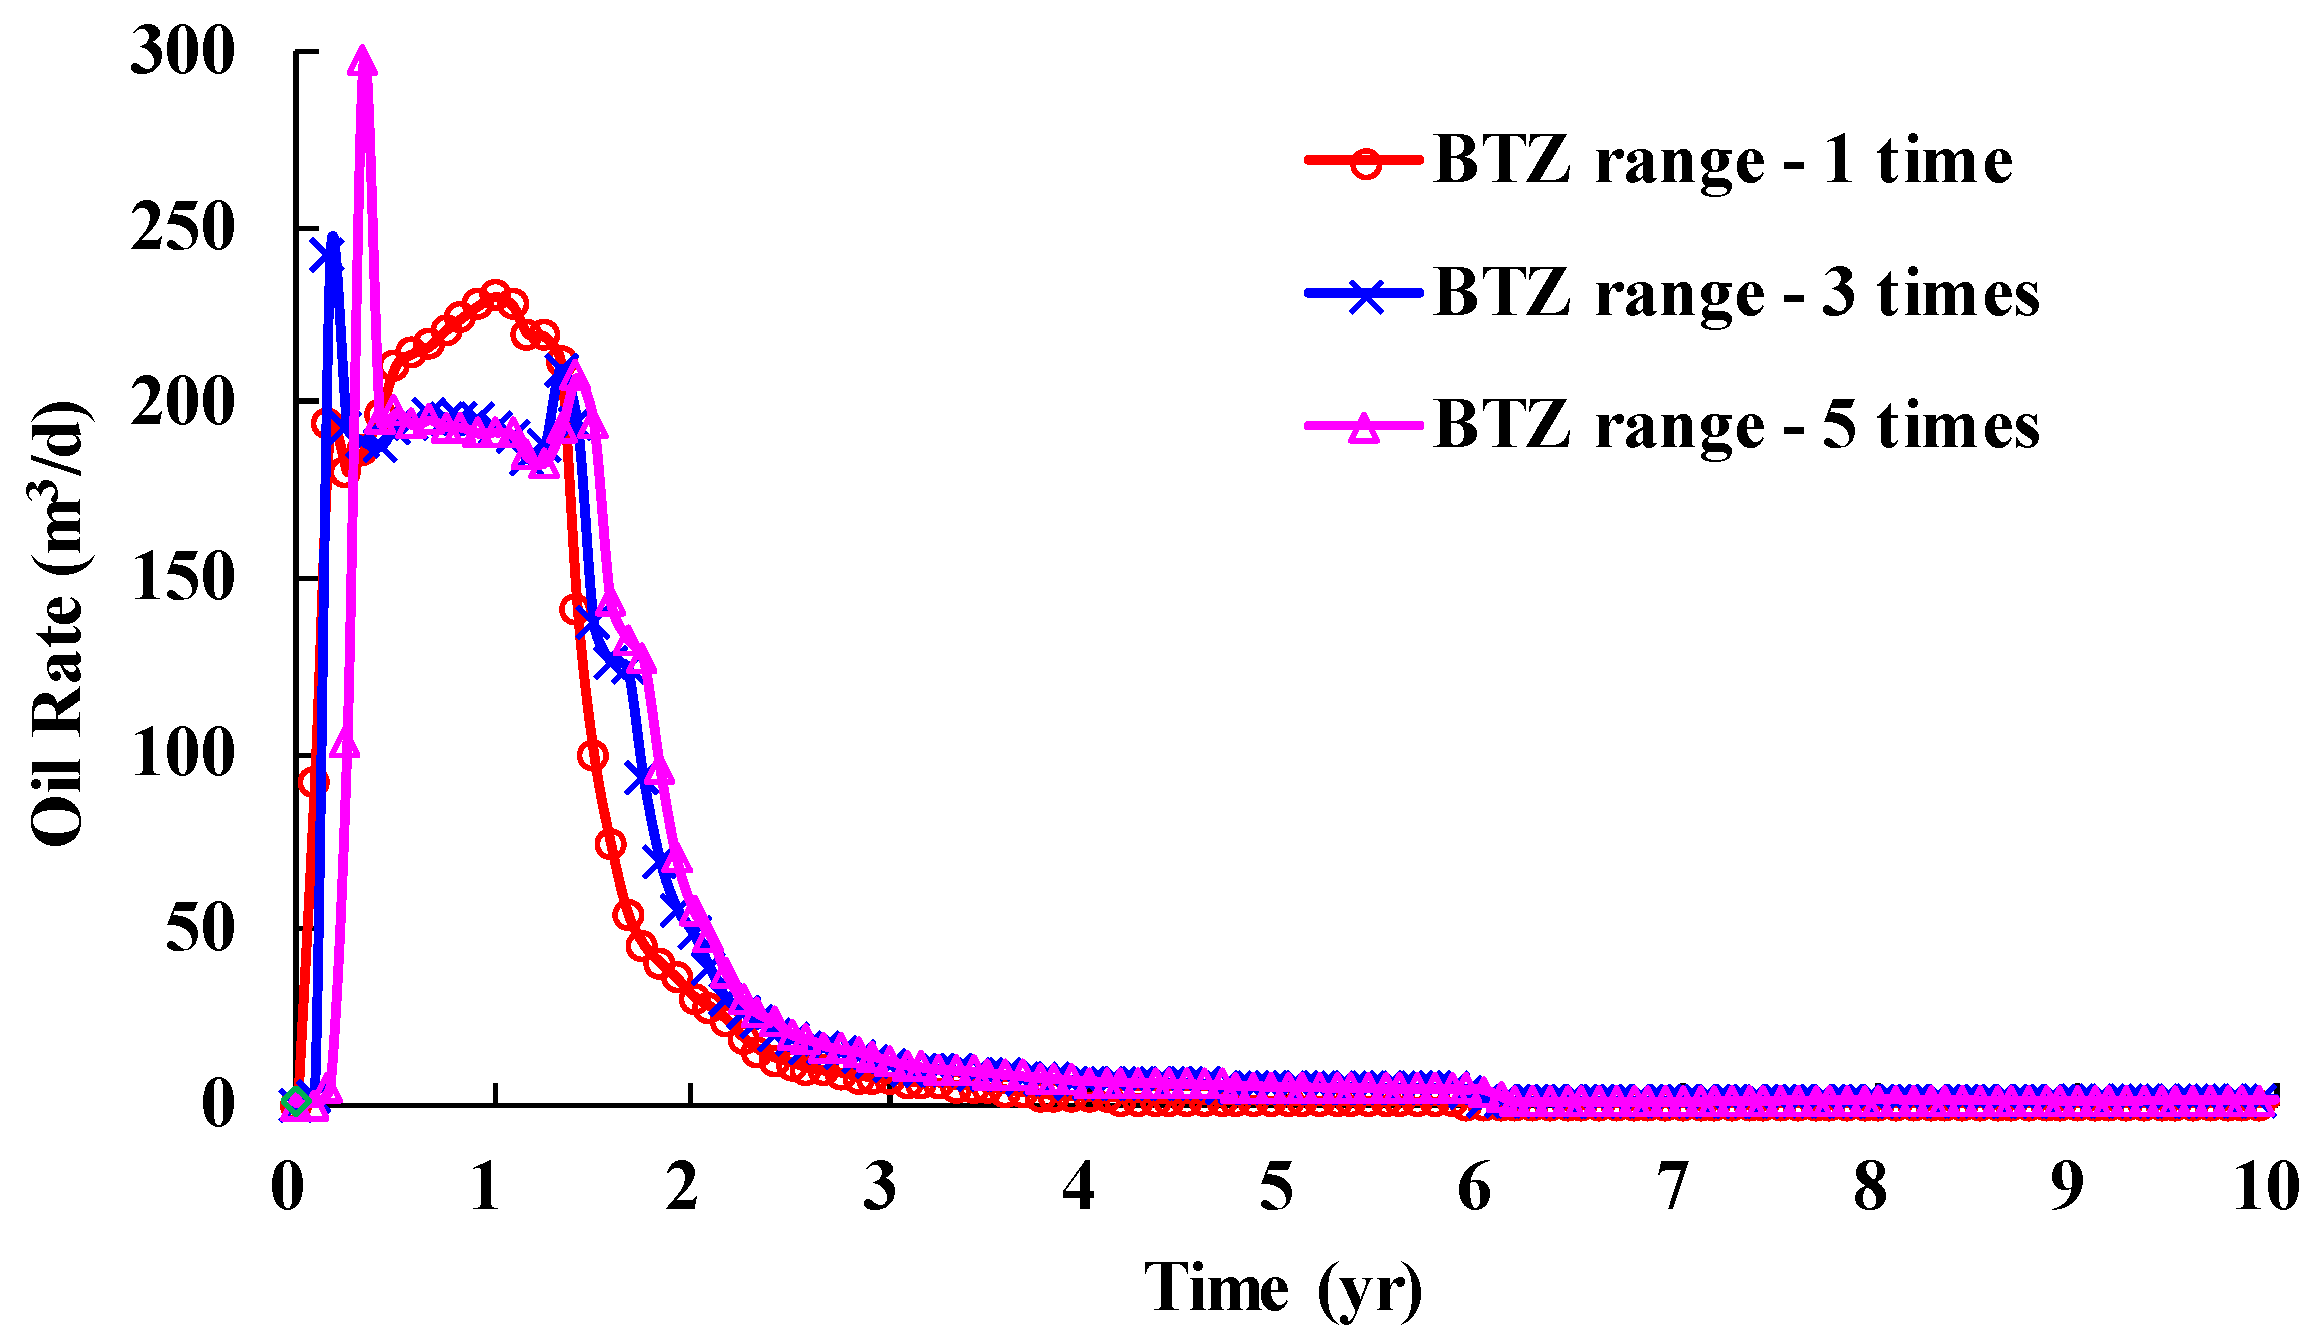
3.3.5. BTZ Properties: Horizontal and Vertical Permeability, Thickness, and Water Saturation

The vertical permeability of the BTZ was set as 6 D, and numerical simulations were conducted considering the horizontal permeability K h of 4 D, 6 D, 8 D and 10 D, respectively. Figure 27 shows that the horizontal permeability obviously affects the production timing, but when K h > 8 D , it has minimal influence on the oil rate by further enhancing the horizontal permeability.
The horizontal permeability of the BTZ was set as 10 D, and four schemes of vertical permeability K v were considered including 4 D, 6 D, 8 D and 10 D. As shown in Figure 28, it demonstrates that the vertical permeability can also affect the production timing. In particular, when K v > 6 D , the producer starts quickly, but has little influence on the oil rate by further improving the vertical permeability.
Then, the influence of the water saturation of the BTZ was evaluated including 40%, 50%, 80% and 100%. Figure 29 presents that when water saturation is greater than 50%, the producer can start up quickly, but increasing the water saturation further has limited influence on the oil rate.
Additionally, the influence of the thickness and extended range of the BTZ on the oil rate was analyzed. The properties of oil pay remain unchanged. Three sets of BTZ thickness were included (2 m, 3.5 m, and 5 m), and three sets of the BTZ extended range were considered, including 1 time, 3 times and 5 times. From Figure 30 and Figure 31, it can be seen that both parameters have little impact on the oil rate, and this is because the increasing oil production contribution from the BTZ somewhat offsets the adverse impact of the extended range of the BTZ.

3.4. Application Conditions

In order to ensure that the SDGD process in the BTZ can achieve the desired performance, there are several application conditions that need to be explained:
  • Super heavy oil or oil sand reservoirs that are not suitable for conventional steam flooding, in other words, steam drive and gravity drainage, can only be effectively achieved through the BTZ instead of oil pay.
  • The vertical and horizontal permeability of the BTZ can be further enhanced through dilation stimulation or a fracturing operation.
  • Shale interlayers or laminae above the steam injector are not developed.
  • The limited range of the BTZ or confined BTZ.
  • The total thickness of the BTZ and bottom water should be within 5 m.

4. Conclusions

(1)
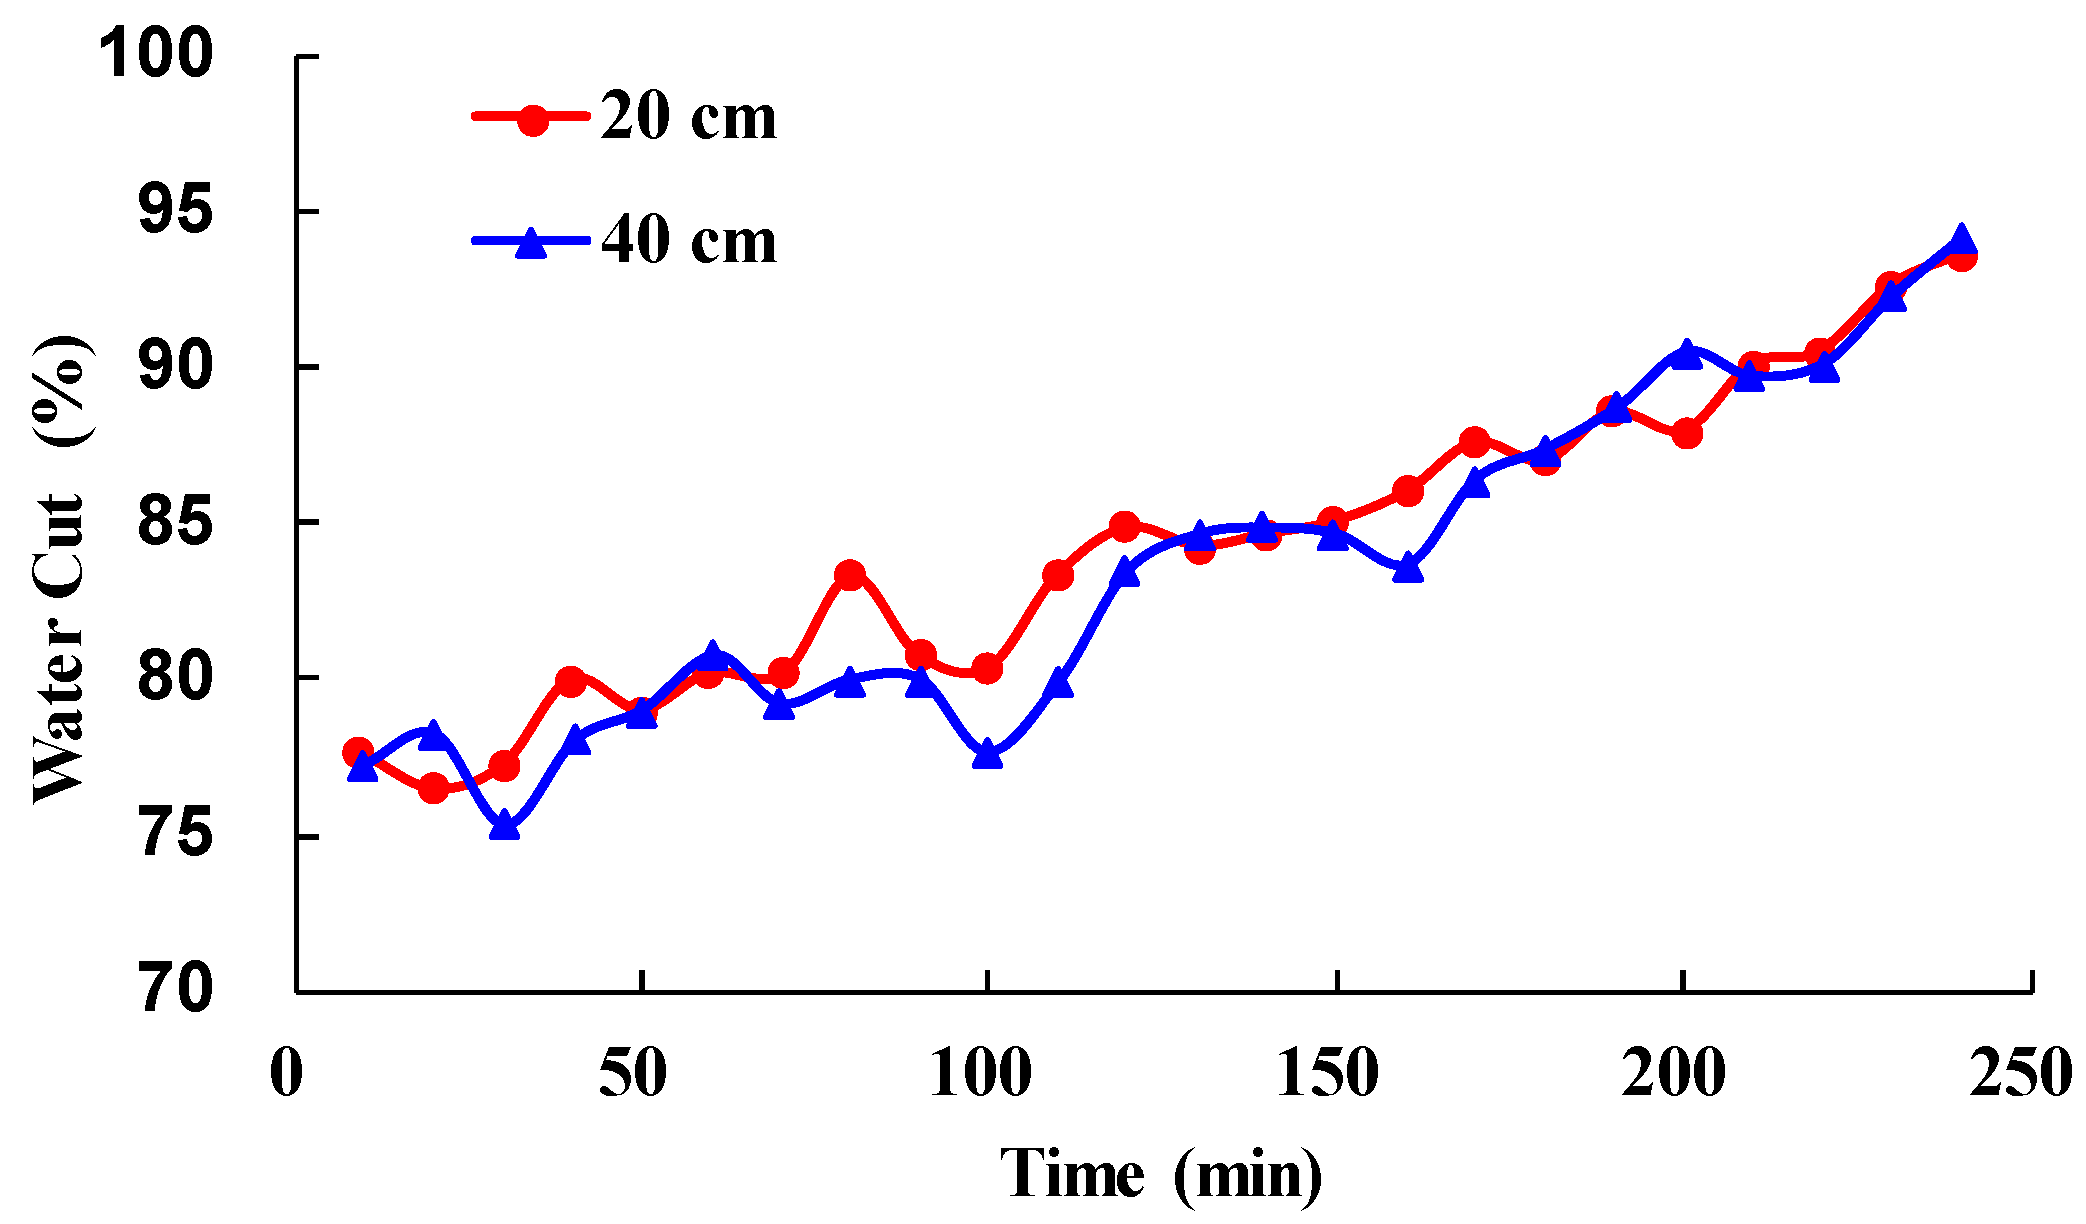
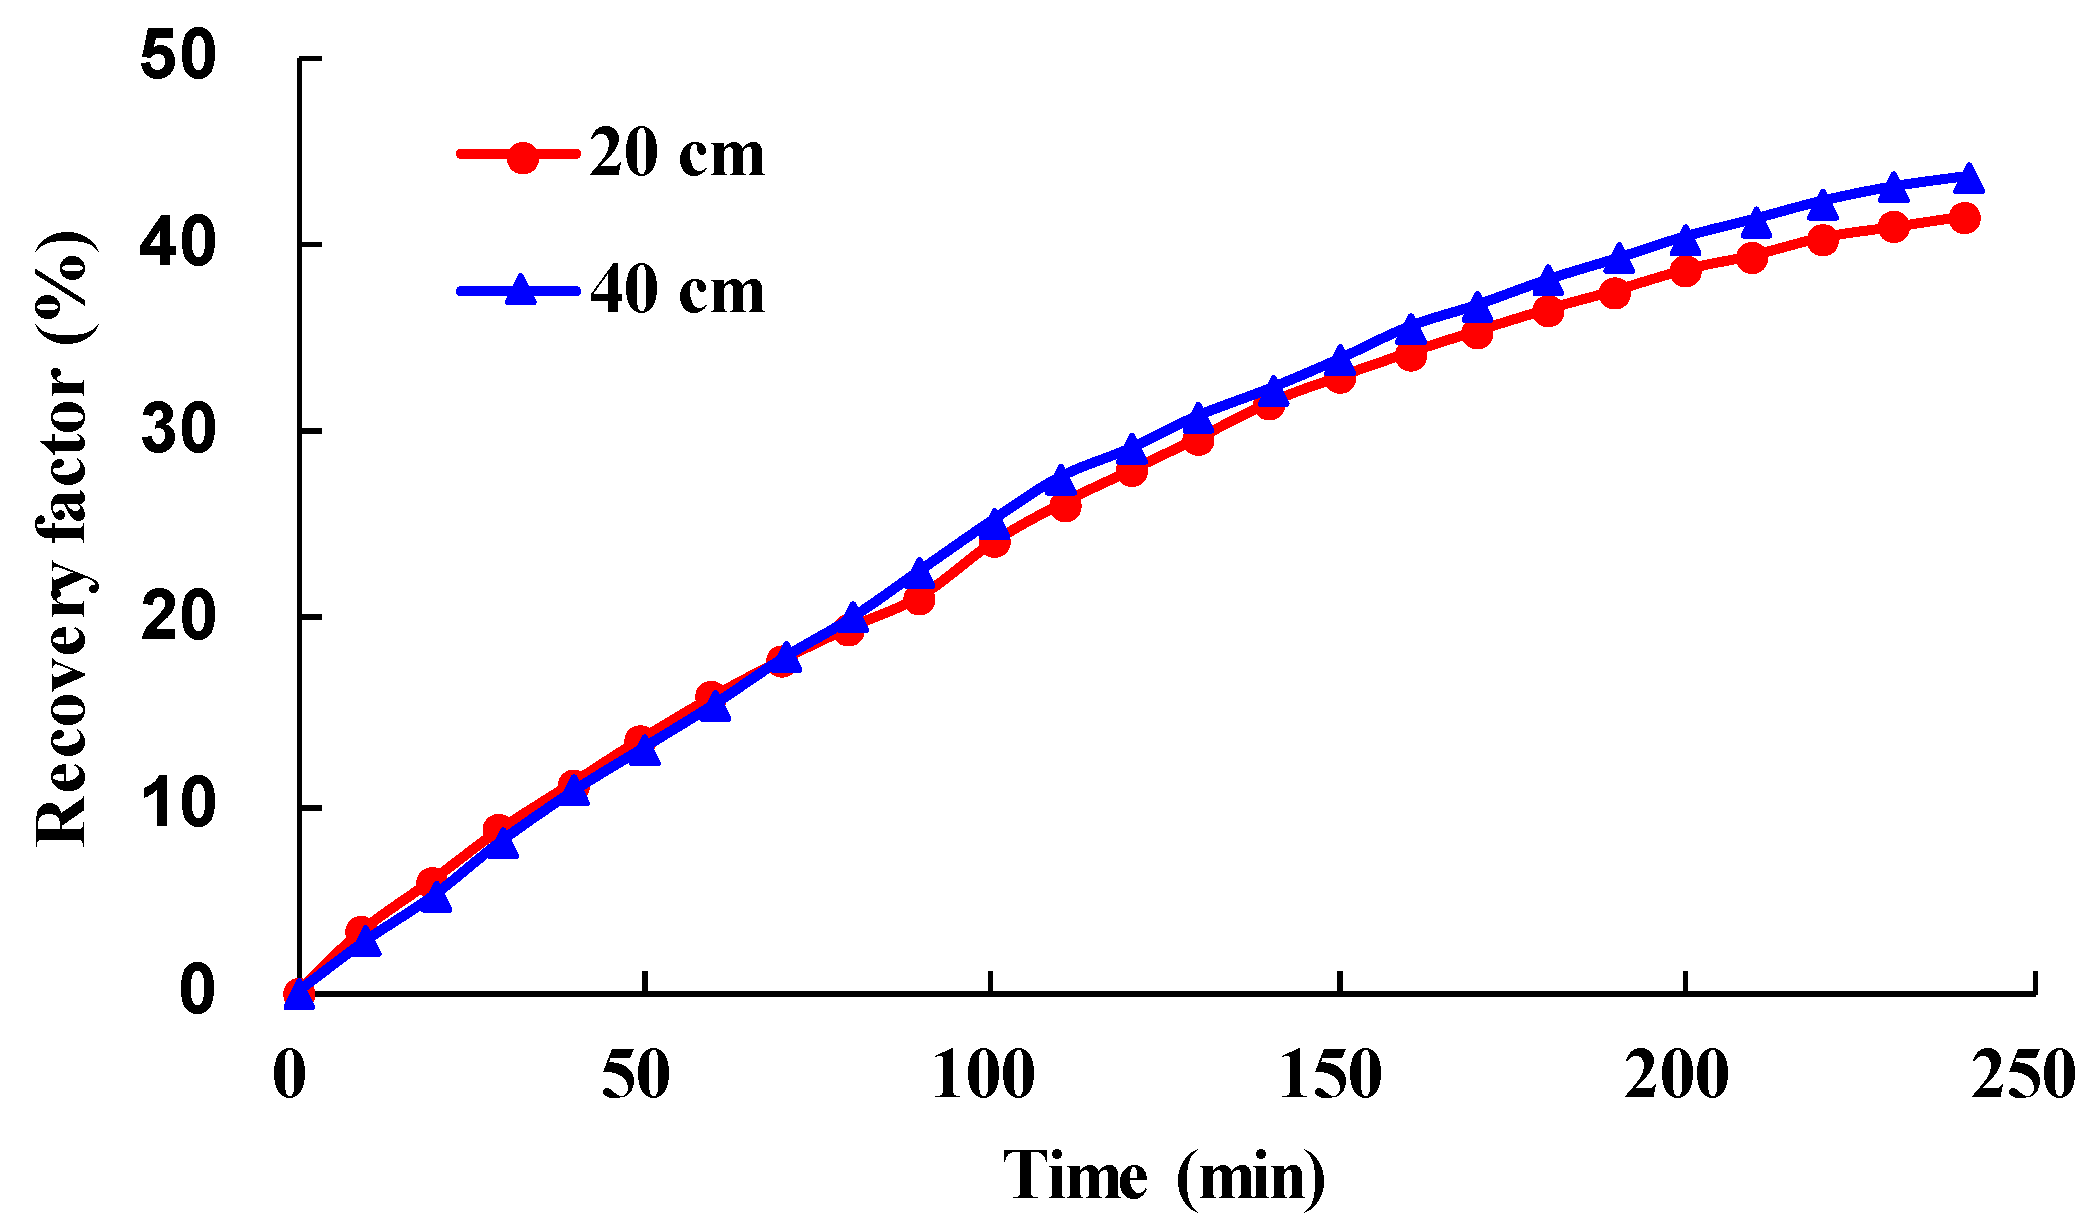
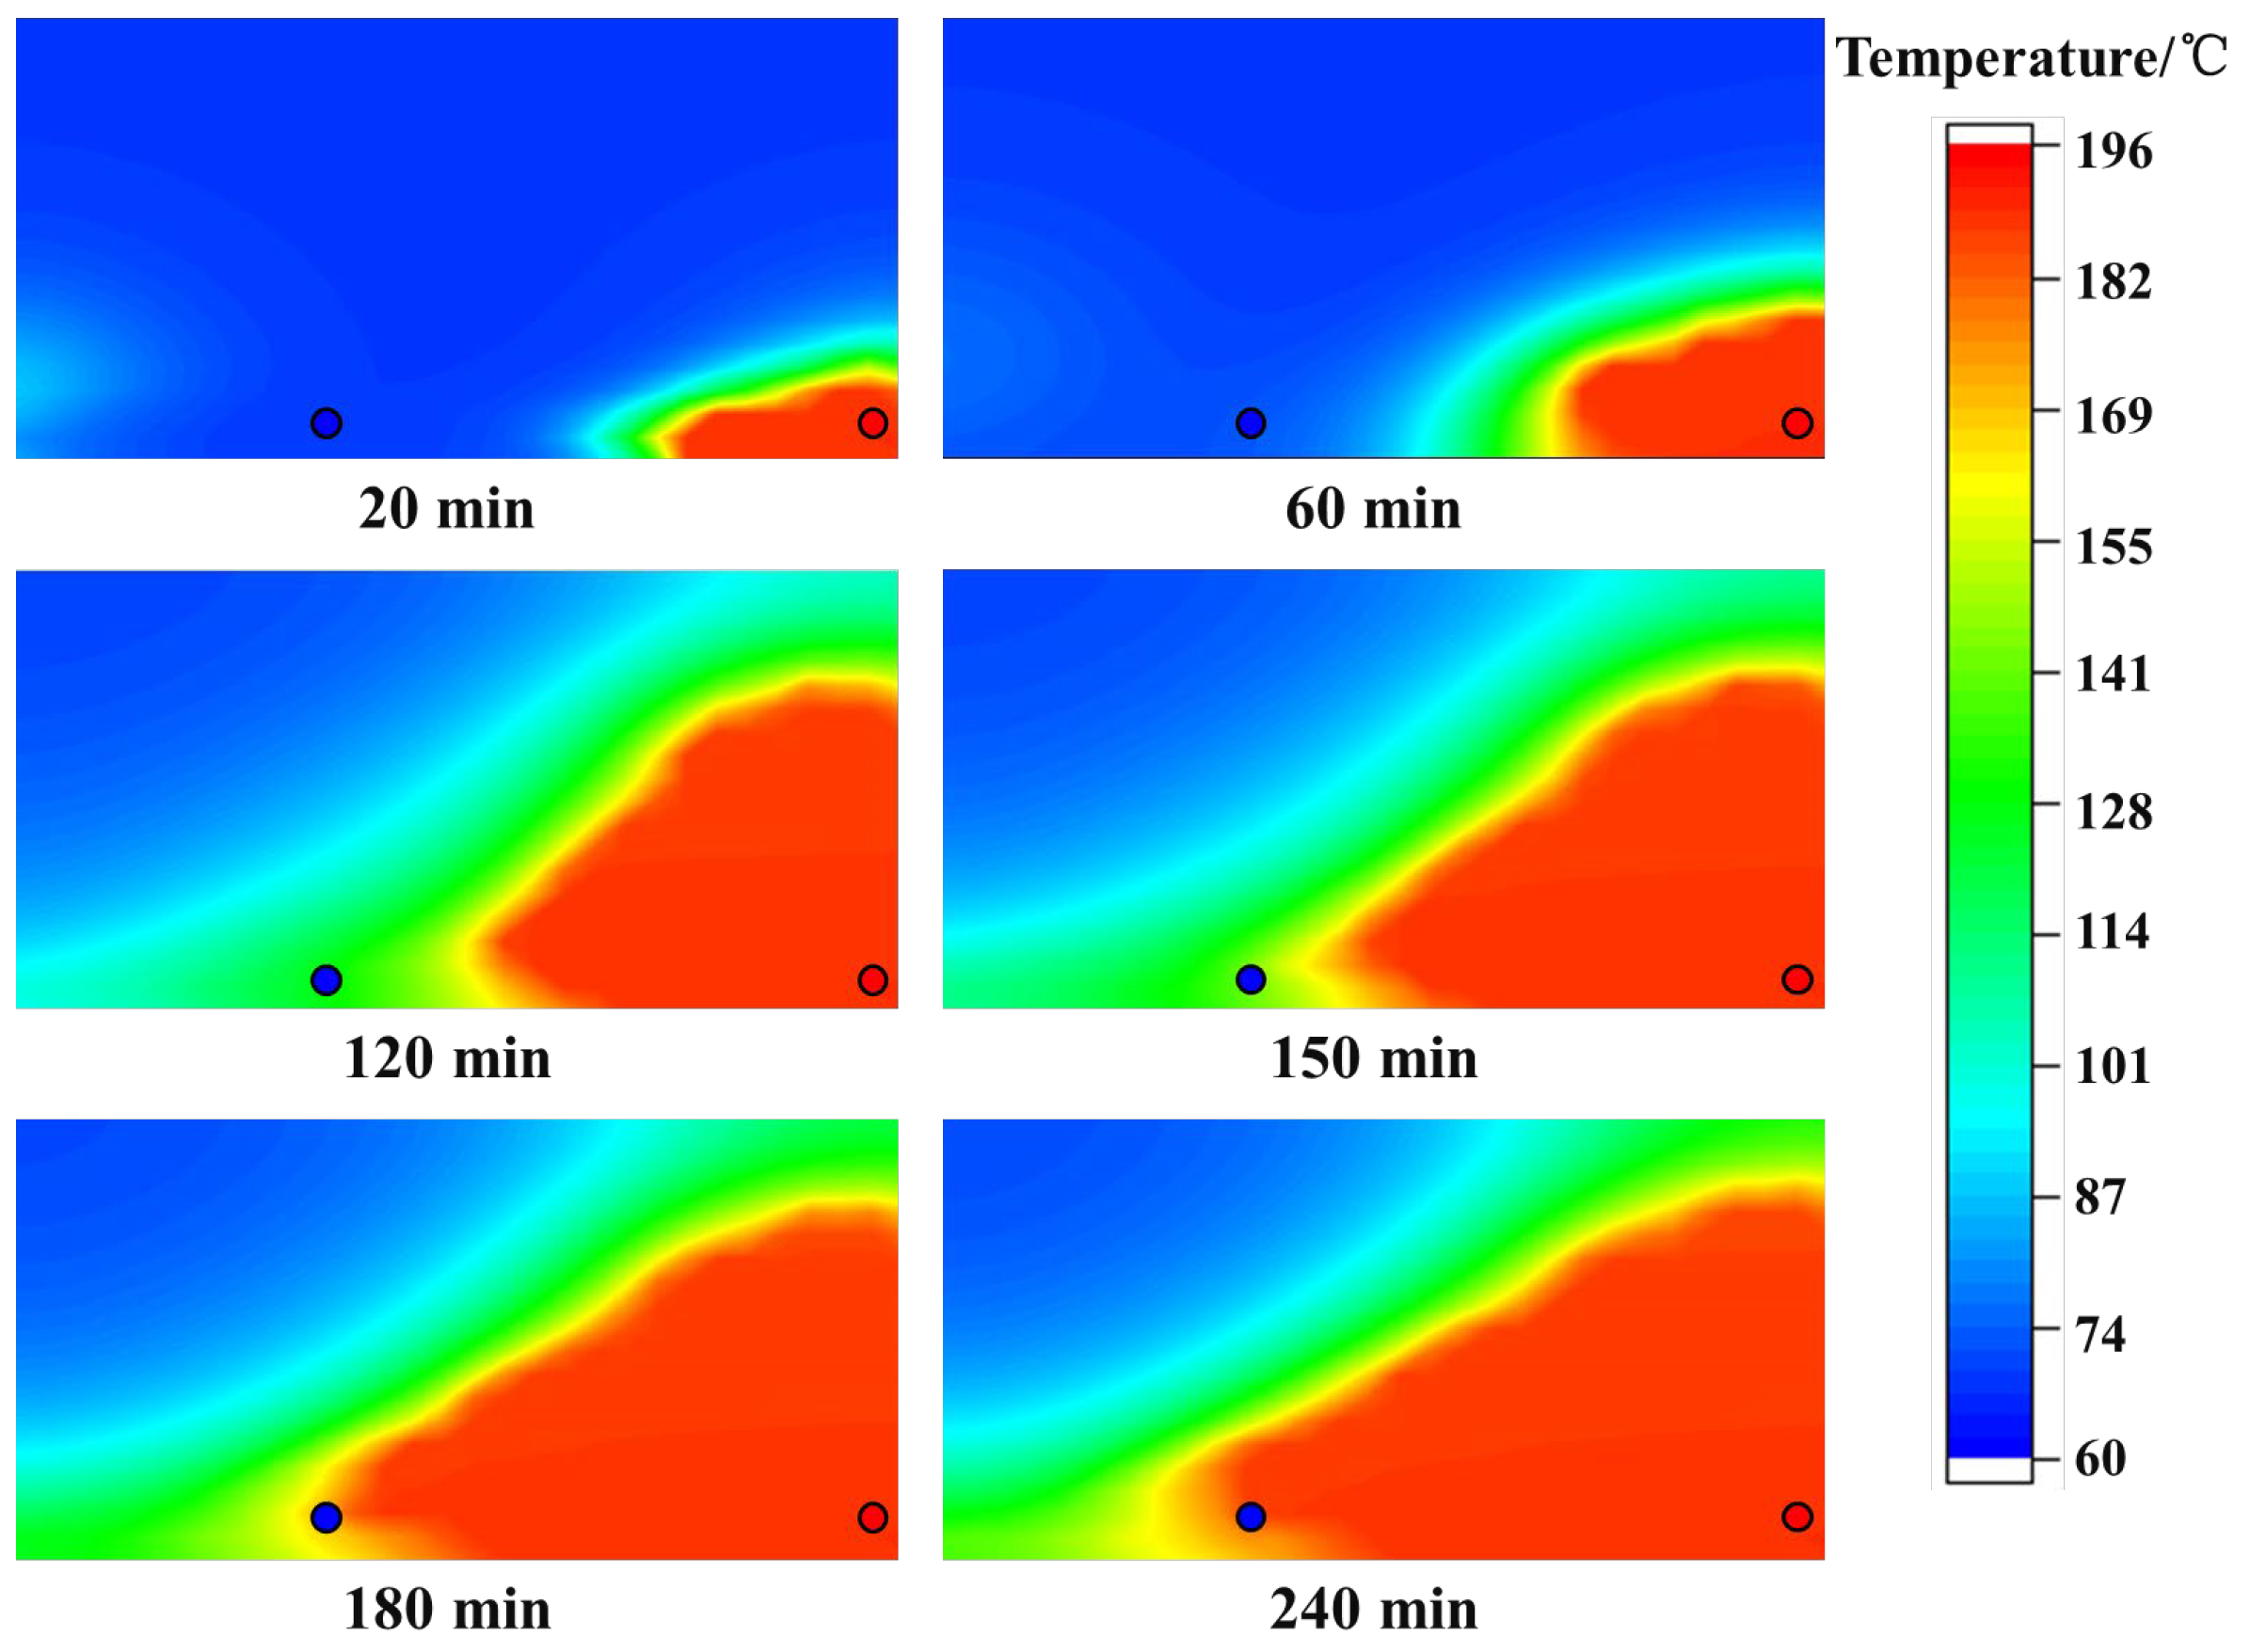
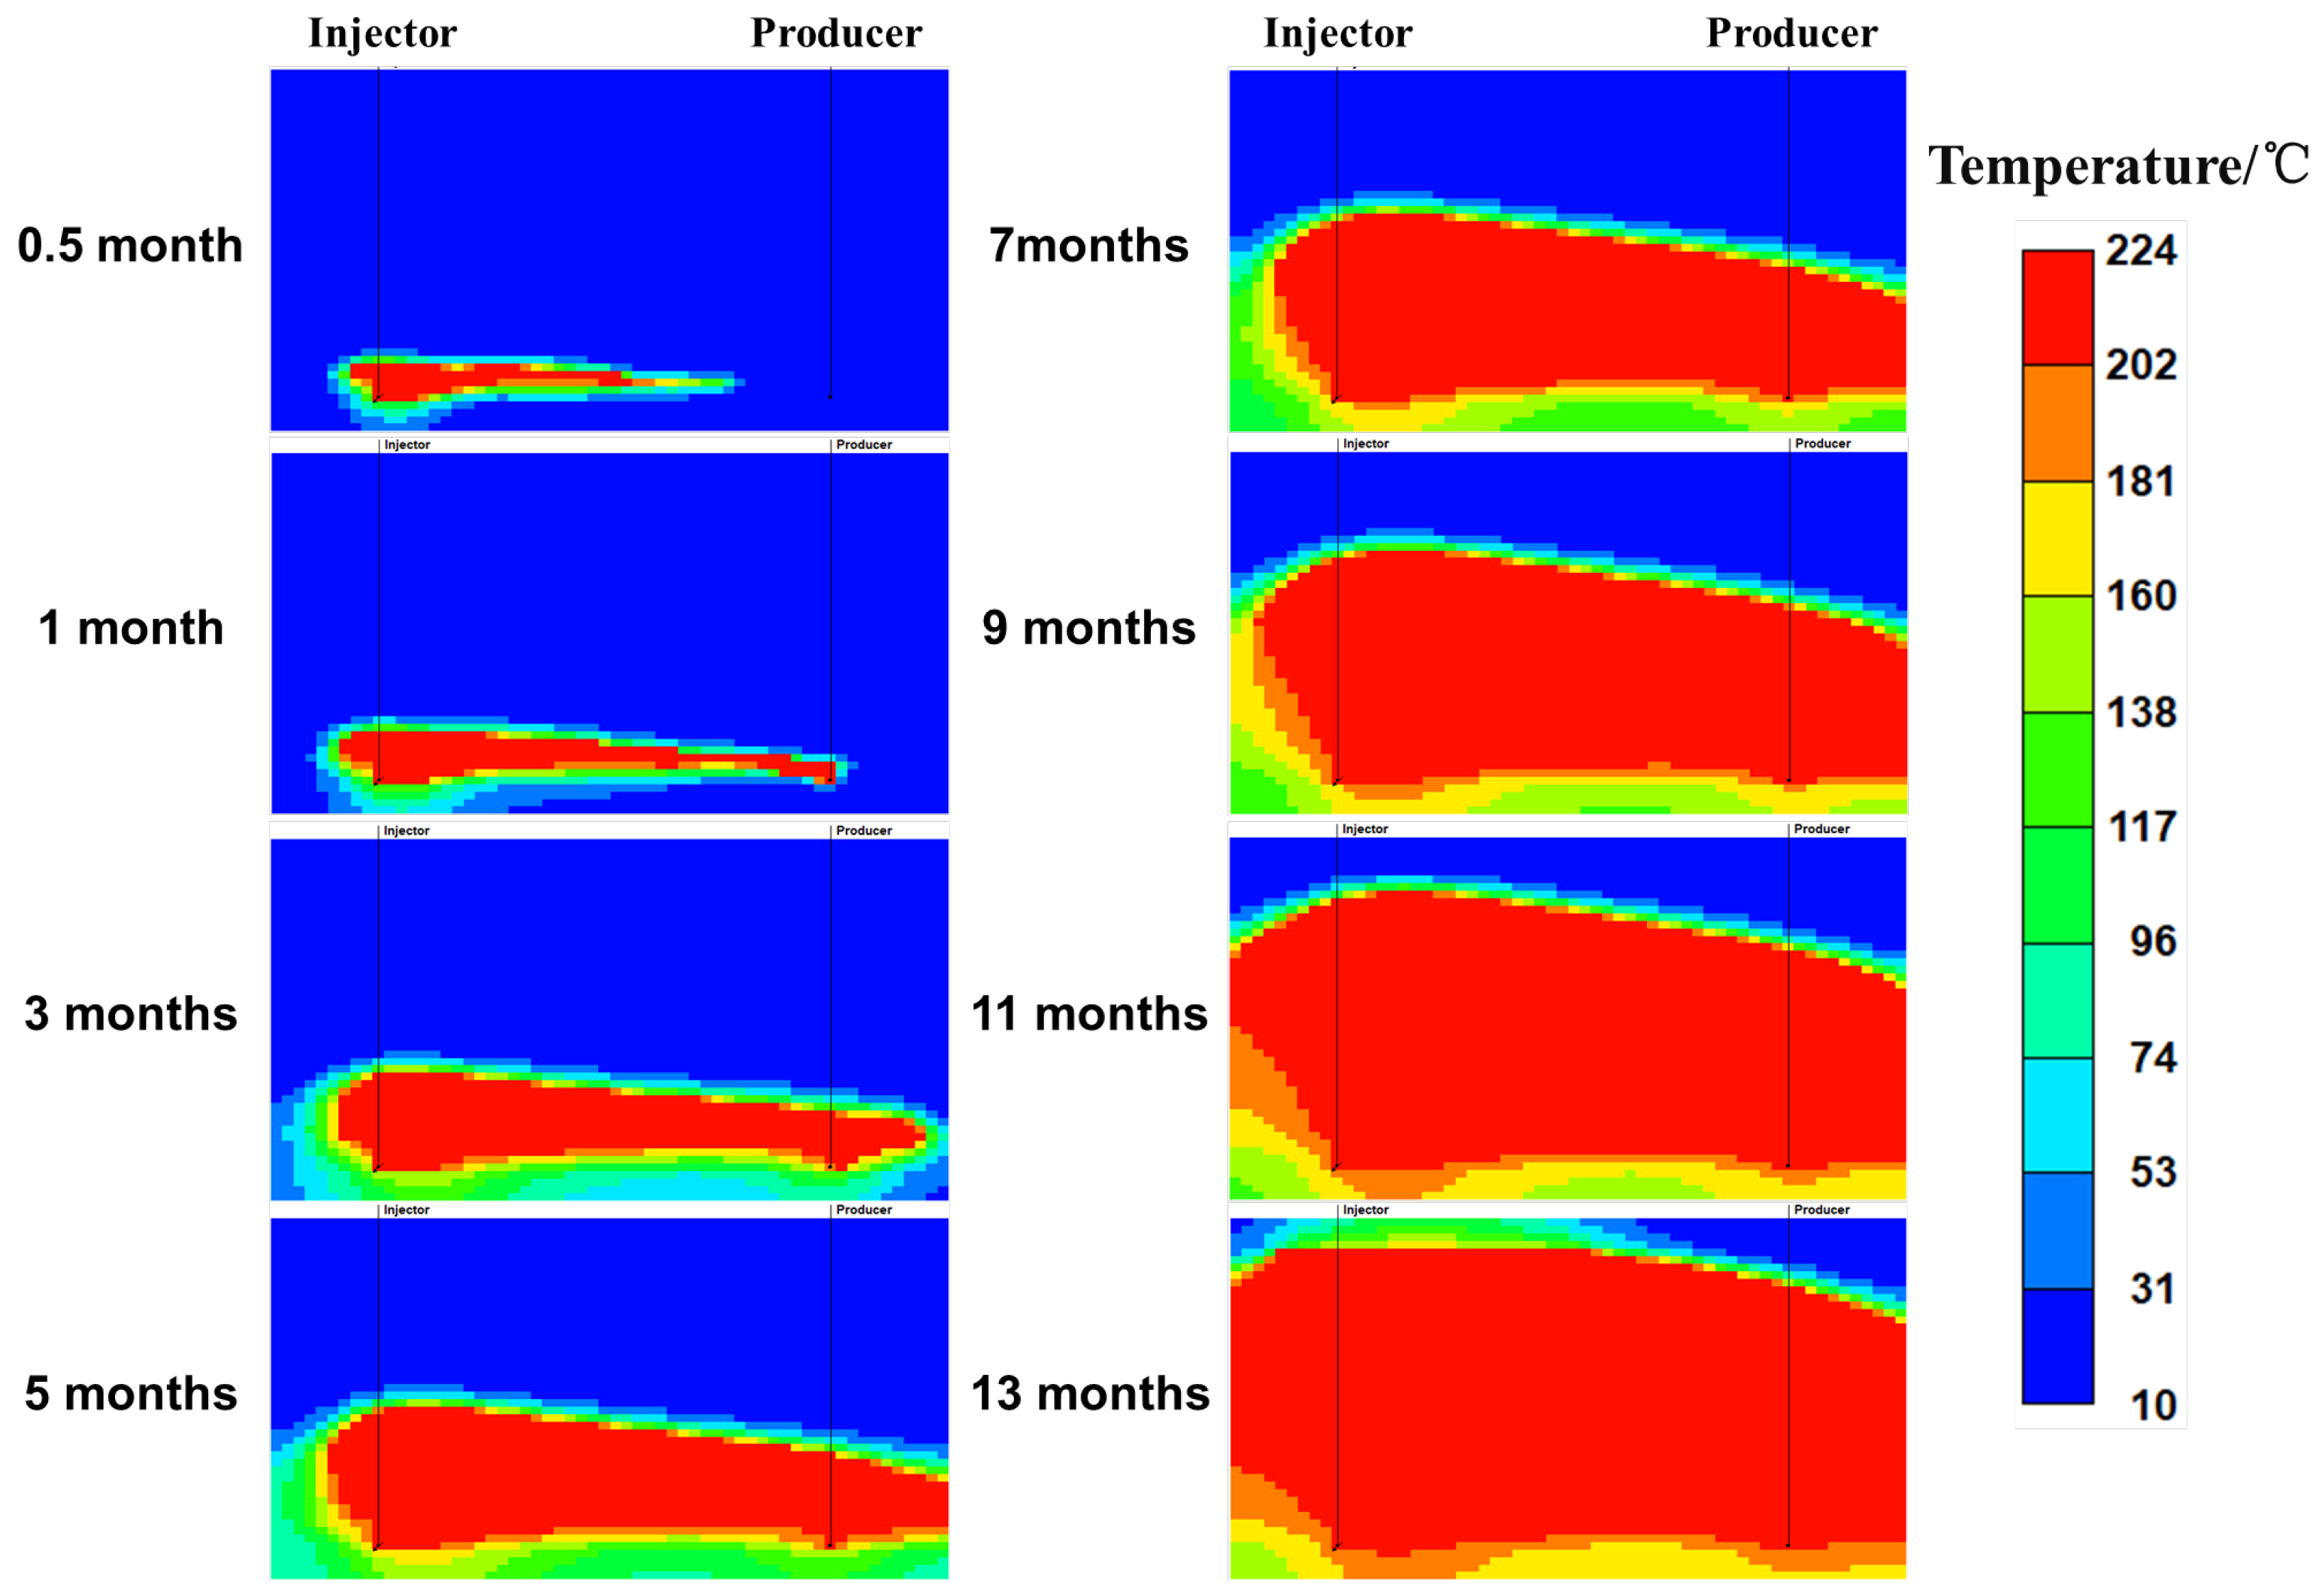
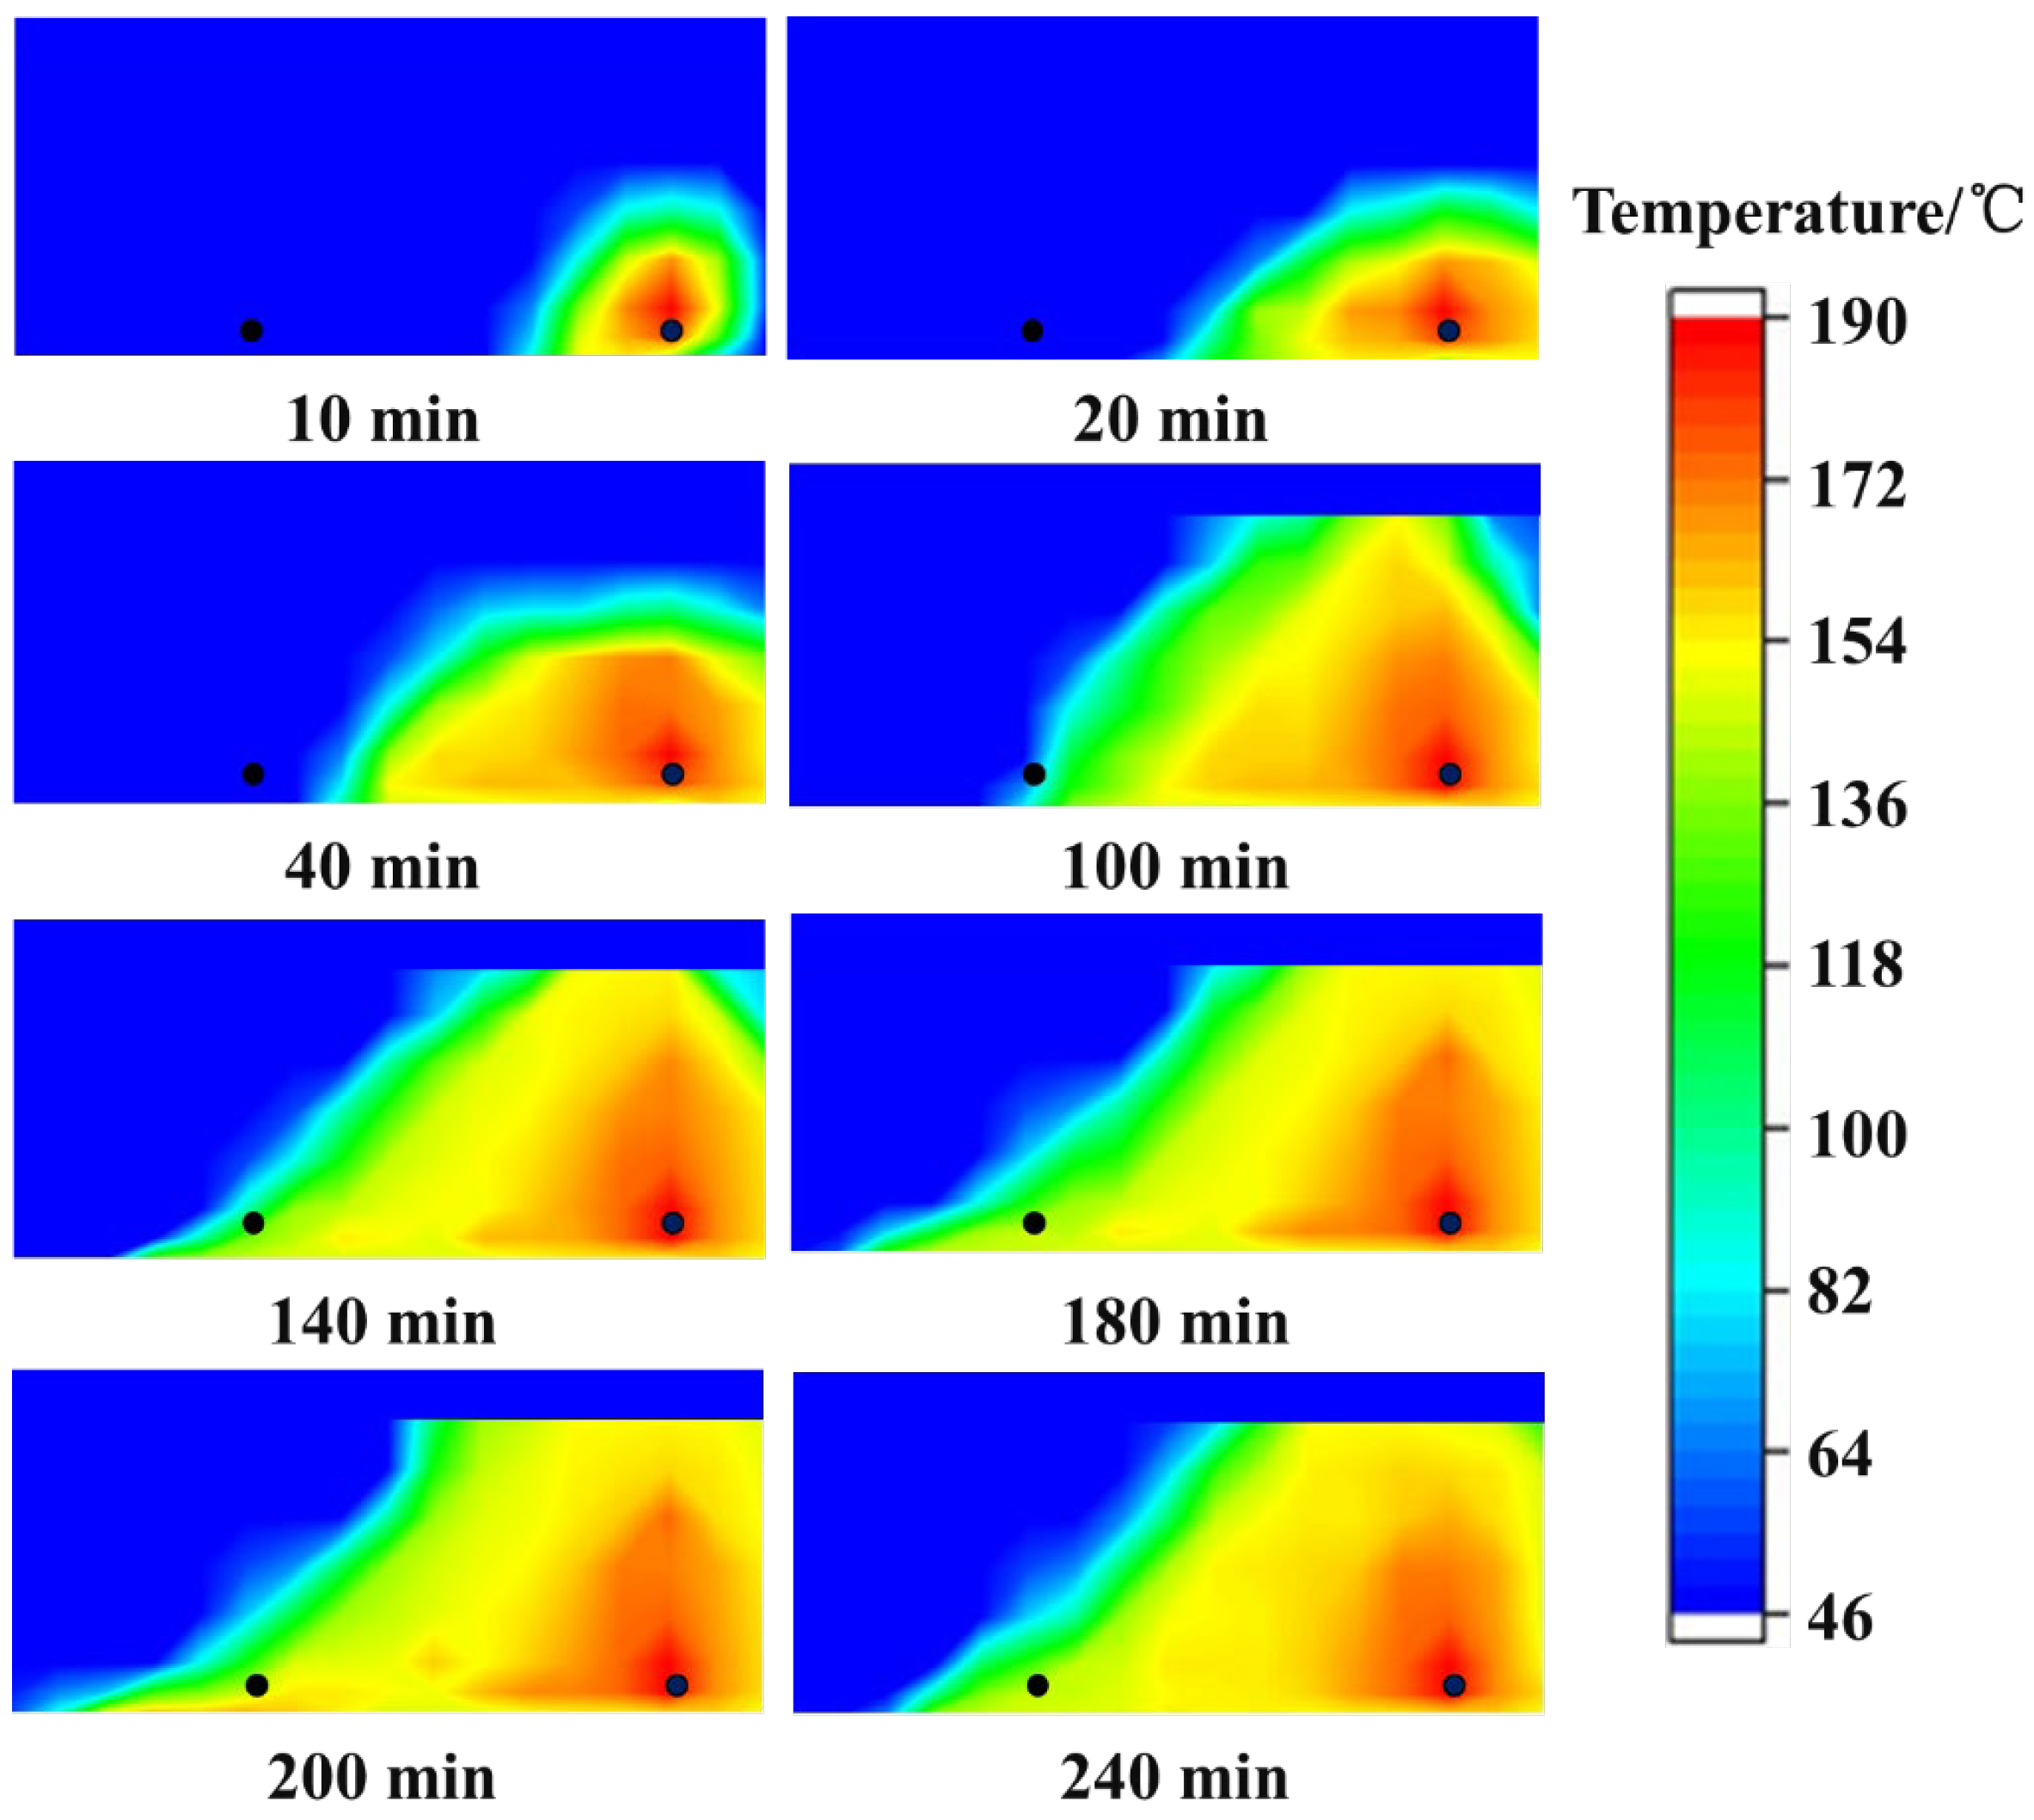
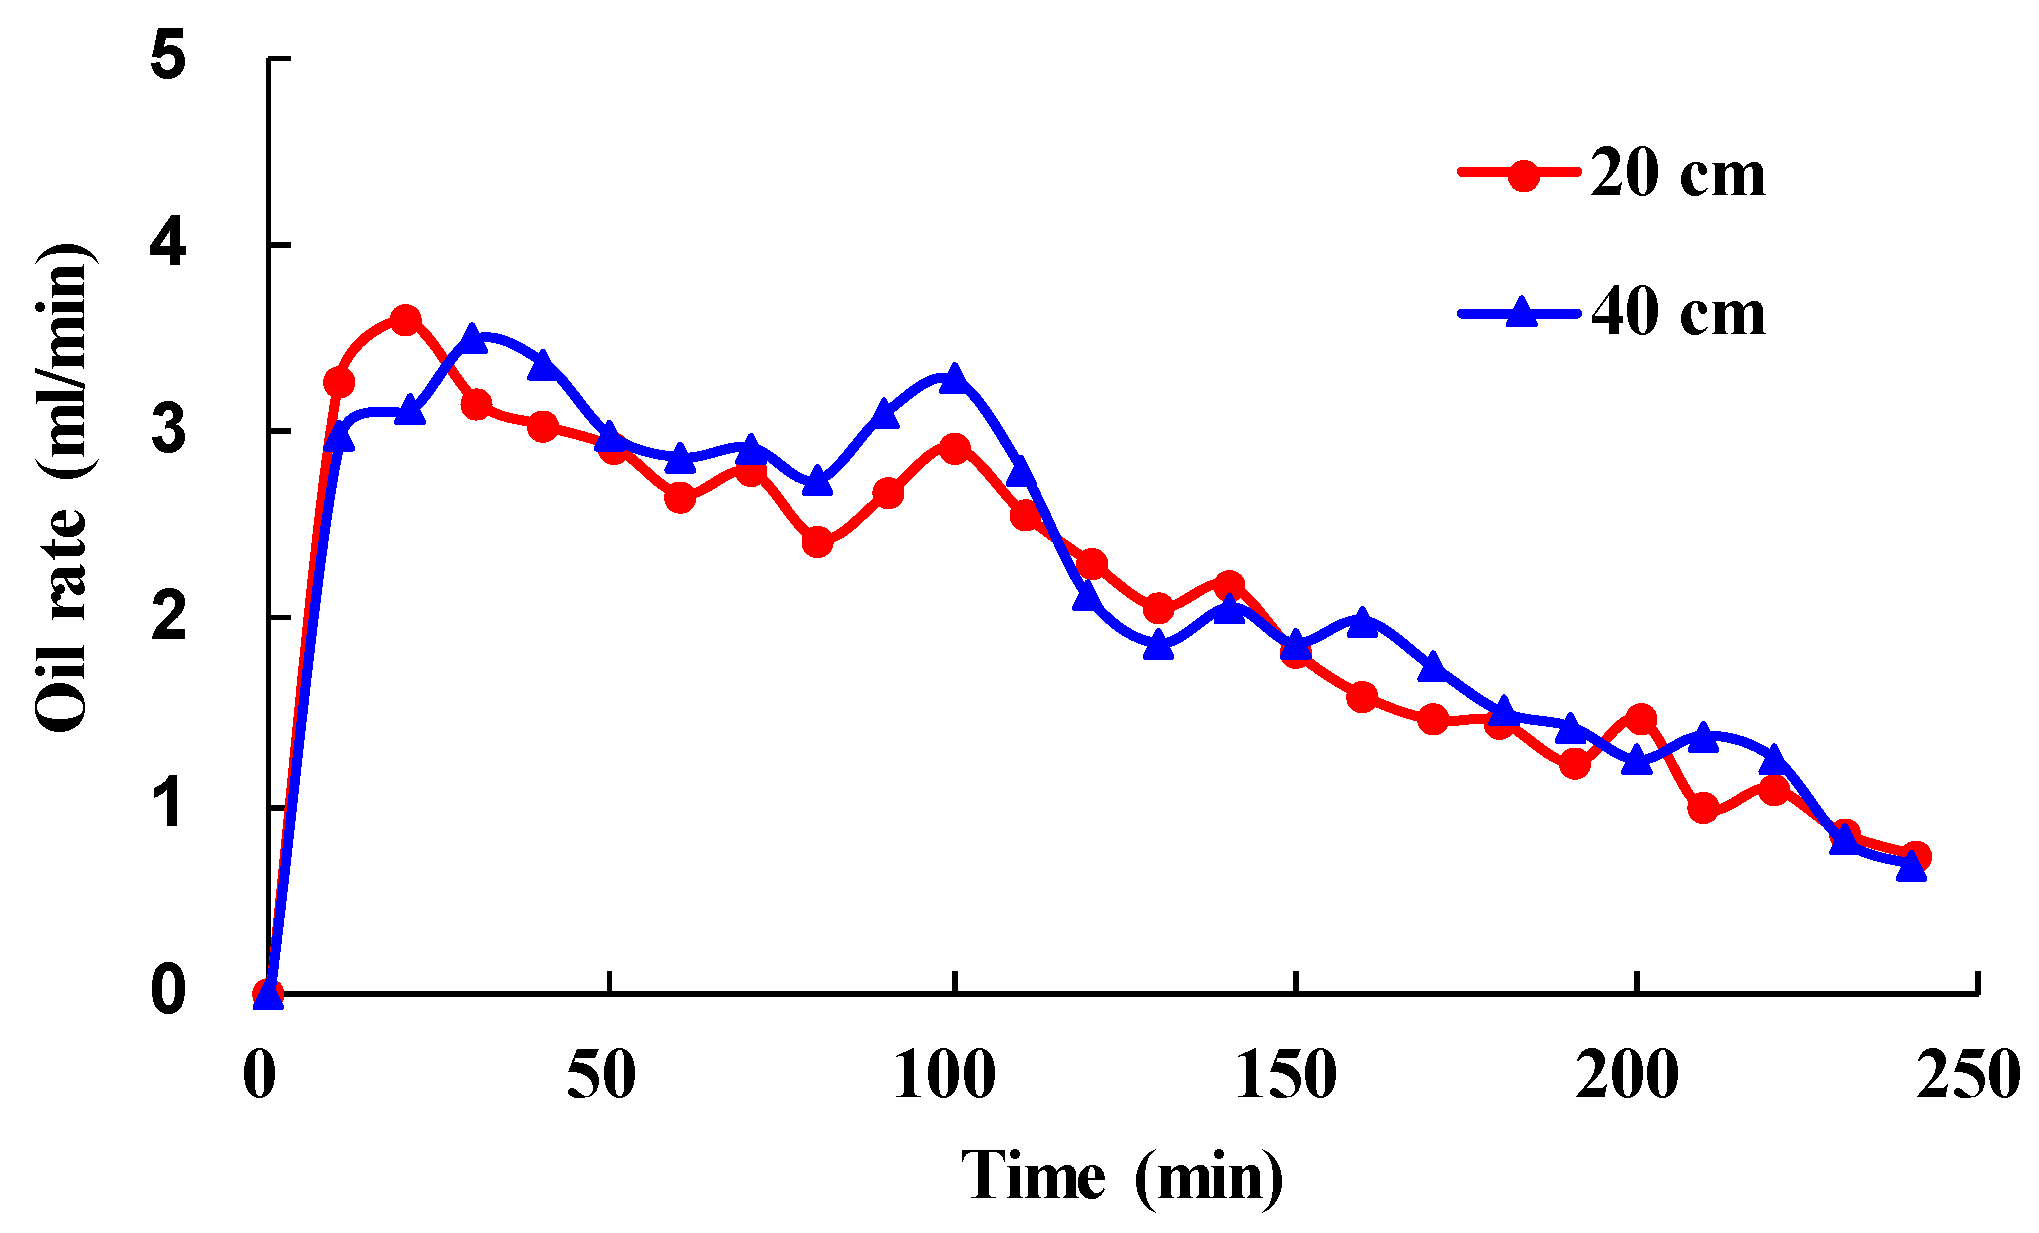
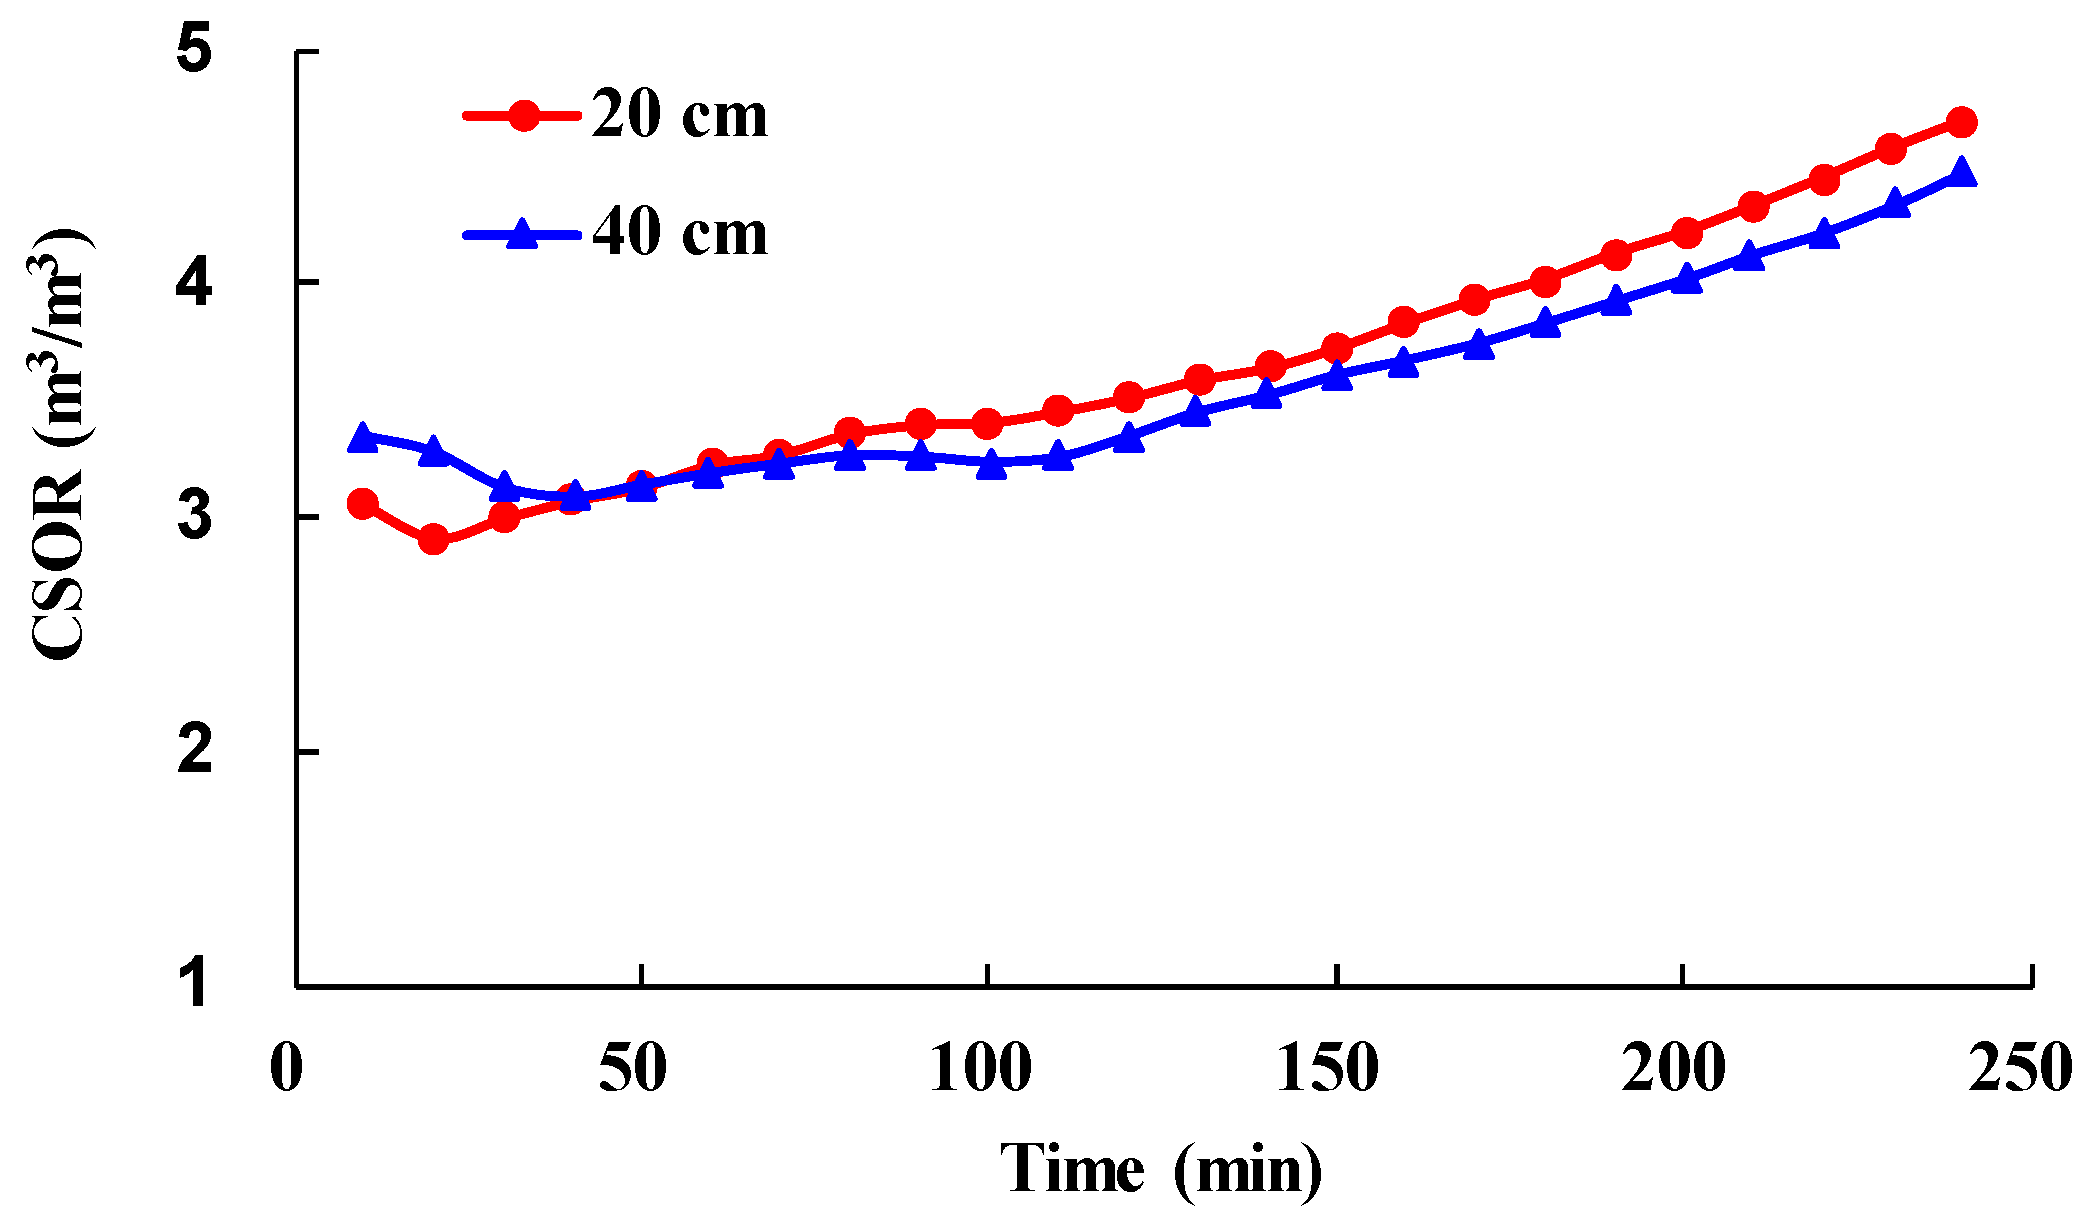
An investigation of the steam drive and gravity drainage (SDGD) process by placing both the injector and the producer in the BTZ was conducted using 2D physical simulations to compare the horizontal well spacings of 20 cm and 40 cm. As the well spacing increases from 20 cm to 40 cm, the lateral steam chamber development accelerates while the vertical steam chamber growth slightly slows down, and it achieves a similar peak oil rate but a longer stable production period.
(2)
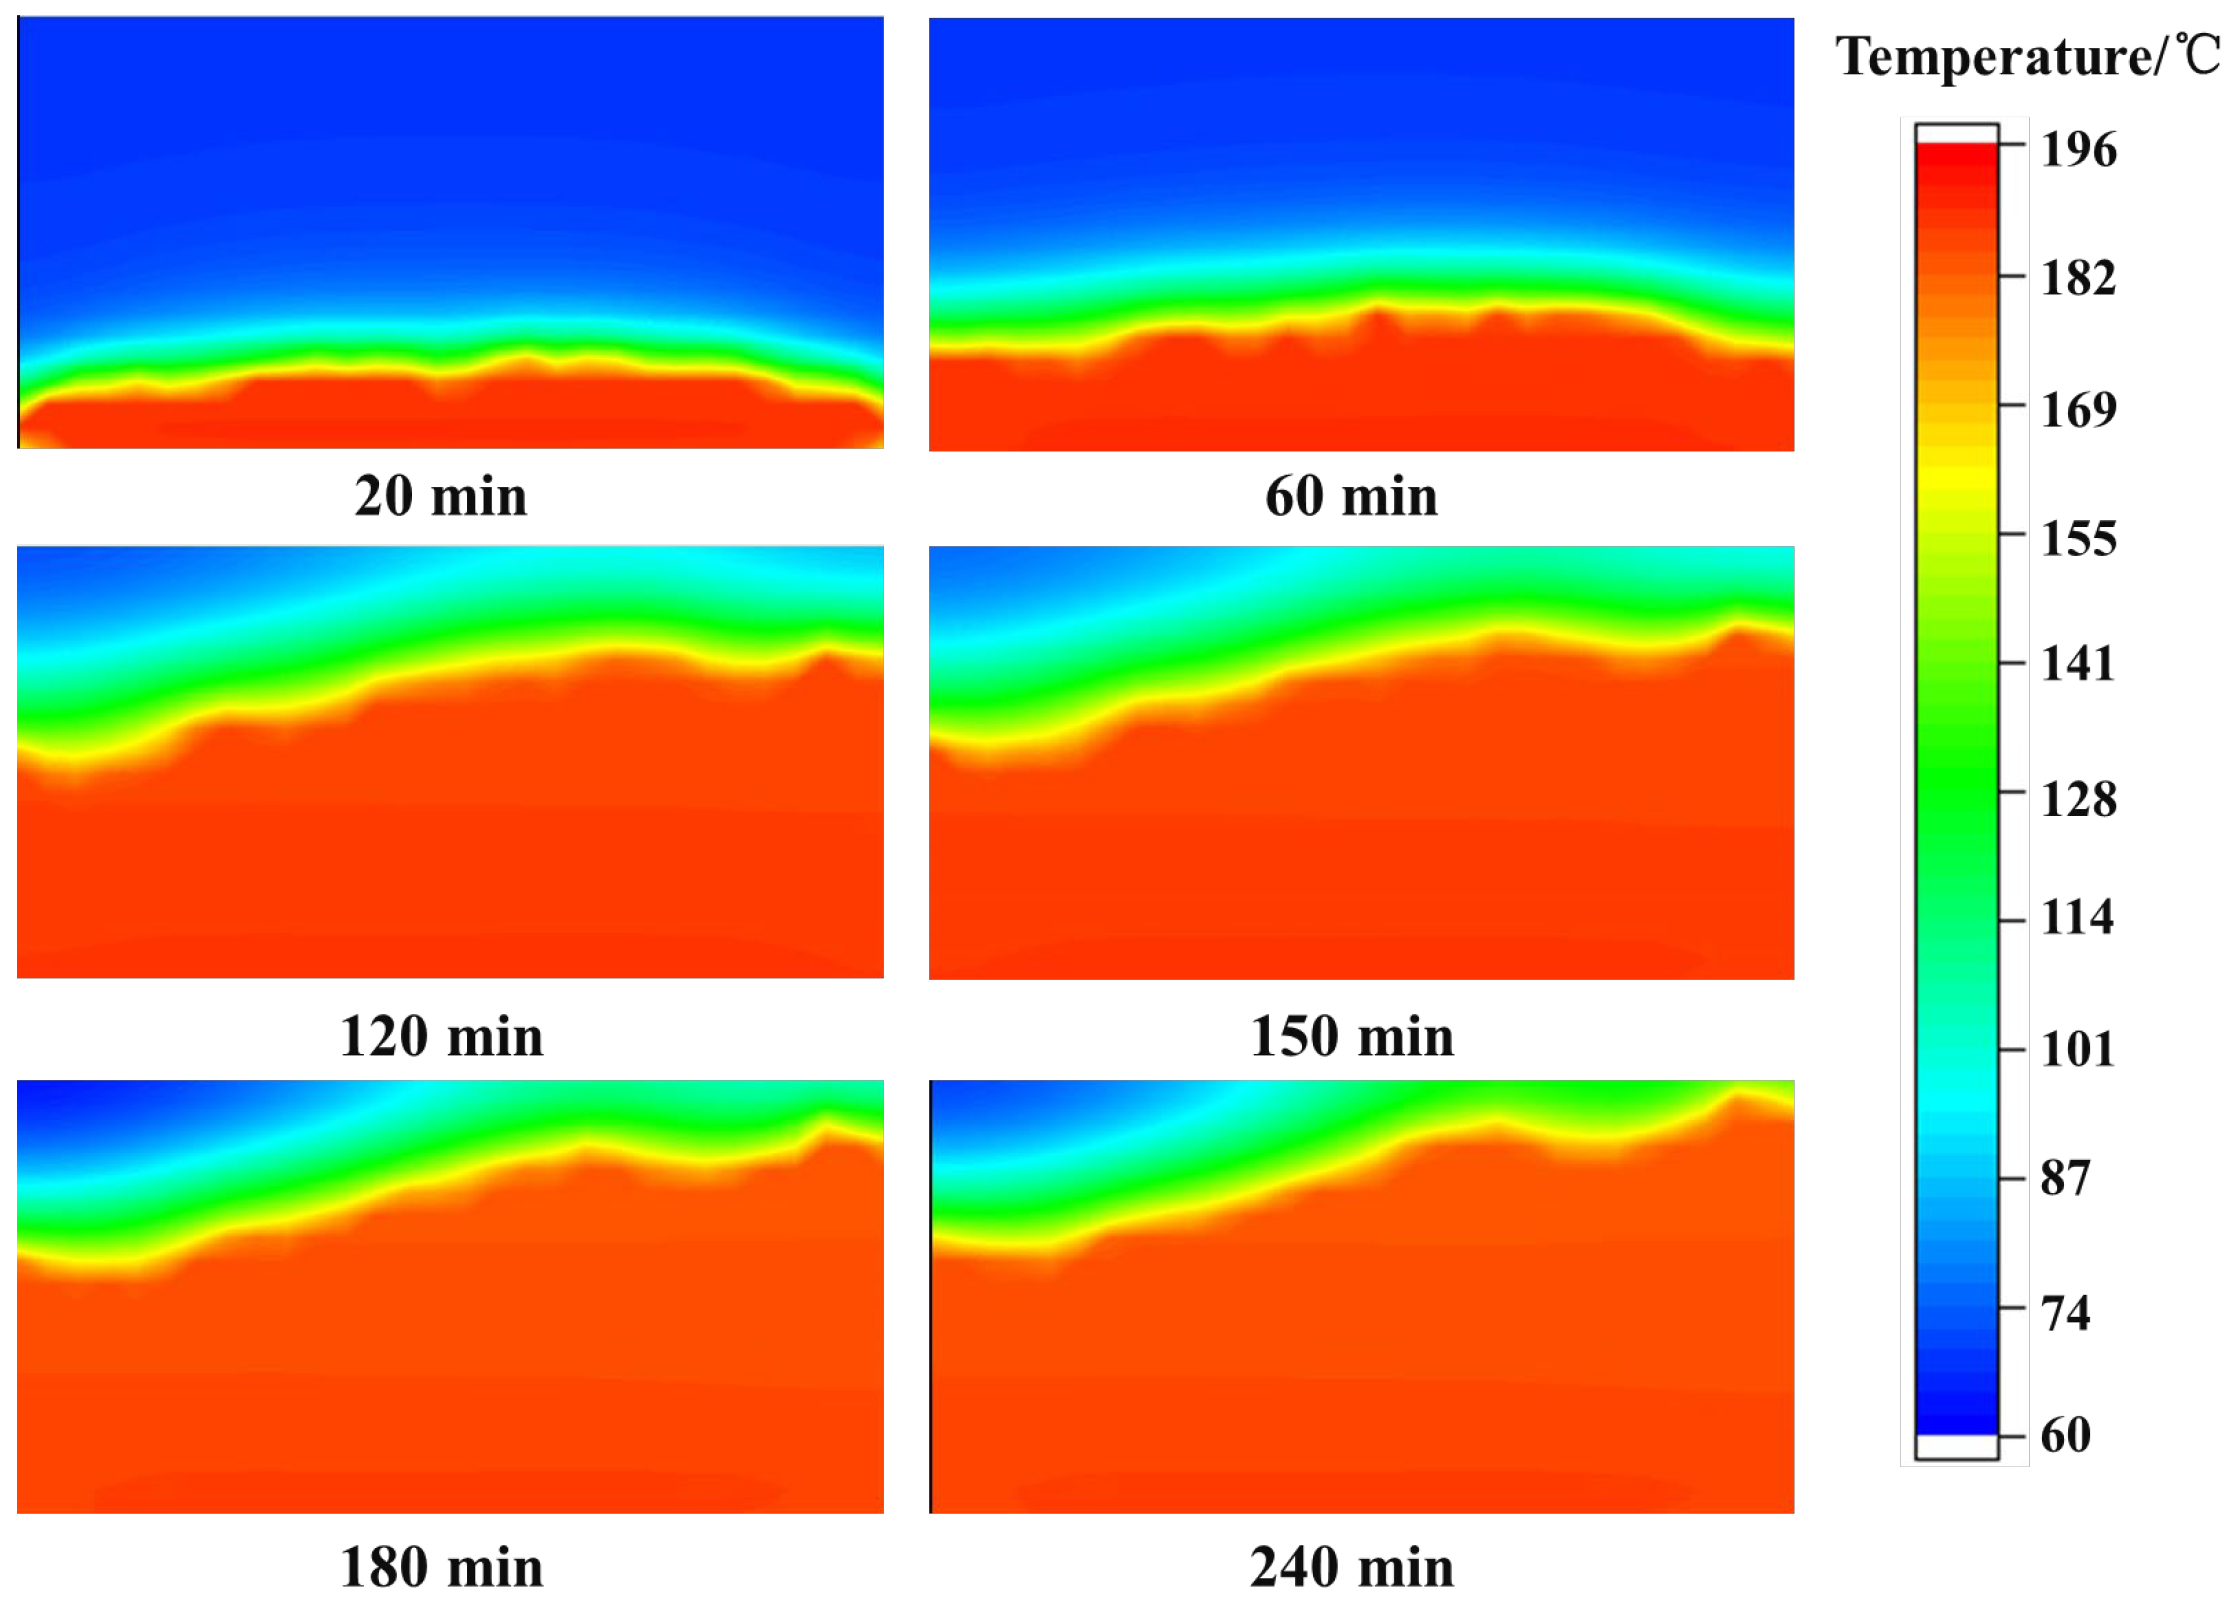
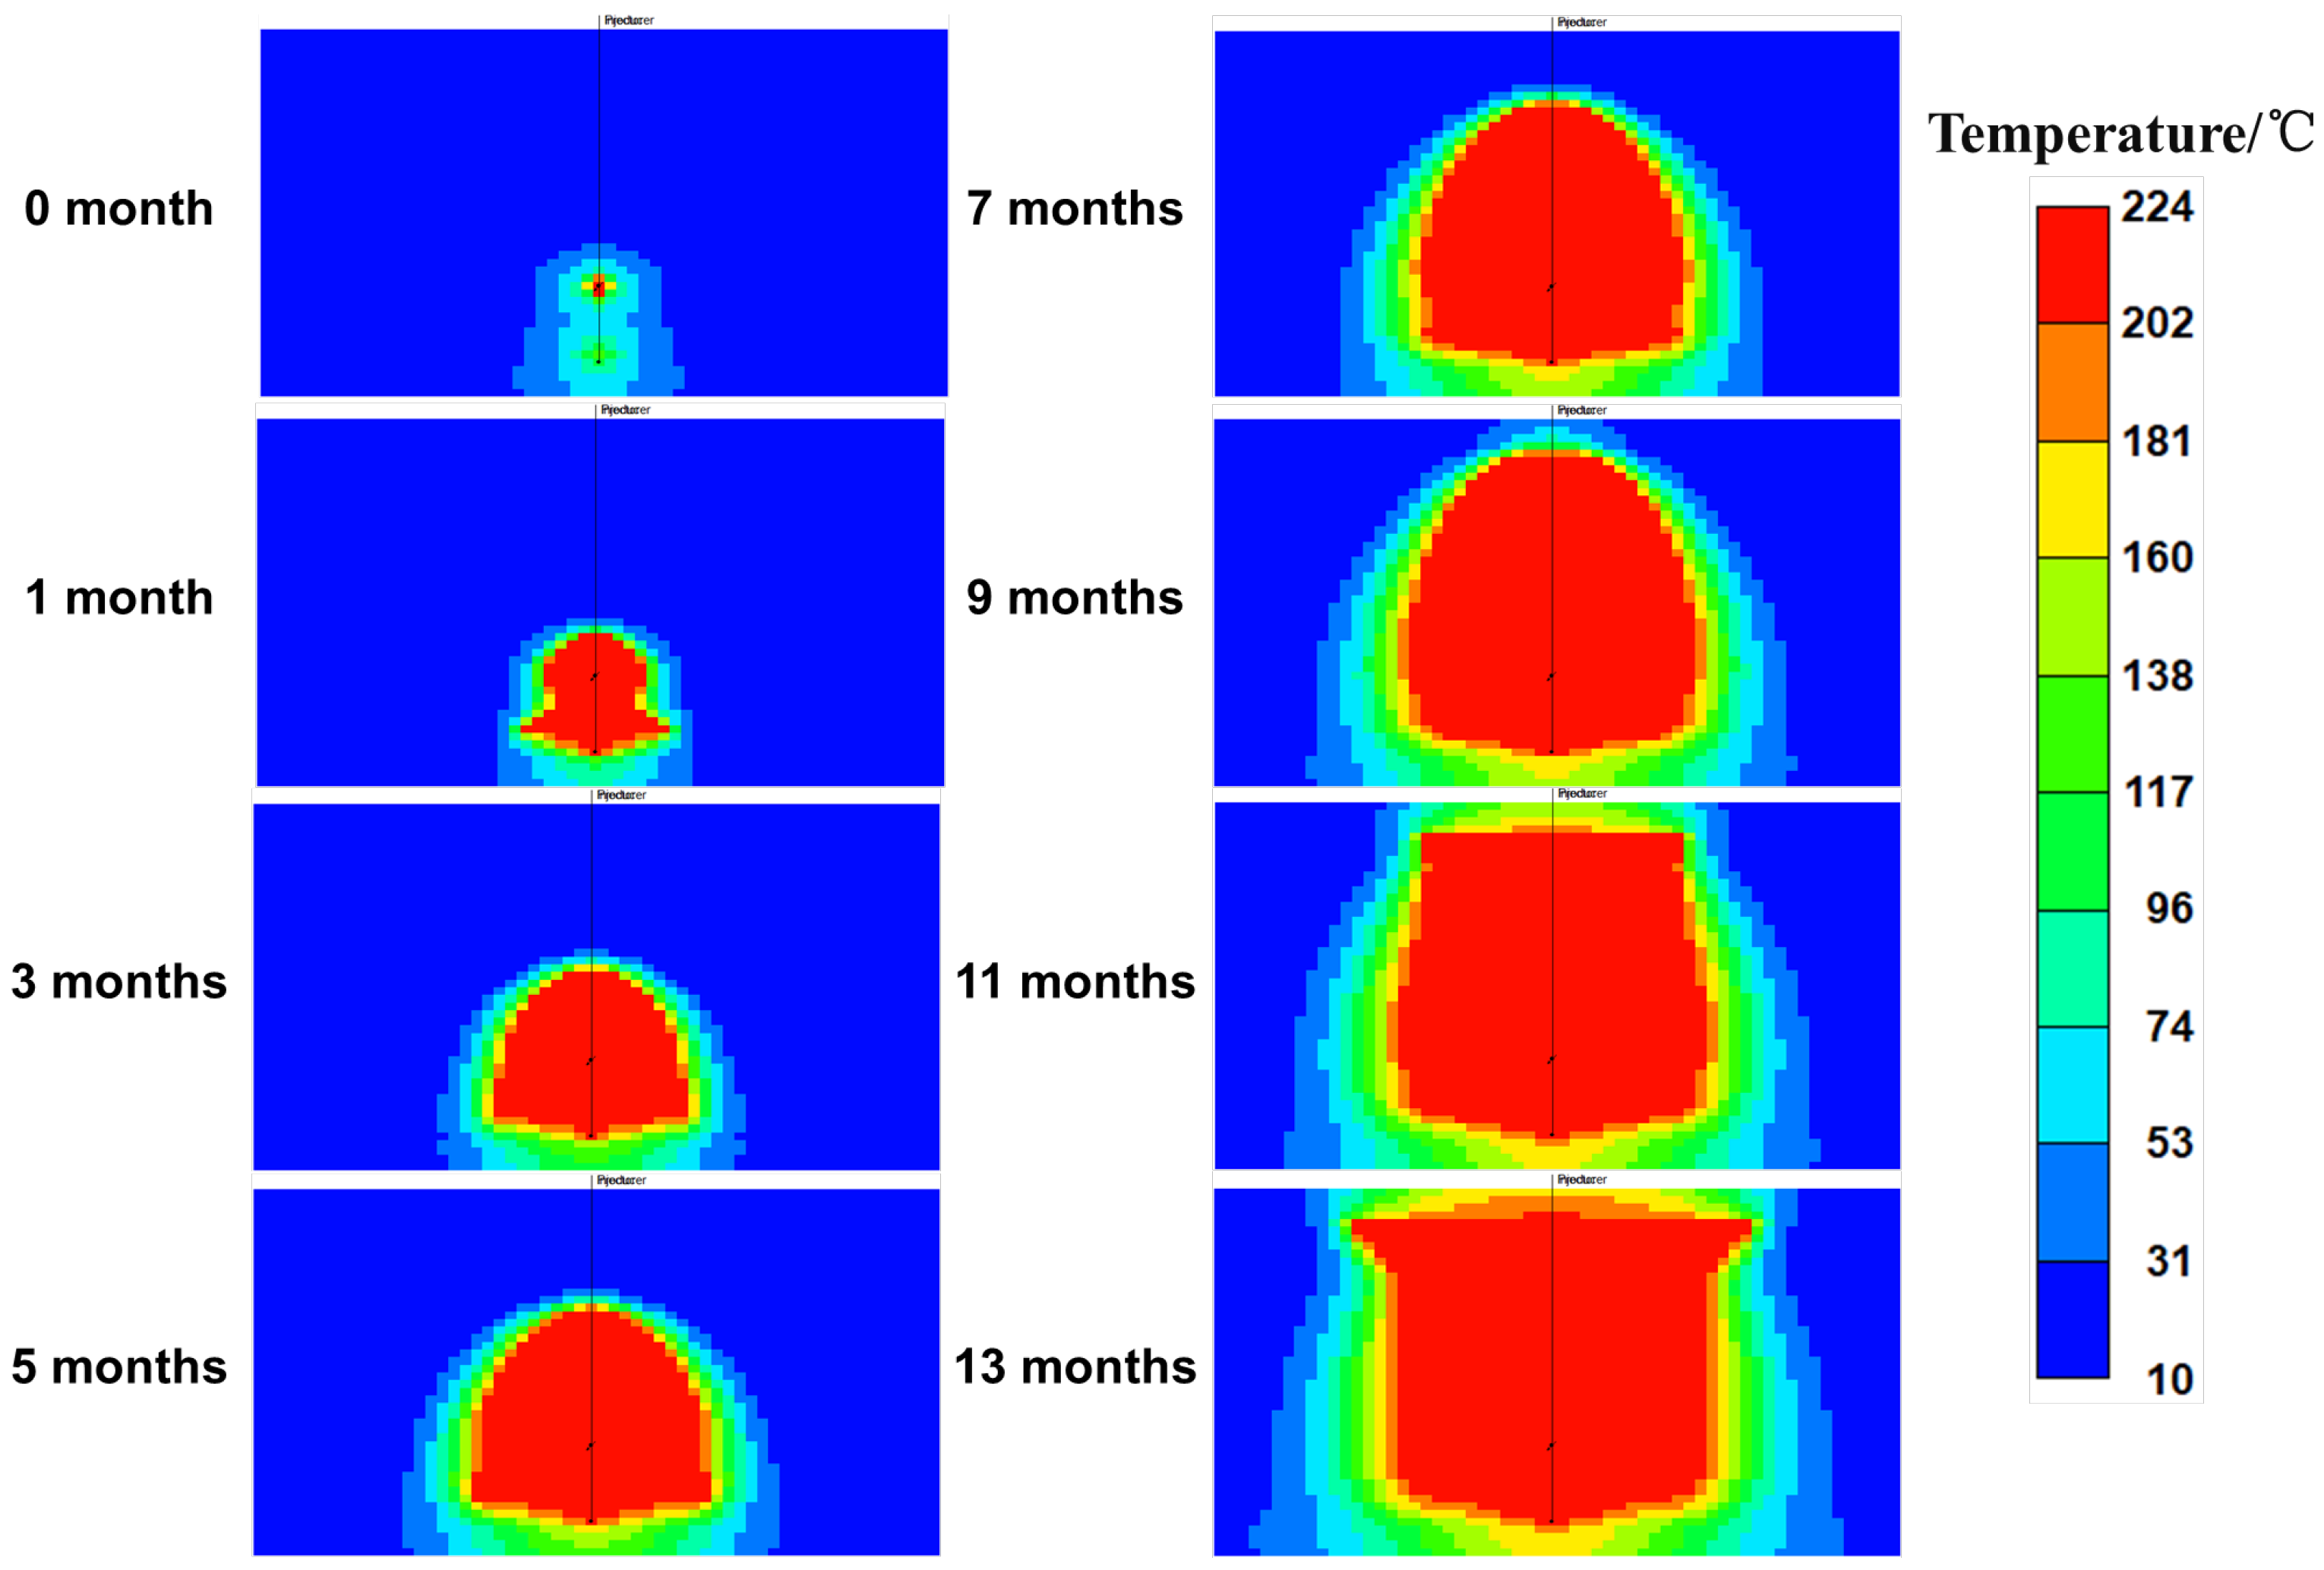
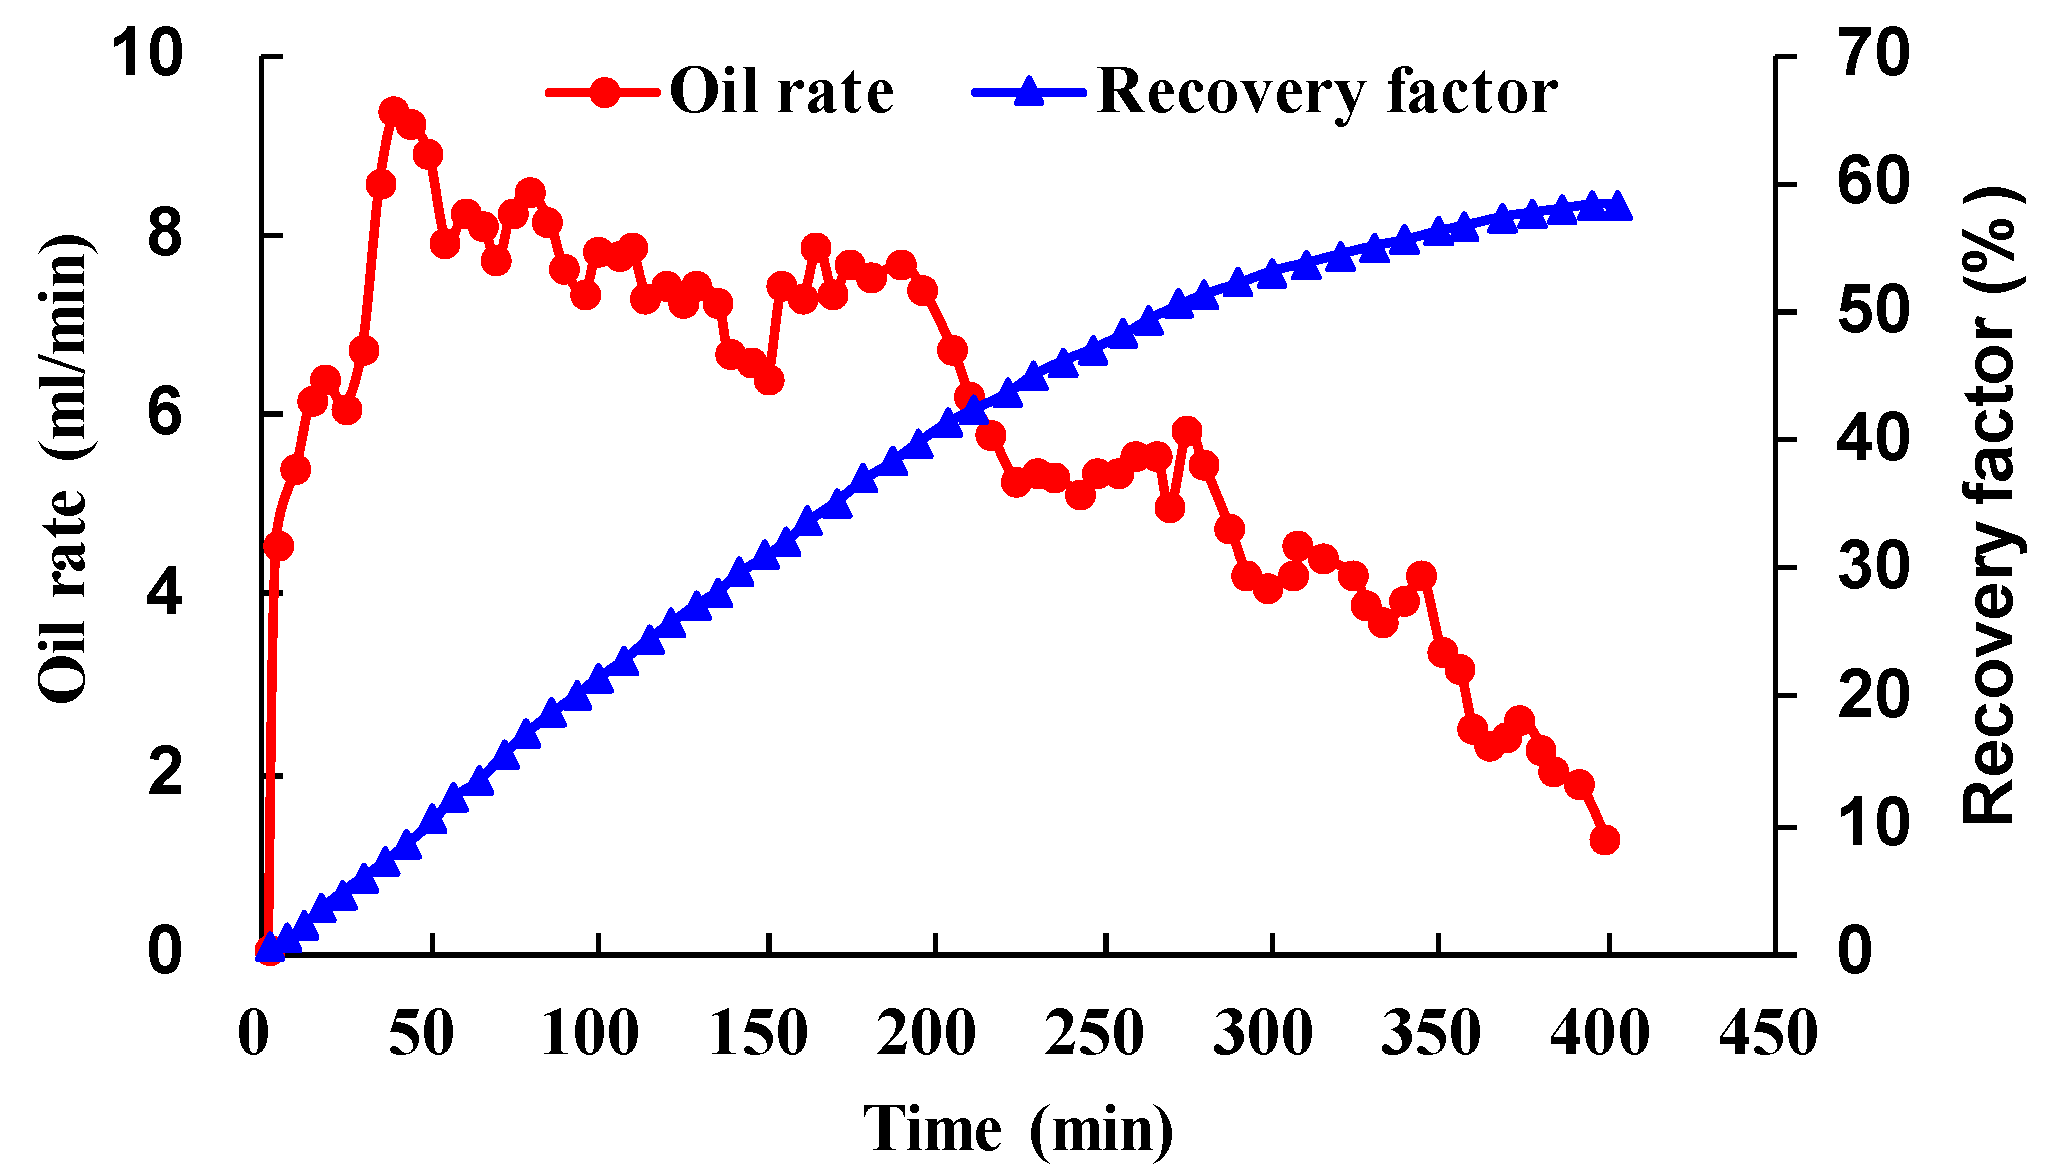
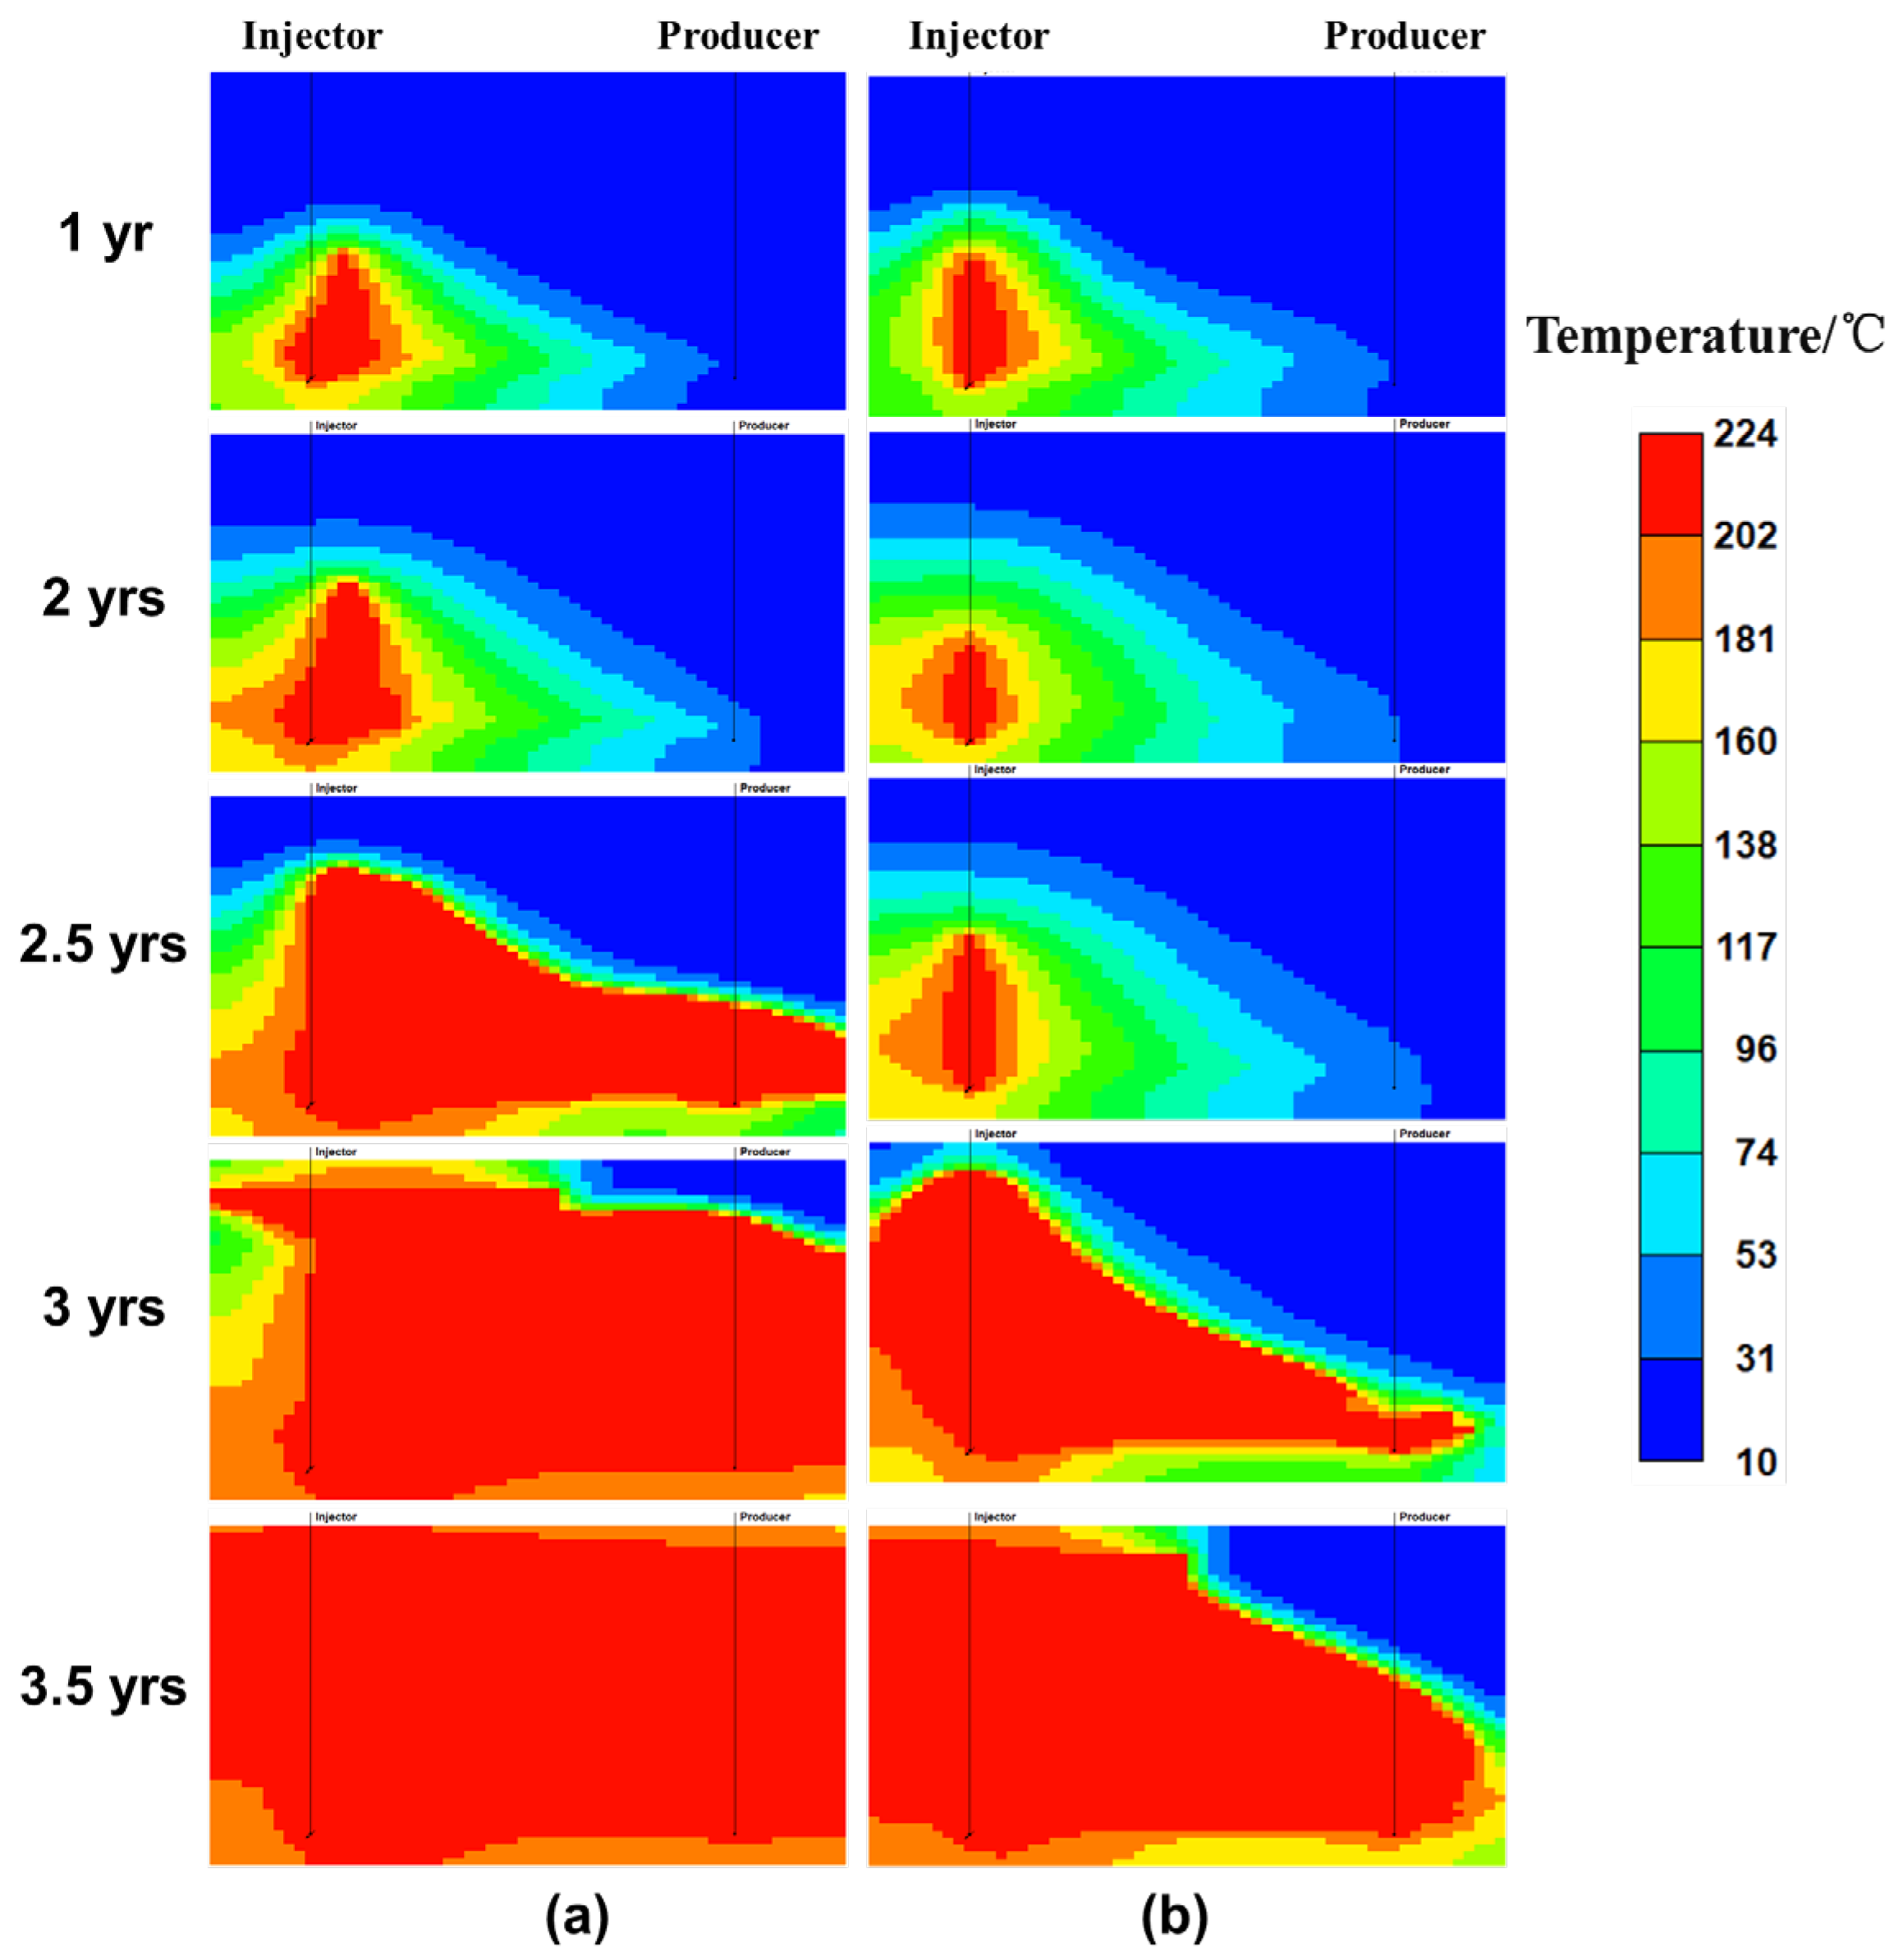
Based on a 40 cm well spacing, 3D physical simulation of the SDGD process was further carried out to analyze the law of steric steam chamber development. Similar to 2D physical simulations, the whole process can be divided into three stages. In the early stage, the steam chamber initially forms near the injector and gradually moves towards the producer mainly under the action of horizontal steam drive. In the middle stage, the vertical steam chamber begins to grow, and the top oil heated by the overlying steam drains downwards to the producer under the synergistic effect of steam drive and gravity drainage. In the late stage, lateral steam chamber development gradually stops and oil production rapidly declines.
(3)
To further evaluate the potential of the SDGD process, a series of sensitivity analyses were conducted using 2D numerical simulations. The findings revealed that: SDGD in the BTZ with enhanced permeability through dilation stimulation can achieve better performance than the SAGD process; the adverse effect is greater for shale laminae distributed near the injector than the producer; both the horizontal and vertical permeability can affect the producing timing; and the thickness, water saturation, and extended range of the confined BTZ have relatively minimal influence.

Author Contributions

Conceptualization, Q.X. and G.L.; data curation, C.L.; formal analysis, Q.X.; funding acquisition, R.W.; investigation, Q.X.; methodology, G.L.; project administration, R.W.; resources, S.L.; supervision, S.L.; validation, R.W. and M.F.; visualization, C.L.; writing—original draft, Q.X.; writing—review and editing, Q.X. and G.L. All authors have read and agreed to the published version of the manuscript.

Funding

This research was funded by China National Oil and Gas Exploration and Development Company Project (No. 2023-YF-01-10).

Institutional Review Board Statement

Not applicable.

Informed Consent Statement

Not applicable.

Data Availability Statement

Data are contained within the present article.

Acknowledgments

The study was supported by the Research Institute of Petroleum Exploration & Development, PetroChina Company Limited. The authors would like to thank RIPED and CNPC for their support and permission to publish this work.

Conflicts of Interest

The authors declare no conflict of interest. The funders had no role in the design of the study; in the collection, analyses, or interpretation of data; in the writing of the manuscript; or in the decision to publish the results.

Abbreviations

BTZBottom oil–water transition zone.
SAGDSteam-assisted gravity drainage.
SDGDSteam drive and gravity drainage.
2DTwo-dimensional.
3DThree dimensional.
SORSteam-to-oil ratio.
CSORCumulative steam-to-oil ratio.
BuGAPDBottom-up gravity-assisted pressure drive.
SubcoolInter-well temperature difference reflecting the subcooled produced liquid.
K h Horizontal permeability.
K v Vertical permeability.
S w Water saturation.

References

  1. Bulter, R.M.; Stephens, D.J. The gravity drainage of steam-heated heavy oil to parallel horizontal wells. J. Can. Pet. Technol. 1981, 20, 90–96. [Google Scholar]
  2. Masih, S.; Ma, K.; Sanchez, J.; Patino, F.; Boida, L. The effect of bottom water coning and its monitoring for optimization in SAGD. In Proceedings of the SPE Heavy Oil Conference Canada, Calgary, AB, Canada, 12–14 June 2012. [Google Scholar]
  3. Masih, S.; Rodriguez, M.; Williams, A. Integration of 4D seismic data for well optimization in SAGD. In Proceedings of the SPE Heavy Oil Conference, Calgary, AB, Canada, 10–12 June 2014. [Google Scholar]
  4. Delamaide, E. Senlac, the forgotten SAGD project. In Proceedings of the SPE Middle East Oil & Gas Show and Conference, Manama, Kingdom of Bahrain, 6–9 March 2017. [Google Scholar]
  5. Sugianto, S.S.; Butler, R.M. The production of conventional heavy oil reservoirs with bottom water using steam-assisted gravity drainage. J. Can. Pet. Technol. 1990, 29, 78–86. [Google Scholar]
  6. Liu, D.; Liu, Y.H.; Lai, N.J. Integrating Physical and Numerical Simulation of Horizontal Well Steam Flooding in a Heavy Oil Reservoir. J. Energy Resour. Technol. 2023, 145, 062601. [Google Scholar] [CrossRef]
  7. Anbari, H.; Robinson, J.P.; Greaves, M. Field performance and numerical simulation study on the toe to heel air injection (THAI) process in a heavy oil reservoir with bottom water. J. Pet. Sci. Eng. 2022, 220, 36–43. [Google Scholar] [CrossRef]
  8. Rabiu Ado, M.; Greaves, M.P.; Rigby, S. Numerical simulation investigations of the applicability of THAI in situ combustion process in heavy oil reservoirs underlain by bottom water. Pet. Res. 2023, 8, 36–43. [Google Scholar]
  9. Peterson, J.A.; Riva, D.T.; Connelly, M.E.; Solanki, S.C.; Edmunds, N.R. Conducting SAGD in shoreface oil sands with associated basal water. J. Can. Pet. Technol. 2010, 49, 74–79. [Google Scholar] [CrossRef]
  10. Yuan, Y.G.; Dong, M.Z. Bottom-Up Gravity-Assisted Pressure Drive. U.S. Patent 2017/0130572 A1, 11 May 2017. [Google Scholar]
  11. Ali; Farouq, S.M. Effect of Bottom Water and Gas Cap on Thermal Recovery. In Proceedings of the SPE Western Regional Meeting, Ventura, CA, USA, 23–25 March 1983. [Google Scholar]
  12. Sun, X.G.; Xu, B.; Qian, G.B. The application of geomechanical SAGD dilation startup in a Xinjiang oil field heavy-oil reservoir. J. Pet. Sci. Eng. 2021, 196, 107670. [Google Scholar] [CrossRef]
  13. Brissenden, S.J. Steaming uphill: Using J-wells for CSS at Peace River. In Proceedings of the Canadian International Petroleum Conference, Calgary, AB, Canada, 7–9 June 2005. [Google Scholar]
  14. Dragani, J.M.; Drover, K.T. Enhanced SAGD startup techniques for improved thermal efficiency and conformance—A field test based on investigation. In Proceedings of the SPE Canada Heavy Oil Technical Conference, Calgary, AB, Canada, 7–9 June 2016. [Google Scholar]
  15. Yuan, Y.G.; Yang, B.H.; Xu, B. Fracturing in the oil-sands reservoirs. In Proceedings of the Canadian Unconventional Resources Conference, Calgary, AB, Canada, 15–17 November 2011. [Google Scholar]
  16. Yuan, Y.G.; Xu, B.; Yang, B.H. Application of geomechanics in heavy oil production—Advanced Canadian experience. In Proceedings of the ISRM 7th International Symposium on Geomechanics, Medellin, DC, USA, 13–16 March 2017. [Google Scholar]
  17. Yuan, Y.G. Hydraulic dilation stimulation to improve steam injectivity and conformance in thermal heavy oil production. In Proceedings of the SPE International Heavy Oil Conference and Exhibition, Kuwait City, Kuwait, 10–12 December 2018. [Google Scholar]
  18. Sun, X.; Qian, G.; Xu, B. SAGD dilation startup and its applications in a shallow super heavy-oil reservoir in Xinjiang Oil Field, China. In Proceedings of the 54th US Rock Mechanics/Geomechanics Symposium, Golden, CO, USA, 28 June–1 July 2020. [Google Scholar]
  19. Cokar, M.; Kallos, M.S.; Gates, I.D. Reservoir simulation of steam fracturing in early cycle cyclic steam stimulation. SPE Reserv. Eval. Eng. 2010, 15, 676–687. [Google Scholar] [CrossRef]
  20. Saeedi, M.; Settari, A.T. SAGD operation in interbedded sands with application of horizontal multistage fracturing: Geomechanics and fracturing aspects. In Proceedings of the SPE Canada Heavy Oil Technical Conference, Golden, CO, USA, 7–9 June 2016. [Google Scholar]
  21. Chen, Q.; Gerritsen, M.G.; Kovscek, A.R. Effects of reservoir heterogeneities on the steam-assisted gravity drainage process. SPE Reserv. Eval. Eng. 2008, 11, 921–932. [Google Scholar] [CrossRef]
Figure 1. Sketch map of SDGD process in the BTZ: (a) 20 cm of horizontal well spacing; (b) 40 cm of horizontal well spacing.
Energies 16 06302 g001
Figure 2. 2D physical simulation flow chart of SDGD process in the BTZ.
Energies 16 06302 g002
Figure 3. Steam chamber development represented by oil saturation for SDGD process in the BTZ at 20 cm well spacing in 2D physical simulation.
Energies 16 06302 g003
Figure 4. Steam chamber development represented by temperature for SDGD process in the BTZ at 20 cm well spacing in 2D physical simulation.
Energies 16 06302 g004
Figure 5. Steam chamber development represented by oil saturation for SDGD process in the BTZ at 40 cm well spacing in 2D physical simulation.
Energies 16 06302 g005
Figure 6. Steam chamber development represented by temperature for SDGD process in the BTZ at 40 cm well spacing in 2D physical simulation.
Energies 16 06302 g006
Figure 7. Oil rate comparison between 20 cm and 40 cm spacing for SDGD process in the BTZ based on 2D physical simulation.
Energies 16 06302 g007
Figure 8. CSOR comparison between 20 cm and 40 cm spacing for SDGD process in the BTZ based on 2D physical simulation.
Energies 16 06302 g008
Figure 9. Water cut comparison between 20 cm and 40 cm spacing for SDGD process in the BTZ based on 2D physical simulation.
Energies 16 06302 g009
Figure 10. Recovery factor comparison between 20 cm and 40 cm spacing for SDGD process in the BTZ based on 2D physical simulation.
Energies 16 06302 g010
Figure 11. Lateral steam chamber development for SDGD process in the BTZ at 40 cm well spacing in 3D physical model.
Energies 16 06302 g011
Figure 12. Steam chamber development along horizontal section for SDGD process at 40 cm well spacing in 3D physical model.
Energies 16 06302 g012
Figure 13. Oil rate and recovery factor for SDGD process in the BTZ at 40 cm well spacing in 3D physical model.
Energies 16 06302 g013
Figure 14. CSOR and water cut for SDGD process in the BTZ at 40 cm well spacing in 3D physical model.
Energies 16 06302 g014
Figure 15. Oil rate comparison among three schemes: SDGD in the BTZ without dilation, SAGD in the BTZ without dilation, and SAGD above the BTZ without dilation.
Energies 16 06302 g015
Figure 16. Steam chamber development for SDGD process in the BTZ.
Energies 16 06302 g016
Figure 17. Steam chamber development for SAGD process in the BTZ.
Energies 16 06302 g017
Figure 18. Steam chamber volume comparison among three schemes: SDGD in the BTZ, SAGD in the BTZ, and SAGD above the BTZ.
Energies 16 06302 g018
Figure 19. Oil rate comparison among three schemes: SDGD in the BTZ, SAGD in the BTZ, and SAGD above the BTZ.
Energies 16 06302 g019
Figure 20. CSOR comparison among three schemes: SDGD in the BTZ, SAGD in the BTZ, and SAGD above the BTZ.
Energies 16 06302 g020
Figure 21. Oil rate comparison of different vertical spacing for 20 m horizontal spacing.
Energies 16 06302 g021
Figure 22. Oil rate comparison of different vertical spacing for 25 m horizontal spacing.
Energies 16 06302 g022
Figure 23. Oil rate comparison of different oil viscosity reduction.
Energies 16 06302 g023
Figure 24. Two schemes of shale laminae distribution: (a) shale laminae distributed above the injector; (b) shale laminae distributed above the producer.
Energies 16 06302 g024
Figure 25. Steam chamber development comparison between two schemes: (a) shale laminae distributed above the injector; (b) shale laminae distributed above the producer.
Energies 16 06302 g025
Figure 26. Oil rate comparison between shale laminae distributed above the injector and the producer.
Energies 16 06302 g026
Figure 27. The influence of the horizontal permeability of BTZ on oil rate.
Energies 16 06302 g027
Figure 28. The influence of the vertical permeability of BTZ on oil rate.
Energies 16 06302 g028
Figure 29. The influence of water saturation of the BZT on oil rate.
Energies 16 06302 g029
Figure 30. The influence of the thickness of BTZ on oil rate.
Energies 16 06302 g030
Figure 31. The influence of extended range of the BTZ on oil rate.
Energies 16 06302 g031
Table 1. Scaled parameters from the reservoir to the 2D physical model.
ParametersReservoirExperiment
Size/m50 × 150.5 × 0.15
Oil pay thickness/m150.15
Well spacing/m20, 400.2, 0.4
Porosity/%3340
Permeability/10−3μm2325230,020
Oil saturation/%74.280.2
Oil viscosity@50 °C/mPa·s15,600980
Oil density@50 °C/kg·m−31082952
Steam intensity/ t·d−13510 mL/min
Table 2. Scaled parameters from the reservoir to 3D physical model.
ParametersReservoirExperiment
Size/m30 × 30 × 200.3 × 0.3 × 0.2
Well spacing /m400.4
Porosity/%3441
Permeability/10−3μm227004217
Oil saturation/%80.580.2
Oil viscosity@50℃/mPa·s15,6231180
Oil density@50℃/kg·m−310321000
Steam intensity/ t·d−1720 mL/min
Table 3. Parameters settings in 2D numerical simulation model.
ParametersValue
Grid size/m1 × 850, 60 × 0.5 m, 48 × 0.5 m
Horizontal section length/m850
Oil pay thickness/m18
Horizontal permeability in the oil pay/D3.2
Vertical permeability in the oil pay/D1.28
Oil saturation in the oil pay/%80
Oil viscosity@10 °C/mPa·s5.24 × 106
Water saturation in the BTZ/%50
BTZ Thickness/m2.0
Horizontal permeability in the BTZ/D10.0
Vertical Permeability in the BTZ/D6.0
Injection pressure/MPa2.5
Subcool/°C5
Disclaimer/Publisher’s Note: The statements, opinions and data contained in all publications are solely those of the individual author(s) and contributor(s) and not of MDPI and/or the editor(s). MDPI and/or the editor(s) disclaim responsibility for any injury to people or property resulting from any ideas, methods, instructions or products referred to in the content.

