
Assessment of Bark Properties from Various Tree Species in Terms of Its Hydrophobicity and Energy Suitability


1
Department of Applied Bioeconomy, Wroclaw University of Environmental and Life Sciences, Chełmońskiego St. 37a, 51-630 Wroclaw, Poland
2
Faculty of Environmental Science and Technology, Wroclaw University of Environmental and Life Sciences, 50-363 Wroclaw, Poland
*
Author to whom correspondence should be addressed.
Energies 2023, 16(18), 6586; https://doi.org/10.3390/en16186586
Submission received: 26 July 2023
/
Revised: 1 September 2023
/
Accepted: 7 September 2023
/
Published: 13 September 2023
(This article belongs to the Section A4: Bio-Energy)
Abstract
:Wood bark is a by-product of the forestry industry with significant quantitative potential. Due to the higher heating value and hydrophobic character (dictated by the content of hydrophobic extracts in the chemical composition of the bark) facilitating long-term storage and transport, bark is considered a valuable material to be integrated into the energy industry as a substrate for combustion and co-combustion. However, the heterogeneous structure of the biomass causes significant differences in these parameters between different types of bark. For this reason, this study aimed to analyze the energy usefulness and hydrophobicity of 14 species of bark occurring in large amounts across Europe. Bark’s higher heating value has been shown to range from 17.239 MJ·kg−1 ± 0.318 MJ·kg−1 to 21.618 MJ·kg−1 ± 0.375 MJ·kg−1, and most species are extremely hydrophobic in the WDPT (water drop penetration time; 70–10,495 s) and MED (molarity ethanol droplet; 8.5–24%) tests. Nevertheless, the statistically significant differences between the species in the hydrophobicity tests indicate that the storage of individual types of bark should be adapted to the species and preceded by an analysis of its hydrophobicity. It was also shown that the WDPT test seems to be more suitable for the analysis of highly hydrophobic biomasses, due to the possibility of better differentiation of the level of hydrophobicity between species showing the same degree of hydrophobicity. In addition, the best type of bark that could be implemented in the power industry from the point of view of hydrophobicity and combustion characteristics was Silver Birch bark.
1. Introduction
Tree bark is the most plentiful solid residue from the forestry and wood processing industries [1]. Using a bark ratio (share of bark in a whole tree) of 10%, it is estimated that the annual amount of this raw material is about 300–400 million m3 [2,3]. Such a significant amount of biomass residue causes various industries to look for effective ways to use the potential of this material appropriately. The valuable chemical composition of tree bark makes it possible to integrate this substrate into the cosmetics, food, and herbal medicine sectors [4,5], charcoal production, use as a soil conditioner or mulch, and several other industrial applications [6,7,8,9]. However, one of the most popular directions for tree bark is its thermal conversion in power engineering [10,11].
The thermal conversion and energy usefulness of tree bark are still the subject of scientific disputes. The calorific value of wood bark biomass ranges from 15 to 23 MJ·kg−1, depending on the species evaluated [12,13,14]. Many researchers have shown that bark has a higher heating value than wood [15,16,17,18,19,20]. According to Lykidis et al. [15] and Szyszlak-Bargłowicz et al. [21], the differences are associated with the presence of a high amount of ash in bark and the increased loss of volatile compounds during its drying [15]. Meyer and Mina [22], based on [23,24], stated that the negative aspects of using bark for energy purposes are related to the presence of resins and minerals in its chemical composition, which can lead to high emissions of particulate matter (PM), black carbon (BC), and organic substances during combustion. However, it should be emphasized that selecting the proper combustion technology plays a vital role in pollutant emissions. Data on Austrian biomass combustion plants, where bark was one of the substrates, showed low emission levels [25]. In addition, the authors pointed out that the obtained results can be further reduced by optimizing the combustion processes [25]. For wood bark biofuel boilers, it is also possible to use fuel additives (sulfonates, carbonyls, naphthalene) that are convenient for effective deposit and corrosion control [26]. Modern methods of counteracting the negative effects of bark combustion, combined with its high energy potential and quantitative resources, increase its potential on the bioenergy market for private and industrial users.
In addition to the standard parameters determining the suitability of wood bark for energy purposes (higher heating value, proximate analysis, elementary analysis), one of the most critical features of this material is its hydrophobicity. It is assumed that the hydrophobic properties of bark result from the nature of the hydrophobic extracts [27,28] present in bark, which are bioactive compounds [29]. The importance of the hydrophobic nature of bark and biomass materials has been explained in detail by Routa et al. [30]. The authors mention that in the logistic chain when using forest biomass, there is always a storage step, which is critical from the point of view of changing biomass moisture [30,31]. Unfortunately, wood bark storage is often primarily overlooked due to focusing mainly on other types of forest raw materials, such as wood chips or forest residues [30,32].
Biomass materials (processed or raw) characterized by a hydrophobic nature are highly valued on the market. This is because most of the obtained biomass has hygroscopic properties, therefore (usually during storage, but also during transport) it is more prone to biodegradation. Cutz et al. [33], based on the observations of other authors [34,35,36,37,38,39], stated that damage to the biomass structure caused by moisture is one of the most crucial parameters affecting self-heating, unforced combustion, pellet attrition, device fouling, or health problems associated with dust particle emissions. Some of these risks can be significantly reduced by appropriate moisture content management, which affects biological processes, chemical processes, and the amount of energy available [40,41]. Therefore, the ability to adsorb moisture and degrade biomass is classified as one of the most critical parameters from the point of view of the processes of harvesting, handling, transporting, and storing this type of raw material [42,43].
Wood bark, which for some species of trees (such as pine) shows hydrophobic properties at low humidity levels [44,45,46,47], seems to be a good material for energy purposes due to the possibility of avoiding some of the abovementioned problems. Moreover, for wood materials, moisture or water significantly affects the functionality of various applications, as it changes properties such as dimensional stability, resistance to decomposition, and mechanical durability [48]. Therefore, hydrophobic biomaterials based on tree bark can contribute to an effective and low-cost increase in the production of electricity and heat from renewable and sustainable sources, increase the use of waste biomass, and serve other industrial purposes.
It is worth emphasizing, however, that the characteristic feature of biomass is the heterogeneity of the chemical composition within several species (or even the same ones) [49,50]. In the case of tree bark, between different tree species, there may be differences in key parameters characterizing energy suitability (e.g., higher heating value) [51], as well as other morphological [52,53] or physicochemical features [54]. In the studies by various scientists, there are also reports of varying levels of hydrophobicity or hydrophilicity in bark extracts [28,55]. Unfortunately, in the literature, there is a critically small number of works related to the general hydrophobicity of various types of tree bark and the possibility of linking these parameters with its energy suitability. Knowledge about the level and dependence of both of these parameters may be crucial for selecting the most valuable species of tree bark for energy purposes or proposing their use in other industries. It will also be possible to optimize the storage processes of wood bark and other processes of the logistics chain where there may be a problem with moisture-induced damage. Therefore, this study aimed to determine the physical-chemical parameters of various types of bark, with particular emphasis on energy and hydrophobicity parameters, and to investigate the possible correlation between these parameters.
2. Materials and Methods
2.1. Tree Bark Species
In this study, 14 species of bark from trees naturally occurring in the environment of central Europe were used. All species were collected in the Lower Silesian Voivodeship (Poland). The species are listed in Table 1.
2.2. Pretreatment and Processing of Bark
The collected tree bark was manually fragmented into smaller pieces and dried. The samples were dried at 105 °C for 24 h in a KBC-65 W drying chamber (WAMED, Warsaw, Poland). The dried tree bark was shredded using an LMN 400 knife mill (TESTCHEM, Pszów, Poland) with a mesh diameter of 1 mm. The dried and shredded samples were subjected to further analyses.
2.3. Physicochemical Properties Determination
2.3.1. Proximate Analysis
The proximate analysis included the following parameters: moisture content (MC), ash content (AC), volatile matter content (VMC), fixed carbon content (FCC), higher heating value (HHV), and lower heating value (LHV). Table 2 presents the procedures and devices used in this test.
2.3.2. Ultimate Analysis
The elemental analysis (C, H, N) was carried out using a FLASH 2000 (Thermo Scientific, Fisher Scientific, Milan, Italy) analyzer and the dynamic combustion technique (combustion process at approx. 900–1000 °C). The analysis was performed by an external laboratory.
2.3.3. Analysis of pH and Electroconductivity
The tree bark’s pH and electroconductivity (eC) were tested using a CPC-411 (CPC-411, Elmetron, Zabrze, Poland). In this test, 1 g of tree bark was dissolved in 10 mL of distilled water (1:10 wt%). The measurement was carried out about 1.5 h after the preparation of the solution. Between individual measurements, the probe was thoroughly rinsed with distilled water.
2.4. Hydrophobic Properties Determination
Two tests were used to determine the hydrophobic properties of the wood bark: the water drop penetration time (WDPT) and the molarity ethanol droplet (MED) tests.
2.4.1. WDPT Test
Samples of tree bark were evenly distributed on a petri dish. Using a pipette, five drops of distilled water were dotted on the surface of bark, and the time after the water was thoroughly soaked into the material’s surface was measured using a stopwatch (Figure 1). Then, the classifications of the material’s hydrophobic properties were adopted, following the applicable ones in Table 3.
2.4.2. MED Test
The MED test was performed based on the methodology described in [64,65]. By diluting pure ethanol with water in different proportions, it is possible to obtain different values of surface tension—thanks to which the surface tension of a drop on the surface of the tested material (wood bark) decreases when a solution with a higher ethanol content is used [64]. The following concentrations of alcohol by volume were prepared: 0%, 1%, 3%, 5%, 8.5%, 13%, 18%, 24%, and 36%.
As in the case of the WDPT test, the material was evenly distributed in a petri dish. A drop was pipetted onto the bark sample, starting with the lowest alcohol concentration. The concentration was increased if the drop did not soak into the material within 3 s. Once the drop penetrated the material within 3 s, the previous concentration was classified as the final result (Figure 2).
2.5. Classification of Hydrophobic and Combustion Suitability of Biomass Bark Species
Classification of the usefulness of tree bark species from the point of view of hydrophobicity and use for energy purposes was carried out using a simplified and assumed point scale for the considered biomass parameters. Four features were assessed: ash content, volatile matter content, higher heating value, and hydrophobicity (based on the WDPT test). The point factors assigned to the relevant parameters are presented in Table 4. Finally, the points are summed up to select the most suitable bark concerning its hydrophobicity and use for energy purposes.
2.6. Statistical Analysis
Statistica 13.0 software (StatSoft—DELL Software, Round Rock, TX, USA) was used for statistical analysis. A one-way analysis of variance (ANOVA) was carried out using the Tukey HSD post hoc test to show statistical differences in the influence of the type of bark on individual physicochemical parameters. The statistical significance level of p = 0.05 was adopted for the performed analyses. Furthermore, the linear correlation coefficient (r) was computed by averaging the parameter results to examine the correlation values among the hydrophobic and physicochemical parameters.
3. Results and Discussion
3.1. Proximate Analysis
Table 5 shows the results of the proximate analysis of the material. Moisture content for the dried tree bark was characterized by the range of 0.47–3.81%, with the lowest results for European Ash (MC = 0.47%) and Common Aspen (MC = 0.53%), and the highest marks for Black Locust (MC = 2.29%) and Common Alder (MC = 3.81%).
In the case of ash content, statistically significantly lowest values of this parameter were recorded for Silver Birch bark (2.71 ± 0.04%), Scots Pine (3.06 ± 0.16%), and Norway Spruce (3.09 ± 0.07%). The highest statistically significant values of ash content were observed for the bark of four tree species: Black Mulberry (10.11 ± 0.05%), White Willow (10.25 ± 0.11%), Horse Chestnut (11.91 ± 0.17%), and Norway Maple (12.09 ± 0.32%). In the remaining cases, the ash content was 5.22–9.80%. Statistically significant differences were also observed between them. The importance of appropriate levels of ash content in biomass fuels is significant and widely commented on by many researchers. According to Contreras-Trejo et al. [66], based on research [67,68], high ash content in the fuel adversely affects the durability and proper operation of the boiler because, e.g., it can reduce efficiency, change the heat transfer characteristics, or accelerate the possibility of damage to the boiler through high-temperature corrosion. Notably, compared to the typical energy substrate, which is wood, bark is characterized by higher amounts of ash, which is caused by the presence of a large amount of mineral substances in its composition [69]. Compared to the remaining species studied, the lowest values of this parameter were observed for bark from Scots Pine and Norway Spruce, a characteristic domain of coniferous tree species [70]. The ash content for these species is similar to the results obtained by other authors, where the values of this parameter are found at the following levels: 0.92–3.04% [71] and 4.6% [72], respectively, for Scots Pine, and 1.33% [73] and 3.3% [74], respectively, for Norway Spruce. Among the examined species of deciduous trees, the lowest ash content was found in Silver Birch bark. A similar relationship was also observed in other studies [75], where a deficient level of ash content distinguished the species compared to other deciduous species.
Analyzing the volatile matter content, it can be seen that the bark from Common Pear (62.16 ± 0.74%) and Horse Chestnut (63.10 ± 0.94%) has the statistically lowest value of this parameter. In turn, statistically significantly, the highest values of volatile matter content were observed in the case of bark from European Ash (74.81 ± 2.21%), Scots Pine (75.02 ± 1.82%), Silver Birch (76.69 ± 0.83%), Largeleaf Linden (74.12 ± 0.56%), and Norway Spruce (72.19 ± 2.73%). The remaining species were characterized by volatile matter content in the 67.50–71.43% range. A small number of statistically significant differences were noted for these species. In the case of fixed carbon content, the lowest values of this parameter were observed for the bark from European Ash (16.98 ± 2.16%) and for the bark from Norway Maple (17.06 ± 2.34%). In turn, the highest values of fixed carbon content were recorded for four species: Common Alder (23.48 ± 1.26%), Norway Spruce (23.85 ± 2.66%), Horse Chestnut (24.26 ± 0.96%), and Common Pear (28.89 ± 0.81%). In the case of the FCC parameter, less variability was observed (regarding the number of statistically significant differences) compared to the AC and VMC parameters. According to [76,77], the volatiles affect the combustion characteristics of the fuel because they are crucial for achieving fast ignition and maintaining a stable flame. Fixed carbon is a char yield after devolatilization [76,77]. Corder [70] commented that a higher fixed carbon content and a lower range of volatile matter than wood characterize bark. The results obtained for Norway Spruce bark are similar to those obtained by other authors (VMC = 74.85%, FCC = 23.04% [78]). Scots Pine’s results differ from those reported in the literature (VMC = 72.4%, FCC = 25.9% [79]). The difference in the test results was also noticed in the case of Common Aspen, where the values of these parameters were VMC = 64.3%, FCC = 15.2% [80]. The results obtained in this experiment indicate that varied levels of VMC and FCC for different species of tree bark can cause differences in combustion characteristics.
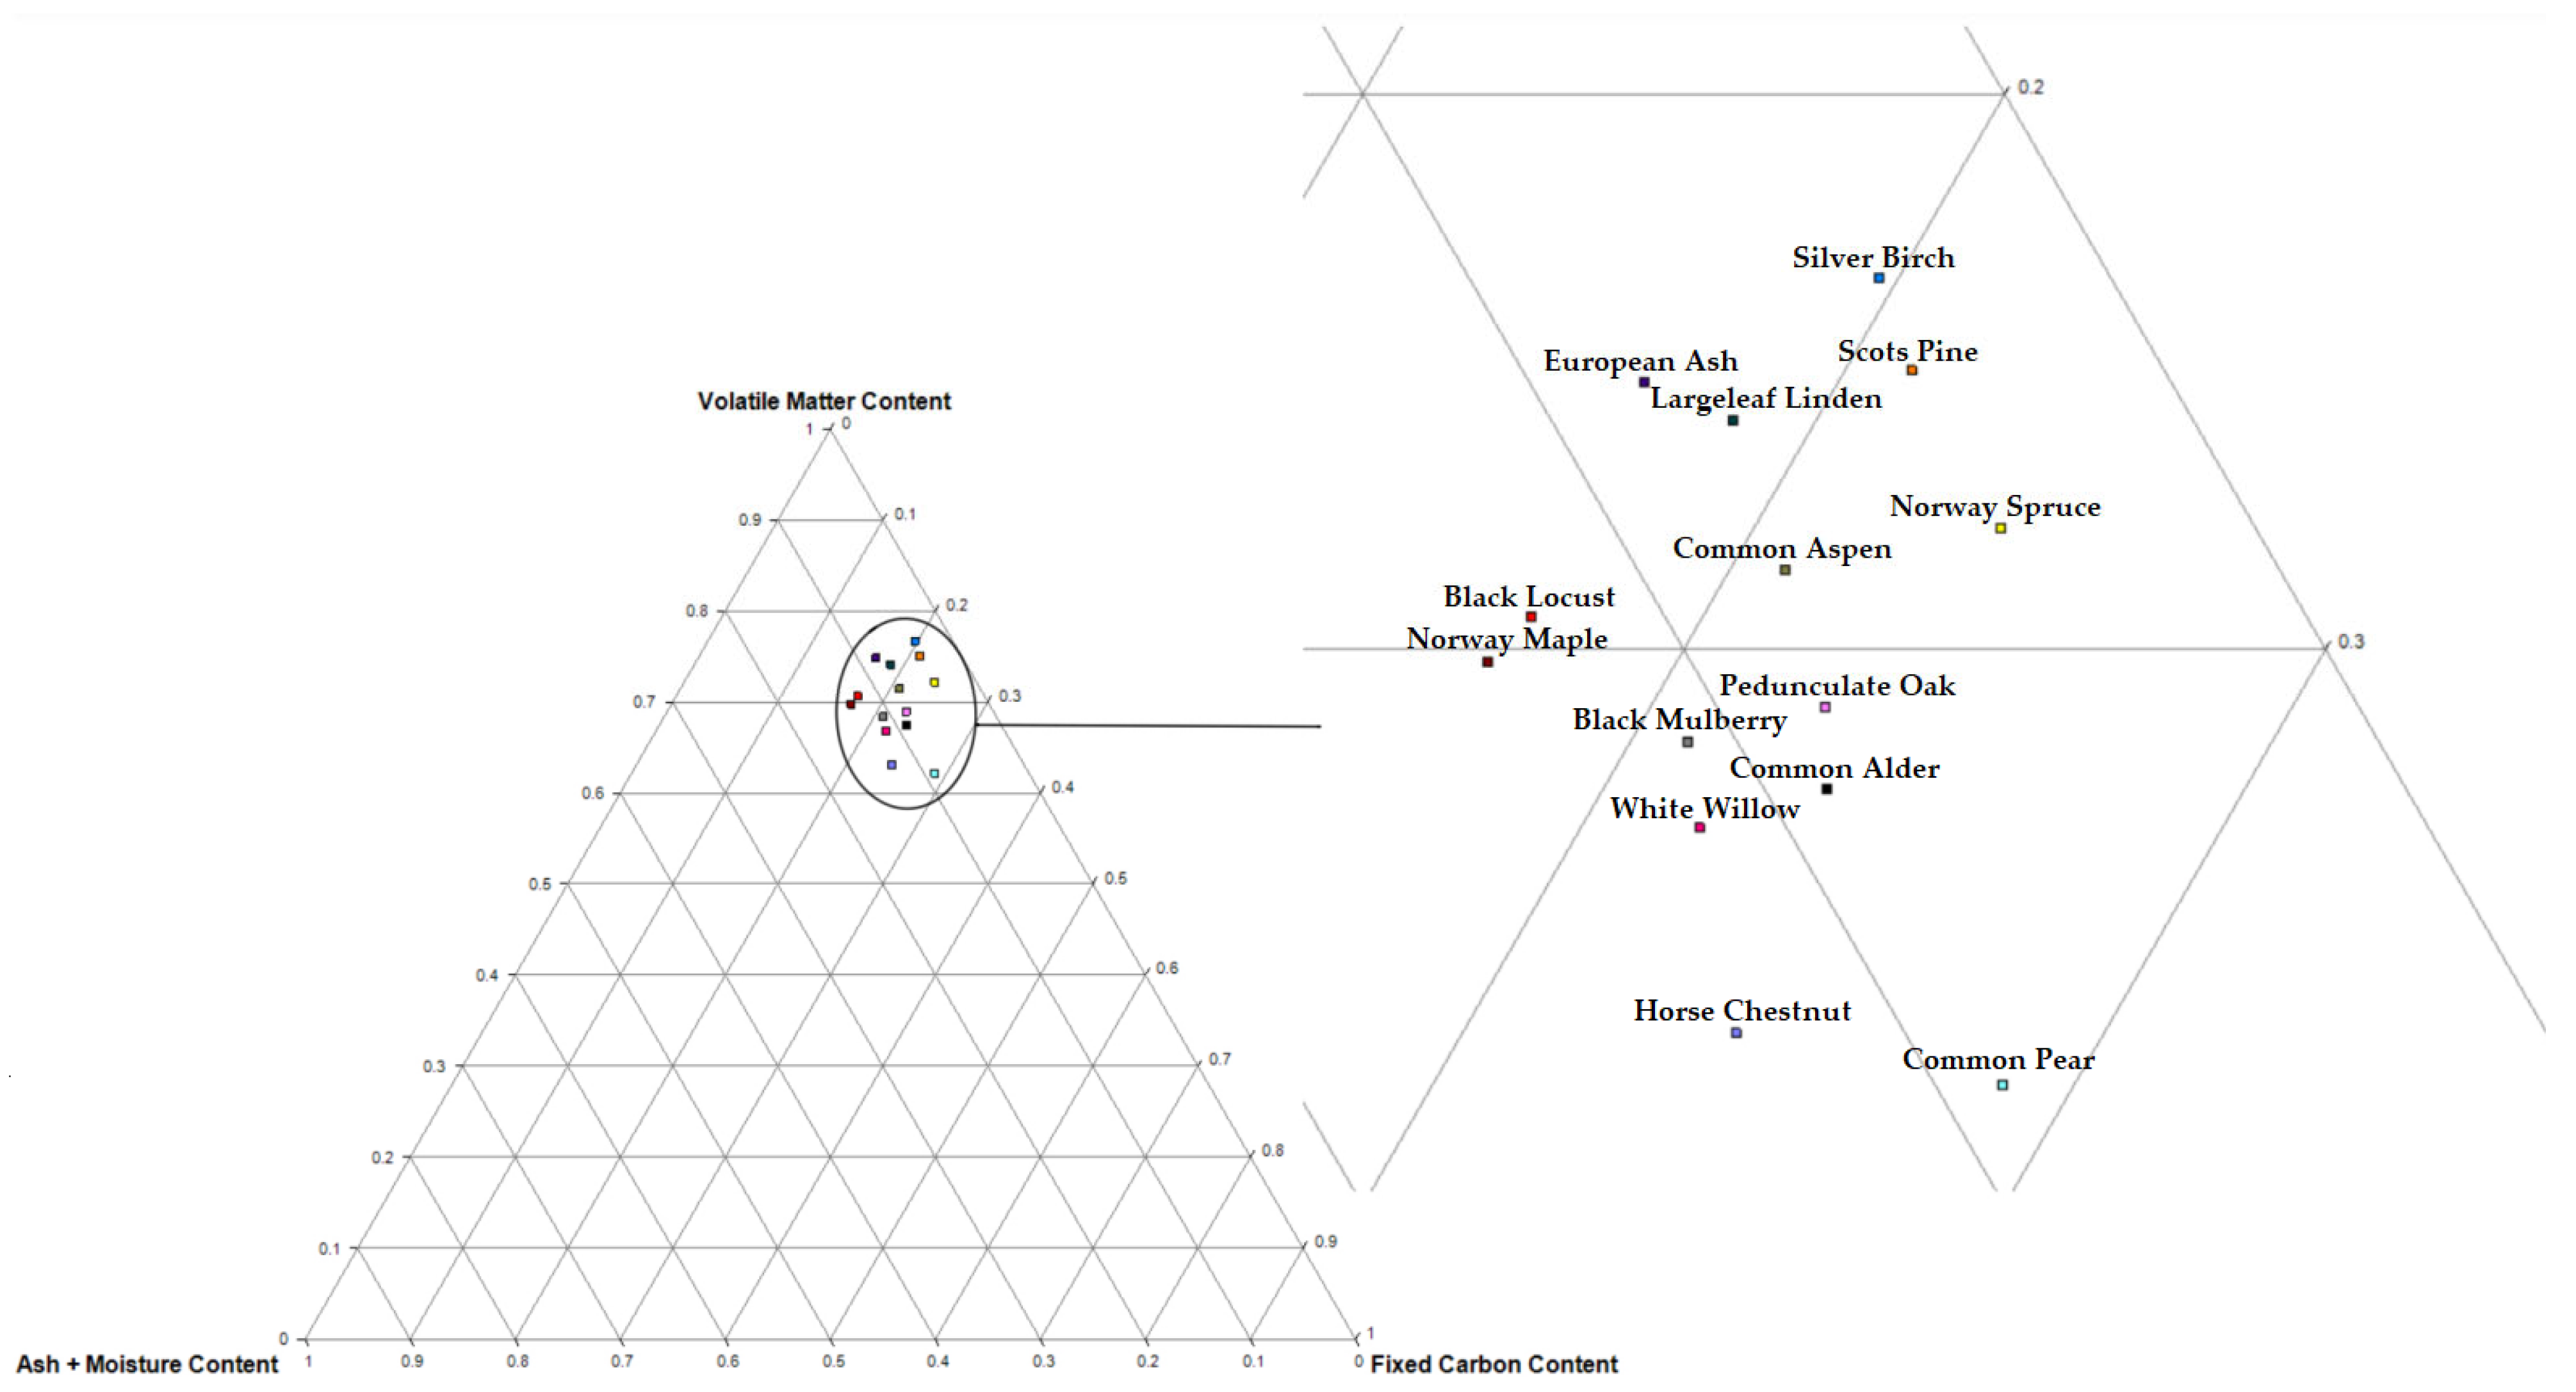
Figure 3 shows the distribution of the proximate analysis components. The ternary diagram is a barycentric plot where three studied parameters add up to a constant value [81]. When analyzing different species of the same substrate, it can be seen that the data dispersion is relatively high (although similar to a typical biomass material). This may mean that before the energy use of tree bark, a proximate analysis should be carried out, or the characteristics of the species should be known due to the possibility of significant differences in the chemical composition of different species or varieties.
Table 6 shows the results for higher heating value and lower heating values. Analyzing the results, it can be observed that the statistically significant lowest values of HHV were obtained for bark from three species: White Willow (17.239 ± 0.318 MJ·kg−1), Horse Chestnut (17.372 ± 0.137 MJ·kg−1) and Norway Maple (17.425 ± 0.300 MJ·kg−1). On the other hand, the statistically significant highest values of HHV were noted for the bark of two species: Norway Spruce (20.341 ± 0.125 MJ·kg−1) and Silver Birch (21.618 ± 0.375 MJ·kg−1). LHV values were characterized by a range of 16.163–20.246 MJ·kg−1. The statistically significant lowest values were observed for White Willow, Horse Chestnut, and Black Mulberry. The statistically significant highest values were noted for Norway Spruce, Common Aspen, and Silver Birch.
Table 7 shows the mean higher heating value for softwood and hardwood species. It can be noted that mean HHVs are higher for softwood species than the mean values of this parameter for hardwood species. Similar phenomena have also been reported in other studies—Esteves et al. [12], based on research [82,83], described a comparison of 402 tree species, where coniferous species tend to be more calorific than deciduous species. The higher HHV of softwood species, compared to hardwood species, is related to, among other things, differences in their chemical composition, mainly in the amount of lignin, cellulose, and hemicellulose, which are the leading energy carriers in biomass [12,84]. According to Rowell [85], softwood species contain more lignin (26–34%) and cellulose (40–45%) compared to hardwood species, where the content of these compounds averages 23–30% (lignin) and 38–49% (cellulose). Studies by other authors suggest that higher amounts of lignin in lignocellulosic biomass positively affect higher heating value [86,87,88]. Data from the literature on lignin, cellulose, and hemicellulose content confirm the observed relationship, where a higher HHV than hardwood species characterizes softwood species. In the case of Scots Pine, the contents of these compounds are for lignin, cellulose, and hemicellulose: 44.9, 25.4, and 14.7% [89], respectively, while for Norway Spruce bark: 25, 25, and 8% [90], respectively. Data from other publications showed a lower content of these compounds for deciduous species. Pedunculate Oak bark is characterized by a lignin content oscillating around 19.5–32.7%, a cellulose content of 23–24%, and a hemicellulose content of 12.0–16.1% [91]. The lignin, cellulose, and hemicellulose contents of Black Locust bark are 36, 14, and 10% [92], respectively. The lignin content of Norway Maple bark is 8.7%, the cellulose content is 45.5%, while hemicellulose content was determined to be 9.3% [93]. Familiar Aspen bark is characterized by a lignin content of 24.8% [94] and a cellulose content of 32% [95]. Silver Birch bark’s amount of lignin and cellulose was determined to be 33.2 and 7.3% [96], respectively. Lignin levels for other deciduous species, according to the literature data, are 18.64% for European Ash [97], 25.23% for Horse Chestnut [98], and 21.89% for White Willow [99].
As stated by Hosseinpour et al. [100], HHV is an essential indicator of the quality of biomass fuels because it shows their thermochemical properties, and knowledge of this value is necessary for the proper design and operation of effective biomass thermal conversion systems. Gruber [75], based on his own and others’ research [30,101], indicated that significant differences in the structure and chemical composition of bark relative to wood make it a much more calorific material (e.g., due to a higher content of fatty acid esters and lignin). Its higher heating value may be in the range of 21–24 MJ·kg−1. Among the obtained results, the most calorific material was Silver Birch bark. A similar higher heating value content for this species was obtained in other studies (HHV = 22.21 MJ·kg−1) [75]. Similarly, the value of the higher heating value of Scots Pine bark is comparable to other data available in the literature (HHV= 19.70 MJ·kg−1 [30], HHV= 19.94 MJ·kg−1 [73]). The tested Norway Maple bark was characterized by a lower heating value than the result obtained by other authors (HHV = 18.17 MJ·kg−1 [73]. The higher heating value of Black Locust bark is comparable to that found in the literature (HHV = 19.66 MJ·kg−1 [20]). The importance of the higher heating value of Norway Spruce bark in the literature is different and amounts to 20.03 MJ·kg−1 [70], 21.81 MJ·kg−1 [102], and 21.21 MJ·kg−1 [73]. It can be caused by the origin and age of the tree from which the bark was obtained [102]. The calorific value of Largeleaf Linden bark (LHV= 16.90 MJ·kg−1) described in the literature [103] is lower than the result obtained, which could be due to higher moisture content in the material (MC = 11.02%). The obtained calorific value of Common Alder bark is very close to the literature result (HHV = 19.949 MJ·kg−1 [104]). In the case of bark from Black Mulberry, Horse Chestnut, and Norway Maple, the lowest HHVs and LHVs were observed, which may be due to the high ash content in these species, as it is one of the main factors affecting both parameters [70,105,106].
As a result of the performed research, differences in the values of the higher heating value for bark from trees of particular species are observed. This may mean that knowledge of this parameter is essential when designing an installation intended for combustion or co-combustion of biomass so that energy conversion is as optimal as possible. Incorrect interpretation of this parameter or lack of technical analysis of tree bark as a biofuel can lead to economic losses and ineffective operation of the heating device, especially in the case of commercial power engineering. It is true that for high-power installations, such procedures are strictly followed and controlled, but for smaller power installations dedicated mainly to home solutions, they are often omitted. Therefore, when implementing wood bark as a substrate supporting the primary combustion fuel, special attention should be paid to the knowledge of the type of tree subjected to combustion so as not to overestimate or underestimate the necessary amount of material for the heating season.
3.2. Elementary Analysis
Table 8 shows the ultimate analysis of the evaluated bark species. The lowest carbon content in bark was recorded for Pedunculate Oak (43.22 ± 0.18%), while the highest content of this element was found in Silver Birch (55.14 ± 1.18%). There were no statistically significant differences between the species of Scots Pine, Black Locust, European Ash, Common Aspen, or Largeleaf Linden. No statistically significant differences were observed for Black Mulberry, Norway Spruce, or Common Pear. In the case of Common Aspen and European Ash, almost identical results were obtained (49.40%). The content of element C in the remaining species ranged from 45.06 to 53.49%, and a high number of statistically significant differences were noted between them.
The level of element H in the bark of the considered tree species ranged from 4.64 to 6.19%. It should be underlined that no statistically significant differences existed between the species studied.
The amount of nitrogen, in the case of detecting this element in the bark of the studied species, ranged from 0.15 to 1.24%. There were no statistically significant differences between the species. The level of this element in the bark of Pedunculate Oak, Horse Chestnut, Scots Pine, Norway Spruce, Silver Birch, Largeleaf Linden, and European Ash was below the detection limits of the apparatus used. The amount of sulfur in the tree bark was not recorded by the device either, which proves its trace amounts in the samples.
The obtained elemental analysis results are comparable to the values given in the literature. In the case of Scots Pine bark, similar results were obtained by Chen [107] (C = 51.20%, H = 5.66%), Tillman [108] (C = 52.3%, H = 5.8%), and Järvik et al. [109] (C = 52.79%, H = 6.08%). The carbon and hydrogen content values in Norway Spruce bark obtained in [70] are also similar (C = 50.6%, H = 5.9%). Slightly different elemental analysis values for Common Aspen were obtained in another study (C = 45%, H = 5.63%, N = 0.73%) [80]. The received contents of elements, carbon, and hydrogen in the bark of Pedunculate Oak differ from those reported in the literature (C = 49.7%, H = 5.40%) [110]. According to Voca et al. [111], based on research [112], carbon is one of the most critical elements in the combustion process, and its appropriate amount in biomass positively affects its calorific value. Corder [70], referring to research [113], claims that tree bark is characterized by a slightly higher content of this element than wood. The data obtained from the elemental and technical analysis can be used as an indirect method for determining the heat of combustion of the fuel by using various available models and equations, which can be an alternative way to study this parameter in comparison to the most common, albeit time-consuming method, which is the use of a calorimeter [114,115,116,117,118,119].
3.3. Chemical Analysis
The pH level of the examined wood bark samples was acidic or weakly acidic in all cases. It ranged from 4.03 to 6.80 (Table 9), with the statistically significant highest value of the parameter recorded for the bark of European Ash (6.80 ± 0.11), Norway Maple (6.74 ± 0.07) and Common Aspen poplar (6.54 ± 0.12). The lowest pH level was observed for Silver Birch bark (4.03 ± 0.14) and Norway Spruce bark (4.17 ± 0.20). In the case of other types of tree bark, the pH level was relatively similar and ranged from 4.57 to 5.50. The phenomenon of the high diversification of the pH parameter of tree bark, depending on the species, was previously widely recognized in the literature. This is because the pH of bark is affected by several biotic and abiotic factors [120]. Nevertheless, the obtained pH range entirely coincides with the literature studies. Vinayaka [121], examining the pH of 30 species of tree bark, observed a range of parameters from 4.6 to 6.8. Other contents include Fojcik et al. [122], who noted pH from 3.13 for Pinus Sylvestris to 5.72 for Populus Tremula (10 species were evaluated in total). Takahashi and Fukusawa [123], in turn, studying 14 species of tree bark, obtained results at levels of 3.7 to 4.2.
The pH parameter in the context of the energy use of wood bark is crucial due to the potential for enhanced fungal degradation of the stored biomass [32], which is associated with the risk of energy loss during the logistics chain. Compared to wood, the susceptibility of bark to fungal infections is more significant because the parenchyma facilitates the spread of fungi [32,124]. The pH conditions are one of the critical determinants of the presence of specific microorganisms in the wood pile [32,125]. Generally, a pH of 3 to 6 is the best environment for the growth of fungi that can decompose wood [126,127]. Since most of the bark species we tested fall within this range, particular emphasis should be placed on controlling bark storage at various points in the logistics chain. Moreover, for bark species that show a pH close to neutral (Common Aspen, European Ash, Norway Maple), this practice is also recommended due to the risk of wood-degrading bacteria and actinomycetes [126,127].
In the case of electroconductivity, the level of this parameter ranged from 0.532 (for Scots Pine bark ± 0.029) mS·cm−1 to 1.811 mS·cm−1 (for Norway Maple bark ± 0.029). High values of electroconductivity were also observed in the case of Horse Chestnut (1.665 mS·cm−1 ± 0.315 mS·cm−1), White Willow (1.632 mS·cm−1 ± 0.243 mS·cm−1), Largeleaf Linden (1.575 mS·cm−1 ± 0.215 mS·cm−1), and European Ash (1.556 mS·cm−1 ± 0.051 mS·cm−1) tree bark. Other types of tree bark were characterized by similar electroconductivity, ranging from 0.712 mS·cm−1 to 1.202 mS·cm−1. Many statistically significant differences were noted between the various types of bark (Table 9). High eC parameter diversification for different tree bark species was also pointed out in the studies of other authors. Kubiak et al. [128] obtained an eC in the range of approximately ~0.150 to ~0.750 mS·cm−1 with five deciduous tree species: Acer platanoides (Norway Maple), Fraxinus excelsior (Ash), Tilia cordata (Lime), Quercus robur (Pedunculate Oak), and Ulmus laevis (European White Elm). Similar ranges, not exceeding the value of 1 mS·cm−1, were also noted in the works [129,130].
3.4. Hydrophobic Properties
Table 10 shows the hydrophobic properties of the evaluated bark species. According to the WDPT test, most types of tree bark (10 out of 14) were extremely hydrophobic, 3 types of bark (European Ash, Horse Chestnut, and Norway Spruce) were strongly hydrophobic, and 1 species (Largeleaf Linden) was severely hydrophobic. The most hydrophobic material was Black Locust (10,495 ± 1496 s), and the least was Norway Spruce (70 ± 6 s). An important observation from the statistical analysis is that the severely and strongly hydrophobic species differed statistically significantly from the extremely hydrophobic species. There were no statistically significant differences between those characterized as strongly and severely hydrophobic, despite the apparent difference in the softer penetration time of water drops for Norway Spruce and Largeleaf Linden (Δ = 1737 s).
Interestingly, the species with the longest water droplet penetration time was statistically different from the other species that were also extremely hydrophobic. This indicates that although tree bark is generally considered a hydrophobic material, there may be statistically significant differences between species, which is very important from the point of view of substrate storage and optimization of this process. In part, this is identical to another hydraulic parameter—hygroscopicity, where the influence of the type of tree on the values of this parameter was also proven [131]. Due to the fact that the kinetics of moisture absorption for materials differing in the degree of hydrophobicity is different, standardizing the bark storage process for various species is not recommended. Such action could result in partial decomposition of the material and the beginning of rotting processes [132], resulting in a loss of energy in the logistics chain [132]. As the research has indicated, the differences can be significant even in the range of species showing an extremely hydrophobic nature. Hence, the need to adjust the storage conditions should occur at the level of a particular species. This is important because, in Table 8, most species have a pH range of 3–6, exposed to the growth of fungi that decompose wood well.
The conducted MED test confirmed the hydrophobic nature of tree bark species. In 12 of the 14 species, a drop of solution penetrated the material rapidly at a concentration of 36%. With one species (Horse Chestnut), the drop penetrated at 24%, and 13% in another (Norway Spruce). Generally, lower solution concentrations were observed for species with low water droplet penetration time (WDPT). This proves the high correlation and agreement of both tests. However, attention can be paid to the differences in the sensitivity of these two tests. The MED test can only show the nature of the material. Still, it is impossible to compare the results for bark species belonging to the same concentration (this is equivalent to showing the hydrophobicity ranges). Consequently, this test is not as accurate as the WDPT test. Previously, a hydrophobicity/water repellency test comparison between biomass types was performed by Miller et al. [133]. Compared to our observations, the authors concluded that the WDPT test is also a better choice than the MED because the times measured are continuous variables. The authors noted, however, that the test’s speed and simplicity dictated the WDPT test selection. Contrary to our research, most of the tested biomass was slightly hydrophobic, so the test was carried out faster. In the case of tree bark, which is more hydrophobic than conventional biomass, the MED test will be much faster but still less accurate.
The high correlation between the MED and WDPT tests for thermochemically processed tree bark was also investigated by Usevičiūtė and Baltrėnaitė [134]. The authors obtained a very strong positive linear correlation between these parameters (r = 0.985 for Pine bark and r = 0.971 for Birch bark, respectively). A strong or very strong correlation was also observed for the remaining biomass types, although with a lower value of the r coefficient. This proves opinions [65,133] that WDPT and MED are closely related, but not for all materials.
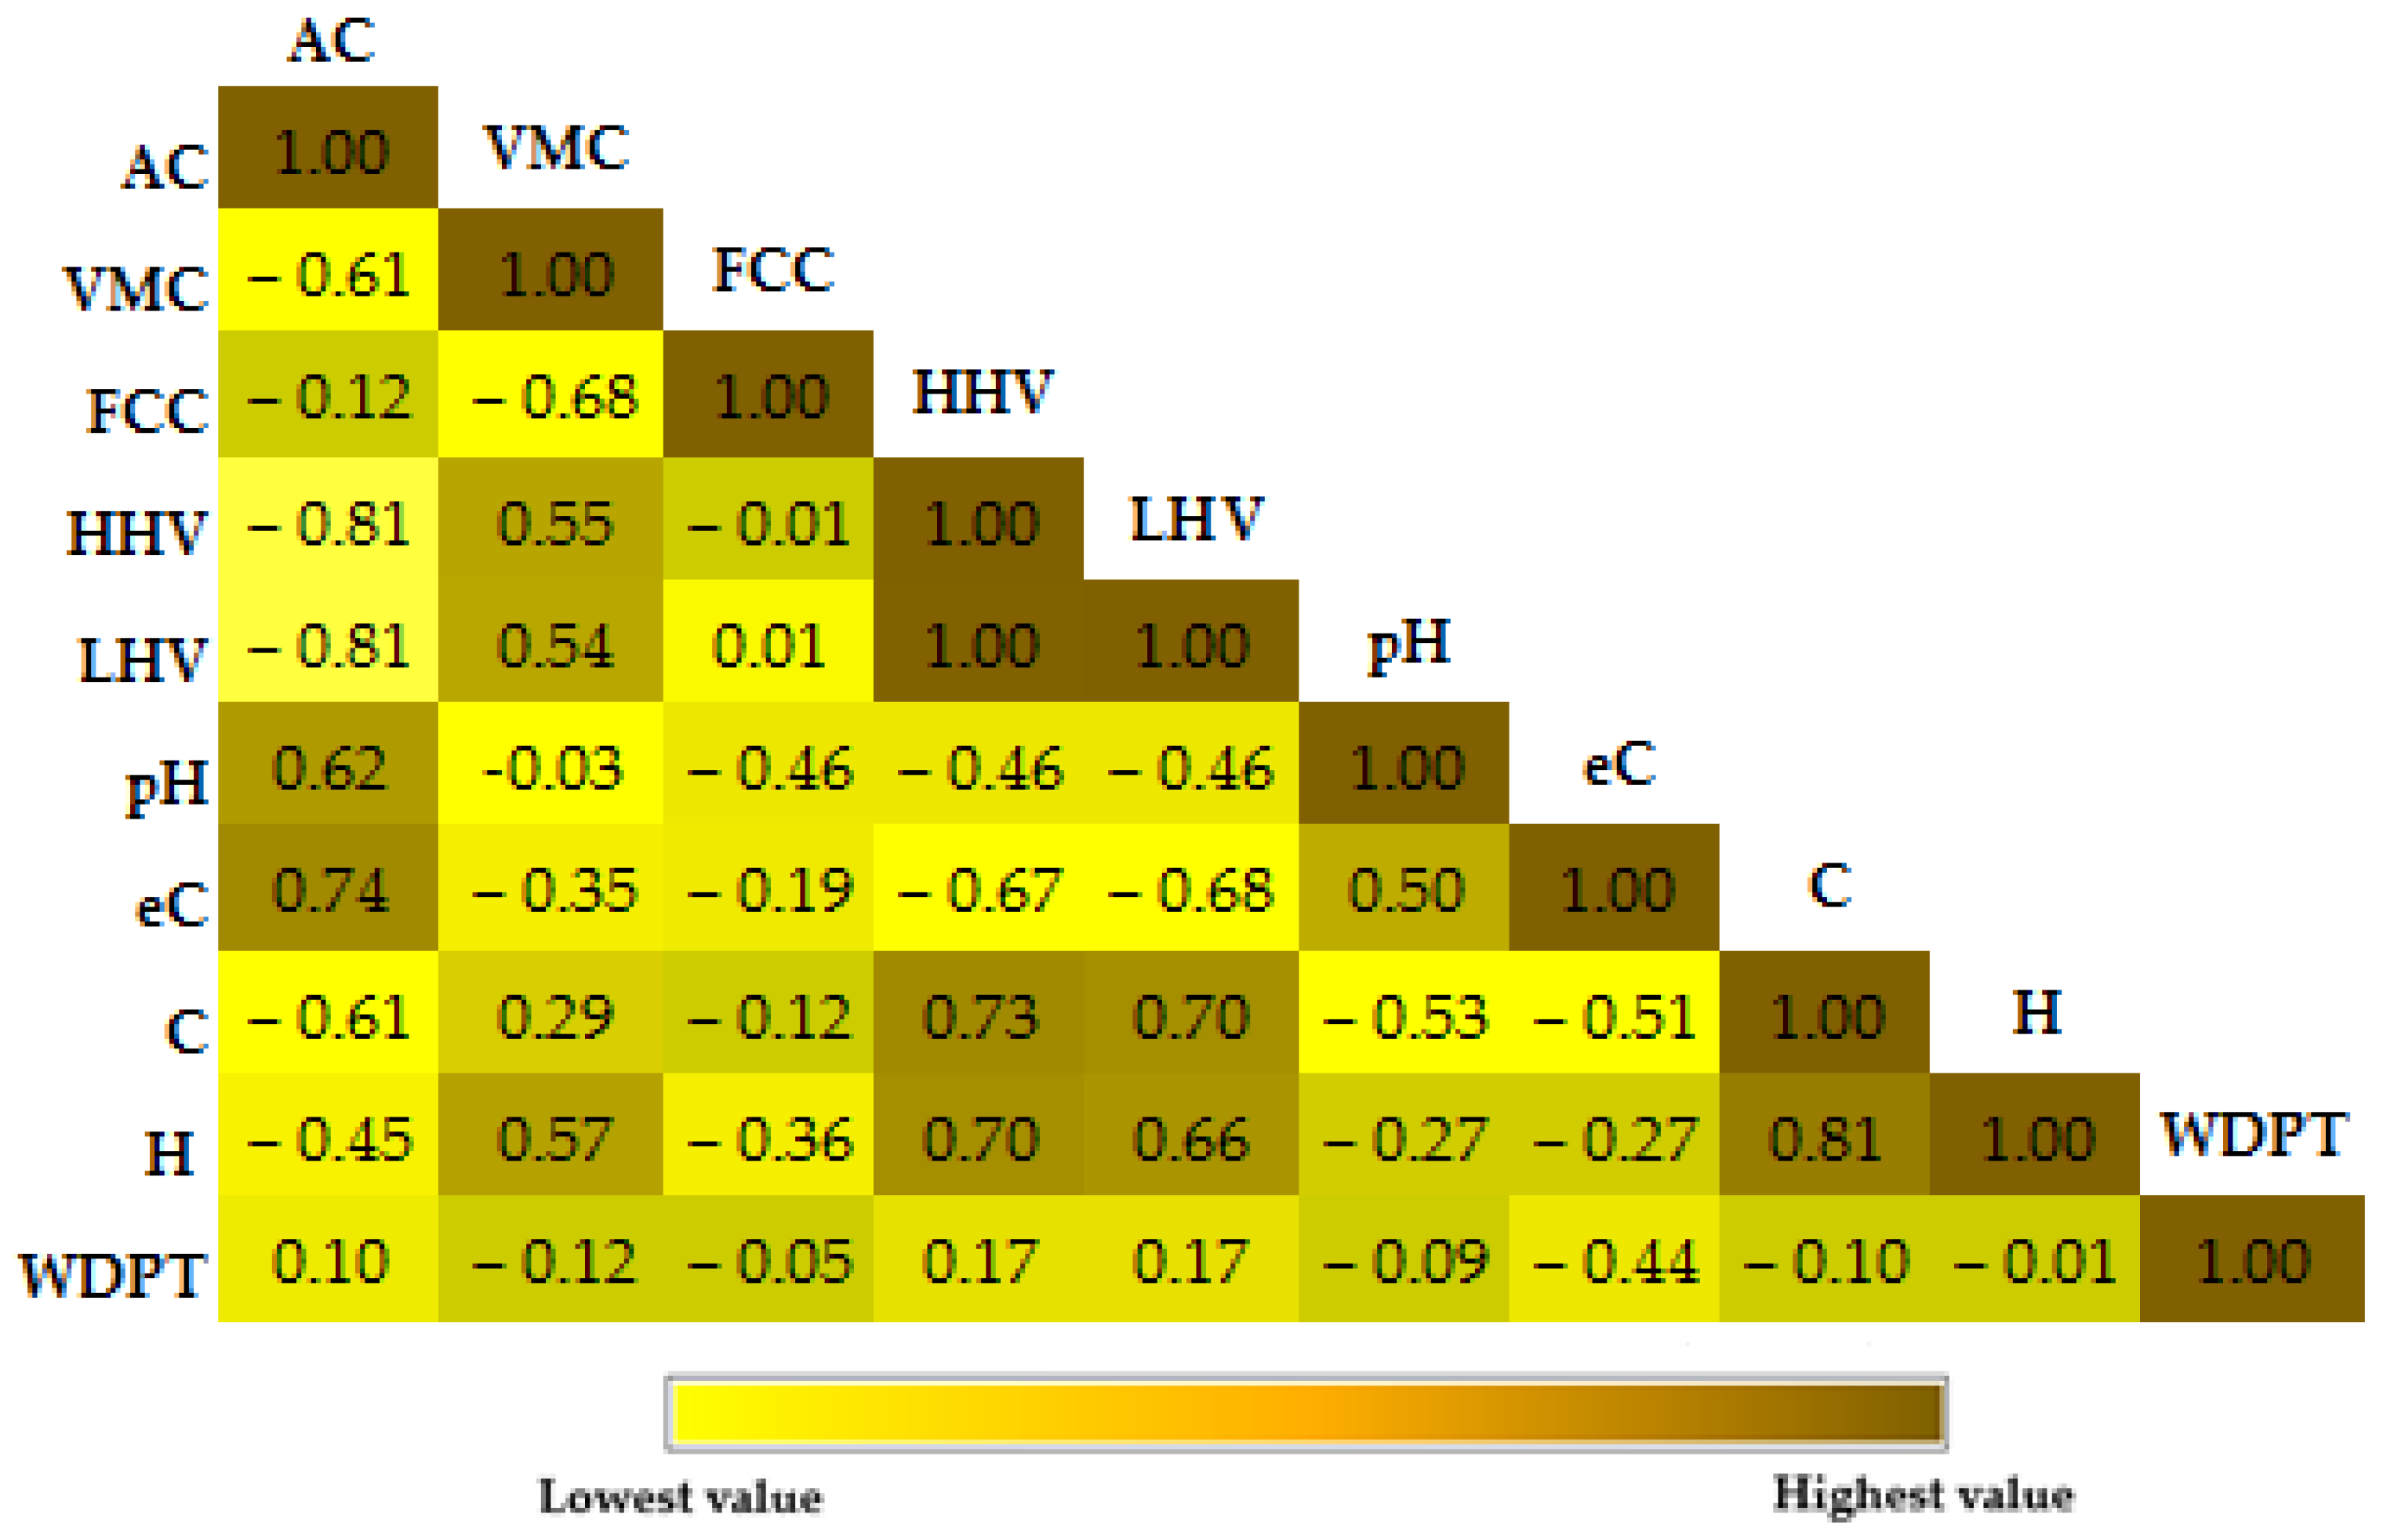
It should be noted, however, that the correlation of hydrophobic properties with other parameters is small (Figure 4). The highest correlation of the WDPT test was obtained with electroconductivity (eC) − r = −0.44. In other cases, the correlation was close to 0. Generally, high levels of correlation between hydrophobicity and other characteristics can be noted for physical traits, such as porosity [131,135]. In future research, the number of biophysicochemical properties should be extended to better understand the levels of correlation between the hydraulic properties of bark and other types of biomass.
3.5. Selection of the Best Material from the Point of View of Hydrophobicity and Combustion
For this study, to select the best type of bark from the point of view of hydrophobicity and energy suitability, a point classification was proposed when assessing such parameters as HHV, AC, VMC, and WDPT. The results of the analysis are presented in Table 11.
Based on such an approach and simple assumptions, Silver Birch was the species with the best performance characteristics. According to [136], betulin is responsible for Silver Birch bark’s beneficial properties (such as hydrophobicity and flammability). As commented by Dements et al. [137], based on research [138,139,140,141], the content of this compound depends mainly on the species of birch and the location where the tree grew, and varies in the range of 20–30%. Betulin is also characterized by its antifungal and antibacterial properties, which protect bark from damage caused by microorganisms [137], which can positively affect the storage of this material.
4. Conclusions
The bark from 14 different species of trees common in central Europe was examined. Parameters such as ash content, fixed carbon content, volatile matter content, moisture content, higher heating value, lower heating value, hydrophobicity, pH, electroconductivity, and the content of C, H, N, and S elements were analyzed.
The ash content in the bark samples was in the range of 2.71–12.09%, while the content of volatile matter ranged from 62.16% to 70.60%, and the content of fixed carbon was in the range of 17.06–28.89%. In the case of the HHV, values ranging from 17.239 MJ·kg−1 to 21.618 MJ·kg−1 were obtained.
Most species are characterized by strong resistance to water absorption in both the WDPT test, ranging from 70 to 10,495 s, and the MED test, with hydrophobicity levels between 8.5% and 24%. However, the significant variations in hydrophobicity observed among species in these tests indicate that the storage of different types of bark should be tailored to each species and preceded by an analysis of their hydrophobic properties. Additionally, the results suggest that the WDPT test is better suited for assessing highly hydrophobic biomass types, as it allows for differentiation between species that exhibit similar levels of hydrophobicity.
As a result of this study, the best type of tree bark, in terms of hydrophobicity and combustion, was determined. Among the examined species, the most favorable characteristics were those found in Silver Birch bark, for which the highest higher heating value, lowest ash content, and extremely hydrophobic properties were observed. From the analysis performed on the averaged values of HHV for hardwood and softwood species, it can be noted that bark from coniferous species is characterized by a higher mean value of this parameter than bark from deciduous species. This conclusion is reflected in the literature data relating to the composition of tree bark, from which it can be seen that a higher lignin content characterizes softwood species. A larger group of softwood species should be analyzed to determine what type of tree bark is the best for energy efficiency applications.
The performed analysis showed statistically significant differences between the individual parameters, indicating the necessity of performing detailed analyses of bark before using it for energy purposes. The obtained research results and a similar region from which the material was taken also suggest that the tree species from which bark is obtained is important in determining the energy usefulness of this type of biomass.
Author Contributions
Conceptualization, Ł.S. and A.D.; methodology, Ł.S., D.S., and A.D.; software, D.S.; validation, Ł.S.; formal analysis, Ł.S. and D.S.; investigation, Ł.S. and D.S.; resources, Ł.S. and D.S.; data curation, Ł.S. and D.S.; writing—original draft preparation, Ł.S. and D.S.; writing—review and editing, A.D.; visualization, D.S. and Ł.S.; supervision, Ł.S. and A.D.; project administration, D.S.; funding acquisition, A.D. All authors have read and agreed to the published version of the manuscript.
Funding
This research received no external funding.
Data Availability Statement
All data are available in the article.
Acknowledgments
The authors would like to thank Jarosław Sobol, Elżbieta Dobrowolska-Sobol, Paweł Sabat, and Izabela Sabat for their help in collecting the tree bark.
Conflicts of Interest
The authors declare no conflict of interest.
References
- Zhao, Q.; Mäkinen, M.; Haapala, A.; Jänis, J. Valorization of Bark from Short Rotation Trees by Temperature-Programmed Slow Pyrolysis. ACS Omega 2021, 6, 9771–9779. [Google Scholar] [CrossRef] [PubMed]
- FAO (Food and Agriculture Organization of the United Nations). FAO Forestry Series No. 48 FAO Statistics Series No. 204, Forest Products 2009–2013. Available online: https://www.fao.org/3/i4746m/i4746m.pdf (accessed on 10 July 2023).
- Pasztory, Z.; Mohacsine, I.R.; Gorbacheva, G.; Börcsök, Z. The Utilization of Tree Bark. BioResources 2016, 11, 7859–7888. [Google Scholar] [CrossRef]
- Tanase, C.; Coșarcă, S.; Muntean, D.-L. A Critical Review of Phenolic Compounds Extracted from the Bark of Woody Vascular Plants and Their Potential Biological Activity. Molecules 2019, 24, 1182. [Google Scholar] [CrossRef] [PubMed]
- Golubkina, N.; Plotnikova, U.; Lapchenko, V.; Lapchenko, H.; Sheshnitsan, S.; Amagova, Z.; Matsadze, V.; Naumenko, T.; Bagrikova, N.; Logvinenko, L.; et al. Evaluation of Factors Affecting Tree and Shrub Bark’s Antioxidant Status. Plants 2022, 11, 2609. [Google Scholar] [CrossRef]
- Jensen, W.; Fremer, K.E.; Sierila, P.; Wartiowaara, V. The Chemistry of Bark. In The Chemistry of Wood; Browning, B.L., Ed.; Interscience Publishers: New York, NY, USA, 1963; pp. 587–666. [Google Scholar]
- Dargan, E.E.; Smith, W.R. Progress in Charcoal Production: Continous Residue Carbonization. For. Prod. J. 1959, 9, 395–397. [Google Scholar]
- Harkin, J.M.; Rowe, J.W. Bark and Its Possible Uses; Forest Products Laboratory, US Forest Service: Madison, WI, USA, 1971; Volume 91. [Google Scholar]
- Ogunwusi, A. Potentials of Industrial Utilization of Bark. J. Nat. Sci. Res. 2013, 3, e2921. [Google Scholar]
- Wenig, C.; Dunlop, J.W.C.; Hehemeyer-Cürten, J.; Reppe, F.J.; Horbelt, N.; Krauthausen, K.; Fratzl, P.; Eder, M. Advanced Materials Design Based on Waste Wood and Bark. Philos. Trans. R. Soc. Math. Phys. Eng. Sci. 2021, 379, 20200345. [Google Scholar] [CrossRef]
- Braghiroli, F.L.; Passarini, L. Valorization of Biomass Residues from Forest Operations and Wood Manufacturing Presents a Wide Range of Sustainable and Innovative Possibilities. Curr. For. Rep. 2020, 6, 172–183. [Google Scholar] [CrossRef]
- Esteves, B.; Sen, U.; Pereira, H. Influence of Chemical Composition on Heating Value of Biomass: A Review and Bibliometric Analysis. Energies 2023, 16, 4226. [Google Scholar] [CrossRef]
- Fengel, D.; Wegener, G. Wood: Chemistry, Ultrastructure, Reactions; Walter de Gruyter: Berlin, Germany, 2011. [Google Scholar]
- Martínez-Pérez, R.; Pedraza-Bucio, F.E.; Orihuela-Equihua, R.; López-Albarrán, P.; Rutiaga-Quiñones, J.G. Calorific Value and Inorganic Material of Ten Mexican Wood Species. Wood Res. 2015, 60, 281–292. [Google Scholar]
- Lykidis, C.; Kamperidou, V.; Mantanis, G.I. The Use of Black Pine Bark for Improving the Properties of Wood Pellets. Forests 2023, 14, 1069. [Google Scholar] [CrossRef]
- Lehtikangas, P. Quality Properties of Pelletised Sawdust, Logging Residues and Bark. Biomass Bioenergy 2001, 20, 351–360. [Google Scholar] [CrossRef]
- Holubcik, M.; Jandacka, J.; Palacka, M.; Kantova, N.; Jachniak, E.; Pavlik, P. The Impact of Bark Content in Wood Pellets on Emission Production During Combustion in Small Heat Source. Commun. Sci. Lett. Univ. Zilina 2017, 19, 94–100. [Google Scholar] [CrossRef]
- Németh, K.; Molnár, S. Az Akácfa Égésmelegének És F\Hut\Hoértékének Vizsgálata. Investig. Fuel Value Black Locust Faip. 1983, 33, 78–79. [Google Scholar]
- Vaucher, H. Baumrinden: Aussehen, Struktur, Funktion, Eigenschaften; Godet-Pflanzenführer; Naturbuch-Verlag: New York, NY, USA, 1997; ISBN 978-3-89440-255-6. [Google Scholar]
- Kamperidou, V.; Lykidis, C.; Barmpoutis, P. Utilization of Wood and Bark of Fast-Growing Hardwood Species in Energy Production. J. For. Sci. 2018, 64, 164–170. [Google Scholar] [CrossRef]
- Szyszlak-Bargłowicz, J.; Zając, G.; Hawrot-Paw, M.; Koniuszy, A. Evaluation of the Quality of Wood Pellets Available on the Market. E3S Web Conf. 2020, 171, 01015. [Google Scholar] [CrossRef]
- Meyer, N.K.; Mina, M. Wood Energy Fuel Cycle Optimization in Beech and Spruce Forests. Environ. Res. Lett. 2012, 7, 014001. [Google Scholar] [CrossRef]
- Oser, M.; Nussbaumer, T.; Müller, P.; Mohr, M.; Figi, R. Grundlagen Der Aerosolbildung in Holzfeuerungen. In Beeinflussung der Partikelemissionen durch Primärmassnahmen und Konzept für eine partikelarme automatische Holzfeuerung (Low-Particle-Feuerung); IA Bundesamt Für Energie: Bern, Switzerland, 2003. [Google Scholar]
- Ellner-Schuberth, F. Partikelemissionen Aus Kleinfeuerungen Für Holz Und Ansätze Für Minderungsmaßnahmen; Technologie-und Förderzentrum (TFZ) im Kompetenzzentrum für Nachwachsende: Straubing, Germany, 2010. [Google Scholar]
- Vos, J. Biomass Energy for Heating and Hot Water Supply in Belarus. In Contract Rep. BYE03G31 BTG; UNDP: New York, NY, USA, 2006. Available online: https://energoeffect.gov.by/bioenergy/htdocs/en/practa.pdf?fbclid=IwAR0e56HdM9JGlJzL5IuR3KCV4lHOWcsvExWK5trLc2dmJu6I7FRxOlBnDpo (accessed on 10 July 2023).
- VEOLIA. Water Technologies & Solutions Handbook of Industrial Water Treatment. Chapter 21—Boiler Fireside Deposit and Corrosion Control; Veolia: Paris, France; Available online: https://www.watertechnologies.com/handbook/chapter-21-boiler-fireside-deposit-and-corrosion-control (accessed on 10 July 2023).
- Nzokou, P.; Kamdem, D.P. Influence of Wood Extractives on Moisture Sorption and Wettability of Red Oak (Quercus Rubra), Black Cherry (Prunus Serotina), and Red Pine (Pinus Resinosa). Wood Fiber Sci. 2004, 36, 483–492. [Google Scholar]
- Borgin, K.; Corbertt, K. The Hydrophobic Properties of Bark Extractives. Wood Sci. Technol. 1971, 5, 190–199. [Google Scholar] [CrossRef]
- Barbini, S.; Sriranganadane, D.; España Orozco, S.; Kabrelian, A.; Karlström, K.; Rosenau, T.; Potthast, A. Tools for Bark Biorefineries: Studies toward Improved Characterization of Lipophilic Lignocellulosic Extractives by Combining Supercritical Fluid and Gas Chromatography. ACS Sustain. Chem. Eng. 2021, 9, 1323–1332. [Google Scholar] [CrossRef]
- Routa, J.; Brännström, H.; Hellström, J.; Laitila, J. Influence of Storage on the Physical and Chemical Properties of Scots Pine Bark. BioEnergy Res. 2021, 14, 575–587. [Google Scholar] [CrossRef]
- Routa, J.; Kolström, M.; Sikanen, L. Dry Matter Losses and Their Economic Significance in Forest Energy Procurement. Int. J. For. Eng. 2018, 29, 53–62. [Google Scholar] [CrossRef]
- Krigstin, S.; Wetzel, S. A Review of Mechanisms Responsible for Changes to Stored Woody Biomass Fuels. Fuel 2016, 175, 75–86. [Google Scholar] [CrossRef]
- Cutz, L.; Tiringer, U.; Gilvari, H.; Schott, D.; Mol, A.; De Jong, W. Microstructural Degradation during the Storage of Biomass Pellets. Commun. Mater. 2021, 2, 2. [Google Scholar] [CrossRef]
- Searcy, E.; Hess, J.R.; Tumuluru, J.; Ovard, L.; Muth, D.; Trømborg, E.; Wild, M.; Deutmeyer, M.; Nikolaisen, L.; Ranta, T.; et al. Optimization of Biomass Transport and Logistics. In International Bioenergy Trade; Junginger, M., Goh, C.S., Faaij, A., Eds.; Springer: Dordrecht, The Netherlands, 2014; Volume 17, pp. 103–123. [Google Scholar]
- Deng, T.; Alzahrani, A.M.; Bradley, M.S. Influences of Environmental Humidity on Physical Properties and Attrition of Wood Pellets. Fuel Process. Technol. 2019, 185, 126–138. [Google Scholar] [CrossRef]
- Schlünssen, V.; Madsen, A.M.; Skov, S.; Sigsgaard, T. Does the Use of Biofuels Affect Respiratory Health among Male Danish Energy Plant Workers? Occup. Environ. Med. 2011, 68, 467–473. [Google Scholar] [CrossRef]
- Ferrero, F.; Malow, M.; Noll, M. Temperature and Gas Evolution during Large Scale Outside Storage of Wood Chips. Eur. J. Wood Wood Prod. 2011, 69, 587–595. [Google Scholar] [CrossRef]
- Dafnomilis, I.; Lodewijks, G.; Junginger, M.; Schott, D. Evaluation of Wood Pellet Handling in Import Terminals. Biomass Bioenergy 2018, 117, 10–23. [Google Scholar] [CrossRef]
- Ilic, D.; Williams, K.; Farnish, R.; Webb, E.; Liu, G. On the Challenges Facing the Handling of Solid Biomass Feedstocks. Biofuels Bioprod. Biorefining 2018, 12, 187–202. [Google Scholar] [CrossRef]
- Anerud, E.; Krigstin, S.; Routa, J.; Brännström, H.; Arshadi, M.; Helmeste, C.; Bergström, D.; Egnell, G. Dry Matter Losses during Biomass Storage-Measures to Minimize Feedstock Degradation. In Proceedings of the IEA Bioenergy: Task; IEA Bioenergy: Paris, France, 2019; Volume 43, pp. 1–45. [Google Scholar]
- Anerud, E.; Bergström, D.; Routa, J.; Eliasson, L. Fuel Quality and Dry Matter Losses of Stored Wood Chips—Influence of Cover Material. Biomass Bioenergy 2021, 150, 106109. [Google Scholar] [CrossRef]
- Cai, J.; He, Y.; Yu, X.; Banks, S.W.; Yang, Y.; Zhang, X.; Yu, Y.; Liu, R.; Bridgwater, A.V. Review of Physicochemical Properties and Analytical Characterization of Lignocellulosic Biomass. Renew. Sustain. Energy Rev. 2017, 76, 309–322. [Google Scholar] [CrossRef]
- Dyjakon, A.; Noszczyk, T.; Sobol, Ł.; Misiakiewicz, D. Influence of Torrefaction Temperature and Climatic Chamber Operation Time on Hydrophobic Properties of Agri-Food Biomass Investigated Using the EMC Method. Energies 2021, 14, 5299. [Google Scholar] [CrossRef]
- Yap, T.C.; Jackson, B.E.; Fonteno, W.C. Water Retention of Processed Pine Wood and Pine Bark and Their Particle Size Fractions\copyright. In Proceedings of the 2014 Annual Meeting of the International Plant Propagators Society; ISHS: Bellefonte, PA, USA, 2014; pp. 467–472. [Google Scholar]
- Beardsell, D.; Nichols, D. Wetting Properties of Dried-out Nursery Container Media. Sci. Hortic. 1982, 17, 49–59. [Google Scholar] [CrossRef]
- Fonteno, W.; Fields, J.; Jackson, B. A Pragmatic Approach to Wettability and Hydration of Horticultural Substrates. In Proceedings of the International Symposium on Growing Media, Composting and Substrate Analysis, Barcelona, Spain, 17–21 October 2011; ISHS: Bellefonte, PA, USA, 2011; pp. 139–146. [Google Scholar]
- Michel, J.-C.; Riviere, L.-M.; Bellon-Fontaine, M.-N. Measurement of the Wettability of Organic Materials in Relation to Water Content by the Capillary Rise Method. Eur. J. Soil Sci. 2001, 52, 459–467. [Google Scholar] [CrossRef]
- Jiang, J.; Du, J.; Li, H.; Mei, C.; Gong, X. Hydrophobicity Improvement on Wood for a Better Application of This Bio-Based Material. Coatings 2022, 12, 1465. [Google Scholar] [CrossRef]
- Waliszewska, B.; Grzelak, M.; Gaweł, E.; Spek-Dźwigała, A.; Sieradzka, A.; Czekała, W. Chemical Characteristics of Selected Grass Species from Polish Meadows and Their Potential Utilization for Energy Generation Purposes. Energies 2021, 14, 1669. [Google Scholar] [CrossRef]
- Sobol, Ł.; Wolski, K.; Radkowski, A.; Piwowarczyk, E.; Jurkowski, M.; Bujak, H.; Dyjakon, A. Determination of Energy Parameters and Their Variability between Varieties of Fodder and Turf Grasses. Sustainability 2022, 14, 11369. [Google Scholar] [CrossRef]
- Kelsey, R.G. Heat Content of Bark, Twigs, and Foliage of Nine Species of Western Conifers; Forest Service, US Department of Agriculture, Intermountain Forest and Range Experiment Station: Madison, WI, USA, 1979; Volume 261. [Google Scholar]
- Biswas, S.; Gupta, K.; Talapatra, S.N. A Digitized Database of Bark Morphology for Identification of Common Tree Species and Literature Study of Bark Phytochemicals and Therapeutic Usage. World Sci. News 2016, 42, 143–155. [Google Scholar]
- Kalbande, R.B. Digital Visual Bark an Image Based Tool for Plant Diversity Research, Diversity in Bark Supports in Tree Identification. Int. J. Life Sci. Pharma Res. 2014, 4, 17–24. [Google Scholar]
- Hengst, G.E.; Dawson, J.O. Bark Properties and Fire Resistance of Selected Tree Species from the Central Hardwood Region of North America. Can. J. For. Res. 1994, 24, 688–696. [Google Scholar] [CrossRef]
- Fernández, K.; Kappes, T.; González, N.; Gutiérrez, C. Influence of Tree Height on the Hydrophilic and Lipophilic Composition of Bark Extracts from Eucalyptus globulus and Eucalyptus nitens. Holzforschung 2019, 73, 705–713. [Google Scholar] [CrossRef]
- ISO 18134-2:2017; Solid Biofuels—Determination of Moisture Content—Oven Dry Method—Part. 2: Total Moisture—Simplified Method. ISO: Geneva, Switzerland, 2017.
- ISO 18122:2015; Solid Biofuels Determ. Ash Content. ISO: Geneva, Switzerland, 2015; pp. 1–18.
- ISO 18123:2016-01; Solid Fuels. Determination of Volatile Content by Gravimetric Method. ISO: Geneva, Switzerland, 2016.
- ASTM D3172-13; Standard Practice for Proximate Analysis of Coal and Coke. ASTM: West Conshohocken, PA, USA, 2013; Volume 5.
- ISO 18125:2017; Solid Biofuels—Determination of Calorific Value. ISO: Geneva, Switzerland, 2017.
- Porowski, R. Analiza metod określania ciepła spalania i wartości opałowej paliw. Zesz. Nauk. SGSP/Szkoła Główna Służby Pożarniczej 2016, 3, 45–70. [Google Scholar]
- Gautam, R.; Ashwath, N. Hydrophobicity of 43 Potting Media: Its Implications for Raising Seedlings in Revegetation Programs. J. Hydrol. 2012, 430, 111–117. [Google Scholar] [CrossRef]
- Bisdom, E.; Dekker, L.; Schoute, J.T. Water Repellency of Sieve Fractions from Sandy Soils and Relationships with Organic Material and Soil Structure. In Soil Structure/Soil Biota Interrelationships; Elsevier: Amsterdam, The Netherlands, 1993; pp. 105–118. [Google Scholar]
- Farahnak, M.; Mitsuyasu, K.; Otsuki, K.; Shimizu, K.; Kume, A. Factors Determining Soil Water Repellency in Two Coniferous Plantations on a Hillslope. Forests 2019, 10, 730. [Google Scholar] [CrossRef]
- Doerr, S.H. On Standardizing the ‘Water Drop Penetration Time’ and the ‘Molarity of an Ethanol Droplet’ Techniques to Classify Soil Hydrophobicity: A Case Study Using Medium Textured Soils. Earth Surf. Process. Landf. J. Br. Geomorphol. Group 1998, 23, 663–668. [Google Scholar] [CrossRef]
- Contreras-Trejo, J.C.; Vega-Nieva, D.J.; Heya, M.N.; Prieto-Ruíz, J.A.; Nava-Berúmen, C.A.; Carrillo-Parra, A. Sintering and Fusibility Risks of Pellet Ash from Different Sources at Different Combustion Temperatures. Energies 2022, 15, 5026. [Google Scholar] [CrossRef]
- Frandsen, F.J. Utilizing Biomass and Waste for Power Production—A Decade of Contributing to the Understanding, Interpretation and Analysis of Deposits and Corrosion Products. Fuel 2005, 84, 1277–1294. [Google Scholar] [CrossRef]
- Szemmelveisz, K.; Szűcs, I.; Palotás, Á.; Winkler, L.; Eddings, E. Examination of the Combustion Conditions of Herbaceous Biomass. Fuel Process. Technol. 2009, 90, 839–847. [Google Scholar] [CrossRef]
- Nosek, R.; Holubcik, M.; Jandacka, J. The Impact of Bark Content of Wood Biomass on Biofuel Properties. BioResources 2016, 11, 44–53. [Google Scholar] [CrossRef]
- Corder, S.E. Properties and Uses of Bark as an Energy Source; Forest Research Laboratory, Oregon State University: Corvallis, OR, USA, 1976. [Google Scholar]
- Saarela, K.-E.; Harju, L.; Rajander, J.; Lill, J.-O.; Heselius, S.-J.; Lindroos, A.; Mattsson, K. Elemental Analyses of Pine Bark and Wood in an Environmental Study. Sci. Total Environ. 2005, 343, 231–241. [Google Scholar] [CrossRef]
- Miranda, I.; Gominho, J.; Mirra, I.; Pereira, H. Chemical Characterization of Barks from Picea Abies and Pinus Sylvestris after Fractioning into Different Particle Sizes. Ind. Crops Prod. 2012, 36, 395–400. [Google Scholar] [CrossRef]
- Orémusová, E.; Tereňová, L.; Réh, R. Evaluation of the Gross and Net Calorific Value of the Selected Wood Species. Adv. Mater. Res. 2014, 1001, 292–299. [Google Scholar] [CrossRef]
- Varila, T.; Brännström, H.; Kilpeläinen, P.; Hellström, J.; Romar, H.; Nurmi, J.; Lassi, U. From Norway Spruce Bark to Carbon Foams: Characterization, and Applications. BioResources 2020, 15, 3651–3666. [Google Scholar] [CrossRef]
- Gruber, L.; Seidl, L.; Zanetti, M.; Schnabel, T. Calorific Value and Ash Content of Extracted Birch Bark. Forests 2021, 12, 1480. [Google Scholar] [CrossRef]
- Basu, P. Biomass Gasification and Pyrolysis: Practical Design and Theory; Academic Press: Cambridge, MA, USA, 2010. [Google Scholar]
- Sarkar, D.K. Fuels and Combustion. In Thermal Power Plant; Elsevier: Amsterdam, The Netherlands, 2015; pp. 91–137. ISBN 978-0-12-801575-9. [Google Scholar]
- Wang, L.; Barta-Rajnai, E.; Skreiberg, Ø.; Khalil, R.; Czégény, Z.; Jakab, E.; Barta, Z.; Grønli, M. Effect of Torrefaction on Physiochemical Characteristics and Grindability of Stem Wood, Stump and Bark. Appl. Energy 2018, 227, 137–148. [Google Scholar] [CrossRef]
- Ren, X.; Meng, J.; Chang, J.; Kelley, S.S.; Jameel, H.; Park, S. Effect of Blending Ratio of Loblolly Pine Wood and Bark on the Properties of Pyrolysis Bio-Oils. Fuel Process. Technol. 2017, 167, 43–49. [Google Scholar] [CrossRef]
- Xie, M.; Cheng, J.; Xu, L.; Wang, L.; Chen, A.; Zhang, S.; Ren, X. Preparation of Activated Carbon from Co-Pyrolysis Activation of Fly Ash and Biomass. Energies 2022, 15, 6636. [Google Scholar] [CrossRef]
- Tanquilut, M.R.C.; Elauria, J.C.; Amongo, R.M.C.; Suministrado, D.C.; Yaptenco, K.F.; Elauria, M.M. Biomass Characterization of Pigeon Pea (Cajanus Cajan) Wood for Thermochemical Conversion. Philipp. J. Agric. Biosyst. Eng. 2019, 15, 39–52. [Google Scholar]
- Harker, A.; Sandels, A.; Burley, J. Calorific Values for Wood and Bark and a Bibliography for Fuelwood; Tropical Products Institute: London, UK, 1982. [Google Scholar]
- Dhamodaran, T.; Gnanaharan, R.; Thulasidas, P. Calorific Value Variation in Coconut Stem Wood. Wood Sci. Technol. 1989, 23, 21–26. [Google Scholar] [CrossRef]
- Wróbel, M. Zagęszczalność i Kompaktowalność Biomasy Lignocelulozowej; Polskie Towarzystwo Inżynierii Rolniczej: Kraków, Poland, 2019. [Google Scholar]
- Rowell, R.M. Handbook of Wood Chemistry and Wood Composites; CRC Press: Boca Raton, FL, USA, 2005. [Google Scholar]
- Demirbas, A. Higher Heating Values of Lignin Types from Wood and Non-Wood Lignocellulosic Biomasses. Energy Sources Part Recovery Util. Environ. Eff. 2017, 39, 592–598. [Google Scholar] [CrossRef]
- White, R.H. Effect of Lignin Content and Extractives on the Higher Heating Value of Wood. Wood Fiber Sci. 1987, 4, 446–452. [Google Scholar]
- Telmo, C.; Lousada, J. The Explained Variation by Lignin and Extractive Contents on Higher Heating Value of Wood. Biomass Bioenergy 2011, 35, 1663–1667. [Google Scholar] [CrossRef]
- Valentín, L.; Kluczek-Turpeinen, B.; Willför, S.; Hemming, J.; Hatakka, A.; Steffen, K.; Tuomela, M. Scots Pine (Pinus Sylvestris) Bark Composition and Degradation by Fungi: Potential Substrate for Bioremediation. Bioresour. Technol. 2010, 101, 2203–2209. [Google Scholar] [CrossRef]
- Meng, X. Towards a Norwegian Spruce Bark Biorefinery. Ph.D. Thesis, University of York, York, UK, 2018. [Google Scholar]
- Dedrie, M.; Jacquet, N.; Bombeck, P.-L.; Hébert, J.; Richel, A. Oak Barks as Raw Materials for the Extraction of Polyphenols for the Chemical and Pharmaceutical Sectors: A Regional Case Study. Ind. Crops Prod. 2015, 70, 316–321. [Google Scholar] [CrossRef]
- Vangeel, T.; Renders, T.; Van Aelst, K.; Cooreman, E.; Van den Bosch, S.; Van den Bossche, G.; Koelewijn, S.-F.; Courtin, C.; Sels, B. Reductive Catalytic Fractionation of Black Locust Bark. Green Chem. 2019, 21, 5841–5851. [Google Scholar] [CrossRef]
- Rizwan, M.; Gilani, S.R.; Durrani, A.I.; Naseem, S. Low Temperature Green Extraction of Acer Platanoides Cellulose Using Nitrogen Protected Microwave Assisted Extraction (NPMAE) Technique. Carbohydr. Polym. 2021, 272, 118465. [Google Scholar] [CrossRef] [PubMed]
- Wang, Z.; Winestrand, S.; Gillgren, T.; Jönsson, L.J. Chemical and Structural Factors Influencing Enzymatic Saccharification of Wood from Aspen, Birch and Spruce. Biomass Bioenergy 2018, 109, 125–134. [Google Scholar] [CrossRef]
- Migneault, S.; Koubaa, A.; Perré, P. Effect of Fiber Origin, Proportion, and Chemical Composition on the Mechanical and Physical Properties of Wood-Plastic Composites. J. Wood Chem. Technol. 2014, 34, 241–261. [Google Scholar] [CrossRef]
- Vedernikov, D.N.; Shabanova, N.Y.; Roshchin, V.I. Change in the Chemical Composition of the Crust and Inner Bark of the Betula Pendula Roth. Birch (Betulaceae) with Tree Height. Russ. J. Bioorganic Chem. 2011, 37, 877–882. [Google Scholar] [CrossRef]
- Sillero, L.; Prado, R.; Andrés, M.A.; Labidi, J. Characterisation of Bark of Six Species from Mixed Atlantic Forest. Ind. Crops Prod. 2019, 137, 276–284. [Google Scholar] [CrossRef]
- Özgenç, Ö.; Durmaz, S.; Kuştaş, S. Chemical Analysis of Tree Barks Using ATR-FTIR Spectroscopy and Conventional Techniques. BioResources 2017, 12, 9143–9151. [Google Scholar] [CrossRef]
- Vangeel, T.; Neiva, D.M.; Quilho, T.; Costa, R.A.; Sousa, V.; Sels, B.F.; Pereira, H. Tree Bark Characterization Envisioning an Integrated Use in a Biorefinery. Biomass Convers. Biorefinery 2021, 13, 2029–2043. [Google Scholar] [CrossRef]
- Hosseinpour, S.; Aghbashlo, M.; Tabatabaei, M. Biomass Higher Heating Value (HHV) Modeling on the Basis of Proximate Analysis Using Iterative Network-Based Fuzzy Partial Least Squares Coupled with Principle Component Analysis (PCA-INFPLS). Fuel 2018, 222, 1–10. [Google Scholar] [CrossRef]
- Kumaniaev, I.; Navare, K.; Mendes, N.C.; Placet, V.; Van Acker, K.; Samec, J.S. Conversion of Birch Bark to Biofuels. Green Chem. 2020, 22, 2255–2263. [Google Scholar] [CrossRef]
- Rhén, C. Chemical Composition and Gross Calorific Value of the Above-Ground Biomass Components of Young Picea Abies. Scand. J. For. Res. 2004, 19, 72–81. [Google Scholar] [CrossRef]
- Lyubov, V.; Popov, A.; Popova, E. The Energy and Ecological Performance of the Hot Water Boiler Burning Linden Bark and Wood Briquettes. In Proceedings of the IOP Conference Series: Earth and Environmental Science; IOP Publishing: Bristol, UK, 2020; Volume 408, p. 012003. [Google Scholar]
- Karbowniczak, A.; Hamerska, J.; Wróbel, M.; Jewiarz, M.; Nęcka, K. Evaluation of Selected Species of Woody Plants in Terms of Suitability for Energy Production. In Renewable Energy Sources: Engineering, Technology, Innovation; Mudryk, K., Werle, S., Eds.; Springer Proceedings in Energy; Springer International Publishing: Cham, Switzerland, 2018; pp. 735–742. ISBN 978-3-319-72370-9. [Google Scholar]
- Postrzednik, S. Analiza Parametrów Wpływających Na Energetyczną Przydatność Paliw (Analysis of the parameters influencing the energy usefulness of fuels - in Polish). Energetyka 2011, 7, 395–398. [Google Scholar]
- Demirbas, A. Relationships between Heating Value and Lignin, Moisture, Ash and Extractive Contents of Biomass Fuels. Energy Explor. Exploit. 2002, 20, 105–111. [Google Scholar] [CrossRef]
- Chen, W.-Y. Rates of Pyrolysis and Combustion of Bark by Thermogravimetfuc Analysis; YUMPU: Diepoldsau, Switzerland, 1996. [Google Scholar]
- DA, T. Wood as an Energy Resource. Fuel 1978, 3, 112–123. [Google Scholar]
- Jarvik, O.; Sulg, M.; Cirici, P.C.; Eldermann, M.; Konist, A.; Gusca, J.; Siirde, A. Co-Pyrolysis and Co-Gasification of Biomass and Oil Shale. Rigas Teh. Univ. Zinat. Raksti 2020, 24, 624–637. [Google Scholar] [CrossRef]
- Park, S.K. Ultimate Analysis of Different Biomass Fuels Sources & Common Fuels. Bioenergy Sci. Eng. 2014, FB-595. [Google Scholar]
- Voca, N.; Bilandzija, N.; Jurisic, V.; Matin, A.; Kricka, T.; Sedak, I. Proximate, Ultimate, and Energy Values Analysis of Plum Biomass By-Products Case Study: Croatia’s Potential. J. Agric. Sci. Technol. 2016, 18, 1655–1666. [Google Scholar]
- Obernberger, I.; Thek, G. Physical Characterisation and Chemical Composition of Densified Biomass Fuels with Regard to Their Combustion Behaviour. Biomass Bioenergy 2004, 27, 653–669. [Google Scholar] [CrossRef]
- Barkley, J.F.; Morgan, R.E. Burning Wood Waste for Commercial Heat and Power; Information circular; U.S. Department of the Interior, Bureau of Mines: Washington, DC, USA, 1950. [Google Scholar]
- Ghugare, S.B.; Tiwary, S.; Elangovan, V.; Tambe, S.S. Prediction of Higher Heating Value of Solid Biomass Fuels Using Artificial Intelligence Formalisms. BioEnergy Res. 2014, 7, 681–692. [Google Scholar] [CrossRef]
- Güleç, F.; Pekaslan, D.; Williams, O.; Lester, E. Predictability of Higher Heating Value of Biomass Feedstocks via Proximate and Ultimate Analyses–A Comprehensive Study of Artificial Neural Network Applications. Fuel 2022, 320, 123944. [Google Scholar] [CrossRef]
- Samadi, S.H.; Ghobadian, B.; Nosrati, M. Prediction of Higher Heating Value of Biomass Materials Based on Proximate Analysis Using Gradient Boosted Regression Trees Method. Energy Sources Part Recovery Util. Environ. Eff. 2021, 43, 672–681. [Google Scholar] [CrossRef]
- Bychkov, A.L.; Denkin, A.I.; Tikhova, V.D.; Lomovsky, O.I. Prediction of Higher Heating Values of Plant Biomass from Ultimate Analysis Data. J. Therm. Anal. Calorim. 2017, 130, 1399–1405. [Google Scholar] [CrossRef]
- Ulbig, P.; Hoburg, D. Determination of the Calorific Value of Natural Gas by Different Methods. Thermochim. Acta 2002, 382, 27–35. [Google Scholar] [CrossRef]
- Posom, J.; Sirisomboon, P. Evaluation of Lower Heating Value and Elemental Composition of Bamboo Using near Infrared Spectroscopy. Energy 2017, 121, 147–158. [Google Scholar] [CrossRef]
- Kovářová, M.; Pyszko, P.; Plášek, V. How Does the PH of Tree Bark Change with the Presence of the Epiphytic Bryophytes from the Family Orthotrichaceae in the Interaction with Trunk Inclination? Plants 2021, 11, 63. [Google Scholar] [CrossRef]
- Vinayaka, K.S. Diversity & Distribution of Tropical Macrolichens in Shettihalli Wildlife Sanctuary, Western Ghats, Southern India. Plant Sci. Today 2016, 3, 211. [Google Scholar] [CrossRef]
- Fojcik, B.; Chruścińska, M.; Nadgórska-Socha, A. Epiphytic Habitats in an Urban Environment; Contamination by Heavy Metals and Sulphur in the Barks of Different Tree Species. Pol. J. Nat. Sci. 2017, 32, 283–295. [Google Scholar]
- Takahashi, K.; Fukasawa, Y. Association between Corticolous Myxomycetes and Tree Vitality in Cryptomeria Japonica. Mycoscience 2022, 63, 45–52. [Google Scholar] [CrossRef]
- Schwarze, F.W.M.R. Wood Decay under the Microscope. Fungal Biol. Rev. 2007, 21, 133–170. [Google Scholar] [CrossRef]
- Shields, J.K. Microflora of Eastern Canadian Wood Chip Piles. Mycologia 1969, 61, 1165–1168. [Google Scholar] [CrossRef] [PubMed]
- Fan, S.; Sun, Y.; Ter Heijne, A.; Chen, W.-S.; Buisman, C.J.N. Effect of Nitrogen, Phosphorus and PH on Biological Wood Oxidation at 42 °C. Sci. Total Environ. 2020, 726, 138569. [Google Scholar] [CrossRef] [PubMed]
- Nicholas, D.D.; Crawford, D. Concepts in the Development of New Accelerated Test Methods for Wood Decay. In Wood Deterioration and Preservation: Advances in Our Changing World; ACS symposium series; American Chemical Society: Washington, DC, USA, 2003; pp. 288–312. [Google Scholar]
- Kubiak, D.; Osyczka, P. Non-Forested vs Forest Environments: The Effect of Habitat Conditions on Host Tree Parameters and the Occurrence of Associated Epiphytic Lichens. Fungal Ecol. 2020, 47, 100957. [Google Scholar] [CrossRef]
- Legrand, I.; Asta, J.; Goudard, Y. Variations in Bark Acidity and Conductivity over the Trunk Length of Silver Fir and Norway Spruce. Trees 1996, 11, 54–58. [Google Scholar] [CrossRef]
- Landaverde, A.C.; Shreckhise, J.H.; Altland, J.E. Storage Procedures Affect PH, Electrical Conductivity, and Nutrient Concentrations of Pour-through Leachate from Pine Bark and Peat-Based Substrates. HortScience 2020, 55, 1597–1604. [Google Scholar] [CrossRef]
- Ilek, A.; Siegert, C.M.; Wade, A. Hygroscopic Contributions to Bark Water Storage and Controls Exerted by Internal Bark Structure over Water Vapor Absorption. Trees 2021, 35, 831–843. [Google Scholar] [CrossRef]
- Sánchez, J.; Curt, M.D.; Robert, N.; Fernández, J. Biomass Resources. In The Role of Bioenergy in the Bioeconomy; Elsevier: Amsterdam, The Netherlands, 2019; pp. 25–111. [Google Scholar]
- Miller, J.J.; Owen, M.L.; Yang, X.M.; Drury, C.F.; Chanasyk, D.S.; Willms, W.D. Water Repellency and Hydrophobicity of Some Major Agricultural Crop Residues. Agron. J. 2019, 111, 3008–3019. [Google Scholar] [CrossRef]
- Usevičiūtė, L.; Baltrėnaitė, E. Methods for Determining Lignocellulosic Biochar Wettability. Waste Biomass Valorization 2020, 11, 4457–4468. [Google Scholar] [CrossRef]
- Sobol, Ł.; Łyczko, J.; Dyjakon, A.; Sroczyński, R. Relationship between Odor Adsorption Ability and Physical–Hydraulic Properties of Torrefied Biomass: Initial Study. Energies 2023, 16, 1780. [Google Scholar] [CrossRef]
- Pike, S. Birch Bark Is Waterproof and Flammable. York Weekly. 2013. Available online: https://eu.fosters.com/story/news/local/2019/01/29/nature-news-birch-bark-is-waterproof-and-flammable/6166558007/ (accessed on 10 July 2023).
- Demets, O.V.; Takibayeva, A.T.; Kassenov, R.Z.; Aliyeva, M.R. Methods of Betulin Extraction from Birch Bark. Molecules 2022, 27, 3621. [Google Scholar] [CrossRef] [PubMed]
- Šiman, P.; Filipová, A.; Tichá, A.; Niang, M.; Bezrouk, A.; Havelek, R. Effective Method of Purification of Betulin from Birch Bark: The Importance of Its Purity for Scientific and Medicinal Use. PLoS ONE 2016, 11, e0154933. [Google Scholar] [CrossRef] [PubMed]
- Hu, Z.; Guo, N.; Wang, Z.; Liu, Y.; Wang, Y.; Ding, W.; Zhang, D.; Wang, Y.; Yan, X. Development and Validation of an LC–ESI/MS/MS Method with Precolumn Derivatization for the Determination of Betulin in Rat Plasma. J. Chromatogr. B 2013, 939, 38–44. [Google Scholar] [CrossRef]
- Holonec, L.; Ranga, F.; Crainic, D.; Truta, A.; Socaciu, C. Evaluation of Betulin and Betulinic Acid Content in Birch Bark from Different Forestry Areas of Western Carpathians. Not. Bot. Horti Agrobot. Cluj-Napoca 2012, 40, 99–105. [Google Scholar] [CrossRef]
- O’Connell, M.M.; Bentley, M.D.; Campbell, C.S.; Cole, B.J. Betulin and Lupeol in Bark from Four White-Barked Birches. Phytochemistry 1988, 27, 2175–2176. [Google Scholar] [CrossRef]
Figure 1.
WDPT test scheme.

Figure 2.
MED test scheme.

Figure 3.
Ternary plot of proximate analysis of different species of tree bark.

Figure 4.
Heatmap of correlations between bark properties.


Table 1.
Tree bark species used in the study.
| No. | Tree Type | Scientific Name | Category |
|---|---|---|---|
| 1. | Black Mulberry | Morus nigra L. | Hardwood |
| 2. | Pedunculate Oak | Quercus robur L. | Hardwood |
| 3. | Horse Chestnut | Aesculus hippocastanum L. | Hardwood |
| 4. | Scots Pine | Pinus sylvestris L. | Softwood |
| 5. | White Willow | Salix alba L. | Hardwood |
| 6. | Norway Spruce | Picea abies L. | Softwood |
| 7. | Silver Birch | Betula pendula Roth | Hardwood |
| 8. | Common Pear | Pyrus communis L. | Hardwood |
| 9. | Common Alder | Alnus glutinosa L. | Hardwood |
| 10. | Black Locust | Robinia pseudoacacia L. | Hardwood |
| 11. | Common Aspen | Populus tremula L. | Hardwood |
| 12. | Norway Maple | Acer platanoides L. | Hardwood |
| 13. | Largeleaf Linden | Tilia platyphyllos Scop. | Hardwood |
| 14. | European Ash | Fraxinus excelsior L. | Hardwood |
Table 2.
Proximate analysis procedures.
| Parameter | Procedure | Device | Ref. |
|---|---|---|---|
| MC | PN-EN ISO 18134-2:2017-03E | SARTORIUS MA150 (SARTORIUS, Goettingen, Germany) | [56] |
| AC | PN EN ISO 18122:2015 | SNOL 8.2/1100 (SNOL, Utena, Lithuania) | [57] |
| VMC | PN-EN ISO 18123:2016-01 | Pyrolysis Biomass Gasifier No. 11/14/3 (ROTAMETR, Gliwice, Poland) | [58] |
| FCC | FCC = 1 − MC − AC − VMC | Formula | [59] |
| HHV | PN-EN ISO 18125:2017-07 | IKA C200 (IKA, Lucknow, India) | [60] |
| LHV | LHV = HHV − r·(MC + 8.94·H) | Formula | [61] |
where: r—latent heat of water vaporization (r = 2.44 MJ∙kg−1), H—hydrogen content in the analytical sample, 8.94—hydrogen to water converter.
| Water Drop Penetration Time, s | Adopted Properties |
|---|---|
| <5 | Hydrophilic |
| 5–60 | Slightly hydrophobic |
| 60–600 | Strongly hydrophobic |
| 600–3600 | Severely hydrophobic |
| >3600 | Extremely hydrophobic |
Table 4.
Simplified point scale for biomass classification.
| Assigned Points | Ash Content (%) | Volatile Matter Content (%) | Higher Heating Value (MJ·kg−1) | Hydrophobicity (WDPT, s) |
|---|---|---|---|---|
| 7 | 0–2 | >85% | >20 | >7200 |
| 6 | 2–4 | 80–85 | 17.5–20 | 3600–7200 |
| 5 | 4–6 | 75–80 | 15–17.5 | 1800–3600 |
| 4 | 6–8 | 70–75 | 12.5–15 | 600–1800 |
| 3 | 8–10 | 60–65 | 10–12.5 | 60–600 |
| 2 | 10–12 | 55–60 | 7.5–10 | 5–60 |
| 1 | >12 | <55 | <7.5 | <5 |
Table 5.
Proximate analysis of tree bark.
| Bark Type | MC, % | AC, % | VMC, % | FCC, % |
|---|---|---|---|---|
| Black Mulberry | 0.66 | 10.11 f ± 0.05 | 68.33 cde ± 1.27 | 20.90 abcd ± 1.25 |
| Pedunculate Oak | 0.76 | 7.56 de ± 0.10 | 68.96 cde ± 2.45 | 22.72 d ± 2.36 |
| Horse Chestnut | 0.73 | 11.91 g ± 0.17 | 63.10 ab ± 0.94 | 24.26 cd ± 0.96 |
| Scots Pine | 0.87 | 3.06 a ± 0.16 | 75.02 gh ± 1.82 | 21.04 abcd ± 1.91 |
| White Willow | 1.11 | 10.25 f ± 0.11 | 66.80 bc ± 0.71 | 21.84 bcd ± 0.82 |
| Norway Spruce | 0.87 | 3.09 a ± 0.07 | 72.19 efgh ± 2.73 | 23.85 d ± 2.66 |
| Silver Birch | 0.92 | 2.71 a ± 0.04 | 76.69 h ± 0.83 | 19.69 abcd ± 0.87 |
| Common Pear | 1.16 | 7.79 e ± 0.09 | 62.16 a ± 0.74 | 28.89 e ± 0.81 |
| Common Alder | 3.81 | 5.22 b ± 0.09 | 67.50 bcd ± 1.16 | 23.48 d ± 1.26 |
| Black Locust | 2.29 | 9.80 f ± 0.09 | 70.60 cdefg ± 0.50 | 17.32 ab ± 0.44 |
| Common Aspen | 0.53 | 7.17 d ± 0.48 | 71.43 defg ± 0.04 | 20.87 abcd ± 0.44 |
| Norway Maple | 1.07 | 12.09 g ± 0.32 | 69.78 cdef ± 2.22 | 17.06 a ± 2.34 |
| Largeleaf Linden | 1.36 | 5.83 c ± 0.09 | 74.12 fgh ± 0.56 | 18.70 abc ± 0.60 |
| European Ash | 0.47 | 7.74 e ± 0.11 | 74.81 gh ± 2.21 | 16.98 a ± 2.16 |
The same markings in the column (a, b, c, d…) mean no statistically significant differences between the type of bark according to the Tukey HSD test at the level of p = 0.05.
Table 6.
HHV and LHV of different species of tree bark.
| Bark Type | HHV, MJ·kg−1 | LHV, MJ·kg−1 |
|---|---|---|
| Black Mulberry | 18.023 abc ± 0.294 | 16.753 a ± 0.294 |
| Pedunculate Oak | 18.451 abcd ± 0.068 | 17.420 ab ± 0.068 |
| Horse Chestnut | 17.372 ab ± 0.137 | 16.227 a ± 0.137 |
| Scots Pine | 19.449 cdef ± 0.163 | 18.270 bc ± 0.163 |
| White Willow | 17.239 a ± 0.318 | 16.163 a ± 0.318 |
| Norway Spruce | 20.341 fg ± 0.125 | 19.103 cd ± 0.125 |
| Silver Birch | 21.618 g ± 0.375 | 20.246 d ± 0.375 |
| Common Pear | 19.461 cdef ± 0.173 | 18.301 bc ± 0.173 |
| Common Alder | 19.945 ef ± 0.858 | 18.638 bc ± 0.858 |
| Black Locust | 19.872 def ± 0.213 | 18.574 bc ± 0.213 |
| Common Aspen | 20.596 fg ± 1.238 | 19.371 cd ± 1.238 |
| Norway Maple | 17.425 ab ± 0.300 | 16.283 a ± 0.300 |
| Largeleaf Linden | 20.044 ef ± 0.367 | 18.697 bc ± 0.367 |
| European Ash | 18.799 bcde ± 0.609 | 17.569 ab ± 0.609 |
The same markings in the column (a, b, c, d…) mean no statistically significant differences between the type of bark according to the Tukey HSD test at the level of p = 0.05.
Table 7.
Mean HHVs for hardwood and softwood species.
| Hardwood Species | |
|---|---|
| Bark Type | Mean HHV, MJ·kg−1 |
| Black Mulberry | 19.070 ± 1.409 |
| Pedunculate Oak | |
| Horse Chestnut | |
| White Willow | |
| Silver Birch | |
| Common Pear | |
| Common Alder | |
| Black Locust | |
| Common Aspen | |
| Norway Maple | |
| Largeleaf Linden | |
| European Ash | |
| Softwood Species | |
| Bark Type | Mean HHV, MJ·kg−1 |
| Scots Pine | 19.895 ± 0.631 |
| Norway Spruce | |
Table 8.
Ultimate analysis of different species of tree bark.
| Bark Type | C, % | H, % | N, % | S, % |
|---|---|---|---|---|
| Black Mulberry | 51.48 def ± 0.52 | 5.75 a ± 0.04 | 0.23 ± 0.01 | - |
| Pedunculate Oak | 43.22 a ± 0.18 | 4.64 a ± 0.01 | - | - |
| Horse Chestnut | 47.32 abcd ± 0.89 | 5.17 a ± 0.08 | - | - |
| Scots Pine | 49.79 cde ± 0.69 | 5.31 a ± 0.02 | - | - |
| White Willow | 46.53 abc ± 1.71 | 4.81 a ± 0.18 | 1.24 ± 0.25 | - |
| Norway Spruce | 51.85 def ± 0.86 | 5.58 a ± 0.21 | - | - |
| Silver Birch | 55.14 f ± 1.18 | 6.19 a ± 0.08 | - | - |
| Common Pear | 51.24 def ± 2.38 | 5.19 a ± 0.48 | 0.15 ± 0.07 | - |
| Common Alder | 53.49 ef ± 0.77 | 5.57 a ± 0.08 | 0.54 ± 0.09 | - |
| Black Locust | 50.04 cde ± 0.50 | 5.70 a ± 0.04 | 1.11 ± 0.18 | - |
| Common Aspen | 49.40 bcde ± 1.75 | 5.56 a ± 0.18 | 0.18 ± 0.01 | - |
| Norway Maple | 45.06 ab ± 0.72 | 5.12 a ± 0.18 | 0.15 ± 0.03 | - |
| Largeleaf Linden | 50.27 cde ± 0.54 | 6.03 a ± 0.02 | - | - |
| European Ash | 49.40 bcde ± 1.19 | 5.59 a ± 0.13 | - | - |
The same markings in the column (a, b, c, d…) mean no statistically significant differences between the type of bark according to the Tukey HSD test at the level of p = 0.05.
Table 9.
The pH and electroconductivity of different species of tree bark.
| Bark Type | pH | eC, mS·cm−1 |
|---|---|---|
| Black Mulberry | 5.25 efg ± 0.31 | 1.202 cdef ± 0.207 |
| Pedunculate Oak | 5.07 def ± 0.04 | 1.047 bc ± 0.125 |
| Horse Chestnut | 5.39 fg ± 0.15 | 1.665 fg ± 0.315 |
| Scots Pine | 4.90 cde ± 0.05 | 0.532 a ± 0.029 |
| White Willow | 5.41 fg ± 0.15 | 1.632 efg ± 0.243 |
| Norway Spruce | 4.17 ab ± 0.20 | 1.125 bcd ± 0.023 |
| Silver Birch | 4.03 a ± 0.14 | 0.712 ab ± 0.086 |
| Common Pear | 4.70 cd ± 0.04 | 1.179 bcde ± 0.092 |
| Common Alder | 4.70 cd ± 0.14 | 0.921 abc ± 0.127 |
| Black Locust | 5.50 g ± 0.06 | 1.058 bc ± 0.125 |
| Common Aspen | 6.54 h ± 0.12 | 1.051 bc ± 0.025 |
| Norway Maple | 6.74 h ± 0.07 | 1.811 g ± 0.176 |
| Largeleaf Linden | 4.57 bc ± 0.03 | 1.575 defg ± 0.215 |
| European Ash | 6.80 h ± 0.11 | 1.556 defg ± 0.051 |
The same markings in the column (a, b, c, d…) mean no statistically significant differences between the type of bark according to the Tukey HSD test at the level of p = 0.05.
Table 10.
Hydrophobic properties of different species of tree bark.
| Bark Type | WDPT, s | Character (WDPT) | MED |
|---|---|---|---|
| Black Mulberry | 5558 b ± 1327 | extremely hydrophobic | 24% |
| Pedunculate Oak | 5842 b ± 754 | extremely hydrophobic | 24% |
| Horse Chestnut | 384 a ± 44 | strongly hydrophobic | 18% |
| Scots Pine | 4622 b ± 322 | extremely hydrophobic | 24% |
| White Willow | 4773 b ± 214 | extremely hydrophobic | 24% |
| Norway Spruce | 70 a ± 6 | strongly hydrophobic | 8.5% |
| Silver Birch | 6248 b ± 709 | extremely hydrophobic | 24% |
| Common Pear | 6452 b ± 1427 | extremely hydrophobic | 24% |
| Common Alder | 6076 b ± 1886 | extremely hydrophobic | 24% |
| Black Locust | 10,495 c ± 1496 | extremely hydrophobic | 24% |
| Common Aspen | 4435 b ± 1279 | extremely hydrophobic | 24% |
| Norway Maple | 4754 b ± 1169 | extremely hydrophobic | 24% |
| Largeleaf Linden | 1807 a ± 200 | severely hydrophobic | 24% |
| European Ash | 227 a ± 41 | strongly hydrophobic | 24% |
The same markings in the column (a, b, c) mean no statistically significant differences between the type of bark according to the Tukey HSD test at the level of p = 0.05.
Table 11.
Classification of most suitable hydrophobic-combustible bark species.
| Bark Species | HHV | AC | VMC | WDPT | Total | |
|---|---|---|---|---|---|---|
| Black Mulberry | 6 | 2 | 3 | 6 | 17 | Lowest score |
| Pedunculate Oak | 6 | 4 | 3 | 6 | 19 |  |
| Horse Chestnut | 5 | 2 | 2 | 3 | 12 | |
| Scots Pine | 6 | 6 | 5 | 6 | 23 | |
| White Willow | 5 | 2 | 3 | 6 | 16 | |
| Norway Spruce | 7 | 6 | 4 | 3 | 20 | |
| Silver Birch | 7 | 6 | 5 | 6 | 24 | |
| Common Pear | 6 | 4 | 2 | 6 | 18 | |
| Common Alder | 6 | 5 | 3 | 6 | 20 | |
| Black Locust | 6 | 3 | 4 | 7 | 20 | |
| Common Aspen | 7 | 4 | 4 | 6 | 21 | |
| Norway Maple | 5 | 1 | 3 | 6 | 15 | |
| Largeleaf Linden | 7 | 5 | 4 | 5 | 21 | |
| European Ash | 6 | 4 | 4 | 3 | 17 | Highest score |
Disclaimer/Publisher’s Note: The statements, opinions and data contained in all publications are solely those of the individual author(s) and contributor(s) and not of MDPI and/or the editor(s). MDPI and/or the editor(s) disclaim responsibility for any injury to people or property resulting from any ideas, methods, instructions or products referred to in the content. |
© 2023 by the authors. Licensee MDPI, Basel, Switzerland. This article is an open access article distributed under the terms and conditions of the Creative Commons Attribution (CC BY) license (https://creativecommons.org/licenses/by/4.0/).
Share and Cite
MDPI and ACS Style
Sobol, Ł.; Sabat, D.; Dyjakon, A. Assessment of Bark Properties from Various Tree Species in Terms of Its Hydrophobicity and Energy Suitability. Energies 2023, 16, 6586. https://doi.org/10.3390/en16186586
AMA Style
Sobol Ł, Sabat D, Dyjakon A. Assessment of Bark Properties from Various Tree Species in Terms of Its Hydrophobicity and Energy Suitability. Energies. 2023; 16(18):6586. https://doi.org/10.3390/en16186586
Chicago/Turabian StyleSobol, Łukasz, Dominika Sabat, and Arkadiusz Dyjakon. 2023. "Assessment of Bark Properties from Various Tree Species in Terms of Its Hydrophobicity and Energy Suitability" Energies 16, no. 18: 6586. https://doi.org/10.3390/en16186586
Note that from the first issue of 2016, this journal uses article numbers instead of page numbers. See further details here.