
Optimization of Welding Process of Geomembranes in Biodigesters Using Design of Factorial Experiments


1
Departamento de Estudios Multidisciplinarios, División de Ingenierías, Campus Irapuato-Salamanca, Universidad de Guanajuato, Yuriria 38944, Guanajuato, Mexico
2
Departamento de Arte y Empresa, División de Ingenierías, Campus Irapuato-Salamanca, Universidad de Guanajuato, Salamanca 36885, Guanajuato, Mexico
*
Author to whom correspondence should be addressed.
Energies 2023, 16(18), 6583; https://doi.org/10.3390/en16186583
Submission received: 4 August 2023
/
Revised: 1 September 2023
/
Accepted: 11 September 2023
/
Published: 13 September 2023
(This article belongs to the Collection Bioenergy and Biofuel)
Abstract
:This research focuses on the optimization of the thermofusion process in the construction of biodigesters as it has a direct influence on their quality and durability. The study utilizes factorial experiments and statistical analysis, with particular emphasis on the innovative application of the arcsine transformation. Two factorial designs were developed to account for warm and cold weather. The experiments evaluated factors such as the operator’s experience, wedge sealing temperature, sealing speed, and extruder temperature. The effects on the response variables were analyzed, which included overheating, resistance, and leaks. The study identified significant influences of the operator and the temperature of the wedge sealer in warm weather conditions, while the operator’s influence remained prominent in resistance and leakage tests in cold weather. Data transformation techniques, including the arcsine transformation, were employed to ensure statistical validity. Optimal input variable combinations were identified to maximize resistance and minimize overheating and air leaks. The research emphasizes the importance of optimizing the thermofusion process for biodigester construction, highlighting the role of arcsine transformation in improving statistical analysis. The findings enable practitioners to make informed decisions, leading to improvements in welding processes and overall biodigester quality.
1. Introduction
In the manufacture of biodigesters, the optimization of the thermofusion process for geomembranes assumes significance, owing to its direct impact on the quality of biodigesters. Geomembranes have a wide range of applications due to their durability, chemical resistance, and impermeability [1]. One of the common applications of geomembranes is their use in biodigesters as a lining material to prevent the escape of biogas and leachate from the tank [2]. The thermofusion process is applied to geomembranes. In order to guarantee their proper functionality, it is imperative to implement rigorous quality control measures throughout the entire process. The thermofusion process, also referred to as heat welding or hot air welding, involves the fusion of two or more geomembrane sheets through the application of heat [1]. This process assumes critical importance as it directly influences the integrity and longevity of the seam formed in the biodigester, thereby determining its strength and durability [3]. A poorly executed thermofusion can result in leaks, structural failure, and other problems, which can compromise the integrity of the entire biodigester [4].
There are several types of biodigesters; however, according to the “General Diagnosis of the Situation of Biodigestion Systems in Mexico” presented by the Federal Directorate of Agriculture, Animal Breeding, and Rural Development (SAGARPA), approximately 94.2% of biodigesters in Mexico are of the anaerobic type, known as lagoon type [5]. According to this report, it is estimated that many of these biodigesters are not operational due to leakage problems in the geomembranes. Unfortunately, this problem cannot be solved by the user because it is directly related to the manufacture of the biodigester [6]. Furthermore, Zhang et al. [7] detail that a critical factor for the success of a containment system is the quality of the welds. In their study, they highlight that the quality of the welds in geomembranes is significantly affected by variables such as temperature and welding speed as well as the environmental conditions of the site, especially ambient temperature. Similarly, Gassner et al. [8] carried out an analysis of the leak rate in 67 liquid retention ponds, predominantly with polyethylene liners, and observed that approximately 32% of the recorded failures were related to faulty welds, with the majority of these defects being at the bottom of the ponds. In a biodigester, weld problems that cause leaks can lead to economic losses and even put construction personnel at risk. For this reason, the optimization of the thermofusion process assumes significance as it aids in achieving a strong and durable seam. Several factors must be taken into account to optimize the thermofusion process in the construction of biodigesters. These factors include the type and thickness of the geomembrane, prevailing weather conditions, temperature, and the speed of the welding equipment. All these factors play a crucial role in the optimization process.
There are several ways that optimization can be achieved in manufacturing. A powerful tool for optimizing processes in manufacturing is the design of experiments (DOE) [9]. DOE uses mathematics to generate optimal experimental conditions, which helps improve the quality of a process or product while reducing costs [10]. This statistical technique evaluates multiple factors simultaneously and analyzes interaction effects, allowing for the identification of the optimal level of these factors to maximize the desired outcome [11].
In the analysis of the thermofusion process of biodigesters using DOE, the transformation of categorical response variables is crucial. In a biodigester, the response variables that are analyzed in this investigation include overheating, resistance, and leaks. Given that one of the response variables involves a pass-or-fail outcome, it becomes essential to accurately represent and analyze categorical data. In this regard, the utilization of the arcsine transformation emerges as a valuable technique for transforming categorical response variables into a continuous scale [12]. In the context of the optimization of the thermofusion process in biodigester construction, the application of the arcsine transformation offers substantial benefits. By transforming categorical response variables, such as the presence of structural failures, into a continuous scale, the analysis becomes more powerful and informative. It allows for the identification of significant factors and interactions that may influence the outcomes and enables the evaluation of the effects of various process variables on the quality and performance of the biodigester.
Recently, DOE has been employed as a methodology for process optimization in manufacturing [13]. In various fields and industries, DOE has proven to be a successful tool [11]. In the context of welding technique optimization, DOE has been widely used to identify critical factors that influence the quality of welded joints in different materials. For example, Farrahi et al. [14] used the DOE of the Taguchi method to examine the influence of various parameters on spot welding. The analysis results showed that electric current and welding time had the greatest effect on spot welding quality. Similarly, Eshraghi et al. [15] conducted a parametric study of the spot-welding process in dual-phase steels. They used DOE to investigate the effect of process parameters on the geometric characteristics of the weld nugget and heat-affected zone, including diameter and height. They discovered that the most important parameters were electric current, sheet thickness, and welding time, respectively. Sharda et al. [16] employed DOE to maximize the welding strength of aluminum. Variations in process parameters, such as gas flow rate, base current, and electrode spacing, were considered to control quality. Some parameters were kept constant, such as current, welding speed, and pulse frequency. It was observed that electric current, gas flow rate, and electrode spacing had a certain influence on tensile strength and material deformation rate. In another study, Madrid et al. [17] presented a novel method that combined the benefits of DOE techniques with welding simulation. The study determined the relationship between four process variables: power, speed, thickness, and bevel angle. The squared model was significant for response variables where weld penetration and distortion were quality responses to optimize. In these studies, an analysis of continuous responses was realized. Similarly, the realm of DOE and its diverse statistical and numerical methodologies have been employed for the prediction and enhancement of welding quality across various techniques, incorporating the utilization of continuous response data as well [18,19,20,21,22,23,24,25,26,27]. However, in the methodology of analysis, responses of a discrete nature were addressed. Through the utilization of the arcsine transformation, these responses were successfully transformed into a continuous format, a step deemed essential for enabling accurate analysis.
It is imperative to underscore that within the framework of DOE applications in bioenergetics, DOE focuses on optimizing system performance by evaluating the effects of different factors on biogas production [28,29,30,31,32]. In a separate investigative study, Ye Min et al. [33]. employed the principles of DOE to optimize the production of diesel–biodiesel–water emulsion fuel, effectively refining four independent variables to attain an optimal mean droplet size for the diesel–biodiesel emulsion. Nevertheless, in the context of optimizing the thermofusion process of biodigesters, the authors have encountered a gap in the literature as there seems to be a lack of investigations specifically applying DOE to this particular case.
Research on experiments regarding geomembrane welding to assess their quality has been identified. For instance, Llanos et al. [34], in their study, analyze the influence of welding machinery’s speed and temperature. They emphasize the importance of maintaining the speed below 5 m/min to achieve optimal weld strength. However, this research lacks a specific methodology based on DOE. Furthermore, the geomembranes used in the study are not suitable for biodigester construction. Similarly, in the work by Mendoza [35], experiments are not conducted using DOE, prompting the authors to recommend the search for optimal parameters through field testing to attain optimal outcomes for various types of geosynthetic materials. In the study conducted by Zhang et al. [7], the effects of temperature variations on the characteristics of high-density polyethylene geomembranes (HDPE) were investigated. This research focused on carrying out tests designed to detect changes in key properties, such as peel strength, shear tensile strength, and elongation at break. The results revealed an overheating phenomenon during the thermofusion process using the [specific type of] sealer, particularly under conditions of temperatures exceeding 450 °C and thermofusion speeds below 1 m/min. The authors emphasized the importance of operating at speeds above 3 m/min at 450 °C to prevent this undesirable overheating effect. Although this study provides valuable information for research purposes, it is pertinent to note that the detailed methodology of the tests is not fully specified in the report. Likewise, the identified parameters are not directly geared toward efficiency in the manufacturing of biodigesters. For example, the suitability of using speeds higher than 2 m/min is not mentioned. Therefore, in this article, the authors propose a novel approach using DOE that can optimize a categorical attribute or response, specifically to measure the thermofusion in biodigesters. By incorporating the arcsine transformation and accommodating both continuous and categorical responses, this study aims to identify the optimal conditions necessary to achieve the strongest and most durable fusion seams in biodigesters. The utilization of the arcsine transformation in this innovative DOE framework highlights its importance as a key tool for effectively addressing categorical response variables in the context of biodigester construction.
This article aims to visualize the importance of using the arcsine transformation to transform categorical response variables in the context of optimizing the thermofusion process in biodigester construction. Through the application of factorial experiments and statistical analysis, it demonstrates how the arcsine transformation enhances the accuracy, reliability, and interpretability of the results. By utilizing this transformation technique, researchers and practitioners can gain valuable insights into the factors that contribute to the quality and durability of biodigesters, ultimately leading to improved construction processes and more efficient use of resources.
2. Materials and Methods
The primary objective of this study is to improve the overall quality of the thermofusion process in biodigester construction. This research was conducted in collaboration with expert operators specializing in biodigester manufacturing. It is important to highlight that two separate DOEs were performed to evaluate the thermofusion process under distinct climatic conditions: one for warm weather and another for cold climates. This approach ensures the consideration of specific environmental factors that may influence the performance and reliability of the thermofusion process.
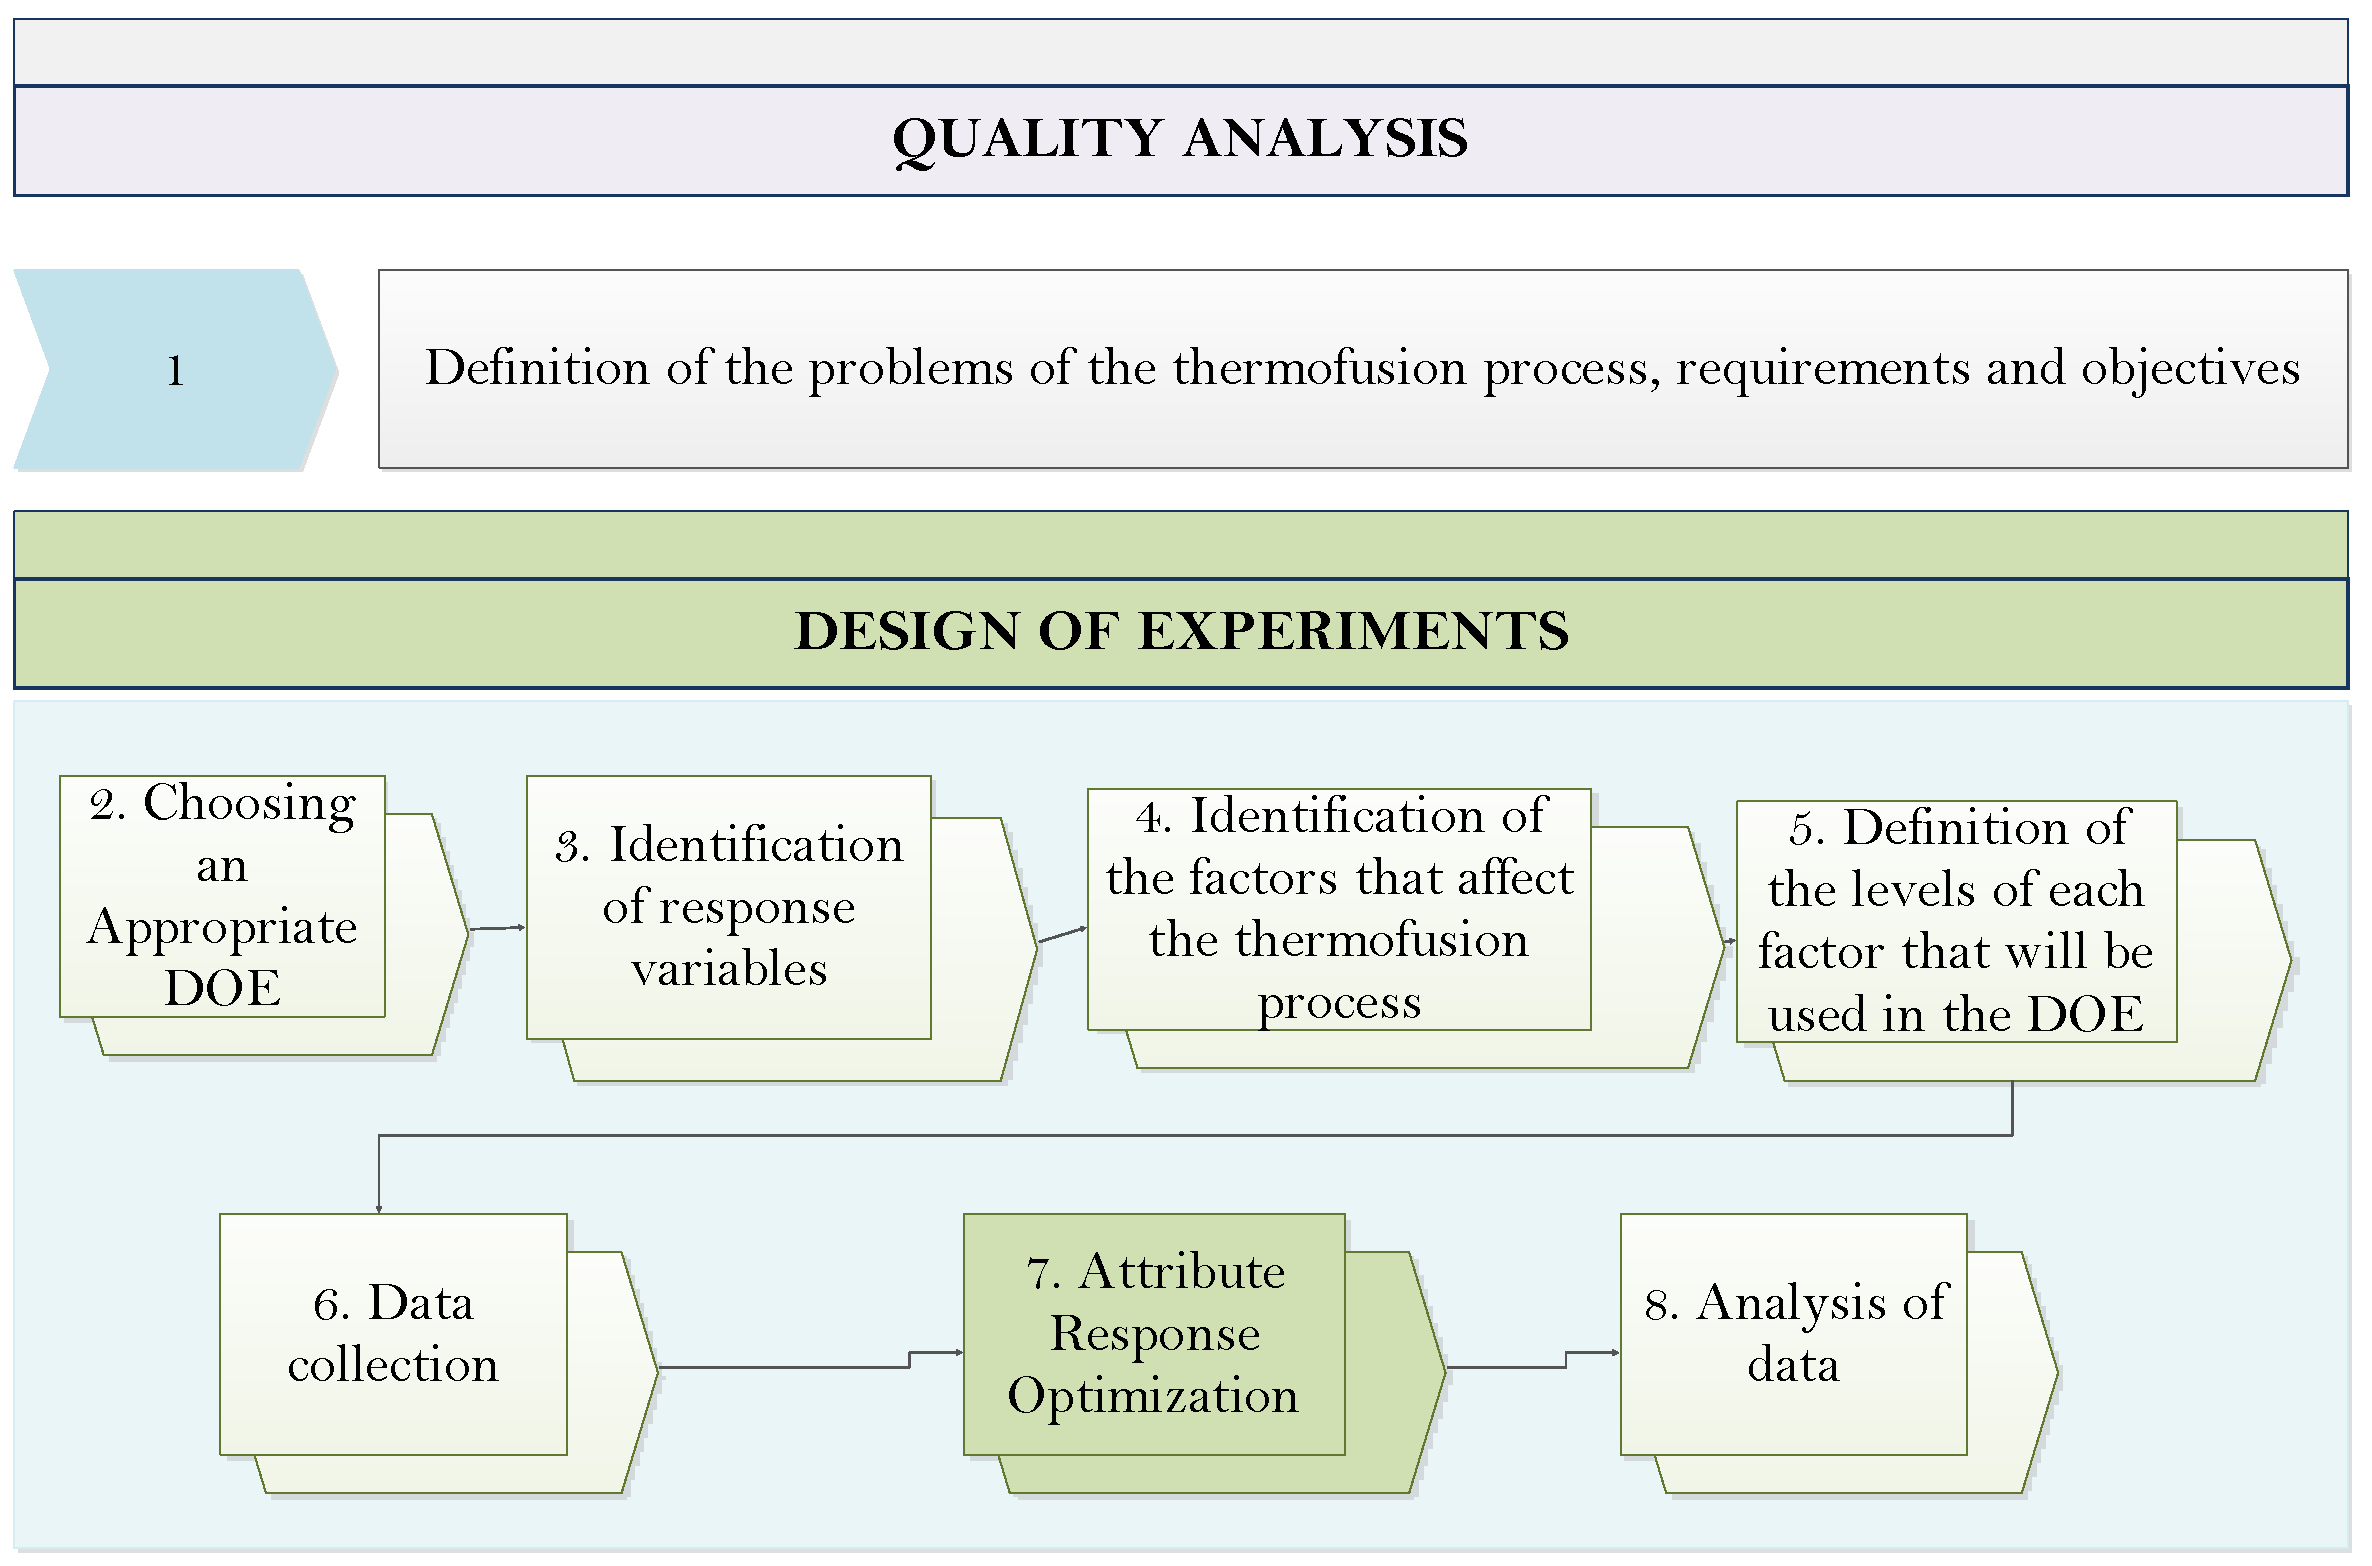
The present research encompasses eight distinct stages, which are visually illustrated in Figure 1.
Figure 1 visually represents the interconnected stages of the research, providing a comprehensive overview of the entire research framework.Each stage will be described in detail below.
Step 1. Definition of requirements of the thermofusion process, problems, and research objectives:
Through a comprehensive analysis, several potential issues directly associated with the quality of the thermofusion process of geomembranes were identified. These issues encompass various aspects, such as:
- Uneven heating: Uneven heating of the geomembrane can lead to weak spots and gaps in the fusion seam, which can compromise the integrity of the liner or containment system. This can be caused by a variety of factors, such as a dirty or damaged heating element or improper temperature control.
- Contamination: Contamination of the geomembrane surface can prevent a proper fusion between the two layers. This can occur when the surfaces are not properly cleaned or when debris, moisture, or other foreign substances are present.
- Inadequate fusion of the geomembrane layers: If the welding parameters are not set correctly for the geomembrane material, thickness, and ambient conditions, this can lead to inadequate fusion of the geomembrane layers. Welding parameters, such as temperature and speed, play a crucial role in achieving a proper weld joint.
The machines used for geomembrane thermofusion are as follows:
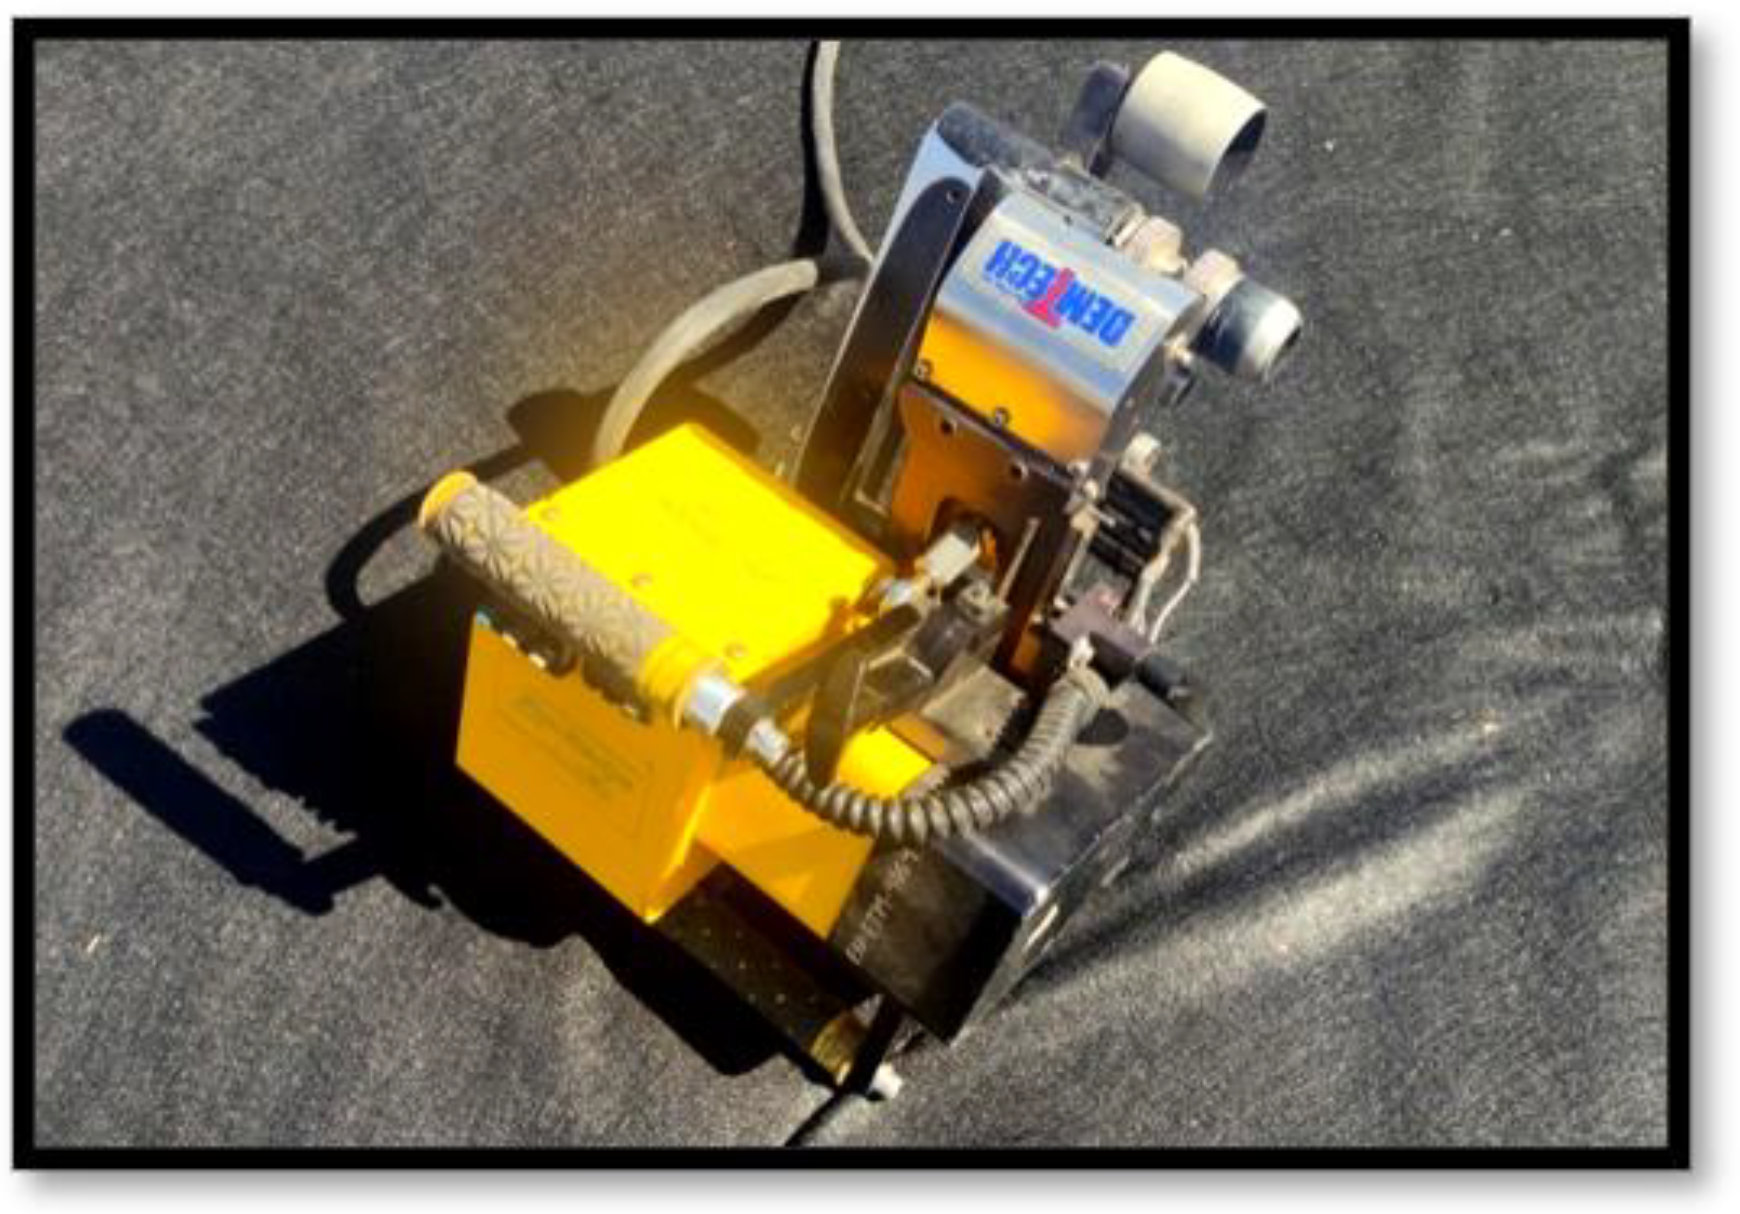
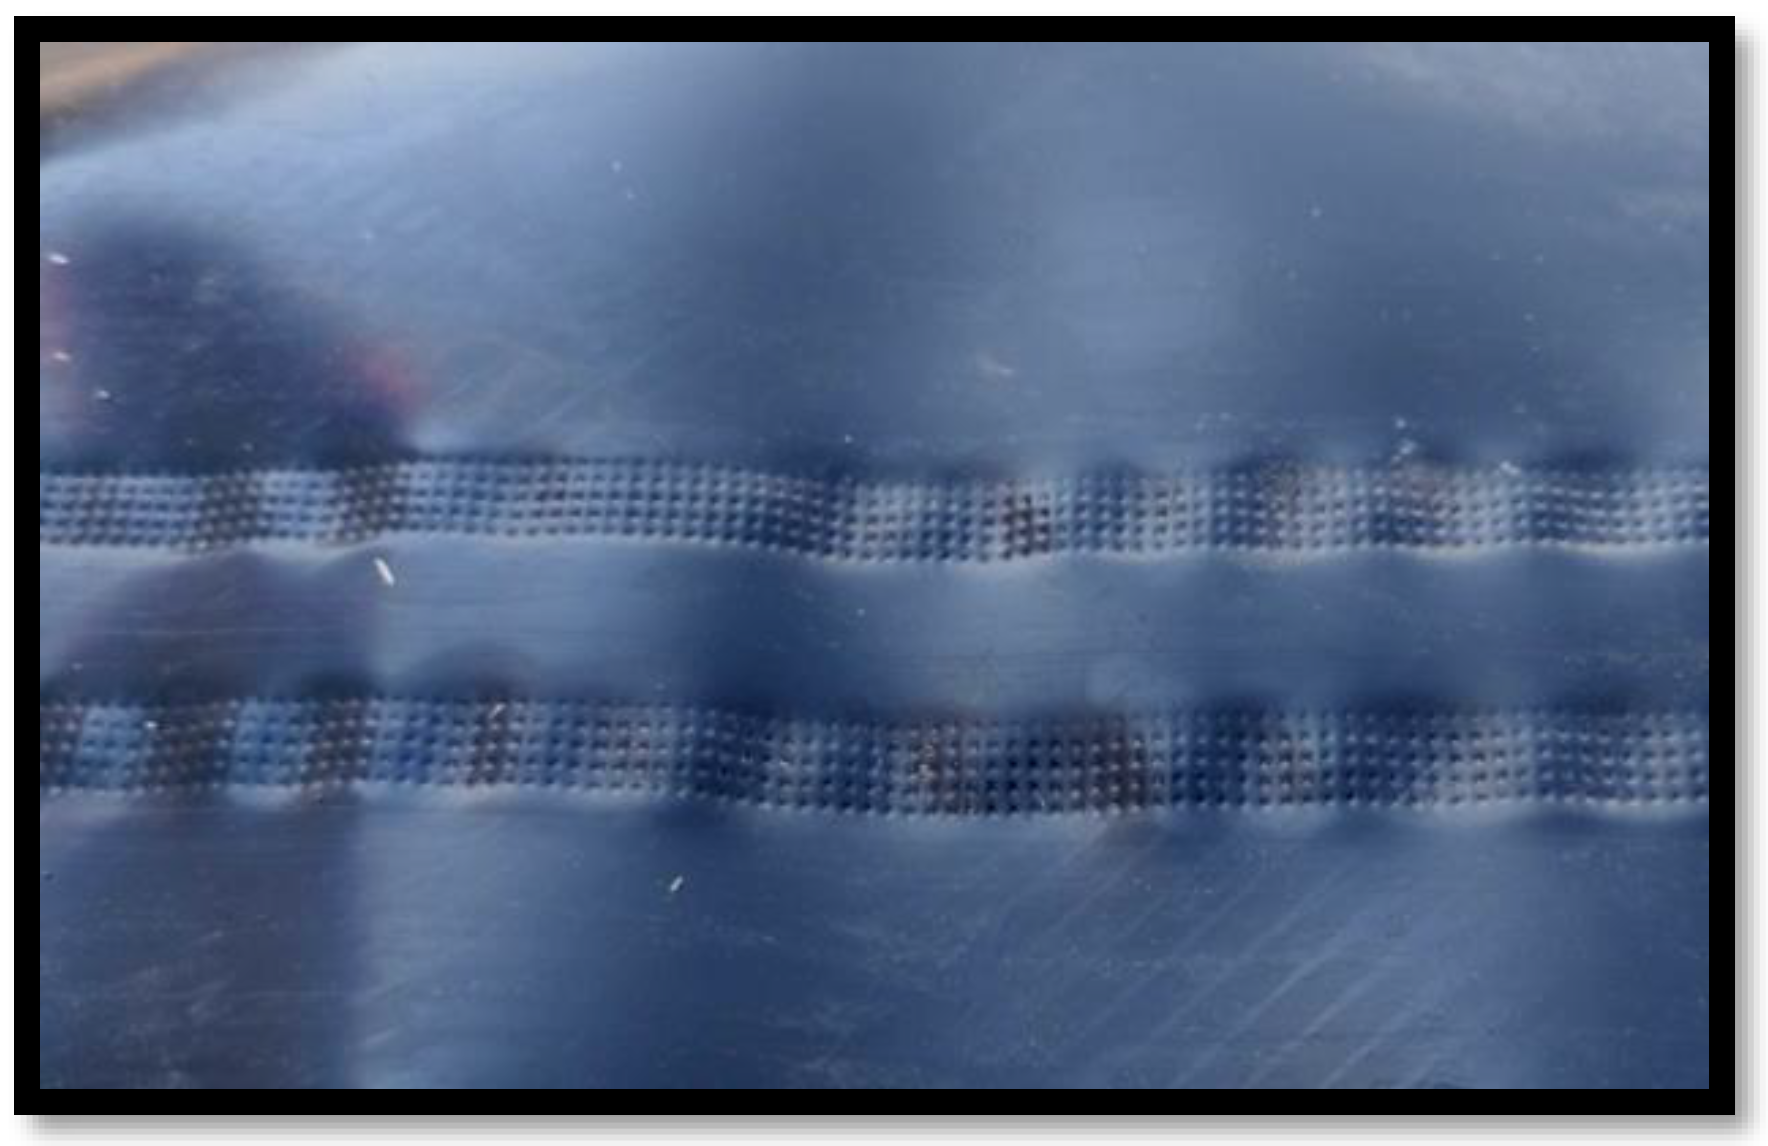
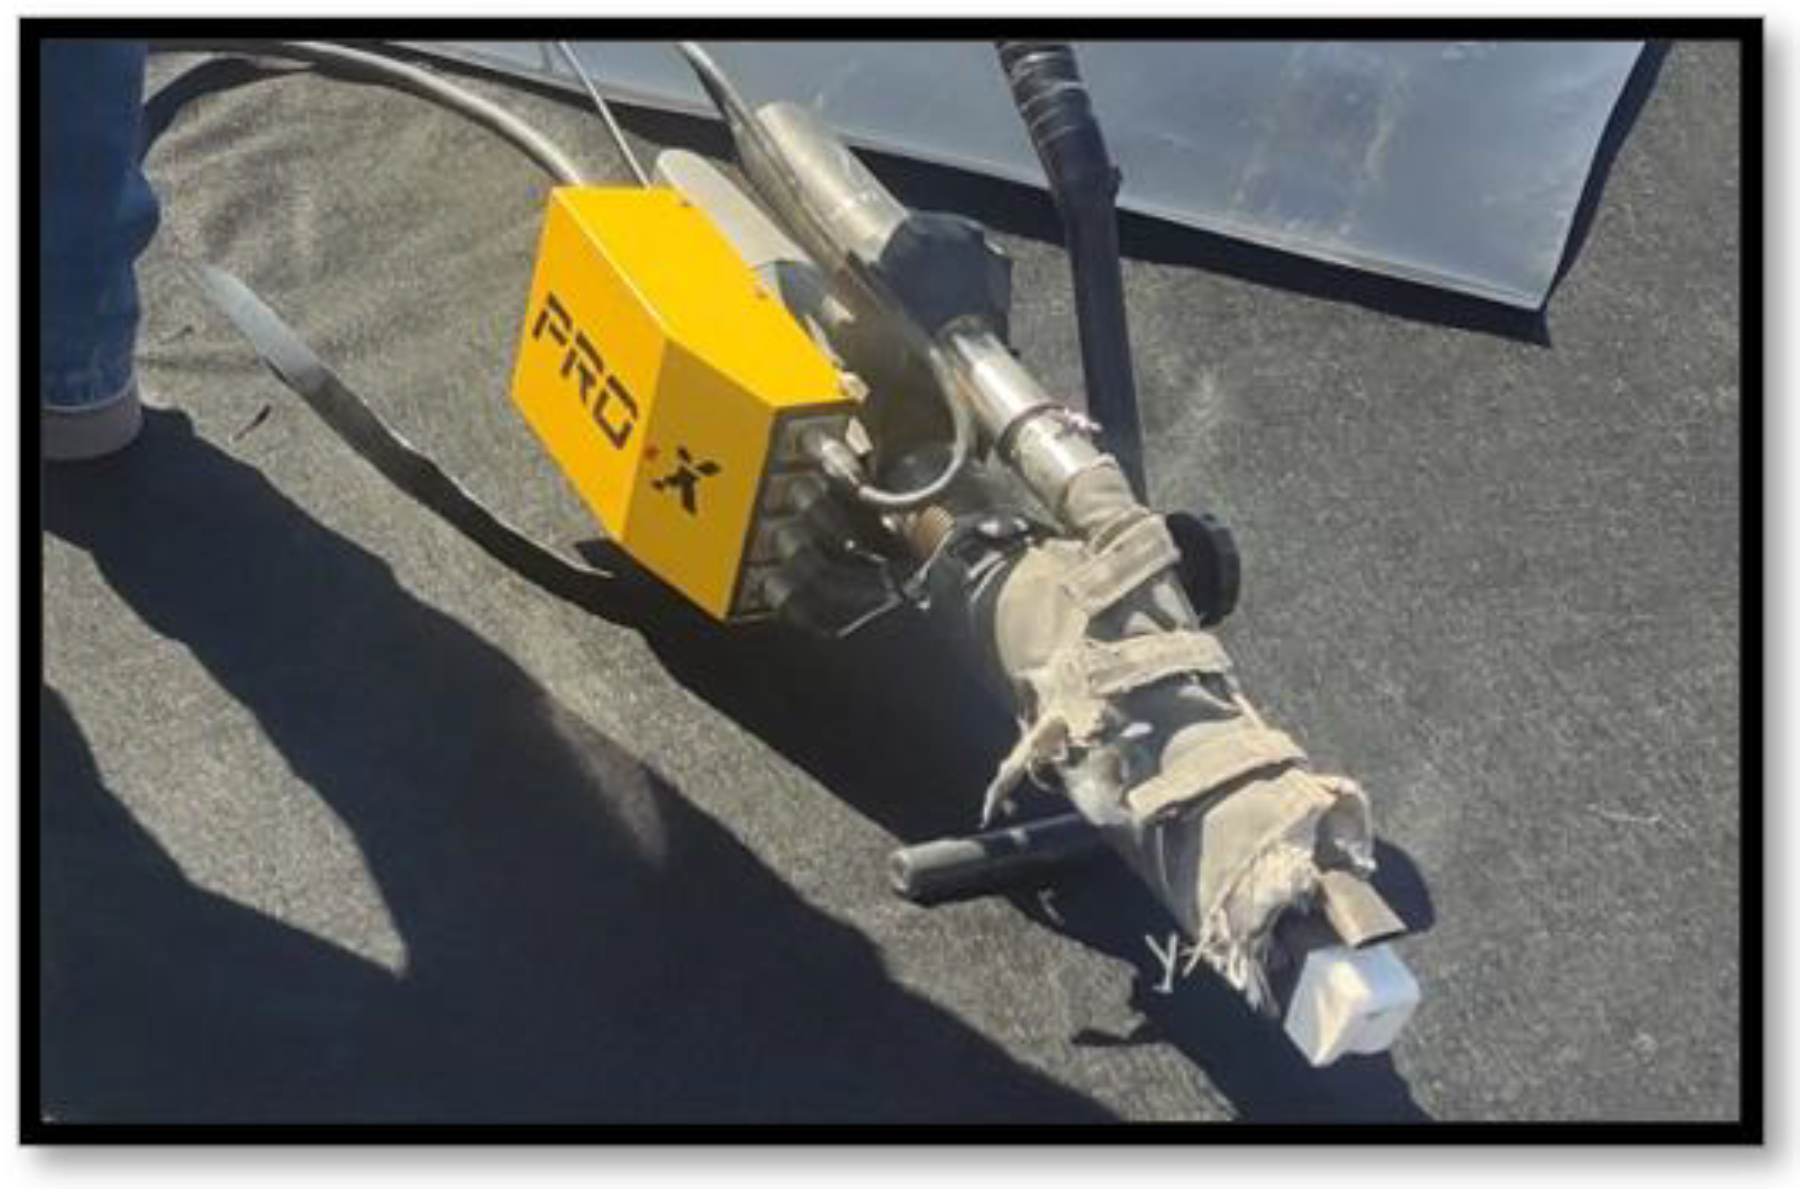
A wedge sealer (Figure 2) is machinery that operates by applying heat-generating energy, which melts the geomembrane material and exerts mechanical pressure through a set of rollers. The welding process begins by positioning two overlapping geomembrane sheets, with two parallel points serving as a reference. The wedge sealer creates a cavity in the center of the overlap, often referred to as a “test channel” (Figure 3). This channel remains empty during the welding process. The purpose of the test channel is to allow for nondestructive testing after the welding is complete. By injecting air into the test channel, various tests can be conducted to verify the integrity and quality of the weld. This helps ensure that the weld meets the required standards and provides a reliable barrier against leakage or other potential issues.
Extruder (Figure 4): Machinery with a welding system through a continuous high-density polyethylene (HDPE) cord with which optimal fusion is achieved as it is of the same quality as the geomembrane. This process is used mainly for repairs, patches, and closures.
- 4
- Poor alignment: If the geomembrane sheets are not properly aligned before the fusion process, it can lead to an imperfect seam or even complete failure.
- 5
- Operator error: Improper handling of the welding equipment or lack of training can also lead to problems during the thermofusion process.
To avoid these problems, the objective of our research is to utilize analysis tools such as DOE to optimize the welding process. By employing DOE, the welding parameters can be systematically varied to determine the optimal combination that ensures adequate fusion of the geomembrane material.
Step 2. Choice of an appropriate experimental design based on the research objectives
The factorial design of experiments was chosen as the experimental design for this study due to its well-established suitability and effectiveness in analyzing complex processes such as the thermofusion process in biodigesters.
Experimental data are essential for developing a model that establishes a relationship between inputs and outputs. This model typically includes first- and second-order terms, allowing for a more comprehensive representation of the underlying dynamics. When fitting the model to the experimental data, the most common approaches involve employing either a linear or quadratic form. In the case of a linear model with two factors, and , the relationship can be expressed as a simple linear equation. A linear model for two factors and , can written as:
where = is the response for given levels of the main effects with and , and , is included to account for a possible interaction between and . The constant is the response of when both main effects are zero. The three terms with single are the main effects. When the experimental data are analyzed, all the coefficients are estimated and the estimated coefficients of the X terms are tested to see which one is significant [36].
In this investigation, given the direct influence of climatic conditions on the thermofusion process, it was deemed crucial to conduct two separate DOEs to account for different climate scenarios. Specifically, one factorial DOE with a design was conducted for temperate climate conditions, and the other DOE with the same design was performed for cold climate conditions.
Step 3. Identification of the dependent variables or response variables that you want to optimize
The response variables of the experiment that will be analyzed are as follows: overheating, resistance, and the presence of a leak in the air test.
The assessment of overheating will be approached using a binary classification, indicating the presence (1) or absence (0) of overheating. Several factors will be considered to evaluate overheating, specifically focusing on the presence of bubbles or lumps in the weld. The presence of bubbles or lumps in the weld will serve as an indicator of overheating. If such irregularities are observed, it suggests that excessive heat was applied during the welding process, leading to overheating. These visual cues provide valuable evidence for identifying instances of overheating in the weld joint.
It is important to highlight that the evaluation of the response is conducted visually, necessitating a categorical analysis approach. Therefore, the response will be included in the DOE as a categorical variable. This approach is suitable because the weld is analyzed based on specific criteria for acceptance or rejection.
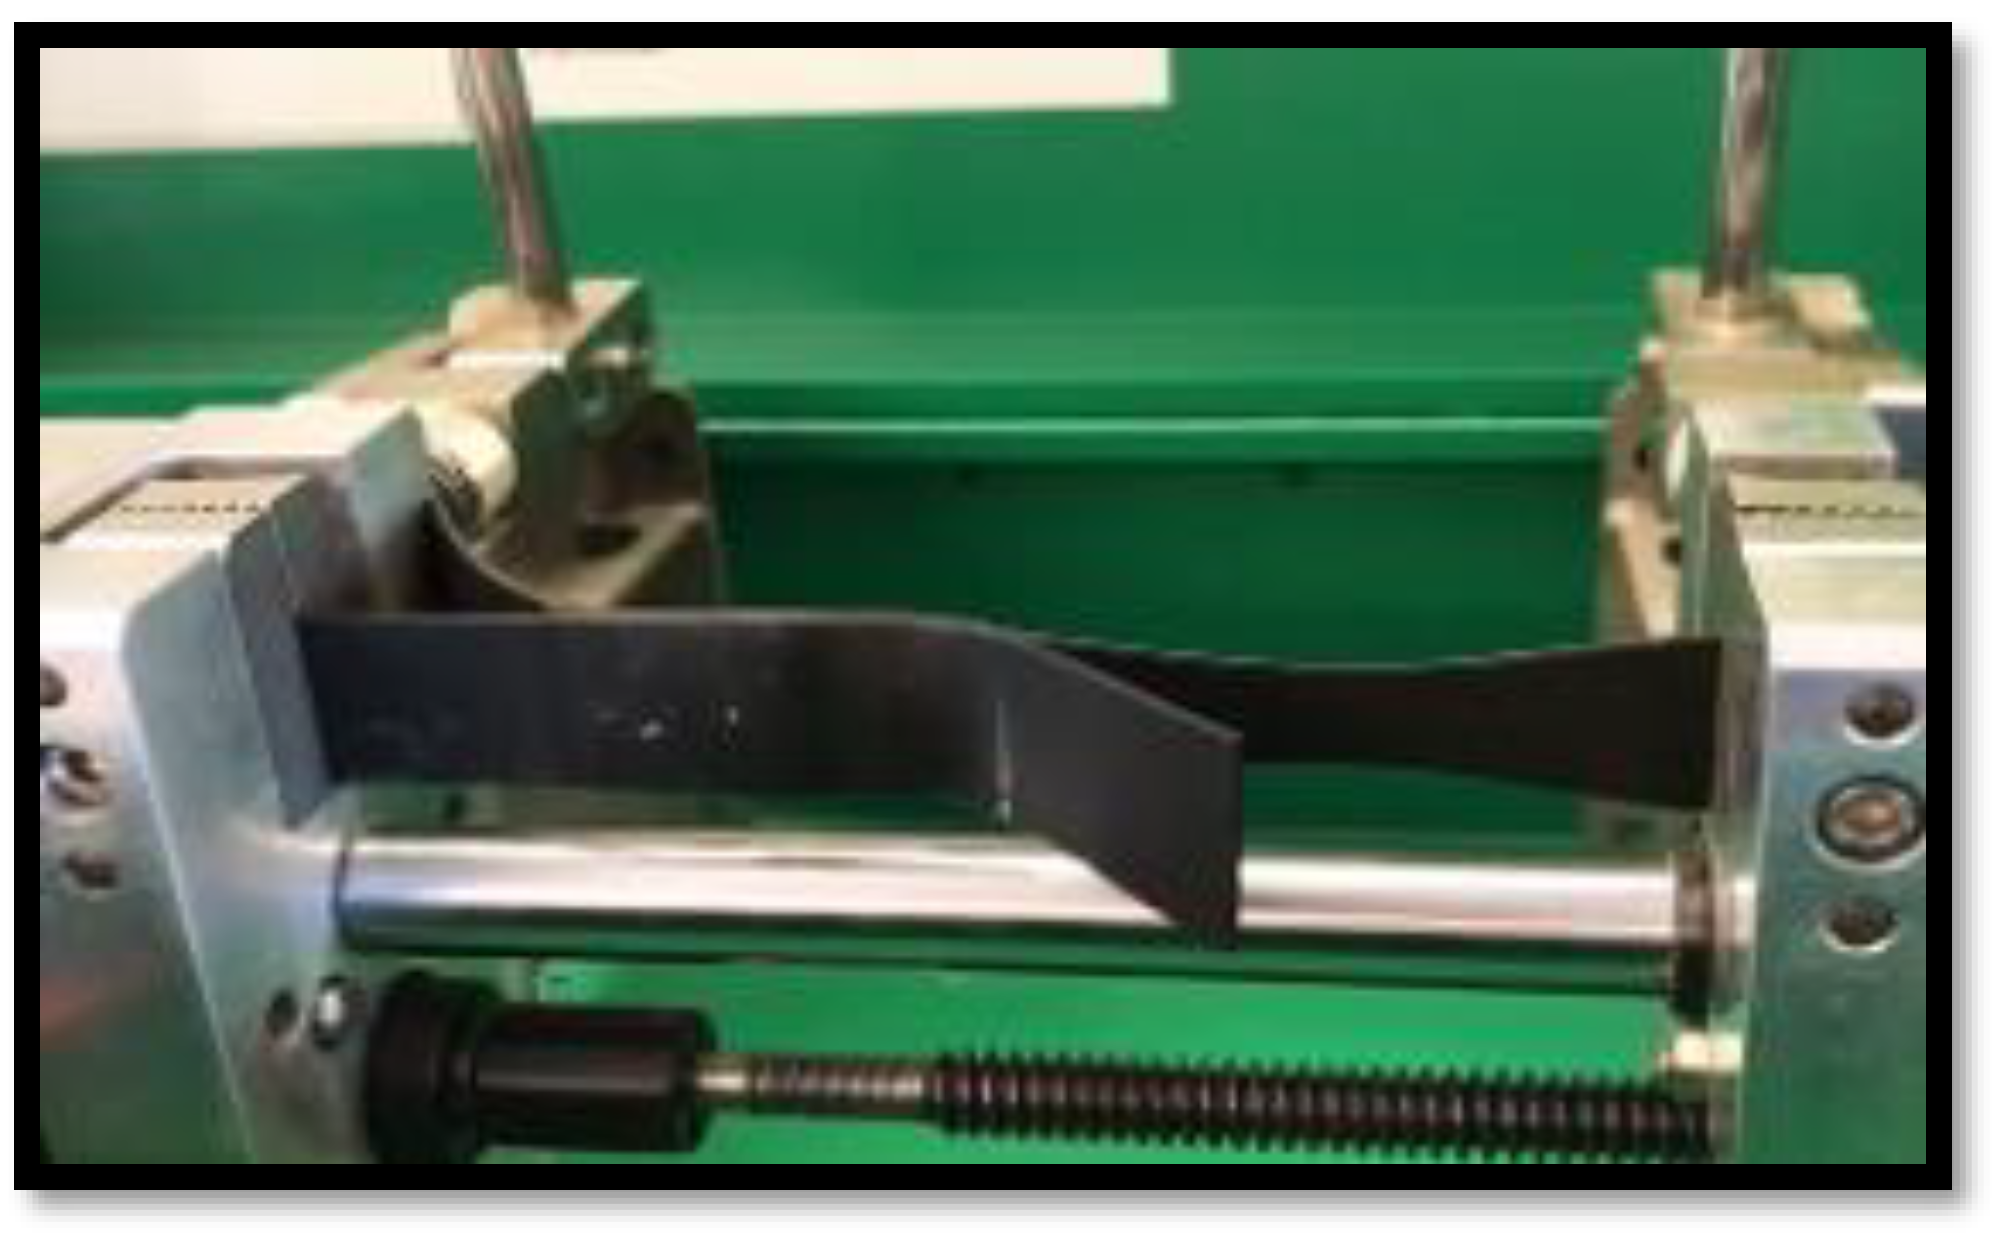
To evaluate the resistance of the weld, a tensiometer, also known as a tension tester or tensile testing machine, is used to measure the force required to cause separation or detachment of the welded part. A tensiometer is a specialized instrument designed to apply tension or pulling force to a material and measure the corresponding stress or strain. In the context of weld evaluation, the tensiometer is used to determine the maximum tension or load that the weld can withstand before detachment (Figure 5). The threshold of 80 lb/in² serves as a standardized measure to assess the weld’s strength and integrity. If the weld can support this specified tension, it demonstrates adequate resistance and indicates a properly executed weld. In case the weld does not support 80 lb/in2, it is considered that there is a detachment and that it was not carried out correctly. The use of a tensiometer in evaluating the resistance and peel-off characteristics of the weld contributes to quality assurance and helps ensure the structural integrity and longevity of the welded components.
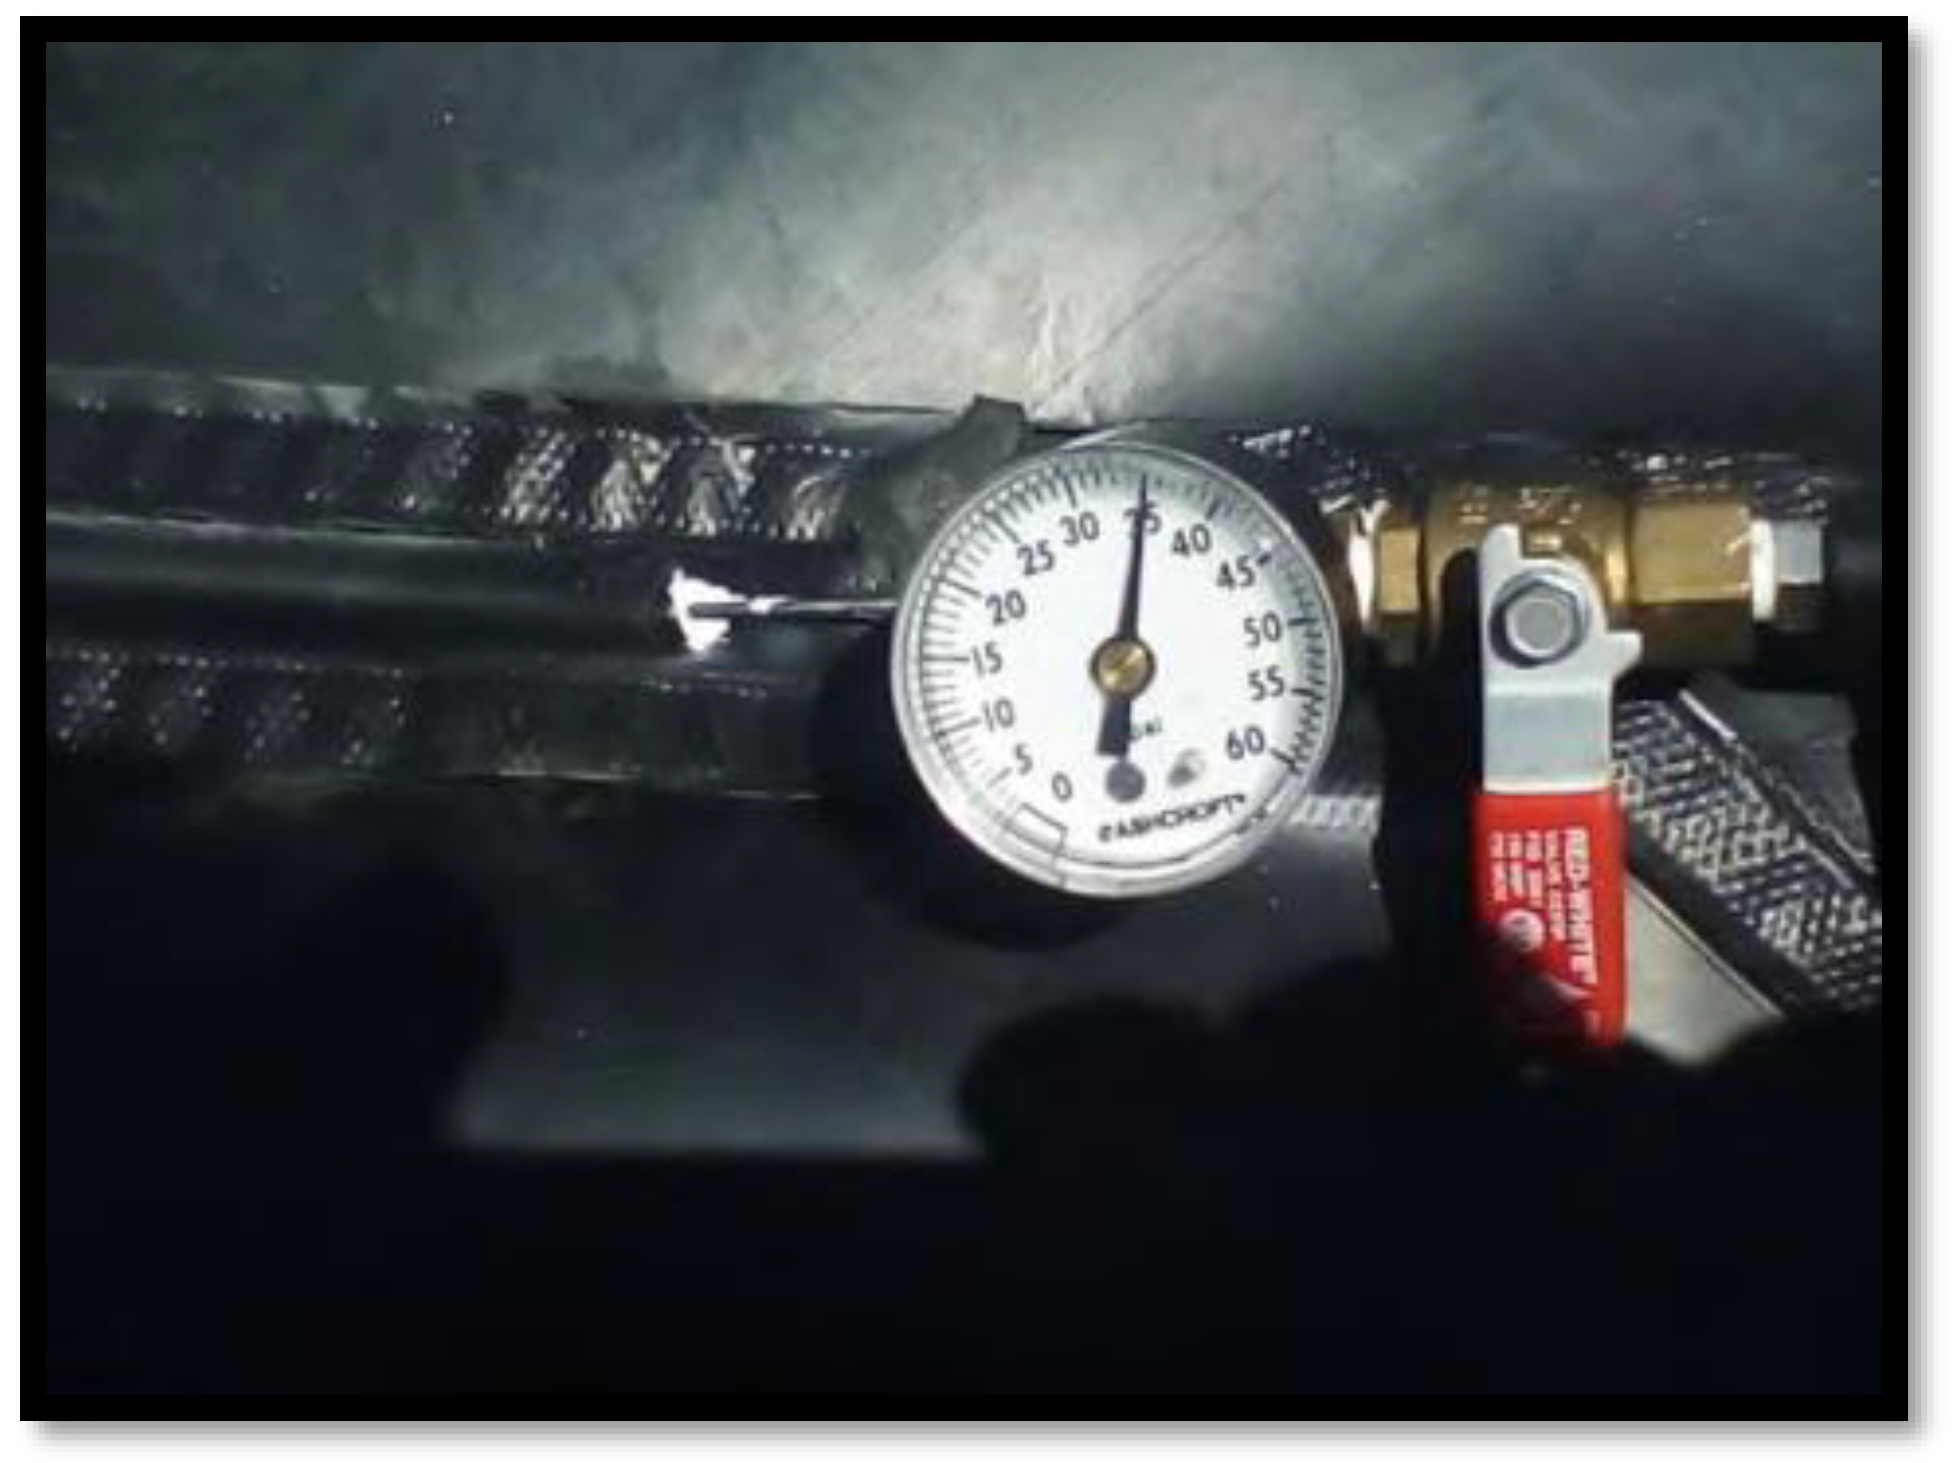
To verify the integrity of the thermofusion process and ensure there are no leaks, an air test is conducted using air injection. One advantage of the machinery used for thermofusion is that it creates a channel during the sealing process, which allows for the introduction of pressurized air for air pressure testing. The air test is designed to identify any air leaks in the geomembrane seals. To perform the test, a pressurized manometer is used to measure the pressure between 25 and 30 pounds per square inch (psi) in the joints where the respective channel exists. The pressure measurement is taken initially, and then a designated time period is provided for observation (refer to Figure 6). If a difference greater than 4 psi is observed between the initial measurement and the end of the pressure gauge, it indicates a possible brittle joint or leakage in the geomembrane seal. This suggests that the thermofusion process may not have been executed correctly and that further inspection or repair is required. Conversely, if no difference greater than 4 psi is detected during the air test, it indicates that there is no leak in the geomembrane seal. This confirms the successful execution of the thermofusion process, ensuring the integrity and reliability of the sealed joints. By conducting thorough air tests and evaluating the pressure differentials, any potential leaks in the geomembrane seals can be promptly identified, allowing for necessary corrective actions and ensuring the effectiveness of the thermofusion process.
Step 4. Identification of factors or independent variables that affect the quality of the thermofusion process, which are directly related to the response variable
In the quality analysis of the thermofusion process, several factors are analyzed to assess their impact on the final weld quality. These variables include the following:
Operator: The skill and expertise of the operator directly influence the execution of the thermofusion process. Factors such as experience and training can affect the consistency and accuracy of the welds.
Wedge sealing temperature: The temperature at which the wedge sealing process is performed plays a crucial role in achieving proper fusion. This variable determines the melting and bonding of the geomembrane material, affecting the strength and integrity of the weld.
Sealing speed: The speed at which the welding equipment moves along the seam affects the heat input and material flow during the thermofusion process. Proper control of the sealing speed ensures adequate heat distribution and fusion, contributing to the quality of the weld.
Extruder temperature: The temperature of the extruder, which supplies the molten material for the welding process, is a critical variable. It determines the viscosity and flow characteristics of the molten geomembrane material, impacting the quality and strength of the resulting weld.
Type of geomembrane: Different types of geomembranes have varying physical properties and fusion characteristics. Factors such as material composition, thickness, and surface texture can influence the welding process and the overall weld quality.
Weather temperature: The ambient temperature during the thermofusion process can affect the material behavior and fusion properties of the geomembrane. Extreme temperatures, too hot or too cold, can pose challenges and require adjustments to the welding parameters to ensure optimal fusion.
Voltage: The voltage supplied to the welding equipment can impact the energy input and the performance of the thermofusion process. Proper voltage control is necessary to ensure consistent and reliable welds.
Geomembrane overlap: The overlap distance between two geomembrane sheets significantly influences the surface area available for fusion. The appropriate overlap distance ensures sufficient contact and fusion between the sheets, contributing to a strong and durable weld.
By analyzing and controlling these variables during the thermofusion process, the quality of the welds can be effectively monitored and improved. Understanding the influence of each variable allows for adjustments, optimization, and adherence to specific guidelines and standards, ensuring reliable and high-quality thermofusion welds.
Step 5. Definition of the levels: Elaboration of the range of values for each factor that will be used in the experiment
Based on the previous point, there are eight key factors that influence the thermofusion process of geomembranes. Among these factors, four will be varied in DOE: operator, wedge sealing temperature, sealing speed, and extruder temperature. These variables will be intentionally altered to assess their impact on the weld quality and performance. On the other hand, the remaining process parameters will remain constant throughout the experiments. These parameters include the type of geomembrane, weather temperature, voltage, and geomembrane overlap. By keeping these factors constant, their potential influence on the thermofusion process can be isolated, allowing for a focused analysis of the variables under investigation.
This approach allows for a systematic evaluation of the significant variables while maintaining consistency in the other process parameters. By clearly defining the factors subject to variation and those kept constant, DOE ensures a comprehensive assessment of the thermofusion process and provides valuable insights into the individual contributions of each variable. Levels and specifications of the operator, wedge sealing temperature, sealing speed, and extruder temperature are shown in Table 1.
This design allows for a systematic exploration of the selected factors, by varying them at two levels.
The operator factor will involve comparing the performance of different operators, considering their level of training and experience. The assessment of the operator will be approached using a binary classification. The operator’s level of experience and training can be denoted as “1” if they possess these qualities and as “0” if they do not. The wedge sealing temperature, measured in degrees Celsius, will be another variable of interest. Two levels of temperature will be selected for evaluation, 390 °C and 450 °C, to assess the impact of varying temperatures on the fusion characteristics and overall quality of the welds. The speed of the wedge sealer will also be examined as a factor in the DOE. The levels of sealing speed will be 2.6 and 3.6 m per minute (m/min), and these levels will be chosen for evaluation and determination of the optimal speed to achieve consistent and reliable fusion in the biodigester welds. Furthermore, the extruder temperature, measured in degrees Celsius, will be considered a significant factor. Two levels of temperature will be selected for these levels, 270 °C and 290 °C, to evaluate their influence on the melt properties and resulting weld quality in the biodigesters.
In DOE analysis, several variables will be held constant without varying their levels. These variables include the type of geomembrane, climatic temperature, voltage, and geomembrane overlap. By keeping these factors unchanged, we can isolate their effects and focus on evaluating the impact of the variables that are being varied. Detailed specifications of these unchanged factors, including the specific type of geomembrane, climatic temperature range, voltage level, and the required geomembrane overlap, can be found in Table 2.
In the context of biodigester applications, the type of geomembrane that is used in the investigation is specified as HDPE type Gm13 with a thickness of 1.5 mm. HDPE stands for high-density polyethylene, which is a common material choice for geomembranes due to its excellent chemical resistance, durability, and flexibility. This particular type of geomembrane has undergone prior evaluation, demonstrating its suitability for thermofusion applications in the field of biodigesters [6]. The specific type, HDPE type Gm13, indicates a particular grade or formulation of HDPE geomembrane that is suitable for use in biodigester applications. This type of geomembrane is specifically engineered to meet the requirements and challenges posed by biodigester environments. The thickness of 1.5 mm indicates the physical thickness of the geomembrane material. The choice of thickness depends on various factors, including the size of the biodigester, the level of expected stress or pressure on the geomembrane, and any regulatory or industry standards that need to be met. Specifying the type of geomembrane as HDPE type Gm13 with a thickness of 1.5 mm ensures that the biodigester system is constructed using a geomembrane material that is appropriate for the application. This choice of geomembrane provides the necessary barrier properties, chemical resistance, and strength required to effectively contain and manage the organic waste and biogas generated within the biodigester system.
In reference to the temperature of the climate, it is important to highlight that the analysis will include two distinct climatic temperatures. Given the direct influence of climatic conditions on the thermofusion process, it was deemed crucial to conduct two separate DOEs to account for different climate scenarios. One DOE was carried out at a constant temperature of 29 °C, while the other DOE was carried out at a temperature of 9 °C. Since weather conditions are beyond our control, this factor was kept constant throughout the experiments.
Step 6. Data collection
To deepen the way in which the sampling was carried out, a total of 96 specific tests were conducted to measure the thermofusion process in the geomembranes. These tests were distributed as follows: The first DOE involved a factorial design with 4 factors at 2 levels and 4 replicas, specifically tailored for the warm climate conditions. The temperature was maintained constant at 29 °C, resulting in a total of 64 tests. The second DOE used a factorial design with 4 factors at 2 levels and 2 replicas, focusing on the cold climate conditions. The temperature remained constant at 9 °C, resulting in a total of 32 tests. Table 2 shows the data collected in the DOE experiments. Table 3 and Table 4 show the DOE corresponding to hot and cold weather, respectively.
These tests evaluated various aspects of the fusion process, including the quality, strength, and durability of the welded geomembranes. Through rigorous experimentation and data collection, the welded geomembrane scrims were subjected to air tests, stress tests, and visual validations, generating a comprehensive and robust dataset. Overheating was assessed based on a visual examination of the welds for any signs of bubbles or bulges. To measure gas leaks, gas leak tests were carried out to identify possible leaks in the biodigester seals, ensuring the integrity of the welded joints. Finally, to measure the resistance, a part of the geomembrane canvas was subjected to a tension test, with the objective of determining if it can support a specific load of 80 lb/in2. By varying the main factors of the process, the response variables were evaluated. The DOE analysis provided valuable information to optimize the thermofusion process for biodigesters. The findings contribute to improving the quality of welds, ensuring the durability and efficiency of biodigester systems.
Step 7. Optimization of attribute responses
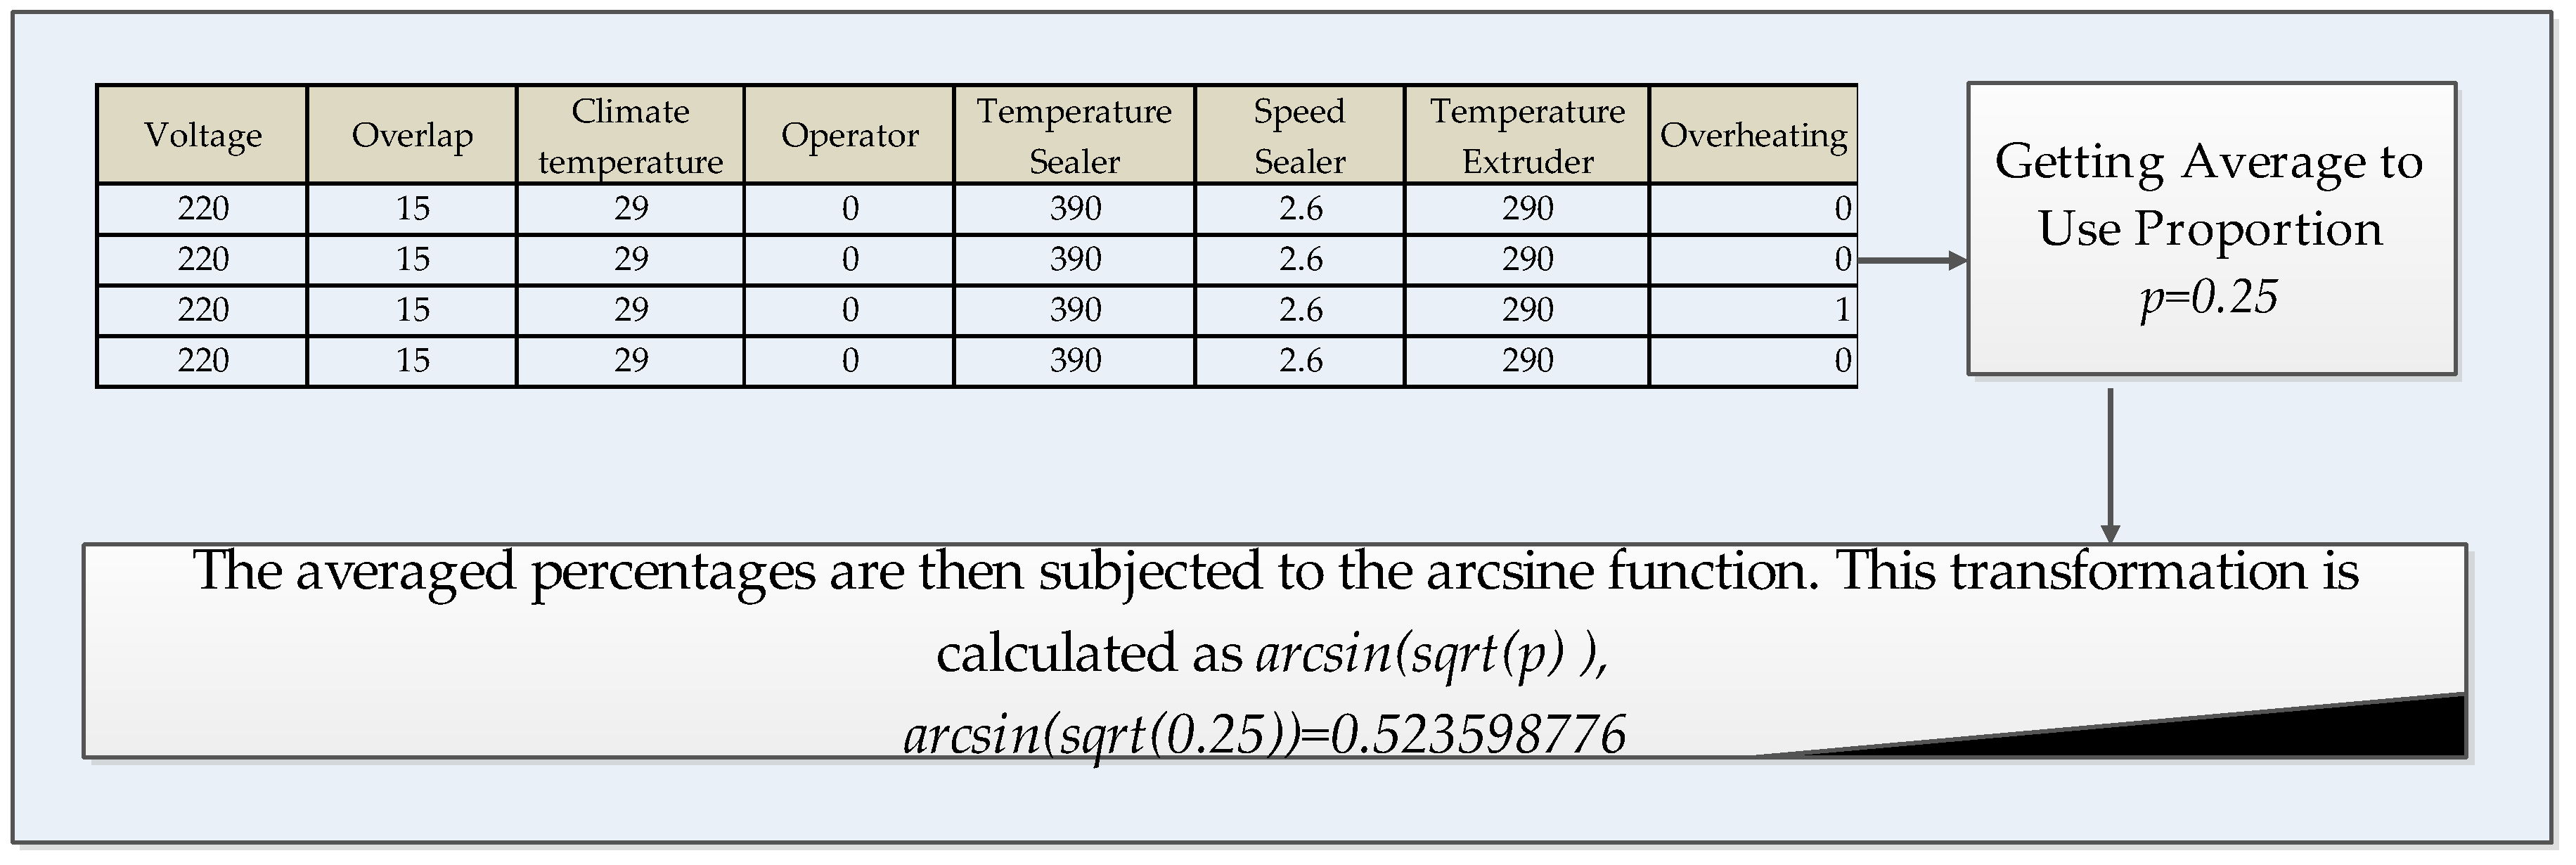
The response variables in this DOE analysis will include overheating, resistance, and gas leak tests. To optimize the response of an attribute in a DOE using the arcsine transformation, the DOE replicates are averaged so that the data represent proportions or percentages that are transformed using the arcsine function. By using the arcsine transform, the response attribute can be effectively optimized within the DOE framework. This transformation helps normalize the data and address any abnormalities. In proposed DOEs, replicates play a vital role. These replicates are used to average multiple measurements to obtain a single percentage of replicate treatments. The averaged percentages are then subjected to the arcsine function. In the first DOE with a design with 4 replicates, resulting in a total of 64 experiments, the average is calculated for each replicate treatment. Consequently, the final design would consist of 16 treatments. By applying the arcsine transformation, the function is applied to each average. This transformation is typically computed as arcsin(sqrt(y)),where y represents the original ratio or percentage value. The same approach is applied to the second DOE, which uses a design with 2 replicates, resulting in an equivalent number of 16 final treatments. Figure 7 provides an example in which this process is performed for the first 4 DOE replicates for warm weather. Table 3 and Table 4 in the Results Section show the final two DOEs. After applying the transformation, an analysis of the transformed data is performed to identify significant factors and their effects on the response.
Step 8. Data analysis
For data analysis, the Minitab 18® software was used. The DOE analysis consisted of 4 points:
- Analysis of significant factors and interactions in DOEs: The analysis of significant factors and interactions involved determining which factors have a statistically significant impact on the response variable and how they interact with each other. The Pareto chart is a graphical tool used in the analysis of significant factors in the design of experiments (DOE) [37]. It is particularly useful in identifying and prioritizing the most influential factors affecting a response variable based on their relative importance.
- Interaction effects analysis: In addition to the main effects, interactions between factors are also examined. Interaction effects occur when the effect of one factor on the response variable depends on the level or presence of another factor. Interaction effects can be additive, synergistic, or antagonistic. By including interaction terms in the statistical model, researchers can evaluate the significance and strength of these interactions.
- Verification of assumptions in statistical analysis: involves checking for normality, constant variance, and independence of the data. Normality refers to the data following a normal distribution, while constant variance means that the variability of the response variable is consistent across all levels of factors. Independence indicates that observations or data points are not correlated or dependent on each other. These assumptions are crucial for valid statistical inference. The normal probability plot is used to test these assumptions.
- Optimization of the response variables of the model: It involves finding the combination of factors or input variables that maximizes or minimizes the response variable(s) based on the objectives of the study. The goal is to identify the optimal settings or conditions that lead to the desired outcome.
3. Results
In this paper, two factorial designs are proposed, with one being intended for warm weather conditions and the other for cold weather conditions. The final DOEs for each climate are presented in Table 5 and Table 6, respectively.
Each DOE has 16 experiments; it is important to remember that the averages of the replicates were taken.
3.1. Analysis of Significant Factors and Interactions
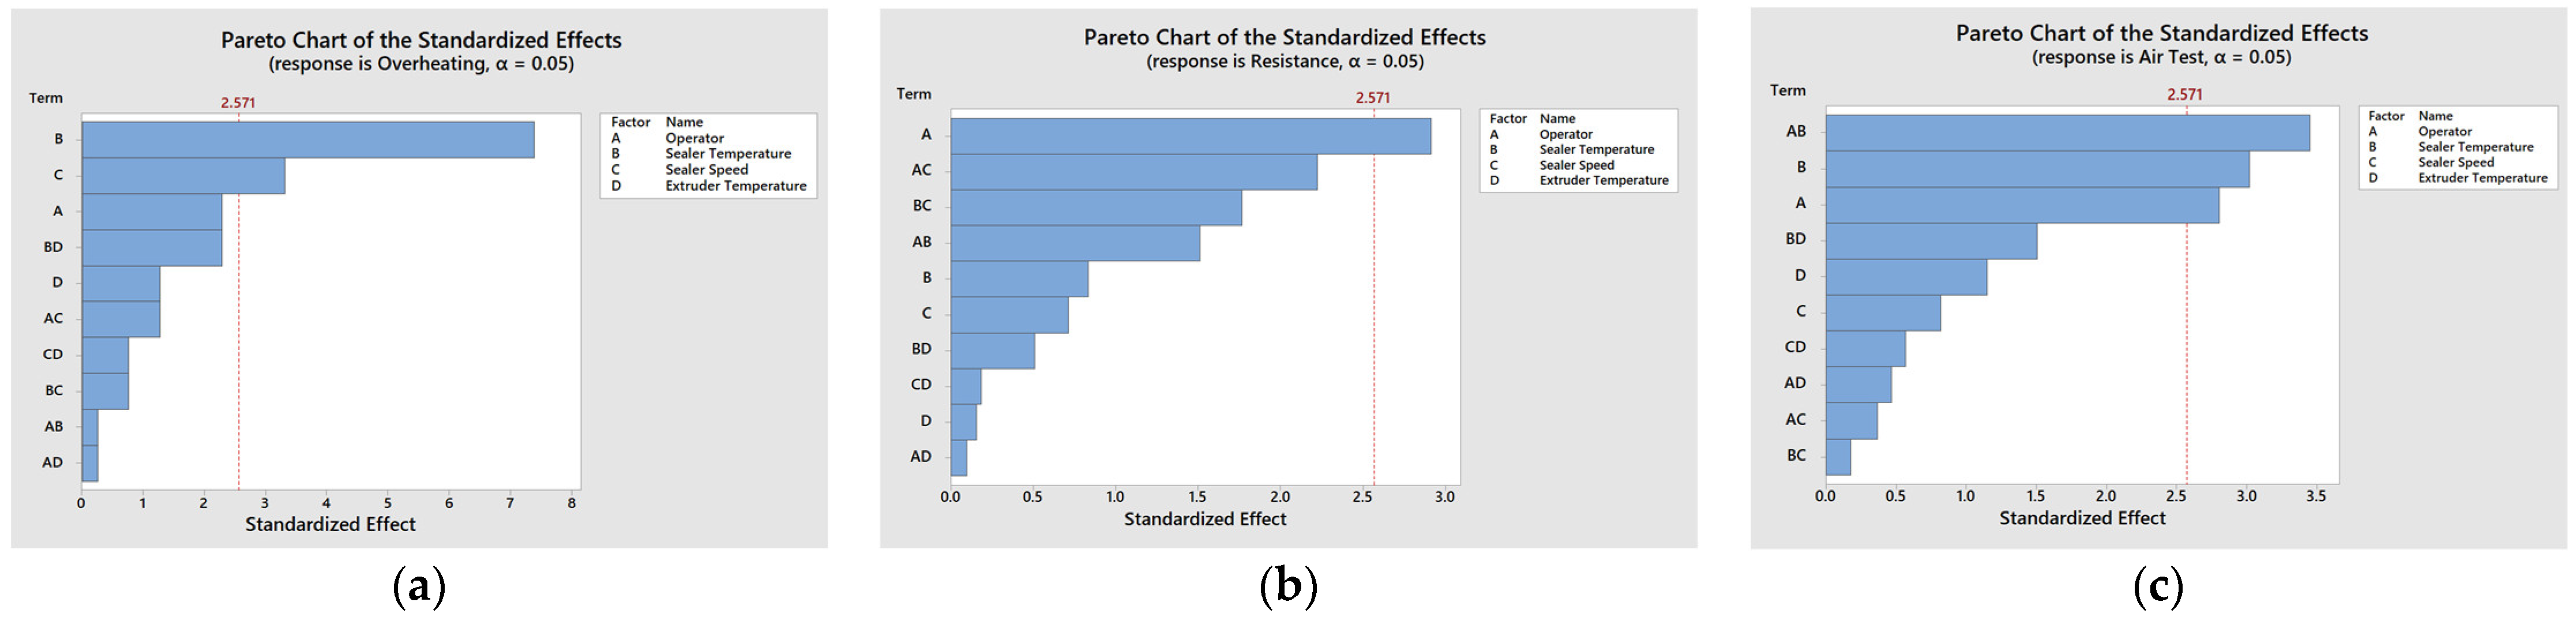
The analysis of significant factors for overheating, resistance, and gas leaks in warm weather conditions is shown in Figure 8.
Figure 8 illustrates the Pareto chart for warm climatic conditions. It is evident that both the operator and the temperature of the wedge-sealing process have exerted significant influence over the pivotal dependent variables of resistance and leakage tests in our analysis. Additionally, upon delving into the domain of overheating, it becomes apparent that the temperature and velocity of the wedge sealer stand out as the predominant factors driving the impact of this phenomenon. The prominence of Figure 8 lies in emphasizing the significance of proficient operators and adopting more precise control over the temperature and velocity during the sealing process. This move holds the potential to augment the quality and outcomes of resistance, overheating, and air leakage tests. The implementation of these targeted enhancements could pave the way for considerable progress while ensuring comprehensive process reliability.
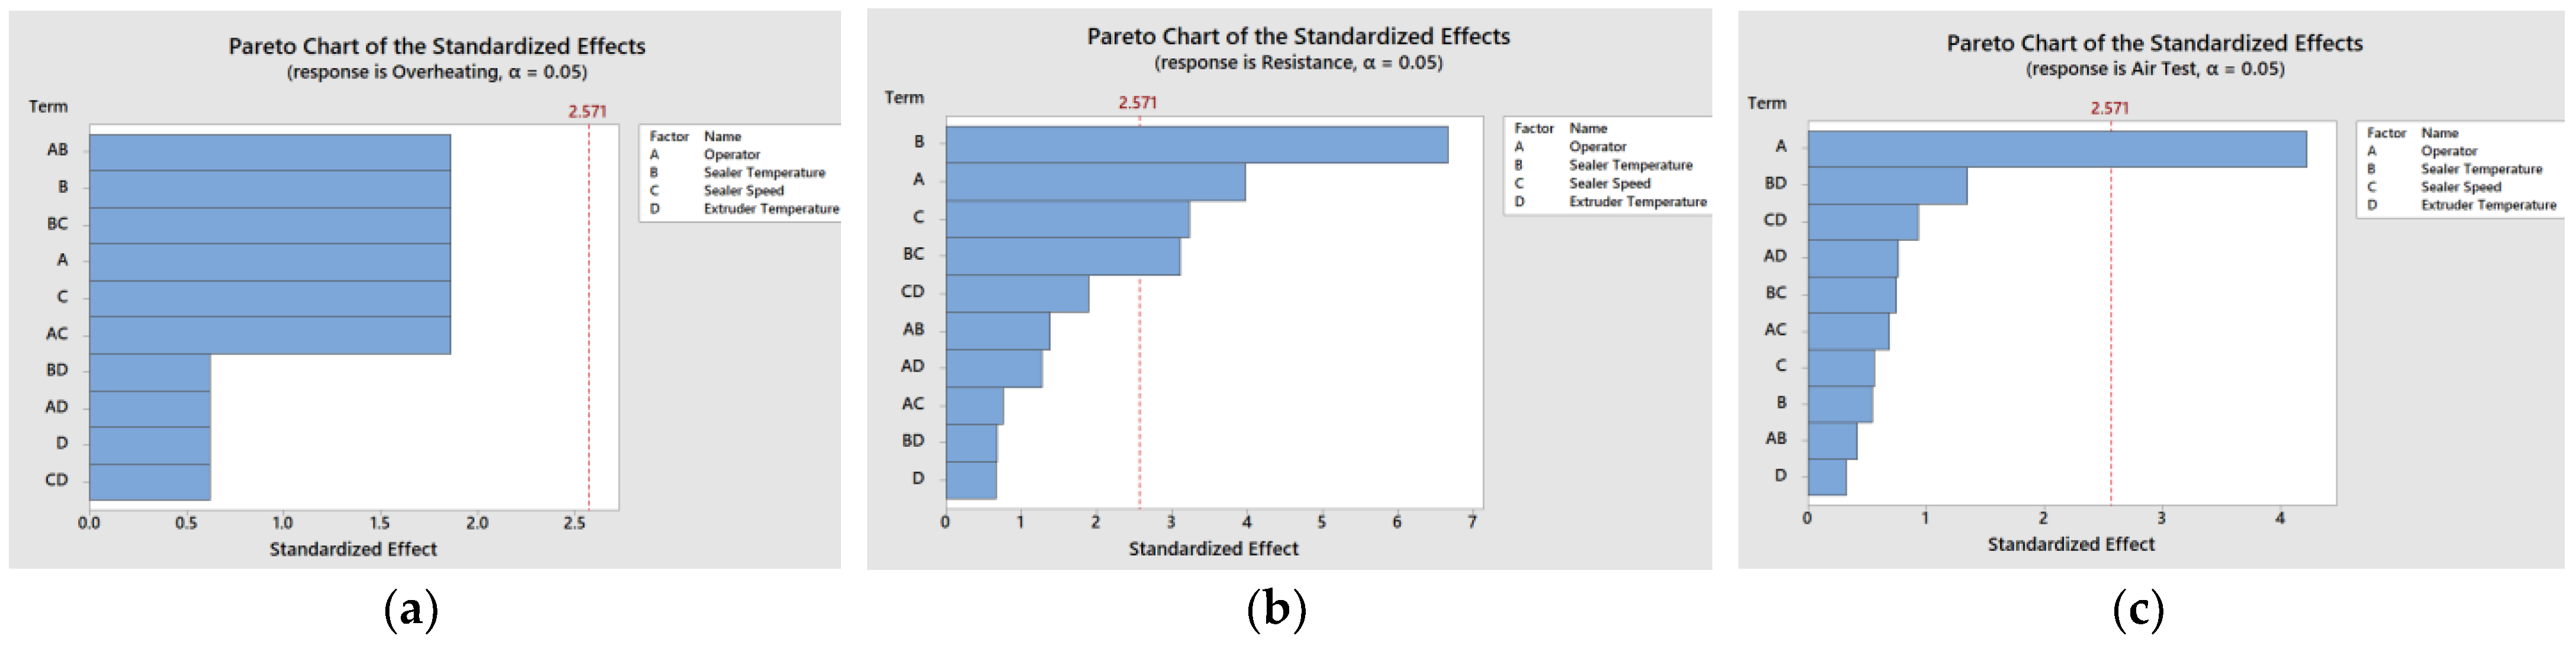
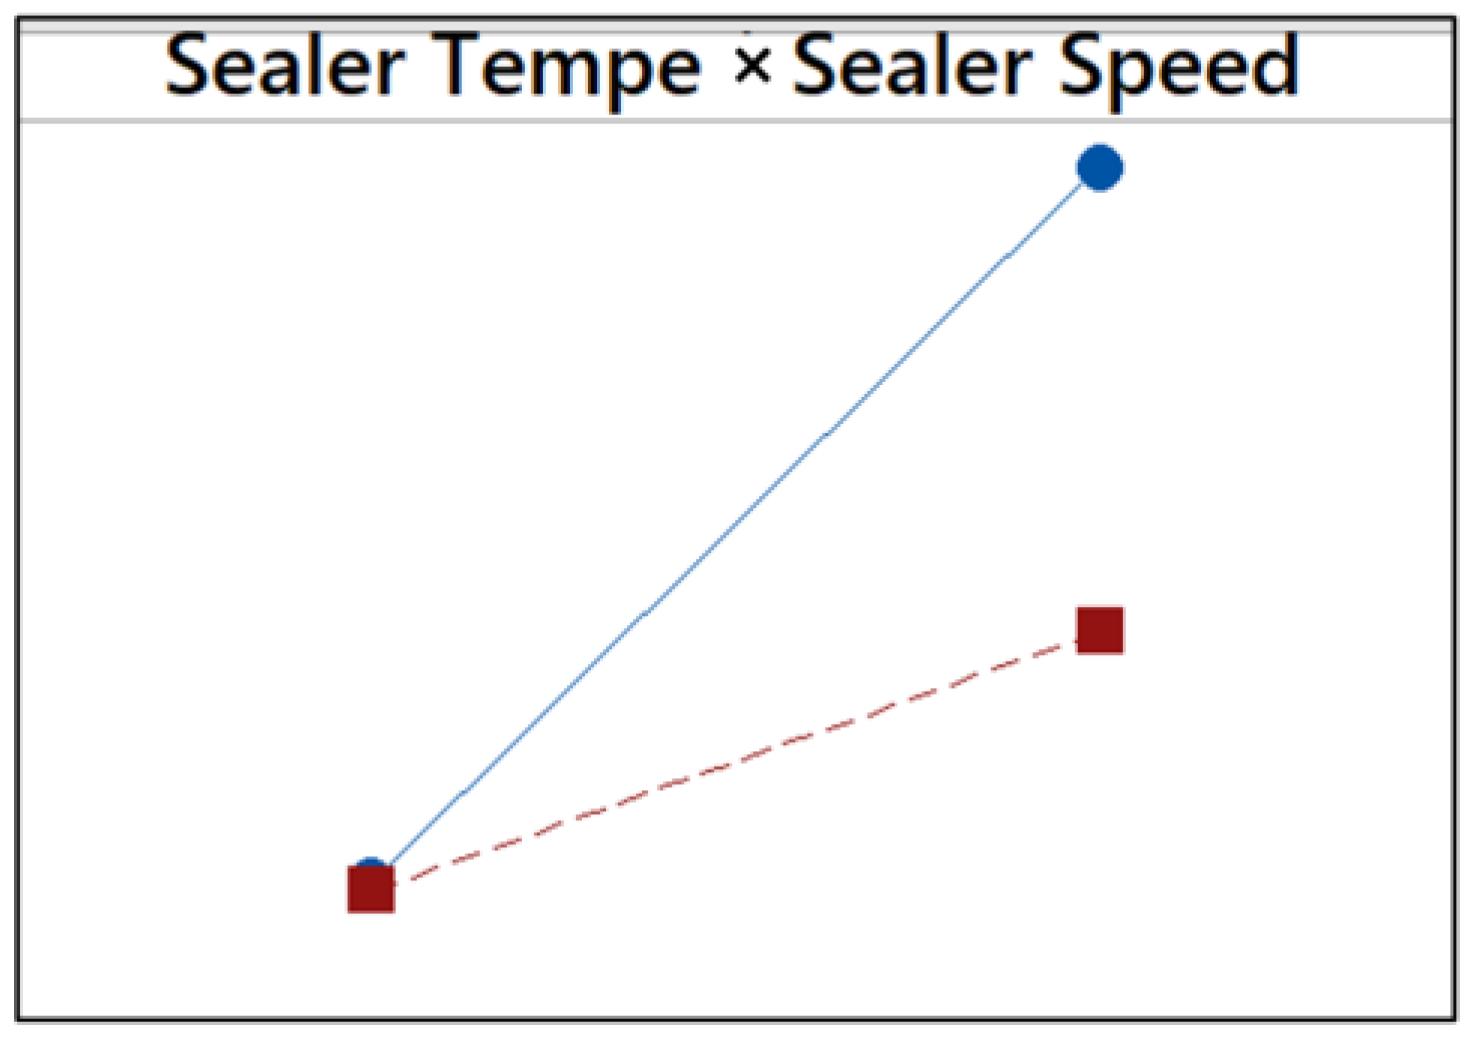
Figure 9 depicts the Pareto chart illustrating the results of the DOE conducted at cold temperatures. The analysis reveals that neither factor has a decisive impact on the superheat response. This observation is attributed to the challenging task of overheating the geomembrane in cold climates as the material tends to remain cold. On the other hand, in both the resistance and leakage tests, the operator’s influence on the responses is evident. In the case of resistance, the temperature and speed of the wedge sealer, along with the interaction between these two factors, exhibit a significant influence on this particular response variable. This assumption can also be observed in the interaction graph of Figure 10 where the combination of temperature and speed of the wedge sealer intersect, demonstrating that it influences the response variable.
3.2. Verification of Assumption
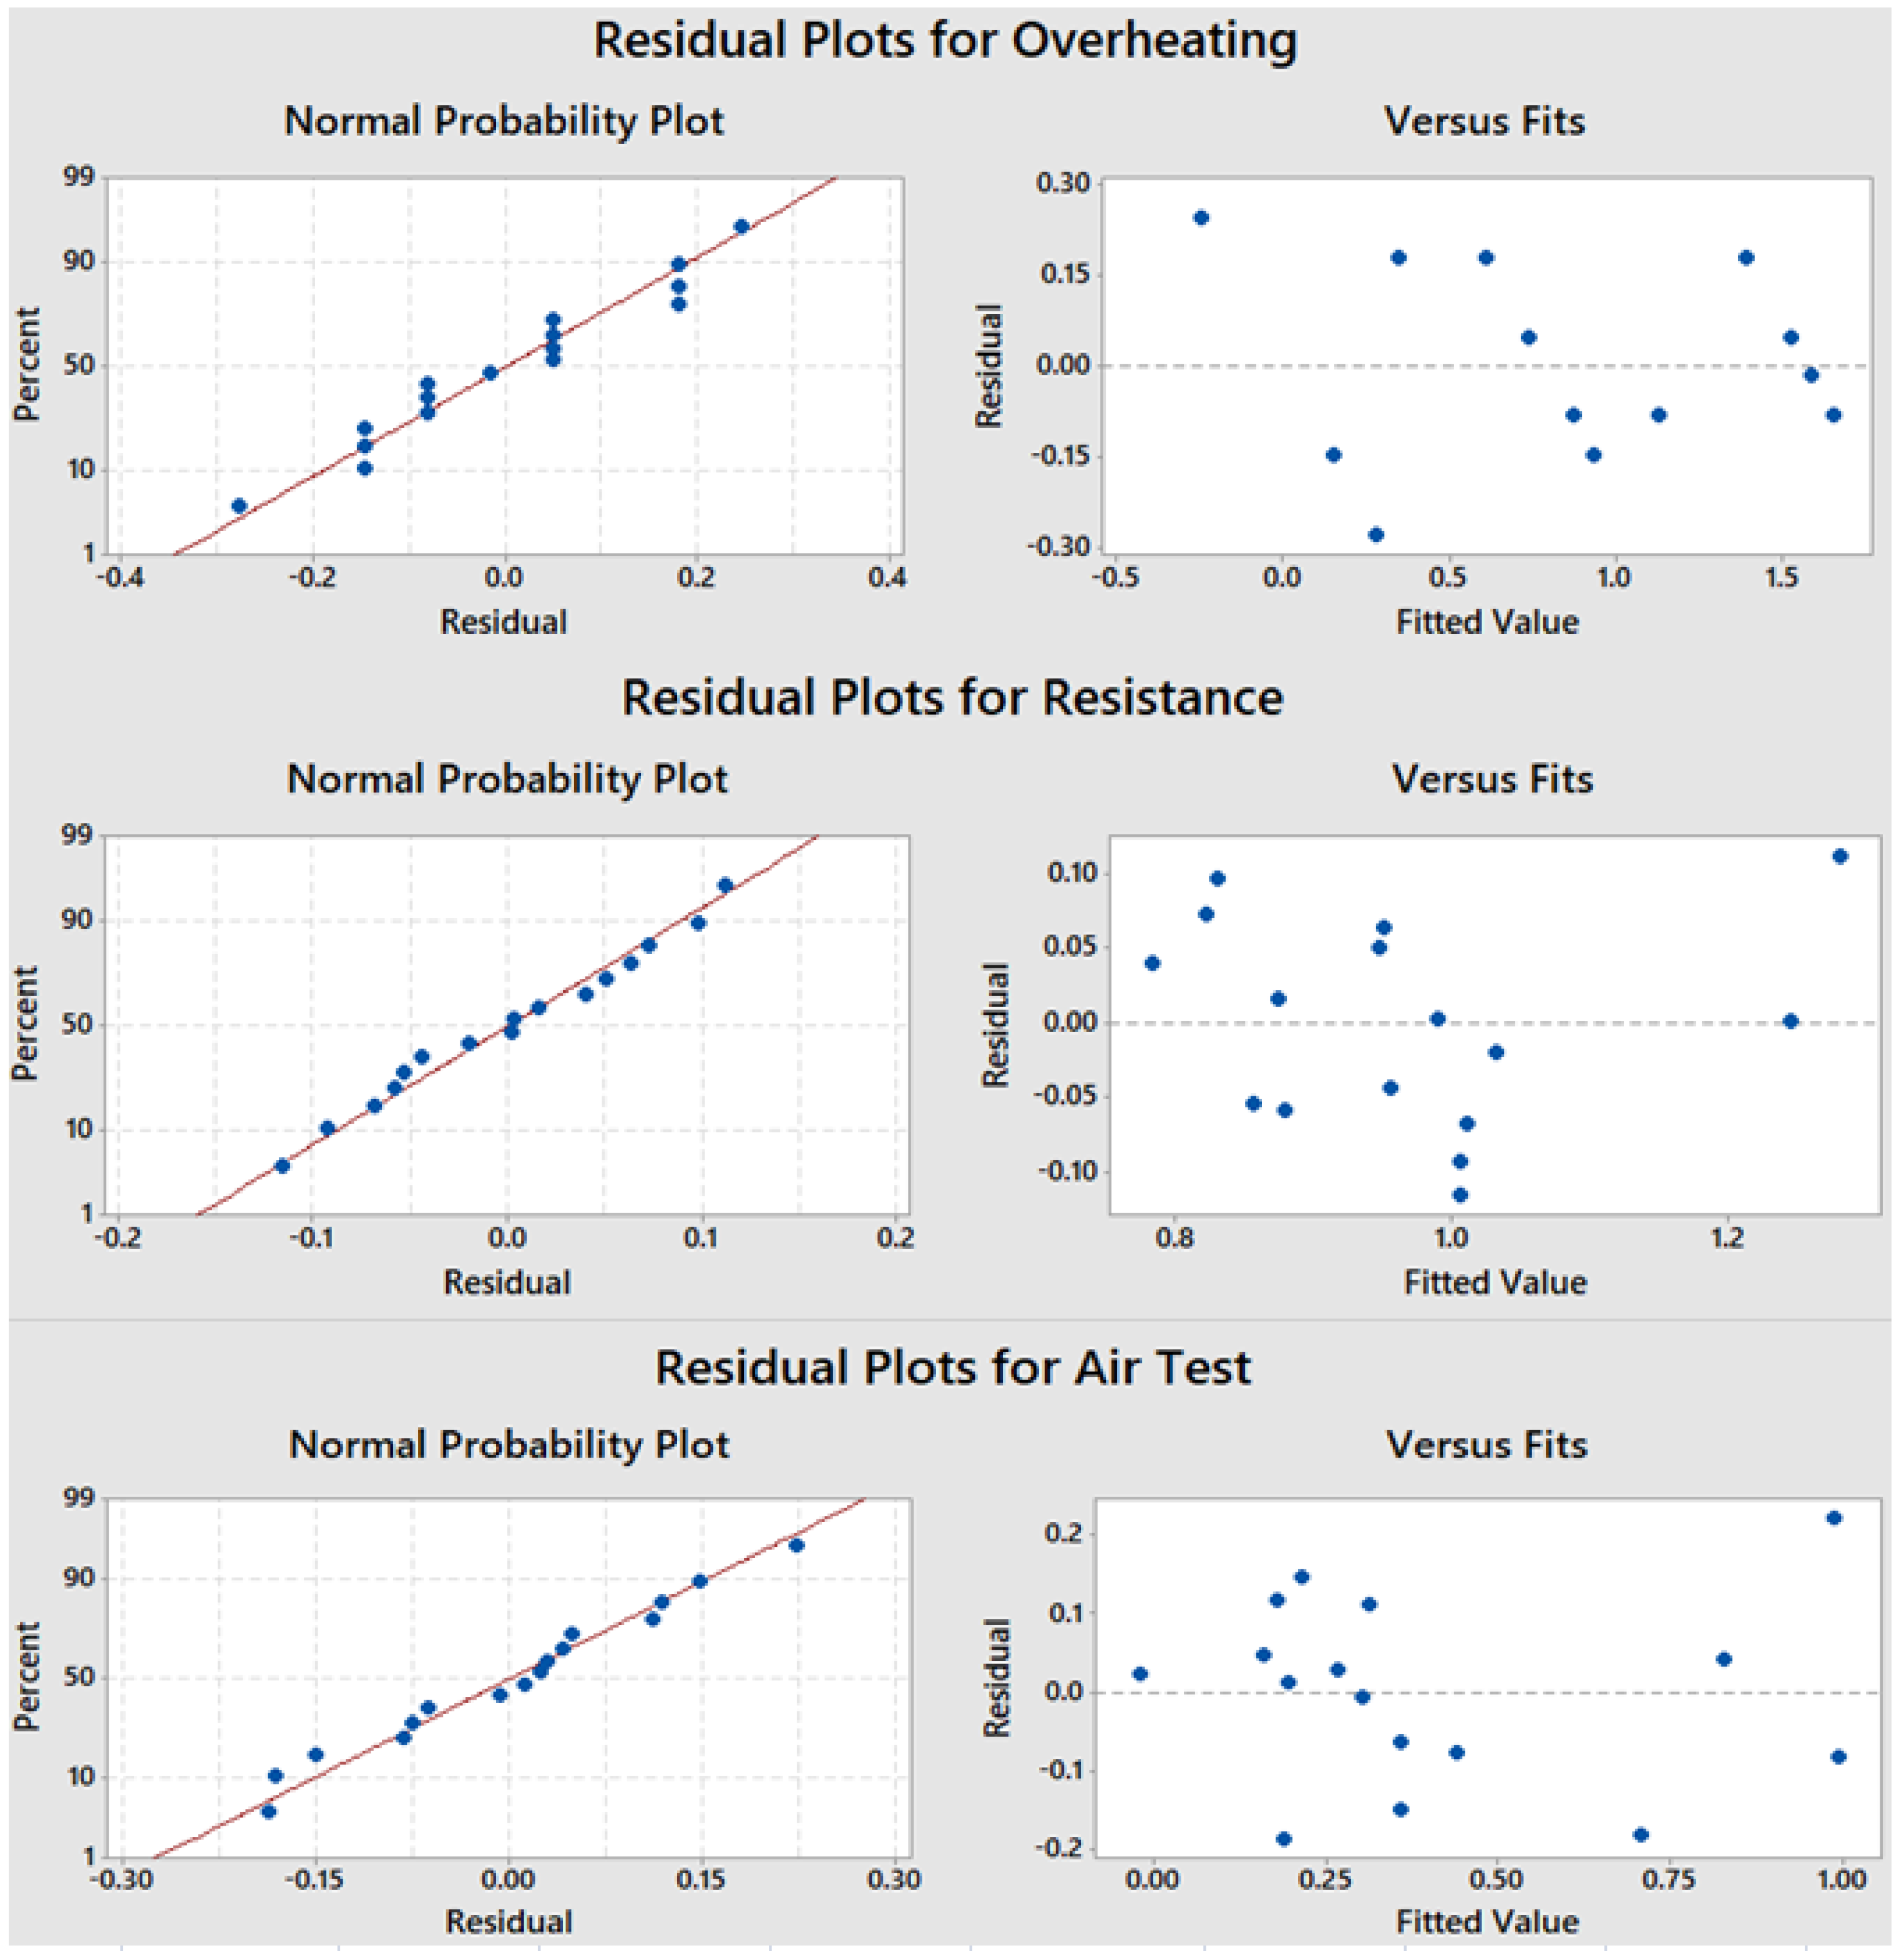
The data were transformed using the arcsine function to normalize the residuals and equalize the variation in each group. Figure 11 shows the normal probability plots of the residuals (deviations from the means of the groups) of the first DOE. Most of the observations form a good straight line for all three responses, which implies a normal distribution. Plots of model group means versus residuals provide no evidence of a pattern suggesting variance heterogeneity. Therefore, the necessary assumptions for the analysis of variance are adequately met.
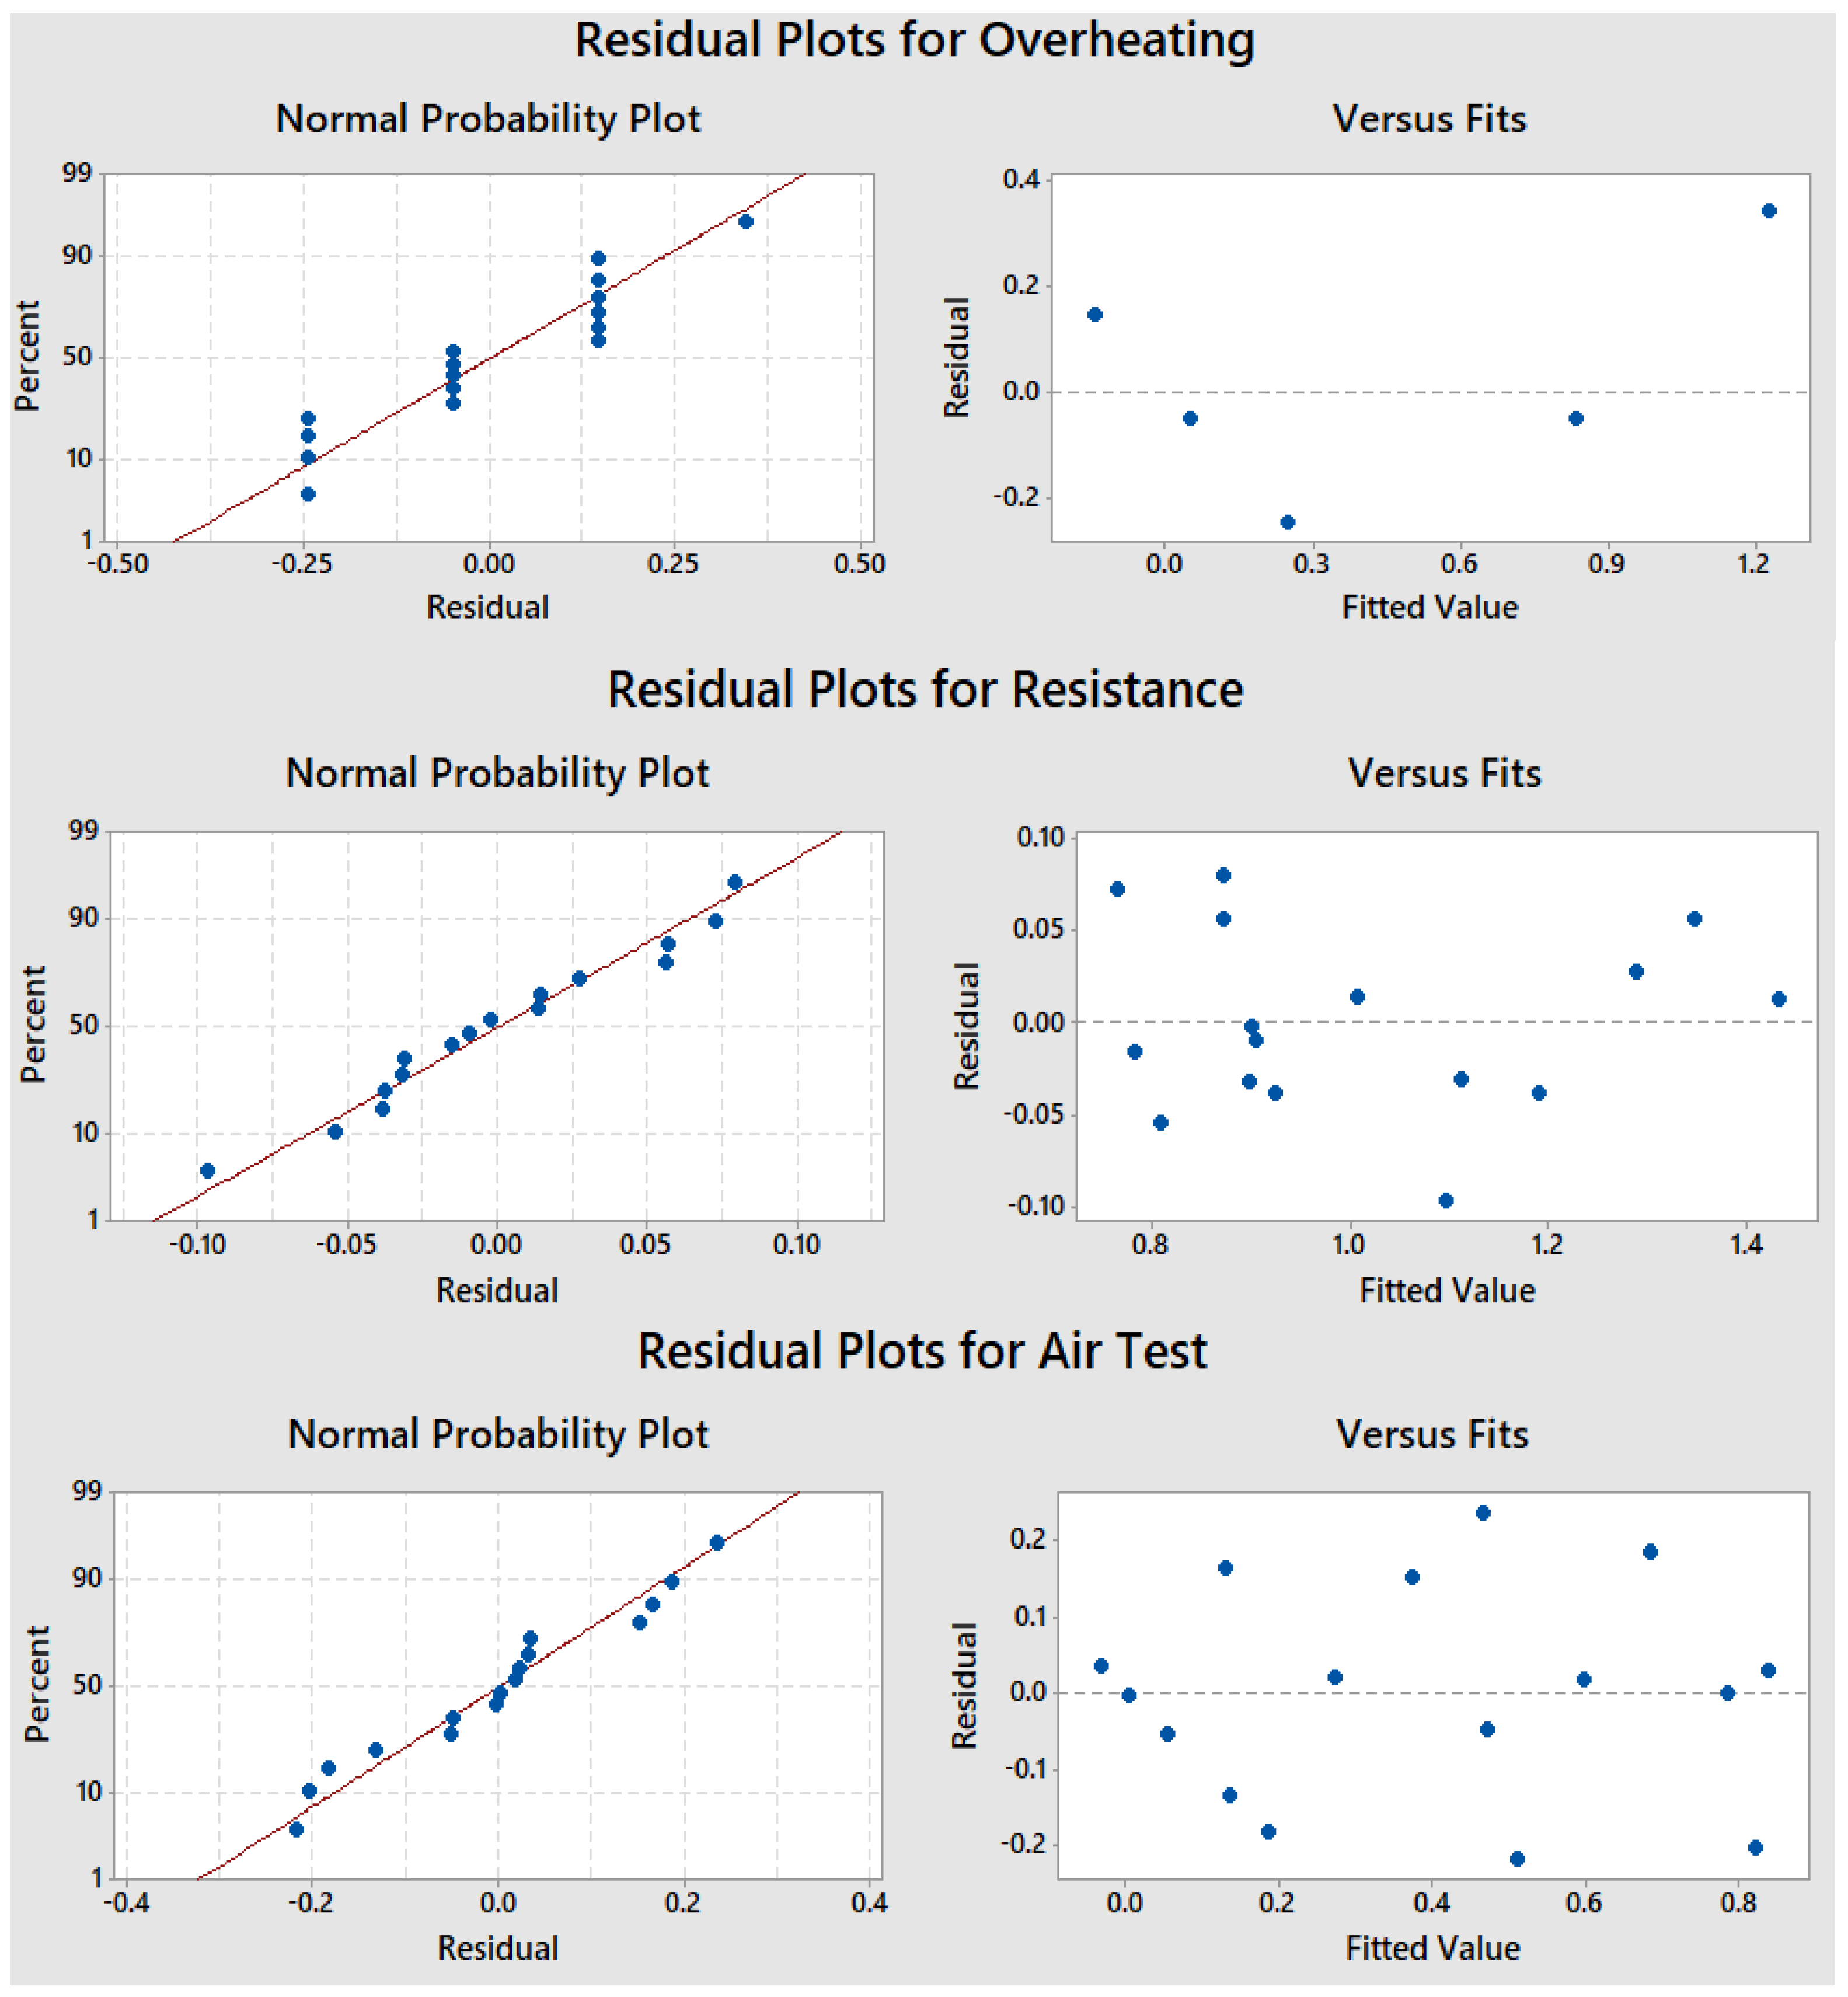
Regarding the second DOE in cold weather conditions, due to the fact that no factor influences overheating, in the graph of residuals and the graph of the means of the model group versus the residuals, there are data that are considered atypical in addition to forming a funnel pattern. Therefore, it does not adequately meet the assumptions for the analysis of variance. However, these assumptions are met for resistance and air tests (observe Figure 12).
3.3. Optimization of Model
The models obtained from the regression analysis for warm temperature are shown in Equations (2)–(4) for resistance, overheating, and gas leakage, respectively.
Overheating = 35.7 + 0.86 O − 0.0646 TS − 0.69 VS − 0.1621 TE + 0.00109 O × TS − 0.327
O × VS − 0.00218 O × TE − 0.00327 TS × VS + 0.000327 TS × TE + 0.00654 VS × TE
O × VS − 0.00218 O × TE − 0.00327 TS × VS + 0.000327 TS × TE + 0.00654 VS × TE
Resistance = 9.26 − 2.02 O − 0.0209 TS − 1.36 VS − 0.0118 T E + 0.00300 O × TS+ 0.265
O × VS + 0.00040 O × TE + 0.00351 TS × VS + 0.000034 TS × TE − 0.00074 VS × TE
O × VS + 0.00040 O × TE + 0.00351 TS × VS + 0.000034 TS × TE − 0.00074 VS × TE
Gas leak test = 23.3 − 4.13 O − 0.0601 TS + 0.77 VS − 0.0624 TE + 0.01180 O × TS −
0.076 O × VS − 0.00320 O × TE + 0.00060 TS × VS + 0.000172 TS × TE − 0.00388 VS × TE
0.076 O × VS − 0.00320 O × TE + 0.00060 TS × VS + 0.000172 TS × TE − 0.00388 VS × TE
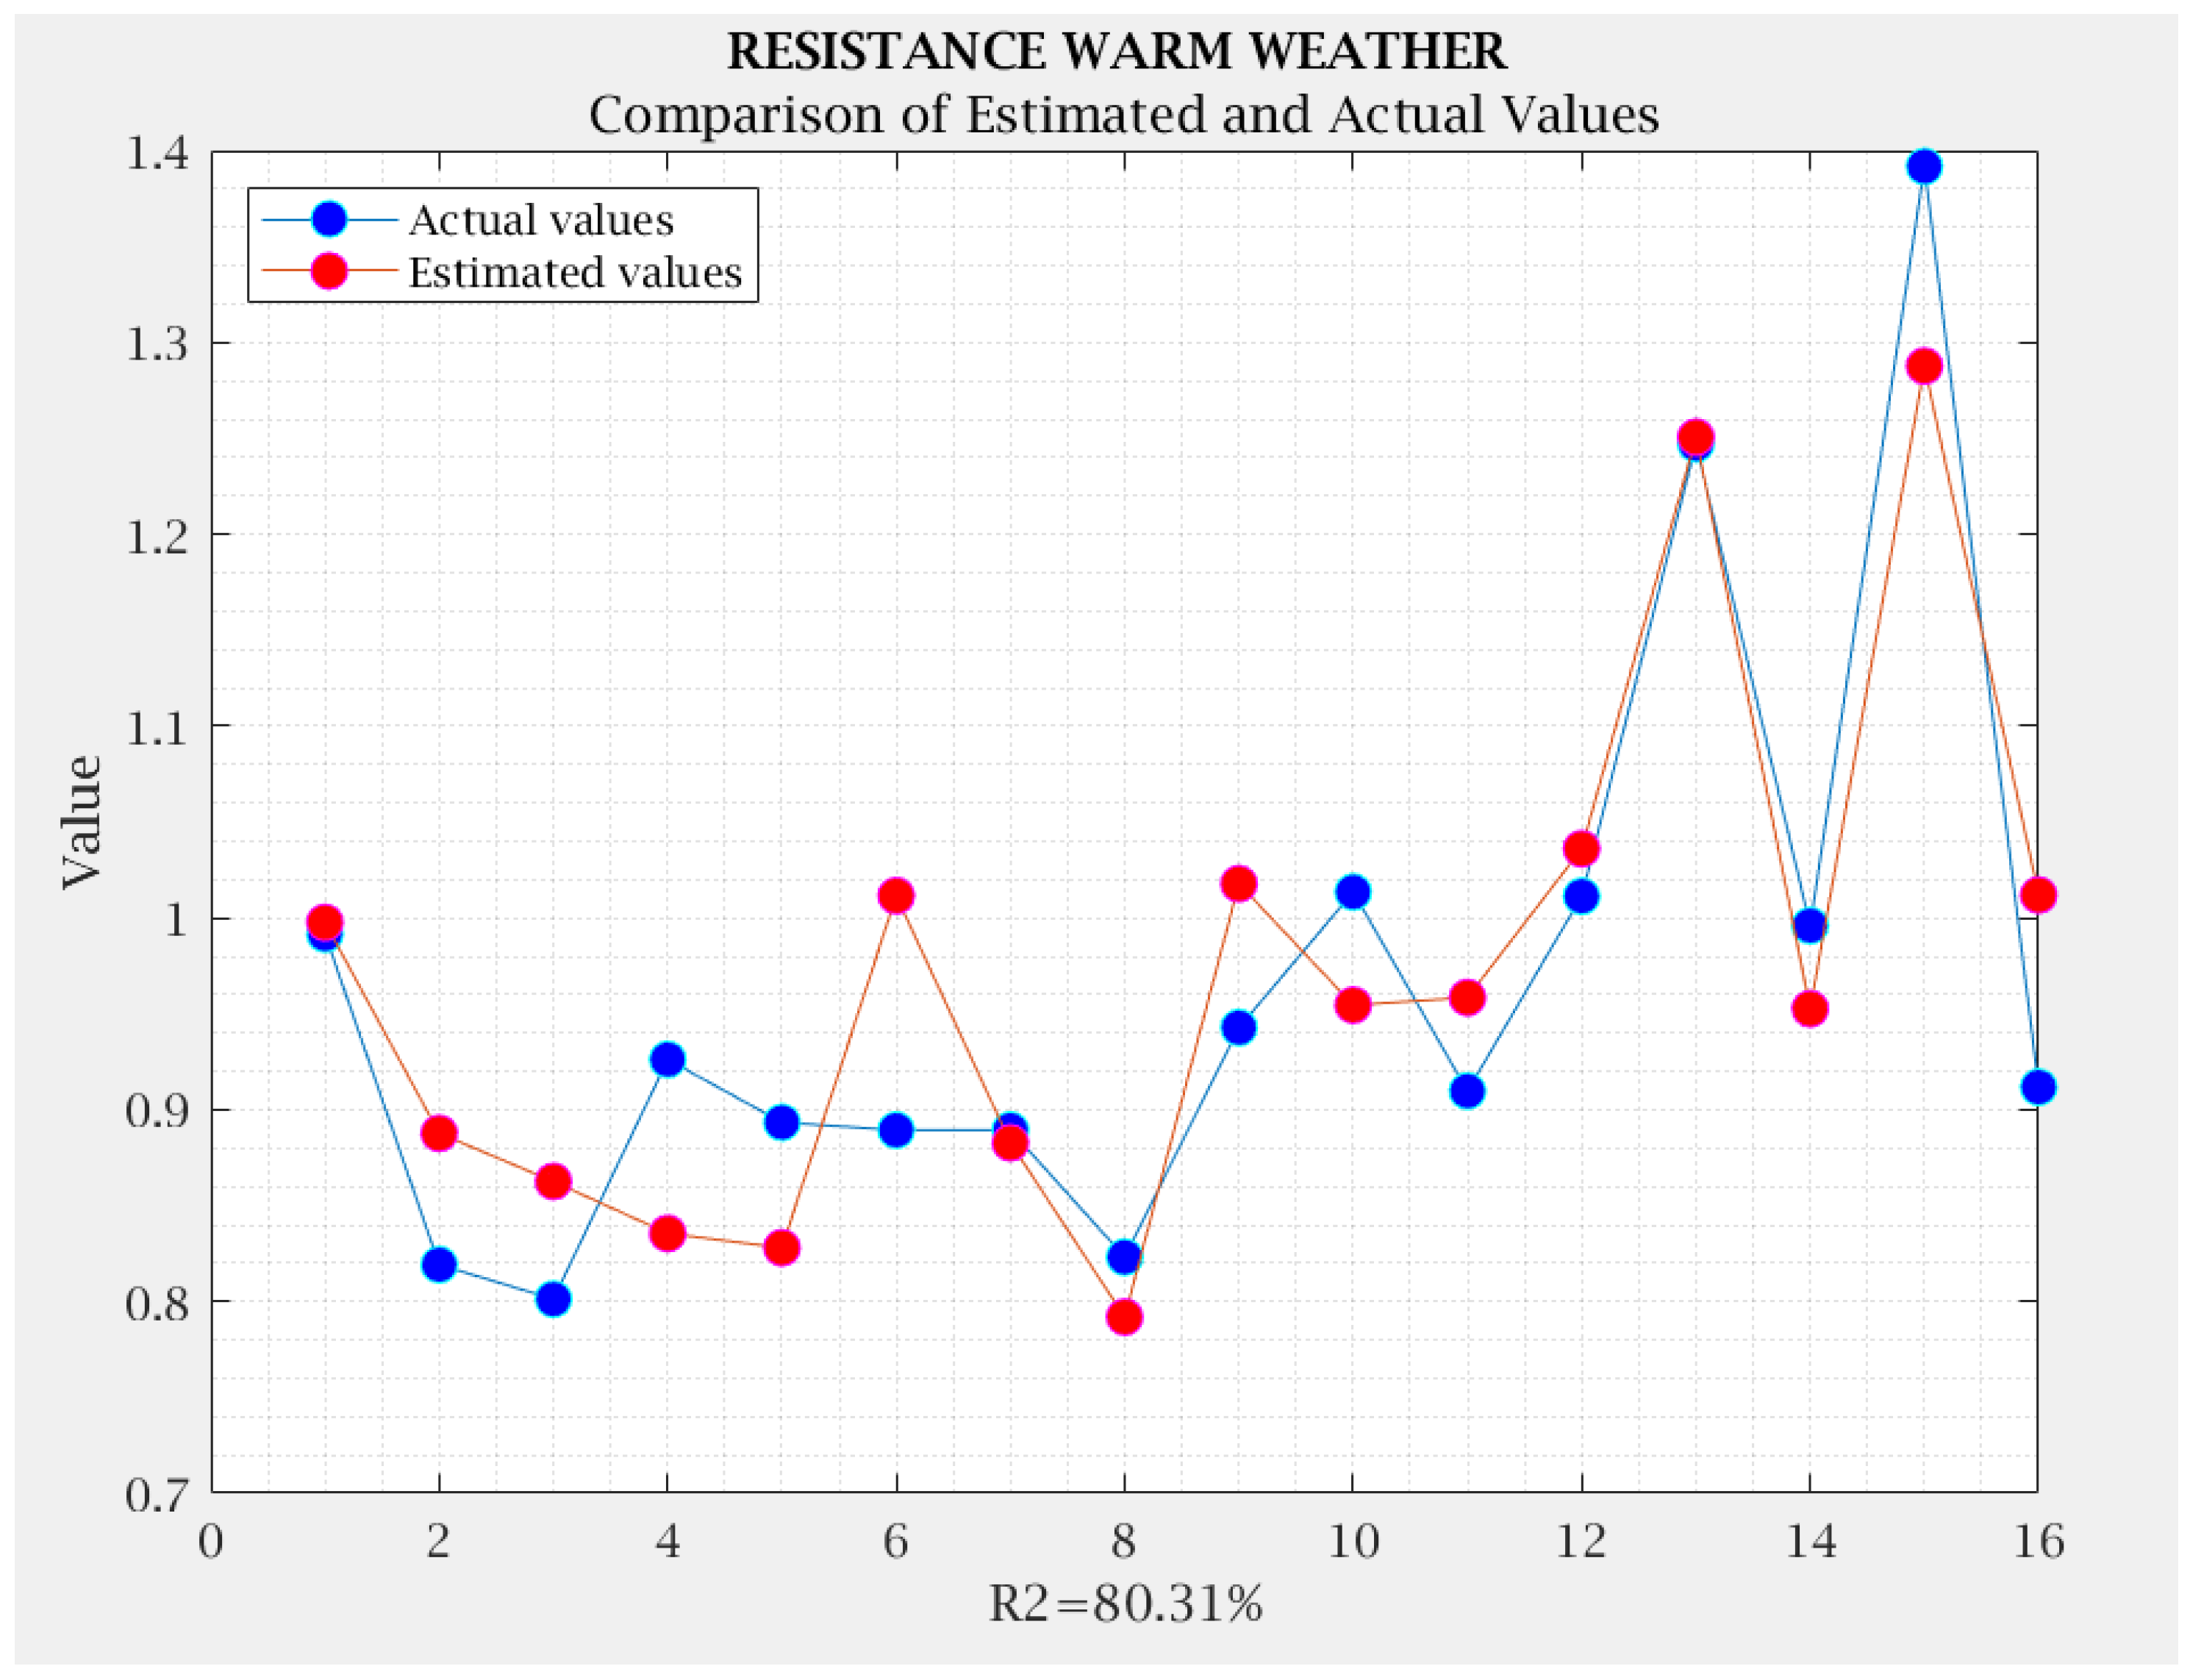
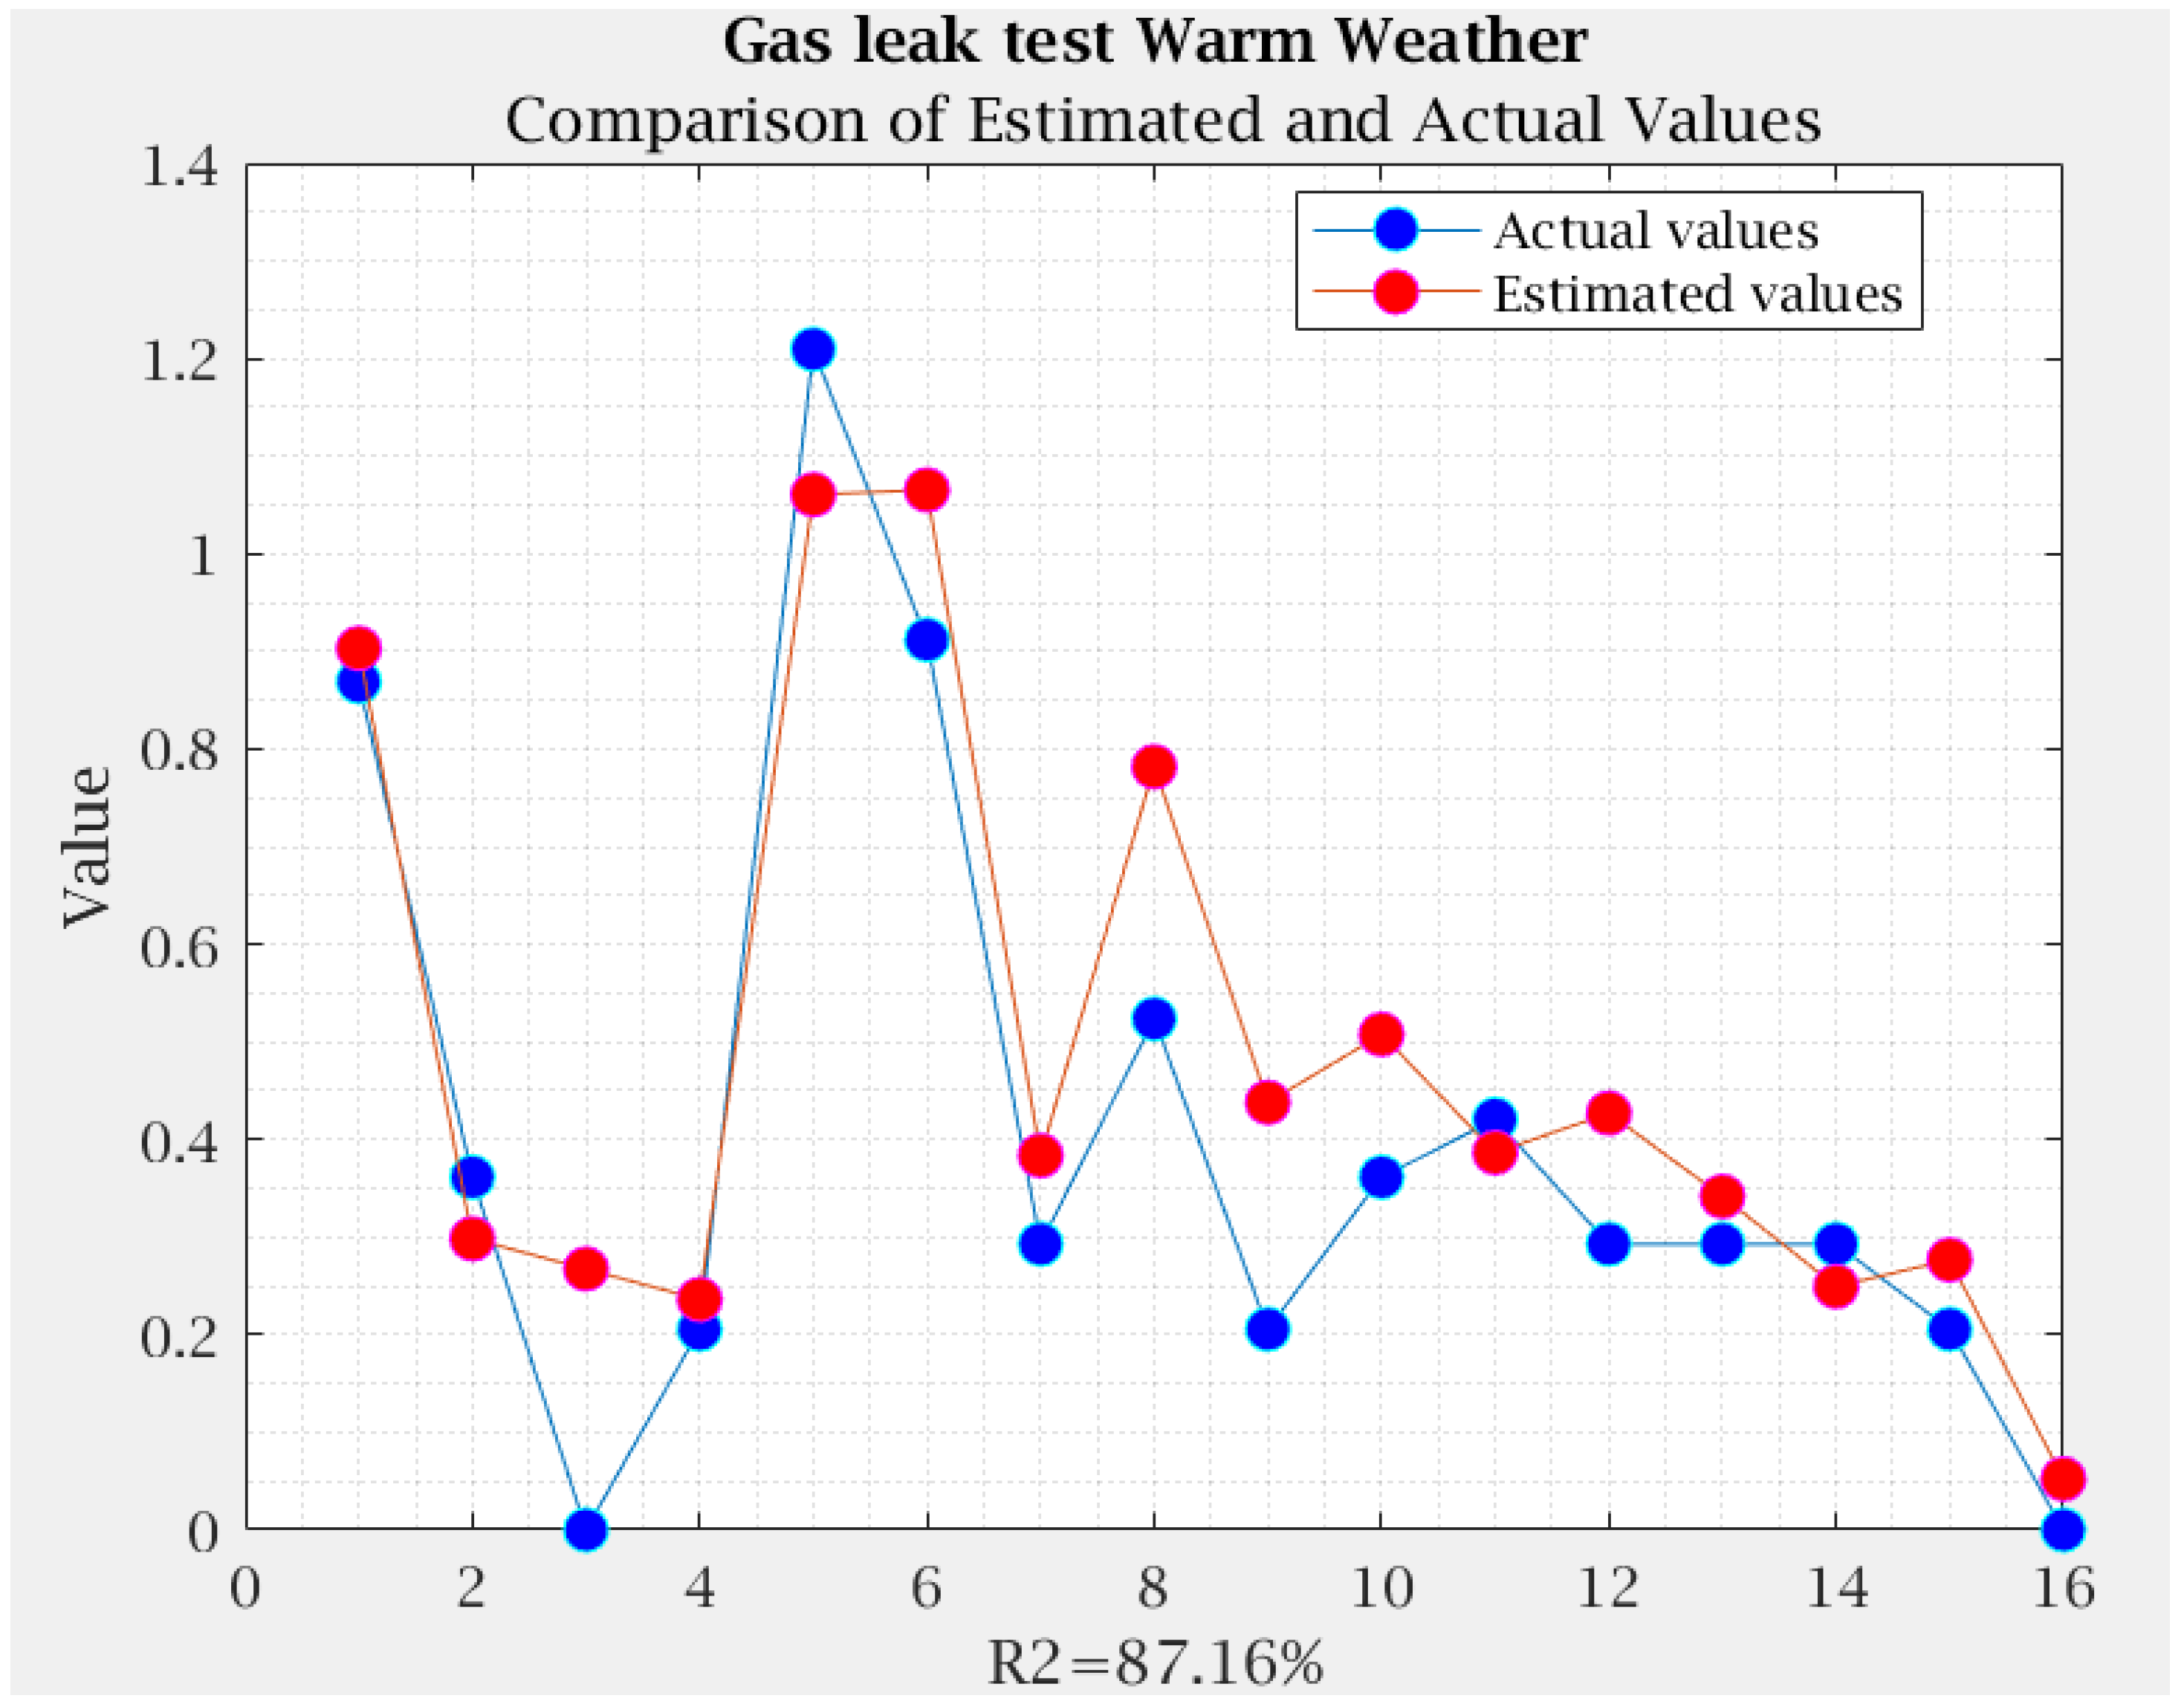
The coefficient of determination (R2) represents the proper measure of the goodness of fit in the regression line determined by the model. In these cases, the R2 values were 94.16% for overheating, 80.31% for resistance, and 87.16% for gas leak test.
Regarding the results for the cold climate, the models obtained from the analysis are shown in Equations (5)–(7).
Overheating = −20.0 + 0.20 O + 0.0702 TS + 1.73 VS + 0.0190 TE − 0.00982 O ×
TS + 0.589 O × VS + 0.0065 O × TE
− 0.00982 TS × VS− 0.000109 T S × TE + 0.0065 VS × TE
TS + 0.589 O × VS + 0.0065 O × TE
− 0.00982 TS × VS− 0.000109 T S × TE + 0.0065 VS × TE
Resistance = −7.57 + 0.13 O + 0.0087 TS + 3.187 VS + 0.0060 TE + 0.00199
O × TS + 0.0658 O × VS − 0.00363 O × TE − 0.00445 TS × VS + 0.000032 TS × TE− 0.00541 VS × TE
O × TS + 0.0658 O × VS − 0.00363 O × TE − 0.00445 TS × VS + 0.000032 TS × TE− 0.00541 VS × TE
Gas leak test = −22.8 + 0.99 O + 0.0382 TS + 0.95 VS + 0.1008 TE + 0.00167 O ×
TS − 0.166 O × VS + 0.00613 O × TE + 0.00302 TS × VS − 0.000180 TS × TE +
0.00752 VS × TE
TS − 0.166 O × VS + 0.00613 O × TE + 0.00302 TS × VS − 0.000180 TS × TE +
0.00752 VS × TE
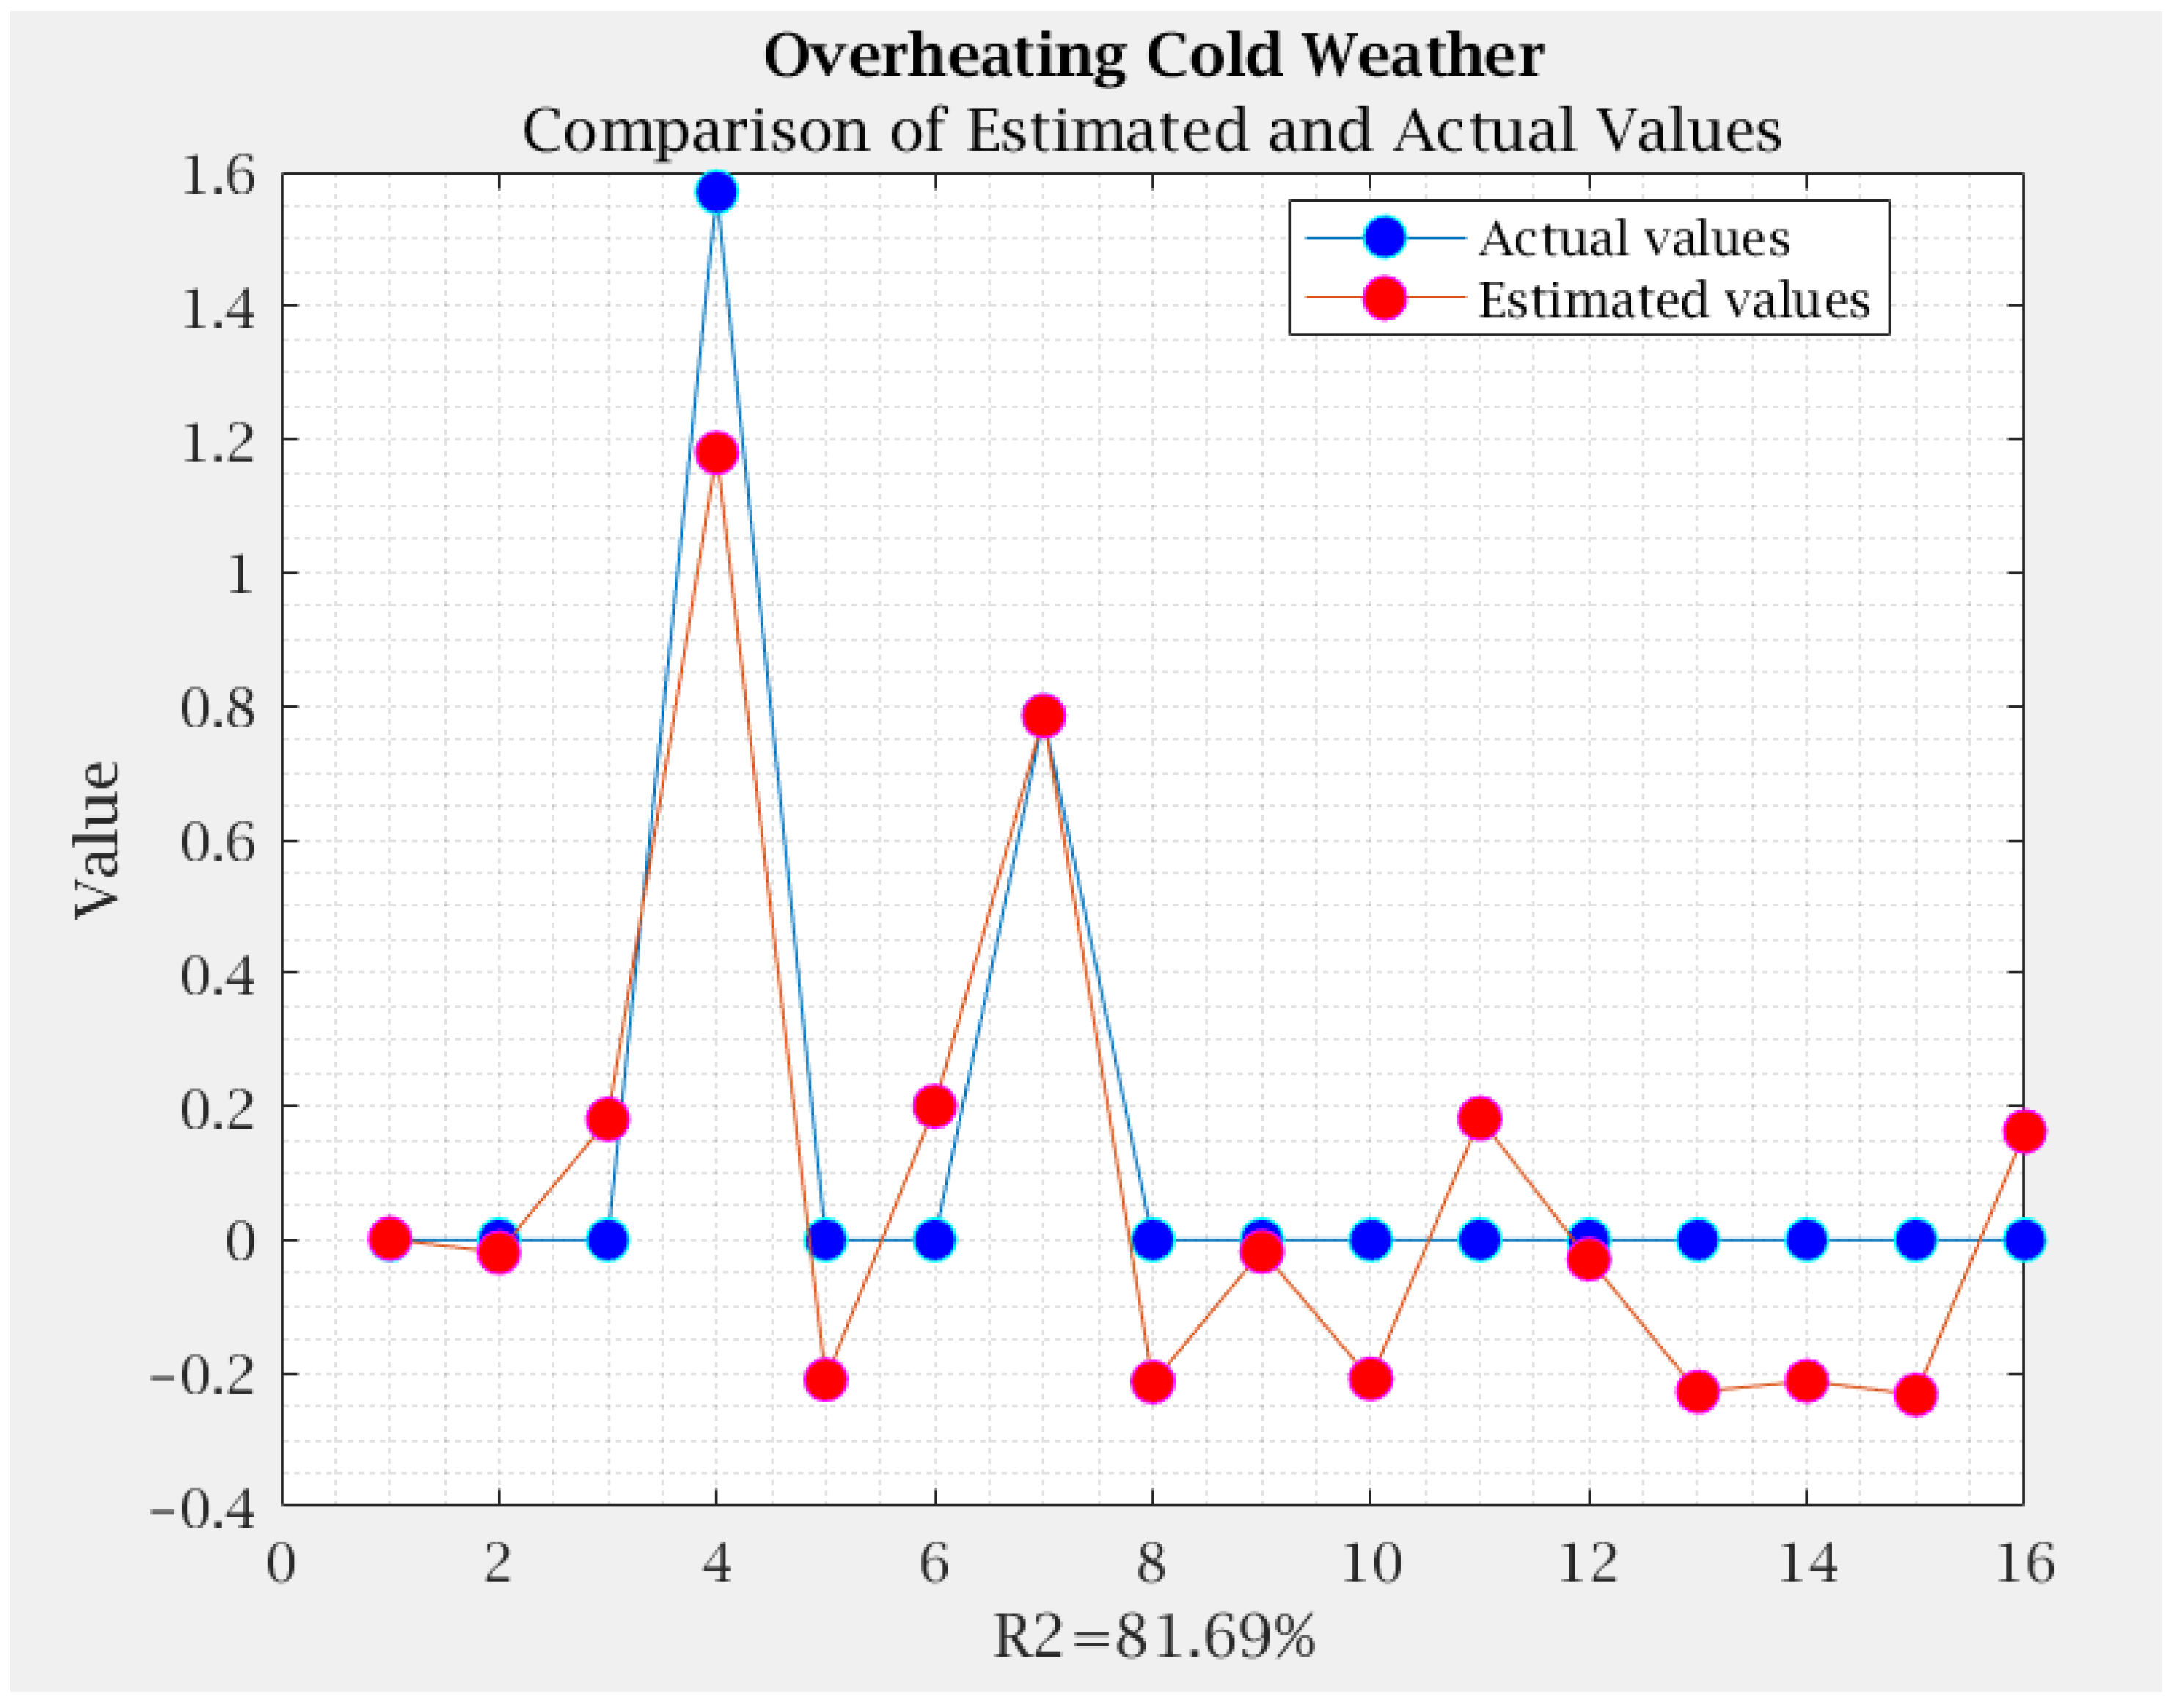
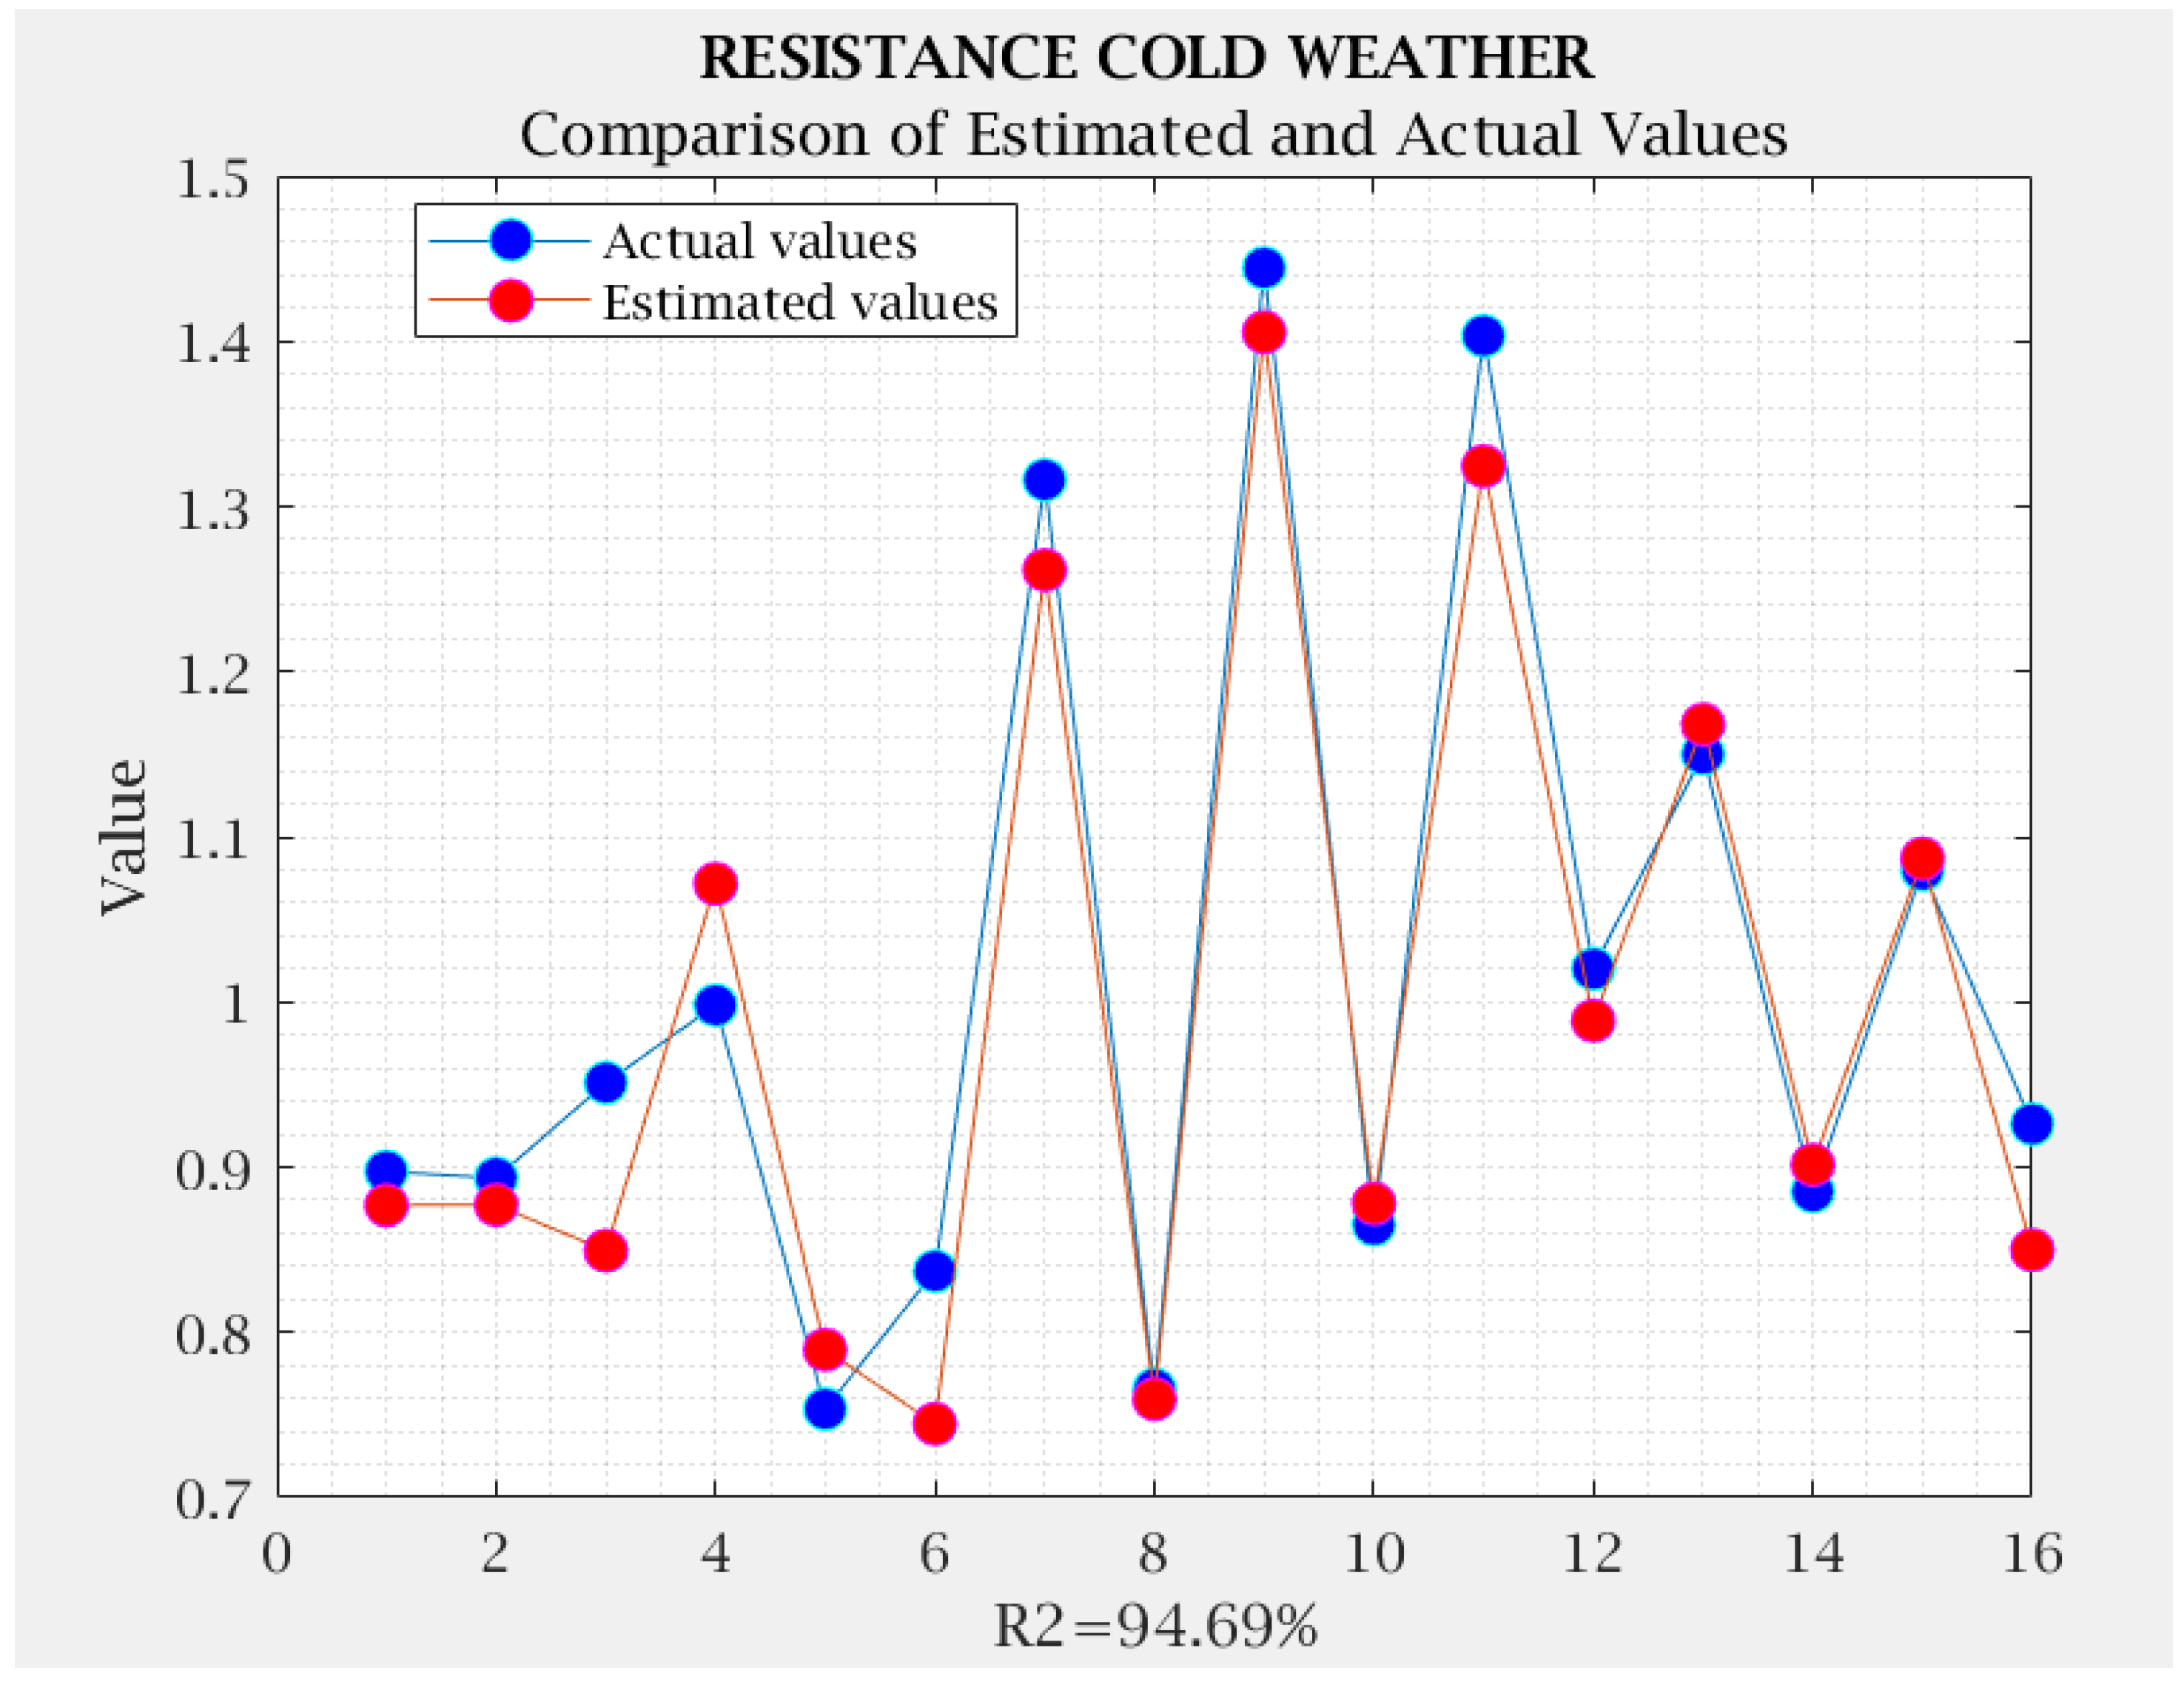
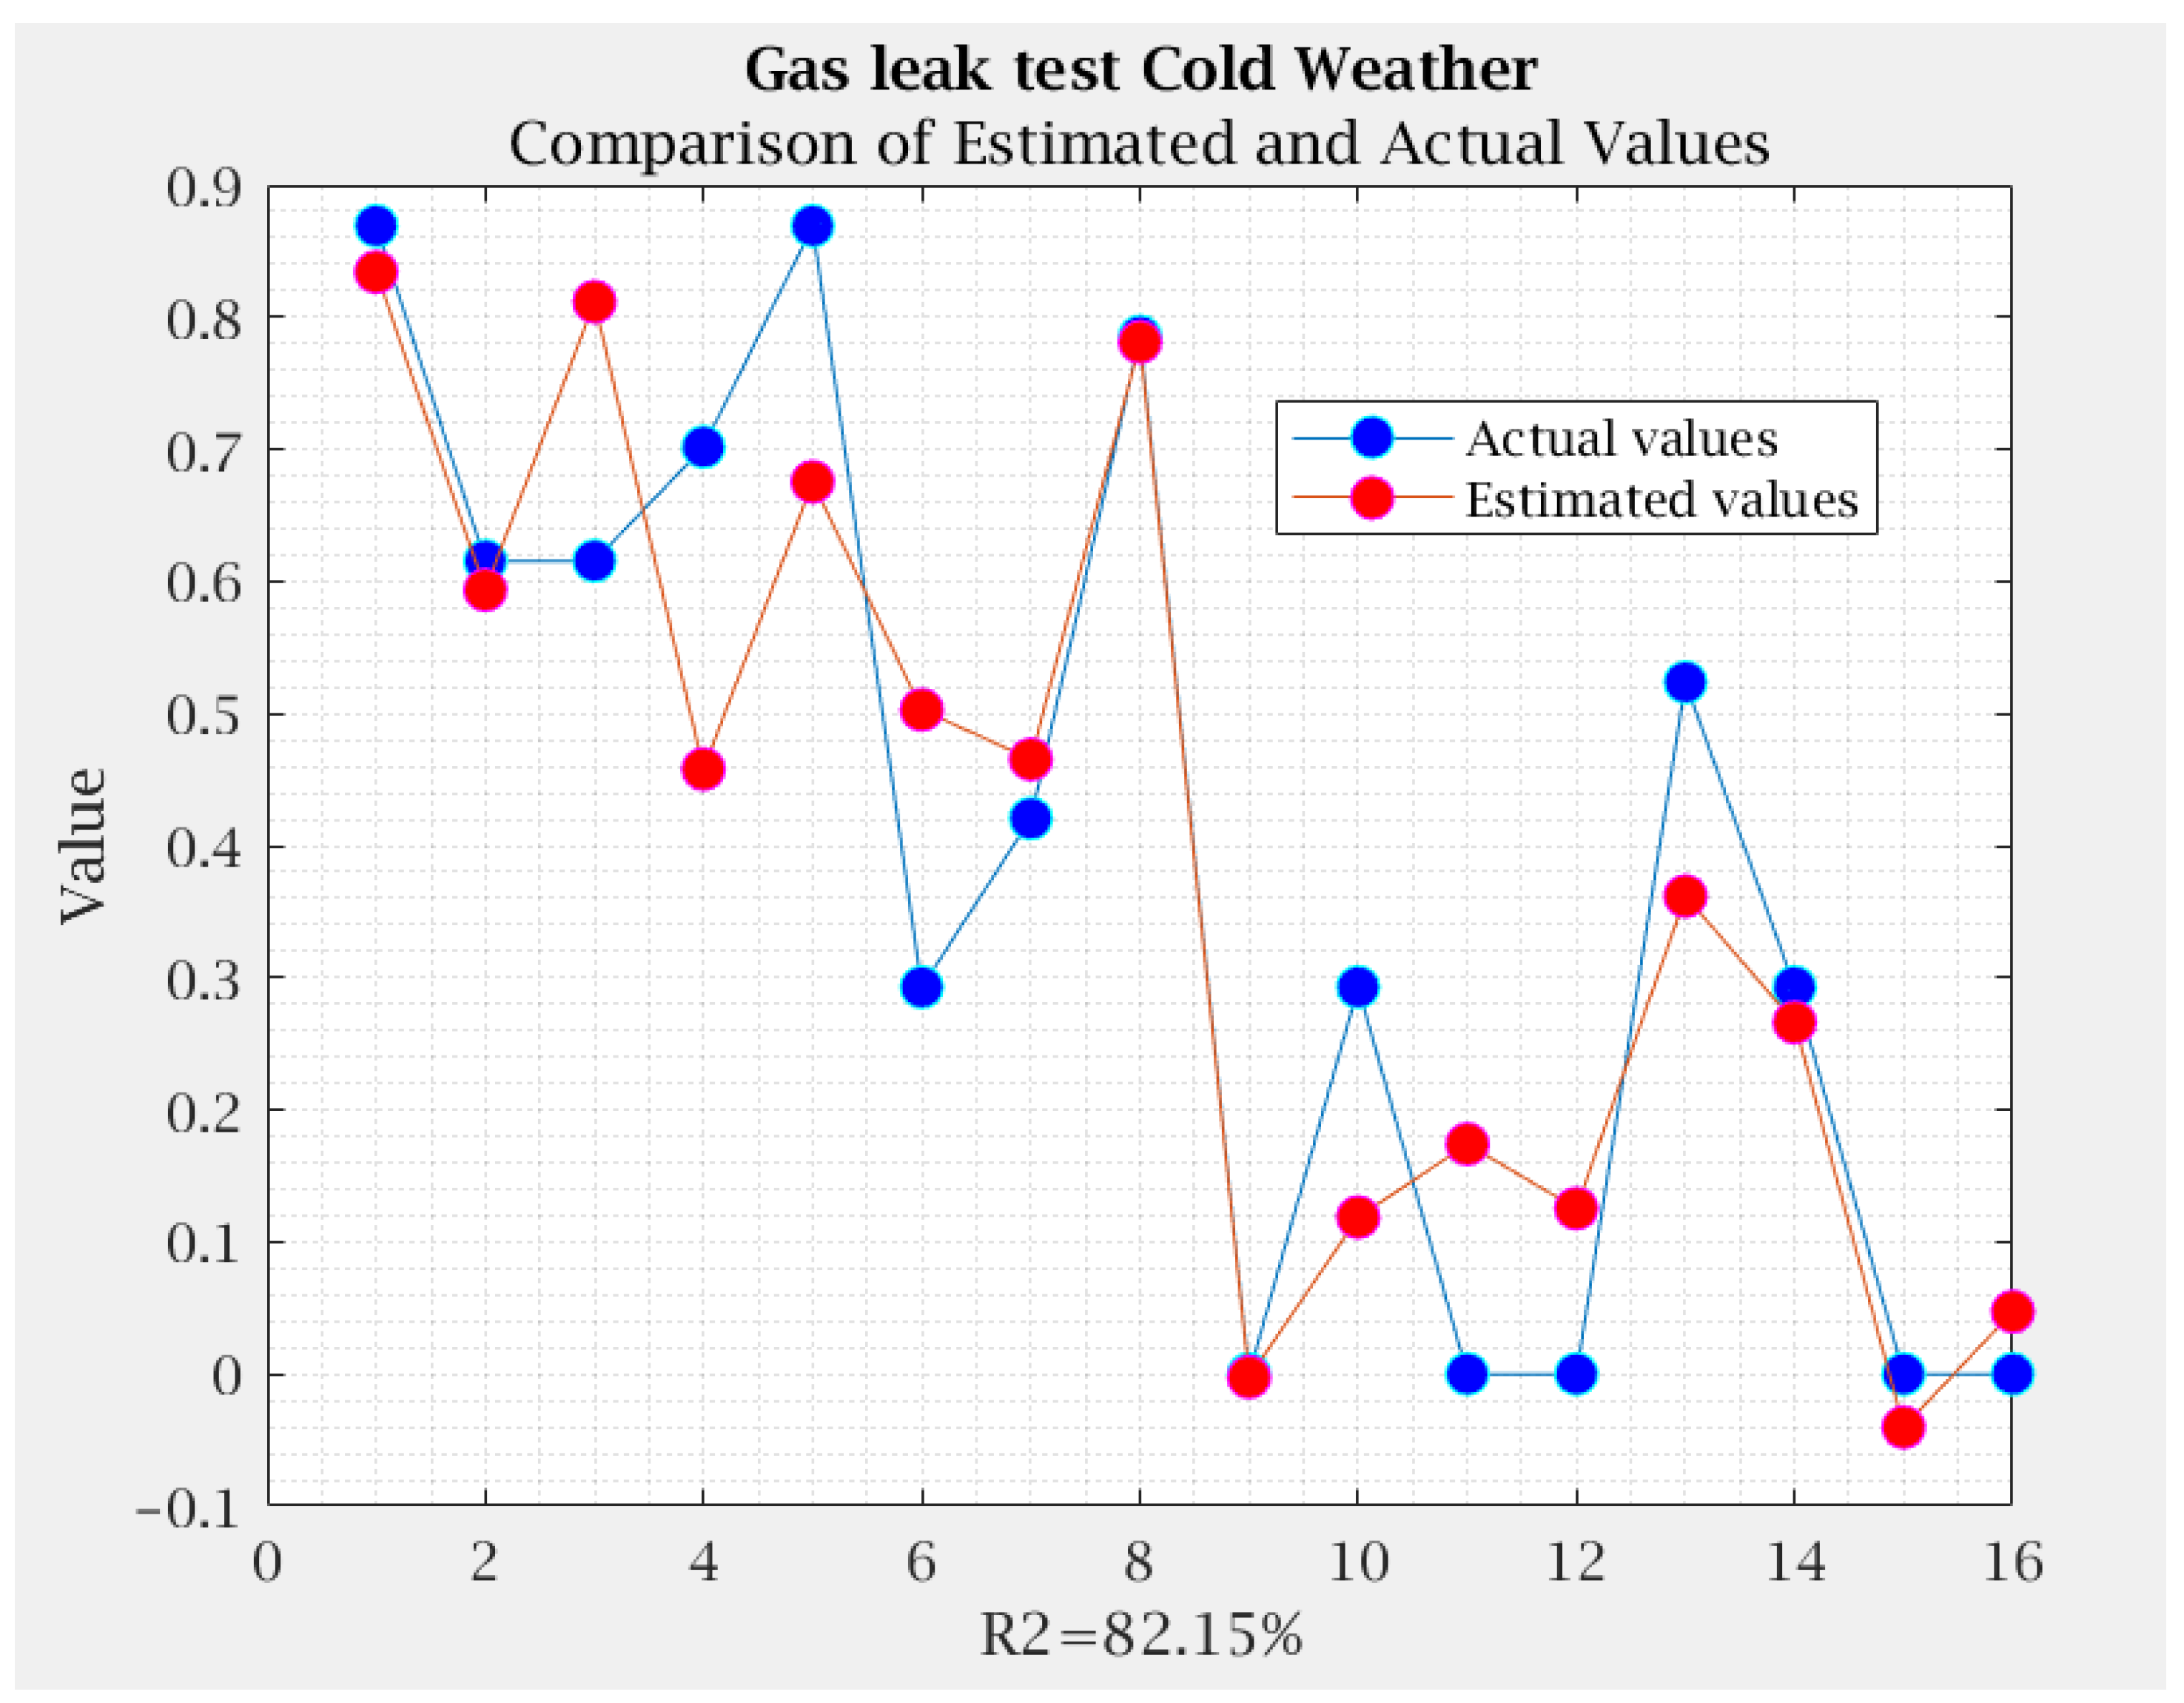
For the cold climate, the R2 for overheating was 81.69%, for resistance,94.69%, and for the gas leak test, 82.15%. Given that the R2 values are relatively high (generally above 80%), this suggests that the regression models reasonably fit the observed data for both warm and cold climates. Overall, these results indicate that the regression models are capable of explaining a substantial portion of the variability in the variables of interest (overheating, resistance, and gas leakage) under different climatic conditions.
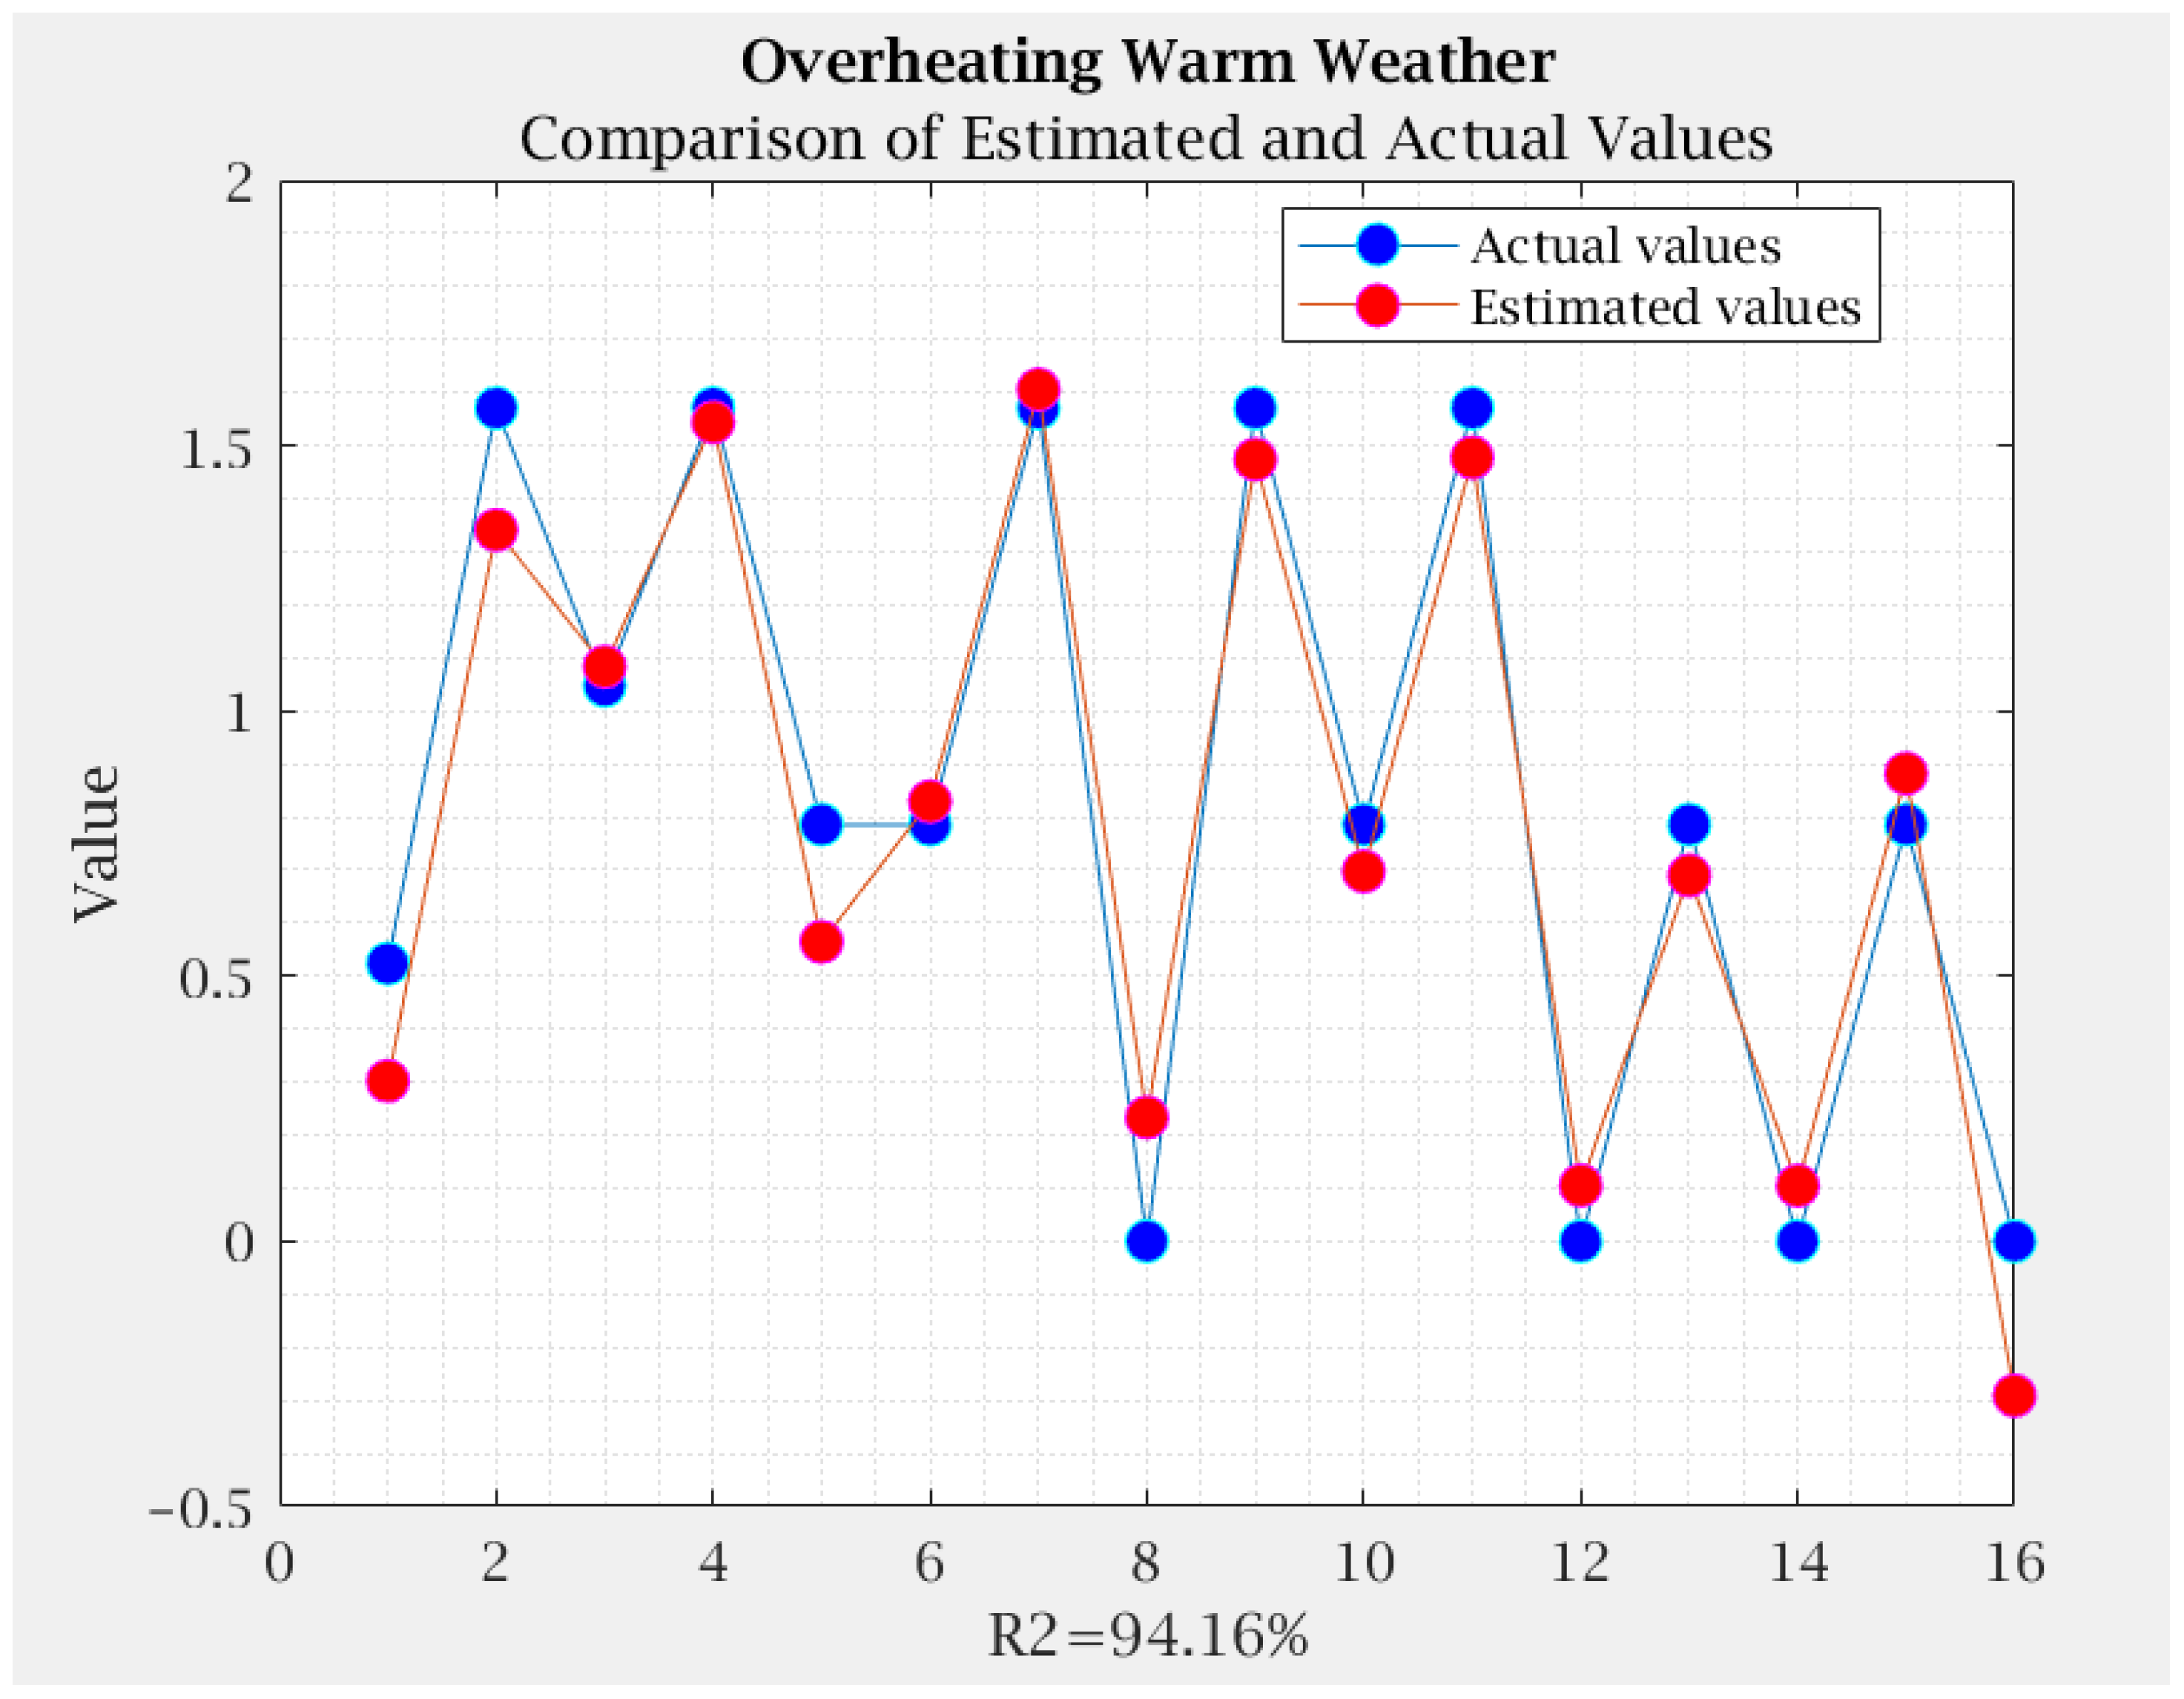
In this study, a detailed analysis of a data set was carried out using regression techniques to estimate theoretical values. Figure 13, Figure 14, Figure 15, Figure 16, Figure 17 and Figure 18 below graphs present a visual comparison between estimated values and actual values. For the elaboration of the graphs, the MATLAB R 2020b® software was used.
Through the comparison of the estimated values and the real values, a general concordance between both data sets is observed. However, certain discrepancies are also identified that may require further evaluation. Figure 13, Figure 14, Figure 15, Figure 16, Figure 17 and Figure 18 highlight the importance of regression as a tool for modeling relationships and making estimates and provide a solid foundation for further exploring the underlying relationships in the data.
The optimal combinations of input variables or factors that maximize or minimize the response variables and that achieve the optimization of these model responses are presented in Table 7 for the temperate climate and in Table 8 for the cold climate.
An analysis of the first DOE reveals that to minimize the issue of overheating, it is suggested to keep the sealer level low. However, it has been observed in the resistance and air tests that maintaining a higher sealer level is beneficial for maximizing resistance and minimizing air leaks. Therefore, it is concluded that in order to achieve these desired outcomes, it is crucial for the operator to undergo training and utilize the sealer at a temperature of 450 °C with a speed of 3.6 m/min. Additionally, the extruder temperature should be maintained at 290 °C. These recommendations are specifically applicable to temperate climates.
In the case of the DOE conducted for cold climates, the optimal approach to maximize resistance and minimize overheating and air leaks also involves operator training and utilizing the sealer at a temperature of 450 °C with a speed of either 2.6 or 3.6 m/min. Additionally, the extruder temperature should be maintained at 290 °C. These adjustments ensure optimal results in cold climate conditions.
3.4. Comparative Analysis with Neural Networks
In this study, in addition to the comparison between the estimated and real values by means of regression, the efficiency of artificial neural networks (ANN) in the prediction of resistance, overheating, and gas leaks as a function of warm temperatures was explored. Neural networks are machine learning models that can capture complex relationships between variables, making them suitable for addressing forecasting problems with multiple influencing factors [38].
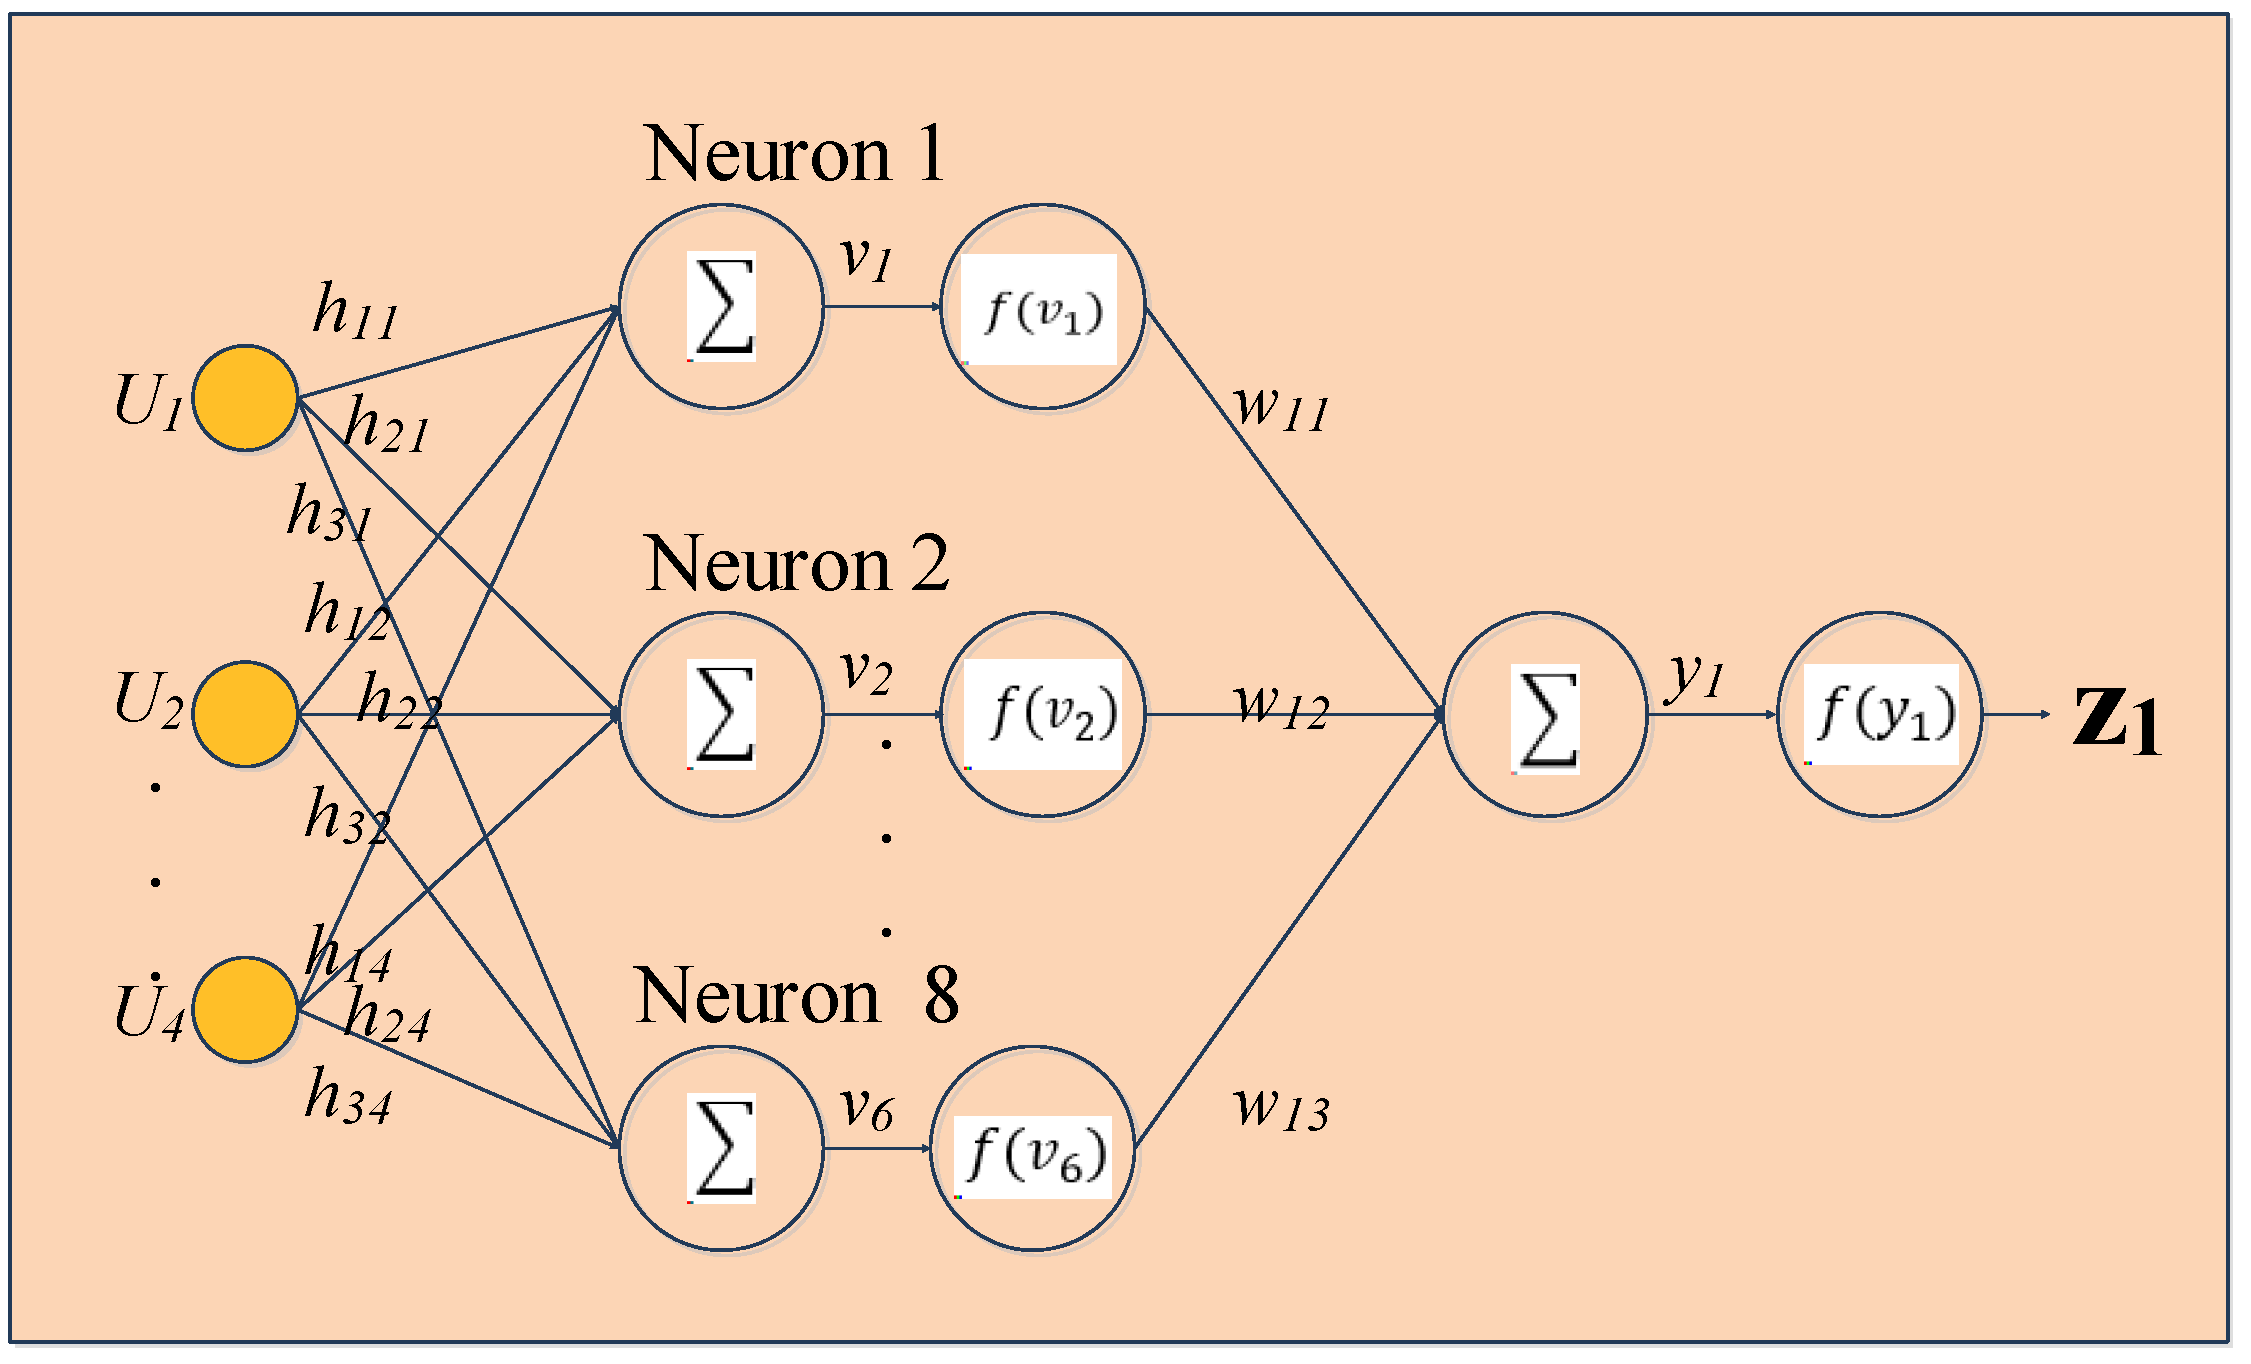
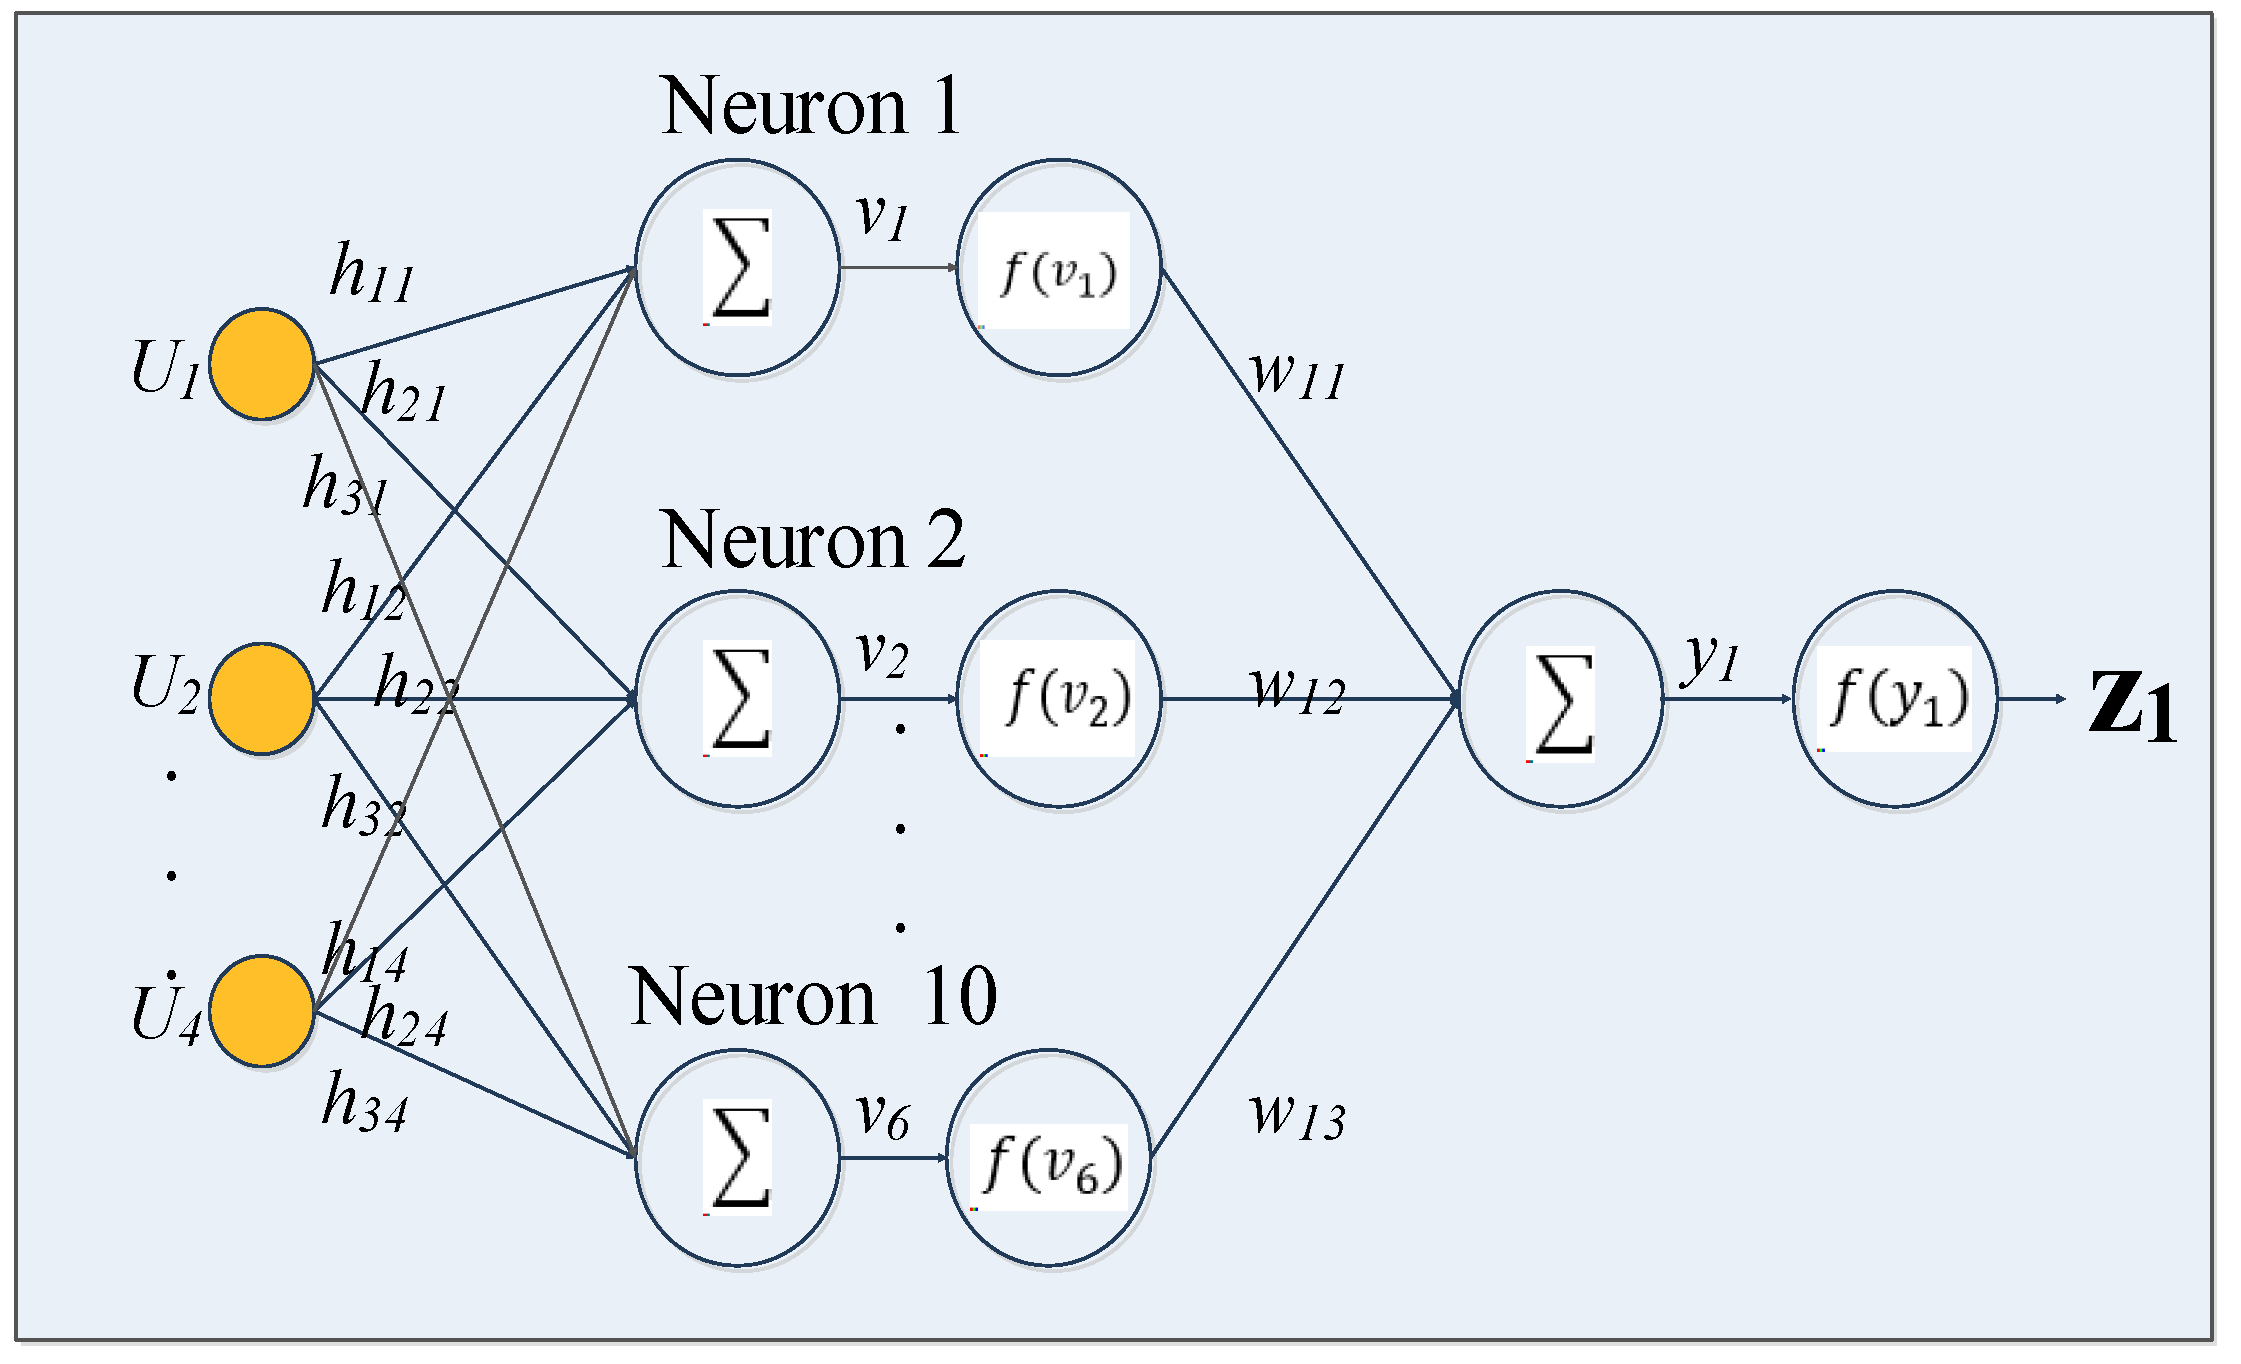
To carry out the comparison, the MATLAB software was used and two different ANN architectures were developed: one designed for warm weather and the other for cold weather, thus addressing the problem posed. Each of these neural architectures was specifically configured to consider multiple variables, including operator, sealer temperature, sealer speed, and extruder temperature. The purpose of this detailed setup was to anticipate the responses of overheating, resistance, and gas leaks. In Figure 19 and Figure 20, the structure of the RNAs of layers and neurons is presented, which were fine-tuned to achieve an optimal balance between model adaptability and prevention of overfitting.
Figure 19 presents the architecture of the ANN used, which is formed by a multilayer red neural perceptron that uses the Levenberg–Marquardt algorithm with supervised learning. This configuration consists of four inputs, eight neurons in the hidden layer, and one output. In the case of the cold climate presented in Figure 20, it is distinguished by the use of a total of 10 neurons.
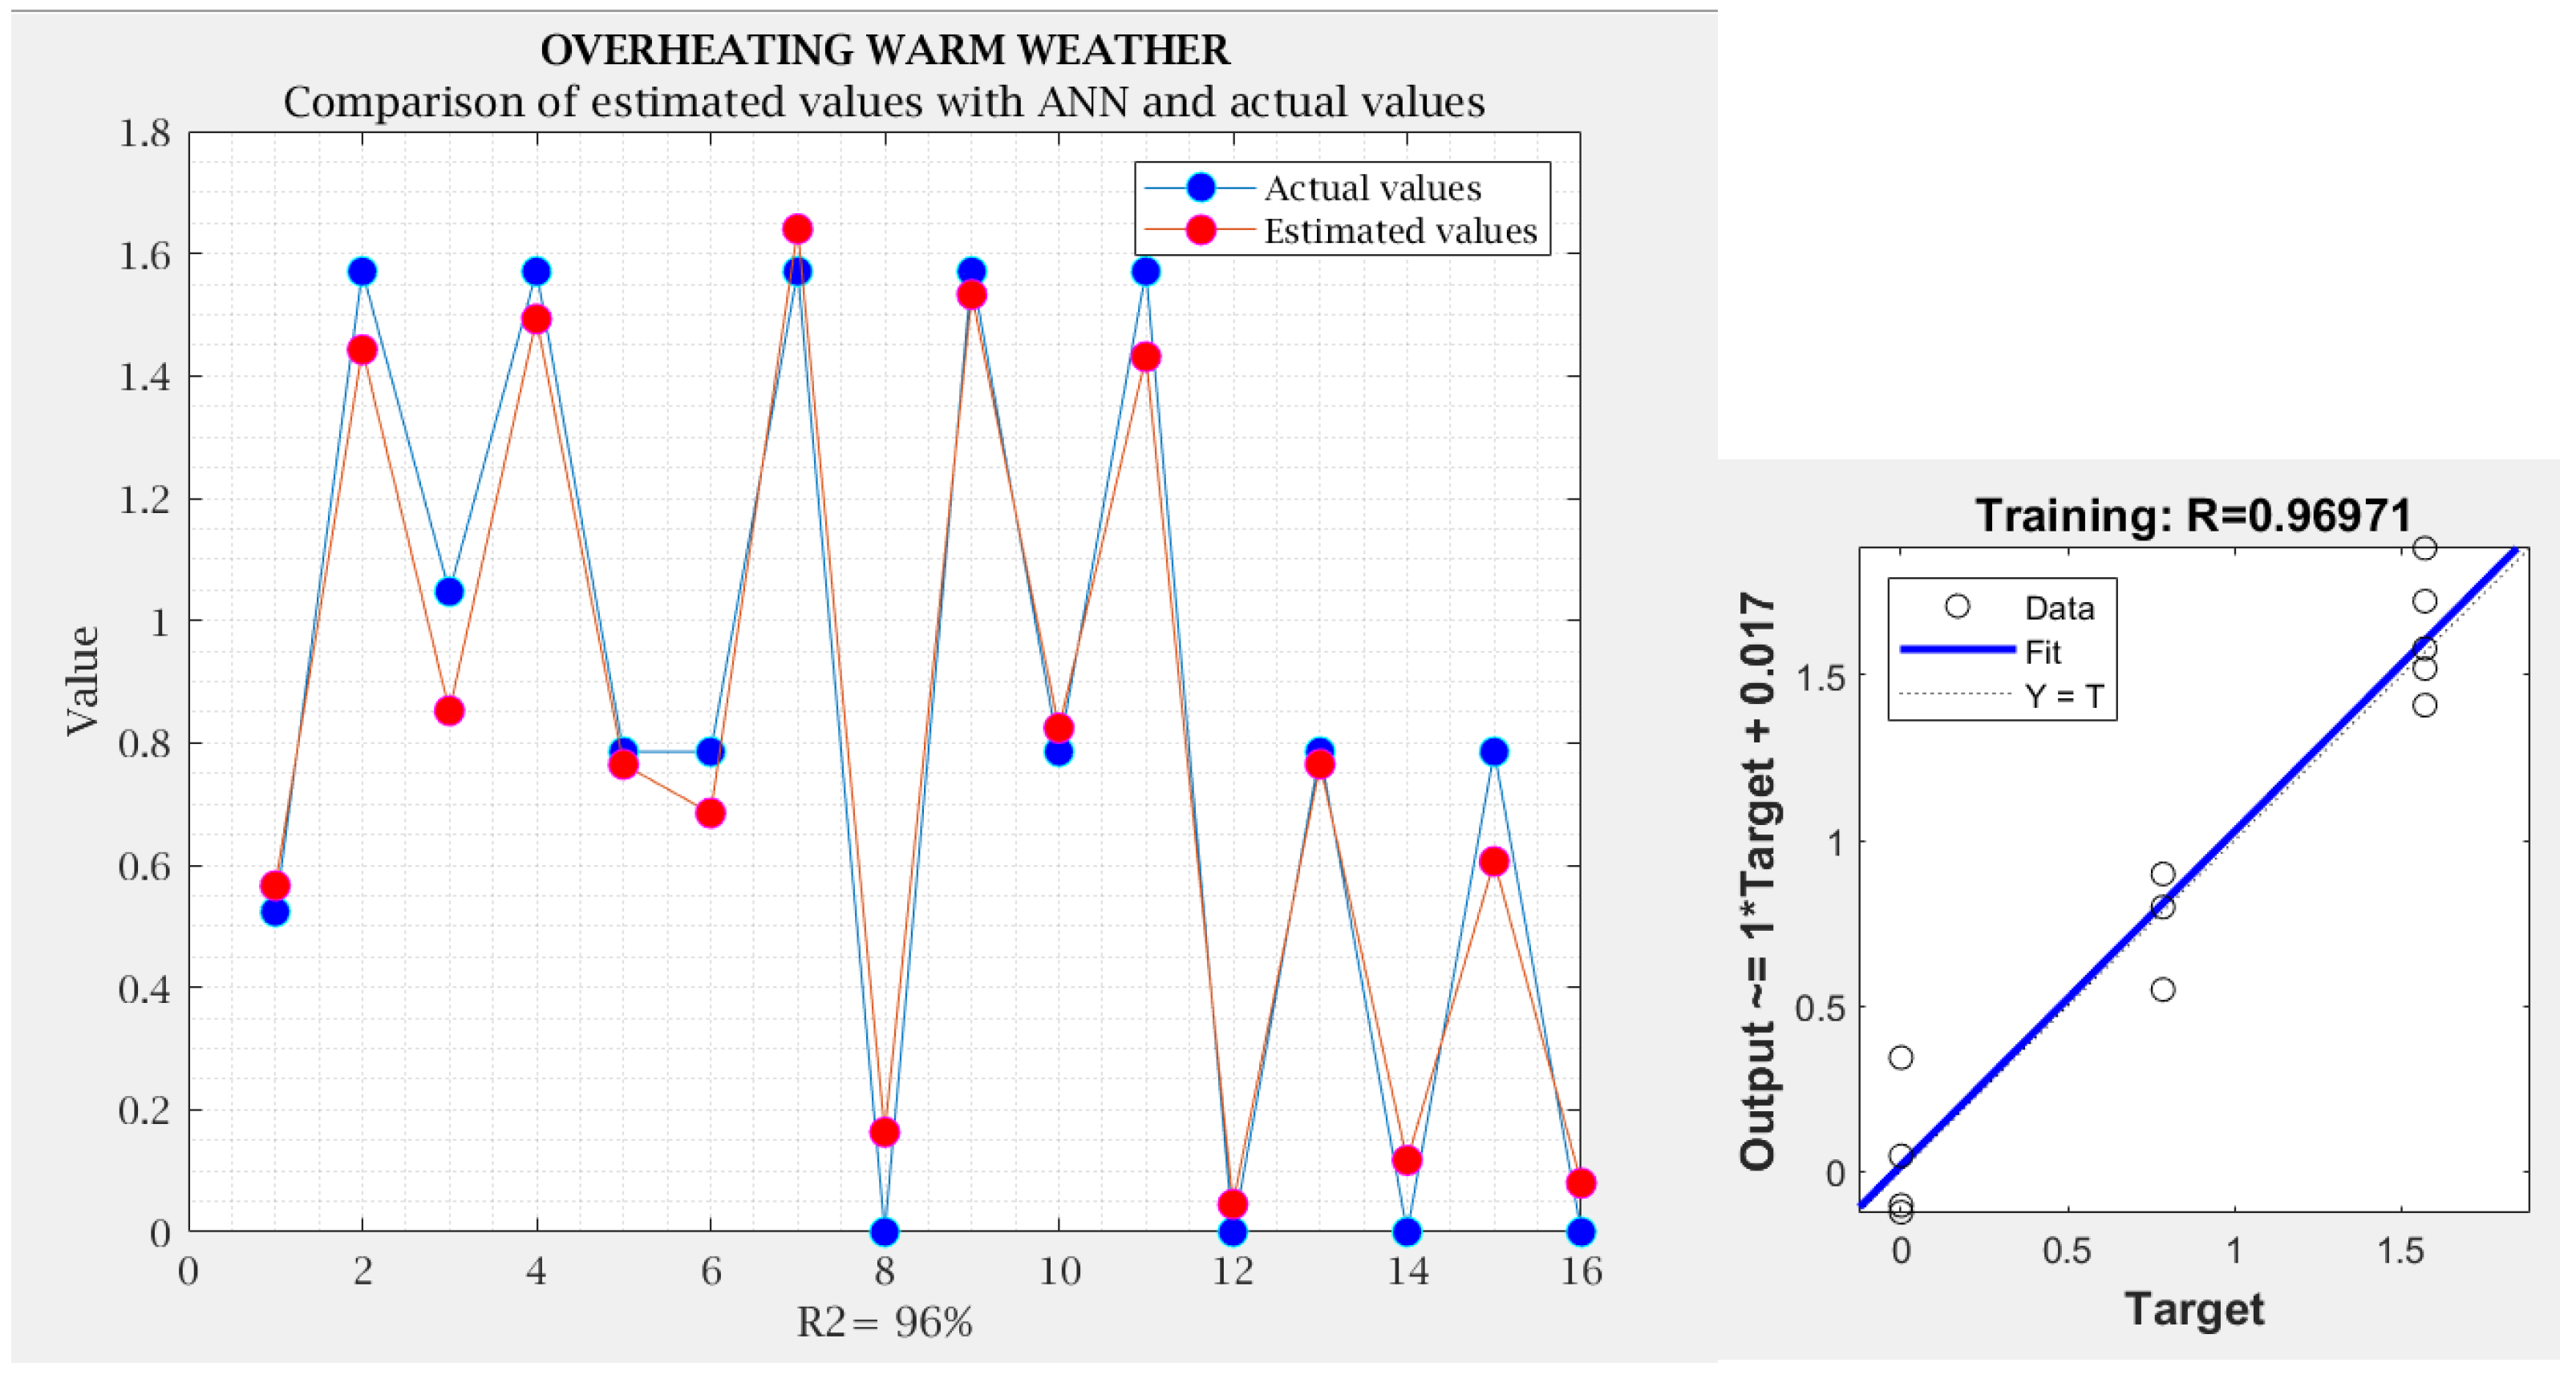
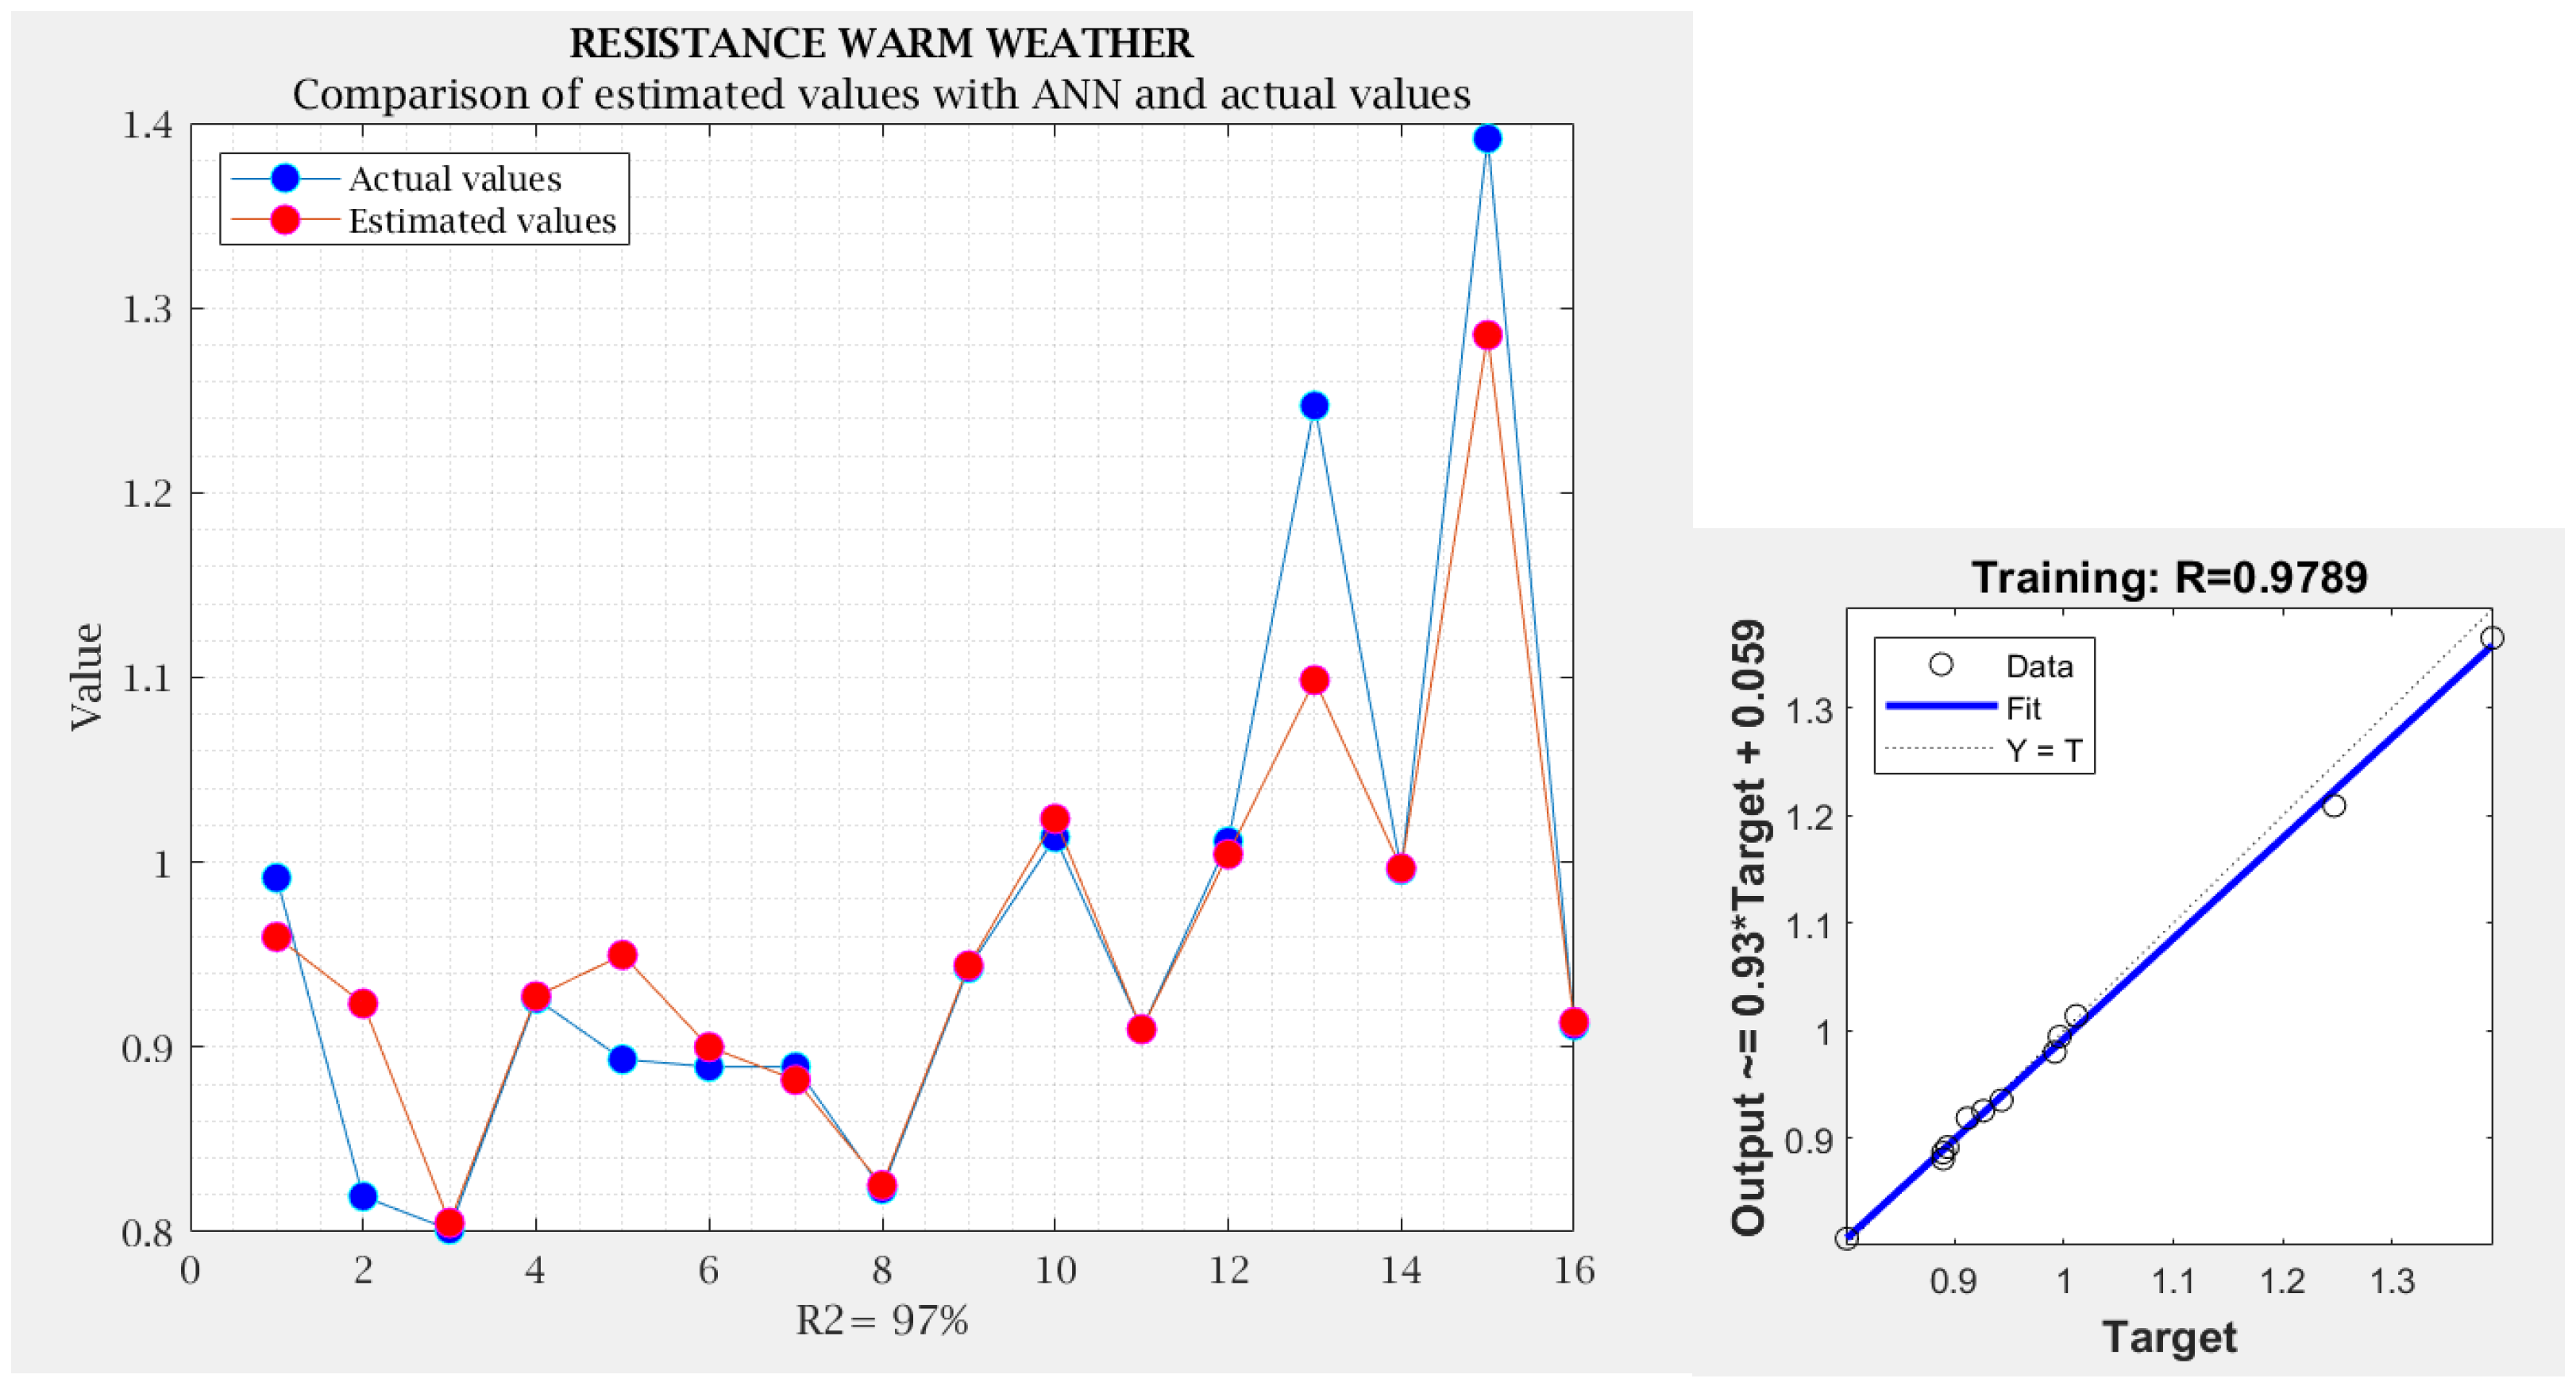
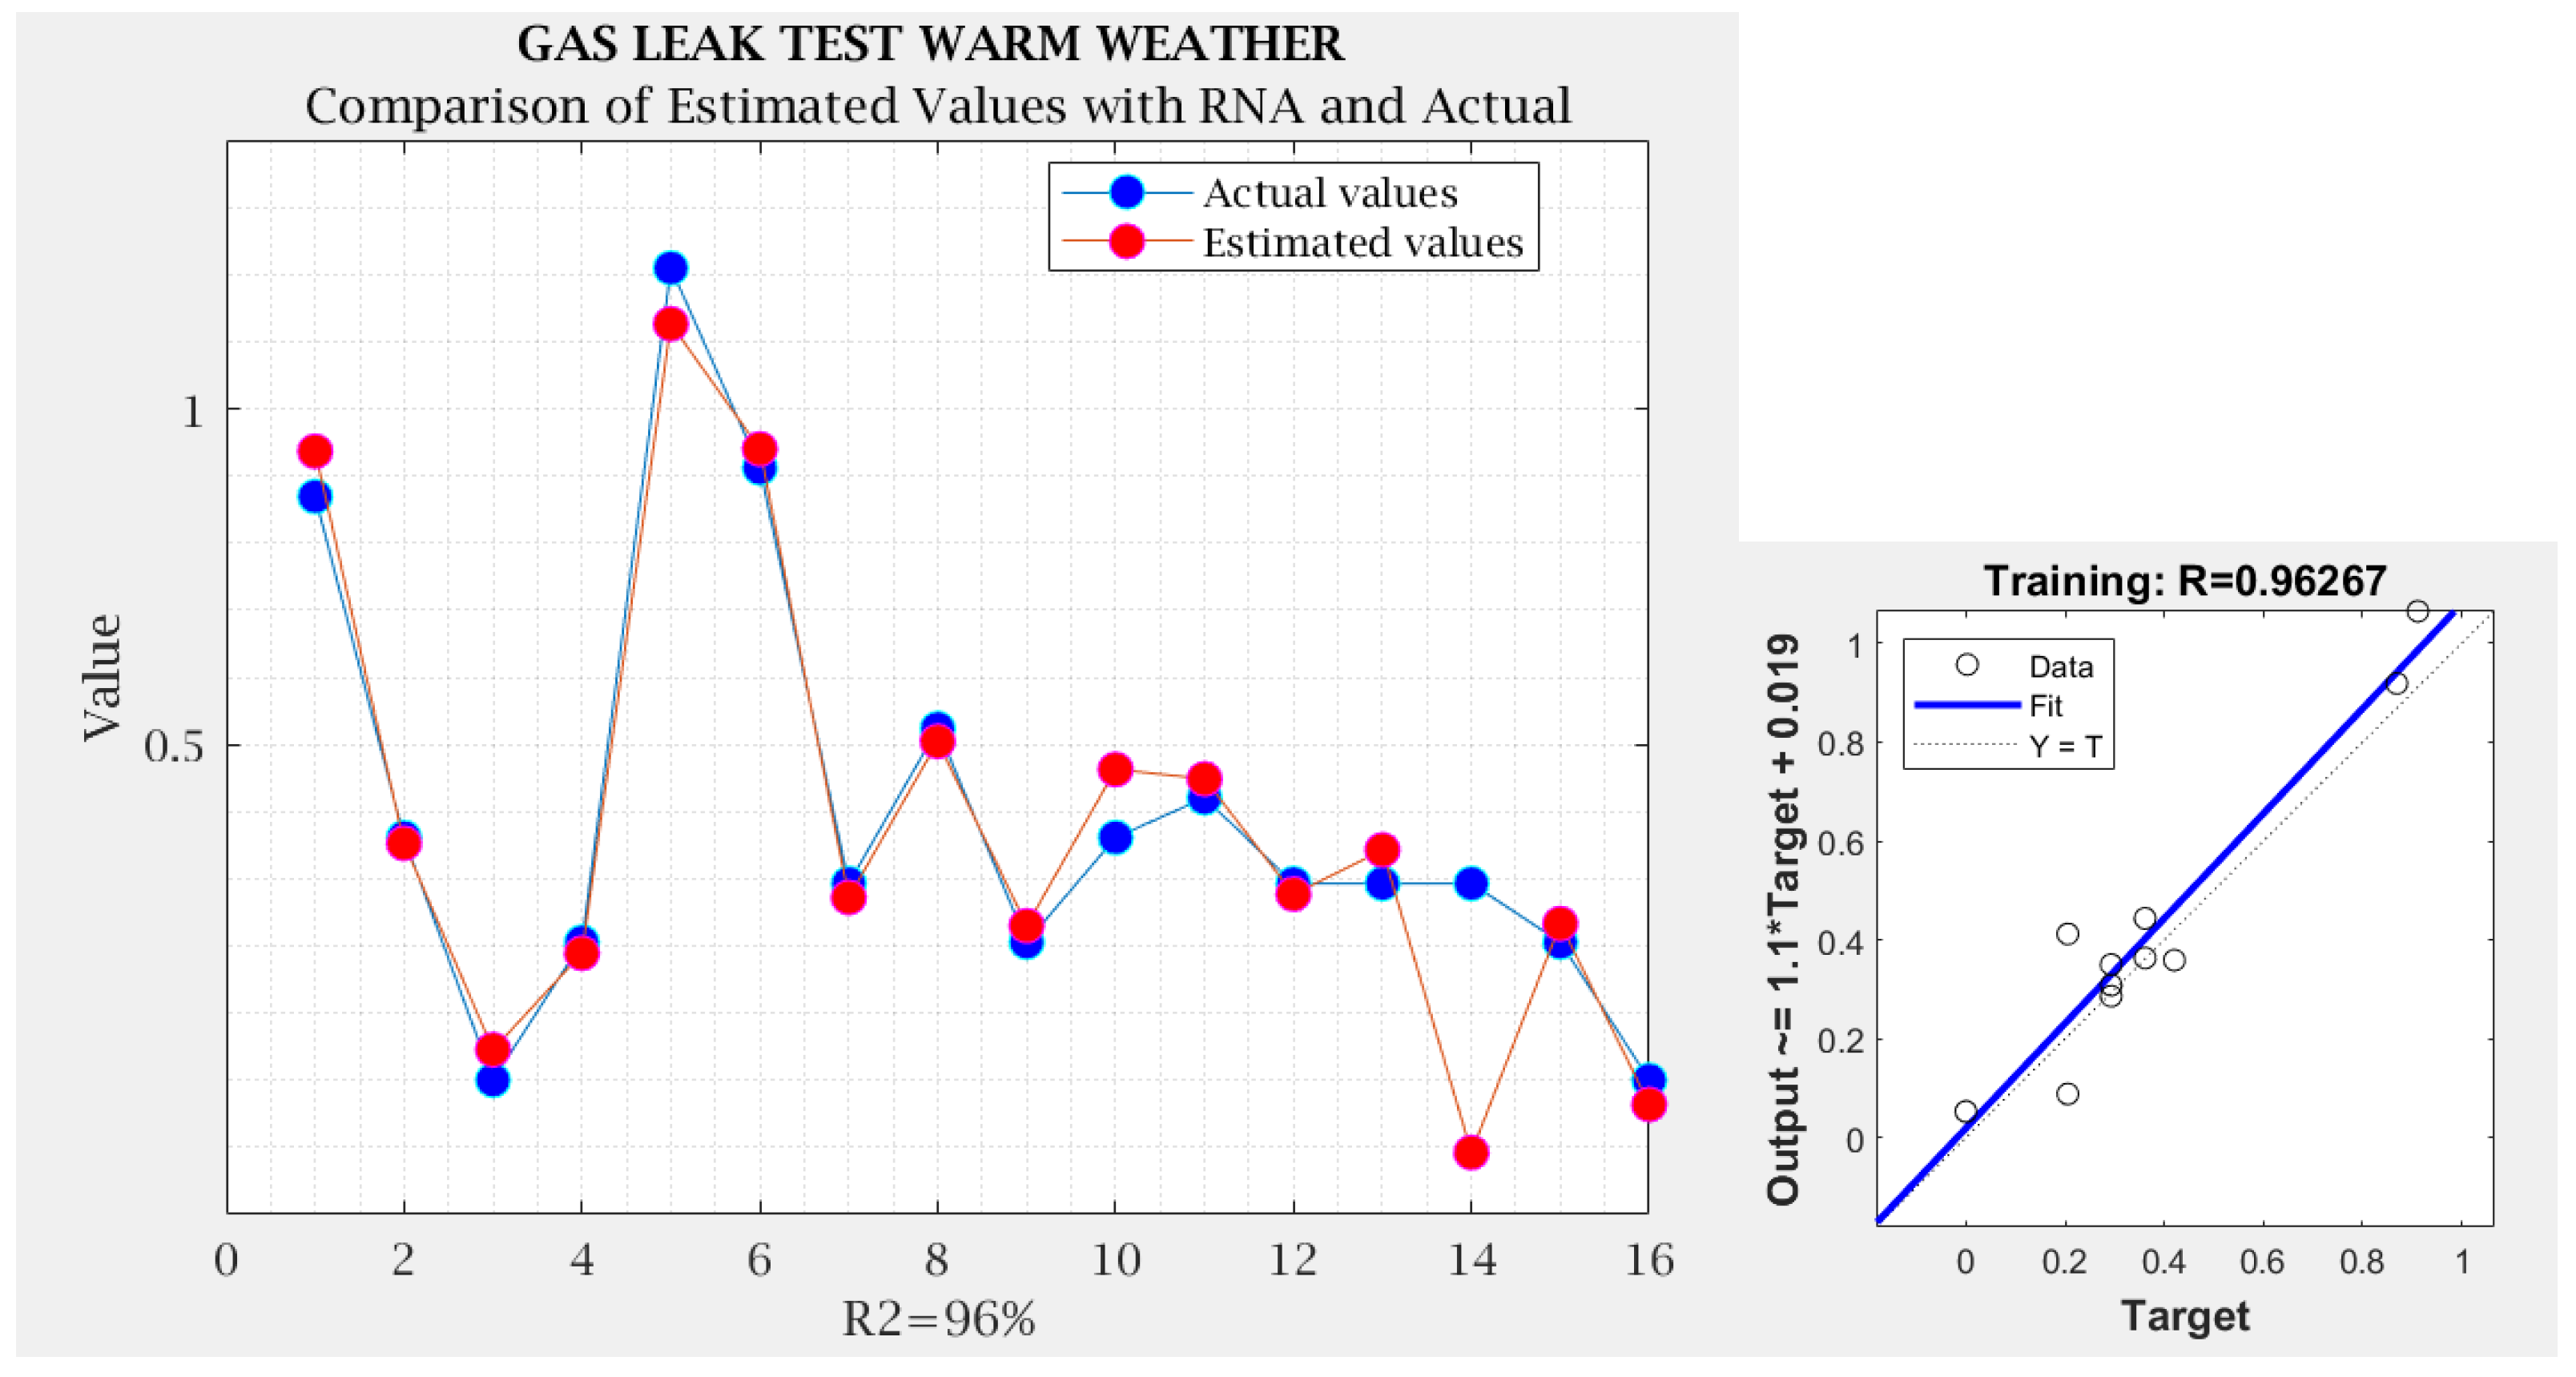
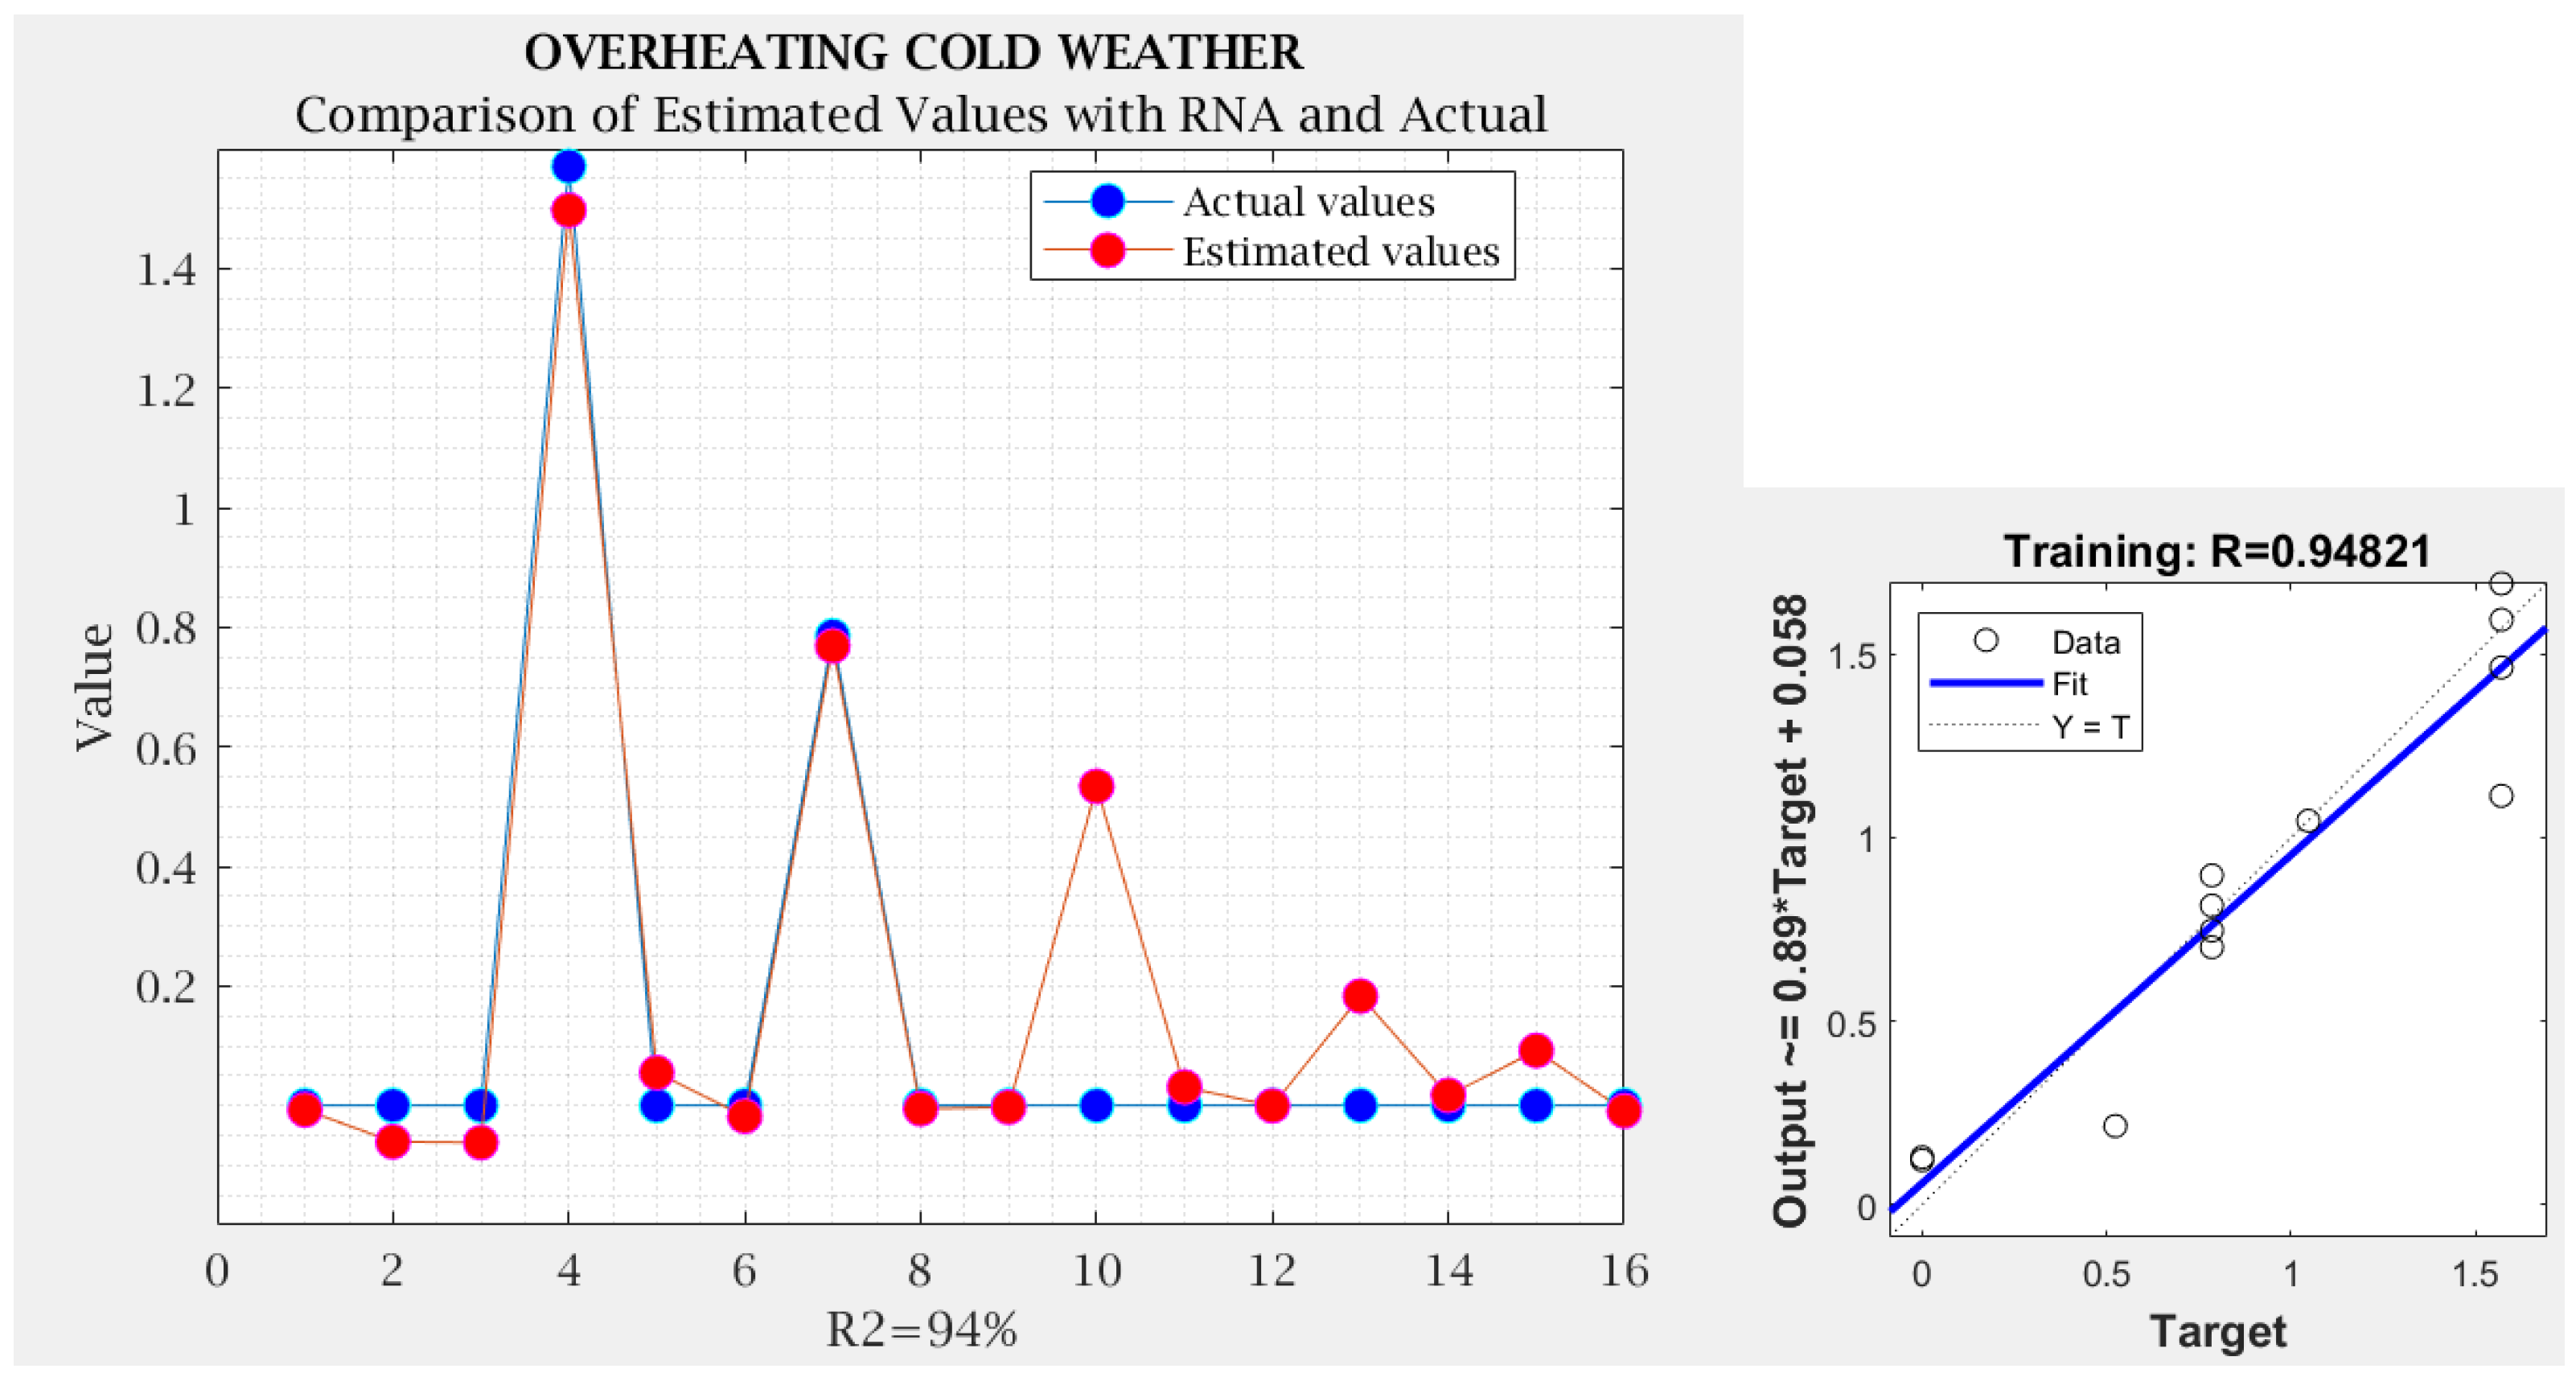
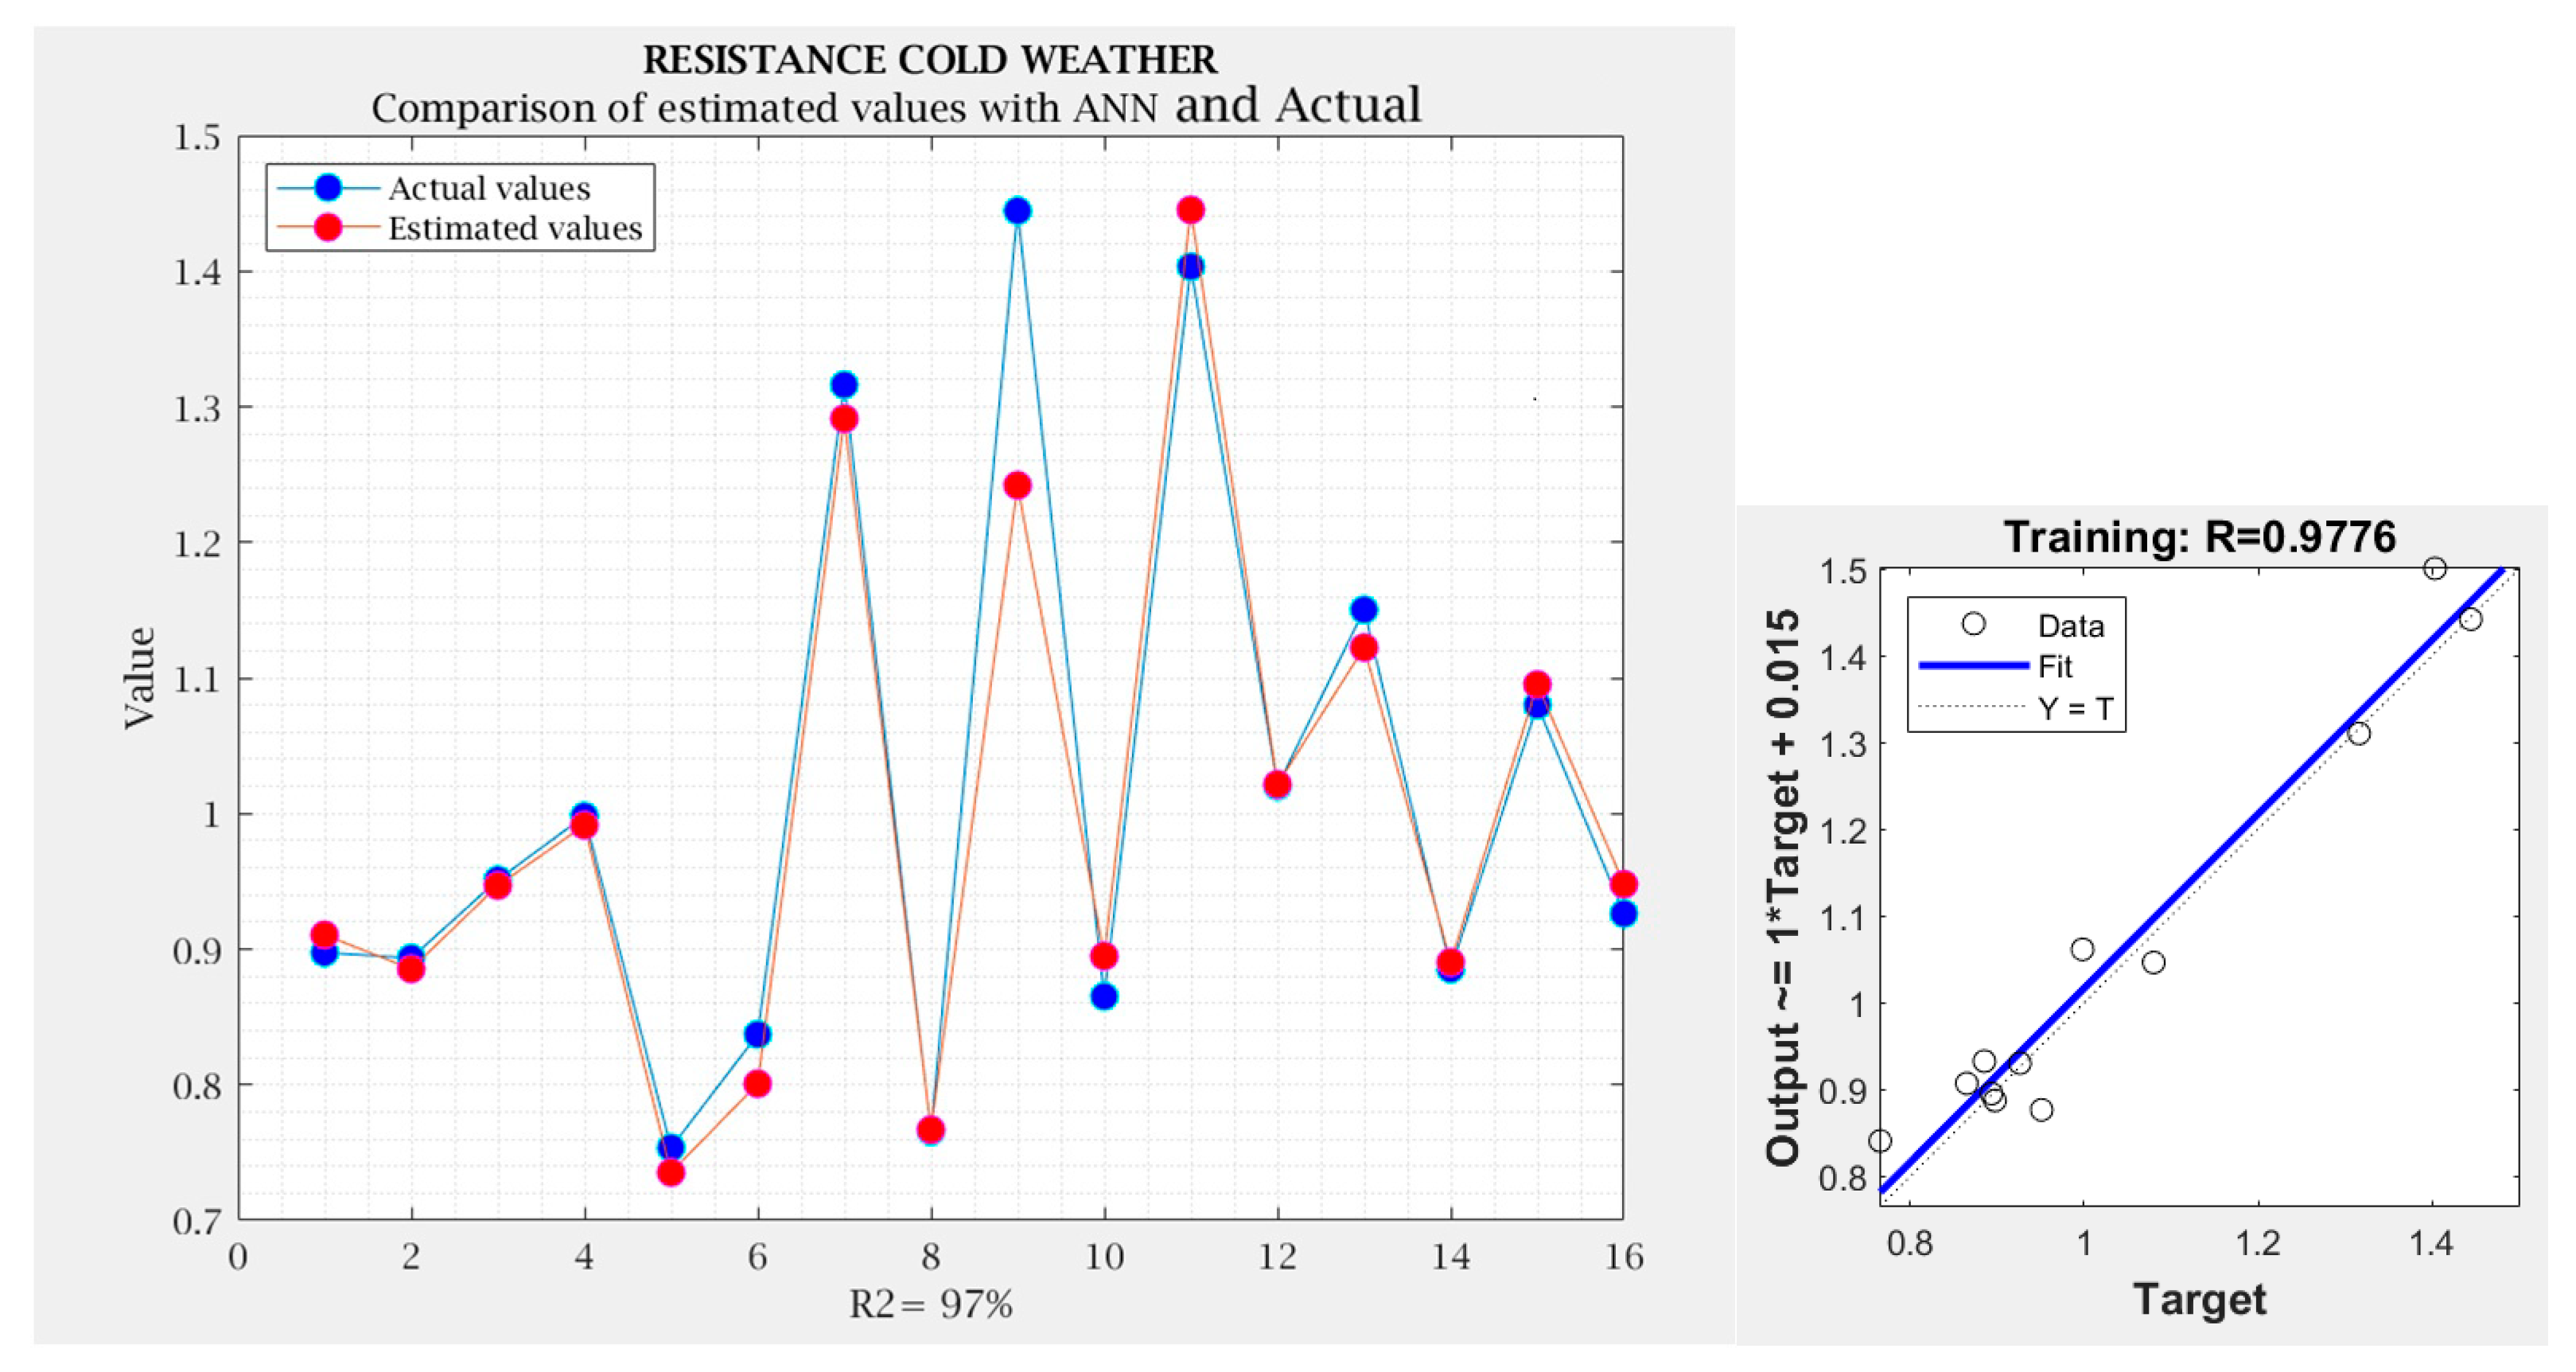
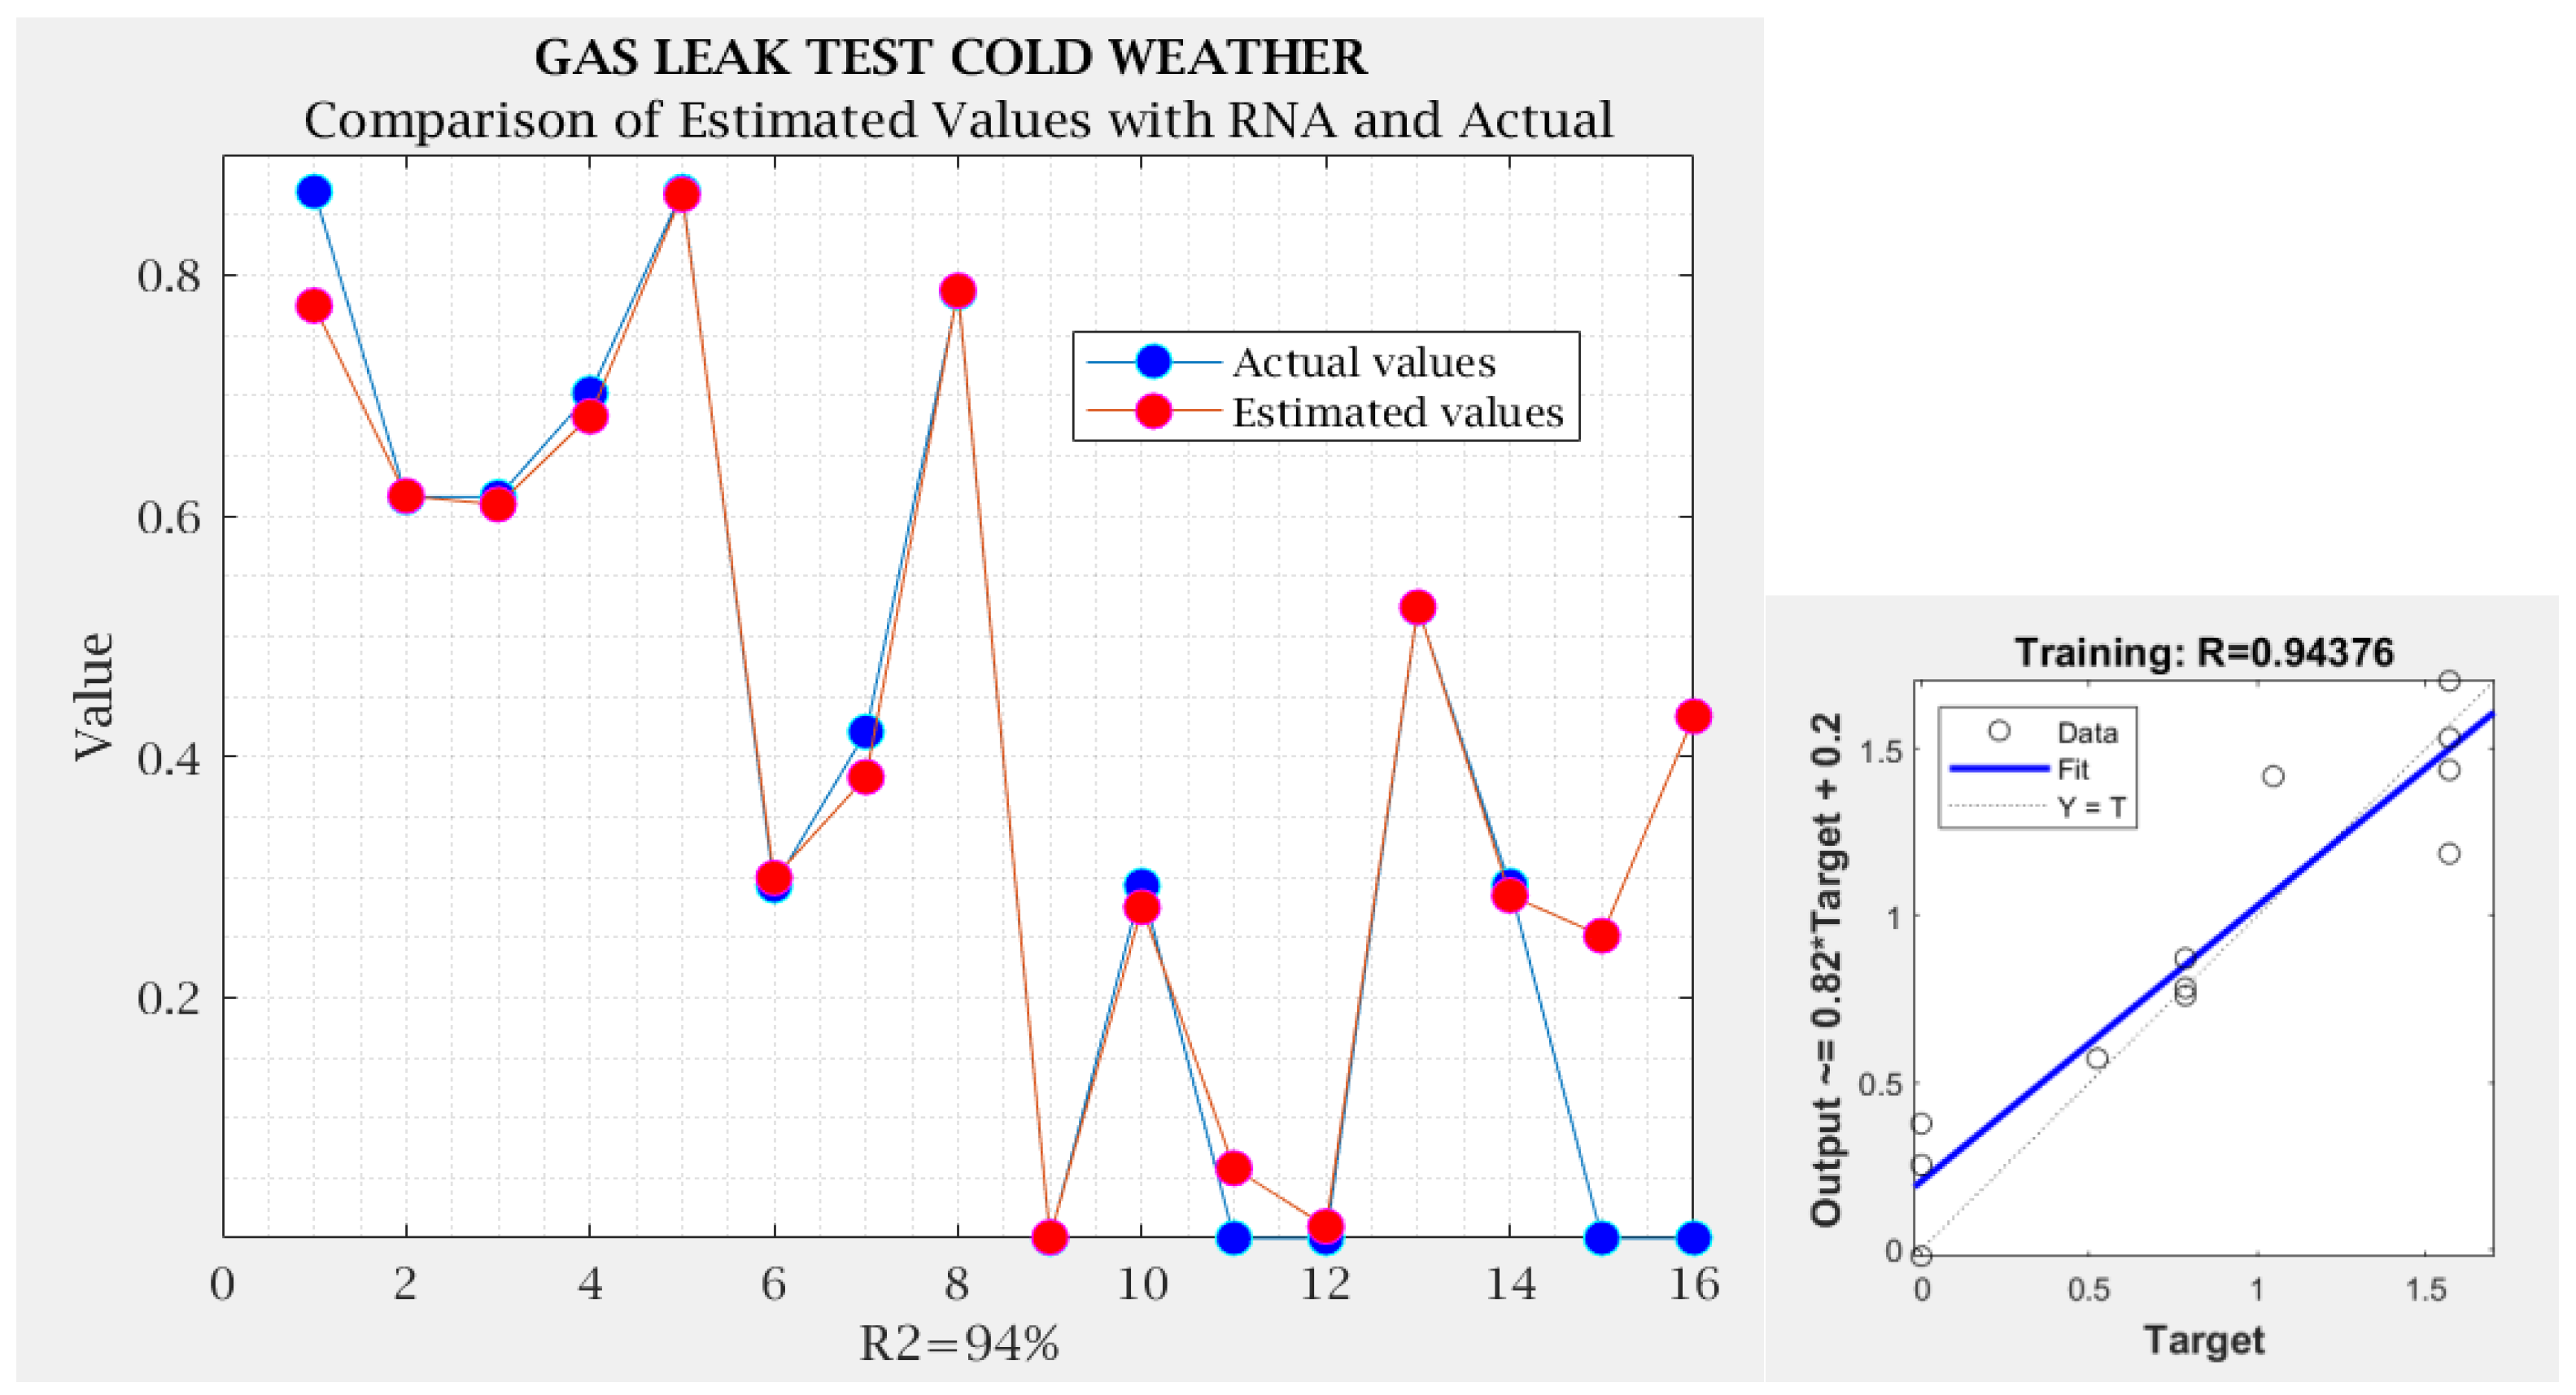
Once the ANNs were trained using the MATLAB R2020b® software, the predictions of the ANNs were compared with the actual values of superheat, resistance, and gas leakage for hot and cold temperatures. Endpoints, such as R2, were used to quantify the accuracy of the neural network’s predictions. The results are shown in Figure 21, Figure 22, Figure 23, Figure 24, Figure 25 and Figure 26.
The results achieved from the neural network were compared with the results generated by the previously examined regression models. The neural network’s performance was evaluated with the aim of surpassing the capabilities of regression. Notably, it was observed that the determination coefficient (R2) achieved 96% for overheating, 97% for resistance, and 96% for gas leakage testing. Similarly, concerning the results in cold weather conditions, the R2 values were 94% for overheating, 98% for resistance, and 94% for gas leakage testing. This comparison provides a comprehensive understanding of the relative strengths of both approaches in prediction.
4. Conclusions
This research study aimed to enhance the welding process of geomembranes in biodigesters by utilizing factorial experiments. Two factorial designs were proposed, one tailored for warm weather conditions and the other for cold weather conditions. Through comprehensive analysis and experimentation, several key findings have been obtained.
The analysis of significant factors and interactions revealed that the operator’s expertise and the wedge sealing temperature significantly influenced the resistance and leakage tests in warm weather conditions. Moreover, the temperature and speed of the wedge sealer played a crucial role in determining the overheating response. In cold weather conditions, while no decisive factors were identified for the superheat response, the operator’s influence on resistance and leakage tests remained prominent, with the temperature and speed of the wedge sealer exhibiting significant impacts.
To ensure the validity of the statistical analysis, the assumptions of normality, constant variance, and independence of data were rigorously examined. The data were transformed using the arcsine function to achieve normal distribution, and the plots of residuals confirmed the adequacy of assumptions for conducting the analysis of variance.
In terms of optimization, the study identified the optimal combinations of input variables or factors that maximize or minimize the response variables. For temperate climates, it was determined that maintaining a low-temperature sealer level helps minimize overheating, while a higher sealer level maximizes resistance and minimizes air leaks. Operator training, utilizing the sealer at a temperature of 450 °C with a speed of 3.6 m/min, and maintaining the extruder temperature at 290 °C were recommended for achieving optimal results.
Similarly, for cold climates, operator training, using the sealer at a temperature of 450 °C with a speed of either 2.6 or 3.6 m/min, and maintaining the extruder temperature at 290 °C were found to be the optimal approaches for maximizing resistance and minimizing overheating and air leaks.
In summary, this study contributes valuable insights into optimizing the welding process of geomembranes in biodigesters by employing factorial experiments. The findings provide practical recommendations for improving performance and reliability in different climatic conditions. Future research and practical implementations can leverage these results to enhance the efficiency and effectiveness of biodigester construction processes.
The optimization of the thermofusion process in biodigester construction plays a crucial role in ensuring the quality and durability of the geomembrane welds. In this research study, the aim was to improve the thermofusion process through the application of factorial experiments and statistical analysis. Two factorial designs were developed, considering both warm and cold weather conditions, to capture the variations and challenges presented by different climates. The experiments were conducted to evaluate the effects of various factors on key response variables, such as overheating, resistance, and leakage. The analysis of significant factors and interactions revealed that the expertise of the operator and the temperature of the wedge sealer had significant influences on resistance and leakage tests in warm weather conditions. Furthermore, the temperature and speed of the wedge sealer emerged as crucial factors in determining the overheating response. In cold weather conditions, while the factors had a limited impact on the superheat response, the operator’s influence remained prominent in resistance and leakage tests. To ensure the validity of the statistical analysis, the assumptions of normality, constant variance, and independence of data were rigorously examined and confirmed. The data transformation techniques were applied to achieve normal distribution and equalize variations among the groups. Based on the findings, optimal combinations of input variables were identified for maximizing resistance and minimizing overheating and air leaks. Operator training, specific temperature and speed settings for the sealer, and appropriate extruder temperature were recommended for achieving optimal results in both warm and cold climates. The implications of this research highlight the significance of optimizing the thermofusion process in biodigester construction as it ensures the strength, durability, and performance of the geomembrane welds. The insights gained from this study can guide practitioners and operators in making informed decisions to enhance the welding process and improve the overall quality of biodigesters.
The comparison with neural networks adds an additional dimension to the analysis, evaluating the suitability of these more complex and flexible models in relation to traditional regression models. The results of this comparison will contribute to a comprehensive evaluation of modeling techniques and can help make informed decisions about the choice of the most appropriate method to address the prediction problem under study. As part of future research endeavors, there is an intention to incorporate the response surface methodology (RSM) for comparative analysis with the neural network outcomes. Existing studies underscore the pronounced effectiveness of the design of experiments (DOE) and RSM in optimization pursuits. By amalgamating these methodologies, it becomes feasible to efficiently uncover and attain optimal configurations. Therefore, as a prospective avenue, we aspire to refine the thermofusion process methodology by integrating these approaches, fostering heightened research efficacy and practical application. This extension of the research endeavors holds the potential to contribute to a more comprehensive framework for devising and implementing biodigester systems that adapt adeptly to a diverse range of environmental conditions.
Author Contributions
Conceptualization and methodology, R.B.-S. and R.A.L.-M.; software, R.C.-M.; validation R.B.-S., R.A.L.-M. and R.C.-M.; formal analysis R.C.-M.; investigation, R.C.-M.; resources, R.B.-S., R.A.L.-M. and R.C.-M.; writing, review and editing, R.B.-S., R.A.L.-M. and R.C.-M. All authors have read and agreed to the published version of the manuscript.
Funding
The work presented in this paper has not received external funding.
Data Availability Statement
The data presented in this study are available on the corresponding link.
Conflicts of Interest
The authors declare no conflict of interest.
References
- Francey, W.; Rowe, R.K. Importance of thickness reduction and squeeze-out Std-OIT loss for HDPE geomembrane fusion seams. Geotext. Geomembr. 2023, 51, 30–42. [Google Scholar] [CrossRef]
- Cahyani, D.; Haryanto, A.; A Putra, G.; Fil’aini, R.; Marpaung, D.S.S. Life cycle assessment of biogas digester in small scale tapioca industry. IOP Conf. Ser. Earth Environ. Sci. 2019, 258, 012017. [Google Scholar] [CrossRef]
- Cacciuttolo, C.; Pastor, A.; Valderrama, P.; Atencio, E. Process Water Management and Seepage Control in Tailings Storage Facilities: Engineered Environmental Solutions Applied in Chile and Peru. Water 2023, 15, 196. [Google Scholar] [CrossRef]
- Valentin, C.A.; da Silva, J.L.; Kobelnik, M.; Ribeiro, C.A. Thermoanalytical and dynamic mechanical analysis of commercial geomembranes used for fluid retention of leaching in sanitary landfills. J. Therm. Anal. Calorim. 2019, 136, 471–481. [Google Scholar] [CrossRef]
- Shared Risk Trust. General Diagnosis of the Situation of Biodigestion Systems in Mexico; Federal Bureau of Agriculture, Animal Breeding and Rural Development: Mexico City, Mexico, 2010. [Google Scholar]
- Camarena-Martinez, R.; Lizarraga-Morales, R.A.; Baeza-Serrato, R. Classification of Geomembranes as Raw Material for Defects Reduction in the Manufacture of Biodigesters Using an Artificial Neuronal Network. Energies 2021, 14, 7345. [Google Scholar] [CrossRef]
- Zhang, L.; Bouazza, A.; Rowe, R.K.; Scheirs, J. Effect of welding parameters on properties of HDPE geomembrane seams. Geosynth. Int. 2017, 24, 408–418. [Google Scholar] [CrossRef]
- Gassner, F.; Fairhead, G. Field leakage rates of geosynthetic lined facilities. In Proceedings of the 10th International Geosynthetics Conference (DGGT), Berlin, Germany, 21–25 September 2014. [Google Scholar]
- Kasemiire, A.; Avohou, H.T.; De Bleye, C.; Sacre, P.-Y.; Dumont, E.; Hubert, P.; Ziemons, E. Design of experiments and design space approaches in the pharmaceutical bioprocess optimization. Eur. J. Pharm. Biopharm. 2021, 166, 144–154. [Google Scholar] [CrossRef]
- Acheson, C.; Mackle, D.; Murphy, A.; Butterfield, J.; Higgins, P.; Collins, R.; Higgins, C.; Darlington, J.; Tame, R. Using Design of Experiments to Define Factory Simulations for Manufacturing Investment Decisions. In Proceedings of the 34th International Manufacturing Conference, Sligo, Ireland, 30–31 August 2017. [Google Scholar]
- Dejaegher, B.; Vander Heyden, Y. Experimental designs and their recent advances in set-up, data interpretation, and analyti829 cal applications. J. Pharm. Biomed. Anal. 2011, 56, 141–158. [Google Scholar]
- Laurencelle, L.; Cousineau, D. Analysis of proportions using arcsine transform with any experimental design. Front. Psychol. 2023, 13, 1045436. [Google Scholar] [CrossRef]
- Román-Ramírez, L.; Marco, J. Design of experiments applied to lithium-ion batteries: A literature review. Appl. Energy 2022, 320, 119305. [Google Scholar] [CrossRef]
- Farrahi, G.H.; Kashyzadeh, K.R.; Minaei, M.; Sharifpour, A.; Riazi, S. Analysis of Resistance Spot Welding Process Parameters Effect on the Weld Quality of Three-steel Sheets Used in Automotive Industry: Experimental and Finite Element Simulation. Int. J. Eng. 2020, 33, 148–157. [Google Scholar]
- Eshraghi, M.; Tschopp, M.A.; Zaeem, M.A.; Felicelli, S.D. A parametric study of resistance spot welding of a dual-phase steel using finite element analysis. In Proceedings of the 8th International Congress on Advanced Materials and Processing, Waikoloa, HI, USA, 4–9 August 2013; Springer: Berlin/Heidelberg, Germany, 2013; Volume 33, pp. 3073–3080. [Google Scholar]
- Shrivas, S.P.; Vaidya, S.K.; Khandelwal, A.K.; Vishvakarma, A.K. Investigation of TIG welding parameters to improve strength. Mater. Today Proc. 2020, 26, 1897–1902. [Google Scholar] [CrossRef]
- Madrid, J.; Lorin, S.; Söderberg, R.; Hammersberg, P.; Wärmefjord, K.; Lööf, J. A Virtual Design of Experiments Method to Evaluate the Effect of Design and Welding Parameters on Weld Quality in Aerospace Applications. Aerospace 2019, 6, 74. [Google Scholar] [CrossRef]
- Raveendra, J.; Parmar, R.S. Mathematical models to predict weld bead geometry for flux cored arc welding. J. Met. Constr. 1987, 19, 31R–35R. [Google Scholar]
- Gupta, V.K.; Parmar, R.S. Parmar, Fractional factorial technique to predict dimensions of the weld bead in automatic submerged arc welding. J. Inst. Eng. 1989, 70, 67–75. [Google Scholar]
- Kim, I.; Son, K.; Yang, Y.; Yaragada, P. Sensitivity analysis for process parameters in GMA welding processes using a factorial design method. Int. J. Mach. Tools Manuf. 2003, 43, 763–769. [Google Scholar]
- Gunaraj, V.; Murugan, N. Application of response surface methodology for predicting weld bead quality in submerged arc welding of pipes. J. Mater. Process. Technol. 1999, 88, 266–275. [Google Scholar] [CrossRef]
- Murugan, N.; Gunaraj, V. Prediction and control of weld bead geometry and shape relationships in submerged arc welding of pipes. J. Mater. Process. Technol. 2005, 168, 478–487. [Google Scholar] [CrossRef]
- Pahkamaa, A.; Wärmefjord, K.; Karlsson, L.; Söderberg, R.; Goldak, J. Combining variation simulation with welding simulation for prediction of deformation and variation of a final assembly. J. Comput. Inf. Sci. Eng. 2012, 12, 021002. [Google Scholar]
- Benyounis, K.; Olabi, A.-G. Optimization of different welding processes using statistical and numerical approaches—A reference guide. Adv. Eng. Softw. 2008, 39, 483–496. [Google Scholar] [CrossRef]
- Manonmani, K.; Murugan, N.; Buvanasekaran, G. Effects of process parameters on the bead geometry of laser beam butt welded stainless steel sheets. Int. J. Adv. Manuf. Technol. 2007, 32, 1125–1133. [Google Scholar] [CrossRef]
- Siddaiah, A.; Singh, B.; Mastanaiah, P. Prediction and optimization of weld bead geometry for electron beam welding of AISI 304 stainless steel. Int. J. Adv. Manuf. Technol. 2017, 89, 27–43. [Google Scholar] [CrossRef]
- Benyounis, K.Y.; Olabi, A.G.; Hashmi, M.S.J. Optimizing the laser-welded butt joints of medium carbon steel using RSM. J. Mater. Process. Technol. 2005, 164, 986–989. [Google Scholar] [CrossRef]
- Vicente, G.; Coteron, A.; Martinez, M.; Aracil, J. Application of the factorial design of experiments and response surface methodology to optimize biodiesel production. Ind. Crop. Prod. 1998, 8, 29–35. [Google Scholar] [CrossRef]
- Koudache, F.; Yala, A.A. A Contribution to the Optimisation of Biogas Digesters with the Design of Experiments Method. J. Inter. Environ. Appl. Sci. 2008, 3, 195–200. [Google Scholar]
- Bose, A.; O’Shea, R.; Lin, R.; Murphy, J.D. A comparative evaluation of design factors on bubble column operation in photosynthetic biogas upgrading. Biofuel Res. J. 2021, 8, 1351–1373. [Google Scholar] [CrossRef]
- Bharadwaz, Y.D.; Rao, B.G.; Rao, V.D.; Anusha, C. Improvement of biodiesel methanol blends performance in a variable compression ratio engine using response surface methodology. Alex. Eng. J. 2016, 55, 1201–1209. [Google Scholar] [CrossRef]
- Clean, J. Evaluation of biogas upgrading technologies using a response surface methodology for process simulation. J. Clean. Prod. 2017, 141, 978–988. [Google Scholar]
- Oo, Y.M.; Legwiriyakul, A.; Thawornprasert, J.; Somnuk, K. Production of diesel–biodiesel–water fuel nanoemulsions using three-dimensional printed rotor–stator hydrodynamic cavitation. Fuel 2022, 317, 123445. [Google Scholar] [CrossRef]
- Chuquiruna, E.J.L.; Chuquiruna, N.A.L. Cut and Tear Resistance in HDPE Geomembrane. Bachelor’s Thesis, Northern Private University, Trujillo, Peru, 2019. [Google Scholar]
- Mendoza Pumacahua, D.O. Fusion Welding Parameters in the HDPE Geomembrane Reservoir in the Community of San Pedro, District of San José de Ticllas, Huamanga-Ayacucho-2023; Universidad Nacional de San Cristóbal de Huamanga: Ayacucho, Peru, 2023. [Google Scholar]
- Chong, B.W.; Othman, R.; Putra Jaya, R.; Mohd Hasan, M.R.; Sandu, A.V.; Nabiałek, M.; Jeż, B.; Pietrusiewicz, P.; Kwiatkowski, D.; Postawa, P.; et al. Design of Experiment on Concrete Mechanical Properties Prediction: A Critical Re883 view. Materials 2021, 14, 1866. [Google Scholar] [CrossRef]
- Wang, H.; Chen, K.; Lin, B.; Kou, J.; Li, L.; Wu, S.; Liao, S.; Sun, G.; Pu, J.; Yang, H.; et al. Process Development and Optimization of Linagliptin Aided by the Design of Experiments (DoE). Org. Process. Res. Dev. 2022, 26, 3254–3264. [Google Scholar] [CrossRef]
- Idris, M.; Abiola, O. Performance evaluation of three different-shaped bio-digesters for biogas production and optimization by artificial neural network integrated with genetic algorithm. Sustain. Energy Technol. Assess. 2018, 26, 116–124. [Google Scholar]
Figure 1.
Diagram of research methodology with emphasis on the arcsine transformation.
Figure 2.
Wedge sealer used for the thermofusion process.
Figure 3.
Channel left by wedge sealer for the quality test.
Figure 4.
Extruder used for the thermofusion process.
Figure 5.
Tensiometer applying load to the welded geomembrane to evaluate its resistance.

Figure 6.
Air test carried out in a channel left by the wedge sealer.
Figure 7.
Transformation procedure in the first replicas of the first DOE.
Figure 8.
Pareto chart of standardized effects for DOE responses under warm weather conditions, (a) Represents Pareto chart for Overheating response for warm weather; (b) Pareto chart for Resistance response for warm weather (c) Pareto chart for Air Test response for warm weather.
Figure 8.
Pareto chart of standardized effects for DOE responses under warm weather conditions, (a) Represents Pareto chart for Overheating response for warm weather; (b) Pareto chart for Resistance response for warm weather (c) Pareto chart for Air Test response for warm weather.
Figure 9.
Pareto chart of standardized effects for DOE responses under cold weather conditions, (a) Represents Pareto chart for Overheating response for cold weather; (b) Pareto chart for Resistance response for cold weather (c) Pareto chart for Air Test response for cold weather.
Figure 9.
Pareto chart of standardized effects for DOE responses under cold weather conditions, (a) Represents Pareto chart for Overheating response for cold weather; (b) Pareto chart for Resistance response for cold weather (c) Pareto chart for Air Test response for cold weather.
Figure 10.
Interaction graph for resistance.

Figure 11.
Plots of residuals for the first DOE.
Figure 12.
Plots of residuals for the second DOE.
Figure 13.
Comparative analysis of estimated and actual values for overheating under warm temperature conditions.
Figure 13.
Comparative analysis of estimated and actual values for overheating under warm temperature conditions.
Figure 14.
Comparative analysis of estimated and actual values for resistance to warm temperature.
Figure 15.
Comparative analysis of estimated and actual values for gas leak test under warm temperature conditions.
Figure 15.
Comparative analysis of estimated and actual values for gas leak test under warm temperature conditions.
Figure 16.
Comparative analysis of estimated and actual values for overheating under cold temperature conditions.
Figure 16.
Comparative analysis of estimated and actual values for overheating under cold temperature conditions.

Figure 17.
Comparative analysis of estimated and actual values for resistance under cold temperature conditions.
Figure 17.
Comparative analysis of estimated and actual values for resistance under cold temperature conditions.

Figure 18.
Comparative analysis of estimated and actual values for gas leak test under cold temperature conditions.
Figure 18.
Comparative analysis of estimated and actual values for gas leak test under cold temperature conditions.

Figure 19.
Proposed neural network architecture for warm weather conditions.
Figure 20.
Proposed neural network architecture for cold weather conditions.

Figure 21.
Comparison of estimated values with the ANN and actual values in warm weather for overheating response and network performance diagram.
Figure 21.
Comparison of estimated values with the ANN and actual values in warm weather for overheating response and network performance diagram.
Figure 22.
Comparison of estimated values with the ANN and actual values in warm weather for resistance response.
Figure 22.
Comparison of estimated values with the ANN and actual values in warm weather for resistance response.
Figure 23.
Comparison of estimated values with the ANN and actual values in warm weather for gas leak response and network performance diagram.
Figure 23.
Comparison of estimated values with the ANN and actual values in warm weather for gas leak response and network performance diagram.

Figure 24.
Comparison of estimated values with the ANN and actual values in warm weather for overheating response and network performance diagram.
Figure 24.
Comparison of estimated values with the ANN and actual values in warm weather for overheating response and network performance diagram.
Figure 25.
Comparison of estimated values with the ANN and actual values in warm weather for resistance response and network performance diagram.
Figure 25.
Comparison of estimated values with the ANN and actual values in warm weather for resistance response and network performance diagram.
Figure 26.
Comparison of estimated values with the ANN and actual values in warm weather for gas leak response and network performance diagram.
Figure 26.
Comparison of estimated values with the ANN and actual values in warm weather for gas leak response and network performance diagram.


Table 1.
Properties and ranges of characteristics of the thermofusion process.
| Specification Levels | Properties | Specifications |
|---|---|---|
| 0 | Operator | Untrained |
| 1 | Trained | |
| 390 °C | Wedge sealer temperature | Measured in °C |
| 450 °C | ||
| 2.6 | Speed sealer | Measured in meters per minute (m/min) |
| 3.6 | ||
| 270 | Extruder temperature | Measured in °C. |
| 290 |
Table 2.
Properties and characteristics of the thermofusion process that remain constant.
| Properties | Specifications |
|---|---|
| Type of geomembrane | HDPE type Gm13 with 1.5 mm thickness |
| Weather temperature, | 29 °C and 9 °C |
| Voltage | 220 Volts |
| Geomembrane overlap | 15 cm |
Table 3.
DOE in warm weather conditions.
| Voltage | Overlap | Weather | Operator | Wedge Sealer Temperature | Speed Sealer | Extruder Temperature | Overheating | Resistance | Gas Leak Tests |
|---|---|---|---|---|---|---|---|---|---|
| 220 | 15 | 29 | 0 | 390 | 2.6 | 290 | 0 | 0.6349 | 1.0000 |
| 220 | 15 | 29 | 0 | 390 | 2.6 | 290 | 0 | 0.5238 | 0.8333 |
| 220 | 15 | 29 | 0 | 390 | 2.6 | 290 | 1 | 0.7619 | 0.1667 |
| 220 | 15 | 29 | 0 | 390 | 2.6 | 290 | 0 | 0.8810 | 0.3333 |
| 220 | 15 | 29 | 0 | 450 | 3.6 | 290 | 1 | 0.6349 | 0.0000 |
| 220 | 15 | 29 | 0 | 450 | 3.6 | 290 | 1 | 0.6349 | 0.3333 |
| 220 | 15 | 29 | 0 | 450 | 3.6 | 290 | 1 | 0.4365 | 0.1667 |
| 220 | 15 | 29 | 0 | 450 | 3.6 | 290 | 1 | 0.4286 | 0.0000 |
| 220 | 15 | 29 | 0 | 450 | 3.6 | 260 | 1 | 0.6349 | 0.0000 |
| 220 | 15 | 29 | 0 | 450 | 3.6 | 260 | 1 | 0.6349 | 0.0000 |
| 220 | 15 | 29 | 0 | 450 | 3.6 | 260 | 1 | 0.4444 | 0.0000 |
| 220 | 15 | 29 | 0 | 450 | 3.6 | 260 | 0 | 0.3492 | 0.0000 |
| 220 | 15 | 29 | 0 | 450 | 2.6 | 260 | 1 | 0.6349 | 0.0000 |
| 220 | 15 | 29 | 0 | 450 | 2.6 | 260 | 1 | 0.6349 | 0.0000 |
| 220 | 15 | 29 | 0 | 450 | 2.6 | 260 | 1 | 0.6032 | 0.1667 |
| 220 | 15 | 29 | 0 | 450 | 2.6 | 260 | 1 | 0.6825 | 0.0000 |
| 220 | 15 | 29 | 0 | 390 | 3.6 | 260 | 1 | 0.6111 | 1.0000 |
| 220 | 15 | 29 | 0 | 390 | 3.6 | 260 | 0 | 0.5952 | 0.6667 |
| 220 | 15 | 29 | 0 | 390 | 3.6 | 260 | 1 | 0.6111 | 1.0000 |
| 220 | 15 | 29 | 0 | 390 | 3.6 | 260 | 0 | 0.6111 | 0.8333 |
| 220 | 15 | 29 | 0 | 390 | 2.6 | 260 | 0 | 0.6349 | 0.8333 |
| 220 | 15 | 29 | 0 | 390 | 2.6 | 260 | 1 | 0.6111 | 0.8333 |
| 220 | 15 | 29 | 0 | 390 | 2.6 | 260 | 1 | 0.5952 | 0.6667 |
| 220 | 15 | 29 | 0 | 390 | 2.6 | 260 | 0 | 0.5714 | 0.1667 |
| 220 | 15 | 29 | 0 | 450 | 2.6 | 290 | 1 | 0.6349 | 0.3333 |
| 220 | 15 | 29 | 0 | 450 | 2.6 | 290 | 1 | 0.6032 | 0.0000 |
| 220 | 15 | 29 | 0 | 450 | 2.6 | 290 | 1 | 0.5238 | 0.0000 |
| 220 | 15 | 29 | 0 | 450 | 2.6 | 290 | 1 | 0.6508 | 0.0000 |
| 220 | 15 | 29 | 0 | 390 | 3.6 | 290 | 0 | 0.5317 | 0.0000 |
| 220 | 15 | 29 | 0 | 390 | 3.6 | 290 | 0 | 0.5238 | 0.0000 |
| 220 | 15 | 29 | 0 | 390 | 3.6 | 290 | 0 | 0.5317 | 0.8333 |
| 220 | 15 | 29 | 0 | 390 | 3.6 | 290 | 0 | 0.5635 | 0.1667 |
| 220 | 15 | 29 | 1 | 450 | 2.6 | 290 | 1 | 0.6349 | 0.0000 |
| 220 | 15 | 29 | 1 | 450 | 2.6 | 290 | 1 | 0.6349 | 0.0000 |
| 220 | 15 | 29 | 1 | 450 | 2.6 | 290 | 1 | 0.5635 | 0.1667 |
| 220 | 15 | 29 | 1 | 450 | 2.6 | 290 | 1 | 0.7857 | 0.0000 |
| 220 | 15 | 29 | 1 | 390 | 2.6 | 260 | 0 | 0.6349 | 0.3333 |
| 220 | 15 | 29 | 1 | 390 | 2.6 | 260 | 1 | 0.6349 | 0.0000 |
| 220 | 15 | 29 | 1 | 390 | 2.6 | 260 | 0 | 0.8889 | 0.0000 |
| 220 | 15 | 29 | 1 | 390 | 2.6 | 260 | 1 | 0.7222 | 0.1667 |
| 220 | 15 | 29 | 1 | 450 | 2.6 | 260 | 1 | 0.4365 | 0.0000 |
| 220 | 15 | 29 | 1 | 450 | 2.6 | 260 | 1 | 0.6349 | 0.0000 |
| 220 | 15 | 29 | 1 | 450 | 2.6 | 260 | 1 | 0.4444 | 0.5000 |
| 220 | 15 | 29 | 1 | 450 | 2.6 | 260 | 1 | 0.9762 | 0.1667 |
| 220 | 15 | 29 | 1 | 390 | 3.6 | 260 | 0 | 0.6349 | 0.0000 |
| 220 | 15 | 29 | 1 | 390 | 3.6 | 260 | 0 | 0.6349 | 0.0000 |
| 220 | 15 | 29 | 1 | 390 | 3.6 | 260 | 0 | 0.8254 | 0.0000 |
| 220 | 15 | 29 | 1 | 390 | 3.6 | 260 | 0 | 0.7778 | 0.3333 |
| 220 | 15 | 29 | 1 | 450 | 3.6 | 260 | 1 | 0.9841 | 0.1667 |
| 220 | 15 | 29 | 1 | 450 | 3.6 | 260 | 1 | 0.8810 | 0.1667 |
| 220 | 15 | 29 | 1 | 450 | 3.6 | 260 | 0 | 0.8889 | 0.0000 |
| 220 | 15 | 29 | 1 | 450 | 3.6 | 260 | 0 | 0.8413 | 0.0000 |
| 220 | 15 | 29 | 1 | 390 | 2.6 | 290 | 0 | 0.6349 | 0.0000 |
| 220 | 15 | 29 | 1 | 390 | 2.6 | 290 | 0 | 0.6349 | 0.0000 |
| 220 | 15 | 29 | 1 | 390 | 2.6 | 290 | 0 | 0.7778 | 0.1667 |
| 220 | 15 | 29 | 1 | 390 | 2.6 | 290 | 0 | 0.7698 | 0.1667 |
| 220 | 15 | 29 | 1 | 450 | 3.6 | 290 | 1 | 0.9921 | 0.0000 |
| 220 | 15 | 29 | 1 | 450 | 3.6 | 290 | 0 | 1.0000 | 0.0000 |
| 220 | 15 | 29 | 1 | 450 | 3.6 | 290 | 1 | 0.9286 | 0.1667 |
| 220 | 15 | 29 | 1 | 450 | 3.6 | 290 | 0 | 0.9524 | 0.0000 |
| 220 | 15 | 29 | 1 | 390 | 3.6 | 290 | 0 | 0.6349 | 0.0000 |
| 220 | 15 | 29 | 1 | 390 | 3.6 | 290 | 0 | 0.6349 | 0.0000 |
| 220 | 15 | 29 | 1 | 390 | 3.6 | 290 | 0 | 0.5794 | 0.0000 |
| 220 | 15 | 29 | 1 | 390 | 3.6 | 290 | 0 | 0.6508 | 0.0000 |
Table 4.
DOE in cold weather conditions.
| Voltage | Overlap | Weather | Operator | Wedge Sealer Temperature | Speed Sealer | Extruder Temperature | Overheating | Resistance | Gas Leak Tests |
|---|---|---|---|---|---|---|---|---|---|
| 220 | 15 | 9 | 0 | 390 | 2.6 | 290 | 0 | 0.6032 | 0.8333 |
| 220 | 15 | 9 | 0 | 390 | 2.6 | 290 | 0 | 0.6190 | 0.3333 |
| 220 | 15 | 9 | 0 | 450 | 3.6 | 290 | 0 | 0.6905 | 0.1667 |
| 220 | 15 | 9 | 0 | 450 | 3.6 | 290 | 0 | 0.5238 | 0.5000 |
| 220 | 15 | 9 | 0 | 450 | 3.6 | 260 | 0 | 0.6270 | 0.3333 |
| 220 | 15 | 9 | 0 | 450 | 3.6 | 260 | 0 | 0.6984 | 0.3333 |
| 220 | 15 | 9 | 0 | 450 | 2.6 | 260 | 1 | 0.7857 | 0.1667 |
| 220 | 15 | 9 | 0 | 450 | 2.6 | 260 | 1 | 0.6270 | 0.6667 |
| 220 | 15 | 9 | 0 | 390 | 3.6 | 260 | 0 | 0.4286 | 0.1667 |
| 220 | 15 | 9 | 0 | 390 | 3.6 | 260 | 0 | 0.5079 | 1.0000 |
| 220 | 15 | 9 | 0 | 390 | 2.6 | 260 | 0 | 0.5794 | 0.0000 |
| 220 | 15 | 9 | 0 | 390 | 2.6 | 260 | 0 | 0.5238 | 0.1667 |
| 220 | 15 | 9 | 0 | 450 | 2.6 | 290 | 1 | 0.8889 | 0.1667 |
| 220 | 15 | 9 | 0 | 450 | 2.6 | 290 | 0 | 0.9841 | 0.1667 |
| 220 | 15 | 9 | 0 | 390 | 3.6 | 290 | 0 | 0.4841 | 0.0000 |
| 220 | 15 | 9 | 0 | 390 | 3.6 | 290 | 0 | 0.4762 | 1.0000 |
| 220 | 15 | 9 | 1 | 450 | 2.6 | 290 | 0 | 1.0000 | 0.0000 |
| 220 | 15 | 9 | 1 | 450 | 2.6 | 290 | 0 | 0.9683 | 0.0000 |
| 220 | 15 | 9 | 1 | 390 | 2.6 | 260 | 0 | 0.6111 | 0.1667 |
| 220 | 15 | 9 | 1 | 390 | 2.6 | 260 | 0 | 0.5476 | 0.0000 |
| 220 | 15 | 9 | 1 | 450 | 2.6 | 260 | 0 | 0.9683 | 0.0000 |
| 220 | 15 | 9 | 1 | 450 | 2.6 | 260 | 0 | 0.9762 | 0.0000 |
| 220 | 15 | 9 | 1 | 390 | 3.6 | 260 | 0 | 0.6984 | 0.0000 |
| 220 | 15 | 9 | 1 | 390 | 3.6 | 260 | 0 | 0.7540 | 0.0000 |
| 220 | 15 | 9 | 1 | 450 | 3.6 | 260 | 0 | 0.8254 | 0.3333 |
| 220 | 15 | 9 | 1 | 450 | 3.6 | 260 | 0 | 0.8413 | 0.1667 |
| 220 | 15 | 9 | 1 | 390 | 2.6 | 290 | 0 | 0.5556 | 0.1667 |
| 220 | 15 | 9 | 1 | 390 | 2.6 | 290 | 0 | 0.6429 | 0.0000 |
| 220 | 15 | 9 | 1 | 450 | 3.6 | 290 | 0 | 0.6746 | 0.0000 |
| 220 | 15 | 9 | 1 | 450 | 3.6 | 290 | 0 | 0.8810 | 0.0000 |
| 220 | 15 | 9 | 1 | 390 | 3.6 | 290 | 0 | 0.6429 | 0.0000 |
| 220 | 15 | 9 | 1 | 390 | 3.6 | 290 | 0 | 0.6349 | 0.0000 |
Table 5.
DOE in warm weather conditions after arcsine transform.
| Voltage | Overlap | Weather | Operator | Wedge Sealer Temperature | Speed Sealer | Extruder Temperature | Overheating | Resistance | Gas Leak Tests |
|---|---|---|---|---|---|---|---|---|---|
| 220 | 15 | 29 | 0 | 390 | 2.6 | 290 | 0.5235 | 0.9915 | 0.8691 |
| 220 | 15 | 29 | 0 | 450 | 3.6 | 290 | 1.5707 | 0.8191 | 0.3613 |
| 220 | 15 | 29 | 0 | 450 | 3.6 | 260 | 1.0471 | 0.8012 | 0 |
| 220 | 15 | 29 | 0 | 450 | 2.6 | 260 | 1.5707 | 0.9261 | 0.2055 |
| 220 | 15 | 29 | 0 | 390 | 3.6 | 260 | 0.7853 | 0.8933 | 1.2094 |
| 220 | 15 | 29 | 0 | 390 | 2.6 | 260 | 0.7853 | 0.8893 | 0.9117 |
| 220 | 15 | 29 | 0 | 450 | 2.6 | 290 | 1.5707 | 0.8893 | 0.2928 |
| 220 | 15 | 29 | 0 | 390 | 3.6 | 290 | 0 | 0.8231 | 0.5235 |
| 220 | 15 | 29 | 1 | 450 | 2.6 | 290 | 1.570 | 0.9427 | 0.2055 |
| 220 | 15 | 29 | 1 | 390 | 2.6 | 260 | 0.7853 | 1.0134 | 0.3613 |
| 220 | 15 | 29 | 1 | 450 | 2.6 | 260 | 1.5707 | 0.9096 | 0.4205 |
| 220 | 15 | 29 | 1 | 390 | 3.6 | 260 | 0 | 1.0112 | 0.2928 |
| 220 | 15 | 29 | 1 | 450 | 3.6 | 260 | 0.7853 | 1.2470 | 0.2928 |
| 220 | 15 | 29 | 1 | 390 | 2.6 | 290 | 0 | 0.9959 | 0.2928 |
| 220 | 15 | 29 | 1 | 450 | 3.6 | 290 | 0.7853 | 1.3916 | 0.2055 |
| 220 | 15 | 29 | 1 | 390 | 3.6 | 290 | 0 | 0.9117 | 0 |
Table 6.
DOE in cold weather conditions after arcsine transform.
| Voltage | Overlap | Weather | Operator | Wedge Sealer Temperature | Speed Sealer | Extruder Temperature | Overheating | Resistance | Gas Leak Tests |
|---|---|---|---|---|---|---|---|---|---|
| 220 | 15 | 9 | 0 | 390 | 2.6 | 290 | 0 | 0.8974 | 0.8691 |
| 220 | 15 | 9 | 0 | 450 | 3.6 | 290 | 0 | 0.8933 | 0.6154 |
| 220 | 15 | 9 | 0 | 450 | 3.6 | 260 | 0 | 0.9511 | 0.6154 |
| 220 | 15 | 9 | 0 | 450 | 2.6 | 260 | 1.5707 | 0.9981 | 0.7016 |
| 220 | 15 | 9 | 0 | 390 | 3.6 | 260 | 0 | 0.7536 | 0.8691 |
| 220 | 15 | 9 | 0 | 390 | 2.6 | 260 | 0 | 0.8370 | 0.2928 |
| 220 | 15 | 9 | 0 | 450 | 2.6 | 290 | 0.7853 | 1.3160 | 0.4205 |
| 220 | 15 | 9 | 0 | 390 | 3.6 | 290 | 0 | 0.7655 | 0.7853 |
| 220 | 15 | 9 | 1 | 450 | 2.6 | 290 | 0 | 1.4444 | 0 |
| 220 | 15 | 9 | 1 | 390 | 2.6 | 260 | 0 | 0.8651 | 0.2928 |
| 220 | 15 | 9 | 1 | 450 | 2.6 | 260 | 0 | 1.4033 | 0 |
| 220 | 15 | 9 | 1 | 390 | 3.6 | 260 | 0 | 1.0201 | 0 |
| 220 | 15 | 9 | 1 | 450 | 3.6 | 260 | 0 | 1.1502 | 0.5235 |
| 220 | 15 | 9 | 1 | 390 | 2.6 | 290 | 0 | 0.8852 | 0.2928 |
| 220 | 15 | 9 | 1 | 450 | 3.6 | 290 | 0 | 1.0799 | 0 |
| 220 | 15 | 9 | 1 | 390 | 3.6 | 290 | 0 | 0.9261 | 0 |
Table 7.
Optimization of response variables for the first DOE (warm weather).
| Response Variable | Operator | Wedge Sealing Temperature | Sealing Speed | Extruder Temperature |
|---|---|---|---|---|
| Overheating | 1 | 390 °C | 3.6 m/min | 290 °C |
| Resistance | 1 | 450 °C | 3.6 m/min | 290 °C |
| Air test | 1 | 450 °C | 3.6 m/min | 290 °C |
Table 8.
Optimization of response variables for the second DOE (cold weather).
| Response Variable | Operator | Wedge Sealing Temperature | Sealing Speed | Extruder Temperature |
|---|---|---|---|---|
| Overheating | 1 | 450 °C | 3.6 m/min | 290 °C |
| Resistance | 1 | 450 °C | 2.6 m/min | 290 °C |
| Air test | 1 | 450 °C | 3.6 m/min | 290 °C |
Disclaimer/Publisher’s Note: The statements, opinions and data contained in all publications are solely those of the individual author(s) and contributor(s) and not of MDPI and/or the editor(s). MDPI and/or the editor(s) disclaim responsibility for any injury to people or property resulting from any ideas, methods, instructions or products referred to in the content. |
© 2023 by the authors. Licensee MDPI, Basel, Switzerland. This article is an open access article distributed under the terms and conditions of the Creative Commons Attribution (CC BY) license (https://creativecommons.org/licenses/by/4.0/).
Share and Cite
MDPI and ACS Style
Camarena-Martinez, R.; Baeza-Serrato, R.; Lizarraga-Morales, R.A. Optimization of Welding Process of Geomembranes in Biodigesters Using Design of Factorial Experiments. Energies 2023, 16, 6583. https://doi.org/10.3390/en16186583
AMA Style
Camarena-Martinez R, Baeza-Serrato R, Lizarraga-Morales RA. Optimization of Welding Process of Geomembranes in Biodigesters Using Design of Factorial Experiments. Energies. 2023; 16(18):6583. https://doi.org/10.3390/en16186583
Chicago/Turabian StyleCamarena-Martinez, Rocio, Roberto Baeza-Serrato, and Rocio A. Lizarraga-Morales. 2023. "Optimization of Welding Process of Geomembranes in Biodigesters Using Design of Factorial Experiments" Energies 16, no. 18: 6583. https://doi.org/10.3390/en16186583
Note that from the first issue of 2016, this journal uses article numbers instead of page numbers. See further details here.