

Retrofit of a 600 MW Down-Fired Pulverized-Coal Furnace for Low NOx Emission
1
State Key Laboratory of Low-Carbon Smart Coal-Fired Power Generation and Ultra-Clean Emission, Nanjing 210023, China
2
China Energy Science and Technology Research Institute Co., Ltd., Nanjing 210023, China
3
State Key Laboratory of Coal Combustion, Huazhong University of Science and Technology, Wuhan 430074, China
*
Author to whom correspondence should be addressed.
Energies 2023, 16(19), 6837; https://doi.org/10.3390/en16196837
Submission received: 21 August 2023
/
Revised: 10 September 2023
/
Accepted: 12 September 2023
/
Published: 27 September 2023
(This article belongs to the Topic Clean Energy Technologies and Assessment)
Abstract
:Aiming at solving the problem of high NOx emissions of a down-fired boiler, a new combustion system has been proposed by means of the numerical simulation using Ansys Fluent. The coal-lean stream (tertiary air), which was originally mixed with a separated overfired air (SOFA) stream on the front and rear walls of the upper furnace, was relocated to the lower zone of the furnace after retrofit. The secondary-air slots were transformed into a new annular port type, which was injected into the furnace with a down-tilt angle to increase the residence time of the coal stream. Furthermore, the effect of secondary air distribution and velocity of coal stream on performance was studied. After retrofitting the combustion system, the NO emissions were effectively controlled, decreasing from 906 mg Nm−3 to 576 mg Nm−3, but the carbon content of fly ash increased from 2.46% to 5.78%. Aiming at decreasing the carbon content of fly ash, the effect of coal/primary air velocity on the arch was studied. Less carbon content in fly ash can be observed for the lower arch airflow velocity. The results showed that the NO emissions can be controlled below 595 mg Nm−3, and the carbon content of fly ash was reduced to 3.39% when the velocity was decreased to 18 m s−1.
1. Introduction
During coal combustion for electricity, nitrogen oxides can be formed and discharged partially into the atmosphere, causing photochemical pollution and acid rain [1]. Lean coal and anthracite coal are of a relatively high degree of coalification, with a relatively low volatile content and low reactivity, making it relatively difficult to ignite and burn out [2,3,4]. In order to utilize lean coal and anthracite coal efficiently, the down-fired boiler was proposed. The down-fired boiler has a unique advantage of high combustion temperature [5,6], thus lowering carbon content in fly ash but resulting in a higher NOx emission. Presently, four main types of down-fired furnace have been developed, including the Foster Wheeler, the Babcock and Wilcox, the Mitsui Babcock Energy Limited (MBEL) and the Stein down-fired furnace, which have been summarized in other works. The main differences among them are the type of burner, the position of coal-lean and coal-rich streams and the distribution of secondary air [7], which can affect coal combustion behavior and NOx emission significantly.
There have been extensive studies on new technology for the NOx control of down-fired boilers [7,8,9,10,11,12,13,14,15,16]. A stronger reductive atmosphere in the lower zone of the furnace, a larger circulation area near coal/air injection nozzles, a longer residence time of coal particles within a furnace and a proper temperature distribution are essential for the above purpose. Typically, a coal-lean stream separated from the coal-rich stream has a marked effect on the flow field, temperature distribution and oxidative and reductive atmospheres due to the higher content of moisture and the lower temperatures in the coal-lean stream. Thus, the arrangement of coal-lean stream has been studied extensively. Ma et al. [8,9,10] retrofitted the combustion system of a 600 MW down-fired boiler by moving the coal-lean stream on the arch to the front and rear walls in the lower zone of the furnace, and rearranged the F-layer and the over-fired secondary air, which successfully reduced around 50% of NOx emissions and controlled the carbon content in fly ash. Chen et al. [11] carried out a systematic study on the retrofit of the combustion system of a 600 MW down-fired boiler, including the optimal layout of the coal-lean stream, the downward inclination angle of secondary air and the ratio of over-fired air distribution. It was also found that the preferred position of the coal-lean stream was in the front and rear walls in the lower zone of the furnace and a declination of 20° for secondary air showed the best performance. Li et al. [12] studied the effect of the ratio of secondary air and coal-lean stream on the combustion characteristics of a 300 MW down-fired boiler. The result revealed that the ignition distance was reduced from 1.30 to 0.84 m when the secondary air ratio increased from 30.5% to 42.5%. The SOFA has a significant effect on the NOx emission and combustion efficiency of the furnace. Liu et al. [13] studied the influence of over-fired air ratio on the flow field, temperature distribution and component concentration distribution. The results showed that with the increase in the over-fired air ratio, the outlet temperature of furnace, the carbon content in fly ash and the concentration of O2 increased, but the NOx emissions decreased significantly. Ren et al. [14] studied the effect of different over-fire air ratios on the flow field, combustion characteristics and NOx emissions of a 300 MW down-fired FW boiler through numerical simulation, and found that when the over-fire air ratio increased from 0% to 40%, NOx emissions were reduced, but the carbon content of fly ash increased. A well-organized flow field of coal particles can hinder the primary formation of NOx without sacrificing the combustion efficiency of a furnace. Song et al. [7,15,16] had systematically studied the application of multiple-jet-staged combustion technology in the MBEL down-fired boiler, and thoroughly explored the impact of different schemes on the operation of the boiler. The higher velocity of secondary air surrounding the primary coal/air stream can delay the ignition of coal particles. Moreover, the flame center can also be altered by the velocity of secondary air. Wang et al. [17,18,19] studied the effect of a novel swirl burner with an acentric secondary air arrangement of the combustion behavior of a down-fired boiler and found that the circulation area can be enlarged, which was beneficial to the ignition of anthracite coal particles and stable combustion at low load.
Originally, the coal-lean stream was guided into SOFA (so-called vent-to-OFA technology), but proved to be a failure with high NOx emissions and the slagging phenomenon after coal-lean stream injection. To overcome these problems, a new combustion system was proposed in this work by moving tertiary air down to the lower zone of the boiler and mixing with secondary air. Moreover, the air ratio was redistributed and the type of secondary/tertiary air nozzle was redesigned. The speed of the coal/primary coal stream was also optimized to decrease the carbon content in fly ash.
2. Methodology
2.1. Original Combustion System
Figure 1A shows the diagram of the original combustion system. In this system, 36 double-cyclone pulverized coal burners were located on the arch of the furnace. Accordingly, the coal-lean stream was guided out of double-cyclone pulverized coal burners and mixed with SOFA (tertiary overfired air). The coal-rich stream was preheated and injected into the furnace with the assistance of a stream of secondary air. Compared with the traditional pulverized coal burner, the primary coal/air stream was mixed with preheated secondary air in the burner to intensify the ignition (so-called fuel preheat nozzle). C-layer secondary air on the arch was arranged to assist the flow of the coal-rich stream and volatile combustion in the initial stage. The remaining secondary air were horizontally injected into the furnace through the D, E and F slots. The tertiary air/SOFA stream was guided into the furnace with a down-tilt angle of 30°, and a down-tilt angle of 80° was set for double-cyclone pulverized coal burners. The remaining secondary air was horizontally injected into the furnace through D, E and F slots. The original air distribution of the furnace is given in Table 1.
2.2. New Combustion System
For the original combustion system, the NO emission was up to 900–1000 mg Nm−3 due to the unreasonable arrangement of coal-lean stream and secondary air distribution. In the original design, the coal-lean stream was burned in the upper parts of the furnace, resulting in a serious slagging phenomenon in the upper zone. Given the above problems that occurred during the operation, a new combustion system was proposed. The detailed retrofit scheme is described as follows: (1) The original tertiary overfired air nozzles were dismantled and the 72 SOFA nozzles were re-installed. (2) The 36 coal-lean streams were guided into the E-layer with a down-tilt degree of 30°. The outer zone of nozzles was surrounded by secondary air and the inner zone was for the injection of coal-lean stream. (3) The D-layer was removed. (4) The F-layer slots were re-designed as square nozzles with a down-tilt degree of 40°, which improved the rigidity of the flow and penetration depth of coal particles. The double-cyclone pulverized coal burners remained unchanged. Figure 1B presents a schematic diagram of the new combustion system. The guidance of coal-lean stream through the E-layer into the furnace can prevent their combustion in the upper zone of the furnace and prevent incomplete combustion. The D-layer was removed to extend the reductive environment to avoid the primary NOx formation in the outskirt of the burner. The injection of streams at E- and F-layers at a declination angle is beneficial for the penetration of coal stream into the lower position of the furnace, thus resulting in a longer residence time. Table 2 shows the new air distribution after retrofit.
2.3. Numerical Simulation
The proximate analysis and ultimate analysis of pulverized coal used for this furnace are shown in Table 3. It can be seen that the fixed carbon content is more than 80% and the ash content is 26.9%, indicating the coal is a typical anthracite.
The simulation of coal combustion in this furnace was performed by Ansys Fluent. The involved methods and models mainly include the gas-phase turbulent fluid flow (Standard k-ε model [20]), particle movement (stochastic particle method [21]), radiation heat transfer (DO model [22]), coal devolatilization (two-step competition rate model [23]), gas-phase turbulent combustion (mixture fraction/probability density function model [24]), char combustion (diffusion/kinetic model [25,26]) and NOx prediction (Zeldvich mechanism [27]). The prediction of NOx formation was simulated using the post-processing method only considering the contribution of thermal NO and Fuel NO. The formation pathway of Fuel NO can be described by the De Soete mechanism [28]. In this work, it is assumed that the N in the volatile matter is released in the form of HCN and NH3 (HCN/NH3 = 9:1). The N in the char is assumed to be transformed into NO with a conversation rate of 0.32.
3. Results and Discussion
3.1. Verification of Numerical Simulation Reliability
The grid independence verification was initially carried out to ensure the reliability of the geometric model and the grid division scheme. The model was divided into different numbers of cells, including 1.16 million, 2.16 million, 3.01 million, 4.71 million and 5.17 million. The velocity field and the average velocity curve along the height of the furnace is given in Figure 2. It can be seen that the flow field showed good symmetry when the number of cells was 3.01 million, 4.71 million and 5.17 million, respectively. The average velocity distribution overlapped between 4.71 million and 5.17 million cells. Therefore, 4.71 million cells were chosen for the following simulation.
The numerical simulation of the original operation condition is compared with the field experimental result as given in Table 4. The temperature was measured using an infrared thermograph. The NO was measured using a gas analyzer (Testo 350). The carbon content in fly ash is determined by combusting the fly ash sampled using a isokinetic sampling method after the economizer. It can be seen that the simulation result was close to the experimental result, indicating that the meshing method and the model setting method are reasonable.
3.2. Simulation on New Combustion System
Figure 3 shows the particle trajectory diagram and velocity field of the original design and the new combustion system. From the flow field diagram, it can be seen that the coal particle stream was turned upward at around 15 m for the original design due to the injection of secondary air from E and F layers horizontally. Based on the particle trajectory diagram, parts of pulverized coal cannot be effectively lifted for the original design due to the low rigidity of the secondary air from E and F layers. Comparatively, for the new combustion system, the F-layer can effectively lift the coal stream, preventing the coal from entering the slagging discharge port. Moreover, the new combustion system can create a larger recirculation area under the arch. The recirculation area under the arch can suck high-temperature flue gas and promote the combustion of pulverized coal in the initial stage [29].
The temperature distribution of the original system and the new combustion system is given in Figure 4. For the new combustion, it can be seen that the flame moved downward as a whole and the average temperature was higher in the lower zone of the furnace system. All coal particles were combusted in the lower zone of the furnace, thus resulting in a higher average temperature. The two temperature peaks were possibly due to the combustion of coal-lean stream and coal-rich stream, respectively. For the new combustion system, the coal particle stream can penetrate deeper inside the lower zone of the furnace. As a result, more volatiles and char can be burnt in the lower parts of the furnace. Therefore, the average temperature in the lower zone of furnace was increased. Moreover, the circulation zone was enlarged for the new combustion system. The high temperature area of the upper furnace was significantly reduced, which can potentially hinder the occurrence of slagging in the upper furnace.
Figure 5 shows the O2 and CO distribution of the original design and the new combustion system. It can be observed that the average oxygen concentration was lower for the new combustion system due to the better combustion efficiency of coal particles consuming more oxygen than the original system. For the original design, the oxygen concentration was high near the front and back walls, indicating the poor mixing of coal particles with secondary air in the initial stage. Consistent with oxygen and temperature distributions, a higher CO concentration was observed for the areas with less oxygen but higher temperature. Two peaks can be observed for the new combustion system, corresponding to the combustion of coal-lean and coal-rich streams separately.
Figure 6 shows the NO distribution and averaged NO concentration along the furnace height. From the NO distribution graph, it can be seen that a large amount of NO was formed near the tertiary overfired air nozzles for the original design due to the partial combustion of coal in an oxidative atmosphere. Comparatively, the pattern of NO distribution was largely altered for the new combustion system. Only one peak of NO formation can be observed for the new combustion system. In the lower position (<18 m), a higher NO was formed possibly due to the injection of the coal-lean stream, because the coal concentration in the coal-lean stream was much lower. Therefore, a local oxidative atmosphere can promote the formation of NO. With the coal particles moving upward, the NO concentration decreased markedly. For the new combustion system, a stronger reductive atmosphere can be created in the lower zone of the furnace as evidenced by the oxygen and CO distribution. As a result, the formed NO can be reduced into N2 along their pathway. Comparatively, two peaks can be observed for the original system. A large amount of NO was formed near the primary coal/air nozzles due to the combustion of the coal-rich stream. In the original condition, parts of secondary air (C-layer) were introduced into the furnace alone with the primary coal/air mixtures, which is detrimental to NO reduction. Moreover, the primary coal/air stream can be reversed upward due to the smaller circulation area, which can be relatively easily oxidized into NO. In the lower position of the furnace, parts of coal particles encountered the secondary air and were oxidized into NO.
Through the above simulation, the NO emission can be effectively controlled for the new combustion system, reducing from 906 mg Nm−3 to 576 mg Nm−3. After the introduction of the coal-lean stream into the E-layer, the flame center moved downward significantly and the residence time of coal particles within the lower zone of the furnace could be increased. As a result, the oxygen level decreased and the NO reduction effect was promoted. However, this can lead to a higher carbon content in fly ash due to the oxygen-deficient environment [30,31]. For the new combustion system, the carbon content of fly ash increased to 5.78% with respect to 2.46% for the original system. The power plant adopted this new combustion system to meet the NO emission requirement and hindered the coking phenomenon of the upper furnace successfully.
3.3. The Air Distribution of F-Layer and Arch
After moving down the coal-lean stream, the NOx emission could essentially be controlled, but the carbon content in fly ash was still high. In the new combustion system, the secondary air ratio was initially set to 29.5% considering the fact that the ratio of secondary air on the arch can have a great impact on NO and a high ratio of secondary air on the arch may result in a poor NO inhibition effect [32,33]. It is of great significance to study the effect of the ratio of secondary air located on the arch on NO formation. In this part, the ratio of SOFA, tertiary air and E-layer air remained unchanged. Only the secondary air on the arch and F-layer were adjusted to study the effect of deep air-staged combustion. Keeping the total air ratio on the arch and F-layer unchanged, the air ratio on the arch was set to 29.5%, 24.7% and 20%, respectively, as shown in Table 5. To avoid the influence of nozzle velocity, the nozzle velocity was kept constant by changing the size of the nozzle.
Figure 7 shows the temperature distribution for different conditions. It can be observed that the temperature level was lower and more homogeneous at a lower secondary air ratio on the arch. At the condition of a lower secondary air ratio on the arch, the cooling effect can be weakened and the combustion of char and volatiles can be relatively slowly burnt along the pathway [12]. Therefore, the temperature profile was more homogeneous.
The O2 and CO distribution for the original condition and new combustion system are given in Figure 8. The oxygen concentration in the lower zone of the furnace was lower for the condition of the lower secondary air ratio on the arch. Conversely, the CO concentration was larger in the same area. This is because less O2 was available in the lower zone of the furnace for Case-B and Case-C because more secondary air was injected through the F-layer. From this perspective, NO formation can be hindered for the condition of a lower secondary air ratio on the arch.
From the NO distribution in Figure 9, it can be seen that the NO formation in the lower zone of the furnace can be largely hindered for Case-B and Case-C due to the stronger oxygen-deficient environment created by the deep air staging. However, more NO was formed above 20 m for Case-C. Possibly, the burnout rate of char was low for Case-C in the lower zone of the furnace. Therefore, parts of N in char can be released as NO in the oxidative environment of SOFA in this condition.
The simulation results of different working conditions are summarized in Table 6 and drawn in Figure 10. It can be seen that when the secondary air ratio on the arch increased from 20% to 24.7%, the emission of NO decreased markedly, possibly due to the stronger reductive environment. An increasing secondary air ratio on the arch indicates that less secondary air will be provided in the lower zone of the furnace, which can create a local reductive atmosphere forming less NO, as evidenced by the lower O2 and higher CO concentration in the lower zone of the furnace. From Figure 10, it can be seen that the carbon content in fly ash did not increase, indicating that increasing secondary air ratio on the arch from 20% to 24.7% hardly affected the combustion of coal-particle stream in the lower zone of the furnace. However, when the secondary air on the arch was further increased to 29.5%, the NO and carbon contents in fly ash both increased. In this condition, the secondary air ratio in the lower zone of the furnace decreased markedly, which is detrimental to the combustion of coal particles. Therefore, parts of coal will be combusted in the upper zone of the furnace and nitrogen in the unburnt char will be released as NO. The higher carbon content in fly ash also indicted the delayed combustion of coal particles.
3.4. The Influence of Velocity of Arch Airflow
After studying the influence of the air distribution ratio between the arch and F-layer on combustion behavior, the effect of the velocity of arch airflow was further simulated to obtain optimal values. In the above simulation, the velocity of arch airflow was set as 25 m s−1 to maintain the rigidity of the coal-particle stream. The excessively high air velocity may affect the residence time, ignition and the burnout of the pulverized coal in the furnace. Therefore, different velocities of arch airflow of 18, 20, 22, 25 and 28 m s−1 were chosen for the following simulation, while keeping the air distribution ratio unchanged.
Figure 11 shows the temperature distribution at different velocities of arch airflow. It can be seen that the average temperature in the lower zone of the furnace reduced, but increased above the arch. This is because, as the velocity of coal-particle stream increased, the ignition of the coal-particle stream could be delayed. The average temperature was thus decreased in the lower zone of the furnace.
The oxygen and CO distribution at different velocities of arch airflow are given in Figure 12. From the oxygen distribution curve, it can be observed that the averaged oxygen concentration at a higher arch airflow velocity was slightly larger than that at smaller velocity conditions in the lower zone of the furnace, and a reversed trend can be observed for CO in the same zone. In general, more CO and less oxygen were formed at a location above 13 m at lower velocities of arch airflow. In contrast, the CO concentration in the position below 13 m was higher with the increase in arch airflow velocity. This is because the higher the velocity of arch airflow, the more pulverized coal can penetrate deep into the lower position of the furnace and form more CO. At around 20 m, a higher CO concentration can be observed for a lower arch airflow. At a lower arch airflow velocity, more of the coal-particle stream can be burnt near the nozzle, thus creating a stronger reductive atmosphere, showing a better effect on suppressing NO formation [34]. Upon injecting the SOFA into the upper zone of the furnace, the oxygen concentration increased markedly and a final higher oxygen emission could be observed for a higher velocity of arch airflow. It indicates that the utilization of oxygen at a higher arch airflow velocity was weakened, resulting in a poor burnout performance of pulverized coal. Therefore, the lower arch airflow velocity can consume more oxygen and produce more CO and thus a better burnout performance due to the optimal flow field.
The NO concentration distribution at different arch airflow velocities is given in Figure 13. It can be seen that the NO concentration was the highest at around 13 m, possibly due to the combustion of the coal-lean stream in the oxidative atmosphere. At higher arch airflow velocities, more NO was formed at zones below SOFA. This is because more coal particles can penetrate the lower position at higher arch airflow velocities, which can be combusted with the assistance of F-layer air, forming more NO. Comparatively, at lower velocities, more coal particles can be consumed in the higher position of a lower zone of the furnace, thus creating a stronger reductive atmosphere and promoting the reduction in NO. Upon the injection of SOFA, the NO concentration was dropped markedly due to the dilution effect of SOFA. With the continuous combustion of pulverized coal, the NO concentration gradually increased along the furnace height. As the arch airflow velocity decreased from 25 to 18 m s−1, the NO concentration at the outlet showed an upward trend. This indicates that extra NO can be formed upon the injection of SOFA, which is stronger at a lower arch airflow velocity.
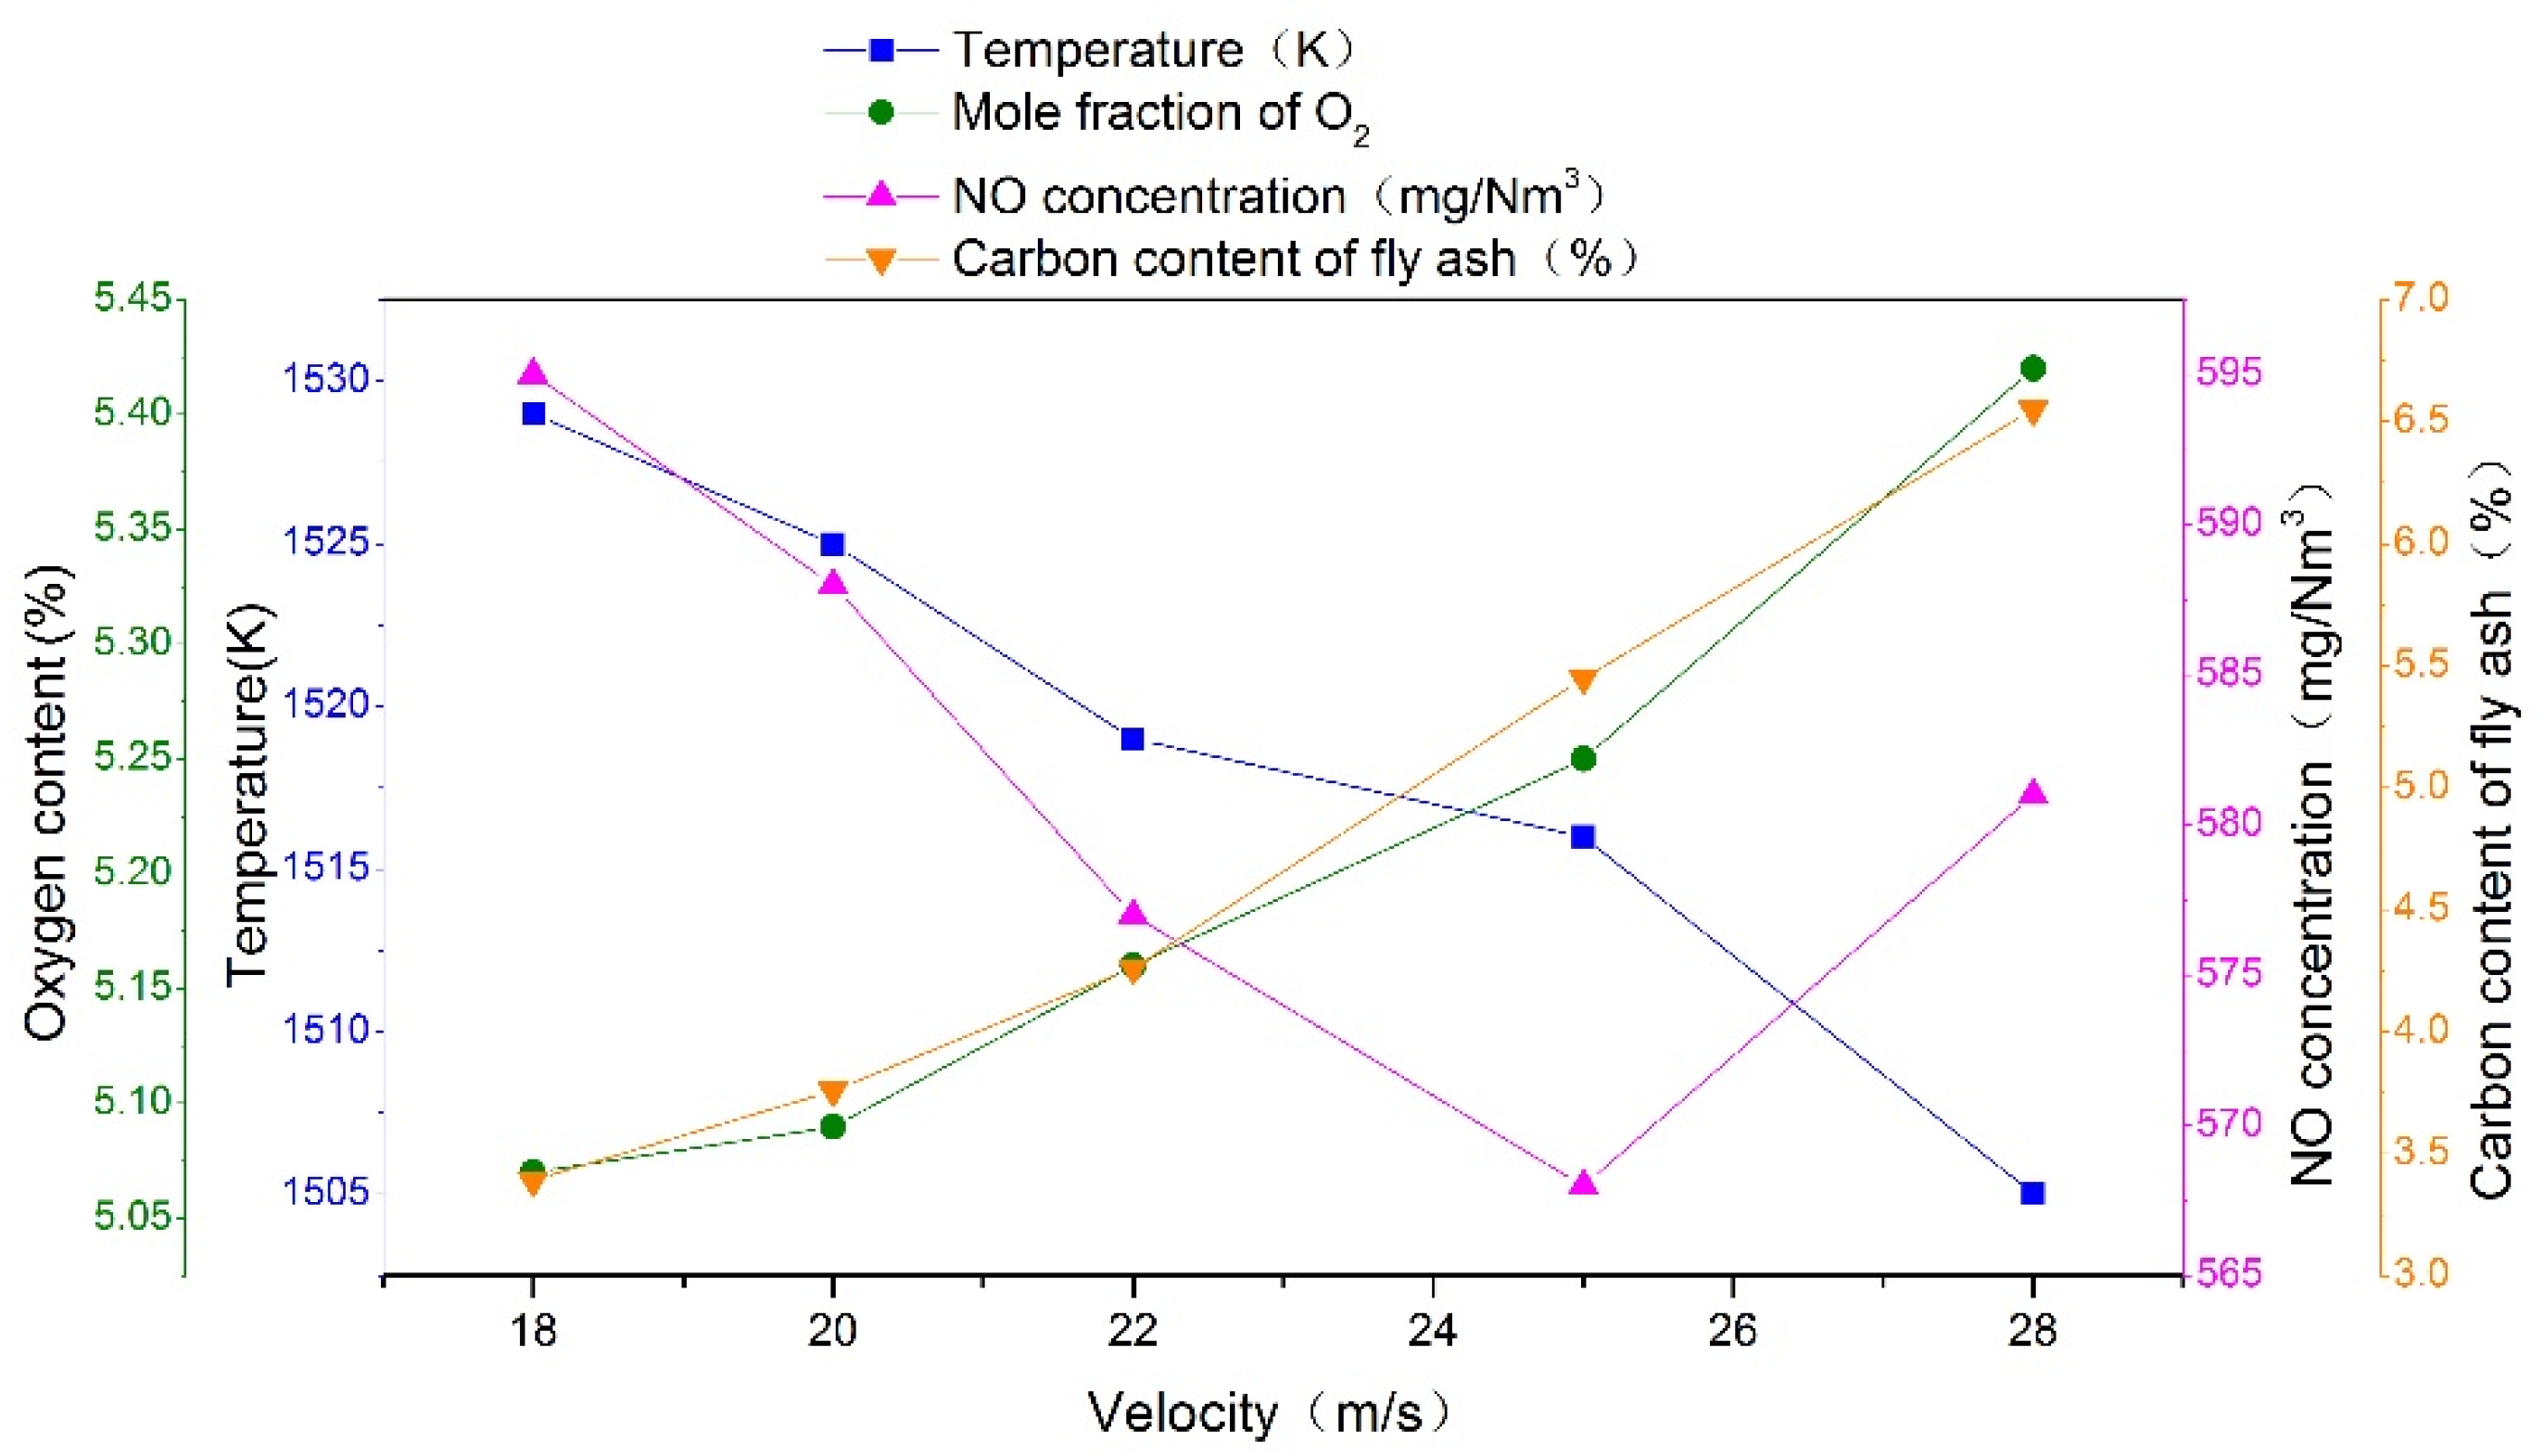
To further understand the effect of arch airflow velocity, the variations of temperature, oxygen, NO and carbon content in fly ash with respect to arch airflow velocity are summarized in Figure 14. In summary, more NO and a higher carbon content in fly ash can be observed at higher arch airflow velocities, but a reduction in temperature and oxygen concentration are seen at the outlet of the furnace. A higher carbon content in fly ash and a higher oxygen concentration, yet with a lower temperature at the outlet of the furnace, indicate a poor combustion efficiency at higher arch airflow velocities. At a higher arch airflow velocity, more of the coal-particles stream can penetrate the lower position of the furnace and be burnt at lower temperatures, which is not conducive to the combustion of pulverized coal [35]. Thus, the carbon content in fly ash increases. Due to the lower combustion extent of char after the SOFA, less N in char can be released as NO, and thus, a lower NO emission occurs at a higher arch airflow velocity.
4. Conclusions
In this work, a new combustion system has been proposed and simulated using Ansys Fluent. The effect of the arrangement of the coal-lean stream, the distribution of secondary air and the velocity of arch airflow on combustion performance were studied. Upon moving the coal-lean stream downward and combining it with E-layer air, the flame center was lowered. Only one NO formation peak could be observed for the new combustion system with respect to two NO formation peaks at the original operating condition due to the stronger reductive atmosphere. As a result, the NO emissions were effectively controlled, decreasing from 906 mg Nm−3 to 576 mg Nm−3, but the carbon content of fly ash increased from 2.46% to 5.78% after a retrofit of the combustion system. Decreasing the secondary air ratio on the arch to 24.7% can decrease carbon content in fly ash and NO emission slightly by creating a stronger reductive atmosphere in the initial stage of combustion. Further, the velocity of arch airflow velocity was also optimized to reveal their effect on combustion behavior. With the increase in velocity, the residence time of coal particles was extended overall, but stayed at a lower temperature zone for a longer time. Therefore, the burnout rate of coal was hindered at a higher arch airflow velocity and more char was consumed after the injection of SOFA, releasing more NO in the oxidative atmosphere.
Author Contributions
Validation, S.W.; Investigation, Z.W.; Resources, T.L.; Supervision, J.Y. All authors have read and agreed to the published version of the manuscript.
Funding
This research was funded by the natinal Key R&D Program of China (2018YFC190104) and The AP was funded by State Key Laboratory of Low-Carbon Smart Coal-Fired Power Generation and Ultra-Clean Emission and China Energy Science and Technology Research Institute Co., Ltd.
Data Availability Statement
The research data can be obtained upon request.
Conflicts of Interest
The authors declare that they have no known competing financial interest or personal relationships that could have appeared to influence the work reported in this paper.
References
- Pui, D.Y.H.; Chen, S.-C.; Zuo, Z. PM 2.5 in China: Measurements, sources, visibility and health effects, and mitigation. Particuology 2014, 13, 1–26. [Google Scholar] [CrossRef]
- Kuang, M.; Li, Z.; Liu, C.; Zhu, Q.; Zhang, Y.; Wang, Y. Evaluation of overfire air behavior for a down-fired 350 MWe utility boiler with multiple injection and multiple staging. Appl. Therm. Eng. 2012, 48, 164–175. [Google Scholar] [CrossRef]
- Li, S.; Chen, Z.; He, E.; Jiang, B.; Li, Z.; Wang, Q. Combustion characteristics and NO x formation of a retrofitted low-volatile coal-fired 330 MW utility boiler under various loads with deep-air-staging. Appl. Therm. Eng. 2017, 110, 223–233. [Google Scholar] [CrossRef]
- Wang, J.; Zhang, R.; Yang, F.; Cheng, F. Numerical simulation on optimization of structure and operating parameters of a novel lean coal decoupling burner. Chin. J. Chem. Eng. 2020, 28, 2890–2899. [Google Scholar] [CrossRef]
- Fang, Q.; Wang, H.; Zhou, H.; Lei, L.; Duan, X. Improving the Performance of a 300 MW Down-Fired Pulverized-Coal Utility Boiler by Inclining Downward the F-Layer Secondary Air. Energy Fuels 2010, 24, 4857–4865. [Google Scholar] [CrossRef]
- Kuang, M.; Li, Z. Review of gas/particle flow, coal combustion, and NOx emission characteristics within down-fired boilers. Energy 2014, 69, 144–178. [Google Scholar] [CrossRef]
- Song, M.; Zeng, L.; Yang, X.; Chen, Z.; Li, Z. Influence of the mass ratio of pulverized-coal in fuel-rich flow to that in fuel-lean flow on the gas/particle flow and particle distribution characteristics in a 600 MWe down-fired boiler. Exp. Therm. Fluid Sci. 2018, 91, 363–373. [Google Scholar] [CrossRef]
- Ma, L.; Fang, Q.; Lv, D.; Zhang, C.; Chen, Y.; Chen, G.; Duan, X.; Wang, X. Reducing NOx Emissions for a 600 MWe Down-Fired Pulverized-Coal Utility Boiler by Applying a Novel Combustion System. Environ. Sci. Technol. 2015, 49, 13040–13049. [Google Scholar] [CrossRef]
- Ma, L.; Fang, Q.; Tan, P.; Zhang, C.; Chen, G.; Lv, D.; Duan, X.; Chen, Y. Effect of the separated overfire air location on the combustion optimization and NO reduction of a 600 MW FW down-fired utility boiler with a novel combustion system. Appl. Energy 2016, 180, 104–115. [Google Scholar] [CrossRef]
- Ma, L.; Yu, S.; Fang, Q.; Zhang, C.; Chen, G. Effect of separated over-fire air angle on combustion and NOx emissions in a down-fired utility boiler with a novel combustion system. Process Saf. Environ. Prot. 2020, 138, 57–66. [Google Scholar] [CrossRef]
- Chen, T.; Zhou, Y.; Wang, B.; Deng, W.; Song, Z.; Li, W.; Yang, W.; Sun, L. Investigations on combustion optimization and NOX reduction of a 600-MWe down-fired boiler: Influence of rearrangement of tertiary air and jet angle of secondary air and separated over-fire air. J. Clean. Prod. 2020, 277, 124310. [Google Scholar] [CrossRef]
- Li, X.; Zeng, L.; Liu, H.; Du, H.; Yang, X.; Han, H.; Liu, W.; Zhang, S.; Song, M.; Chen, Z.; et al. Numerical simulation study on the influences of the secondary-tertiary air proportion on the airflow mixing effects and pulverized coal combustion characteristics in a 300-MW down-fired boiler. Process Saf. Environ. Prot. 2019, 130, 326–343. [Google Scholar] [CrossRef]
- Liu, G.; Chen, Z.; Li, Z.; Li, G.; Zong, Q. Numerical simulations of flow, combustion characteristics, and NO x emission for down-fired boiler with different arch-supplied over-fire air ratios. Appl. Therm. Eng. 2015, 75, 1034–1045. [Google Scholar] [CrossRef]
- Ren, F.; Li, Z.; Zeng, L.; Chen, Z.; Zhu, Q. Numerical Simulation of Flow, Combustion, and NOxEmission Characteristics in a 300 MW Down-Fired Boiler with Different OFA Ratios. Numer. Heat Transf. Part A Appl. 2012, 62, 231–249. [Google Scholar] [CrossRef]
- Song, M.; Zeng, L.; Li, X.; Liu, Y.; Chen, Z.; Li, Z. Effects of tertiary air damper opening on flow, combustion and hopper near-wall temperature of a 600 MWe down-fired boiler with improved multiple-injection multiple-staging technology. J. Energy Inst. 2018, 91, 573–583. [Google Scholar] [CrossRef]
- Song, M.; Zeng, L.; Zhao, Y.; Pei, J.; Li, Z. Secondary air distribution in a 600 MWe multi-injection multi-staging down-fired boiler: A comprehensive study. J. Energy Inst. 2020, 93, 1250–1260. [Google Scholar] [CrossRef]
- Wang, Q.; Chen, Z.; Han, H.; Tu, Y.; Liu, G.; Zeng, L.; Li, Z. Detailed gas/particle flow characteristics of an improved down-fired boiler with respect to a critical factor affecting coal burnout: Vent-air inclination angle. Energy 2019, 182, 570–584. [Google Scholar] [CrossRef]
- Wang, Q.; Chen, Z.; Han, H.; Zeng, L.; Li, Z. Experimental characterization of anthracite combustion and NO emission for a 300-MWe down-fired boiler with a novel combustion system: Influence of primary and vent air distributions. Appl. Energy 2019, 238, 1551–1562. [Google Scholar] [CrossRef]
- Wang, Q.; Chen, Z.; Li, L.; Zeng, L.; Li, Z. Achievement in ultra-low-load combustion stability for an anthracite- and down-fired boiler after applying novel swirl burners: From laboratory experiments to industrial applications. Energy 2020, 192, 116623. [Google Scholar] [CrossRef]
- Launder, B.E.; Spalding, D.B. The numerical computation of turbulent flows. Comput. Methods Appl. Mech. Eng. 1974, 3, 269–289. [Google Scholar] [CrossRef]
- Fang, Q.; Musa, A.A.B.; Wei, Y.; Luo, Z.; Zhou, H. Numerical Simulation of Multifuel Combustion in a 200 MW Tangentially Fired Utility Boiler. Energy Fuels 2011, 26, 313–323. [Google Scholar] [CrossRef]
- Truelove, J.S. Three-dimensional radiation in absorbing-emitting-scattering media using the discrete-ordinates approximation. J. Quant. Spectrosc. Radiat. Transf. 1988, 39, 27–31. [Google Scholar] [CrossRef]
- Kobayashi, H.; Howard, J.B.; Sarofim, A.F. Coal devolatilization at high temperatures. Symp. Int. Combust. 1977, 16, 411–425. [Google Scholar] [CrossRef]
- Sivathanu, Y.R.; Faeth, G.M. Generalized state relationships for scalar properties in nonpremixed hydrocarbon/air flames. Combust. Flame 1990, 82, 211–230. [Google Scholar] [CrossRef]
- Baum, M.M.; Street, P.J. Predicting the Combustion Behaviour of Coal Particles. Combust. Sci. Technol. 1971, 3, 231–243. [Google Scholar] [CrossRef]
- Field, M.A. Rate of combustion of size-graded fractions of char from a low-rank coal between 1 200 °K and 2 000 °K. Combust. Flame 1969, 13, 237–252. [Google Scholar] [CrossRef]
- Ma, L.; Gharebaghi, M.; Porter, R.; Pourkashanian, M.; Jones, J.M.; Williams, A. Modelling methods for co-fired pulverised fuel furnaces. Fuel 2009, 88, 2448–2454. [Google Scholar] [CrossRef]
- De Soete, G.G. Overall reaction rates of NO and N2 formation from fuel nitrogen. Symp. Int. Combust. 1975, 15, 1093–1102. [Google Scholar] [CrossRef]
- Ma, L.; Fang, Q.; Yin, C.; Zhong, L.; Zhang, C.; Chen, G. More efficient and environmentally friendly combustion of low-rank coal in a down-fired boiler by a simple but effective optimization of staged-air windbox. Fuel Process. Technol. 2019, 194, 106118. [Google Scholar] [CrossRef]
- Zha, Q.; Li, D.; Wang, C.a.; Che, D. Numerical evaluation of heat transfer and NO x emissions under deep-air-staging conditions within a 600 MW e tangentially fired pulverized-coal boiler. Appl. Therm. Eng. 2017, 116, 170–181. [Google Scholar] [CrossRef]
- Li, D.; Lv, Q.; Feng, Y.; Wang, C.a.; Liu, X.; Chen, K.; Xu, K.; Zhong, J.; Che, D. Effects of Coal Blending and Operating Conditions on Combustion and NO x Emission Characteristics in a Tangentially-fired Utility Boiler. Energy Procedia 2017, 105, 4015–4020. [Google Scholar] [CrossRef]
- Wang, Q.; Chen, Z.; Wang, J.; Zeng, L.; Zhang, X.; Li, X.; Li, Z. Effects of secondary air distribution in primary combustion zone on combustion and NO emissions of a large-scale down-fired boiler with air staging. Energy 2018, 165, 399–410. [Google Scholar] [CrossRef]
- Wang, Y.; Zhou, Y. Numerical optimization of the influence of multiple deep air-staged combustion on the NOx emission in an opposed firing utility boiler using lean coal. Fuel 2020, 269, 116996. [Google Scholar] [CrossRef]
- Choi, M.; Park, Y.; Li, X.; Kim, K.; Sung, Y.; Hwang, T.; Choi, G. Numerical evaluation of pulverized coal swirling flames and NOx emissions in a coal-fired boiler: Effects of co- and counter-swirling flames and coal injection modes. Energy 2021, 217, 119439. [Google Scholar] [CrossRef]
- Tan, P.; Tian, D.; Fang, Q.; Ma, L.; Zhang, C.; Chen, G.; Zhong, L.; Zhang, H. Effects of burner tilt angle on the combustion and NOX emission characteristics of a 700 MWe deep-air-staged tangentially pulverized-coal-fired boiler. Fuel 2017, 196, 314–324. [Google Scholar] [CrossRef]
Figure 1.
Schematic diagram of original and new combustion systems. (A) Original system; (B) New system.
Figure 1.
Schematic diagram of original and new combustion systems. (A) Original system; (B) New system.
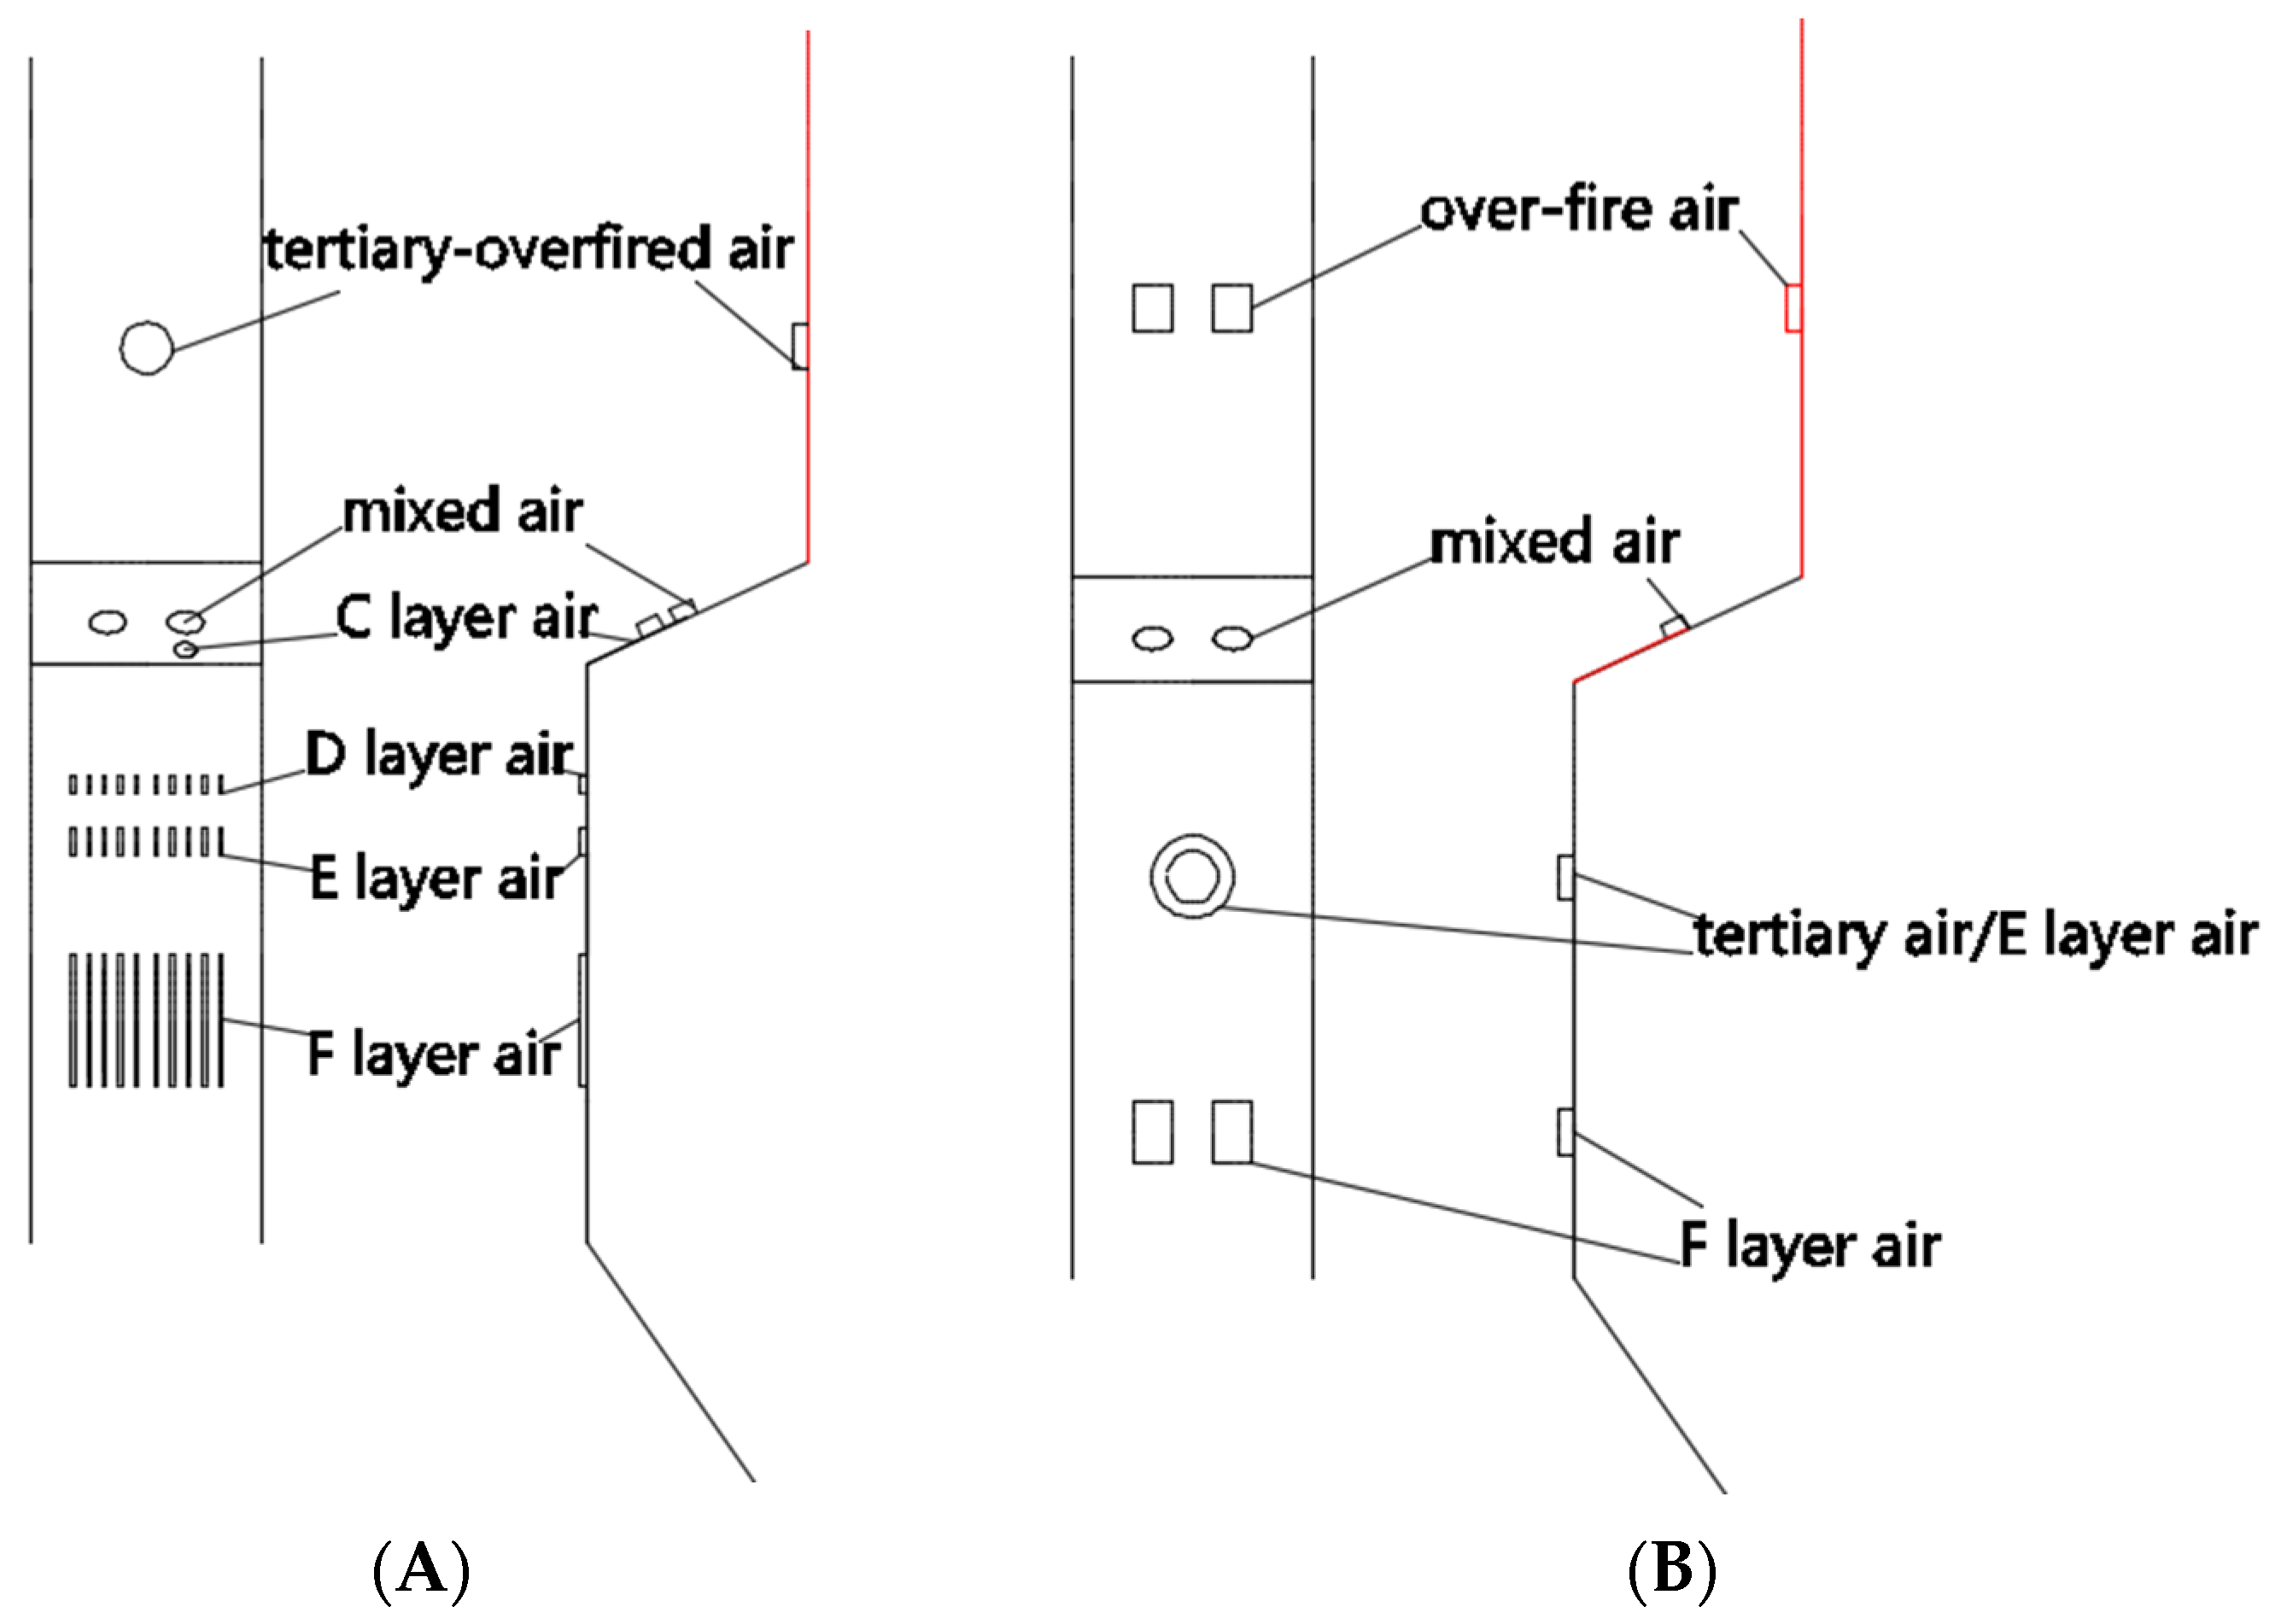
Figure 2.
Flow field and average velocity curve along the height of furnace. (A) 1.16 million; (B) 2.16 million; (C) 3.01 million; (D) 4.71 million; (E) 5.17 million.
Figure 2.
Flow field and average velocity curve along the height of furnace. (A) 1.16 million; (B) 2.16 million; (C) 3.01 million; (D) 4.71 million; (E) 5.17 million.
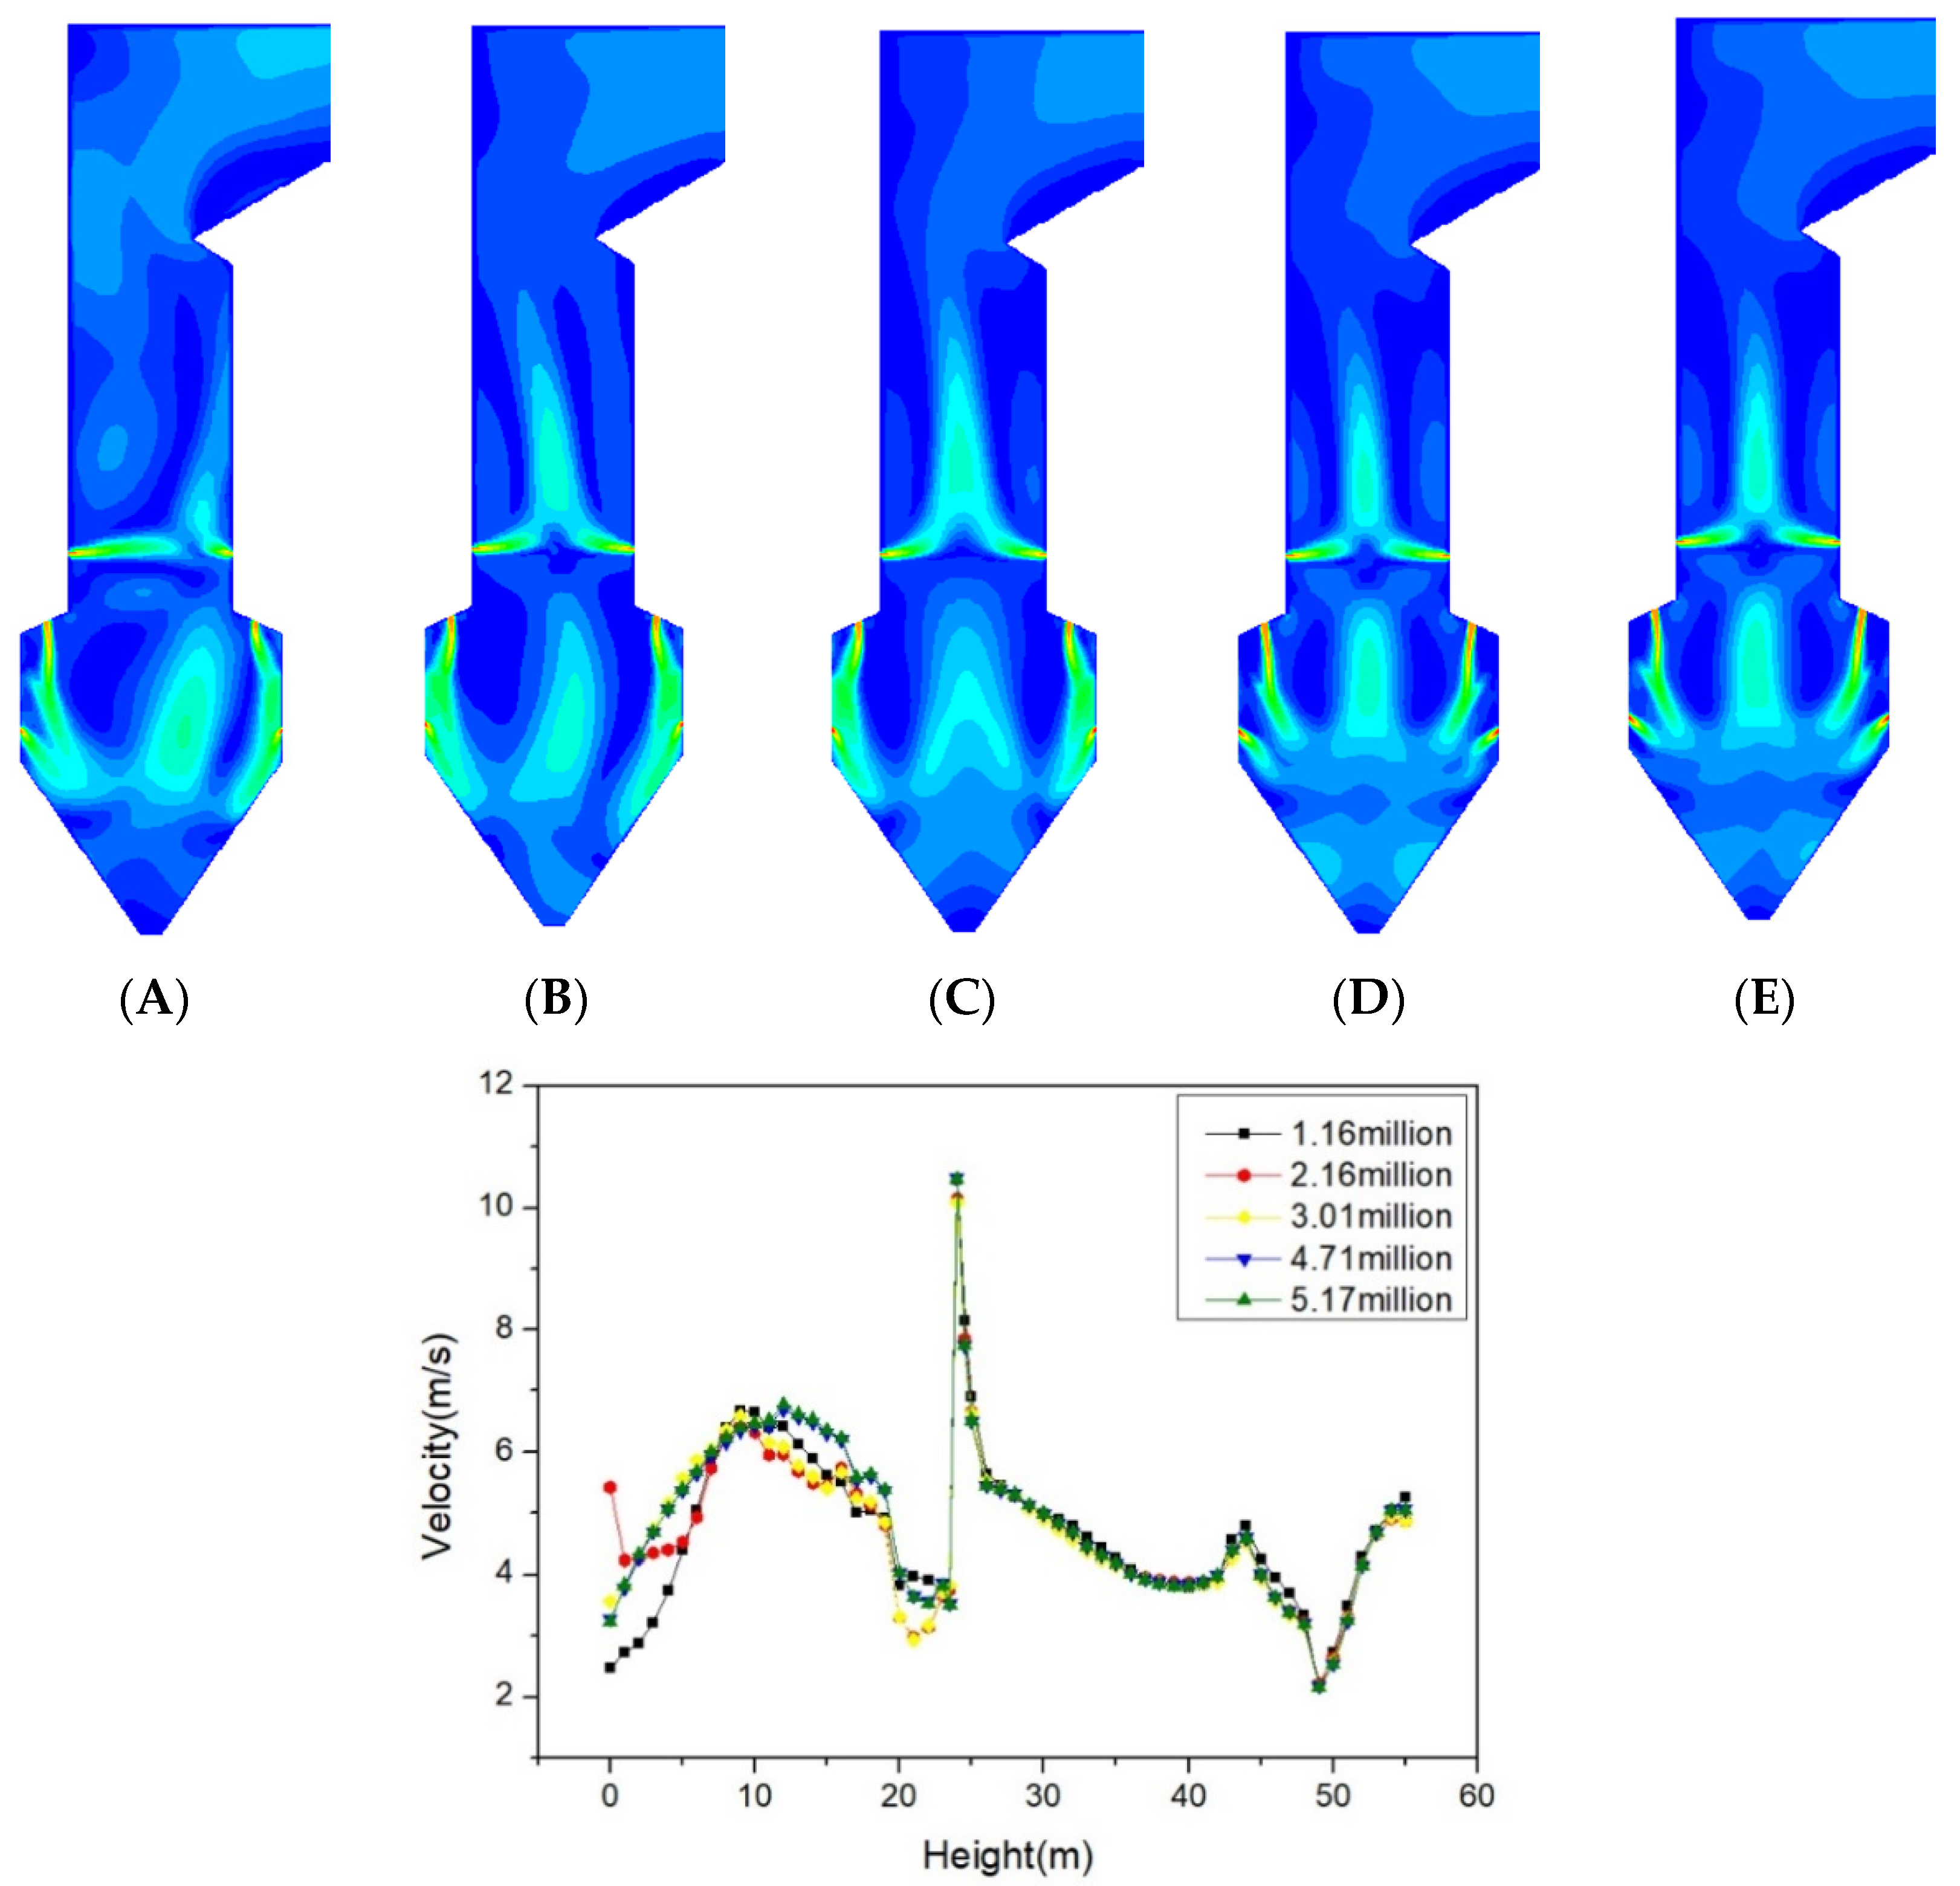
Figure 3.
Particle trajectory diagram: (a) Original operating condition; (b) New combustion system. Flow field diagram: (c) Original operating condition; (d) New combustion system.
Figure 3.
Particle trajectory diagram: (a) Original operating condition; (b) New combustion system. Flow field diagram: (c) Original operating condition; (d) New combustion system.
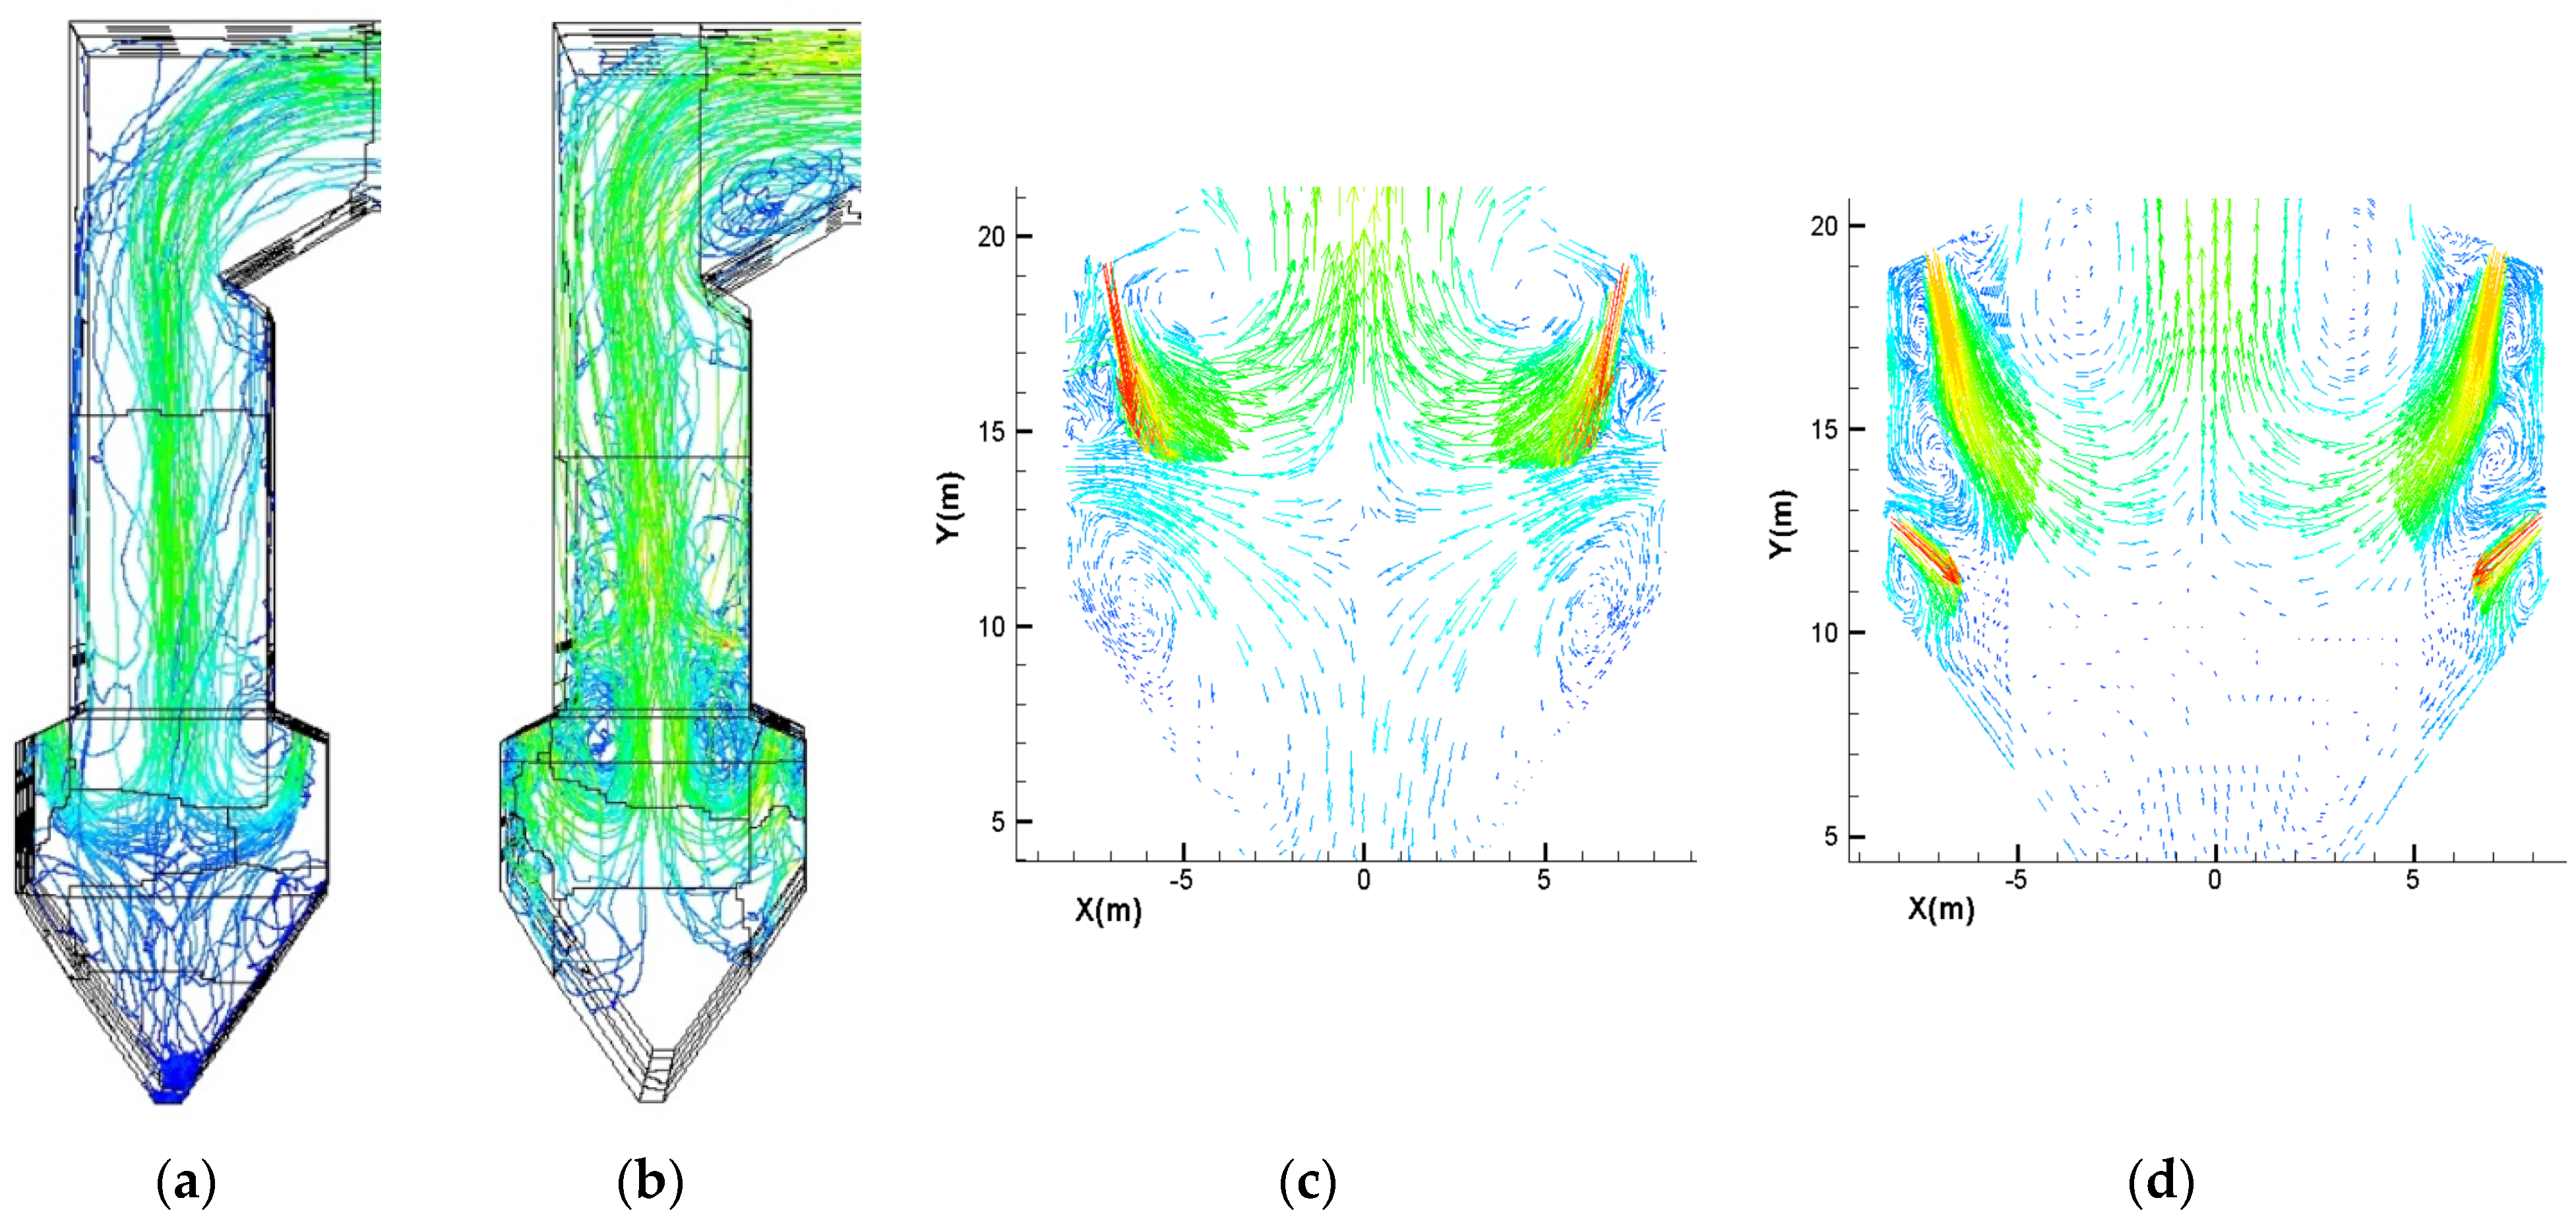
Figure 4.
Temperature distribution and temperature evolution: (a) Original operating condition; (b) New combustion system; (c) Averaged temperature evolution with furnace height alone.
Figure 4.
Temperature distribution and temperature evolution: (a) Original operating condition; (b) New combustion system; (c) Averaged temperature evolution with furnace height alone.
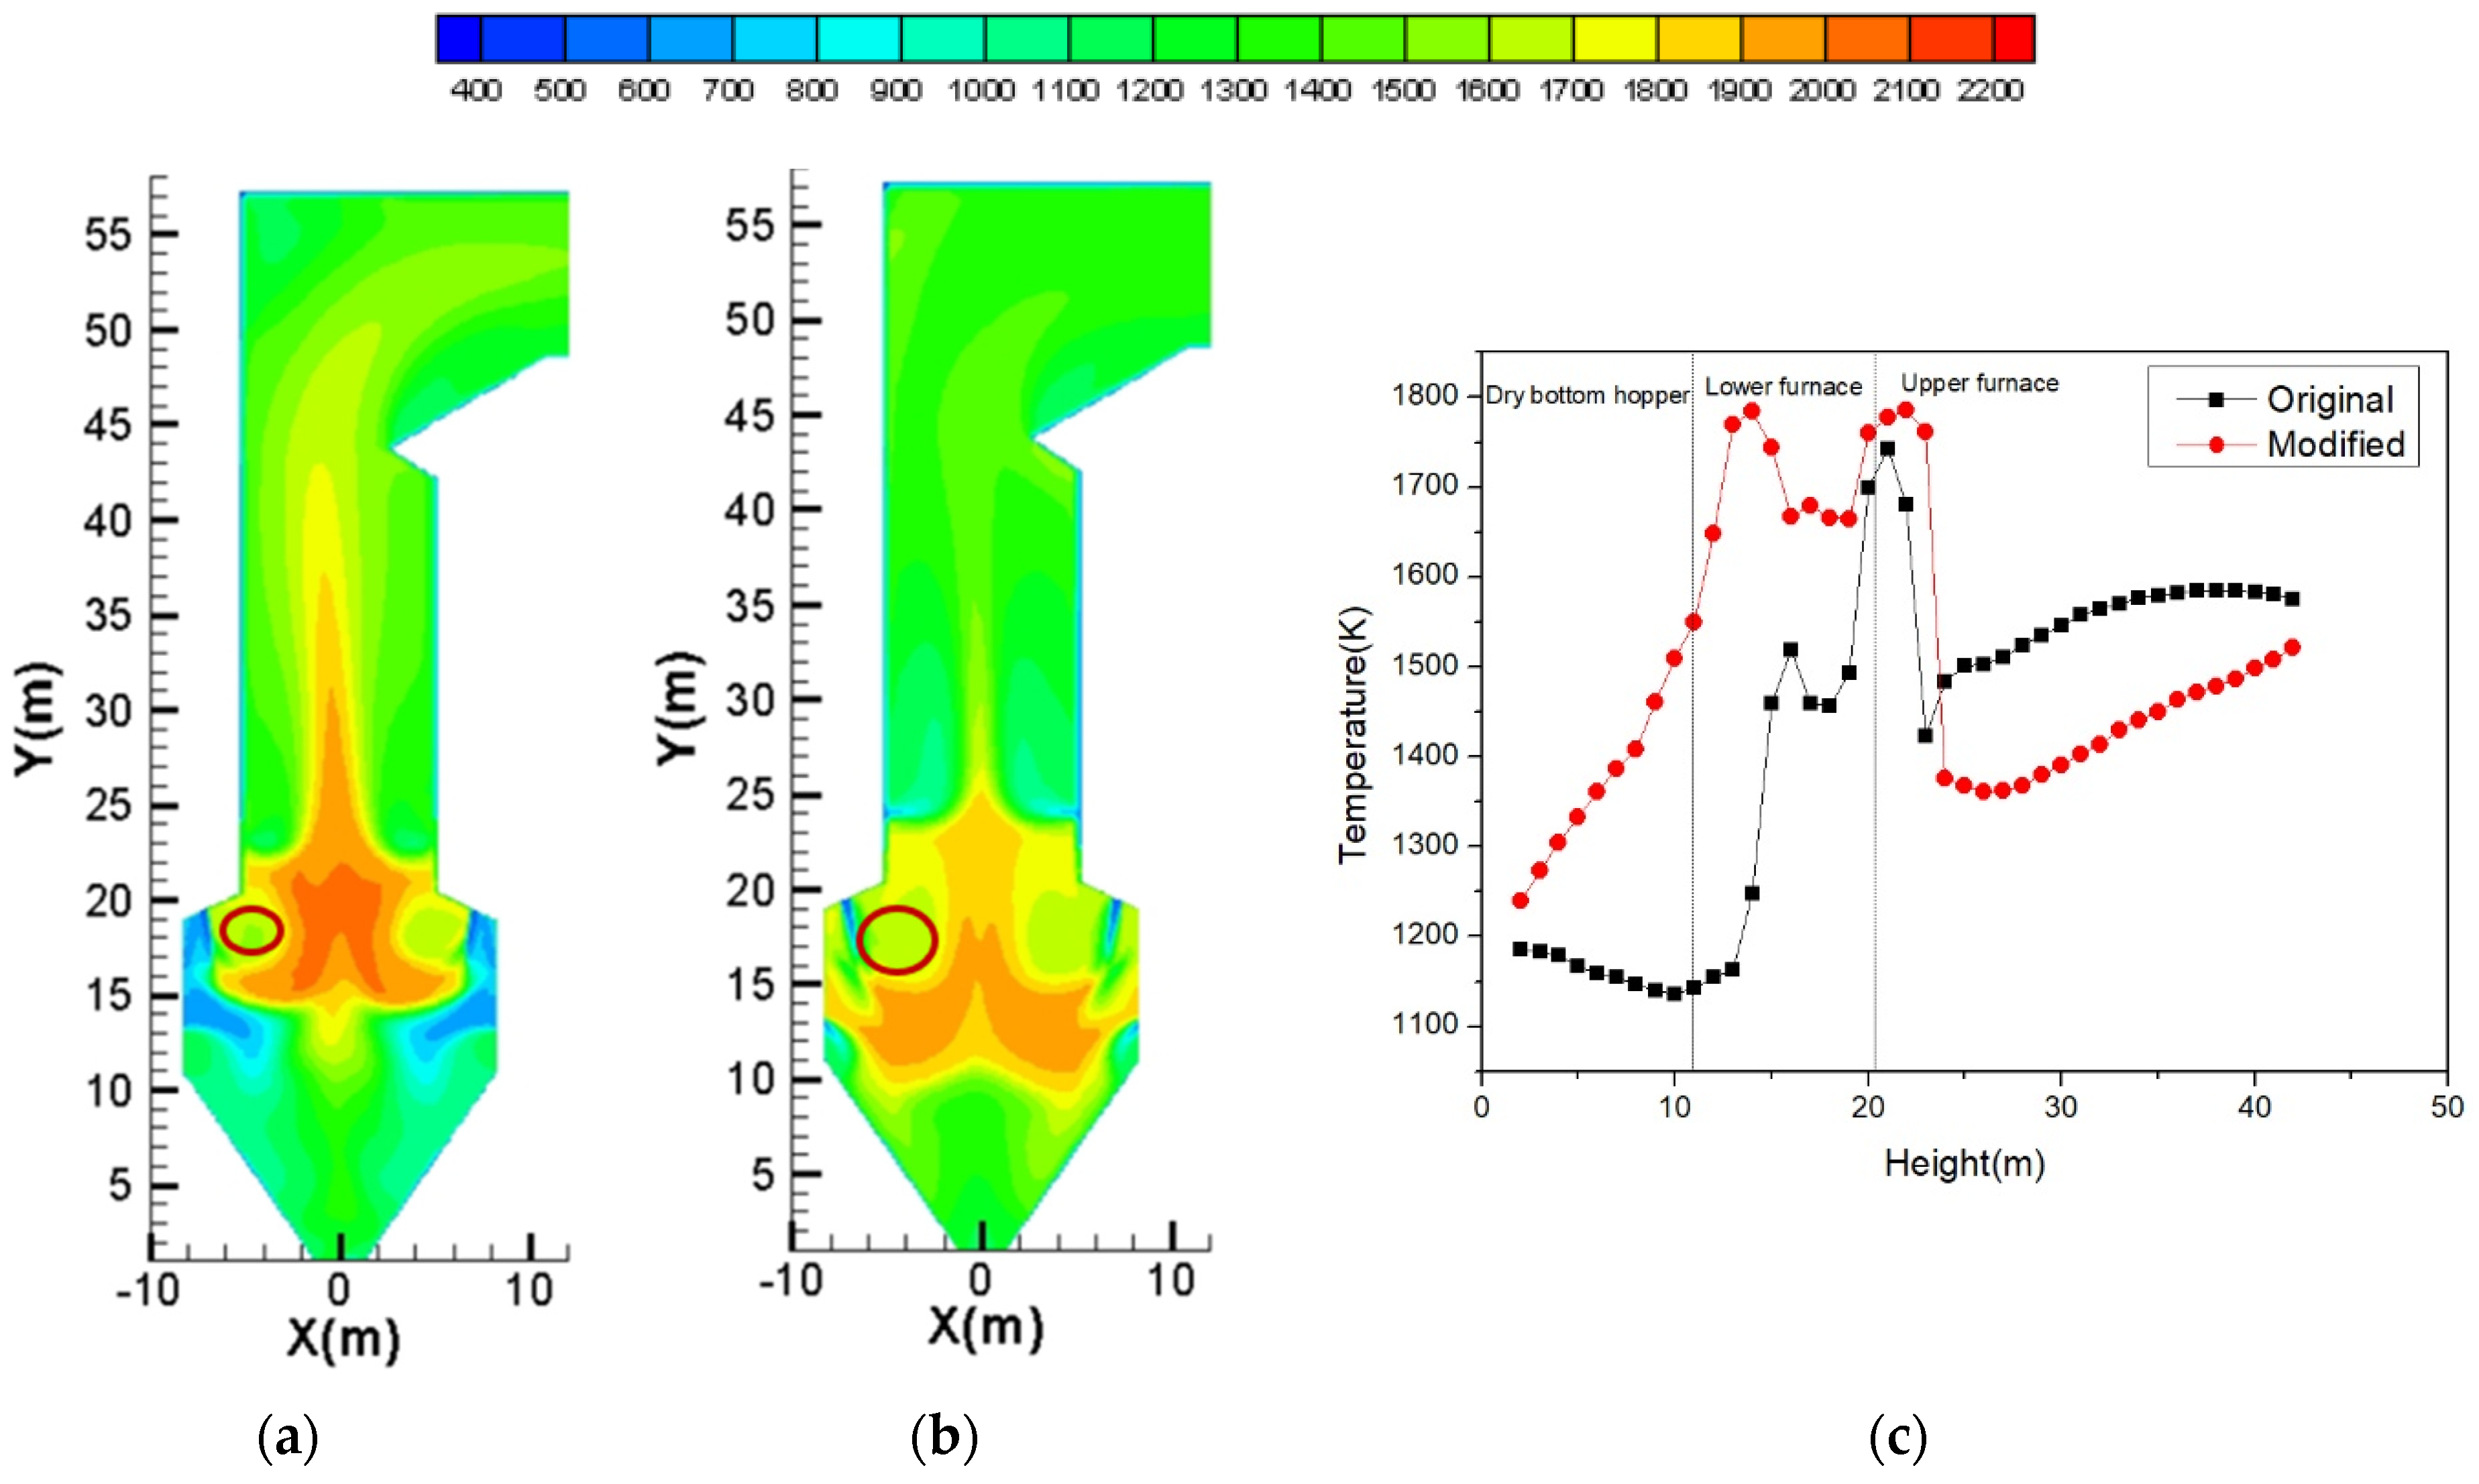
Figure 5.
O2 distribution: (a) Original operating condition; (b) New combustion system; (c) Averaged O2 evolution with furnace height alone. CO distribution: (d) Original operating condition; (e) New combustion system; (f) Averaged CO evolution with furnace height alone.
Figure 5.
O2 distribution: (a) Original operating condition; (b) New combustion system; (c) Averaged O2 evolution with furnace height alone. CO distribution: (d) Original operating condition; (e) New combustion system; (f) Averaged CO evolution with furnace height alone.

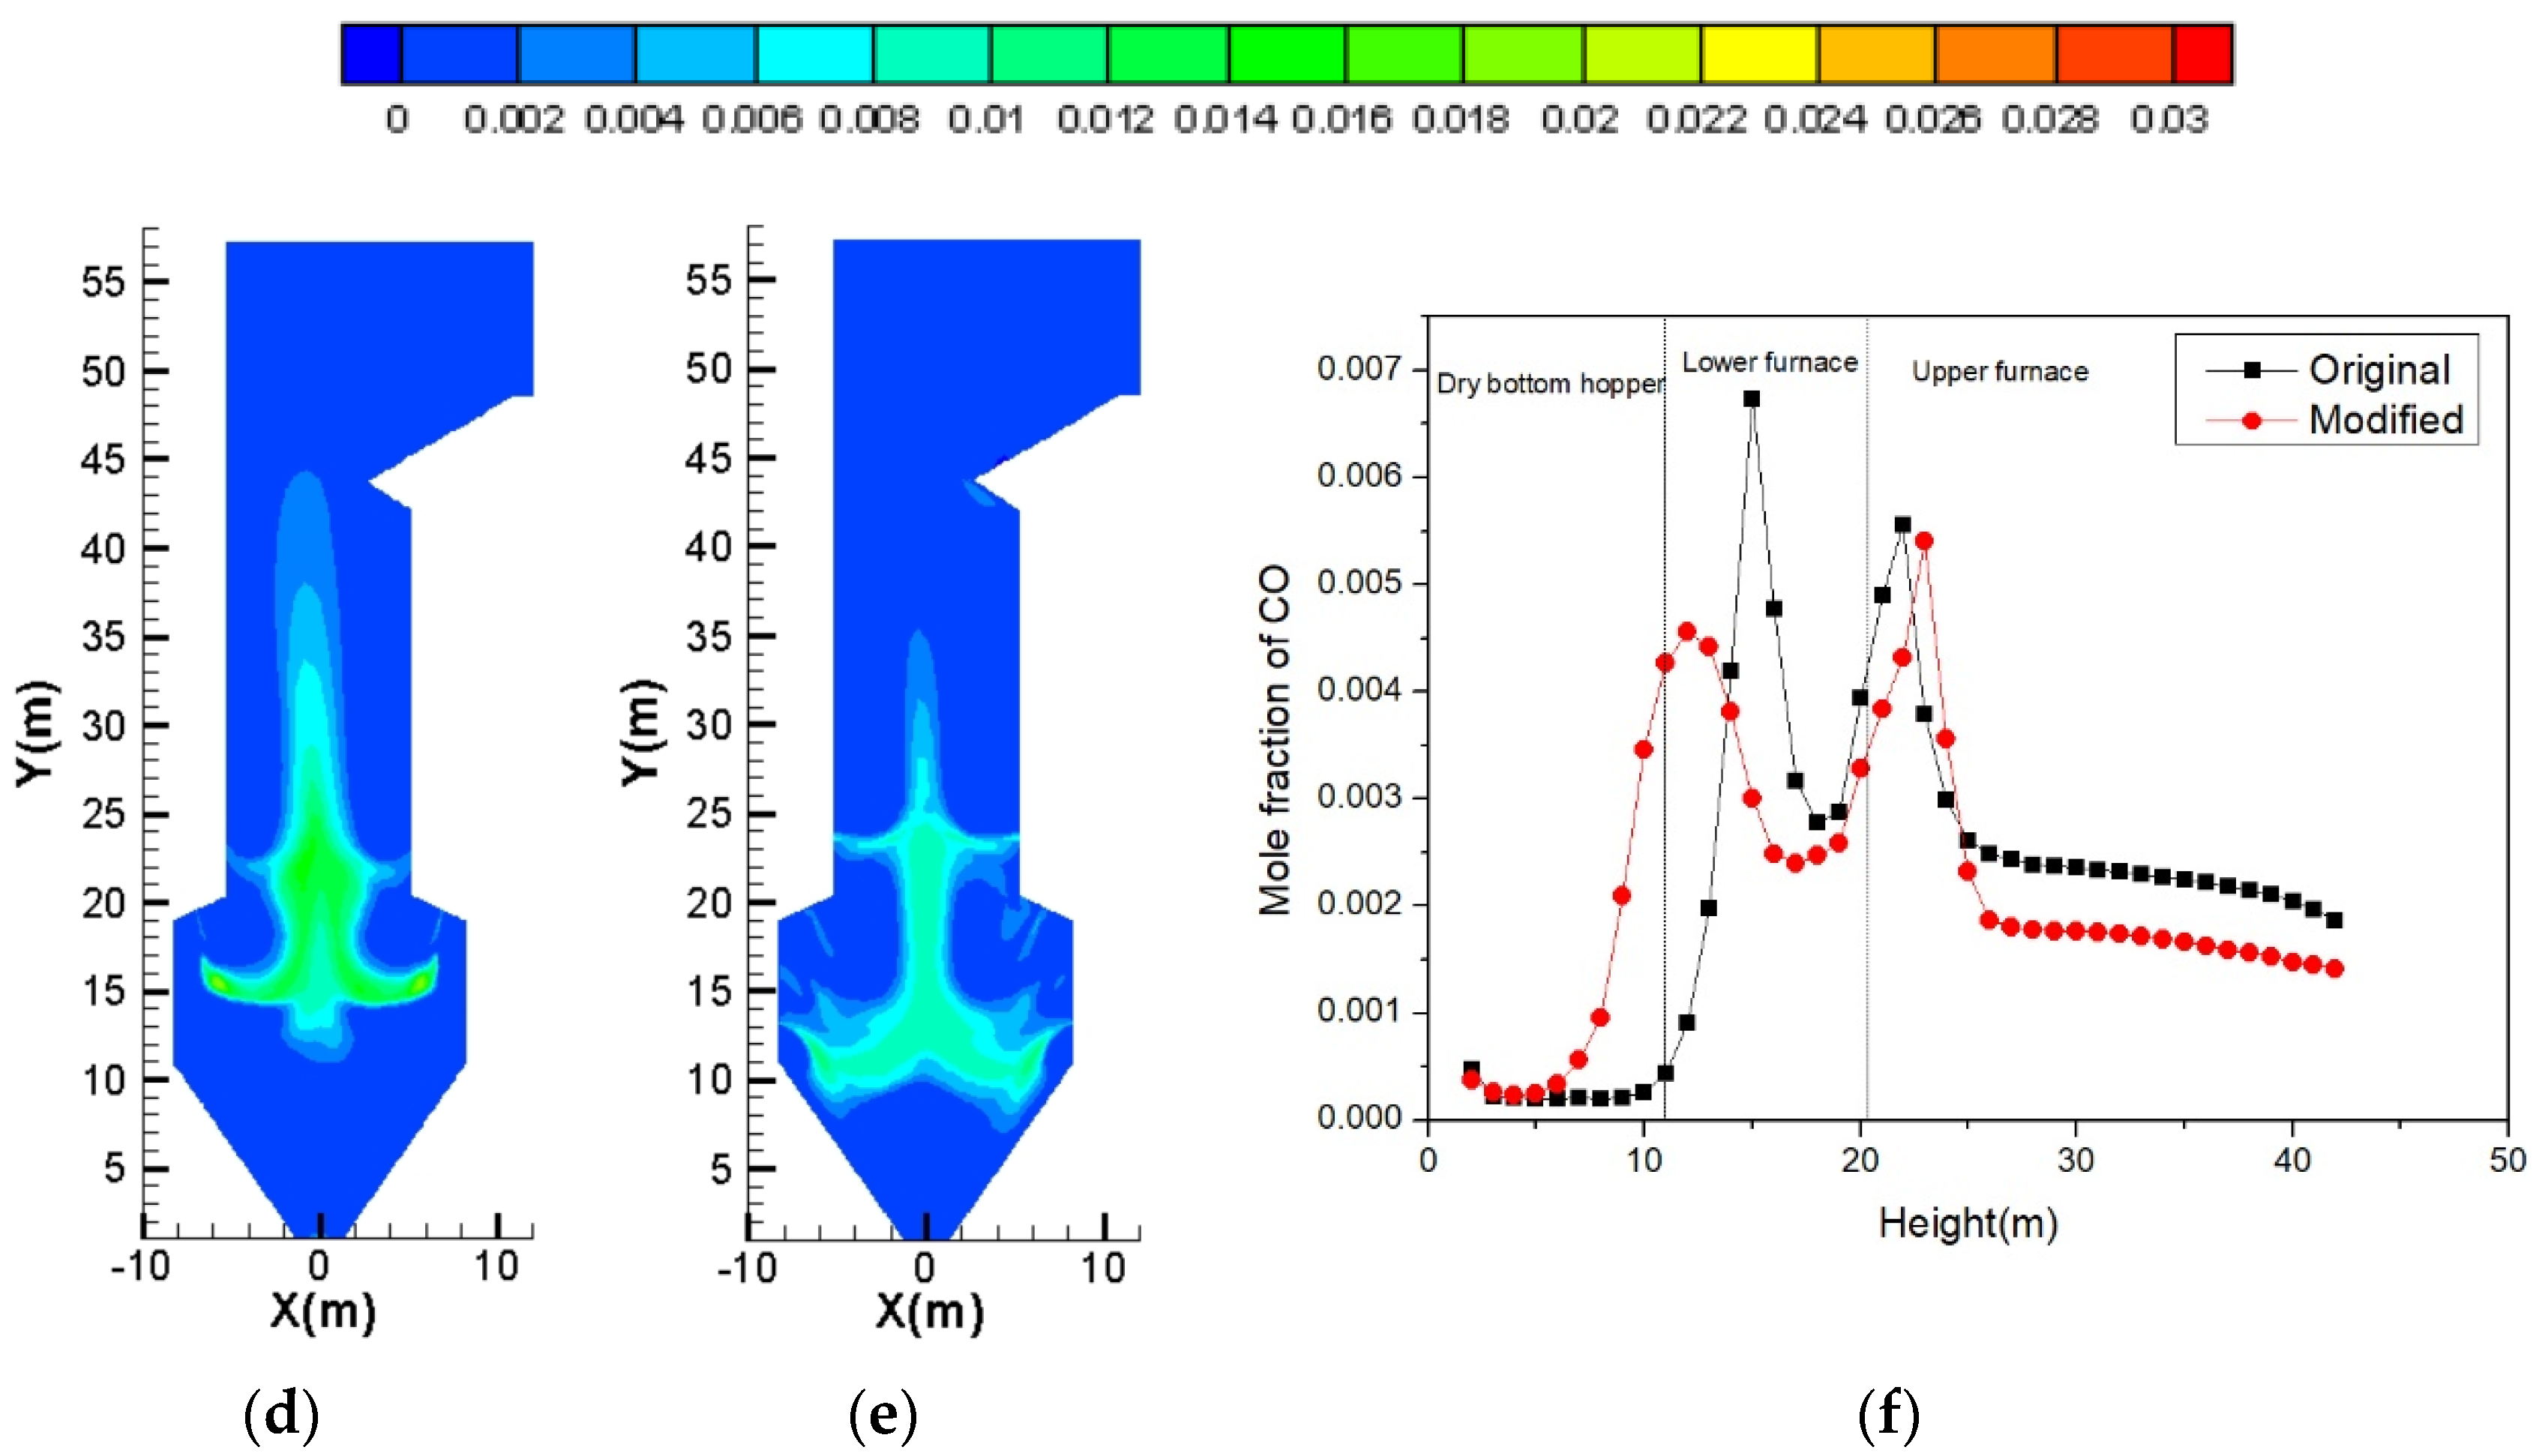
Figure 6.
NO concentration diagram and averaged NO concentration curve: (a) Original operating condition; (b) New combustion system; (c) Averaged NO concentration with furnace height alone.
Figure 6.
NO concentration diagram and averaged NO concentration curve: (a) Original operating condition; (b) New combustion system; (c) Averaged NO concentration with furnace height alone.
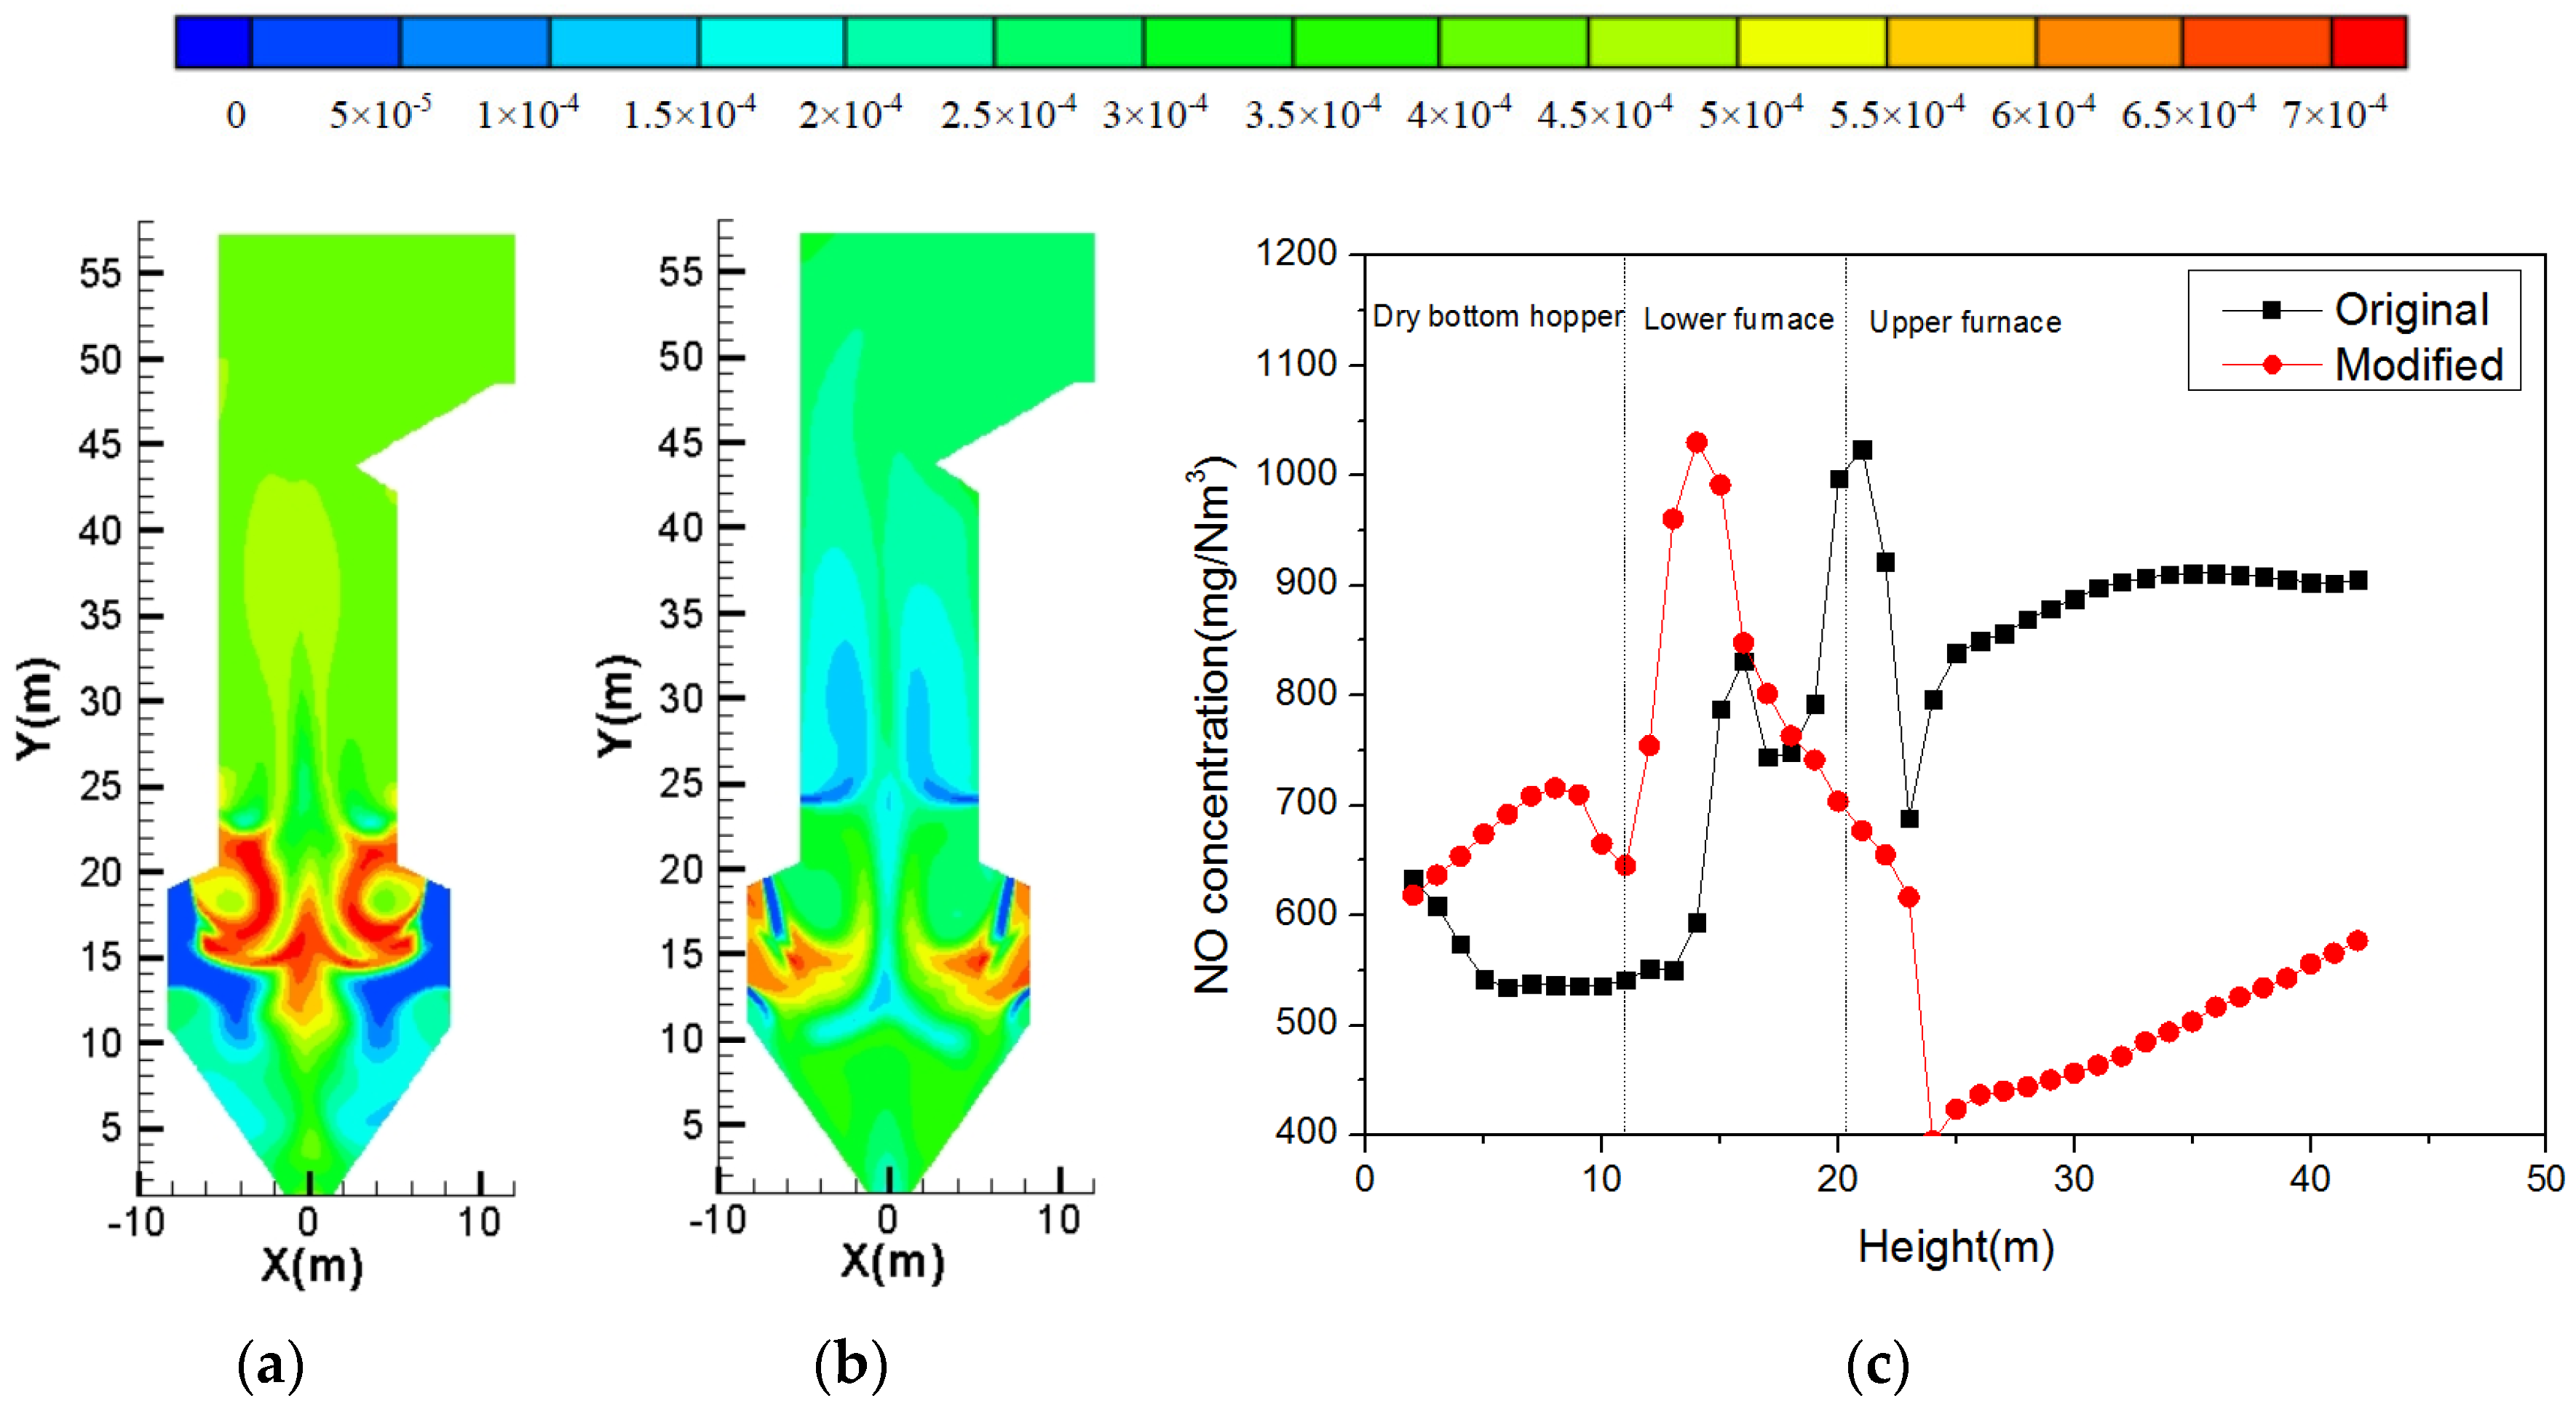
Figure 7.
Temperature distribution diagram: (a) Secondary air ratio on arch, 29.5%; (b) Secondary air ratio on arch, 24.7%; (c) Secondary air ratio on arch, 20%.
Figure 7.
Temperature distribution diagram: (a) Secondary air ratio on arch, 29.5%; (b) Secondary air ratio on arch, 24.7%; (c) Secondary air ratio on arch, 20%.
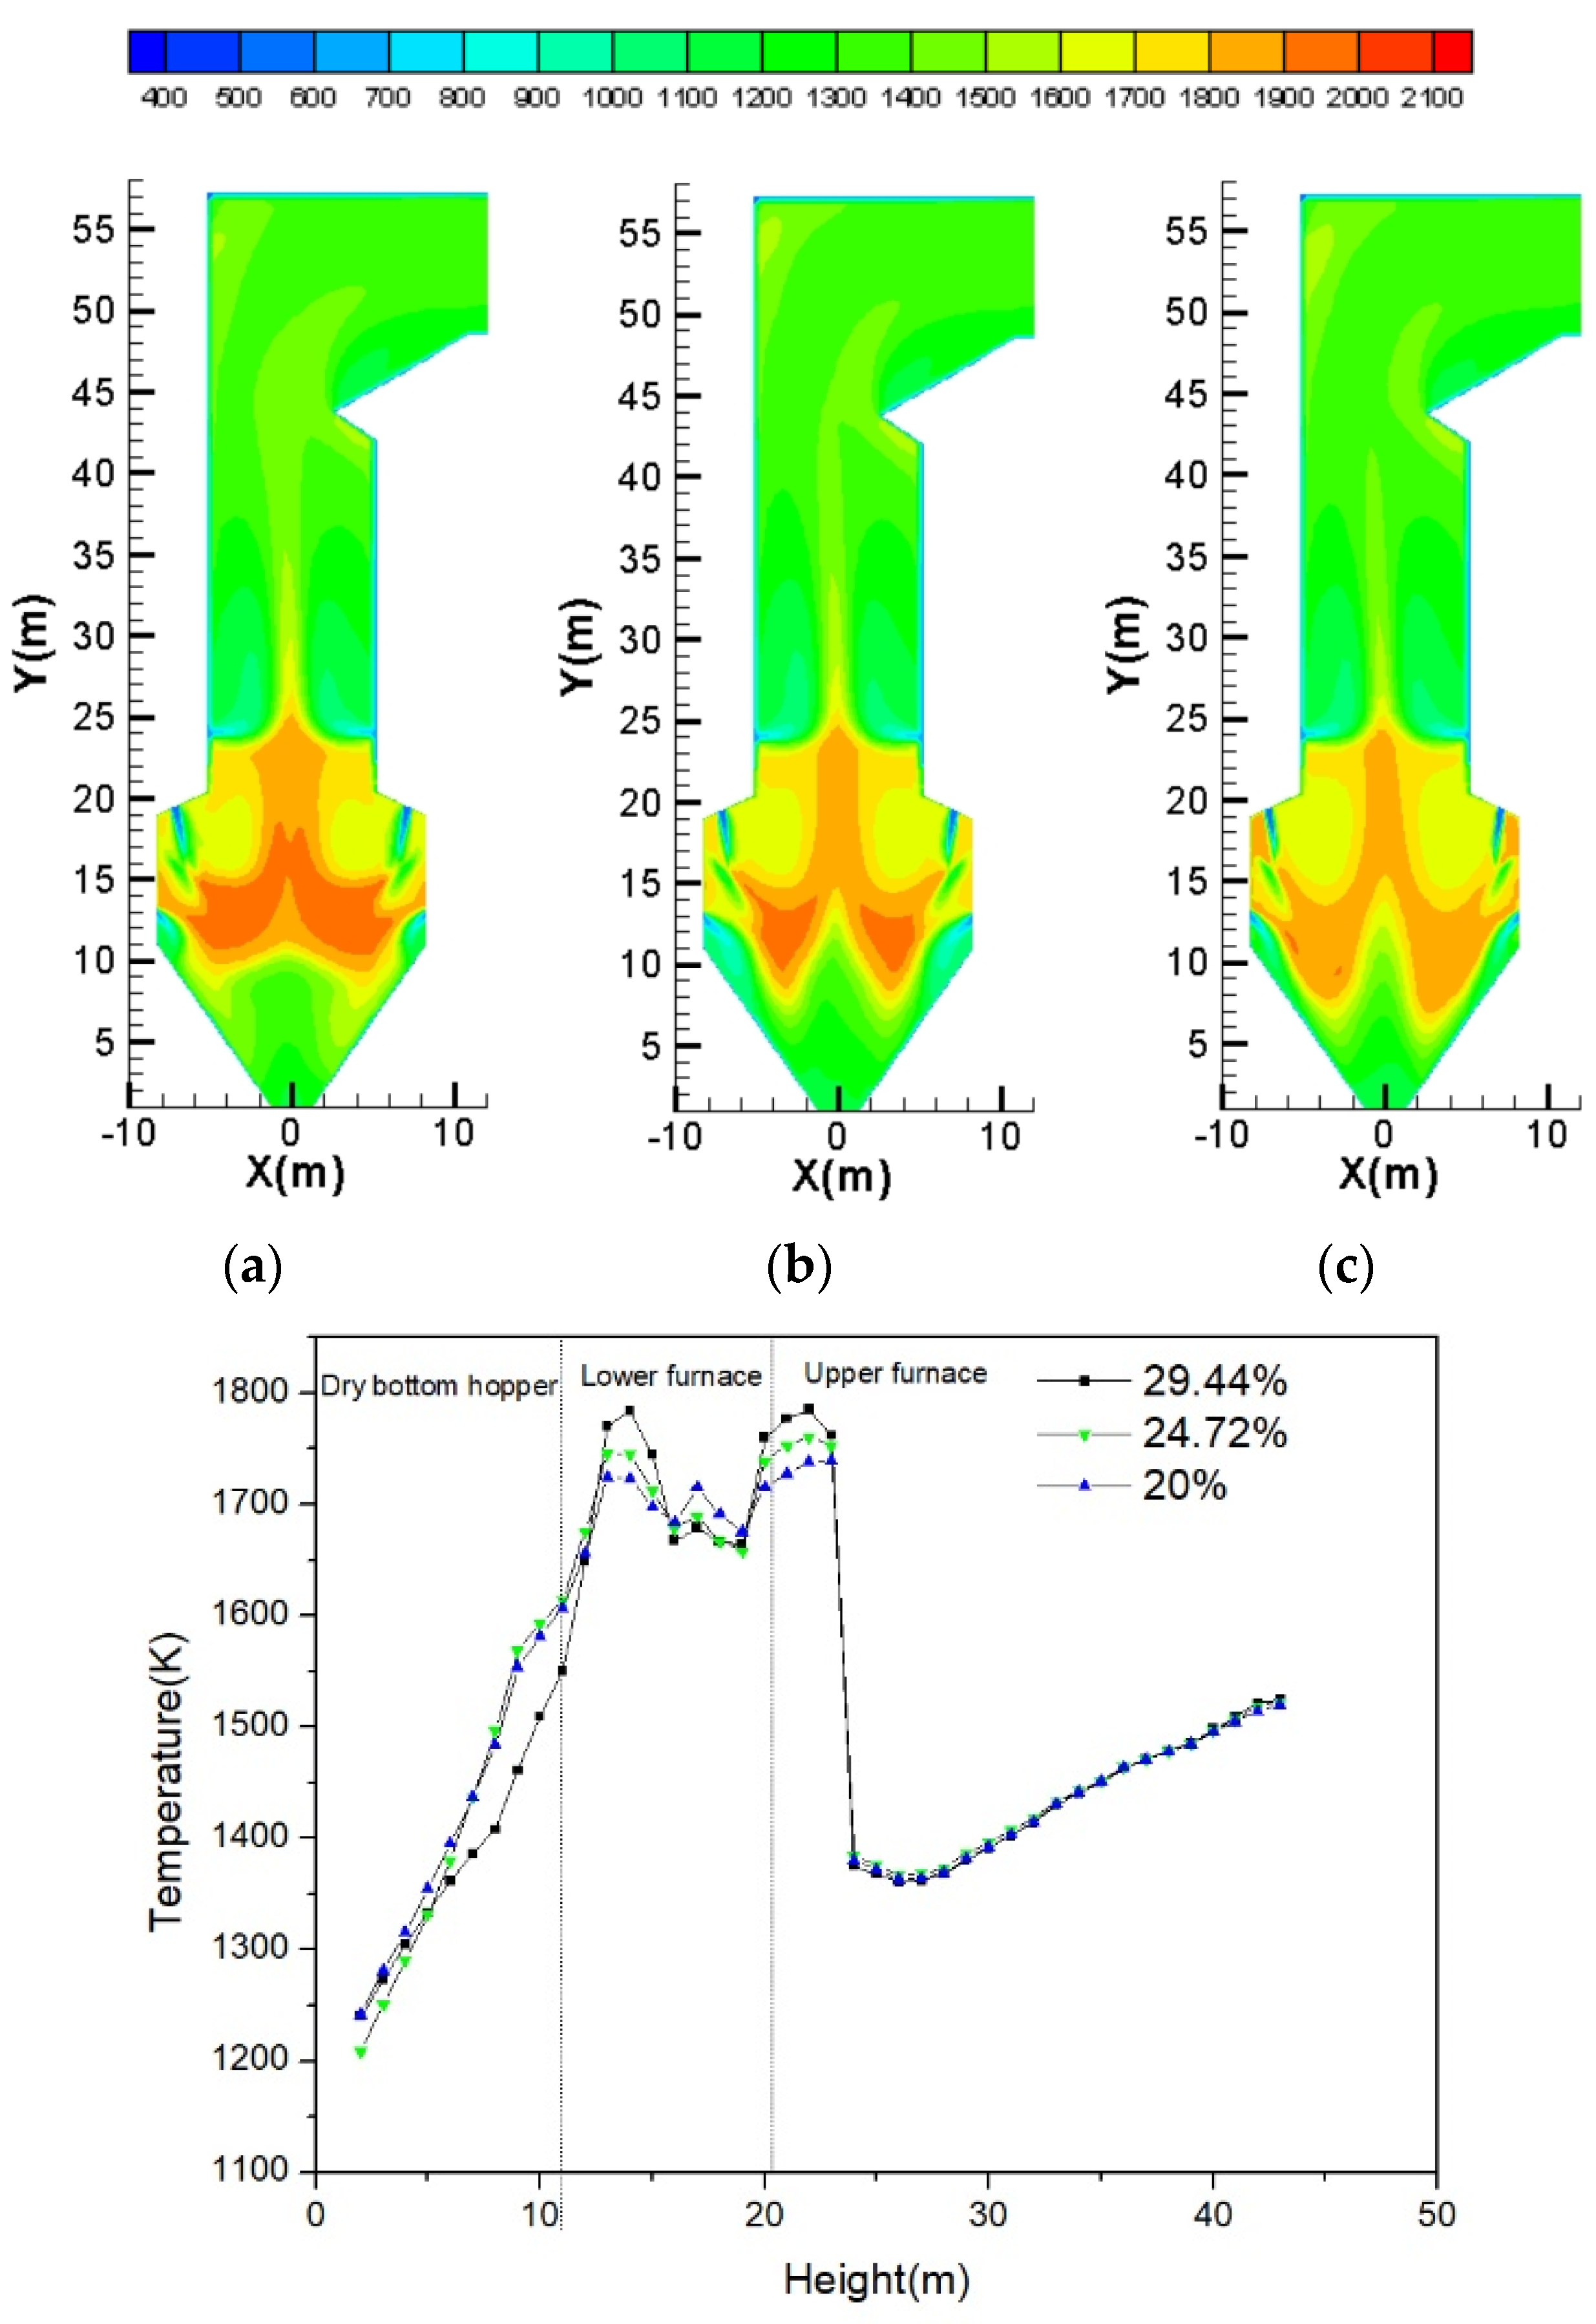
Figure 8.
Averaged O2 and CO concentrations along the furnace height: (a) Oxygen; (b) CO.
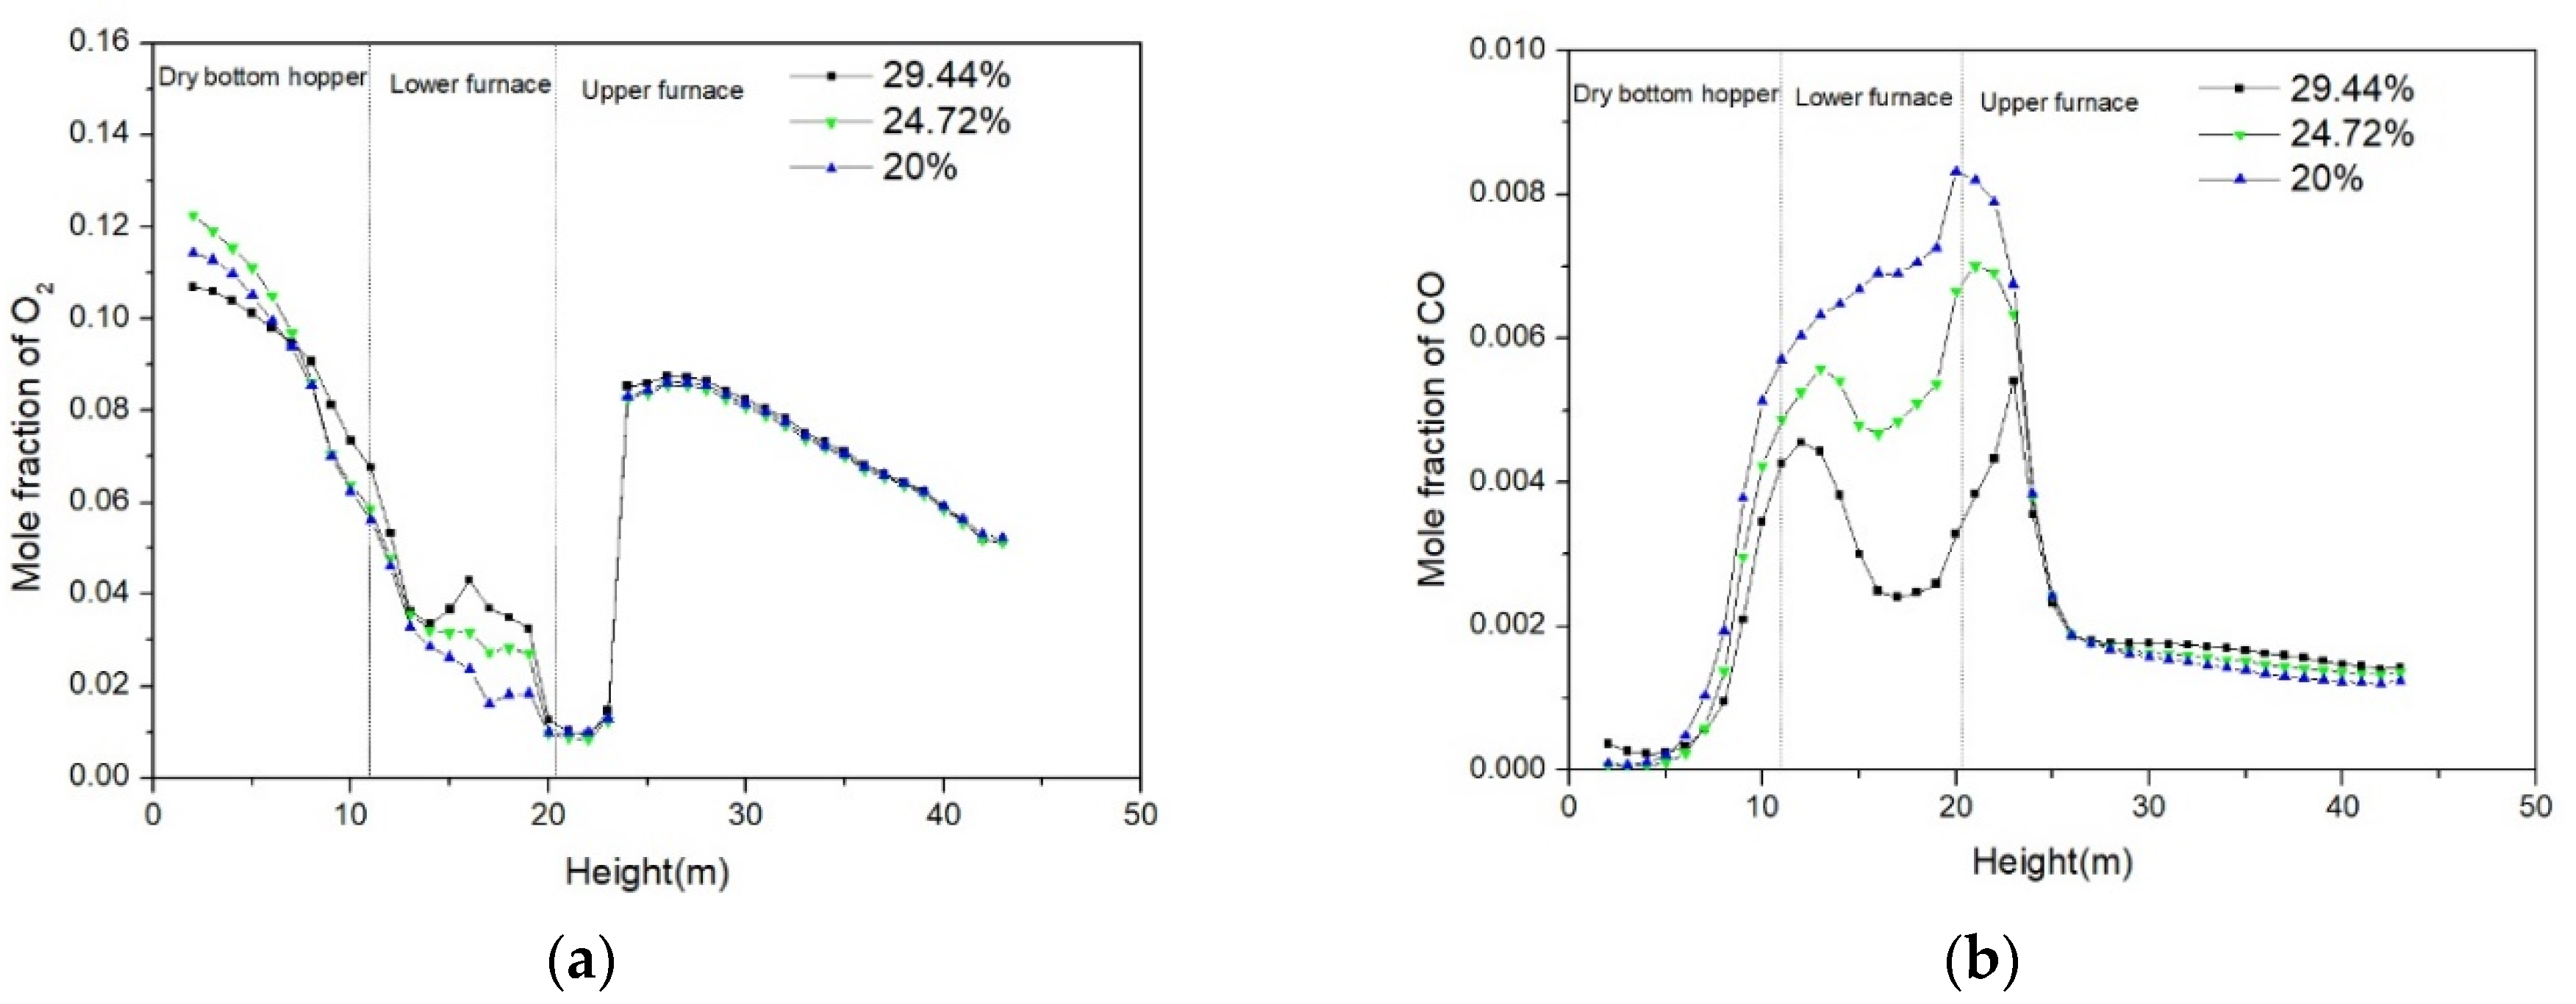
Figure 9.
NO concentration diagram: (a) Secondary air ratio on arch, 29.5%; (b) Secondary air ratio on arch, 24.7%; (c) Secondary air ratio on arch, 20%.
Figure 9.
NO concentration diagram: (a) Secondary air ratio on arch, 29.5%; (b) Secondary air ratio on arch, 24.7%; (c) Secondary air ratio on arch, 20%.
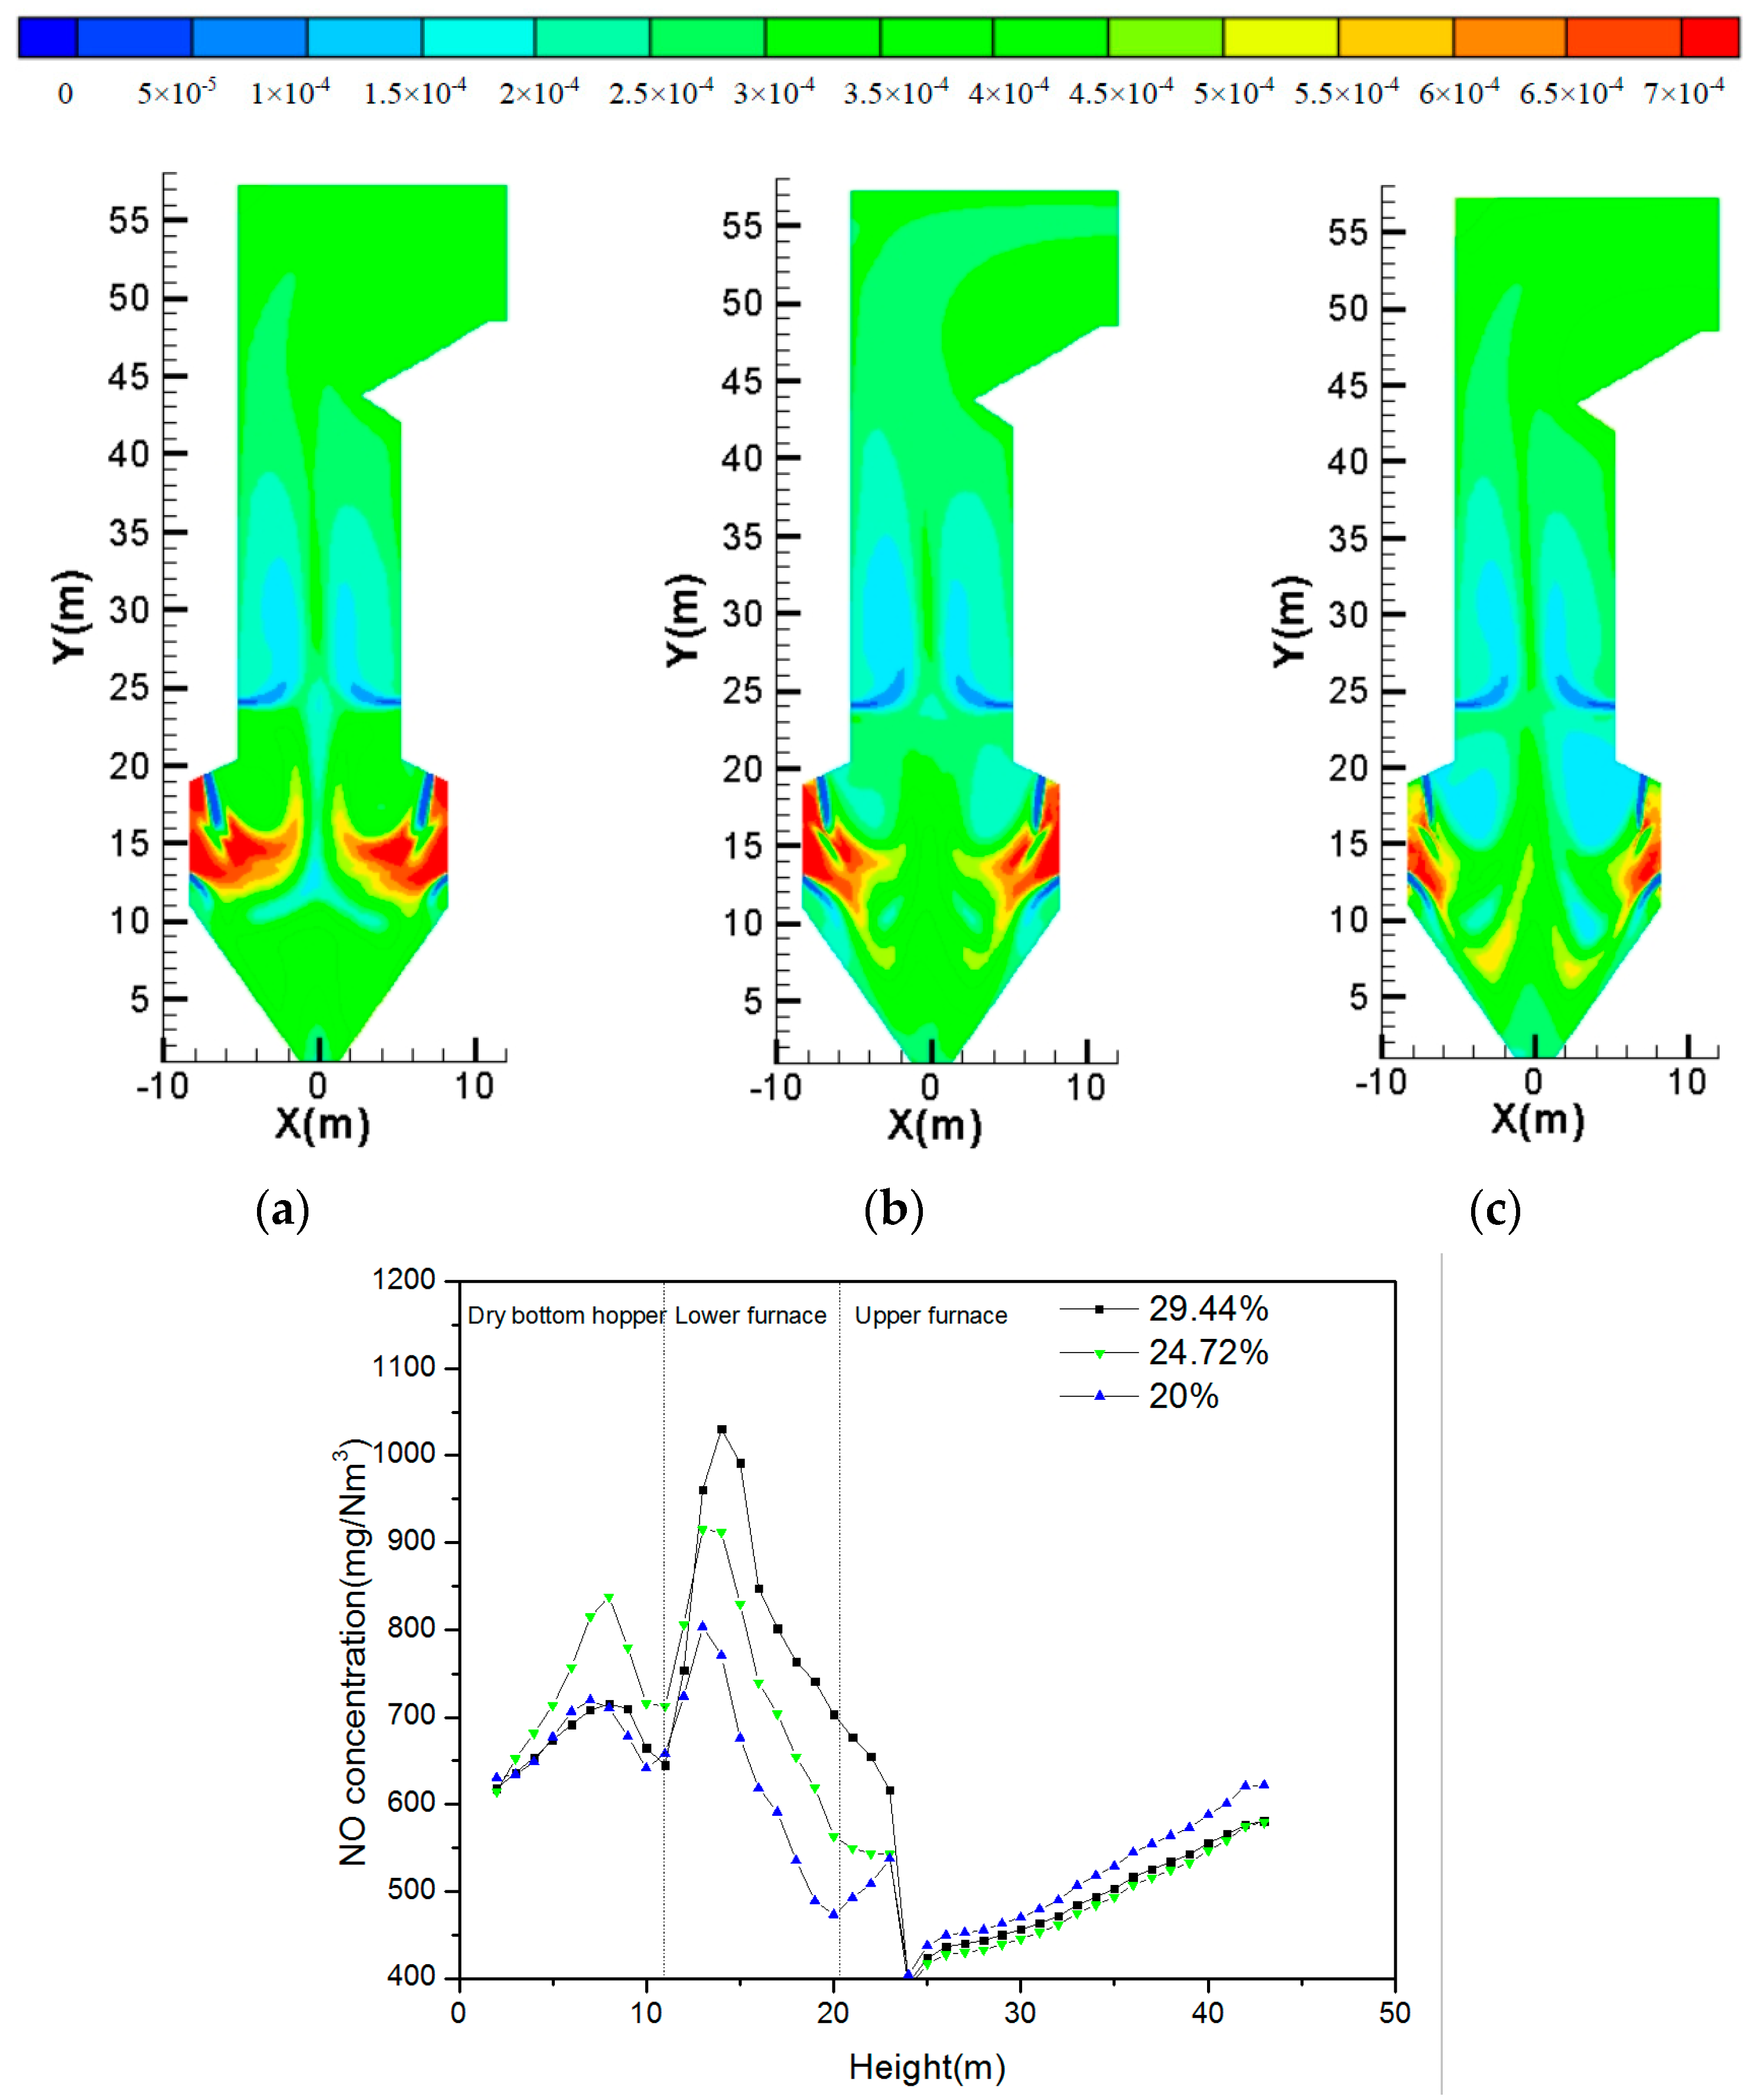
Figure 10.
Comparison of calculation results under different secondary air ratio on the arch.
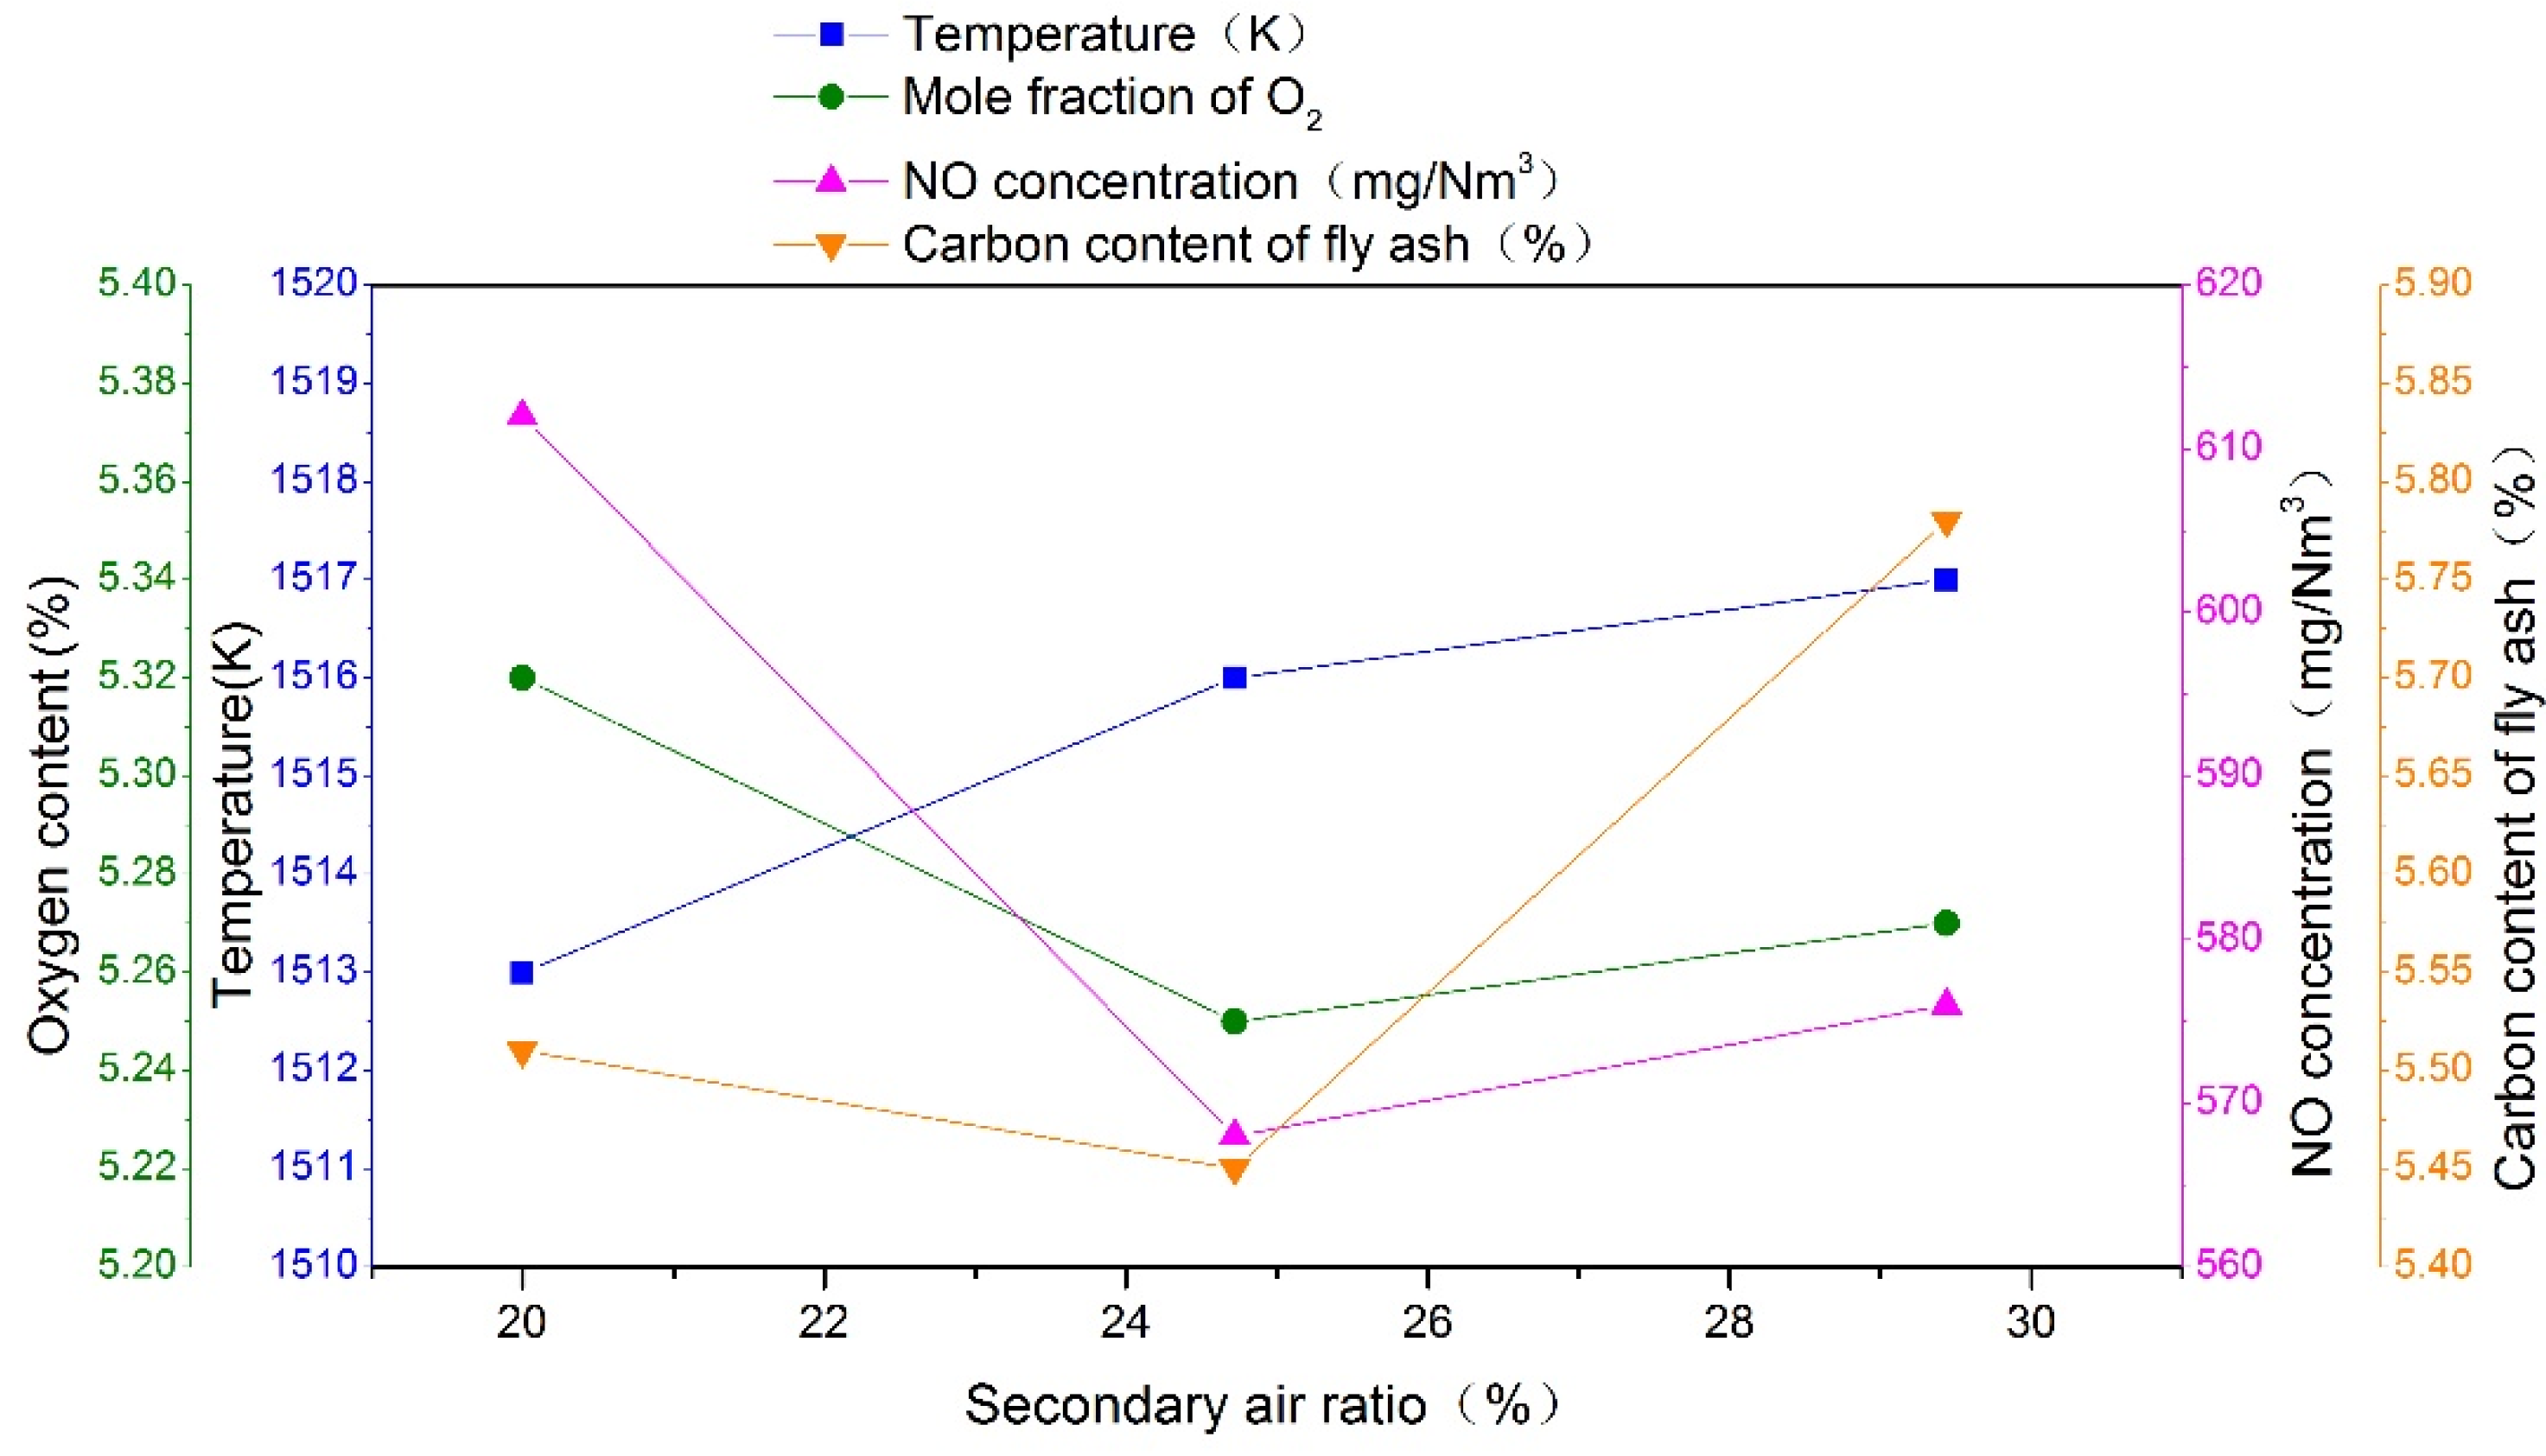
Figure 11.
Temperature distribution: (a) Velocity of 18 m s−1; (b) Velocity of 20 m s−1; (c) Velocity of 22 m s−1; (d) Velocity of 25 m s−1; (e) Velocity of 28 m s−1.
Figure 11.
Temperature distribution: (a) Velocity of 18 m s−1; (b) Velocity of 20 m s−1; (c) Velocity of 22 m s−1; (d) Velocity of 25 m s−1; (e) Velocity of 28 m s−1.
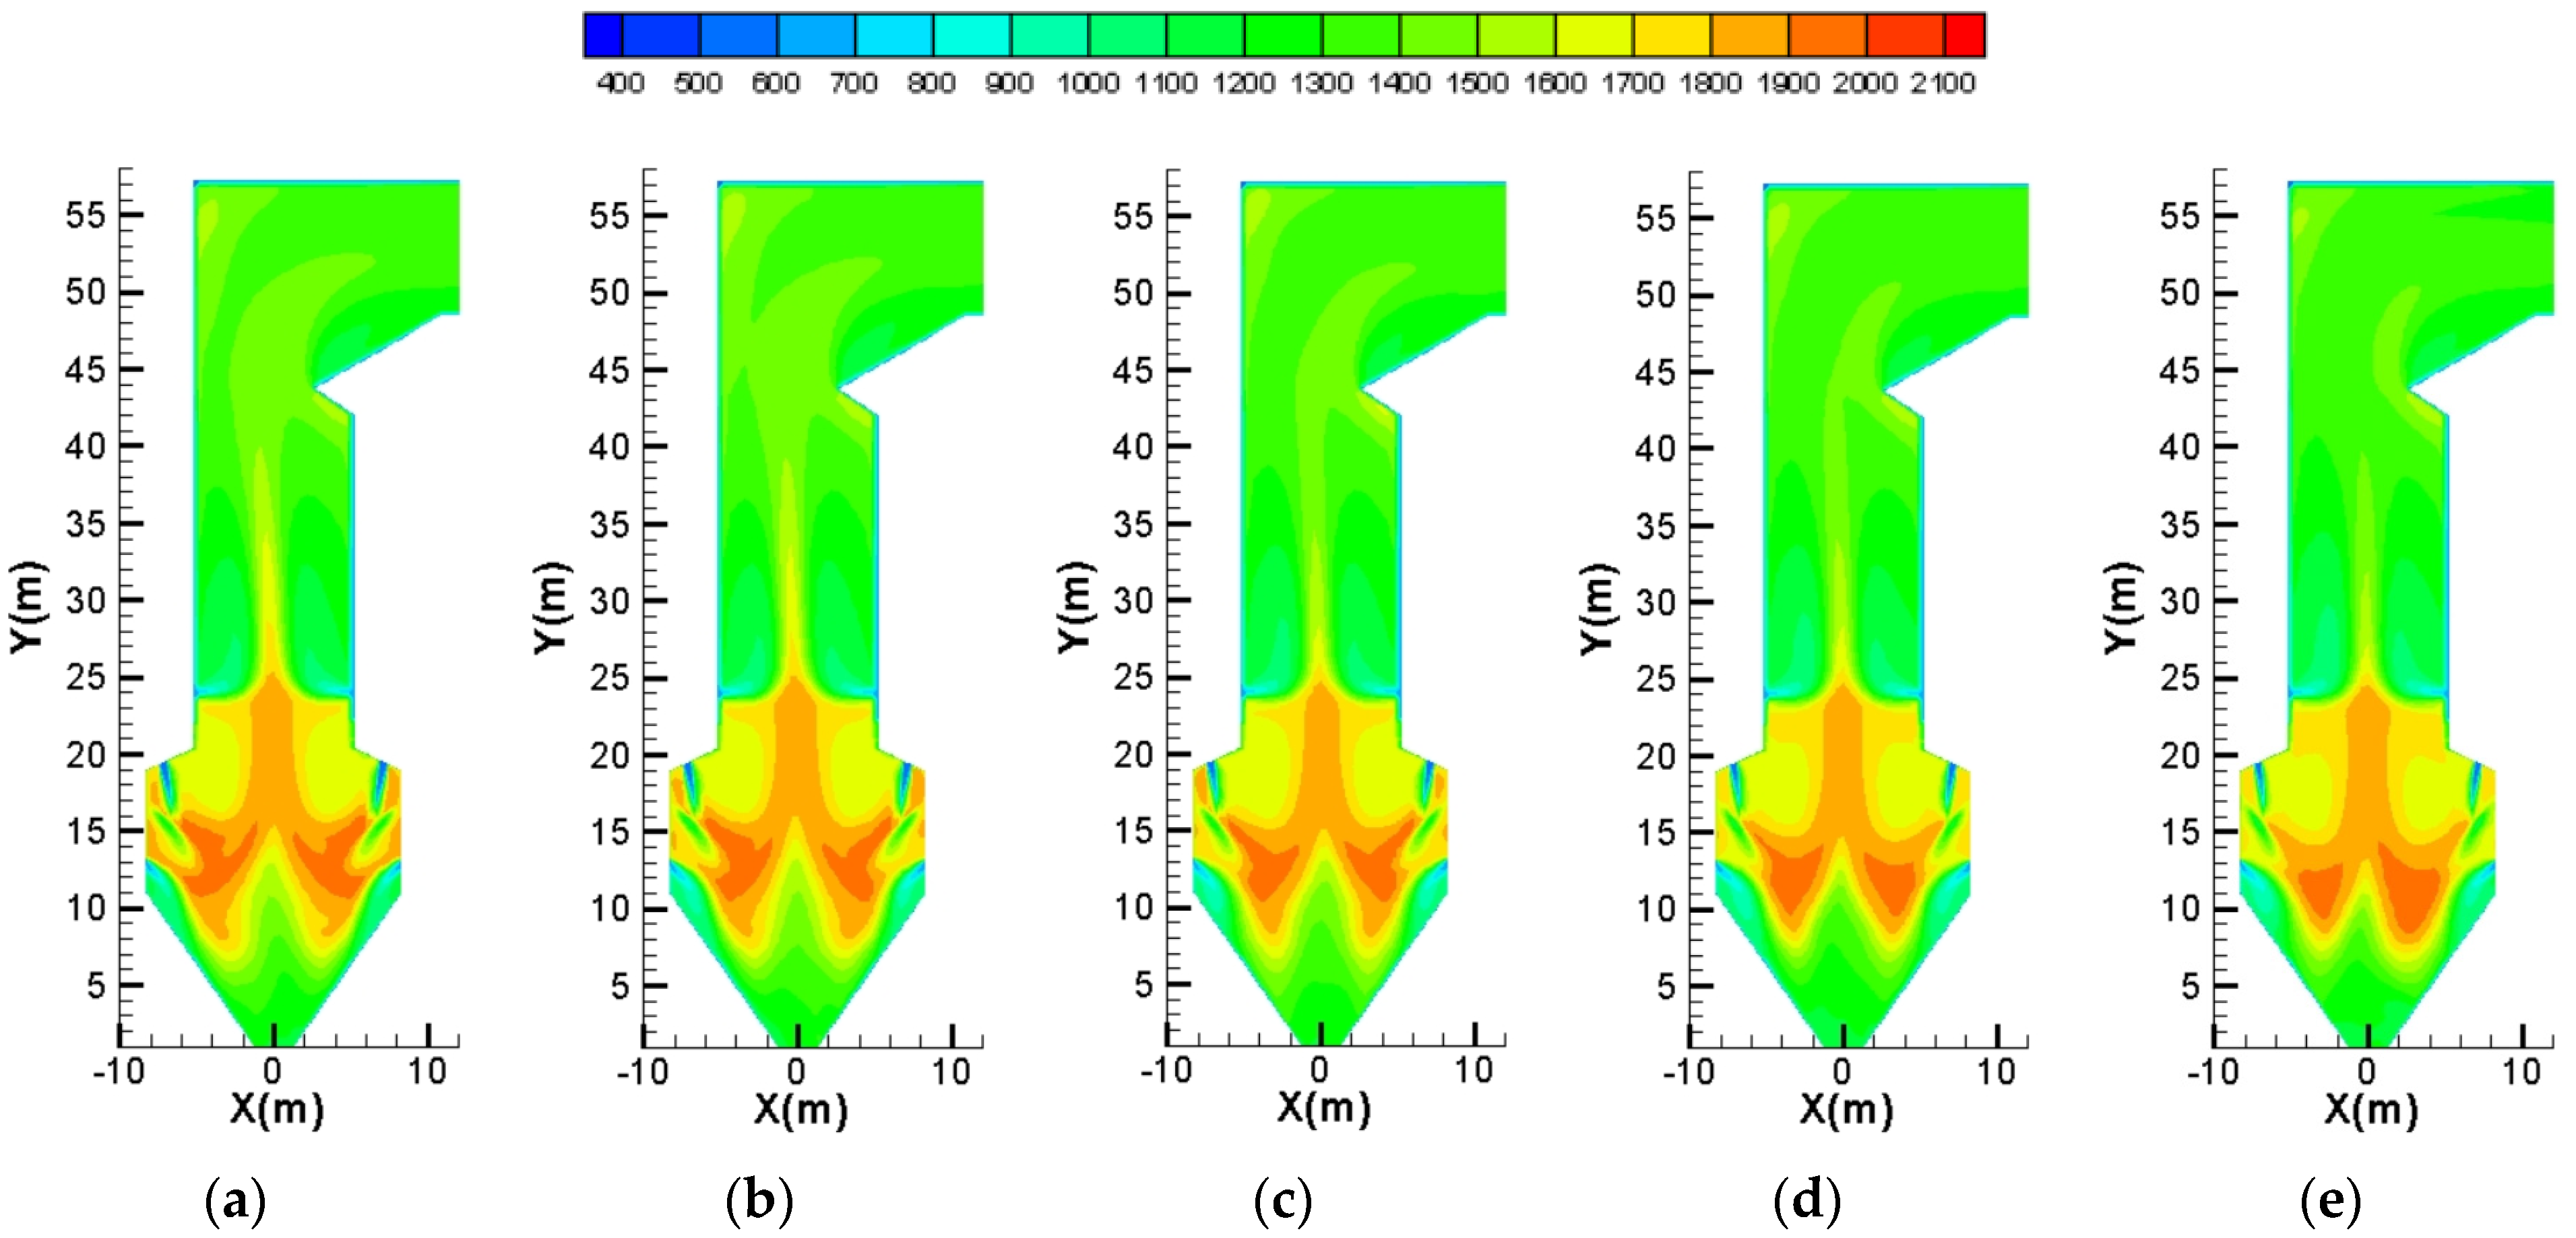
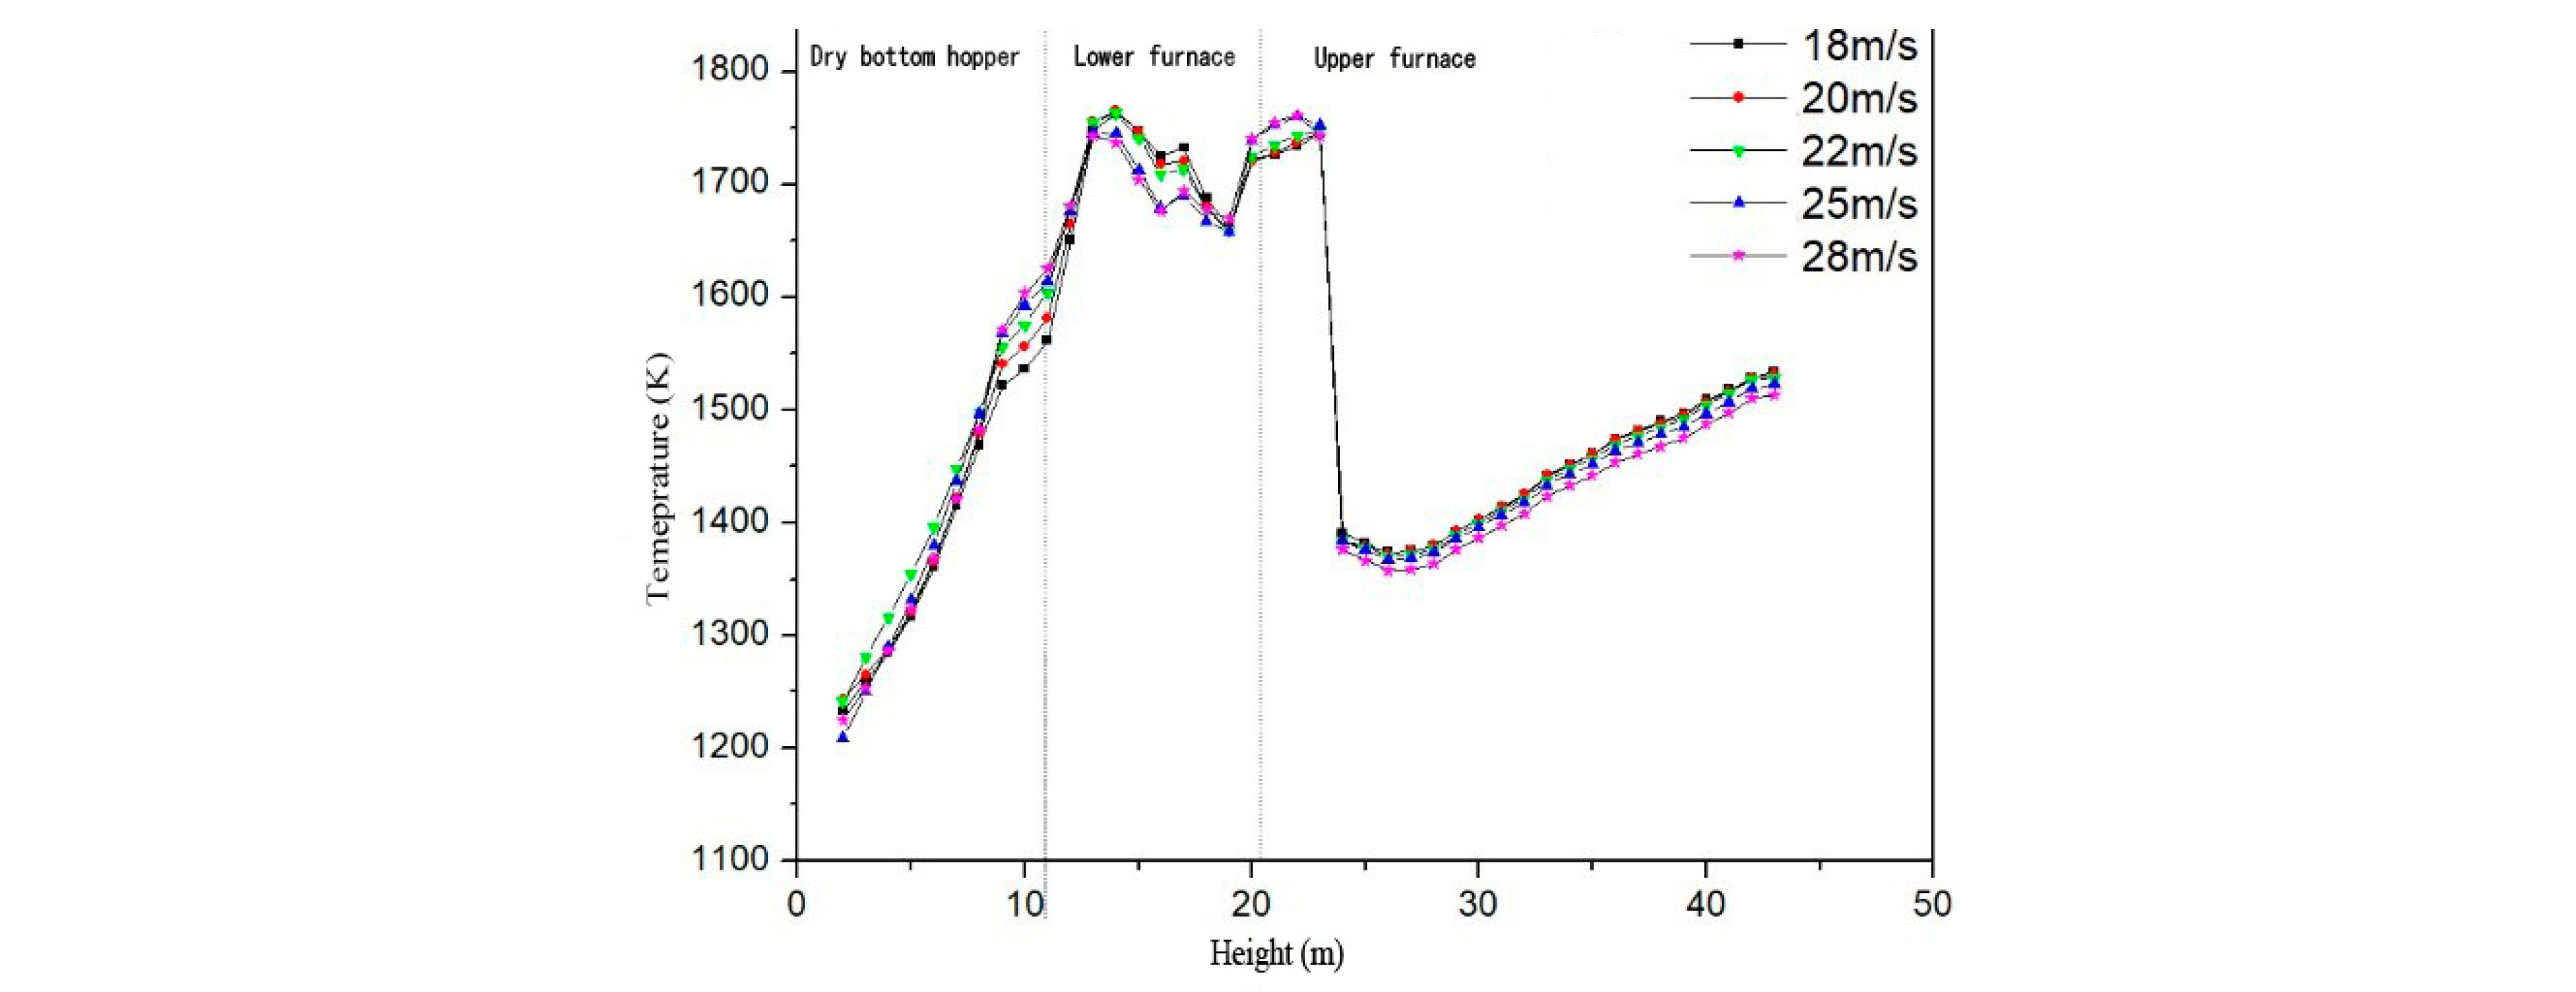
Figure 12.
Distribution curves of oxygen and CO along furnace height: (a) oxygen; (b) CO.
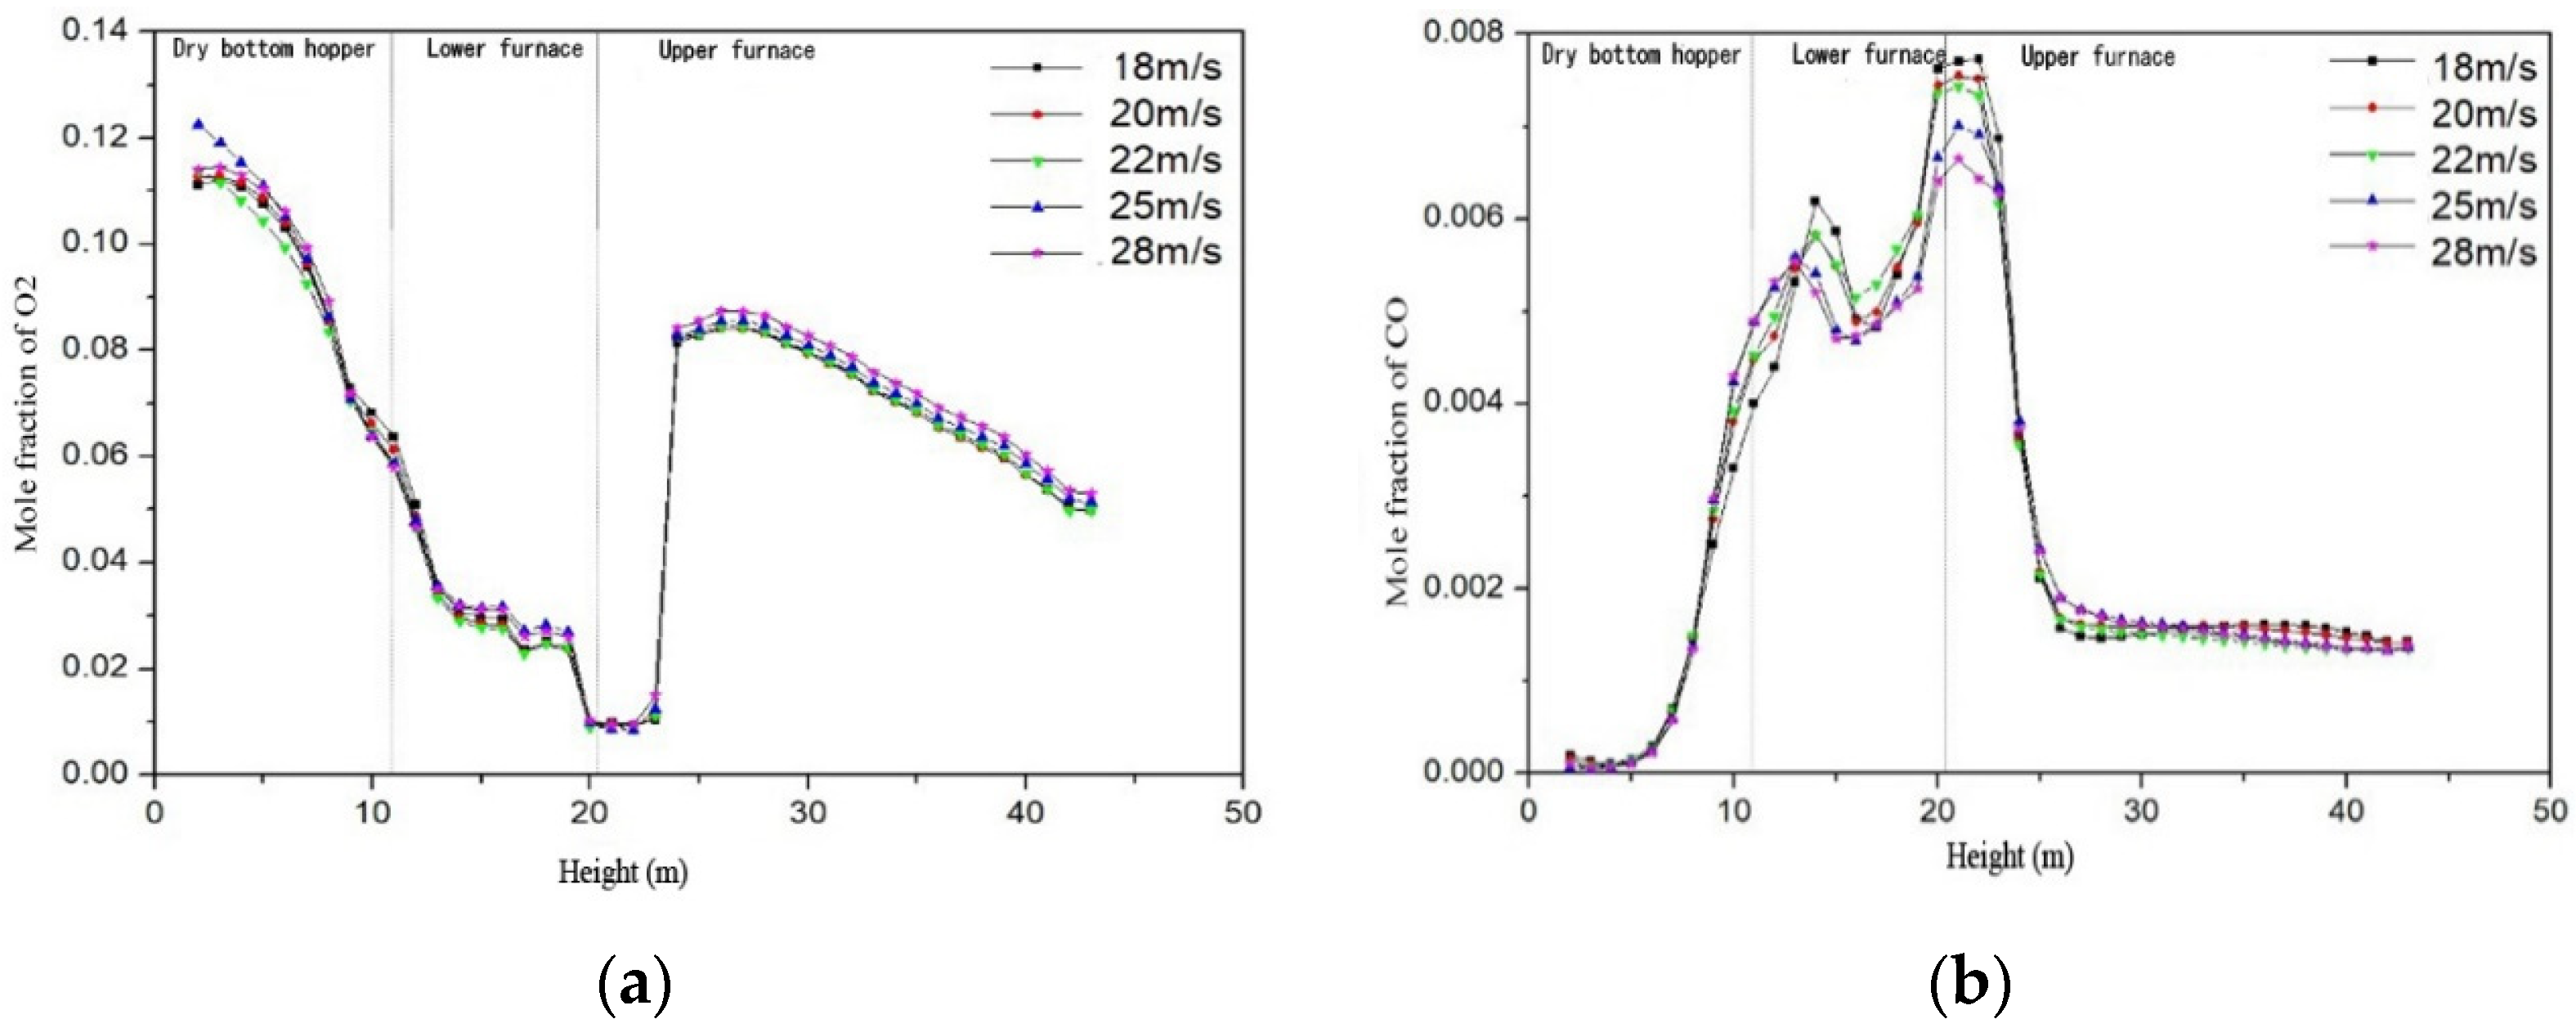
Figure 13.
NO concentration: (a) Velocity of 18 m s−1; (b) Velocity of 20 m s−1; (c) Velocity of 22 m s−1; (d) Velocity of 25 m s−1; (e) Velocity of 28 m s−1.
Figure 13.
NO concentration: (a) Velocity of 18 m s−1; (b) Velocity of 20 m s−1; (c) Velocity of 22 m s−1; (d) Velocity of 25 m s−1; (e) Velocity of 28 m s−1.
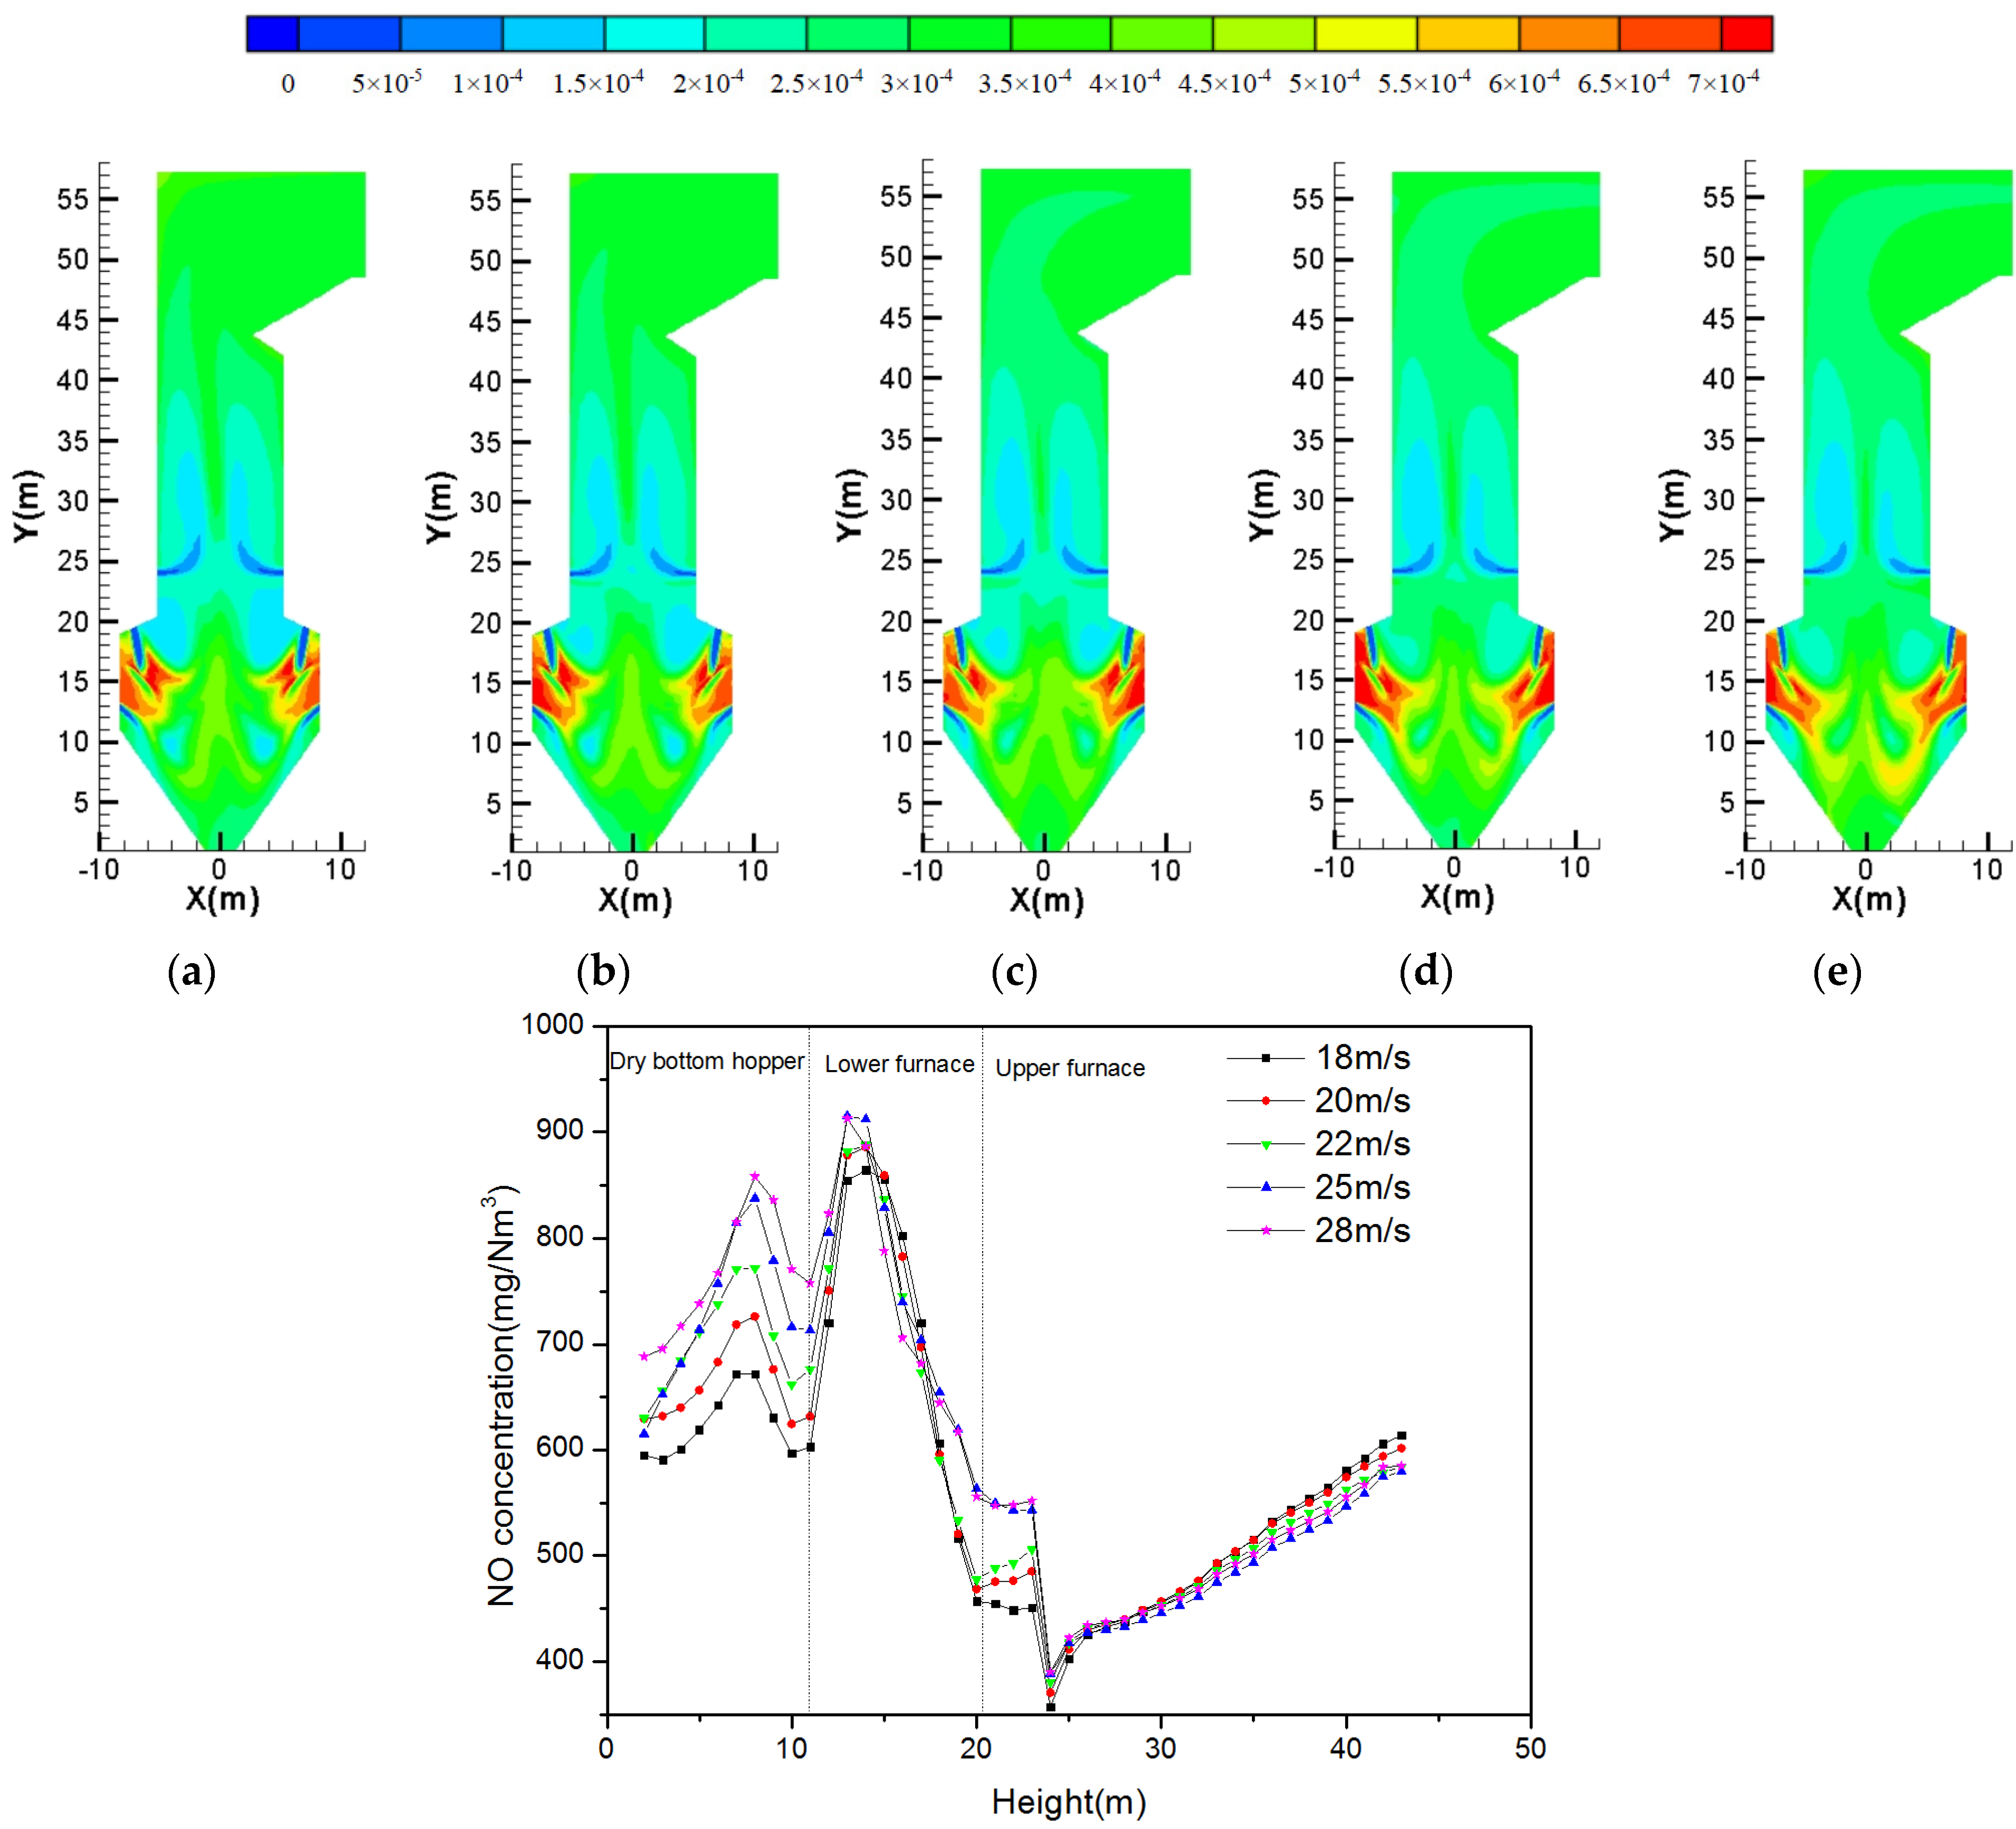
Figure 14.
Comparison of calculation results under different wind speeds at the arch.

Table 1.
Original secondary air distribution.
| Mixed Air | C-Layer | D-Layer | E-Layer | F-Layer | Tertiary Overfired Air | Leakage | |
|---|---|---|---|---|---|---|---|
| Temperature (K) | 556 | 630 | 630 | 630 | 630 | 543 | |
| Ratio (%) | 23.9 | 5 | 4.6 | 6.9 | 34.5 | 20.1 | 5 |
| Velocity (m s−1) | 23.8 | 40 | 14.3 | 14.3 | 14.3 | 26.5 |
Table 2.
The air distribution after retrofit.
| Mixed Air | E-Layer | Tertiary Air | F-Layer | SOFA | Air Leak | |
|---|---|---|---|---|---|---|
| Temperature (K) | 582 | 630 | 393 | 630 | 630 | |
| Ratio (%) | 36.9 | 5.9 | 7.4 | 14.8 | 30 | 5 |
| Speed (m s−1) | 25 | 30 | 25 | 30 | 30 |
Table 3.
Proximate analysis and ultimate analysis.
| Proximate Analysis (wt.%) | Elemental Analysis (wt.%) | |||||||
|---|---|---|---|---|---|---|---|---|
| Moisturear | Volatile Matterdaf | Fixed Carbondaf | Ashar | Car | Har | Nar | Sar | Oar * |
| 7.9 | 20 | 80 | 26.9 | 55.0 | 2.2 | 2.0 | 4.0 | 2.0 |
* daf: dry-ash free basis; ar: as received basis.
Table 4.
Comparison of experimental and simulation results.
| Temperature (K) | NOx (mg Nm−3, 6% O2) | Carbon Content in Fly Ash | |
|---|---|---|---|
| Experimental | 1530 | 900–1000 | 2–3 |
| Simulation | 1609 | 906 | 2.5 |
Table 5.
Air distribution with different secondary air on arch (%).
| Condition | Secondary Air on Arch | Mixed Air | F-Layer | E-Layer | Tertiary Air | SOFA | Air Leak |
|---|---|---|---|---|---|---|---|
| Case-A | 29.5 | 36.9 | 14.8 | 5.9 | 7.4 | 30 | 5 |
| Case-B | 24.7 | 32.2 | 19.5 | 5.9 | 7.4 | 30 | 5 |
| Case-C | 20.0 | 27.4 | 24.3 | 5.9 | 7.4 | 30 | 5 |
Table 6.
Calculation results under different secondary air ratio on arch.
| Secondary Air on the Arch | Temperature (K) | Oxygen Fraction (mol.%) | NO (mg Nm−3) | Carbon Content in Fly Ash (%) |
|---|---|---|---|---|
| 20% | 1513 | 5.3 | 612 | 5.5 |
| 24.7% | 1516 | 5.2 | 568 | 5.5 |
| 29.5% | 1517 | 5.3 | 576 | 5.8 |
Disclaimer/Publisher’s Note: The statements, opinions and data contained in all publications are solely those of the individual author(s) and contributor(s) and not of MDPI and/or the editor(s). MDPI and/or the editor(s) disclaim responsibility for any injury to people or property resulting from any ideas, methods, instructions or products referred to in the content. |
© 2023 by the authors. Licensee MDPI, Basel, Switzerland. This article is an open access article distributed under the terms and conditions of the Creative Commons Attribution (CC BY) license (https://creativecommons.org/licenses/by/4.0/).
Share and Cite
MDPI and ACS Style
Liu, T.; Wang, S.; Wei, Z.; Yu, J. Retrofit of a 600 MW Down-Fired Pulverized-Coal Furnace for Low NOx Emission. Energies 2023, 16, 6837. https://doi.org/10.3390/en16196837
AMA Style
Liu T, Wang S, Wei Z, Yu J. Retrofit of a 600 MW Down-Fired Pulverized-Coal Furnace for Low NOx Emission. Energies. 2023; 16(19):6837. https://doi.org/10.3390/en16196837
Chicago/Turabian StyleLiu, Tao, Sheng Wang, Ziming Wei, and Jie Yu. 2023. "Retrofit of a 600 MW Down-Fired Pulverized-Coal Furnace for Low NOx Emission" Energies 16, no. 19: 6837. https://doi.org/10.3390/en16196837
Note that from the first issue of 2016, this journal uses article numbers instead of page numbers. See further details here.