

Performance Analysis of a Diabatic Compressed Air Energy Storage System Fueled with Green Hydrogen


Department of Mechanical, Chemical and Materials Engineering, University of Cagliari, Via Marengo 2, 09123 Cagliari, Italy
*
Author to whom correspondence should be addressed.
Energies 2023, 16(20), 7023; https://doi.org/10.3390/en16207023
Submission received: 15 September 2023
/
Revised: 2 October 2023
/
Accepted: 6 October 2023
/
Published: 10 October 2023
(This article belongs to the Special Issue Advances in Hydrogen Energy III)
Abstract
:The integration of an increasing share of Renewable Energy Sources (RES) requires the availability of suitable energy storage systems to improve the grid flexibility and Compressed Air Energy Storage (CAES) systems could be a promising option. In this study, a CO2-free Diabatic CAES system is proposed and analyzed. The plant configuration is derived from a down-scaled version of the McIntosh Diabatic CAES plant, where the natural gas is replaced with green hydrogen, produced on site by a Proton Exchange Membrane electrolyzer powered by a photovoltaic power plant. In this study, the components of the hydrogen production system are sized to maximize the self-consumption share of PV energy generation and the effect of the design parameters on the H2-CAES plant performance are analyzed on a yearly basis. Moreover, a comparison between the use of natural gas and hydrogen in terms of energy consumption and CO2 emissions is discussed. The results show that the proposed hydrogen fueled CAES can effectively match the generation profile and the yearly production of the natural gas fueled plant by using all the PV energy production, while producing zero CO2 emissions.
1. Introduction
As is well known, the current target of international policies [1] for energy independence and clean energy transition [2] is the reduction in the dependence on fossil fuels and related emissions through the enhancement of Renewable Energy Sources (RES) [3]. The worldwide production from RES exceeded 7857 TWh in 2021, with solar photovoltaic (PV) and wind power accounting for more than 57% of installed capacity [4] and there are planned additions for 2023 of 290 GW for PV and 107 GW for wind turbines [5]. However, the increasing penetration of non-dispatchable renewables, such as solar and wind energy, is directly linked to increasingly frequent cases of generation curtailment for grid safety reasons [6]. According to the International Energy Agency (IEA), the way to further increase the share of RES without simultaneously increasing generation curtailment is to improve the power system flexibility [7].
Apart from structural improvements on the grid and the introduction of suitable energy management strategies applied to both the demand and supply sides, the enhancement of the power system flexibility can be mainly achieved by the widespread diffusion of energy storage systems, which would allow a shift of the RES overproduction (typically during daytime) towards periods of overdemand (typically during night hours). What is more, in the context of grid congestion control through the so-called “marked-based methods” [8], progressively higher tariffs are being offered to increase the demand during moments of overproduction and decrease it (or even supply energy) during moments of overdemand [9].
Currently, the ancillary services to the grid are mainly operated by thermal power plants based on the use of simple-cycle and combined-cycle gas turbine plants fueled by natural gas [10]. According to the International Energy Agency (IEA), about 22% of global CO2 emissions were derived from natural gas combustion in 2021 [2], and the same levels were maintained in 2022 [11]. A widely studied way to offer the same ancillary services of conventional gas turbines while avoiding CO2 emissions is represented by substituting natural gas with hydrogen [12]. A successful example of a gas turbine running on blends of up to 100% hydrogen with low Nox was presented by Banihabib et al. [10], and the International Energy Agency reports that gas turbines able to run on hydrogen-rich gases or even pure hydrogen are already commercially available [13]. Naturally, CO2 emissions can be effectively avoided only if the hydrogen is produced with renewable energy.
On the other hand, many energy storage technologies are currently available or under development, each characterized by specific features in terms of maximum deliverable power, storage capacity, round-trip efficiency, lifetime, etc. [14]. Among the energy storage technologies characterized by medium-high storage capacities Compressed Air Energy Storage (CAES) systems are one of the most interesting options; potentially more cost-effective compared to batteries and somewhat comparable to pumping hydro systems [15]. CAES technology is very similar to conventional gas turbine plants and is able to provide very similar ancillary services [16]; however, the compression and expansion processes are deferred in time and thus require a suitable reservoir to store the compressed air. Depending on the use of the heat generated during air compression, the different CAES configurations can be classified as Diabatic CAES (D-CAES) (no heat recovery), Adiabatic CAES (A-CAES) (the compression heat is recovered, stored, and subsequently used to heat the air before expansion), and Isothermal CAES (I-CAES) (the compression and expansion processes occur at approximately constant temperature) [17]. Total investment costs (TIC) of CAES systems can be assumed, as reported by Huang et al. [18], to be within the range 700–900 EUR/kWe, depending on the type.
Although CAES technology is not new, its integration with RES [19] and its related management represents a promising research field for energy storage [20]. Since 2009, the use of CAES for balancing unpredictable RES was foreseen as a very well-paid service for electricity markets [21]. Ramadan et al. [22] confirmed this prevision, defining CAES as systems able to improve the profitability of RES by targeting peak energy tariffs. Given this fact, the profitability of CAES systems is always evaluated with reference to a specific electricity market and grid regulation context, as in the case reported by Abbaspour et al. [23] which evaluated an RES-integrated CAES system in Iran characterized by a 43% increase in profits with respect to a conventional gas-fired power plant.
Within this framework, the present study proposes a new energy storage concept based on an RES-integrated D-CAES plant fueled with green hydrogen, produced directly on site through a Proton Exchange Membrane (PEM) electrolyzer powered by a PV plant and stored for a later use as compressed gas.
Among the most common current hydrogen storage technologies (compressed above ground, compressed in caverns, liquid, metal hydride, liquid organic, ammonia), the challenges of achieving economical, efficient, and safe hydrogen storage is particularly relevant at a seasonal scale [24], even if examples of underground compressed hydrogen exist worldwide [25]. The latter is considered the storage technology with the smallest impact on public safety [26], even though it is well known that hydrogen safety during production, transportation, storage, and utilization must be addressed properly [27] by using leak detectors [28], supplementary protection strategies and hazard assessments.
Contrary to seasonal-scale, daily-scale compressed gaseous storage is nowadays considered a mature technology, where the lowest Levelized Cost of Hydrogen Storage (LCHS) is represented by above-ground (around 9 EUR/MWh) and cavern (4 EUR/MWh) systems [29].
Apart from the hydrogen storage, the proposed H2-CAES system entails additional costs with respect to a conventional CAES plant such as the PEM electrolyzer (TIC around 500 EUR/kW [30]) and the PV system (TIC around 800 EUR/kW [31]). The use of hydrogen also leads to significant savings, such as the avoided CH4 cost (over 80 EUR/MWh in Europe in 2022 [32]) and no carbon emission pricing. According to IRENA [30], the green hydrogen production cost is currently within the range of 60–150 EUR/MWh but a reduction below 60 EUR/MWh is foreseen before 2030. Nevertheless, as mentioned above, a detailed analysis of the profitability of the H2-CAES could be carried out only with reference to a specific case.
The proposed H2-CAES system is able to maintain, and enhance, the usual CAES benefits, as it can provide high flexibility to the grid and effectively addresses all the previously described issues. In fact, it is able to: (1) shift the RES production towards the night hours, (2) eliminate the dependency on both fossil fuel and gas pipelines, (3) provide ancillary services (time shift, peak shaving, spinning power delivery and frequency regulation), (4) operate with zero CO2 emissions, and (5) reduce grid congestion not only by varying its power production, but also its consumption profile.
The proposed plant layout is derived from a conventional diabatic CAES system [20]. Currently, the McIntosh [33] and the Huntorf [34] plants are the only two examples of operative CAES technology. The Huntorf plant, originally built with a 270 MW power capacity, started its operation in 1978 and was later retrofitted in 2006 with a 321 MW turbine to increase its electricity generation. The McIntosh plant was built later, in 1991, with a turboexpander power of 110 MW [17].
Since one of the main targets of the European Union (EU) directives is the promotion of sustainable energy communities (such as a small town, a small industrial district, etc.), energy storage systems of medium-size storage capacity will play a fundamental role to enhance the flexibility of mini grids powered by renewable electricity [35]. For this reason, as well as to avoid unreasonable sizes of the PV plant, the proposed layout originated from a down-scaled version of the McIntosh plant.
In this paper, the main features of this new energy storage concept and the results of the performance analysis are reported and discussed. In particular, the H2-CAES performance is evaluated with the aim to maximize the self-consumption (SC) share of the PV energy generation as a function of the main design parameters (nominal power of both PV system and electrolyzer, discharge time, and energy storage capacity).
2. Methods
A schematic diagram of the proposed H2-CAES plant configuration is illustrated in Figure 1. The H2-CAES plant analyzed here includes two main sections: the CAES section fueled with hydrogen and the hydrogen production section. The latter includes a PV power plant, a PEM electrolyzer, and the hydrogen storage tanks.
In particular, the CAES section considered here originated from a downscaled version of the McIntosh plant (used as reference case and from now on named “CH4-CAES”). The original McIntosh CAES configuration consists of a compression train with four compressors, an air storage unit, a turboexpander train with two turbines, two combustion chambers, and a regenerator.
The main parameters of the original and down-scaled McIntosh plants are reported in Table 1.
The operational strategy of the CH4-CAES is the same as the McIntosh plant, which is based on a weekly cycle, repeated throughout all 52 weeks of the year. A single cycle consists of a 40 h charge phase, which occurs during the nighttime and weekends, and a 24 h discharge phase, which occurs during daytime of working days. The 40 h of charge and the 24 h of discharge are not consecutive but rather distributed across the working days of the week on an average of around 5 h of discharge time () per day. It is important to notice that the McIntosh plant was designed during the late 1980s, when RES penetration was very low, the excess of energy production occurred during the night, and peaks of demand occurred during daytime. For this reason, the plant’s operational strategy included a nocturnal charge phase and a diurnal discharge phase.
The operational strategy of the H2-CAES plant analyzed here differs from that of the reference McIntosh plant due to its dependency on hydrogen production, which in turn is based on PV power generation. For this reason, the charge and discharge periods are herein reversed. During the day, when the solar power generation is high, the H2-CAES plant starts the charge phase. During this phase, both storage components of the system are charged. The air cavern is charged using the electrical energy from the grid, which powers the compressors, independently to the PV power generation. Conversely, the charging of the hydrogen storage tanks relies on the availability of energy from the PV power plant. The electrical energy generated by the PV system is used to produce and store the hydrogen in the tanks, and, therefore, the state of charge in the tanks directly depends on the PV power availability. Detailed operations of the hydrogen production system will be discussed in the following sections.
Both the compressed air and hydrogen produced during the day are stored for a later use during the night. Only when the PV production ceases is the discharge phase allowed to begin. The stored hydrogen and the compressed air are used in the combustion chambers to produce the high-temperature gases that expand in the turboexpander train. This allows us to strategically shift a portion of PV generation to nighttime hours, aiding grid stability and reducing the reliance on fossil fuels during electricity generation.
2.1. Mathematical Model
The mathematical models for both the CH4-CAES and the H2-CAES systems were developed using the MATLAB software version R2023a Update 3 [36]. Simulations were carried out throughout one year with a time step of 1 h.
2.1.1. CAES Plant Model
The turboexpander train was modelled assuming steady state conditions [12] and constant isentropic efficiency for the turbines (80%). The efficiency of the combustion chambers was set equal to 98%. In addition, all sub-components were considered adiabatic and without any pressure losses. The turbines’ inlet temperatures and pressures, as well as the regeneration level, were set equal to those of the McIntosh plant (TITHP = 811 K; TIPHP = 42 bar; TITLP = 1144 K; TIPLP = 15 bar; R = 68%) for both the CH4-CAES and the H2-CAES systems. The Lower Heating Values (LHV) of methane and hydrogen were assumed to equal 50 MJ/kg and 120 MJ/kg, respectively. The power output of the turboexpander train was downscaled by a factor of 2.62 with respect to that of the McIntosh plant. The design mass flow rates of both air and hydrogen were calculated by solving the mass and energy balances of the two combustion chambers. The masses (and volumes) of air and methane (or air and hydrogen) to be stored were calculated, according to Sadreddini et al. [3], to ensure the mass flow rates of air and methane (or hydrogen) for the required discharge time. The compressor train, which was designed to replicate the configuration of the McIntosh plant, consisted of four multistage compressors, with a design polytropic efficiency of 85%, with intercooling and aftercooling. The compressors design and off-design performances were calculated according to the Casey–Robinson method [37]. Specifically, the performance of each compressor was assessed separately. The input parameters include the pressure ratio, the mass flow rate, the temperature, and the pressure of the air, as well as additional design parameters like the flow coefficient, the work coefficient, and the Mach number at the tip of the compressor. The number of stages was determined by considering an equal subdivision of the enthalpy difference between the stages. The polytropic efficiency and pressure ratio for each stage were iteratively calculated as a function of the reduced mass flow rate.
2.1.2. Green Hydrogen Production System
The power production of the PV system was simulated as suggested by Duffie et al. [38] by means of the following equation:
where is the overall module surface, the Global Tilted Irradiance, the derating factor (), the inverter efficiency, and the module conversion efficiency. Solar modules were assumed with a tilt of 30° and oriented towards the south (azimuth = 0°). Typical weather conditions provided by Meteonorm software version 7.2 [39] for a latitude of 39.21° were considered.
The PEM electrolyzer was modelled by using the steady state model proposed by Zhao et al. [40]. This model was used to calculate the performance of the electrolyzer, considering the different losses. For a given value of the PV power output, the cell voltage was calculated as:
where is the open circuit voltage, is the activation overpotential, is the ohmic overpotential, and is the diffusion overpotential.
The open circuit voltage and the three overpotentials were calculated with the following equations:
where is the reversible cell voltage, is the gas constant, is the temperature, is the number of electrons, is Faraday constant, , , and are the partial pressures of hydrogen, water, and oxygen, respectively, is the transfer coefficient, is the exchange current density, is the constant coefficient, is the diffusion limit current density, is the thickness of the membrane, I is the cell current, is the membrane cross section area, and is the conductivity of the proton exchange membrane.
The hydrogen yield of the cell of the PEM electrolyzer was calculated based on the Faraday Law:
Since the two combustion chambers operate at different pressure, two storage tanks were employed to store the produced hydrogen. Two pressure regulators were employed to properly set the pressure at the inlet of each combustion chambers. The main parameters of the green hydrogen production system are reported in the following Table 2.
2.1.3. Performance Parameters
The plant performance was evaluated by means of the following parameters:
- Self-consumption (SC) of PV electricity, defined as the ratio of the self-consumed and the total electricity production of the PV system:
- According to the operational strategy previously reported in Section 2 (Methods), the PV systems is conceived to power only the PEM electrolyzer, which cannot be powered by the electrical grid (therefore, ). Furthermore, any excess energy from the PV system is fed to the grid;
- Yearly energy production (), defined as the net electricity produced by the CAES system during discharge phase. Therefore, the latter does not include the excess energy production of the PV system. This choice was made in order to avoid unfair comparison among different PV-sized alternatives;
- Time of discharge () and number of start-ups (): these parameters are used to better explain and detail the influence of PV system size and PEM electrolyzer size on the system performance. The first is defined as the duration of the discharge phase of the CAES system at a constant output power () while the second represents the number of start-ups which occurs during the considered time period;
- Fuel consumption;
- CO2 emissions during operation;
- PEM electrolyzer to compressor energy ratio (), defined as the ratio of the energy consumption of the PEM electrolyzer and the energy consumption of the compressor. This parameter represents the amount of energy required to produce hydrogen with respect to the energy required to compress air;
- Output to input electricity ratio , representing the amount of energy shifted by the plant towards the night hours;
- Output to PV energy ratio (): this parameter relates the energy produced by the CAES to the energy produced by the PV. For a given , higher values of this parameter are preferred because it means that the same energy output can be obtained with smaller PV systems. For a given , higher values of this parameter have to be preferred because it means that with the same PV system can be obtained a higher CAES energy output.
3. Results and Discussion
In this chapter, the results of the study are reported and discussed. The design parameters investigated here include the nominal power of the PV system (), assumed to be within the range of 40–100 MW, the nominal power of the PEM electrolyzer (), assumed to be within the range of 40–85 MW, the minimum discharge time (), assumed to be within the range of 5–9 h, and the maximum discharge time (), assumed to be within the range of 5–15 h. Note that the minimum value within the range of was assumed to be equal to the daily discharge time of the CH4-CAES ().
Figure 2 is useful to better explain the difference between the two discharge time parameters, and , considered here. The ancillary services of the H2-CAES plant considered in this study refer to the provision of a power generation profile, such as the one represented in Figure 2, given by a constant output power () for a certain discharge time of the CAES section (). In order to best highlight the high flexibility of the H2-CAES, instead of considering only a fixed value of , in the present study results are also shown by assuming that the power generation profile of the H2-CAES can vary between a minimum () and a maximum () discharge time. Given this, the fixed value of occurs when .
The H2-CAES performance was evaluated with the aim to maximize the self-consumption (SC) share of the PV energy generation, as defined in Section 2.1.3. Therefore, for given values of the design parameters, higher values of SC indicate a better performing system. Moreover, the performance of the H2-CAES plant was compared with that of the CH4-CAES plant, which is characterized by a discharge time = 5 h and a yearly net electrical energy production of 52.5 GWh.
The influence of each design parameter ( on the H2-CAES performance was assessed starting with the operating parameters of the reference H2-CAES configuration, reported in Table 3. In this configuration, the operating parameters were calculated by assuming a yearly energy production () equal to that of the CH4-CAES plant and a minimum discharge time () equal to the average discharge time of the CH4-CAES plant (). For clarity, it is important to highlight a difference between the production profiles of the CH4-CAES and the H2-CAES plants: while in the CH4-CAES case the production profile remains the same throughout the year ( = 5 h repeated for = 52 times), in the H2-CAES case (when ) the production profile ( and ) can vary during the year.
3.1. Influence of Minimum and Maximum Discharge Times
Figure 3a,b show the influence of the minimum () and maximum () discharge times on the self-consumption (SC) and on the energy output () of the H2-CAES plant. In Figure 3b, the dashed line represents the energy production, , of the CH4-CAES plant.
It is generally notable that different combinations of and are able to obtain SC values around one, as well as values of equal to that of the CH4-CAES.
For a given , the lowest values of each curve represent the SC and the when . In these cases, the shape of the power profile of the H2-CAES is always the same, SCs are within the range 0.68–0.82 and . As increases, SC and increase up to a maximum of SC = 1 and . This happens because the growth of produces two positive effects: (1) the possibility to collect more PV energy due to higher storage capacity and (2) the possibility to run a longer-lasting discharge.
For a given , increasing results in a decrease of SC and of . This happens because the growth of determines the impossibility of running a briefer discharge, which in turn implicates the need to wait for higher states of charge before the discharge phase can be run. The latter leads to higher losses of PV energy if the storage capacity is saturated during the first light hours.
Results of this analysis allow us to conclude that the H2-CAES design parameters can be chosen by fixing the most appropriate values of and , according to the service to be provided by the energy storage plant, and also by considering that small values of and implicate short and frequent discharges while high values of and entail less frequent but longer discharge phases.
3.2. Influence of PV System Size and PEM Electrolyzer Size
Figure 4a–c shows the SC of the H2-CAES plant as a function of and for = = 5 h and three different values of : 8 h (a), 10 h (b) and 12 h (c). Results are shown for values of . Similarly, Figure 5a–c reports the energy production () of the same H2-CAES plants of the CH4-CAES plant.
Figure 4a–c demonstrates that several combinations of , , and allow us to obtain very high values of SC, sometimes around one. Moreover, it is generally notable that, for a given , the increase of results in a decrease in SC, despite the growth of represented in Figure 5a–c. Apart from case (a), where the storage is clearly undersized for values greater than 55 MW, for cases (b) and (c) it is noticeable that as increases, SC decreases with a steeper slope for the lowest values. In fact, the further the nominal PEM electrolyzers power deviates from the nominal PV power, the less they are able to consume the energy produced by the PV system, which in turn increases the PV energy fed to the grid and reduces the PV energy that is self consumed. The wider the difference between and , the more pronounced this effect becomes.
For a fixed value of , it is evident that the highest SC rates can be obtained only for sizes above a certain value and that values of SC around one can be generally achieved for . In fact, the PV system operates at its nominal power only under certain environmental conditions, which occur only occasionally during the year. Therefore, for most hours of the year, the power produced by the PV system is lower than its nominal value. For this reason, if , the PEM electrolyzer will be powered at its nominal power only occasionally during the year. On the contrary, if , the PEM electrolyzer will be powered at its nominal power, , much more frequently.
Considering the values of and for the reference H2-CAES configuration reported in Table 3 ( = 70 MW— = 55 MW), the comparison between (a–c) subfigures of Figure 4 and Figure 5 allows us to observe that a storage capacity of = 8 h is not sufficient to reach an SC above 0.95 nor to match , and a storage capacity of = 12 h does not results is an increase in SC nor with respect to = 10 h.
Aiming to identify the minimum combination of the design parameters required to achieve the highest values of self-consumption (SC) under the previously reported assumptions ( = 52.5 GWh, = = 5 h), it is interesting to note that = 52.5 GWh can be obtained for the different combinations of , and reported in Table 4 together with the corresponding SC share.
Configurations ε, ζ, and ϑ are characterized by the same and values of the configurations β, γ, and δ, respectively. However, configurations ε, ζ, and ϑ exhibit higher values of with respect to β, γ, and δ without any improvement in SC. In fact, = ; = ; and = . Moreover, β and γ configurations achieve substantially the same SC ( obtained, for the configuration γ, with a lower value (). When comparing configurations α, γ, and δ, it becomes evident that configurations α and δ employ a smaller PEM electrolyzer (), at the cost of a considerably larger PV plant. This results in lower SCs, which in turn implies less flexibility on the supply side (since surplus energy should be fed into the grid). Therefore, configuration γ is the solution that achieves the highest values of energy self-consumption (SC) for = 52.5 GWh and = = 5 h.
3.3. Influence of PV System Size and PEM Electrolyzer Size on the Daily Discharge Profiles
For a given power output, , the yearly energy production of the H2-CAES system depends on the effective discharge time, which varies day by day. A synthetic characterization of the daily discharge profiles can be given by the monthly average value of the discharge time by the number of monthly start-ups , as shows by the following equation:
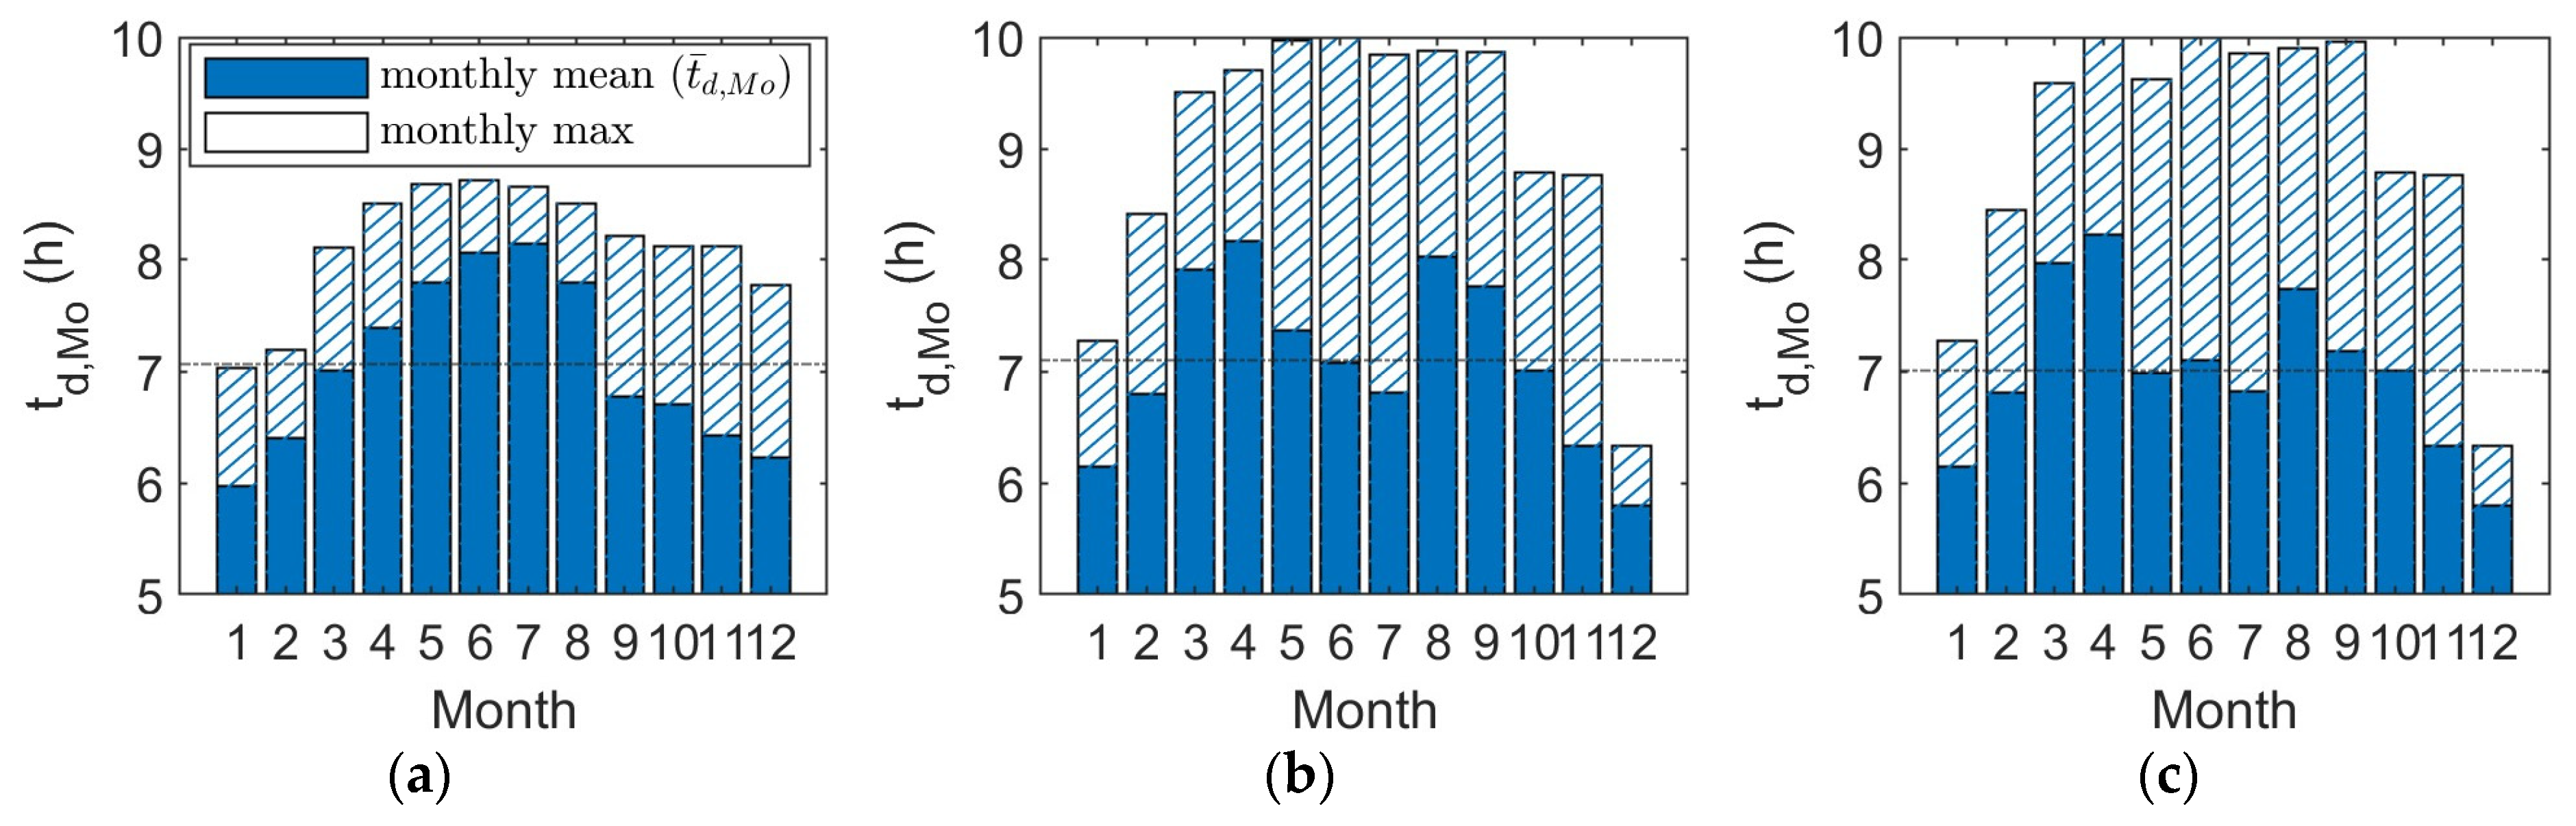
Clearly, the daily discharge profiles, and, therefore, the corresponding values of and , strictly depend on the PV and PEM size. The influence of on is reported in Figure 6a–c, while the influence of on mean () and maximum () values of is reported in Figure 7a–c. The cases a–c are representative of a parameter configuration of = 55 MW (a), = 70 MW (b), and = 85 MW (c), = 10 h (a–c), = 5 h (a–c) and = 55 MW (a–c).
As already shown in Figure 5, an increase in PV size results in an increase in and therefore, as shown by Figure 6a–c, as the PV size increases, the mean value of (dashed-dot line) increases as well, as expected. On the contrary, an increase in the PV size does not result in an increase in (Figure 7). In other words, as the PV size (and the corresponding PV energy production) increases, discharge phases are, on average, briefer but more frequent. For a given PV size, the same trend can also be observed on a monthly base. As demonstrated by the comparison of cases (b) and (c), summer months’ discharge phases are on average briefer than winter months’, but more frequent. In fact, the average discharge time depends on the daily production of hydrogen, which in turn depends on the amount of energy available for the PEM electrolyzer. When PV generation is high, a single day’s charge is enough to store the energy required for the minimum discharge time. On the contrary, when PV generation is low, a single day’s charge is not enough to produce the required hydrogen mass and more than one day of consecutive charge takes place. This multiple-day charge phase results in reaching the minimum discharge time while the PV system is still working, with an averagely higher level of charge and, consequently, discharge.
The influence of the PEM electrolyzer size on and on was analyzed by fixing the maximum discharge time to = 10 h, the minimum discharge time to = 5 h, and the nominal power of the PV plant = 70 MW. The influence of on is reported in Figure 8a–c, while the influence of on the mean () and the maximum () values of is reported in Figure 9a–c for = 40 MW, = 55 MW, and = 70 MW. The cases (b) and (c) show very similar results: in fact, the energy output of these two cases is the same, as reported in Figure 5.
3.4. Comparative Results between CH4-CAES and H2-CAES
Table 5 illustrates the results of the comparison carried out between the CH4-CAES plant and the three H2-CAES configurations γ, δ, and α. These configurations are able to match the CH4-CAES energy output (). Results are shown in terms of electric energy production during the discharge phase, energy consumption during the charge phase (air compression and hydrogen production), fuel consumption (hydrogen or natural gas), carbon dioxide emissions during operation, and the other energy performance indicators previously described in Section 2.1.3.
The compression train consumption () is the same for all cases, but the green hydrogen production system of the H2-CAES requires around 110 GWh/year of electricity from the PV plant () for all three H2-CAES configurations. Almost 100% of is consumed by the PEM electrolyzer for the γ H2-CAES configuration, which produces, on site, 1874 tons of hydrogen per year. The hydrogen production of the other δ and α configurations is almost the same. The natural gas consumption of the CH4-CAES plant is 2.4 times higher (4538 t/year) due to the lower LHV. With reference to carbon dioxide emissions, calculated as suggested by Egware et al. [41], the H2-CAES (γ, δ, α) avoid emitting 34,125 tons of CO2 per year. For the three H2-CAES configurations, the PEM electrolyzer to compressor energy ratio () shows that the energy required to produce the necessary hydrogen is 2.65 times higher than the energy required to compress the air. The output to input electricity ratio is around 0.35, meaning that the H2-CAES plant is able to shift around 35% of the electricity it consumes towards the night hours. The output to PV energy ratio () varies from 0.47 to 0.33 when passing from case γ to case α. The γ case is be preferred because the same energy output is obtained with less PV energy.
4. Conclusions
In this study, a CO2-free diabatic Compressed Air Energy Storage (CAES) plant was proposed and analyzed. The plant originated from the McIntosh diabatic CAES plant, and downscaled by a factor of 2.62, where the natural gas required for combustion is replaced by green hydrogen and produced on site by a PEM electrolyzer powered by a PV plant.
The hydrogen production of the H2-CAES system depends on the PV power profile, while the compressor train is connected to the grid; this way, the system flexibility is also extended to a service of the demand side response.
The plant’s components and its performances were analyzed based on a yearly simulation in order to maximize the self-consumption share of the PV energy production for the same energy production of the CH4-CAES plant. The components of the hydrogen production system were sized according to maximum and minimum discharge times evaluated to be within the range of 5–9 h and 5–15 h, respectively. Additionally,, the influences of the size of the PV plant (in the range 40–100 MW) and the PEM electrolyzer (in the range 40–85 MW) were analyzed in detail.
Higher self-consumption shares and output energies can be obtained by increasing the maximum discharge time because more PV energy can be collected, and longer-lasting discharges can be run. On the other hand, lower self-consumption shares and output energies can be obtained when increasing the minimum discharge time, because of the more limited operational range of the system.
Choosing a PEM electrolyzer with a slightly lower capacity compared to the nominal power of the PV system results in an equivalent self-consumption and energy output as a PEM electrolyzer with the same capacity as the PV system. This equivalence arises from the more frequent operation of the PEM electrolyzer under nominal conditions.
The H2-CAES configuration that minimizes the size of the hydrogen production system was identified as being composed of a 70 MW PV plant coupled to a 55 MW PEM electrolyzer, resulting in a minimum and maximum discharge time of 5 h and 10 h, respectively.
The comparison of the H2-CAES plant to the CH4-CAES plant demonstrates that the proposed configuration can match the performances of the conventional CAES plant while avoiding the emissions of 34,125 tons of CO2 per year due to the PV-powered PEM electrolyzer, which produces around 1900 t/year of green hydrogen successively burned for power generation. The H2-CAES system is able to shift around 35% of the electrical energy used during the charge phase by the air compressor train and by the PEM electrolyzer, towards the nighttime and utilizes about 100% of the available PV energy. This study also demonstrated how different configurations allow us to provide diverse services to the grid, increasing the flexibility of the plant.
Considering the promising performance of H2-CAES, an interesting development of this research could be directed towards a comprehensive environmental, technical, and economic analysis of this technology.
Author Contributions
Conceptualization, L.M., D.M. and D.C.; Methodology, L.M. and D.M.; Software, L.M. and D.M.; Validation, L.M., D.M. and D.C.; Formal analysis, L.M. and D.M.; Investigation, L.M. and D.M.; Writing—original draft, L.M., D.M. and D.C.; Writing—review & editing, L.M., D.M. and D.C.; Funding acquisition, D.C. All authors have read and agreed to the published version of the manuscript.
Funding
This paper forms part of a research project cofounded under the National Recovery and Resilience Plan (NRRP), Mission 4 Component 2 Investment 1.3—Call for tender No. 1561 of 11.10.2022 of Ministero dell’Università e della Ricerca (MUR); funded by the European Union—NextGenerationEU. Project code PE0000021, Concession Decree No. 1561 of 11.10.2022 adopted by Ministero dell’Università e della Ricerca (MUR), CUP F53C22000770007, according to attachment E of Decree No. 1561/2022, Project title “Network 4 Energy Sustainable Transition—NEST” and under the project entitled “Advanced Energy Storage Systems for Sustainable Communities”, funded by the University of Cagliari with financial support from Fondazione di Sardegna, year 2019 (CUP F72F20000340007).
Data Availability Statement
Data will be made available on request.
Conflicts of Interest
The authors declare no conflict of interest. The funders had no role in the design of the study; in the collection, analyses, or interpretation of data; in the writing of the manuscript; or in the decision to publish the results.
Nomenclature
| Symbols | |
| A | area [m2] |
| E | energy [kWh] |
| F | Faraday constant [C/mol] |
| GTI | Global Tilted Irradiance [W/m2] |
| i | current density [A/cm2] |
| I | current [A] |
| LHV | lower heating value [MJ/kg] |
| n | mole rate [mol/s] |
| P | power [kW] |
| R | gas constant [J/molK] |
| T | temperature [K] |
| t | time [h] |
| V | Voltage [V] |
| z | number of electrons |
| overpotential [V] | |
| overpotential [V] | |
| transfer coefficient | |
| constant coefficient | |
| conductivity | |
| humidity factor | |
| Subscripts | |
| act | activation |
| C | Compressor |
| CC | Combustion Chamber |
| c | charge |
| d | discharge |
| diff | diffusion |
| H2 | Hydrogen |
| m | membrane |
| min | minimum |
| max | maximum |
| ohm | ohmic |
| rev | reversible |
| su | start-up |
| Acronyms | |
| A-CAES | Adiabatic CAES |
| CAES | Compressed Air Energy Storage |
| D-CAES | Diabatic CAES |
| HE | Heat Exchanger |
| HP | High Pressure |
| LCHS | Levelized Cost of Hydrogen Storage |
| LP | Low Pressure |
| PEM | Proton Exchange Membrane |
| PV | Photovoltaic |
| R | Regeneration level |
| RE | Renewable Energy |
| SC | Self-Consumption |
| TIC | Total Installed Cost |
| TIP | Turbine Inlet Pressure |
| TIT | Turbine Inlet Temperature |
References
- REPowerEU: Affordable, Secure and Sustainable Energy for Europe. Available online: https://commission.europa.eu/strategy-and-policy/priorities-2019-2024/european-green-deal/repowereu-affordable-secure-and-sustainable-energy-europe_en (accessed on 12 September 2023).
- Global Energy Review 2021—Analysis—IEA. Available online: https://www.iea.org/reports/global-energy-review-2021 (accessed on 12 September 2023).
- Cevik, S. Climate Change and Energy Security: The Dilemma or Opportunity of the Century? IMF Work. Pap. 2022, 2022, 174. [Google Scholar] [CrossRef]
- International Renewable Energy Agency: Renewable Energy Statistics. 2023. Available online: https://www.irena.org/Publications/2023/Jul/Renewable-energy-statistics-2023 (accessed on 12 September 2023).
- International Energy Agency. Renewable Energy Market Update—June 2023; IEA: Paris, France, 2023. [Google Scholar]
- O’Shaughnessy, E.; Cruce, J.R.; Xu, K. Too much of a good thing? Global trends in the curtailment of solar PV. Sol. Energy 2020, 208, 1068–1077. [Google Scholar] [CrossRef] [PubMed]
- International Energy Agency. World Energy Outlook 2022; IEA: Paris, France, 2022. [Google Scholar]
- Jin, X.; Wu, Q.; Jia, H. Local flexibility markets: Literature review on concepts, models and clearing methods. Appl. Energy 2020, 261, 114387. [Google Scholar] [CrossRef]
- Gržanić, M.; Capuder, T. Collaboration model between Distribution System Operator and flexible prosumers based on a unique dynamic price for electricity and flexibility. Appl. Energy 2023, 350, 121735. [Google Scholar] [CrossRef]
- Banihabib, R.; Lingstädt, T.; Wersland, M.; Kutne, P.; Assadi, M. Development and testing of a 100 kW fuel-flexible micro gas turbine running on 100% hydrogen. Int. J. Hydrogen Energy 2023. [Google Scholar] [CrossRef]
- International Energy Agency Gas—IEA. Available online: https://www.iea.org/energy-system/fossil-fuels/natural-gas (accessed on 12 September 2023).
- Skabelund, B.B.; Jenkins, C.D.; Stechel, E.B.; Milcarek, R.J. Thermodynamic and emission analysis of a hydrogen/methane fueled gas turbine. Energy Convers. Manag. X 2023, 19, 100394. [Google Scholar] [CrossRef]
- IEA. Global Hydrogen Review 2023—Analysis—IEA. Available online: https://www.iea.org/reports/global-hydrogen-review-2023 (accessed on 12 September 2023).
- Kousksou, T.; Bruel, P.; Jamil, A.; El Rhafiki, T.; Zeraouli, Y. Energy storage: Applications and challenges. Sol. Energy Mater. Sol. Cells 2014, 120, 59–80. [Google Scholar] [CrossRef]
- He, W.; Dooner, M.; King, M.; Li, D.; Guo, S.; Wang, J. Techno-economic analysis of bulk-scale compressed air energy storage in power system decarbonisation. Appl. Energy 2021, 282, 116097. [Google Scholar] [CrossRef]
- Beaudin, M.; Zareipour, H.; Schellenberglabe, A.; Rosehart, W. Energy storage for mitigating the variability of renewable electricity sources: An updated review. Energy Sustain. Dev. 2010, 14, 302–314. [Google Scholar] [CrossRef]
- Budt, M.; Wolf, D.; Span, R.; Yan, J. A review on compressed air energy storage: Basic principles, past milestones and recent developments. Appl. Energy 2016, 170, 250–268. [Google Scholar] [CrossRef]
- Huang, Y.; Chen, H.S.; Zhang, X.J.; Keatley, P.; Huang, M.J.; Vorushylo, I.; Wang, Y.D.; Hewitt, N.J. Techno-economic Modelling of Large Scale Compressed Air Energy Storage Systems. Energy Procedia 2017, 105, 4034–4039. [Google Scholar] [CrossRef]
- Bazdar, E.; Nasiri, F.; Haghighat, F. An improved energy management operation strategy for integrating adiabatic compressed air energy storage with renewables in decentralized applications. Energy Convers. Manag. 2023, 286, 117027. [Google Scholar] [CrossRef]
- Zhang, Y.; Davis, D.; Brear, M.J. The role of hydrogen in decarbonizing a coupled energy system. J. Clean. Prod. 2022, 346, 131082. [Google Scholar] [CrossRef]
- Lund, H.; Salgi, G.; Elmegaard, B.; Andersen, A.N. Optimal operation strategies of compressed air energy storage (CAES) on electricity spot markets with fluctuating prices. Appl. Therm. Eng. 2009, 29, 799–806. [Google Scholar] [CrossRef]
- Ramadan, O.; Omer, S.; Ding, Y.; Jarimi, H.; Chen, X.; Riffat, S. Economic evaluation of installation of standalone wind farm and wind + CAES system for the new regulating tariffs for renewables in Egypt. Therm. Sci. Eng. Prog. 2018, 7, 311–325. [Google Scholar] [CrossRef]
- Abbaspour, M.; Satkin, M.; Mohammadi-Ivatloo, B.; Lotfi, F.H.; Noorollahi, Y. Optimal operation scheduling of wind power integrated with compressed air energy storage (CAES). Renew. Energy 2013, 51, 53–59. [Google Scholar] [CrossRef]
- Sharma, S.; Ghoshal, S.K. Hydrogen the future transportation fuel: From production to applications. Renew. Sustain. Energy Rev. 2015, 43, 1151–1158. [Google Scholar] [CrossRef]
- Gahleitner, G. Hydrogen from renewable electricity: An international review of power-to-gas pilot plants for stationary applications. Int. J. Hydrogen Energy 2013, 38, 2039–2061. [Google Scholar] [CrossRef]
- Guo, L.; Su, J.; Wang, Z.; Shi, J.; Guan, X.; Cao, W.; Ou, Z. Hydrogen safety: An obstacle that must be overcome on the road towards future hydrogen economy. Int. J. Hydrogen Energy, 2023, in press. [CrossRef]
- Abohamzeh, E.; Salehi, F.; Sheikholeslami, M.; Abbassi, R.; Khan, F. Review of hydrogen safety during storage, transmission, and applications processes. J. Loss Prev. Process. Ind. 2021, 72, 104569. [Google Scholar] [CrossRef]
- Buttner, W.J.; Post, M.B.; Burgess, R.; Rivkin, C. An overview of hydrogen safety sensors and requirements. Int. J. Hydrogen Energy 2011, 36, 2462–2470. [Google Scholar] [CrossRef]
- Abdin, Z.; Khalilpour, K.; Catchpole, K. Projecting the levelized cost of large scale hydrogen storage for stationary applications. Energy Convers. Manag. 2022, 270, 116241. [Google Scholar] [CrossRef]
- Taibi, E.; Blanco, H.; Miranda, R.; Carmo, M. Green Hydrogen Cost Reduction: Scaling Up Electrolysers to Meet the 1.5 °C Climate Goal; International Renewable Energy Agency: Abu Dhabi, United Arab Emirates, 2020; Volume 105. [Google Scholar]
- Renewable Power Generation Costs in 2022. Available online: https://www.irena.org/Publications/2023/Aug/Renewable-Power-Generation-Costs-in-2022 (accessed on 12 September 2023).
- Natural Gas Price Statistics—Statistics Explained. Available online: https://ec.europa.eu/eurostat/statistics-explained/index.php?title=Natural_gas_price_statistics#Natural_gas_prices_for_non-household_consumers (accessed on 12 September 2023).
- Nakhamkin, M.; Andersson, L.; Swensen, E.; Howard, J.; Meyer, R.; Schainker, R.; Pollak, R.; Mehta, B. AEC 110 MW CAES Plant: Status of Project. J. Eng. Gas Turbines Power 1992, 114, 695–700. [Google Scholar] [CrossRef]
- Crotogino, F. Huntorf CAES: More than 20 Years of Successful Operation. In Proceedings of the Solution Mining Research Institute (SMRI) Spring Meeting, Orlando, FL, USA, 15–18 April 2001. [Google Scholar]
- Energy Communities Repository—Homepage. Available online: https://energy-communities-repository.ec.europa.eu/index_en (accessed on 12 September 2023).
- The MathWorks Inc. MATLAB Version: (R2023a) Update 3. 2023. Available online: https://www.mathworks.com (accessed on 12 September 2023).
- Casey, M.; Robinson, C. A Method to Estimate the Performance Map of a Centrifugal Compressor Stage. J. Turbomach. 2012, 135, 021034. [Google Scholar] [CrossRef]
- Duffie, J.A.; Beckman, W.A.; Worek, W.M. Solar Engineering of Thermal Processes. J. Sol. Energy Eng. 1994, 116, 67–68. [Google Scholar] [CrossRef]
- Meteonorm Version: 7.2. Available online: https://meteonorm.com/ (accessed on 12 September 2023).
- Zhao, L.; Brouwer, J.; Samuelsen, S. Dynamic Analysis of a Self-Sustainable Renewable Hydrogen Fueling Station. In Proceedings of the ASME 2014 12th International Conference on Fuel Cell Science, Engineering and Technology, Boston, MA, USA, 30 June–2 July 2014. [Google Scholar] [CrossRef]
- Egware, H.O.; Kwasi-Effah, C.C. A novel empirical model for predicting the carbon dioxide emission of a gas turbine power plant. Heliyon 2023, 9, e14645. [Google Scholar] [CrossRef]
Figure 1.
Scheme of the proposed H2-CAES system.

Figure 2.
Power output profile of the H2-CAES plant.

Figure 3.
(a) as a function of for different values of ( = 70 MW and = 55 MW); (b) as a function of for different values of ( = 70 MW and = 55 MW).
Figure 3.
(a) as a function of for different values of ( = 70 MW and = 55 MW); (b) as a function of for different values of ( = 70 MW and = 55 MW).

Figure 4.
SC as a function of and for = = 5 h and = 8 h (a), = 10 h (b) and = 12 h (c).

Figure 5.
as a function of and for = = 5 h and = 8 h (a), = 10 h (b) and = 12 h (c).

Figure 6.
Number of turbine start-ups () per month for = 10 h, = = 5 h, = 55 MW and (a) = 55 MW, (b) = 70 MW and (c) = 85 MW.
Figure 6.
Number of turbine start-ups () per month for = 10 h, = = 5 h, = 55 MW and (a) = 55 MW, (b) = 70 MW and (c) = 85 MW.

Figure 7.
Mean and maximum discharge time per month () for = 10 h, = = 5 h, = 55 MW and (a) = 55 MW, (b) = 70 MW and (c) = 85 MW.
Figure 7.
Mean and maximum discharge time per month () for = 10 h, = = 5 h, = 55 MW and (a) = 55 MW, (b) = 70 MW and (c) = 85 MW.

Figure 8.
Number of turbine start-ups ) per month for = 10 h, = = 5 h, = 70 MW and (a) = 40 MW, (b) = 55 MW and (c) = 70 MW.
Figure 8.
Number of turbine start-ups ) per month for = 10 h, = = 5 h, = 70 MW and (a) = 40 MW, (b) = 55 MW and (c) = 70 MW.

Figure 9.
Mean and maximum discharge time per month () for = 10 h, = = 5 h, = 70 MW and (a) = 40 MW, (b) = 55 MW and (c) = 70 MW.
Figure 9.
Mean and maximum discharge time per month () for = 10 h, = = 5 h, = 70 MW and (a) = 40 MW, (b) = 55 MW and (c) = 70 MW.


Table 1.
Original and down-scaled McIntosh plant parameters.
| Parameter | Original | Downscaled “CH4-CAES” |
|---|---|---|
| Turboexpander power (MW) | 110 | 42 |
| Compressor power (MW) | 53 | 21 |
| Minimum cavern pressure (bar) | 46 | 46 |
| Maximum cavern pressure (bar) | 75 | 75 |
| HP turbine inlet temperature (°C) | 538 | 538 |
| HP turbine inlet pressure (bar) | 42 | 42 |
| LP turbine inlet temperature (°C) | 871 | 871 |
| LP turbine inlet pressure (bar) | 15 | 15 |
| Weekly discharge time | 24 | 24 |
| Daily discharge time () | 5 | 5 |
| Weekly charge time | 40 | 40 |
| Energy output (MWh) | 2640 | 1008 |
| Compressor consumption (MWh) | 2120 | 840 |
Table 2.
Main parameters of the green hydrogen production system.
| Parameter | Value |
|---|---|
| PEM electrolyzer specific H2 production (kg·h−1/MW) | 17 |
| PEM electrolyzer operating pressure (bar) | 30 |
| PEM electrolyzer operating temperature (°C) | 40 |
| HP H2 storage pressure range (bar) | 46–75 |
| LP H2 storage pressure range (bar) | 16–30 |
Table 3.
Operating parameters of the reference H2-CAES plant configuration.
| Parameter | Value |
|---|---|
| Minimum discharge time ( = = 5 h) (h) | 5 |
| Maximum discharge time () (h) | 10 |
| Photovoltaic system nominal power () (MW) | 70 |
| PEM electrolyzer nominal power () (MW) | 55 |
| Compressor power (MW) | 21 |
| Turboexpander power (MW) | 42 |
| Nominal charge air mass flow rate (kg/h) | 132,000 |
| Nominal charge H2 mass flow rate (kg/h) | 935 |
| Nominal discharge air mass flow rate (kg/h) | 219,600 |
| Nominal discharge H2 mass flow rate (kg/h) | 1495 |
| H2 storage volume (m3) | 11,300 |
| Cavern pressure range (bar) | 46–75 |
| HP turbine inlet pressure (bar) | 42 |
| LP turbine inlet pressure (bar) | 15 |
| Compressors inlet temperature (°C) | 35 |
| Compressors outlet temperature (°C) | ~150 |
| HP turbine inlet temperature (°C) | 538 |
| LP turbine inlet temperature (°C) | 871 |
Table 4.
Different combinations of , , and SC for = 52.5 GWh.
| Combination | SC | |||
|---|---|---|---|---|
| α | 100 | 40 | 8 | 0.69 |
| β | 70 | 70 | 10 | 1.00 |
| γ | 70 | 55 | 10 | 0.99 |
| δ | 85 | 40 | 10 | 0.82 |
| ε | 70 | 70 | 12 | 1.00 |
| ζ | 70 | 55 | 12 | 0.99 |
| ϑ | 85 | 40 | 12 | 0.82 |
Table 5.
Comparative results between CH4-CAES and H2-CAES.
| Case | CH4-CAES | H2-CAES (γ) | H2-CAES (δ) | H2-CAES (α) |
|---|---|---|---|---|
| PV plant nominal power (MW) | - | 70 | 85 | 100 |
| PEM electrolyzer nominal power (MW) | - | 55 | 40 | 40 |
| for H2) (h) | 5 | 5 | 5 | 5 |
| ) (h) | 24 | 10 | 10 | 8 |
| PV ) (GWh/year) | - | 110.8 | 134.55 | 158.3 |
| ) (GWh/year) | - | 110.4 | 110.8 | 109.5 |
| Self-consumption (SC) (%) | - | 99.6 | 82.3 | 69.2 |
| ) (GWh/year) | 41.6 | 41.6 | 41.6 | 41.5 |
| ) (GWh/year) | 52.5 | 52.5 | 52.5 | 52.3 |
| Fuel consumption (t/year) | 4538 | 1874 | 1878 | 1868 |
| CO2 emissions during operation (tCO2,eq) | 34,125 | 0 | 0 | 0 |
| PEM electrolyzer to compressor energy ratio | - | 2.65 | 2.66 | 2.64 |
| - | 0.35 | 0.34 | 0.35 | |
| Output to PV energy ratio ) | - | 0.47 | 0.39 | 0.33 |
Disclaimer/Publisher’s Note: The statements, opinions and data contained in all publications are solely those of the individual author(s) and contributor(s) and not of MDPI and/or the editor(s). MDPI and/or the editor(s) disclaim responsibility for any injury to people or property resulting from any ideas, methods, instructions or products referred to in the content. |
© 2023 by the authors. Licensee MDPI, Basel, Switzerland. This article is an open access article distributed under the terms and conditions of the Creative Commons Attribution (CC BY) license (https://creativecommons.org/licenses/by/4.0/).
Share and Cite
MDPI and ACS Style
Migliari, L.; Micheletto, D.; Cocco, D. Performance Analysis of a Diabatic Compressed Air Energy Storage System Fueled with Green Hydrogen. Energies 2023, 16, 7023. https://doi.org/10.3390/en16207023
AMA Style
Migliari L, Micheletto D, Cocco D. Performance Analysis of a Diabatic Compressed Air Energy Storage System Fueled with Green Hydrogen. Energies. 2023; 16(20):7023. https://doi.org/10.3390/en16207023
Chicago/Turabian StyleMigliari, Luca, Davide Micheletto, and Daniele Cocco. 2023. "Performance Analysis of a Diabatic Compressed Air Energy Storage System Fueled with Green Hydrogen" Energies 16, no. 20: 7023. https://doi.org/10.3390/en16207023
Note that from the first issue of 2016, this journal uses article numbers instead of page numbers. See further details here.