

Which Policies and Factors Drive Electric Vehicle Use in Nepal?

1
Alternative Energy Promotion Center (AEPC), Mid Baneshwor, Kathmandu 44600, Nepal
2
Technology Management, Economics and Policy Program (TEMEP), Seoul National University, 1 Gwanak-ro, Gwanak-gu, Seoul 08826, Republic of Korea
3
Technology Management, Economics and Policy Program (TEMEP) & Graduate School of Engineering Practice, Seoul National University, 1 Gwanak-ro, Gwanak-gu, Seoul 08826, Republic of Korea
*
Author to whom correspondence should be addressed.
Energies 2023, 16(21), 7428; https://doi.org/10.3390/en16217428
Submission received: 13 August 2023
/
Revised: 10 September 2023
/
Accepted: 24 October 2023
/
Published: 3 November 2023
(This article belongs to the Topic Clean Energy Technologies and Assessment)
Abstract
:Electric vehicles (EVs) offer a viable technological solution for mitigating greenhouse gas emissions in the transportation industry, addressing pressing societal concerns regarding climate change, air pollution, and sustainable energy consumption. To effectively promote widespread adoption of EVs, it is crucial to understand consumer preferences and evaluate market dynamics. In Nepal, where proven fossil fuel reserves are absent, the government is actively working towards accelerating EV adoption, leveraging the nation’s significant hydroelectric power generation potential to fulfill EVs’ charging demands. To gain insight into consumer preferences and evaluate market dynamics regarding EVs in Nepal, this study employs a comprehensive approach. Stated preference data are collected through a meticulously designed survey, and sophisticated analytical techniques, namely, the mixed logit model and latent class model, are applied for estimation purposes. The results of this study show that potential EV consumers with small family sizes, lower monthly travel distances, heightened environmental awareness, and substantial knowledge about electric vehicles are more inclined to embrace EV technology. Notably, the study highlights that a reduction in the purchase price exerts the most significant influence on increasing consumers’ likelihood of adopting battery electric vehicles (BEVs) and plug-in hybrid electric vehicles (PHEVs). Market simulation results suggest that a policy mix scenario, encompassing a combination of supportive measures, proves more effective in promoting EV adoption compared to relying on single policy initiatives. Furthermore, through latent class estimation, the study identifies three distinct classes of consumers within Nepal, each exhibiting significant variations in preferences. Recognizing and addressing these variations within policy frameworks is crucial for the successful promotion and widespread acceptance of EVs in Nepal.
1. Introduction
The transportation sector is one of the major contributors to greenhouse gas emissions. Electric vehicles (EVs) have come into greater focus in the mitigation of climate change. EVs, green cars, might be an alternative for fuel substitution with substantial societal and individual benefits [1,2]; however, EVs have not massively penetrated the global market [3]. Electric vehicles (EVs), when battery-charged with renewable or sustainable sources of electricity, can further contribute to addressing climate change issues [4]. Consumers are skeptical of their travel needs for EVs, but addressing the social issues regarding climate change, air pollution, and sustainable energy demands that many more consumers become EV users [5]. Automobile makers are setting strategies for the development of alternative fuel vehicles (AFVs). Likewise, governments are framing different policies for infrastructure development, purchase price subsidies, research and development support, and awareness campaigns to increase the supply and demand of EVs. Even though EVs emit lower pollution, they have some disadvantages such as a higher purchase price than internal combustion vehicles (ICVs), a lack of infrastructures, a lack of massive development, and a low-level market penetration [4,6,7].
Governments around the globe are setting strategies and policies in order to expand the EV market and accelerate the market’s transition [8]. Although the potential of EV technology is to mitigate the climate change issue in the transportation sector, their market penetration depends on consumer preferences and behaviors [9]. In this context, many previous studies have been conducted on consumer preferences using the stated preference method. It is important to examine how consumers perceive EVs and to conduct policy simulations under various scenarios. Consumers consider various aspects before purchasing vehicles, such as purchase price, fuel cost, purchase subsidy, the presence of infrastructures, technical performance, and many others. Consequently, consumer preferences’ analysis of these factors might provide relevant information to policymakers for formulating and analyzing policies. In order to stimulate the use of EVs, great efforts in technological innovation from the automakers and a wide package of policies from the government should come into play [10]. In addition, environmental awareness and proper knowledge of EVs in potential consumers will increase the likelihood of choosing said vehicles [3].
The government of Nepal is also among those governments aiming to accelerate the use of EVs. EVs have important implications in Nepal. Nepal does not have any fossil fuel reserves such as coal, natural gas, and petroleum. Though the country has a high potential for hydropower (approximately 83 GW), its currently installed capacity is very low [11,12,13]. However, a large number of hydropower projects at different stages of construction could provide sufficient electricity for EV charging stations in the upcoming years [14]. Nepal is an attractive country for EV use because the generation of electricity mainly comes from hydropower. Petroleum products imported from neighboring countries provide approximately 13% of the country’s total energy supply. This share of petroleum products could be reduced if the country increased its hydroelectricity production and its use in the vehicle sector; this might also be expected to limit the increasing of its trade deficit [14].
Countries might differ in terms of their potential for EV use depending on their economic situation, geographic conditions, and energy resources’ availability [15]. Countries with different cultures, infrastructure development levels, and travel patterns may yield substantially different results [9]. Thus, the results of a particular study may not necessarily apply to another country; a country-specific analysis is important. Various previous studies have presented their findings based on a country-specific context consideration of vehicle attributes. However, we could not find a consumer preferences’ study on EVs in Nepal. In such studies, there can be substantial individual differences in the acceptance of EVs [16]. Moreover, an important question being asked in said studies seeks to understand how variables such as consumer socio-demographic factors, travel characteristics, and environmental knowledge impact the adaptation of EVs [17,18]. We might expect results that are more explicit when we integrate, in a consumer preferences’ study on EVs, these variables alongside vehicle attributes. Thus, the current study attempts to overcome these gaps. A robust tabular comparison of the proposed analysis to other state-of-the-art studies and analyses is presented in Table 1.
The tabular comparison (Table 1) highlights the following prevalent drawback across previous studies, which is the absence of a comprehensive approach:
- In the study by Hahn et al. (2018) [19], the main objective was to assess the relative impacts of green vehicles’ attributes in Seoul, South Korea. However, the study did not explore the specific preferences or factors influencing the adoption of green vehicles beyond general attributes such as price, operating cost, range, fuel stations, and fuel type.
- Javid and Nejat (2017) [20] focused on exploring factors associated with PEV (plug-in electric vehicle) adoption and estimating PEV market penetration in the USA. Although they used logistic regression and probit models, their study did not thoroughly investigate the role of charging stations and gas prices as tools for transportation planners and city authorities to regulate PEV technology.
- Shim, Kim, Altmann, Yoon, and Kim (2018) [21] analyzed key features for electric vehicle diffusion and its impact on the Korean power market. However, their study did not extensively examine the impact of accessibility and fuel cost on electric vehicle adoption.
- Rahmani and Loureiro (2019) [22] conducted a study on preferences for hybrid electric vehicles in Spain. While they examined factors such as price, fuel cost, emissions, and fuel type, their study did not address the lack of interest in hybrid electric vehicle adaptation due to misinformation and false beliefs about the vehicles’ quality.
- Guerra (2017) [23] evaluated the potential of electric motorcycles in a small Indonesian city, considering factors such as price, fuel price, range, charge time, and maximum speed. However, their study did not thoroughly analyze the variation in preferences for motorcycle features or the substantial importance of speed, range, charge time, and price.
- Rajper and Albrecht (2020) [24] examined the prospects of electric vehicles in developing countries, focusing on the price factor. However, their study did not differentiate between electric four-wheelers and electric two-wheelers, leading to a lack of feasibility analysis for electric four-wheelers.
- Manutworakit and Choocharukul (2022) [25] studied the factors influencing battery electric vehicle adoption in Thailand, considering user behavior and policy. However, their study did not adequately analyze the influence of facilitating conditions on purchase intention and user behavior, except for the age variable.
- Ye, Kang, Li, and Wang (2021) [26] explored how combinations or configurations of psychological and policy attributes jointly influence consumers’ electric vehicle purchase intentions in China. However, their study did not specify the configurations of attributes that lead to high purchase intentions, focusing only on the inclusion of at least one psychological attribute.
- Li, Wang, Chen, and Wang (2020) [27] investigated consumer preferences for different products and policy attributes in China. Although they conducted an experimental survey, their study did not analyze the preference difference among the existing policy incentives after purchase subsidies were abolished.
- Singh, Singh, and Vaibhav (2020) [28] conducted a meta-analysis investigating the factors influencing consumers’ intention to adopt electric vehicles in India. Their study highlighted a significant increase in research on influencing factors over the past decade.
- Adhikari, Ghimire, Kim, Aryal, and Khadka (2020) [29] presented a framework for the identification and analysis of barriers against the use of electric vehicles (EVs) in Nepal. However, their study did not thoroughly address the specific types of barriers, such as technical, policy, economic, infrastructure, and social barriers.
Based on the literature review conducted above, several studies have explored the policies and factors influencing electric vehicle (EV) adoption in developed countries, as well as in some developing countries. However, these studies have not adequately addressed the specific context of Nepal. It is important to note that Nepal possesses distinct economic conditions, geographic characteristics, and availability of energy resources, which significantly influence consumer preferences for EVs. Therefore, it cannot be assumed that the findings of studies conducted in other countries are directly applicable to Nepal. To gain a comprehensive understanding of EV adoption in Nepal, a country-specific analysis considering its unique circumstances is essential.
This study significantly contributes to addressing the identified research gap in the following key ways:
- Identification of Research Gap: This study identifies a research gap regarding consumer preferences for electric vehicles (EVs) in Nepal. Existing studies have not thoroughly investigated this topic in the specific context of Nepal, which has unique economic conditions, geographic characteristics, and energy resource availability.
- Comprehensive Analysis of EV Attributes: This study contributes to the literature by conducting a comprehensive analysis of the relative importance of EV attributes, including purchase price, infrastructure availability, fuel cost, and range. This analysis fills a gap in the literature by providing insights specific to the Nepalese context and helps one to understand the factors driving consumer preferences for EVs.
- Integration of Socio-demographic and Travel Characteristics: To further enhance understanding, this study incorporates consumers’ socio-demographic factors, travel characteristics, and environmental concerns in the analysis of EV preferences. This inclusion provides a more nuanced understanding of the factors influencing consumer choices in Nepal, bridging the gap between existing studies and the specific context.
- Market Simulations and Policy Effectiveness: This study goes beyond analyzing preferences and extends to evaluating the effectiveness of policies in stimulating EV demand through market simulations. By considering different scenarios, this research provides valuable insights into the potential impact of policy interventions, filling a gap in the knowledge regarding the effectiveness of specific policies in the Nepalese context.
- Latent Class Model for Consumer Segmentation: Another significant contribution of this study is the use of the latent class model (LCM) to identify distinct consumer segments. This approach enables a deeper understanding of heterogeneity among consumers and helps identify different classes of individuals based on various membership variables. This analysis adds a novel perspective to the existing literature by uncovering variations in preferences within the Nepalese consumer base.
- Methodological Advancement: This study employs a mixed logit model and integrates stated preference conjoint survey data to estimate the relative importance of EV attributes. This methodological approach contributes to the advancement of research techniques in the field of consumer preferences for EVs in Nepal, providing a solid foundation for future studies.
Thus, the main objective of this study is to analyze consumer preferences regarding EV use in Nepal. This study contributes to the extension of existing studies in four ways. First, we analyzed the relative importance of EVs’ attributes based on a stated preference conjoint survey. Internal combustion vehicle (ICV), plug-in hybrid electric vehicles (PHEV), and battery electric vehicles (BEV) were considered. Moreover, the attributes considered were the purchase price, the infrastructure availability, the fuel cost, and the range. We used the mixed logit model for the estimation. Second, together with the attributes, this study accommodated consumers’ socio-demographic factors, travel characteristics, and environmental concerns to analyze their preferences. Third, different scenarios-based market simulations were performed to analyze the effectiveness of policies to stimulate the demand for EVs. Fourth, another feature of this study was its latent class model (LCM) formulation in order to identify consumers’ segments. The segments were explained based on the various class membership variables. This paper is organized as follows. In Section 2, a comprehensive overview of the research design is discussed. Then, brief explanations of the mixed logit model and the latent class model are presented in Section 3. Section 4 presents the results obtained through estimation. Finally, in Section 5, the conclusion is presented.
2. Research Design
2.1. Conjoint Method
The conjoint method is a statistical method that can be applied to a consumer preferences’ study for any product. This method originates from the idea that any product or service can be described with a certain number of attributes. It has been widely used to measure how consumers provide value to each attribute. In addition, it is a popular method for analyzing new products based on stated preference surveys when revealed preference data have not been sufficiently gathered. We adopted the conjoint method approach to this study in the following steps [30,31,32].
2.1.1. Step I: Attributes Selection
Vehicles can be described on the basis of attributes. Then, each attribute can be decomposed into a certain number of levels. We considered three types of vehicles for the context of Nepal, as follows: internal combustion vehicle (ICV), battery electric vehicle (BEV), and plug-in hybrid electric vehicle (PHEV). We set the purchase price, infrastructure availability, fuel cost, and range as the key attributes that affect consumers’ choice of vehicle. Furthermore, each attribute was decomposed into a certain number of levels. Table 2 shows the summary of the attributes used with their levels.
The purchase price is considered in most of the consumer preference studies on AFVs. Relatively, the purchase price is higher for EVs than ICVs. We considered the purchase price attribute with two levels for the ICV and three levels for the BEV and PHEV. This study defines infrastructure availability as the availability of gasoline stations and maintenance workshops for the ICV. We fixed the current status at 100% for the ICV. For the BEV and PHEV, charging stations and maintenance workshops comparable to the ICV’s are defined as infrastructure availability with three levels. Fuel cost was set as the cost of diesel/petrol/electricity per 100 km. Furthermore, the range is defined in this study as the distance that can be traveled after a one-time full petrol storage, diesel storage, or charging of the battery. We fixed the range at 500 km for the ICV; however, we defined it as having three levels for the BEV and PHEV.
2.1.2. Step II: Choice Cards Design
For the attributes with their levels presented in Table 1, the maximum number of cards that can be created is 166 (2 × 2 + 3 × 3 × 3 × 3 + 3 × 3 × 3 × 3). However, it was unrealistic for the respondents to provide preferences for 166 cards. Thus, we used an orthogonal fractional factorial design to create 20 cards, which greatly reduced the complexity of the survey for the respondents. Then, four sets with five alternative cards each were constructed for the survey questionnaires.
2.2. Variables
The choice of the vehicle does not necessarily only depend on the attributes of the vehicle [19,20]; indeed, other variables that might better explain consumer preferences can be integrated as interaction variables [33,34]. Accordingly, this study considered the socio-demographic factors, travel characteristics, and environmental concerns variables. These variables can also be called membership variables and can be used to explain the different classes/segments of consumers [35,36]. Gender, age, education, family members, and income were considered part of the socio-demographic variables. Likewise, monthly travel distance, intention to buy a new vehicle within five years, current vehicle ownership, and frequent mountain travel were taken as part of the travel characteristics’ variables. Finally, environmental considerations while purchasing a new vehicle, electric vehicle knowledge, and working sector were considered part of the environmental concerns’ variables. A summary of the variables used in this study is shown in Table 3. Based on the above description, the overall research framework is depicted in Figure 1.
2.3. Survey and Data
The data for this study were collected through survey questionnaires administered in January/February 2019. The survey was conducted in Kathmandu, Nepal, targeting individuals at the drivers’ license office and driving institutions and vehicle users. The survey encompassed two main parts. The first part focused on eliciting respondents’ preferences regarding cars. Four sets of cars were presented, each set consisting of five cars with specific attributes. The respondents were asked to choose their preferred car from each set, enabling the analysis of car choice behavior. In the second part of the survey, respondents were queried about their socio-demographic characteristics, travel patterns, and environmental concerns. These additional factors were included to capture a comprehensive understanding of the individuals’ preferences and the underlying factors influencing their car choices. To ensure the reliability of the data, the survey was administered through face-to-face interviews. A total of 268 respondents provided completed questionnaires, resulting in a rich dataset comprising 5360 observations for analysis.
3. Model Specifications
3.1. Mixed Logit
The mixed logit model can reflect the heterogeneity of consumers and is highly flexible for accommodating other random utility models [37]. It overcomes three limitations of the logit model, as follows: random taste variation, restricted substitution patterns, and correlation in unobserved factors [38]. The utility of person n from alternative j in the choice set t is given by Equation (1), as follows:
where is the observed variables, βn is a vector of the coefficients of these variables, and εnjt is a random term with an independent and identically distributed (IID) extreme value. Then, the probability of a sequence of choices is given by Equation (2), as follows:
where is the density function of β and = 1 if the individual choses alternative j in choice situation t, zero otherwise. Allowing the coefficient to vary implies that we allow for the fact that different decision makers may have different coefficients. Then, parameters can be estimated by maximizing the simulated log-likelihood function presented in Equation (3).
where is the rth draw for decision maker n from the distribution of β and R is total number of draws. In addition, the mixed logit model can be applied to estimate each respondent’s coefficients. The expected value of the β conditional on the choice pattern yn and the set of alternatives characterized by xn for person n is given by Equation (4), as follows:
where can be estimated using simulation [39]. For a detailed explanation of the mixed logit model estimation procedure, please refer to the references [38,40,41].
3.2. Latent Class Model (LCM)
The LCM resembles the mixed logit model and is somewhat less flexible than mixed logit. However, it provides flexibility to the researcher in that it does not require having a prior assumption of distributions of coefficients. The LCM treats coefficient parameters as a discrete, based on the fact that each consumer’s choice depends on attributes and latent heterogeneity which is unobserved by the researcher. Instead, we can assume that consumers have Q classes, but the researcher does not know which consumer belongs to which class. Details of the LCM is can be found in [42]. The sequence of the choices’ probability of respondent n is given by Equation (5) as follows:
Then, the probability of respondent n belonging to class q can be specified using Equation (6).
where is the set of observable characteristics of respondents and can be called class membership variables. Parameter is normalized to zero to obtain the identification of the model [38]. Then, the log-likelihood for this model is given by Equation (7), as follows:
Then, and the Q-1 latent class parameters can be estimated by maximizing the log-likelihood Equation (7). For the details about the LCM and its estimation procedure, interested readers are referred to [42,43]. In addition, for previous studies which also applied the LCM, please refer to [33,35,36,44].
4. Results and Discussion
4.1. Mixed Logit Estimation
This mixed logit model estimation contains two parts: first, the random coefficient of the attributes that describe the impact of each attribute on the choice of vehicle and, second, the interaction variables with the BEV and the PHEV that describe the effect of consumers’ socio-demographic factors, travel characteristics, and environmental concerns on their choice of vehicle. It might be reasonable to state that most consumers do not prefer a higher price; thus, we assumed the price attribute as a log-normal distribution [21]. However, all the other attributes are considered as a normal distribution for the estimation. The coefficients are estimated based on the maximum simulated likelihood (MSL) approach, which is the same as the maximum likelihood except for the fact that simulated probabilities are used [38].
The results of the attributes-only model are presented in Table 4. The internal combustion vehicle (ICV) was considered as a base to compare to the BEV and the PHEV. In general, the coefficients of alternative specific attributes show that consumers prefer the ICV to the BEV and PHEV, while all the other variables remain constant. This implies that potential consumers have a clear, distinct preference for EVs over gasoline/diesel vehicles. As expected, the infrastructure and range variables show a positive impact on purchase, implying that consumers would prefer an increase in the infrastructure and range. Likewise, the results show a negative impact of fuel cost and purchase price; however, fuel cost is not statistically significant. Alternatively, we can say that consumers prefer a lower purchase price and a lower fuel cost.
The respondents’ socio-demographic factors, travel characteristic, and environmental concerns were integrated into a mixed logit model by creating interaction variables with the BEV and PHEV. The estimation results are presented in Table 5, the BEV and PHEV coefficients are no more statistically significant. This is because the interaction variables might explain the consumers’ preferences for the BEV and PHEV. Only some of the interaction variables are statistically significant in our estimation. The results show that, relatively, a male consumer was less likely to buy the PHEV than a female consumer. Smaller households tended to prefer the BEV, which is the opposite result to a previous study by Lixian and Didier [45]. This may reflect the limitation of the different size of BEVs for accommodating a larger family.
With regard to the effect of travel characteristics, persons having a lower monthly travel distance had a positive preference for the BEV and PHEV. This may be because a shorter travel distance would reduce the range anxiety of EVs. The respondents with the intention to buy a new vehicle within the next five years were more likely to purchase the BEV. This indicates that there is a market potential for BEVs among potential vehicle buyers. The negative coefficient on the number of vehicles available suggested that the respondents were inherent to change their current vehicle fuel type to the BEV’s.
Further, the demand for BEVs and PHEVs is higher for individuals who consider environmental concerns while purchasing a vehicle. Environmentally aware vehicle consumers have an increased preference for EVs. This demands that environmental awareness efforts should be focused on environmentally unaware consumers to accelerate the adaptation rate for EVs. Furthermore, the results reveal that a high electric vehicle knowledge increases the probability of choosing a BEV, implying that the dissemination of information about EVs and their importance would significantly contribute to their adaptation. As expected, the respondents working in the energy/environment sector had a positive relationship to choosing the PHEV.
4.2. Elasticity
Estimated coefficients of attributes imply a marginal change in utility; such changes in utility are due to the attribute having changed by one unit. However, when units are different for the attributes, the magnitudes of the coefficients are not directly comparable. Therefore, we considered estimating the elasticity effect. We used the following formula, Equation (8), for the estimation of elasticity [6]:
where ∆P is a change in choice probability and ∆Q a change in an attribute.
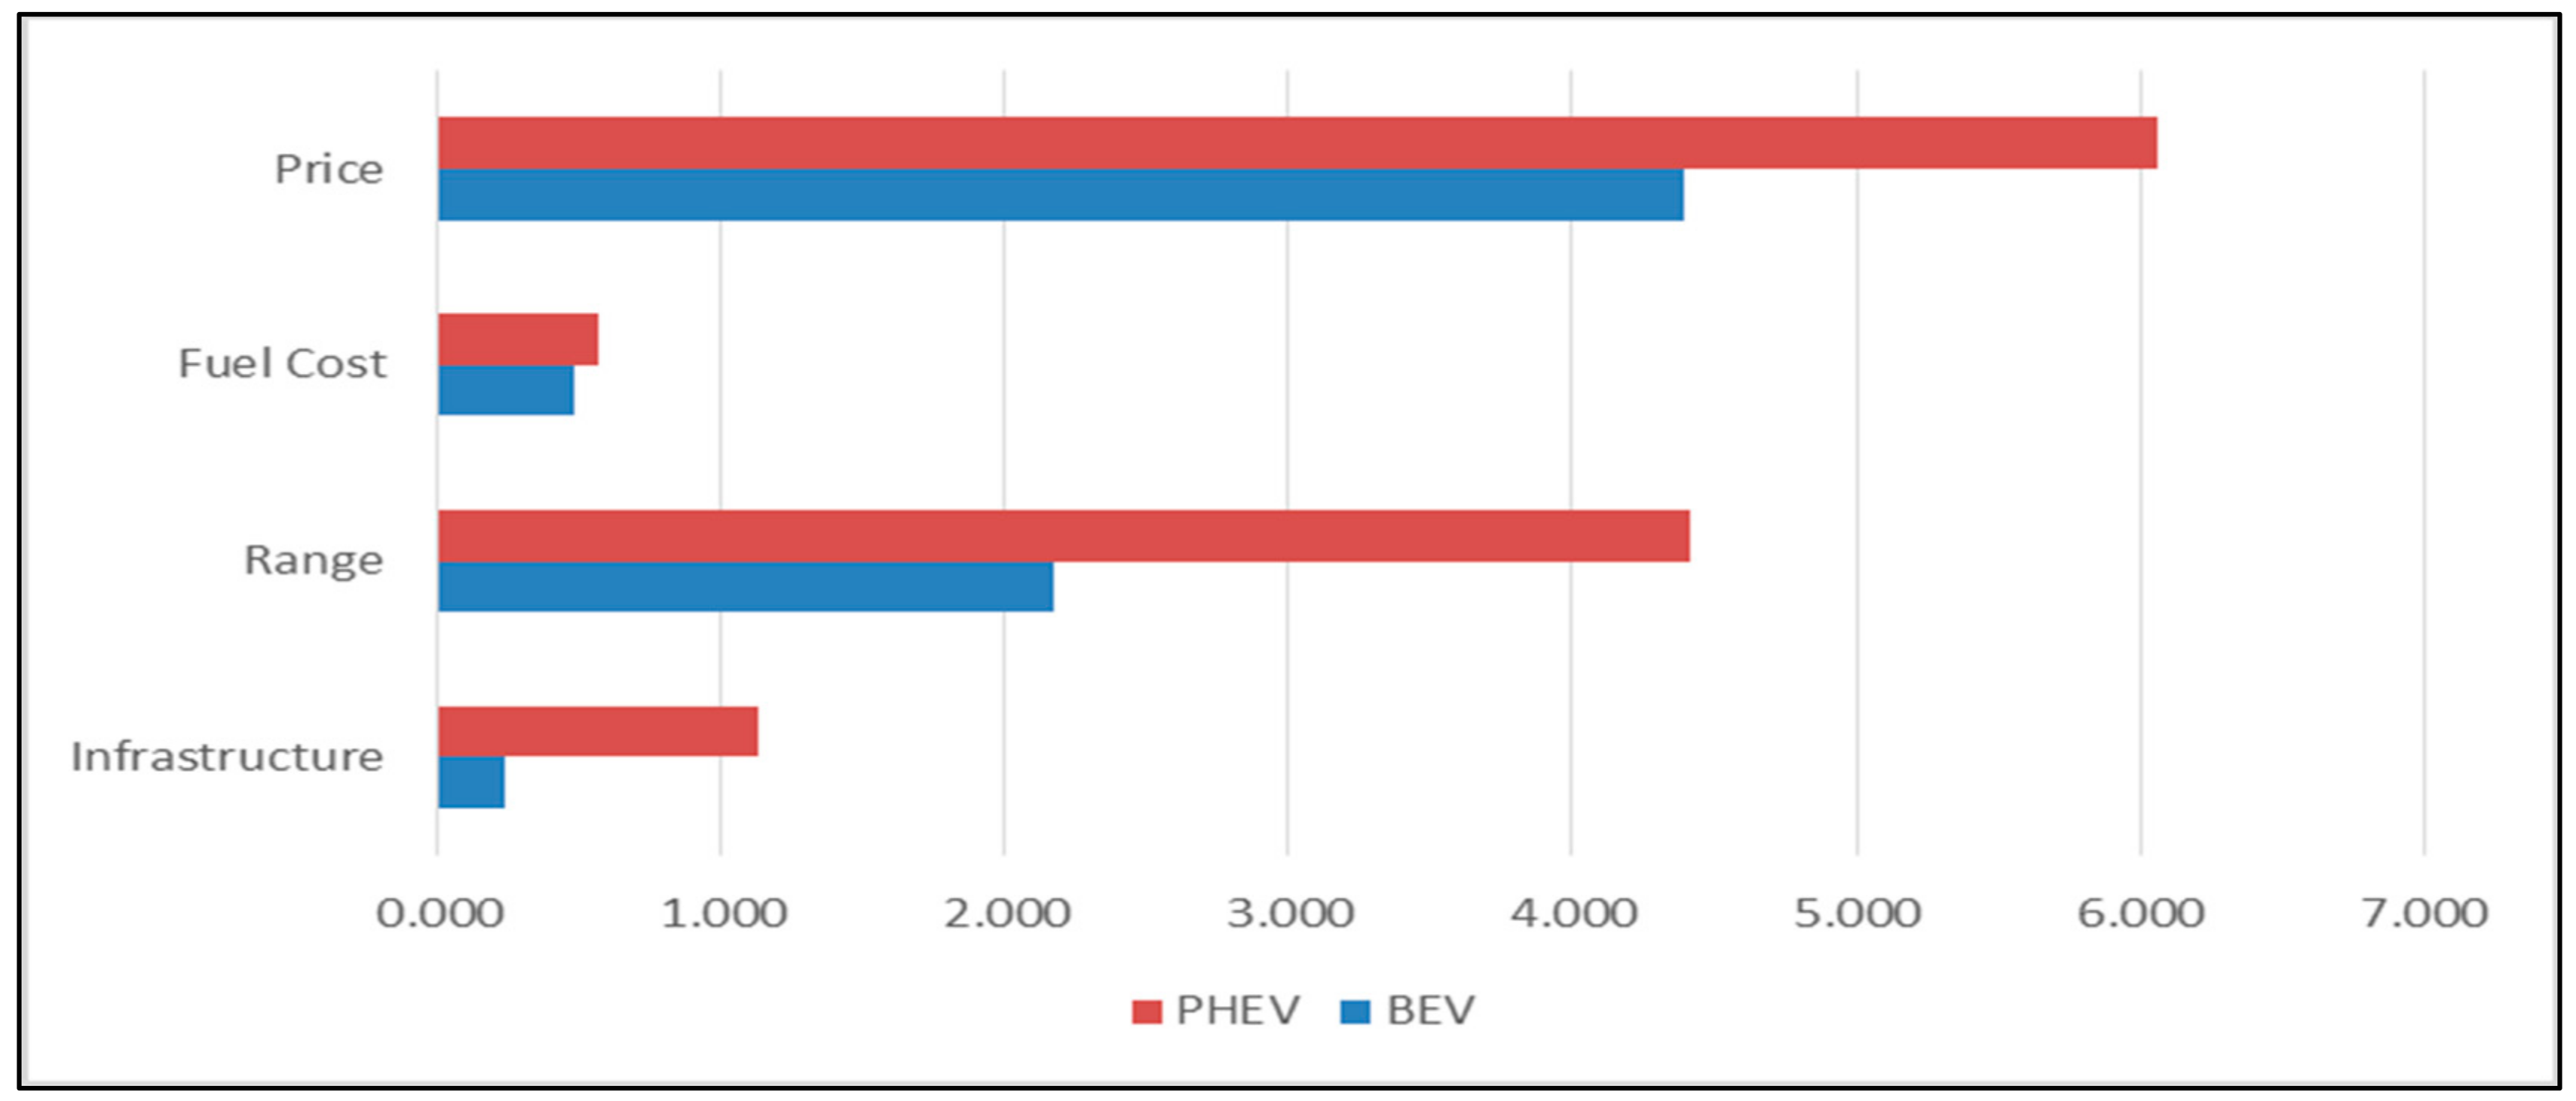
The elasticity results, shown in Figure 2, are calculated based on each attribute change of the BEV and PHEV. Figure 2 shows that the purchase price is the most influential attribute, followed by range, for the BEV and the PHEV. Alternatively, a reduction on purchase is most effective for increasing consumers’ likelihood to choose BEVs and PHEVs. The results also indicate that a reduction in fuel cost has a moderate impact and that infrastructure development has the least impact of all the variables.
4.3. Market Simulations with Different Scenarios
In order to estimate the effects of policy changes and technological advancements, we conducted market simulations to estimate the change in market share of the BEV. We formulated the base case scenario considering relatively realistic attributes based on Nepal’s market. Scenario 1 introduces a purchase subsidy in order to reduce the purchase price of BEVs, while other attributes remain constant from the base case. Scenario 2 considers infrastructure development such as charging stations and service stations’ development for BEVs and PHEVs in percentage compared to the ICVs’. The technological innovation of BEVs is considered under Scenario 3 as a range increment. A policy mix scenario (mix of scenario one and scenario three) is constructed as a part of Scenario 4. Finally, Scenario 5 considers the policy mix and technological innovation. Along with the base case, the five scenarios’ details are outlined in Table 6. The market simulations were based on the sample enumeration method based on Equation (9) [6,38]:
where Pni is the probability that decision maker n chooses alternative i from a set of alternatives, and N is the total number of decision makers.
The results presented in Table 7 show that the market share is about 92.8 for the ICVs, about 2.3% for the BEVs, and about 4.9% for the PHEVs in the base case. The ICVs still dominate the market of Nepal in the base scenario. Next, in each scenario, the market share of the BEV is increased. In general, the purchase subsidy, infrastructure development, and technical innovation scenario increase the market share of the BEV. The Scenario 4 (combination of Scenarios 1 and 2)’s results show that the increased BEV market share is about 3.10%, which is more than the sum effect of Scenarios 1 and 2 (3.10 > 2.45 + 0.20 = 2.55). This might be explained as a synergy effect of both policies. It would be a plausible argument to state that some consumers will adopt BEV only after a reduced price and increased infrastructure. This tells us that a combination of policies would be more effective than having a single policy’s support for EV use in Nepal. Further, when we combine policy mix and innovation in Scenario 5, the BEV share increases by 9.22%. We find that the market share of BEV is largest in Scenario 5; it is worthwhile to note that a combination of policies and innovation would give more increment in the market share of BEV than the summed effect of each scenario (9.22 > 2.45 + 0.20 + 2.42 = 5.07). This might be explained by the fact that some potential consumers will give their preference to BEVs only after technological innovation and supporting policies.
4.4. Latent Class Estimation
When the optimal number of classes might not be known to the researcher, different statistical measures can be used [36]. This study considers the Bayesian Information Criterion (BIC) and the Akaike Information Criterion (AIC) to determine the optimal number of classes [43]. The estimation was performed for up to ten number of classes, and the estimated results for the BIC and AIC are reported in Table 8. The log-likelihood value (LLV) and number of parameters (Nparam) are also shown. The CAIC and BIC are minimized in the three-class model. In the remainder of the latent class model estimation, our estimation and analysis focus on the three-class latent class model estimation.
Table 8 shows the outcomes of a latent class analysis consisting of three distinct classes. The class membership was determined based on a combination of socio-demographic factors, travel characteristics, and environmental concerns. Specifically, variables such as gender, age, education, family size, income, monthly travel distance, intention to purchase a vehicle, availability of a vehicle, frequent mountain travel, environmental consideration, electric vehicle knowledge, and working sector were utilized to explain the allocation of individuals into their respective classes. During the estimation process, not all membership variables exhibited statistical significance. Consequently, only the membership variables that demonstrated a significant association with class membership are discussed for each class. The analysis discerned three discernible consumer groups, each with their own distinctive characteristics and implications. Class 1 is the most receptive to BEV adaptation, and its share is about 37.9%. This class has a positive coefficient for the PHEV; however, this is less than the BEV’s. This class is also the least sensitive to infrastructure development. In addition, this class has a less strong preference to range increment compared to Class 3. The membership results show that consumers with lower average monthly travel distance and environment concerns and a high electric vehicle knowledge are more likely to be in Class 1. Further, consumers with a high income and vehicle ownership are less likely to be in Class 1.
Table 9 shows that Class 2 is the most receptive to the PHEV and that its share is about 32.4%. The results show that this class is the least sensitive to price and range. The membership variables’ results show that a consumer with a lower monthly travel distance and frequent mountain travel is likely to be in Class 2. However, male consumers are less likely to be in this class. Consumers who need to travel frequently to the mountains might compensate the range anxiety and limitation of infrastructures by choosing the PHEV, as PHEVs offer a choice of fuel. PHEVs have both an internal combustion engine for gasoline and an electric motor for the battery.
Class 3’s share is about 29.7%, and this class has less of a preference for the BEV and PHEV compared to Classes 2 and 3. The results show that this class is the most sensitive to price, infrastructure, and range. This implies that this group is an attributes-oriented group. This class is referenced in our estimation. Consumers with a lower income, a longer average monthly travel distance, who own of the vehicle, and have limited knowledge about EVs s are more likely to be in Class 3. In summary, the results show that Class 1 is BEV-oriented, Class 2 PHEV-oriented, and Class 3 attributes-oriented. Class 3 consumers require environmental awareness and knowledge of EVs in order to increase their preference for PHEVs and BEVs. The communication between consumers who are the first to adopt these vehicles and many more potential consumers later is also necessary [5].
5. Conclusions
Nepal, lacking any fossil fuel reserves such as coal, natural gas, and petroleum products, holds a significant potential for hydropower generation. Enhancing the production of hydroelectricity in the country could potentially reduce its reliance on petroleum products, although with the potential consequence of escalating the trade deficit [14]. This scenario highlights the dual advantage associated with the adoption of electric vehicles (EVs) in Nepal: not only can they contribute to environmental benefits, but they also have the potential to mitigate the trade deficit.
This study aims to investigate consumer preferences in Nepal using stated preferences as a basis. Data collection involved conducting a survey utilizing the conjoint method. Subsequently, the mixed logit model was employed for estimation purposes. The findings reveal that, overall, potential vehicle users in Nepal exhibit a preference for BEVs and PHEVs over ICVs. Furthermore, the results demonstrate that consumers hold favorable attitudes towards infrastructure development and increased vehicle range. As anticipated, the coefficients for purchase price and fuel cost were found to be negative, indicating a preference for lower purchase prices and reduced fuel costs among consumers.
In addition, this study examines the combined influence of demographic factors, travel characteristics, and environmental concerns on consumer behavior. The results indicate valuable insights. It is evident that not all consumers exhibit uniform preferences towards EVs. Specifically, individuals with smaller family sizes, shorter monthly travel distances, heightened environmental awareness, and greater familiarity with electric vehicles are more likely to adopt EVs. However, users who already have access to electric vehicle infrastructure are inherently more inclined to adopt both BEVs and PHEVs.
According to our elasticity estimation, reducing the purchase price has the greatest impact on increasing consumers’ likelihood to purchase BEVs and PHEVs. Additionally, our analysis identifies range increments as the second most influential attribute. Conversely, the results indicate that reducing fuel costs and developing infrastructure are less significant for promoting the adoption of BEVs and PHEVs.
Market simulations with different scenarios suggest that a policy mix scenario is more effective in fostering the increase in market share of EVs compared to individual policies’ support. This mixture of policies generates a synergy effect that accelerates the adoption of EVs. Our research further demonstrates that a combination of technological innovation and multiple policies yields the most favorable outcomes for increasing the market share of EVs.
Another key feature of our study is the LCM estimation; LCM allowed us to identify and analyze the latent heterogeneity among potential consumers. The LCM estimation suggests that three distinct classes of consumers exist in Nepal, implying a significant heterogeneity among potential EV users. The results suggest that Class 1 is the most receptive to BEVs, accounting for about 38% of consumers. Class 1 tends to include consumers having a lower monthly travel distance, awareness of EVs, and environmental concern. The results indicate that proper information about BEVs and their environmental benefits contribute to stimulating the market demand for EVs.
Consumers belonging to Class 2 have a higher preference for choosing PHEVs and can be called a PHEV-oriented group. Consumers in this group are the least sensitive to purchase price and limited range. Consumers facing frequent mountain travel are likely to be in the PHEV-oriented group. PHEVs might provide an alternative to accommodate the range anxiety and infrastructure barriers of BEVs. Moreover, Class 3 consumers are attributes-oriented and have lower preferences for BEVs and PHEVs compared to Classes 1 and 2. A lower income, higher monthly travel distance, and unawareness about EVs lead consumers to be in Class 3. It might be concluded that Class 3 needs more awareness and information flow about EVs to stimulate demand. The results demand that awareness policies must be targeted to Class 3 consumers. Alternatively, the significant preference variation across the classes should be addressed within the policies to promote EVs.
The findings of this study provide an insightful background for policymakers and automakers, providing a robust foundation for their decision-making processes. Specifically, the study’s outcomes serve as essential considerations for the formulation of diverse policies by the government of Nepal. Market simulations, encompassing a range of scenarios, furnish decision makers with pertinent information for devising strategies that effectively boost the market demand for BEVs and PHEVs. It is important to note that our estimation is based on the stated preferences’ hypothetical choice experiment method, which may be further compared to revealed preferences in future research. Nonetheless, this study significantly contributes to a comprehensive understanding of the attributes and variables—such as demographics, environmental concerns, and travel characteristics—that influence the demand for EVs. Finally, our estimation is based on the current market-based stated preference approach. Over time, consumers may become better informed, and technological advancements may be achieved, leading to potential changes in preferences in the future.
Overall, this study makes a significant contribution to addressing the research gap by conducting a comprehensive analysis of consumer preferences for EVs in Nepal. It extends existing studies by incorporating specific contextual factors, evaluating policy effectiveness through market simulations, utilizing latent class modeling for consumer segmentation, and employing advanced research methods. The findings of this study fill the gap in knowledge regarding EV preferences in Nepal and provide valuable insights for policymakers, industry stakeholders, and researchers in the field.
This study focuses on the unique context of Nepal, which possesses substantial potential for hydroelectricity and is currently witnessing the construction of numerous hydropower projects at various stages. However, when applying our framework to other countries, it is crucial to consider the specific contextual factors, particularly those related to the potential of the electric vehicle (EV) market, the available energy resources, and the strategies and policies adopted by the respective governments. Adapting the framework to different countries necessitates a thorough understanding of these context-specific elements.
Author Contributions
Conceptualization, L.P.G. and Y.K.; Methodology, L.P.G.; Validation, L.P.G.; Formal analysis, L.P.G.; Data curation, L.P.G.; Writing—original draft, L.P.G.; Writing—review & editing, Y.K. and N.R.D.; Supervision, Y.K. and N.R.D. All authors have read and agreed to the published version of the manuscript.
Funding
This research received no external funding.
Conflicts of Interest
The authors declare no conflict of interest.
References
- Byun, H.; Shin, J.; Lee, C.-Y. Using a discrete choice experiment to predict the penetration possibility of environmentally friendly vehicles. Energy 2018, 144, 312–321. [Google Scholar] [CrossRef]
- Noel, L.; de Rubens, G.Z.; Sovacool, B.K.; Kester, J. Fear and loathing of electric vehicles: The reactionary rhetoric of range anxiety. Energy Res. Soc. Sci. 2019, 48, 96–107. [Google Scholar] [CrossRef]
- Hackbarth, A.; Madlener, R. Consumer preferences for alternative fuel vehicles: A discrete choice analysis. Transp. Res. Part D Transp. Environ. 2013, 25, 5–17. [Google Scholar] [CrossRef]
- Lopez-Behar, D.; Tran, M.; Mayaud, J.R.; Froese, T.; Herrera, O.E.; Merida, W. Putting electric vehicles on the map: A policy agenda for residential charging infrastructure in Canada. Energy Res. Soc. Sci. 2019, 50, 29–37. [Google Scholar] [CrossRef]
- Kurani, K.S.; Caperello, N.; TyreeHageman, J.; Davies, J. Symbolism, signs, and accounts of electric vehicles in California. Energy Res. Soc. Sci. 2018, 46, 345–355. [Google Scholar] [CrossRef]
- Kim, Y.; Jeong, G.; Ahn, J.; Lee, J.D. Consumer preferences for alternative fuel vehicles in South Korea. Int. J. Automot. Technol. Manag. 2007, 7, 327. [Google Scholar] [CrossRef]
- CRS Report for Congress Alternative Transportation Fuels and Vehicles: Energy, Environment, and Development Issues. Available online: https://www.everycrsreport.com/reports/RL30758.html (accessed on 12 August 2023).
- Kim, J.-H.; Kim, H.-J.; Yoo, S.-H. Willingness to pay for fuel-cell electric vehicles in South Korea. Energy 2019, 174, 497–502. [Google Scholar] [CrossRef]
- Axsen, J.; Cairns, J.; Dusyk, N.; Goldberg, S. What drives the Pioneers? Applying lifestyle theory to early electric vehicle buyers in Canada. Energy Res. Soc. Sci. 2018, 44, 17–30. [Google Scholar] [CrossRef]
- Wang, S.; Li, J.; Zhao, D. The impact of policy measures on consumer intention to adopt electric vehicles: Evidence from China. Transp. Res. Part A Policy Pract. 2017, 105, 14–26. [Google Scholar] [CrossRef]
- Sovacool, B.K.; Bambawale, M.J.; Gippner, O.; Dhakal, S. Electrification in the Mountain Kingdom: The implications of the Nepal Power Development Project (NPDP). Energy Sustain. Dev. 2011, 15, 254–265. [Google Scholar] [CrossRef]
- Gurung, A.; Ghimeray, A.K.; Hassan, S.H. The prospects of renewable energy technologies for rural electrification: A review from Nepal. Energy Policy 2012, 40, 374–380. [Google Scholar] [CrossRef]
- Gurung, A.; Gurung, O.P.; Oh, S.E. The potential of a renewable energy technology for rural electrification in Nepal: A case study from Tangting. Renew. Energy 2011, 36, 3203–3210. [Google Scholar] [CrossRef]
- Durbar, S. Economic Survey, 2017/18, Ministry of Finance; Government of Nepal: Kathmandu, Nepal, 2008. [Google Scholar]
- Ghimire, L.P.; Kim, Y. An analysis on barriers to renewable energy development in the context of Nepal using AHP. Renew. Energy 2018, 129, 446–456. [Google Scholar] [CrossRef]
- Schneidereit, T.; Franke, T.; Günther, M.; Krems, J.F. Does range matter? Exploring perceptions of electric vehicles with and without a range extender among potential early adopters in Germany. Energy Res. Soc. Sci. 2015, 8, 198–206. [Google Scholar] [CrossRef]
- Sovacool, B.K. What are we doing here? Analyzing fifteen years of energy scholarship and proposing a social science research agenda. Energy Res. Soc. Sci. 2014, 1, 1–29. [Google Scholar] [CrossRef]
- Sovacool, B.K. Experts, theories, and electric mobility transitions: Toward an integrated conceptual framework for the adoption of electric vehicles. Energy Res. Soc. Sci. 2017, 27, 78–95. [Google Scholar] [CrossRef]
- Hahn, J.-S.; Lee, J.-H.; Choi, K. Heterogeneous preferences of green vehicles by vehicle size: Analysis of Seoul case. Int. J. Sustain. Transp. 2018, 12, 675–685. [Google Scholar] [CrossRef]
- Javid, R.J.; Nejat, A. A comprehensive model of regional electric vehicle adoption and penetration. Transp. Policy 2017, 54, 30–42. [Google Scholar] [CrossRef]
- Shim, D.; Kim, S.W.; Altmann, J.; Yoon, Y.T.; Kim, J.G. Key Features of Electric Vehicle Diffusion and Its Impact on the Korean Power Market. Sustainability 2018, 10, 1941. [Google Scholar] [CrossRef]
- Rahmani, D.; Loureiro, M.L. Assessing drivers’ preferences for hybrid electric vehicles (HEV) in Spain. Res. Transp. Econ. 2019, 73, 89–97. [Google Scholar] [CrossRef]
- Guerra, E. Electric vehicles, air pollution, and the motorcycle city: A stated preference survey of consumers’ willingness to adopt electric motorcycles in Solo, Indonesia. Transp. Res. Part D Transp. Environ. 2019, 68, 52–64. [Google Scholar] [CrossRef]
- Rajper, S.Z.; Albrecht, J. Prospects of Electric Vehicles in the Developing Countries: A Literature Review. Sustainability 2020, 12, 1906. [Google Scholar] [CrossRef]
- Manutworakit, P.; Choocharukul, K. Factors Influencing Battery Electric Vehicle Adoption in Thailand—Expanding the Unified Theory of Acceptance and Use of Technology’s Variables. Sustainability 2022, 14, 8482. [Google Scholar] [CrossRef]
- Ye, F.; Kang, W.; Li, L.; Wang, Z. Why do consumers choose to buy electric vehicles? A paired data analysis of purchase intention configurations. Transp. Res. Part A Policy Pract. 2021, 147, 14–27. [Google Scholar] [CrossRef]
- Li, L.; Wang, Z.; Chen, L.; Wang, Z. Consumer preferences for battery electric vehicles: A choice experimental survey in China. Transp. Res. Part D Transp. Environ. 2020, 78, 102185. [Google Scholar] [CrossRef]
- Singh, V.; Singh, V.; Vaibhav, S. A review and simple meta-analysis of factors influencing adoption of electric vehicles. Transp. Res. Part D Transp. Environ. 2020, 86, 102436. [Google Scholar] [CrossRef]
- Adhikari, M.; Ghimire, L.P.; Kim, Y.; Aryal, P.; Khadka, S.B. Identification and Analysis of Barriers against Electric Vehicle Use. Sustainability 2020, 12, 4850. [Google Scholar] [CrossRef]
- Ko, W.; Hahn, T.-K. Analysis of Consumer Preferences for Electric Vehicles. EEE Trans. Smart Grid 2013, 4, 437–442. [Google Scholar] [CrossRef]
- Green, P.E.; Srinivasan, V. Conjoint Analysis in Consumer Research: Issues and Outlook. J. Consum. Res. 1978, 5, 103–123. [Google Scholar] [CrossRef]
- Green, P.E.; Srinivasan, V. Conjoint Analysis in Marketing: New Developments with Implications for Research and Practice. J. Mark. 1990, 54, 3. [Google Scholar] [CrossRef]
- Sheldon, T.L.; DeShazo, J.R.; Carson, R.T. Electric and plug-in hybrid vehicle demand: Lessons for an emerging market. Econ. Inq. 2017, 55, 695–713. [Google Scholar] [CrossRef]
- Rudolph, C. How may incentives for electric cars affect purchase decisions? Transp. Policy 2016, 52, 113–120. [Google Scholar] [CrossRef]
- Khan, N.A.; Fatmi, M.R.; Habib, M.A. Type Choice Behavior of Alternative Fuel Vehicles: A Latent Class Model Approach. Transp. Res. Procedia 2017, 25, 3299–3313. [Google Scholar] [CrossRef]
- Kormos, C.; Axsen, J.; Long, Z.; Goldberg, S. Latent demand for zero-emissions vehicles in Canada (Part 2): Insights from a stated choice experiment. Transp. Res. Part D Transp. Environ. 2019, 67, 685–702. [Google Scholar] [CrossRef]
- McFadden, D.; Train, K. Mixed MNL models for discrete response. J. Appl. Econom. 2000, 15, 447–470. [Google Scholar] [CrossRef]
- Train, K.E. Discrete Choice Methods with Simulation; Cambridge University Press: Cambridge, UK, 2001. [Google Scholar] [CrossRef]
- Revelt, D.; Train, K. Customer Specific Taste Parameters and Mixed Logit Models; Working paper; University of California: Berkeley, CA, USA, 1999; Volume 9, pp. 3–10. [Google Scholar]
- Hole, A.R. Fitting Mixed Logit Models by Using Maximum Simulated Likelihood. Stata J. Promot. Commun. Stat. Stata 2007, 7, 388–401. [Google Scholar] [CrossRef]
- Hole, A.R. Mixed logit modeling in Stata—An overview. In Proceedings of the United Kingdom Stata Users’ Group Meetings, London, UK, 12–13 September 2013. [Google Scholar]
- Greene, W.H.; Hensher, D.A. A latent class model for discrete choice analysis: Contrasts with mixed logit. Transp. Res. Part B Methodol. 2003, 37, 681–698. [Google Scholar] [CrossRef]
- Pacifico, D.; Yoo, H.I. Lclogit: A Stata Command for Fitting Latent-Class Conditional Logit Models via the Expectation-Maximization Algorithm. Stata J. 2013, 13, 625–639. [Google Scholar] [CrossRef]
- Ferguson, M.; Mohamed, M.; Higgins, C.D.; Abotalebi, E.; Kanaroglou, P. How open are Canadian households to electric vehicles? A national latent class choice analysis with willingness-to-pay and metropolitan characterization. Transp. Res. Part D Transp. Environ. 2018, 58, 208–224. [Google Scholar] [CrossRef]
- Qian, L.; Soopramanien, D. Heterogeneous consumer preferences for alternative fuel cars in China. Transp. Res. Part D Transp. Environ. 2011, 16, 607–613. [Google Scholar] [CrossRef]
Figure 1.
Research framework for the EV consumer preference analysis.
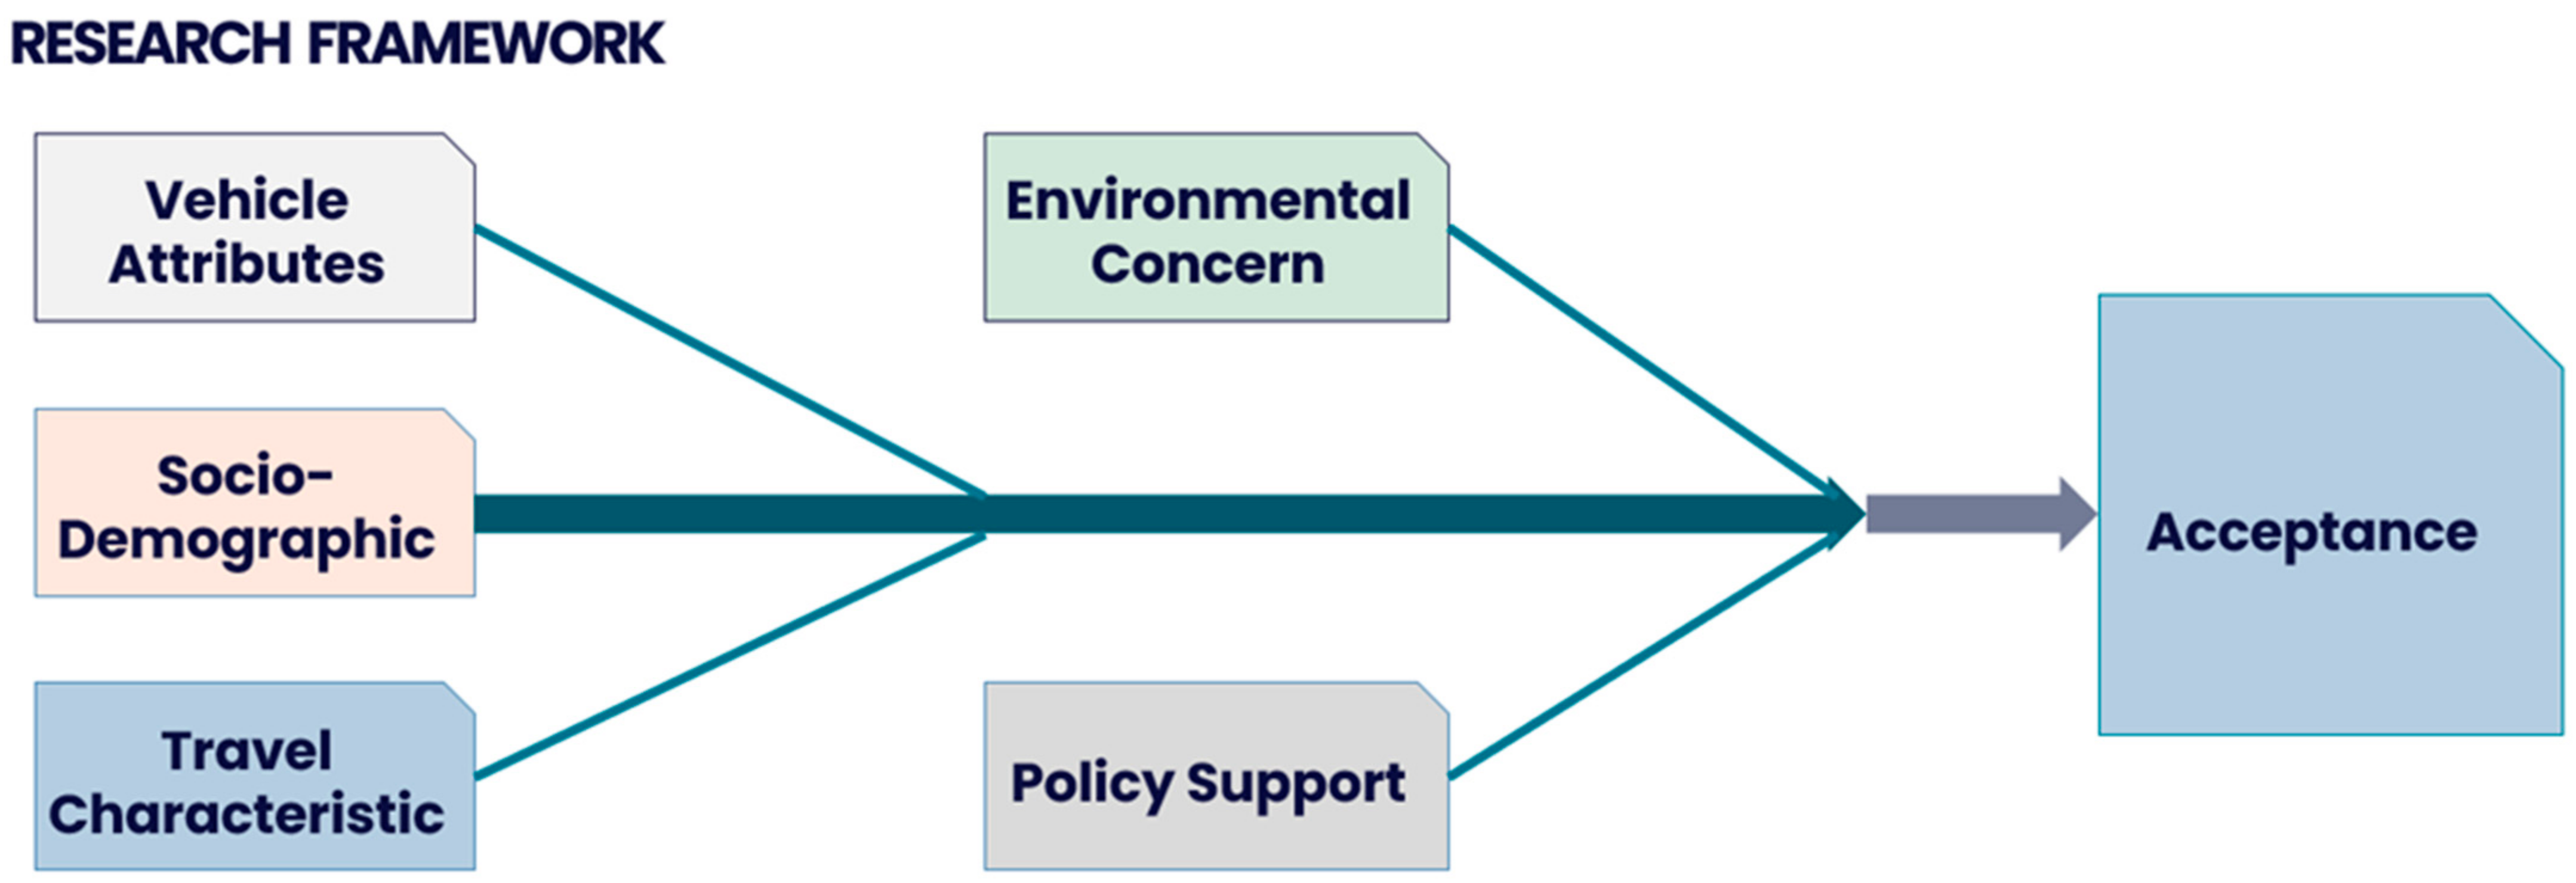
Figure 2.
Elasticity calculation for each attribute.

Table 1.
Tabular comparison of the proposed analysis to other state-of-the-art studies and analyses.
Table 1.
Tabular comparison of the proposed analysis to other state-of-the-art studies and analyses.
| Reference/Country | Main Objective | Attributes | Model | Main Results |
|---|---|---|---|---|
[19]
| Assessing the relative impacts of green vehicles’ attributes. | Price Operating cost Range Fuel stations Fuel type | MNL Nested Logit | Choice probabilities of green vehicles differed depending on the size of the vehicles. The purchase price was found to be the most effective approach for increasing demand. |
[20]
| Exploring the factors that are deemed to be associated with PEV adoption and estimating the PEVs’ market penetration. | Logistic Regression Probit | Charging stations and gas prices are tools for transportation planners and city authorities to regulate PEV technology. | |
[21]
| Analyzing key features for electric vehicle diffusion and its impact on the Korean power market. | Fuel type Accessibility Range Fuel cost Price | Mixed Logit | Electric vehicles can increase to around 40% of the total market share if the key features of electric vehicles reach a similar level to ICVs. |
[22]
| Analyzing preferences for hybrid electric vehicles. | Price Fuel cost Emissions Fuel type | Latent Class | The lack of interest in the adaptation of hybrid electric vehicles is due to a lack of information and false belief in the vehicle’s quality. Informative campaigns and additional economic incentives policies are recommended to increase demand. |
[23]
| Evaluating the potential of electric motorcycles in a small Indonesian city. | Price Fuel price Range Charge time Max speed | Mixed Logit | Identified variation in preferences for motorcycle features. Speed, range, charge time, and price all mattered substantially. |
[24]
| Prospects of electric vehicles in developing countries. | Price | Systematic Reviews and Meta-analysis (PRISMA) guidelines | Electric four-wheelers are not a feasible option in developing countries due to their high purchase price. On the contrary, electric two-wheelers may be beneficial as they come with a lower purchase price. |
[25]
| Factors influencing battery-charged electric vehicle adoption in Thailand. | User behavior Policy | Partial least squares structural equation modeling (PLS-SEM) | User behavior is positively influenced by purchase intention. Facilitating conditions do not significantly influence purchase intention and user behavior. Moreover, only the age variable was found to have significant effects on purchase behavior. |
[26]
| How the combinations or configurations of psychological and policy attributes jointly influence consumers’ EV purchase intentions. | Psychological Policy | Fuzzy-set qualitative comparative analysis (fsQCA) approach | Configurations of attributes that lead to a high EV purchase intention always include at least one psychological attribute. |
[27]
| Consumer preferences for different products and policy attributes. | Products Policy Battery warranty Depreciation rate Personal carbon trading Tradable driving credits | Experimental survey | Main product attributes and battery warranty have a significant positive effect on inducing mainstream consumers to adopt BEVs, while no preference difference occurs among existing policy incentives after purchase subsidies are abolished. For young consumers, almost all the incentives that reduce the operation cost (e.g., PCT) or increase convenience (e.g., TDC) can increase their adoption of BEVs. |
[28]
| Investigating the factors influencing a consumer’s intention to adopt an EV. | Adoption intention Purchase intention Behavioral intention Usage intention | Meta-analysis | The trend of studies on the influencing factors for adopting EVs has increased significantly over the past decade. |
[29]
| Presenting a framework for the identification and analysis of the barriers against the use of EVs. | Technical barriers Policy barriers Economic barriers Infrastructure barriers Social barriers | Analytical hierarchical process | In Nepal, the main obstacles to the adopt-ion of electric vehicles (EVs) are related to infrastructure, policy, economics, and technology rather than social factors. The lack of charging stations, higher cost of EVs compared to traditional vehicles, and inadequate government planning and goal setting were identified as the top-three barriers hindering the uptake of EVs in the country. |
Table 2.
Overview of the attributes with their levels.
| Fuel Type | ICV | BEV | PHEV |
|---|---|---|---|
| Purchase price ($1000) | 20 30 | 25 | 25 |
| 32.5 | 32.5 | ||
| 40 | 40 | ||
| Infrastructure availability (% of ICV) | 100 | 25 | 25 |
| 50 | 50 | ||
| 75 | 75 | ||
| Fuel cost ($/100 km) | 10 15 | 5 | 5 |
| 8 | 8 | ||
| 10 | 10 | ||
| Range (km) | 500 | 100 | 100 |
| 200 | 300 | ||
| 300 | 500 |
Table 3.
Summary and definitions of the variables used.
| Variables | Definition |
|---|---|
| Gender (male) | One if the respondent is male, zero otherwise |
| Age (≤40 years) | One if the respondent’s age is within 40 years, zero otherwise |
| Education (≥Bachelor) | One if the respondent’s education is at least a bachelor, zero otherwise |
| Family (≤4 persons) | One if the number of family members is up to four |
| Middle income | One if the income is between $ 5000 and $10,000 |
| High income | One if the income is higher than $10,000 |
| Monthly travel distance (≤600 km) | One if the monthly travel distance is up to 600 km, zero otherwise |
| Intention to buy a new vehicle | One if the respondent intends to buy a new vehicle within five years, zero otherwise |
| Vehicle available | One if the respondent has at least one vehicle available, zero otherwise |
| Mountain travel | One if the respondent faces frequent mountain travel, zero otherwise |
| Environmental consideration | One if yes, zero otherwise |
| Vehicle knowledge (medium) | One if the respondent has a medium-level EV knowledge, zero otherwise |
| Vehicle knowledge (high) | One if the respondent has a high-level EV knowledge, zero otherwise |
| Working (energy/environment) | One if the respondent is working in the energy/environment sector, zero otherwise |
Table 4.
Estimation results of the attributes-only model.
| Mixed Logit Model Number of Obs = 5360 | ||||||
|---|---|---|---|---|---|---|
| Mean | Standard Deviation | |||||
| Variables | Coef. | Std. Err. | P > z | Coef. | Std. Err. | P > z |
| BEV | 3.242 | 0.323 | 0.000 | 1.706 | 0.246 | 0.000 |
| PHEV | 2.725 | 0.244 | 0.000 | −1.005 | 0.234 | 0.000 |
| Infrastructure | 0.019 | 0.003 | 0.000 | −0.023 | 0.004 | 0.000 |
| Range | 0.008 | 0.001 | 0.000 | −0.004 | 0.001 | 0.000 |
| Fuel Cost | −0.042 | 0.030 | 0.156 | 0.186 | 0.039 | 0.000 |
| Price | −2.573 | 0.138 | 0.000 | 0.687 | 0.154 | 0.000 |
Table 5.
Interaction model.
| Mixed Logit Model Number of Obs = 5360 | ||||||
|---|---|---|---|---|---|---|
| Mean | Standard Deviation | |||||
| Attributes | Coef. | Std. Err. | P > z | Coef. | Std. Err. | P > z |
| BEV | 0.070 | 0.495 | 0.444 | 1.479 | 0.238 | 0.000 |
| PHEV | −0.431 | 0.790 | 0.585 | 0.877 | 0.250 | 0.000 |
| Infrastructure | 0.018 | 0.003 | 0.000 | 0.022 | 0.004 | 0.000 |
| Range | 0.007 | 0.001 | 0.000 | 0.146 | 0.040 | 0.000 |
| Fuel cost | −0.053 | 0.028 | 0.060 | 0.004 | 0.001 | 0.000 |
| Price | −2.631 | 0.142 | 0.000 | 0.716 | 0.141 | 0.000 |
| BEV | PHEV | |||||
| Interaction variables | Coef. | Std. Err. | P > z | Coef. | Std. Err. | P > z |
| Gender (male) | −0.234 | 0.379 | 0.536 | −0.592 | 0.301 | 0.049 |
| Age (≤40 years) | −0.043 | 0.481 | 0.929 | 0.513 | 0.389 | 0.188 |
| Education (≥Bachelor) | −0.313 | 0.441 | 0.478 | −0.193 | 0.354 | 0.585 |
| Family (≤4 persons) | 0.633 | 0.369 | 0.087 | 0.437 | 0.301 | 0.146 |
| Middle income | 0.212 | 0.584 | 0.717 | 0.649 | 0.479 | 0.176 |
| High income | −0.629 | 0.464 | 0.175 | 0.251 | 0.373 | 0.500 |
| Monthly travel distance (≤600 km) | 1.678 | 0.431 | 0.000 | 0.876 | 0.336 | 0.009 |
| Intention to buy a new vehicle | 1.024 | 0.529 | 0.053 | 0.590 | 0.421 | 0.161 |
| Vehicle available | −0.373 | 0.390 | 0.039 | 0.015 | 0.316 | 0.962 |
| Mountain travel | −0.015 | 0.395 | 0.970 | 0.155 | 0.323 | 0.331 |
| Environmental consideration | 1.176 | 0.488 | 0.016 | 1.555 | 0.387 | 0.000 |
| Vehicle knowledge (medium) | 0.106 | 0.640 | 0.869 | 0.210 | 0.504 | 0.677 |
| Vehicle knowledge (high) | 1.476 | 0.734 | 0.044 | 0.318 | 0.581 | 0.584 |
| Working (energy/environment) | −0.029 | 0.511 | 0.954 | 0.669 | 0.418 | 0.100 |
Table 6.
Different scenarios with government intervention and technological innovation.
| Scenarios | Infrastructure (% ICV) | Range (km) | Fuel Cost ($/100 km) | Price ($1000) |
|---|---|---|---|---|
| Base (Current-Realistic) | ||||
| ICV | 100 | 500 | 15 | 20 |
| BEV | 10 | 150 | 10 | 32 |
| PHEV | 50 | 400 | 12 | 40 |
| Scenario 1: Purchase subsidy ($10,000) for BEVs | ||||
| ICV | 100 | 500 | 15 | 20 |
| BEV | 10 | 150 | 10 | 22 |
| PHEV | 50 | 400 | 12 | 40 |
| Scenario 2: Infrastructure Development (BEVs and PHEVs) | ||||
| ICV | 100 | 500 | 15 | 20 |
| BEV | 50 | 150 | 10 | 32 |
| PHEV | 70 | 400 | 12 | 40 |
| Scenario 3: Technological innovation (BEVs’ range = 300 km) | ||||
| ICV | 100 | 500 | 15 | 20 |
| BEV | 10 | 300 | 10 | 32 |
| PHEV | 50 | 400 | 12 | 40 |
| Scenario 4: Policy mix (Combinations of Scenarios 1 and 2) | ||||
| ICV | 100 | 500 | 15 | 20 |
| BEV | 50 | 150 | 10 | 22 |
| PHEV | 70 | 400 | 12 | 40 |
| Scenario 5: Policy mix and innovation (Combination of Scenarios 1,2, and 3 | ||||
| ICV | 100 | 500 | 15 | 20 |
| BEV | 50 | 300 | 10 | 22 |
| PHEV | 70 | 400 | 12 | 40 |
Table 7.
Results of market shares in the different scenarios (in %).
| Scenarios | Predicted Market Share | Δ BEV Share | ||
|---|---|---|---|---|
| ICV | BEV | PHEV | ||
| Base—Realistic | 92.78 | 2.35 | 4.87 | - |
| Scenario 1: Purchase subsidy | 90.64 | 4.80 | 4.56 | 2.45 |
| Scenario 2: Infrastructure development | 91.57 | 2.55 | 5.89 | 0.20 |
| Scenario 3: Technological innovation | 90.66 | 4.77 | 4.58 | 2.42 |
| Scenario 4: Policy mix | 88.97 | 5.45 | 5.58 | 3.10 |
| Scenario 5: Policy mix and innovation | 83.40 | 11.57 | 5.02 | 9.22 |
Table 8.
Latent class identification with BIC and CAIC.
| Classes | LLV | Nparam | CAIC | BIC |
|---|---|---|---|---|
| 2 | −1439.83 | 15 | 2978.524 | 2963.524 |
| 3 | −1393.38 | 23 | 2938.352 | 2915.352 |
| 4 | −1371.06 | 31 | 2946.438 | 2915.438 |
| 5 | −1356.86 | 39 | 2970.767 | 2931.767 |
| 6 | −1347.33 | 47 | 3004.434 | 2957.434 |
| 7 | −1328.27 | 55 | 3019.052 | 2964.052 |
| 8 | −1331.05 | 63 | 3077.337 | 3014.337 |
| 9 | −1320.44 | 71 | 3108.836 | 3037.836 |
| 10 | −1307.04 | 79 | 3134.774 | 3055.774 |
Table 9.
Class membership model parameters: Class 3 = reference class.
| Class 1 | Class 2 | Class 3 | ||||
|---|---|---|---|---|---|---|
| Attributes | Coef. | P > z | Coef. | P > z | Coef. | P > z |
| BEV | 4.055 | 0.000 | 2.695 | 0.000 | 1.296 | 0.167 |
| PHEV | 2.021 | 0.000 | 3.532 | 0.000 | 1.522 | 0.015 |
| Price | −0.097 | 0.000 | −0.042 | 0.010 | −0.111 | 0.000 |
| Infrastructure | 0.006 | 0.100 | 0.014 | 0.012 | 0.028 | 0.000 |
| Fuel cost | −0.057 | 0.134 | 0.006 | 0.932 | −0.076 | 0.386 |
| Range | 0.007 | 0.000 | 0.005 | 0.000 | 0.009 | 0.000 |
| Class share | 0.379 | 0.324 | 0.297 | |||
| Class membership variables | ||||||
| Gender | −0.327 | 0.468 | −1.564 | 0.008 | - | - |
| Age (≤40 years) | −0.555 | 0.306 | −0.295 | 0.640 | - | - |
| Education (≥Bachelor) | −0.416 | 0.453 | −0.486 | 0.440 | - | - |
| Family (≤4 person) | 0.424 | 0.325 | 0.072 | 0.884 | - | - |
| Middle income | −0.105 | 0.871 | 0.346 | 0.637 | - | - |
| High income | −0.982 | 0.065 | −0.445 | 0.437 | - | - |
| Monthly travel distance (≤600 km) | 1.730 | 0.000 | 1.239 | 0.023 | - | - |
| Intention to buy a new vehicle | 0.690 | 0.302 | 0.376 | 0.597 | - | - |
| Vehicle available | −0.660 | 0.036 | −0.359 | 0.482 | - | - |
| Mountain travel | −0.124 | 0.800 | 0.492 | 0.067 | - | - |
| Environmental consideration | 1.203 | 0.023 | 14.652 | 0.855 | - | - |
| Vehicle knowledge (medium) | 0.014 | 0.985 | −0.188 | 0.839 | - | - |
| Vehicle knowledge (high) | 1.460 | 0.087 | 0.455 | 0.656 | - | - |
| Working (energy/environment) | −0.218 | 0.738 | 0.558 | 0.395 | - | - |
| Constant | −1.291 | 0.281 | 13.718 | 0.864 | - | - |
Disclaimer/Publisher’s Note: The statements, opinions and data contained in all publications are solely those of the individual author(s) and contributor(s) and not of MDPI and/or the editor(s). MDPI and/or the editor(s) disclaim responsibility for any injury to people or property resulting from any ideas, methods, instructions or products referred to in the content. |
© 2023 by the authors. Licensee MDPI, Basel, Switzerland. This article is an open access article distributed under the terms and conditions of the Creative Commons Attribution (CC BY) license (https://creativecommons.org/licenses/by/4.0/).
Share and Cite
MDPI and ACS Style
Ghimire, L.P.; Kim, Y.; Dhakal, N.R. Which Policies and Factors Drive Electric Vehicle Use in Nepal? Energies 2023, 16, 7428. https://doi.org/10.3390/en16217428
AMA Style
Ghimire LP, Kim Y, Dhakal NR. Which Policies and Factors Drive Electric Vehicle Use in Nepal? Energies. 2023; 16(21):7428. https://doi.org/10.3390/en16217428
Chicago/Turabian StyleGhimire, Laxman Prasad, Yeonbae Kim, and Nawa Raj Dhakal. 2023. "Which Policies and Factors Drive Electric Vehicle Use in Nepal?" Energies 16, no. 21: 7428. https://doi.org/10.3390/en16217428
Note that from the first issue of 2016, this journal uses article numbers instead of page numbers. See further details here.