Review

Simulation Modeling in Supply Chain Management Research of Ethanol: A Review

by
Sojung Kim
1,
Yeona Choi
1 and
Sumin Kim
2,*
1
Department of Industrial and Systems Engineering, Dongguk University—Seoul, Seoul 04620, Republic of Korea
2
Department of Environmental Horticulture & Landscape Architecture, College of Life Science & Biotechnology, Dankook University, Cheonan-si 31116, Republic of Korea
*
Author to whom correspondence should be addressed.
Energies 2023, 16(21), 7429; https://doi.org/10.3390/en16217429
Submission received: 10 October 2023 / Revised: 31 October 2023 / Accepted: 2 November 2023 / Published: 3 November 2023

Abstract

:
Ethanol, a common renewable energy resource, can reduce greenhouse gas (GHG) emissions to resolve the problem of global warming worldwide. Various feedstocks such as corn, sugarcane, maize stover, and wheat straw can be utilized for ethanol production. They determine production operations and relevant costs. Although there are monetary incentives and government policies in different countries to increase ethanal use, it is still challenging to make its sales price competitive due to the inefficient supply chain of ethanol. Unlike fossil fuels such as coal, oil, and natural gas using a well-designed supply chain in the long history of mankind, additional efforts are needed to organize and stabilize the supply chain of ethanol efficiently. The goal of this study is to investigate how simulation modeling techniques can be applied to various supply chain management issues of ethanol. Particularly, application cases of three major simulation paradigms such as discrete-event simulation, system dynamics, and agent-based simulation are investigated by conducting a scientific literature review. The findings of this study will contribute to the expansion of simulation use in the field of biofuel supply chain management.

1. Introduction

Renewable energy is attracting attention as concerns about future energy sustainability grow. To mitigate greenhouse (GHG) gas emissions and air pollutants, the U.S. has launched the Renewable Fuel Standard (RFS) program to increase renewable fuel use up to 36 billion gallons by 2022 [1]. Besides the U.S., other countries such as Indonesia, India, and Brazil are also trying to use biofuel blending with existing automobile fuel for reducing GHG gas emissions [2]. In fact, replacing transport fuels with biofuels enables air pollutants to be mitigated, including carbon monoxide, nitrogen oxides, sulfur oxides, methane, and volatile organic compounds [3].
Biofuels refer to energy-rich chemicals derived from the biomass of organisms [4]. They can be converted into renewable bioenergy [5]. To be more specific, ethanol is classified into two categories (i.e., first-generation ethanol and second-generation ethanol) based on its feedstock. First-generation ethanol is produced directly from animal waste and starch-rich food crops such as wheat, barley, corn, potatoes, and sugarcane. Second-generation ethanol is produced from non-food crops (plants) and microorganisms [6]. Of these two categories of ethanol, first-generation ethanol is more popular. It is mainly produced by producers in the United States, Brazil, and the European Union [7]. In addition, India and China have increased their production of ethanol over the past few decades. In 2022, worldwide fuel ethanol production was approximately 106 billion liters, and the United States, Brazil, the European Union, India, and China produced 58,295 million liters, 28,088 million liters, 5035 million liters, 4126 million liters, 3483 million liters, respectively [8]. The United States, Brazil, and China are also the largest consumers of fuel ethanol. Fuel ethanol use in the United States, Brazil, China, and Canada was 541,314 million liters, 29,905 million liters, 3634 million liters, and 2990 million liters, respectively [9].
Nevertheless, fossil fuels have been used as a major energy resource for the past few decades despite the fact that they are continuously causing environmental problems. According to a previous study [10], refiners and fuel importers are willing to buy ethanol if its price is less than USD 1.15/L. However, the minimum ethanol selling price (MESP) for ethanol from sugarcane bagasse (second-generation ethanol) is between USD 1.19/L and USD 1.29/L. On the other hand, the price of gasoline in the U.S. was USD 0.67/L in 2019. Thus, more efforts are needed to reduce the production cost of ethanol. Although there are monetary incentives and government policies in different countries to increase ethanal use, production cost reduction should be continued for the sustainable use of ethanol in the long term [11,12].
The goal of this study is to investigate simulation modeling approaches used for the efficient supply chain management of ethanol. To this end, application cases of three major simulation paradigms, discrete-event simulation (DES), system dynamics (SD), and agent-based simulation (ABS), are investigated by conducting a literature review of various scientific journals. The findings of this study will contribute to the expansion of simulation use in the field of biofuel supply chain management.
The remaining sections of this paper are organized as follows. Section 2 describes the characteristics of ethanol production and its supply chain. Section 3 summarizes recent studies of simulation modeling approaches applied to the supply chain management of ethanol. The advantages and disadvantages of simulation-based supply chain management approaches are discussed. Section 4 concludes this study and summarizes the study findings.

2. Ethanol Supply Chain

Ethanol is a type of biofuel produced by fermenting sugars and starches found in crops such as corn, sugarcane, and wheat [13]. Bioethanol is considered a renewable and sustainable alternative to fossil fuels. However, its production costs are generally higher than other fuels due to the expensive and energy-intensive processes involved in sourcing raw materials like corn [14,15].
In 2016, the United States produced the world’s largest biofuel (3.6 million tons), accounting for 41% of global biofuel production [16]. In 2022, worldwide fuel ethanol production was 106 million tons [8]. This trend has reached the mandatory standards of the U.S. Environmental Protection Agency (EPA). At current market prices, only a limited amount of corn is available because corn is needed for food and feed supplies [17]. In 2023, the EPA finalized biofuel blending volumes at 20.94 billion gallons, including 15 billion gallons of corn and other conventional biofuels [18]. It is clear that the U.S. government is attempting to consider advanced biofuels using non-food crops.
However, most of the biomass resources used for ethanol production are still first-generation biomass feedstock, including corn and sugarcane [7,19]. Since 2018, 94.3% of the 210 ethanol refineries in the United States have been based on corn, and approximately 90% of corn-based ethanol refineries use a dry process that ferments with enzymes to convert corn biomass or corn starch into ethanol [20]. Figure 1 illustrates the general dry mill ethanol production process at a refinery [21].
In Figure 1, once a refinery receives grain (i.e., corn) from either farms or grain warehouses, the grain is sent to milling and cooking operations. During liquefaction, enzymes break down starch into a liquid called mash. In the liquefaction stage, enzymes are introduced to the mixture, further breaking down the starch into a liquid form known as mash [22]. Fermentation converts sugar and starch into ethanol and carbon dioxide [23]. Subsequently, during fermentation, yeast is added to the mash, initiating a transformative process wherein sugars are converted into ethanol and carbon dioxide. Distillation separates ethanol from impurities using distillation columns [24]. The fermented mash undergoes distillation to separate the ethanol from water and other impurities. Employing a series of distillation columns, ethanol is isolated based on differences in boiling points [25]. For further refinement, ethanol then passes through a molecular sieve, effectively eliminating any lingering water and impurities. The final denatured ethanol is stored before shipment [26]. The sugarcane bioethanol process differs from the corn-based process in that the juice is extracted directly from the sugarcane and fermented to produce bioethanol [27]. This process is also more efficient than corn-based bioethanol production because sugarcane contains more sugar per unit of biomass than corn [28].
To address the limitations of using corn as a feedstock for ethanol production, several alternatives have been proposed. One such option is utilizing cellulose feedstock like Switchgrass, which are more abundant and cost-effective than corn [29]. Lignocellulose is a biomass composed of cellulose and lignin that can be extracted from vegetable waste such as wood, weeds, and by-products [30]. Switchgrass is a prime example of this Lignocellulose biomass. Unlike other crops, Switchgrass is a grass that grows well in dry environments, requiring less water and nutrients. It can maintain high productivity despite various environmental adverse effects [31]. Switchgrass can also be converted to bioethanol using more efficient and sustainable production processes such as gasification and fermentation. Ensuring an efficient supply chain is vital for successful bioethanol production and distribution [5]. The supply chain encompasses feedstock production, transportation to refineries, and delivery to end-users. An optimized supply chain can minimize costs and enhance the overall sustainability of bioethanol production, making it a promising and economically viable alternative to fossil fuels [32]. For this reason, Switchgrass is considered to be one of the most important crops in the study of alternative fuel production [5]. However, despite its potential, Switchgrass has not yet been widely used in biofuel production due to its higher processing costs than conventional biofuel feedstock such as corn [33,34,35].

3. Simulation Modeling of Ethanol Supply Chain Management

Simulation modeling plays a pivotal role in designing optimized biomass feedstock supply chains for biofuel facilities. Simulation models enable us to mimic major activities and processes, including biomass harvesting and transfer to roadside collection points, followed by transportation via trucks to biomass-processing facilities and eventual storage at the bio-refinery [26]. They serve the purpose of evaluating the supply chain using multiple criteria, such as delivered feedstock cost, energy consumption, and greenhouse gas (GHG) emissions [7].
There are three major paradigms in the field of simulation [36]: (1) discrete-event simulation (DES), (2) system dynamics (SD), and (3) agent-based simulation (ABS). DES [37] illustrates operations of a system as a discretized sequence of events in time. System status can be changed by a discrete-event. No change occurs between events. Because the simulation time moves from one event to another event without counting continuous time between events, it is an efficient approach to evaluate the performance of a system [38]. SD was devised to investigate the information-feedback characteristics of a system [39]. Using stocks (e.g., material, people, money), flows between stocks, and feedback loops, this illustrates a system’s status change (e.g., balancing or reinforcing) over time from an aggregated point of view [40]. Although SD does not have a fidelity modeling capability as high as DES or ABS, it is an appropriate simulation approach to conduct a macroscopic level of analysis for a large-scale system [41,42]. ABS is based on the activities of autonomous agents in a system [43]. Because each agent could make its own decision under a certain condition like a human, ABS is widely used to evaluate the performance of a system used by people (e.g., a transportation network, a financial market, and a healthcare system) [44,45,46]. Similar to DES, it enables us to describe the operations of a system in detail. However, it considers continuous-event instead of discrete-event [47]. This implies that ABS could mimic the characteristics of a system more accurately than DES in a continuous environment even though it requires a higher computational demand [48,49].
For the simulation modeling of a supply chain of ethanol production, two key drivers should be considered. One is the daily demand of biomass feedstock at an ethanol production facility (i.e., a refinery). The other is daily biomass recovery at a distributed harvesting sites (i.e., feedstock production farms) within a designated region [50]. Notice that a biofuel refinery requires a feedstock supply from harvesting areas or feedstock storages for its reliable operation, which can reduce the operational cost and production waste [51]. In addition, eight processes shown in Figure 1 can be modeled via DES, SD, or ABS to make the production process more efficient. The following sections will address applications of simulation paradigms in the supply chain management of ethanol.

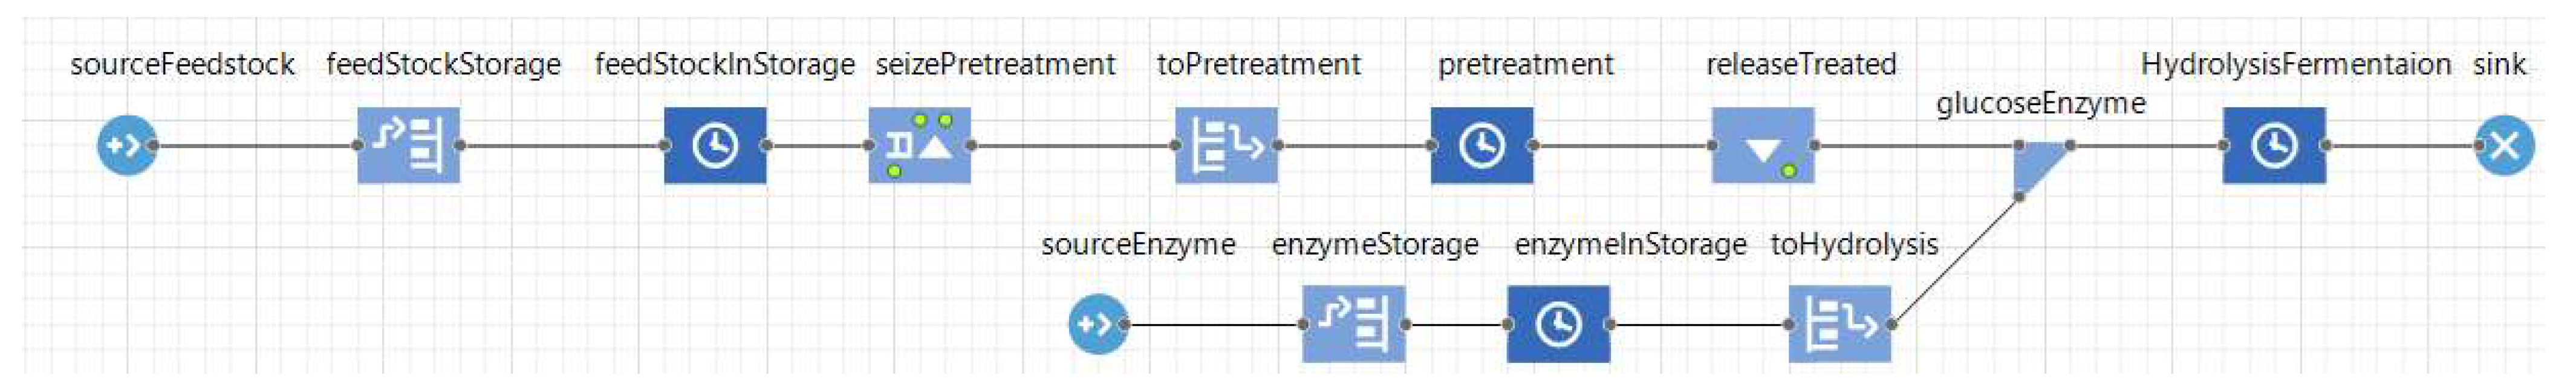
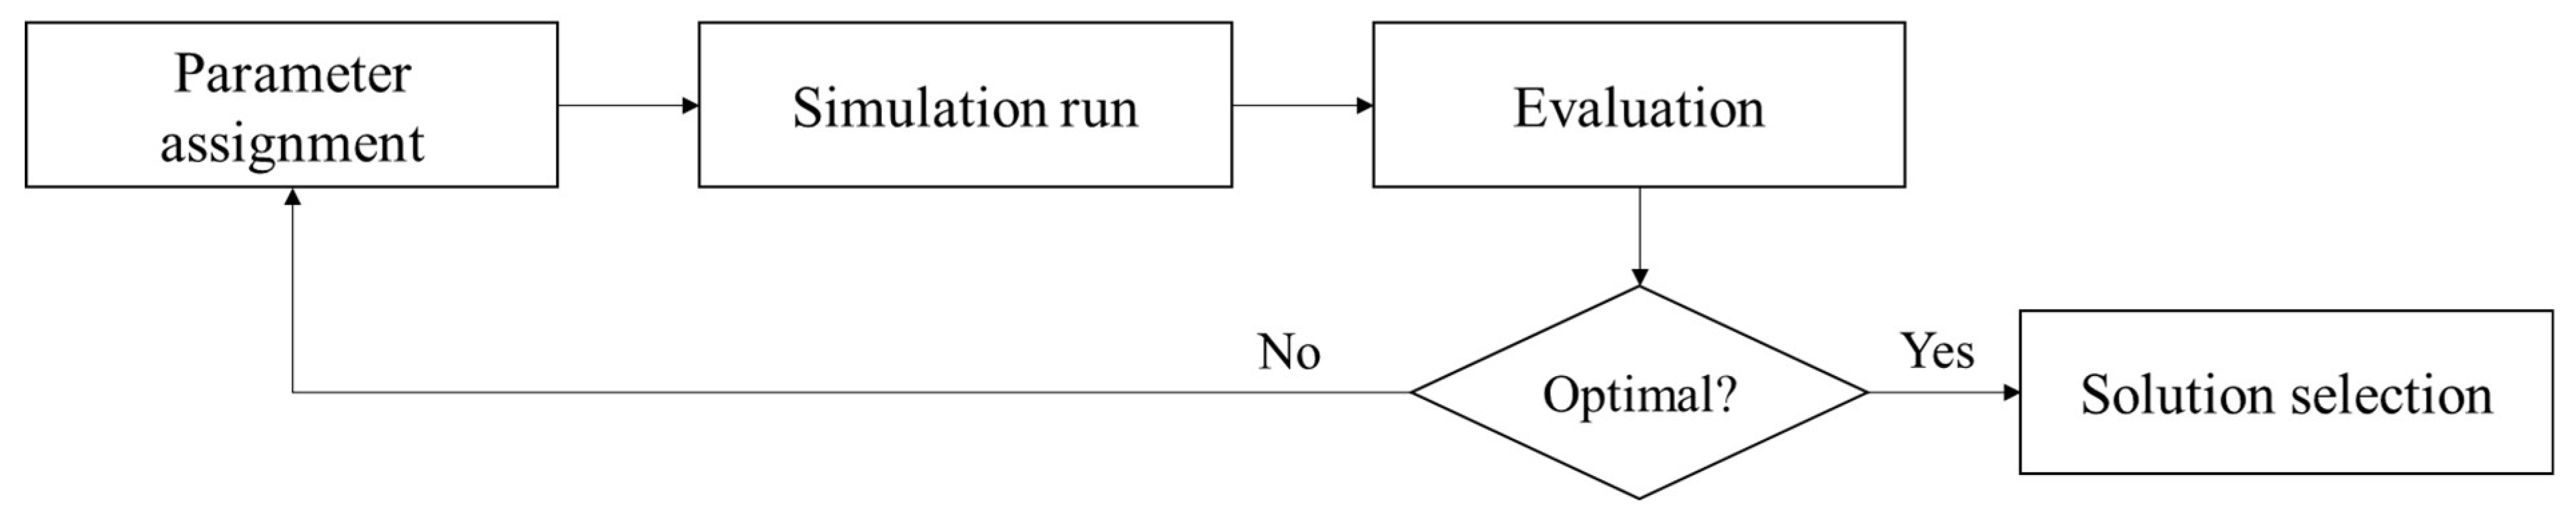
3.1. Applications of Discrete-Event Simulation

DES is suitable for modeling supply chains with discontinuous time flows occurring at certain points in time [52,53]. This makes it ideal for modeling highly volatile supply chains such as unpredictable demand or supply disruptions [54]. Sahoo and Mani [55] have developed a biomass supply chain model involving a Geographic Information System (GIS) to accurately estimate the uncertain feedstock flow rate and delivered cost. In their study, ExtendedSIM 8® was used as a DES tool with Miscanthus crop (biomass) supply chain data collected for 10 years from strip-mined lands in Ohio. Zhang et al. [56] utilized Arena® discrete-event simulation software for the development of a biofuel supply chain model with an easy-to-use graphical user interface. Three major operations such as biomass harvesting and processing, transportation, and feedstock storage were considered in DES. The devised simulation model consisted of three sub-models: (1) model input reading, (2) feed activity (including harvesting/processing, transportation, and storage), and (3) output analysis, which used a series of methodologies to calculate feedstock costs, energy consumption, and greenhouse gas emissions for each activity in the supply chain. To validate the simulation model, forest biomass data were retrieved from the Forest Service Inventory EVALIDator web application version 4.01 [57]. These data included potential biofuel facility locations, forest biomass availability, spring breakup details, cost intensity, fossil energy consumptions intensity, and GHG emissions. Their study shows that DES is a useful tool for selecting optimal logistics design and inventory management [56].
Simulation modeling begins with a conceptual model about a subject system [37]. Biofuel production operations (e.g., feedstock storage and handling, pretreatment and conditioning, fermentation and hydrolysis, and enzyme production) converting lignocellulose biomass (i.e., corn stover) to ethanol are illustrated in Figure 2 [7].
For conceptual modeling, a unified modeling language (UML) activity diagram (or a flow chart) can be utilized. In Figure 2, a circle and rounded-edge rectangle represent a start state and an action state, respectively. In the feedstock storage and handling process, once feedstock arrives at a refinery, it is unloaded and stored in a silo for other operations (see Figure 2). In general, based on the finalized conceptual model, the actual simulation modeling is conducted using simulation software [37]. Figure 3 reveals a screenshot of a simulation model developed by the Process Modeling Library in Anylogic® simulation software (AnyLogic University 8.4) [7].
In the simulation model, chemical reactions between glucose (or glucan), xylose, and enzyme are formulated (see Table 1). Notice that the total production quantity of ethanol is the total ethanol from glucose (or glucan) and xylose. In DES, this continuous process is considered as a discreate-event. In other words, a feedstock batch is considered as one passive object (or an entity), and its production quantity property (or a production quantity attribute) is updated whenever it passes each operation at a refinery [7,37,56].
In addition, to maintain quality in the development of a DES model, Manuj et al. [58] proposed a Simulation Model Development Process (SMDP) approach consisting of problem formulation, variable specification, model verification, data collection, and simulation. This approach was adopted by Cigolini et al. [52] for their DES development with Arena® discrete-event simulation software. Particularly, their study considered five types of supply chain structures involving different configurations of major actors (e.g., suppliers, transporters, warehouses, and retailers). The developed DES model with different supply chain configurations can be utilized to identify the economic order quantity (EOQ) of each facility. EOQ refers to the ideal order quantity of a facility to minimize inventory costs, considering holding, shortage, and order costs [59]. In ethanol production, the optimum delivery quantity of feedstock can be identified using the EOQ model [26]. To this end, the simulation-based optimization (SBO) shown in Figure 4 can be adopted.
In SBO, once optimization parameters (e.g., delivery quantity) are initialized, the framework runs a DES model to achieve simulation results (e.g., performance of a supply chain). At the next iteration, the framework sets other values of optimization parameters and runs a DES model again. This process continues until the framework does not have any significant improvement in the simulation results [37]. Unlike a general numerical optimization (e.g., linear programming and non-linear programming), the DES can simultaneously consider multiple factors such as supply chain management decisions, a number of actors that share inventory capacity of a particular actor, inventory capacity changes over time, and the travel time of transporters so that it can accurately estimate the performance of a supply chain [60]. Overall, DES with SBO is a popular simulation approach that enables us to simulate activities and help identify areas for improvements in the performance of a complex supply chain [54].

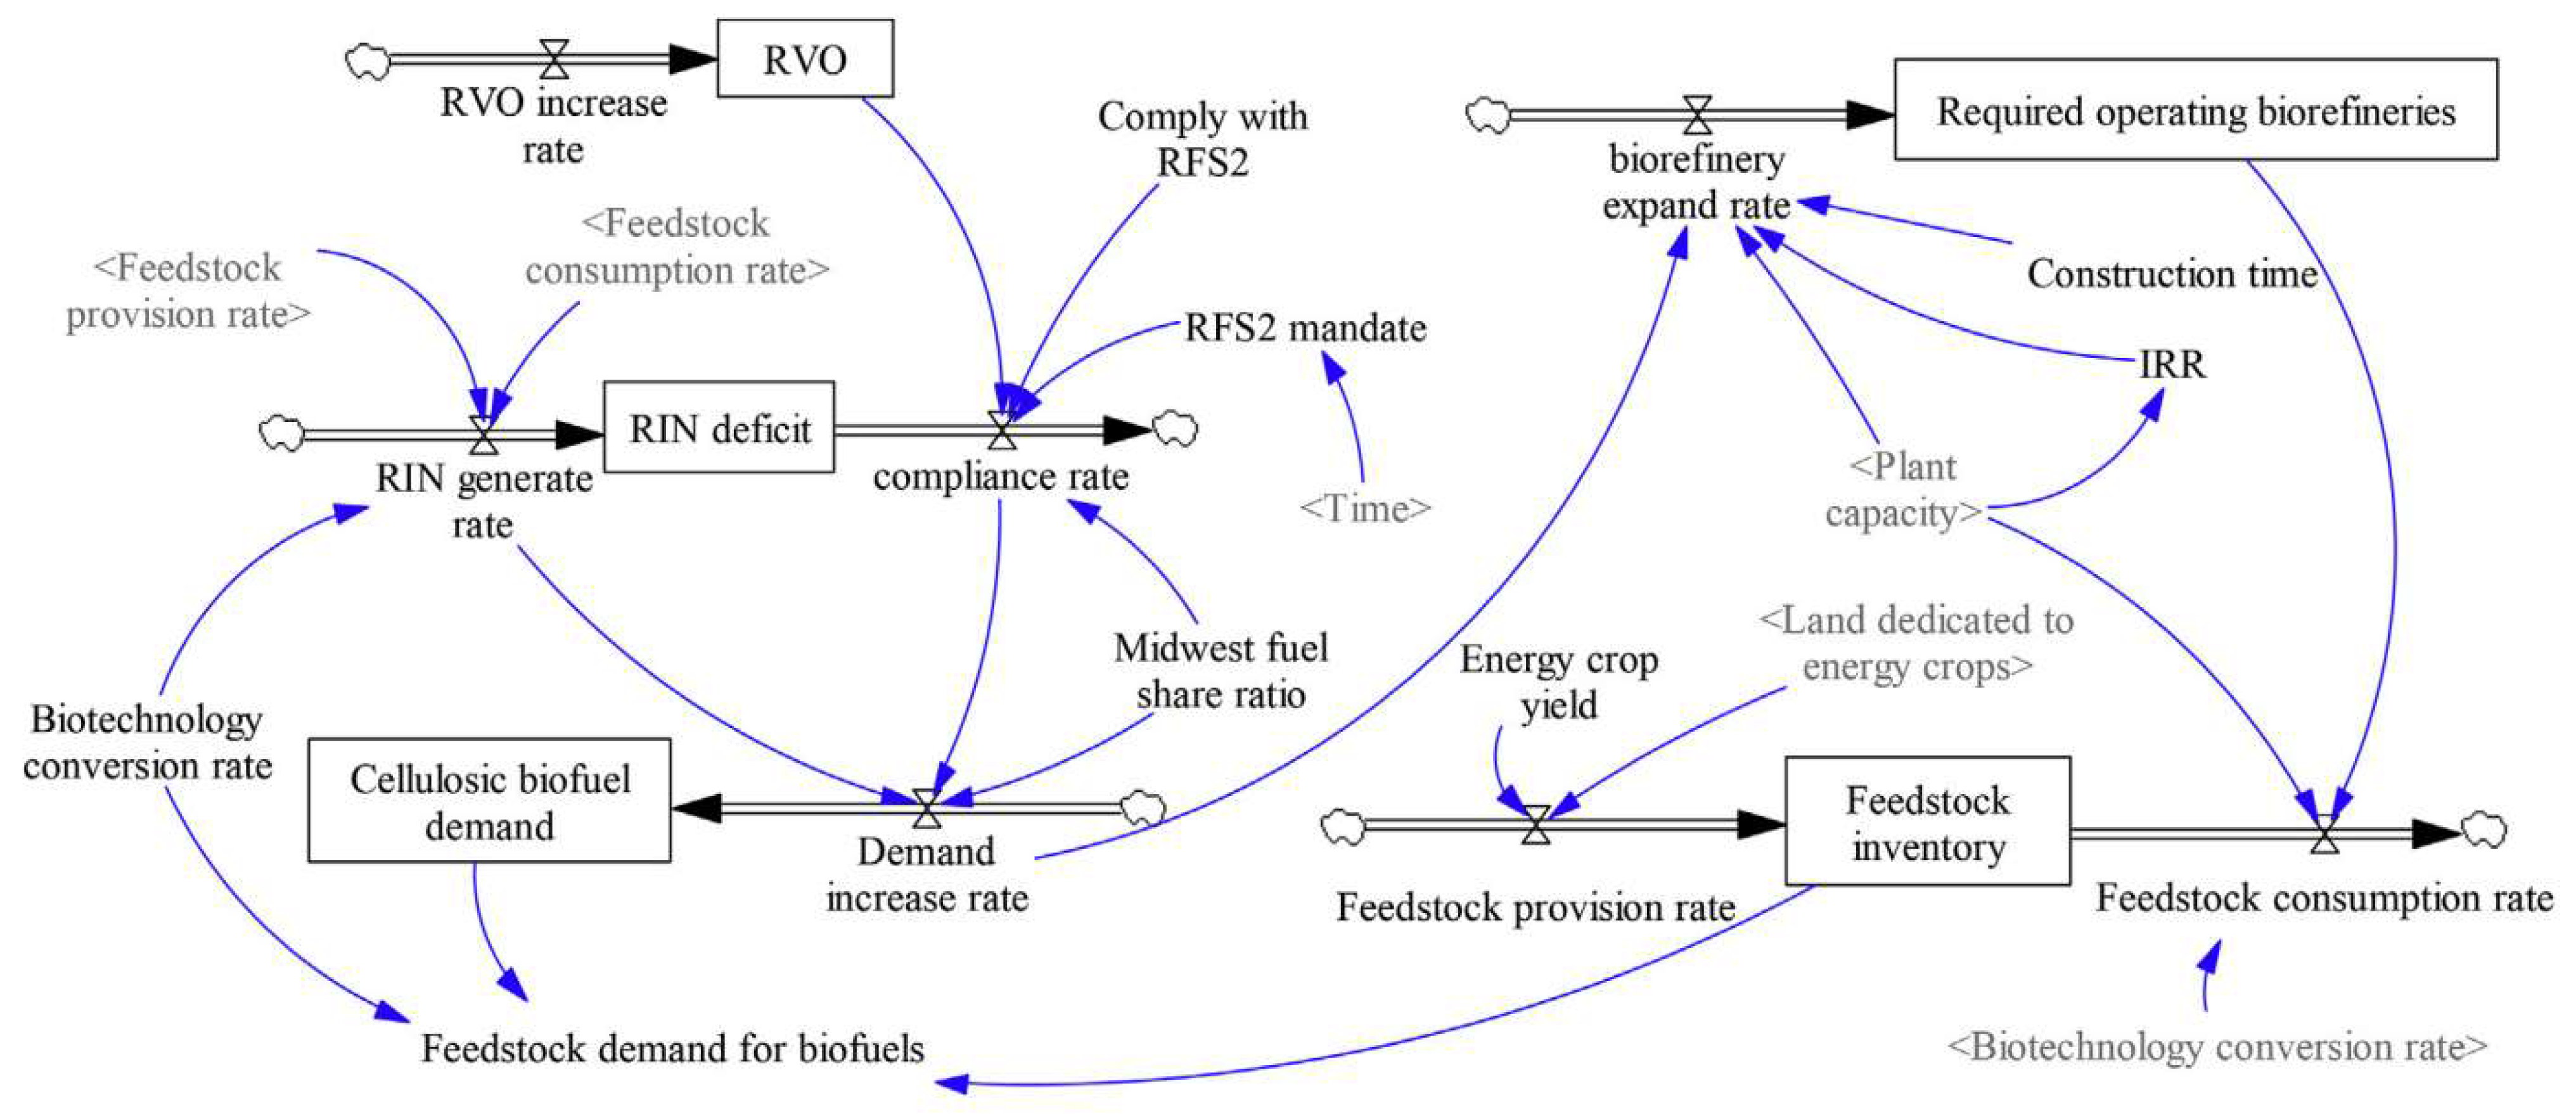
3.2. Applications of System Dynamics

As mentioned in Section 3, SD was devised to investigate the information-feedback characteristics of a system at an aggregated level (or a macroscopic level). It can be considered as a continuous event simulation used to model and analyze complex systems that involve continuous status changes over time [39]. In general, the system is modeled as a set of mathematical equations that describe the behavior of the system over time. The simulation then uses these equations to predict the behavior of the system under different conditions and scenarios [61].
Jin et al. [62] have utilized SD for predicting the sustainable impacts of a cellulosic biofuel system on the environment, economy, and society. Their study defined three types of impacts: (1) environmental impacts (GHG emissions, nitrate leaching, water consumption, and biodiversity), (2) social impacts (social cost of carbon and employment), and (3) economic impacts (gross output and labor income). These three types of impacts are influenced by the cellulosic biofuel production activity involving the feedstock market (see Figure 5), biorefinery economic performance, cellulosic biofuel market, and land use change for energy crops. Their study indicated that advanced bioconversion technologies were critical for the economical production of cellulosic ethanol. Such production could significantly reduce GHG emissions and water use.
Christensen and Panoutsou [63] have adopted SD to accurately model a biofuel value chain in terms of technical and environmental performances. Particularly, a stock-and-flow model in SD was utilized to quantitatively visualize a biofuel value chain and its impact on environment, such as GHG emissions and land use change. The model illustrated the total value chain emissions from biofuel supply chain activities such as primary biomass warehousing, biomass transportation, biomass warehousing, processed biomass transportation, biofuel production, biofuel transportation, and biofuel selling as fuel. Their study reveals that the sustainability and productivity functions of the biofuel value chain could reinforce each other when all competitive activities are optimized.
SD can be also used to understand the impact of an energy policy on biofuel consumption. Demczuk and Padula [64] have investigated impacts of sugarcane yield, gasoline prices, and sales tax rates on the production and consumption of ethanol in Brazil under the developed SD. The SD model was developed via VENSIM® software (version: personal learning edition plus) using four steps: (1) identifying key variables, (2) identifying behavior patterns and data collection, (3) designing a systemic map in SD, and (4) elaborating computational modeling and sensitivity with scenarios analysis. Their simulation study showed that the pump price of regular gasoline should be USD 1.95 per liter for the feasible production of ethanol. Because this price is a far higher than the current price of USD 1.26 per liter in Brazil, the authors claimed that the federal government needed to impose an additional tax on regular gasoline sales to promote biofuel use.

3.3. Agent-Based Simulation

Unlike SD, ABS is based on activities of autonomous agents in a system [43]. Due to its bottom-up modeling characteristic, ABS enables us to describe the operations of a subject system in detail. Although DES can also be used as a high-fidelity simulation modeling technique, ABS considers continuous time space. Thus, it is much more appropriate for ethanol production processing modeling [26]. In fact, each process of ethanol production in Figure 1 is based on a chemical reaction [65]. For example, the degradation of biomass continuously happens over time. Corn mash movement can be described as a flow through in an ethanol production system [66] (see Section 2 for more details about the ethanol production process). In addition to first-generation biofuel, the production of second-generation biofuel such as Switchgrass also uses continuous production processes involving feedstock storage and handling, pretreatment and conditioning, fermentation and hydrolysis, and enzyme production for converting lignocellulosic biomass into ethanol [17]. Figure 6 reveals an example of ABS to predict the operation cost of a building using solar power [67]. In general, as mentioned in Section 3, ABS includes autonomous decision-making agents (i.e., solar panel, irrigation system, and HVAC system agents). The performance of a subject system is estimated based on interactions between agents. In Anylogic® simulation software (AnyLogic University 8.4), a state chart is utilized to address the state change in each agent [5]. To be more specific, in Figure 6, the irrigation system agent is in an idle state under regular conditions. However, it is in an irrigation state when the agent has an appropriate condition (e.g., scheduled irrigation date).
In addition, Moncada et al. [68] developed the Brazilian sugarcane–ethanol supply chain via ABS to analyze the impacts of various blend mandates and taxes on production and consumption changes in ethanol. Particularly, for modeling the complex relationship between actors in the Brazilian ethanol market, ABS was adopted. In the simulation, the adaptation behavior of flex mill owners and interactions between farmers, owners of mills/distilleries, and drivers (or fuel consumers) were modelled. Unlike SD, this bottom-up modeling approach required detailed modeling about the agents’ behaviors. Their study found that an increase in gasoline tax led to an investment increase in the sugarcane processing capacity.
Bichraoui-Draper et al. [69] have also utilized ABS for a life cycle assessment (LCA) of Switchgrass-based biofuel systems. In their study, the potential adoption behavior of farmers was modeled based on the historical adoption data of GE soybeans in the U.S [70]. The devised ABS enabled us to understand significant factors influencing landowner decision-making process. Socioeconomic factors involving age, level of risk aversion, education level, and level of profit of farmers were considered in the adoption behavior modeling. Their study found that the existing economic situation and crop price were the most significant factors for famers’ decision-making process. Similarly, Anderson et al. [71] utilized ABS for modeling farmers’ behaviors and estimating consequence of second-generation biofuels using marginal (low-quality) land in Western Canada. Their study found that marginal land with energy crops enables us to improve the income of farmers. However, it could change the price of beef due to a gradual reduction in cattle.
Because ethanol utilizes feedstocks, it is critical to accurately estimate the yield of feedstock production. To this end, there is an effort to integrate a crop yield estimate simulation with ABS. For example, Kim and Kim [26] adopted the Agricultural Land Management Alternative with Numerical Assessment Criteria (ALMANAC) simulation model for the yield estimation of corn. ALMANAC enables us to simulate crop growth regarding dynamic environmental factors like climate changes, soil characteristics, and management practices [31,72]. To be more specific, the model simulates plant growth, water balance, erosion, soil organic carbon, and nutrient (N and P) cycling at a daily time step [31]. Moreover, the ALMANAC model can be used to make management decisions related to biomass productivity under various environmental conditions and management practices. For example, Yoon et al. [73] have estimated soybean yields under climate change conditions (i.e., daily solar radiation, maximum temperature, minimum temperature, precipitation, wind speed, and humidity) addressed by the Center for Climate System Research (CCSR), University of Tokyo, National Institute for Environmental Studies (NIES), and the Japan Agency for Marine-Earth Science and Technology. A similar technique was also applied to yield the estimation of Switchgrass for ethanol production in a study by Kim et al. [5]. In general, the developed ALMANAC model is validated with filed study data [31]. Based on the estimated feedstock yield, the ABS mimicking operations of supply chain actors (e.g., farms, warehouses, and refineries) can predict the performance of biofuel production. In addition, the integrated simulation carefully considers nonlinear inventory levels in corn storage silos and calculates the most optimal inventory levels so that it can eventually identify the best production plan with the minimum operational cost [26].

4. Discussion

As mentioned in the Introduction, ethanol production has been continuously increased, and the worldwide production of fuel ethanol was 106 million tons in 2022 [8]. To mitigate the operational cost of ethanol production, traditional production management and planning techniques such as economic order quantity (EOQ), master production schedule (MPS), and material requirements planning (MRP) can be utilized. However, given that those techniques are based on either a simple mathematical formula or aggregated information, it is quite challenging to accurately manage the production system. Thus, simulation modeling approaches such as discrete-event simulation (DES), system dynamics (SDs), and agent-based simulation (ABS) have to be adopted for the efficient supply chain management of ethanol under a dynamic environment. Particularly, unlike SD, both DES and ABS are elaborate simulation techniques that model the actual operations of facilities (farms, warehouses, and refineries) in a biofuel supply chain. To be more specific, those simulation models enable the identification of the optimum number of workers and transportation vehicles for the minimum operational cost of a target supply chain. Nevertheless, due to the unstable production of feedstocks, it is recommended to utilize the hybrid simulation technique. As mentioned in Section 3.3, ABS can be integrated with a traditional crop yield estimation simulation model such as ALMANAC [26] so that the ABS can achieve a reliable production yield estimation from ALMANAC within the environment of a changing climate.

5. Conclusions and Future Directions

This study investigated applications of three simulation paradigms such as discrete-event simulation (DES), system dynamics (SD), and agent-based simulation (ABS) in biofuel supply chain management. Due to the different modeling capabilities of the three simulation paradigms, each paradigm can be applied to different areas of a biofuel supply chain. To be more specific, DES enables us to model the operations of a supply chain in great detail. Thus, it can be utilized to estimate operational costs and sales revenue under a specific ethanol production case at a microscopic level. On the other hand, SD can be applied to macroscopic simulation studies investigating the impact of the biofuel pricing policy on society. In fact, both DES and SD are popular simulation paradigms for simulation studies of ethanol supply chains. This is because there are multiple simulation software packages with various functions for both paradigms which were proposed in the mid-1950s. In addition, both paradigms have been intensively applied to other cases such as manufacturing system management, supply chain management, business process management, policy design, and economic studies. On the hand, only a few studies have used ABS. Although ABS is becoming popular because of its bottom-up modeling capability using autonomous decision-making agents such as consumer, vehicle, and company, it is relatively new among the three paradigms. Thus, not many researchers are familiar with ABS. Nevertheless, ABS studies have shown that ABS can accurately estimate the impact of the biofuel pricing policy on society by collecting responses from multiple agents under a given supply chain system. However, since the issue of climate change is becoming significant in feedstock production, the uncertainty of ethanol production should be appropriately modeled via advanced simulation techniques involving hybrid simulation and multi-paradigm simulation in the future.

Author Contributions

Conceptualization, S.K. (Sojung Kim) and S.K. (Sumin Kim); methodology, S.K. (Sojung Kim) and Y.C.; software, S.K. (Sojung Kim) and S.K. (Sumin Kim); validation, Y.C. and S.K. (Sojung Kim); resources, S.K. (Sojung Kim); writing—original draft preparation, Y.C. and S.K. (Sojung Kim); writing—review and editing, S.K. (Sojung Kim) and S.K. (Sumin Kim); visualization, Y.C.; project administration, S.K. (Sojung Kim); funding acquisition, S.K (Sojung Kim). All authors have read and agreed to the published version of the manuscript.

Funding

This work was supported by a Basic Science Research Program through the National Research Foundation of Korea (NRF) funded by the Ministry of Education (No. RS-2023-00239448).

Acknowledgments

The authors gratefully acknowledge the support of the NRF of Korea, funded by the Ministry of Education.

Conflicts of Interest

The authors declare no conflict of interest.

References

  1. U.S. Environmental Protection Agency. Overview for Renewable Fuel Standard. Available online: https://www.epa.gov/renewable-fuel-standard-program/overview-renewable-fuel-standard (accessed on 25 September 2023).
  2. Lima, M.G.B. Just transition towards a bioeconomy: Four dimensions in Brazil, India and Indonesia. For. Policy Econ. 2022, 136, 102684. [Google Scholar] [CrossRef]
  3. Thambiran, T.; Diab, R.D. Air pollution and climate change co-benefit opportunities in the road transportation sector in Durban, South Africa. Atmos. Environ. 2011, 45, 2683–2689. [Google Scholar] [CrossRef]
  4. Rodionova, M.V.; Poudyal, R.S.; Tiwari, I.; Voloshin, R.A.; Zharmukhamedov, S.K.; Nam, H.G.; Zayadan, B.K.; Bruce, B.D.; Hou, H.J.M.; Allakhverdiev, S.I. Biofuel production: Challenges and opportunities. Int. J. Hydrogen Energy 2017, 42, 8450–8461. [Google Scholar] [CrossRef]
  5. Kim, S.; Kim, S.; Kiniry, J.R. Two-phase simulation-based location-allocation optimization of biomass storage distribution. Simul. Model. Pract. Theory 2018, 86, 155–168. [Google Scholar] [CrossRef]
  6. Saladini, F.; Patrizi, N.; Pulselli, F.M.; Marchettini, N.; Bastianoni, S. Guidelines for emergy evaluation of first, second and third generation biofuels. Renew. Sustain. Energy Rev. 2016, 66, 221–227. [Google Scholar] [CrossRef]
  7. Kim, S.; Ofekeze, E.; Kiniry, J.R.; Kim, S. Simulation-Based Capacity Planning of a Biofuel Refinery. Agronomy 2020, 10, 1702. [Google Scholar] [CrossRef]
  8. Statista. Fuel Ethanol Production Worldwide in 2022, by Country. Available online: https://www.statista.com/statistics/281606/ethanol-production-in-selected-countries/ (accessed on 31 October 2023).
  9. Ramsey, S. Fuel Ethanol Use Expanding Globally but Still Concentrated in Few Markets. U.S. Department of Agriculture. Available online: https://www.ers.usda.gov/amber-waves/2023/june/fuel-ethanol-use-expanding-globally-but-still-concentrated-in-few-markets/ (accessed on 31 October 2023).
  10. Larnaudie, V.; Ferrari, M.D.; Lareo, C. Techno-economic analysis of a liquid hot water pretreated switchgrass biorefinery: Effect of solids loading and enzyme dosage on enzymatic hydrolysis. Biomass Bioenergy 2019, 130, 105394. [Google Scholar] [CrossRef]
  11. Duarah, P.; Haldar, D.; Patel, A.K.; Dong, C.D.; Singhania, R.R.; Purkait, M.K. A review on global perspectives of sustainable development in bioenergy generation. Bioresour. Technol. 2022, 348, 126791. [Google Scholar] [CrossRef]
  12. Hasan, M.; Abedin, M.Z.; Amin, M.B.; Nekmahmud, M.; Oláh, J. Sustainable biofuel economy: A mapping through bibliometric research. J. Environ. Manag. 2023, 336, 117644. [Google Scholar] [CrossRef]
  13. Gupta, A.; Verma, J.P. Sustainable bio-ethanol production from agro-residues: A review. Renew. Sustain. Energy Rev. 2015, 41, 550–567. [Google Scholar] [CrossRef]
  14. Khan, S.; Naushad, M.; Iqbal, J.; Bathula, C.; Ala’a, H. Challenges and perspectives on innovative technologies for biofuel production and sustainable environmental management. Fuel 2022, 325, 124845. [Google Scholar] [CrossRef]
  15. Ou, L.; Banerjee, S.; Xu, H.; Coleman, A.M.; Cai, H.; Lee, U.; Wigmosta, M.S.; Hawkins, T.R. Utilizing high-purity carbon dioxide sources for algae cultivation and biofuel production in the United States: Opportunities and challenges. J. Clean. Prod. 2021, 321, 128779. [Google Scholar] [CrossRef]
  16. U.S. Energy Information Administration. Monthly Energy Review. U.S. Energy Information Admistration; EIA: Washington, DC, USA, 2017. Available online: https://www.eia.gov/totalenergy/data/monthly/ (accessed on 25 September 2023).
  17. Kim, S.; Kim, S.; Cho, J.; Park, S.; Jarrín Perez, F.X.; Kiniry, J.R. Simulated biomass, climate change impacts, and nitrogen management to achieve switchgrass biofuel production at diverse sites in US. Agronomy 2020, 10, 503. [Google Scholar] [CrossRef]
  18. Kelly, S.; Renshaw, J. US Boosts Biofuel Mandates over Next 3 Years, but Biofuel Groups Feel Shortchanged. Reuters. 21 June 2023. Available online: https://www.reuters.com/markets/commodities/us-boosts-biofuel-mandates-over-next-3-years-biofuel-groups-feel-shortchanged-2023-06-21/ (accessed on 25 September 2023).
  19. Roy, S.; Chowdhury, R.; Boro, H.; Sarma, B.K.; Kalita, S. Bioethanol Production from Lignocellulose Agricultural Waste Biomass. In Agriculture Waste Management and Bioresource: The Circular Economy Perspective; John Wiley & Sons: Hoboken, NJ, USA, 2023; pp. 218–237. [Google Scholar]
  20. Renewable Fuels Association. Pocket Guide to Ethanol 2019. Available online: https://d35t1syewk4d42.cloudfront.net/file/1032/RFA2019PocketGuide.pdf (accessed on 25 September 2023).
  21. Renwable Fuels Association. How Is Ethanol Made. Available online: https://ethanolrfa.org/ethanol-101/how-is-ethanol-made (accessed on 25 September 2023).
  22. Bothast, R.J.; Schlicher, M.A. Biotechnological processes for conversion of corn into ethanol. Appl. Microbiol. Biotechnol. 2005, 67, 19–25. [Google Scholar] [CrossRef]
  23. Rosenberg, S.L. Fermentation of pentose sugars to ethanol and other neutral products by microorganisms. Enzym. Microb. Technol. 1980, 2, 185–193. [Google Scholar] [CrossRef]
  24. Tgarguifa, A.; Abderafi, S.; Bounahmidi, T. Modeling and optimization of distillation to produce bioethanol. Energy Procedia 2017, 139, 43–48. [Google Scholar] [CrossRef]
  25. Fu, C.; Li, Z.; Jia, C.; Zhang, W.; Zhang, Y.; Yi, C.; Xie, S. Recent advances on bio-based isobutanol separation. Energy Convers. Manag. X 2021, 10, 100059. [Google Scholar] [CrossRef]
  26. Kim, S.; Kim, S. Hybrid simulation framework for the production management of an ethanol biorefinery. Renew. Sustain. Energy Rev. 2022, 155, 111911. [Google Scholar] [CrossRef]
  27. Karp, S.G.; Medina, J.D.; Letti, L.A.; Woiciechowski, A.L.; de Carvalho, J.C.; Schmitt, C.C.; de Oliveira Penha, R.; Kumlehn, G.S.; Soccol, C.R. Bioeconomy and biofuels: The case of sugarcane ethanol in Brazil. Biofuels Bioprod. Biorefining 2021, 15, 899–912. [Google Scholar] [CrossRef]
  28. Mekonnen, M.M.; Romanelli, T.L.; Ray, C.; Hoekstra, A.Y.; Liska, A.J.; Neale, C.M. Water, energy, and carbon footprints of bioethanol from the US and Brazil. Environ. Sci. Technol. 2018, 52, 14508–14518. [Google Scholar] [CrossRef]
  29. Rastogi, M.; Shrivastava, S. Recent advances in second generation bioethanol production: An insight to pretreat-ment, saccharification and fermentation processes. Renew. Sustain. Energy Rev. 2017, 80, 330–340. [Google Scholar] [CrossRef]
  30. Zabed, H.; Sahu, J.N.; Boyce, A.N.; Faruq, G. Fuel ethanol production from lignocellulosic biomass: An overview on feedstocks and technological approaches. Renew. Sustain. Energy Rev. 2016, 66, 751–774. [Google Scholar] [CrossRef]
  31. Kiniry, J.R.; Cassida, K.A.; Hussey, M.A.; Muir, J.P.; Ocumpaugh, W.R.; Read, J.C.; Reed, R.L.; Sanderson, M.A.; Venuto, B.C.; Williams, J.R. Switchgrass simulation by the ALMANAC model at diverse sites in the southern US. Biomass Bioenergy 2005, 29, 419–425. [Google Scholar] [CrossRef]
  32. Yue, D.; You, F.; Snyder, S.W. Biomass-to-bioenergy and biofuel supply chain optimization: Overview, key issues and challenges. Comput. Chem. Eng. 2014, 66, 36–56. [Google Scholar] [CrossRef]
  33. Larnaudie, V.; Ferrari, M.D.; Lareo, C. Switchgrass as an alternative biomass for ethanol production in a biorefinery: Perspectives on technology, economics and environmental sustainability. Renew. Sustain. Energy Rev. 2022, 158, 112115. [Google Scholar] [CrossRef]
  34. Haji Esmaeili, S.A.; Sobhani, A.; Ebrahimi, S.; Szmerekovsky, J.; Dybing, A.; Keramati, A. Location allocation of biorefineries for a switchgrass-based bioethanol supply chain using energy consumption and emissions. Logistics 2023, 7, 5. [Google Scholar] [CrossRef]
  35. Mousavi-Avval, S.H.; Sahoo, K.; Nepal, P.; Runge, T.; Bergman, R. Environmental impacts and techno-economic assessments of biobased products: A review. Renew. Sustain. Energy Rev. 2023, 180, 113302. [Google Scholar] [CrossRef]
  36. Macal, C.; North, M. Introductory tutorial: Agent-based modeling and simulation. In Proceedings of the Winter Simulation Conference, Savannah, GA, USA, 7–10 December 2014; IEEE: Piscataway, NJ, USA, 2014; pp. 6–20. [Google Scholar]
  37. Law, A.M.; Kelton, W.D.; Kelton, W.D. Simulation Modeling and Analysis; Mcgraw-Hill: New York, NY, USA, 2007; Volume 3. [Google Scholar]
  38. Schruben, L.; Yücesan, E. Modeling paradigms for discrete event simulation. Oper. Res. Lett. 1993, 13, 265–275. [Google Scholar] [CrossRef]
  39. Borshchev, A.; Filippov, A. From system dynamics and discrete event to practical agent based modeling: Reasons, techniques, tools. In Proceedings of the 22nd International Conference of the System Dynamics Society, Oxford, UK, 25–29 July 2004; Volume 22, pp. 25–29. [Google Scholar]
  40. Richardson, G.P. System dynamics: Simulation for policy analysis from a feedback perspective. In Qualitative Simulation Modeling and Analysis; Springer: New York, NY, USA, 1991; pp. 144–169. [Google Scholar]
  41. Khosravi, S.; Haghshenas, H.; Salehi, V. Macro-scale evaluation of urban transportation demand management policies in CBD by using system dynamics case study: Isfahan CBD. Transp. Res. Procedia 2020, 48, 2671–2689. [Google Scholar] [CrossRef]
  42. Ghaffarzadegan, N.; Lyneis, J.; Richardson, G.P. How small system dynamics models can help the public policy process. Syst. Dyn. Rev. 2011, 27, 22–44. [Google Scholar] [CrossRef]
  43. Crooks, A.T.; Heppenstall, A.J. Introduction to agent-based modelling. In Agent-Based Models of Geographical Systems; Springer: Dordrecht, The Netherlands, 2011; pp. 85–105. [Google Scholar]
  44. Raberto, M.; Cincotti, S.; Focardi, S.M.; Marchesi, M. Agent-based simulation of a financial market. Phys. A Stat. Mech. Its Appl. 2001, 299, 319–327. [Google Scholar] [CrossRef]
  45. Cabrera, E.; Taboada, M.; Iglesias, M.L.; Epelde, F.; Luque, E. Optimization of healthcare emergency departments by agent-based simulation. Procedia Comput. Sci. 2011, 4, 1880–1889. [Google Scholar] [CrossRef]
  46. Bazzan, A.L.; Klügl, F. A review on agent-based technology for traffic and transportation. Knowl. Eng. Rev. 2014, 29, 375–403. [Google Scholar] [CrossRef]
  47. Somogyi, E.; Sluka, J.P.; Glazier, J.A. Formalizing knowledge in multi-scale agent-based simulations. In Proceedings of the ACM/IEEE 19th International Conference on Model Driven Engineering Languages and Systems, Saint-Malo, France, 2–7 October 2016; pp. 115–122. [Google Scholar]
  48. Chan, W.K.V.; Son, Y.J.; Macal, C.M. Agent-based simulation tutorial-simulation of emergent behavior and differences between agent-based simulation and discrete-event simulation. In Proceedings of the 2010 Winter Simulation Conference, Baltimore, MD, USA, 5–8 December 2010; IEEE: Piscataway, NJ, USA, 2010; pp. 135–150. [Google Scholar]
  49. Ouda, E.; Sleptchenko, A.; Simsekler, M.C.E. Comprehensive review and future research agenda on discrete-event simulation and agent-based simulation of emergency departments. Simul. Model. Pract. Theory 2023, 129, 102823. [Google Scholar] [CrossRef]
  50. Zhang, F.; Johnson, D.M.; Johnson, M.A.; Sutherland, J.W. Development of a Biomass Supply Chain for Biofuel Production. In Proceedings of the IIE Annual Conference, Reno, NV, USA, 21–25 May 2011; Institute of Industrial and Systems Engineers (IISE): Peachtree Corners, GA, USA, 2011; p. 1. [Google Scholar]
  51. Lamers, P.; Tan, E.C.; Searcy, E.M.; Scarlata, C.J.; Cafferty, K.G.; Jacobson, J.J. Strategic supply system design—A holistic evaluation of operational and production cost for a biorefinery supply chain. Biofuels Bioprod. Biorefining 2015, 9, 648–660. [Google Scholar] [CrossRef]
  52. Cigolini, R.; Pero, M.; Rossi, T.; Sianesi, A. Linking supply chain configuration to supply chain perfrmance: A discrete event simulation model. Simul. Model. Pract. Theory 2014, 40, 1–11. [Google Scholar] [CrossRef]
  53. Vidalakis, C.; Tookey, J.E.; Sommerville, J. Demand uncertainty in construction supply chains: A discrete event simulation study. J. Oper. Res. Soc. 2013, 64, 1194–1204. [Google Scholar] [CrossRef]
  54. Tako, A.A.; Robinson, S. The application of discrete event simulation and system dynamics in the logistics and supply chain context. Decis. Support Syst. 2012, 52, 802–815. [Google Scholar] [CrossRef]
  55. Sahoo, K.; Mani, S. GIS based discrete event modeling and simulation of biomass supply chain. In Proceedings of the 2015 Winter Simulation Conference (WSC), Huntington Beach, CA, USA, 6–9 December 2015; IEEE: Piscataway, NJ, USA, 2015; pp. 967–978. [Google Scholar]
  56. Zhang, F.; Johnson, D.M.; Johnson, M.A. Development of a simulation model of biomass supply chain for biofuel production. Renew. Energy 2012, 44, 380–391. [Google Scholar] [CrossRef]
  57. U.S. Forestry Service. Forest Inventory Data Online (FIDO) and EVALIDator. Available online: https://www.fs.usda.gov/ccrc/tool/forest-inventory-data-online-fido-and-evalidator (accessed on 25 September 2023).
  58. Manuj, I.; Mentzer, J.T.; Bowers, M.R. Improving the rigor of discrete-event simulation in logistics and supply chain research. Int. J. Phys. Distrib. Logist. Manag. 2009, 39, 172–201. [Google Scholar] [CrossRef]
  59. Teng, J.T. On the economic order quantity under conditions of permissible delay in payments. J. Oper. Res. Soc. 2002, 53, 915–918. [Google Scholar] [CrossRef]
  60. Hicks, D.A. A four step methodology for using simulation and optimization technologies in strategic supply chain planning. In Proceedings of the 31st Conference on Winter Simulation: Simulation—A Bridge to the Future, Phoenix, AZ, USA, 5–8 December 1999; Volume 2, pp. 1215–1220. [Google Scholar]
  61. Barlas, Y. Formal aspects of model validity and validation in system dynamics. System Dynamics Review. J. Syst. Dyn. Soc. 1996, 12, 183–210. [Google Scholar] [CrossRef]
  62. Jin, E.; Mendis, G.P.; Sutherland, J.W. Integrated sustainability assessment for a bioenergy system: A system dynamics model of switchgrass for cellulosic ethanol production in the US midwest. J. Clean. Prod. 2019, 234, 503–520. [Google Scholar] [CrossRef]
  63. Christensen, T.; Panoutsou, C. Advanced biofuel value chains through system dynamics modelling and competitive priorities. Energies 2022, 15, 627. [Google Scholar] [CrossRef]
  64. Demczuk, A.; Padula, A.D. Using system dynamics modeling to evaluate the feasibility of ethanol supply chain in Brazil: The role of sugarcane yield, gasoline prices and sales tax rates. Biomass Bioenergy 2017, 97, 186–211. [Google Scholar] [CrossRef]
  65. Patzek, T.W. Thermodynamics of the corn-ethanol biofuel cycle. Crit. Rev. Plant Sci. 2004, 23, 519–567. [Google Scholar] [CrossRef]
  66. Ba, B.H.; Prins, C.; Prodhon, C. Models for optimization and performance evaluation of biomass supply chains: An Operations Research perspective. Renew. Energy 2016, 87, 977–989. [Google Scholar] [CrossRef]
  67. Kim, S.; Aydin, B.; Kim, S. Simulation modeling of a photovoltaic-green roof system for energy cost reduction of a building: Texas case study. Energies 2021, 14, 5443. [Google Scholar] [CrossRef]
  68. Moncada, J.A.; Verstegen, J.A.; Posada, J.A.; Junginger, M.; Lukszo, Z.; Faaij, A.; Weijnen, M. Exploring policy options to spur the expansion of ethanol production and consumption in Brazil: An agent-based modeling approach. Energy Policy 2018, 123, 619–641. [Google Scholar] [CrossRef]
  69. Bichraoui-Draper, N.; Xu, M.; Miller, S.A.; Guillaume, B. Agent-based life cycle assessment for switchgrass-based bioenergy systems. Resour. Conserv. Recycl. 2015, 103, 171–178. [Google Scholar] [CrossRef]
  70. Fernandez-Cornejo, J.; McBride, W.D. Adoption of bioengineered crops (No. 1473-2016-120752). USDA Economic Research Service. Available online: https://www.ers.usda.gov/publications/pub-details/?pubid=41423 (accessed on 25 September 2023).
  71. Anderson, L.; Schoney, R.; Nolan, J. Assessing the consequences of second-generation bioenergy crops for grain/livestock farming on the Canadian prairies: An agent-based simulation. J. Simul. 2023, 17, 149–163. [Google Scholar] [CrossRef]
  72. Kim, Y.; Kim, S.; Kim, S. An integrated agent-based simulation modeling framework for sustainable production of an Agrophotovoltaic system. J. Clean. Prod. 2023, 420, 138307. [Google Scholar] [CrossRef]
  73. Yoon, C.Y.; Kim, S.; Cho, J.; Kim, S. Modeling the Impacts of Climate Change on Yields of Various Korean Soybean Sprout Cultivars. Agronomy 2021, 11, 1590. [Google Scholar] [CrossRef]
Figure 1. Dry mill corn-based ethanol production process.
Energies 16 07429 g001
Figure 2. Conceptual model of ethanol production process [7].
Energies 16 07429 g002
Figure 3. Fermentation and hydrolysis process in DES [7].
Energies 16 07429 g003
Figure 4. Simulation-based optimization framework.
Energies 16 07429 g004
Figure 5. Stock and flow diagram for the cellulosic biofuel and feedstock markets sub-model under system dynamics [62].
Energies 16 07429 g005
Figure 6. Operation cost estimation of a building using solar power under agent-based simulation [67].
Energies 16 07429 g006
Table 1. Chemical reaction involving xylose and glucose with enzymes [7].
ReactionReactantsConversion (%)
G l u c o s e 2 E t h a n o l + 2 C O 2 G l u c o s e 90.0
G l u c o s e + 0.047 C S L + 0.018 D A P 6 Z . m o b i l i s + 2.4 H 2 O G l u c o s e 4.0
G l u c o s e + 2.4 H 2 O 2 G l y c e r o l + O 2 G l u c o s e 0.4
G l u c o s e + 2 C O 2 2 S u c c i n i c A c i d + O 2 G l u c o s e 0.6
3 X y l o s e 5 E t h a n o l + 5 C O 2 X y l o s e 80.0
X y l o s e + 0.039 C S L + 0.015 D A P 5 Z . m o b i l i s + 2 H 2 O X y l o s e 4.0
3 X y l o s e + 5 H 2 O 2.5 G l y c e r o l + 2.5 O 2 X y l o s e 0.3
X y l o s e + H 2 O X y l i t o l + 9.5 O 2 X y l o s e 4.6
3 X y l o s e + 5 C O 2 2 S u c c i n i c A c i d + 2.5 O 2 X y l o s e 0.9
Disclaimer/Publisher’s Note: The statements, opinions and data contained in all publications are solely those of the individual author(s) and contributor(s) and not of MDPI and/or the editor(s). MDPI and/or the editor(s) disclaim responsibility for any injury to people or property resulting from any ideas, methods, instructions or products referred to in the content.

