Article

Improve Oil Recovery Mechanism of Multi-Layer Cyclic Alternate Injection and Production for Mature Oilfield at Extra-High Water Cut Stage Using Visual Physical Simulation Experiment

1
PetroChina Research Institute of Petroleum Exploration & Development, Beijing 100083, China
2
College of Petroleum Engineering, China University of Petroleum (Beijing), Beijing 100083, China
*
Author to whom correspondence should be addressed.
Energies 2023, 16(3), 1546; https://doi.org/10.3390/en16031546
Submission received: 20 December 2022 / Revised: 12 January 2023 / Accepted: 23 January 2023 / Published: 3 February 2023
(This article belongs to the Collection Flow and Transport in Porous Media)

Abstract

:
In order to achieve sustainable development of mature oilfield, a series of adjustment measures should be implemented to improve production performance at the extra-high water cut stage. South Kumkol reservoir is a typical multi-layer low viscosity oil reservoir, which has the characteristics of small sandstone body, high shale volume, and strong heterogeneity. At present, the water cut of the South Kumkol reservoir is about 90%, which is on the verge of being abandoned. Multi-layer cyclic alternate injection and production (MCA-IP) is an ideal adjustment measure for multi-layer oil reservoir to improve oil recovery (IOR) at the extra-high water cut stage. In this paper, we designed the double-plate visual physical device and the MCA-IP experimental program and then calculated the sweep coefficient using image recognition method. Furthermore, the sweep coefficient was quantitatively calculated by image recognition method. The results show that the sweep area extends to both sides of the main streamline and the sweep efficiency is gradually improved after the completion of MCA-IP. In addition, the IOR mechanism of MCA-IP mainly includes reperforation, well-pattern encryption, and asynchronous injection-production. The reperforation and well-pattern encryption increased the sweep coefficient by about 19.52%, while asynchronous injection-production increased the sweep coefficient by about 1.2%, and the overall sweep coefficient increased by about 20.7%. According to the experimental data statistics, the MCA-IP method can increase oil recovery by about 11% and reduce water cut by about 6%.

1. Introduction

The most popular method of oil field development is water injection [1,2,3,4]. Its widespread use has significantly increased the economic benefits of oil fields and taken on the significant task of raising crude oil output at this time [5,6,7,8]. However, as long-term water-flooding development moves forward, oilfields frequently reach the ultra-high water cut stage [9,10]. In China, the vast majority of ultra-high water-cut oil fields primarily create terrestrial sedimentary reserves. River or deltaic deposits make up the majority of the sedimentary type. The prominent characteristics of these deposits include the large span of the longitudinal oil-bearing layer system, the superimposition of multiple stages of sand bodies, and the interactive distribution of the reservoirs with different physical properties, which leads to slow pressure transmission and constrained propagation range after development investment. The consequences of water-flooding development in these oil fields have been significantly impacted by the traits of “small sand body, large shale volume, and strong heterogeneity”. Long-term water injection was used to develop these fields, which have a complex oil–water interaction at the stage of ultra-high water cut, a low water injection sweep coefficient, and highly distributed residual oil. Numerous data points indicate that the strongly heterogeneous oil field is characterized by a rapid rise in water cut in the medium-low water cut stage and a sluggish rise in water cut in the medium-high water cut stage as it develops with water injection. The percentage of recoverable reserves is around 61.6% when the water cut approaches 80%. Therefore, professionals and academics are still concentrating their study on how to use the ultra-high water cut stage in big oil fields [11,12,13]. Improved attention has been given to oilfield development in the ultra-high water cut era as a result of ongoing oilfield development. Research on novel potential-harvesting techniques has been conducted by experts and academics with the goal of stabilizing oil and precipitation while lowering costs and boosting efficiency [14,15,16]. The former Soviet Union was a pioneer in research during the 20th century, suggesting a hydrodynamic approach for modifying the production regime and executing field tests with an annual oil increase of roughly 4000 × 104 t [17]. As a result, the United States investigated the impact of well pattern encryption and created enhanced oil recovery technology. During the Seventh Five-Year Plan, a comprehensive adjustment technology based on subdividing the layer system, encrypting the well pattern, and increasing the liquid volume was developed in consideration of the characteristics of China’s old oil fields [18,19]. This technology had the effect of stabilizing crude oil production and reducing water cut. Indoor physical simulation experiments, improved nuclear magnetic resonance imaging technology, numerical simulation technology, and oilfield tests based on meticulous and scientific experimental program design were also carried out throughout the eighth five-year plan. Hydrodynamic adjustment methods, primarily from theoretical and practical perspectives, are examined as a new approach of increasing the water-flooding development effect in oilfields during high water-cut periods [20,21]. The concepts for oil recovery during the high water cut time in China have expanded, thanks to this method’s low investment, high return, and ease of operation [22].
The hydrodynamic adjustment method means using an existing single well to change the reservoir pressure distribution by altering the well production experimental program or well pattern. By doing this, the stagnant crude oil can be moved and the water injection’s efficiency increased. According to their functional properties, hydrodynamic adjustment methods can be categorized into two parts: (1) Modifying well operating system adjustment techniques, primarily by changing fluid flow direction, optimizing high-pressure water injection, increasing throughput of a single well, etc. (2) Modifications to the well pattern’s layer system, primarily through the subdivision of the layer system, well pattern deformation, and transfer of the water injection leading edge, etc. [23]. In oilfields, the use of hydrodynamic adjustment methods has produced a significant number of successful typical examples. The former Soviet Union tested 47 thermal recovery technologies, 105 chemical methods, and 214 hydrodynamic methods on 210 oil fields owned by 32 joint production firms in 1988. According to the test results, oil increased by an average of 7.66 × 10⁴ t using the thermal recovery method, 7.66 × 10⁴ t using the chemical approach, and 18.52 × 10⁴ t using the hydrodynamic method [24]. In the six key oil regions of Daqing, Jilin, Shengli, Liaohe, North China, and Jianghan, China undertook unstable injection-production studies in which all had positive benefits on oil production and were predicted to raise the water-flooding recovery rate by 1.5% to 3% [25,26,27,28]. The hydrodynamic correction approach therefore offers a very wide range of potential applications in China [29,30,31,32]. Most oil field adjustments over the years have relied on the hydrodynamic adjustment approach because: (1) Compared to other enhanced oil recovery techniques, the hydrodynamic approach can yield better economic benefits with a smaller investment and will not have an effect on the environment; and (2) the hydrodynamic method has a wide range of adaptability and a relatively high success rate [33,34].
The South Kumkol oil reservoir is located at the South Turgai Basin in central Kazakhstan. It was deposited in a typical fluvial manner. Strong vertical variability exists in the reservoir plane, and interlayer intercalation has evolved steadily. The block is separated into three sets of development layer systems, with O1 and O3 layers being high permeability reservoirs and O2 layers being low permeability reservoirs, in order to overcome vertical heterogeneity. The O1 and O3 layers have reached the “double high” stage after depletion development due to the low viscosity of crude oil. It is critical to implement multi-layer system synchronization adjustment while taking into account all current layer systems and well patterns. It is suggested that a development adjustment policy of local encryption combined with hydrodynamic modifications focusing on remaining oil enrichment zones be used to change low-viscosity oil reservoirs’ present layer systems and well patterns. An alternate injection and production mode was creatively suggested to improve the water-flooding swept volume of the ultra-high water-cut oil field [35,36,37]. In order to execute MCA-IP, it is necessary to employ the earlier, existing wells. The schematic layout of alternating injection and production is shown in Figure 1. There are now two sets of development layers, and for each layer, there are two sets of five-point well patterns. All production wells are open in the lower layer, while water injection well is injected into the upper layer in the first cycle of MCA-IP. In the second cycle, all production wells are open in the upper layer, while the water injection well is injected into the lower layer. The IOR mechanism of the MCA-IP is the combined effect of unstable water injection and unstable oil production. The MCA-IP also achieves the effect of well pattern encryption and well pattern conversion.

2. Methodology

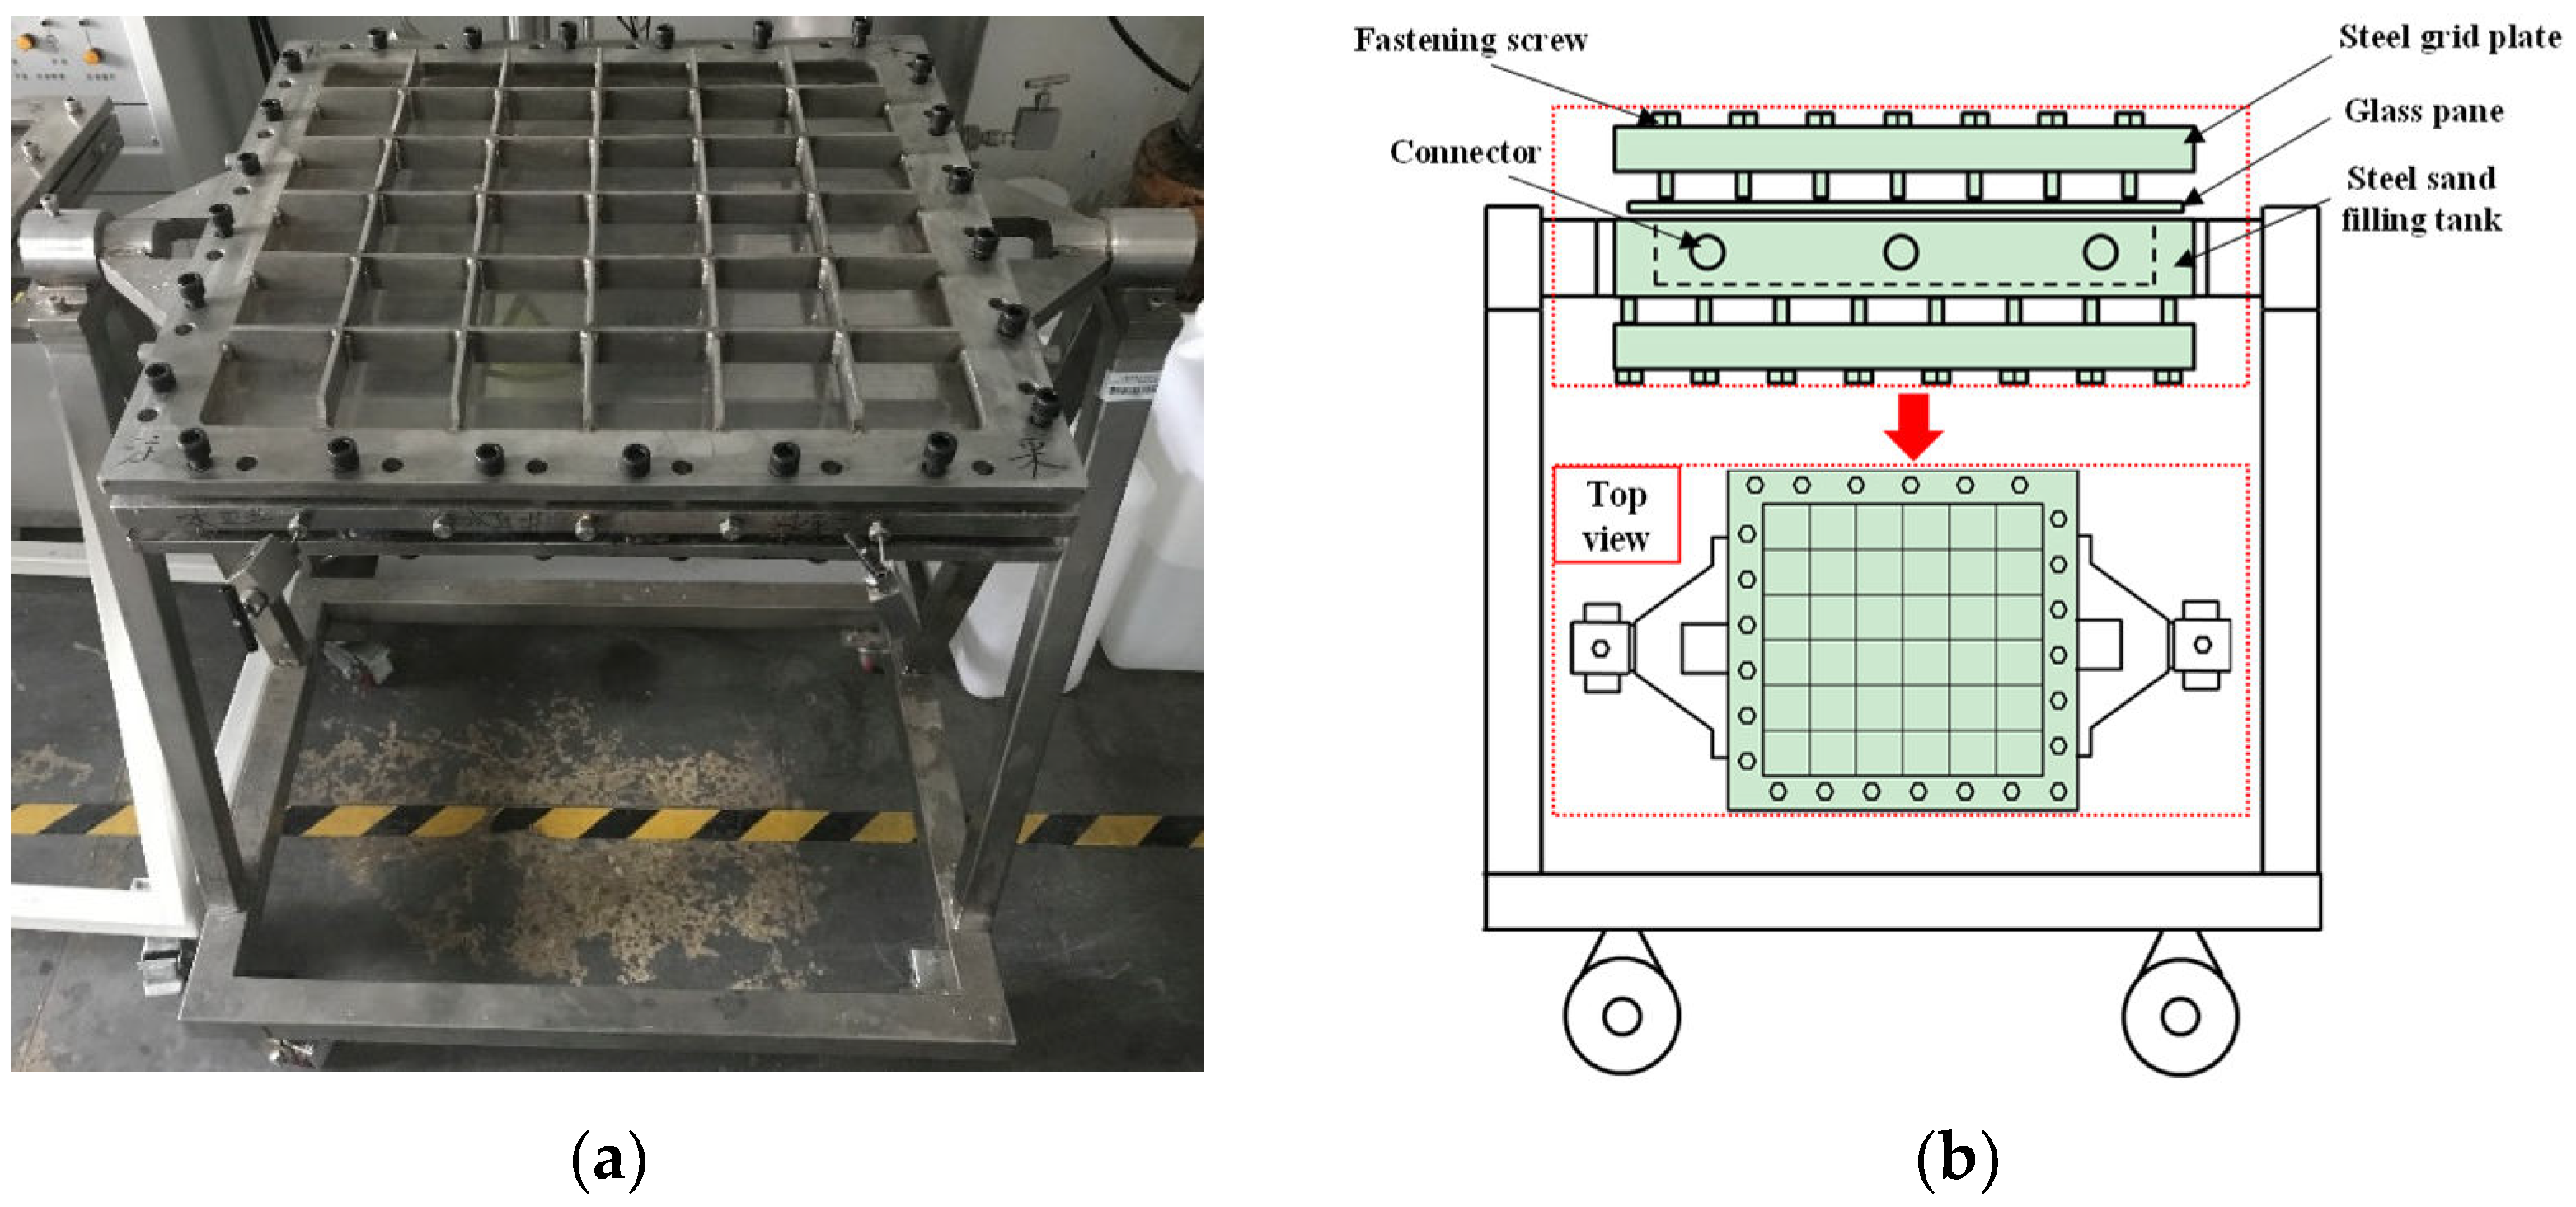
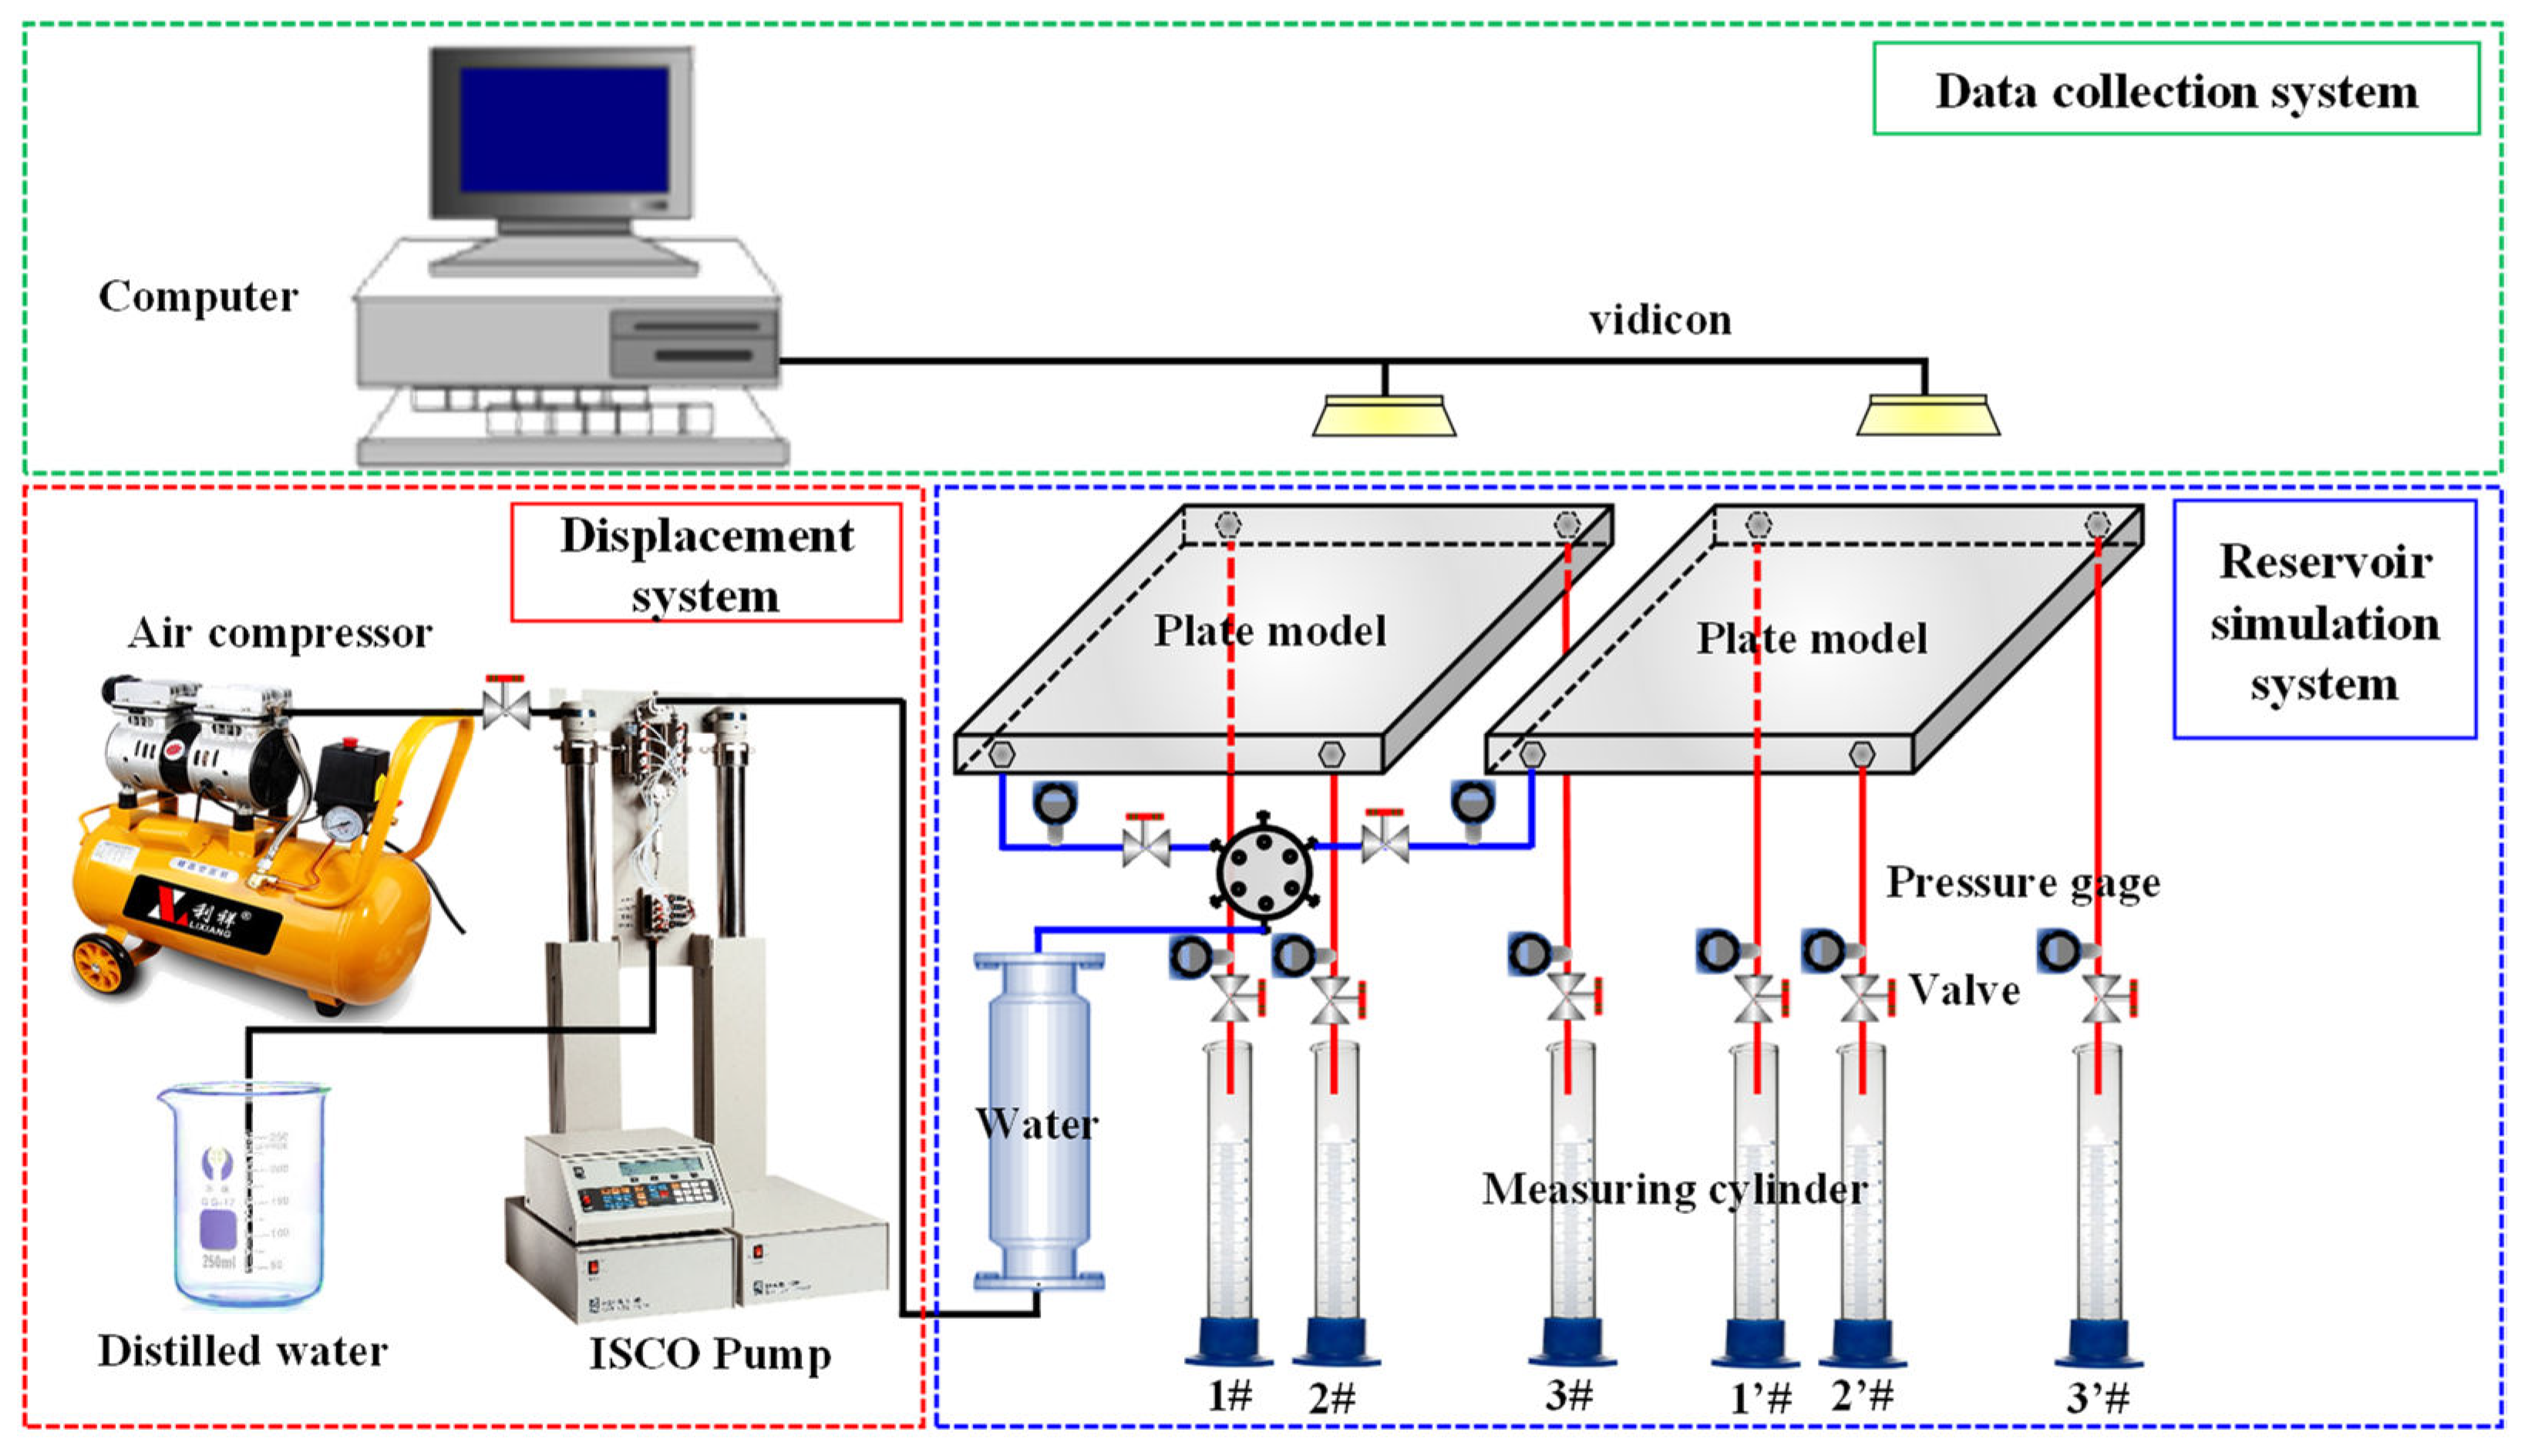
2.1. Experimental Materials and Equipment

South Kumkol reservoir is a typical low viscosity oil reservoir with crude oil viscosity ranging from 1.07 to 3.24 mPa·s. As the viscosity ratio with formation water is close to 1:1, the formation water displacing oil process is piston displacement, and the residual oil saturation Sor within the sweep range is almost close to 0. Its porosity is about 20%, permeability is about 1000 mD. After 20 years of development, the water cut has reached 98.4%, the recovery degree is close to 50%, and the recovery degree of recoverable oil reserves is about 98%. Therefore, the most important factor affecting the recovery degree is the swept volume. MCA-IP field tests were carried out on some well groups of South Kumkol reservoir. The oil recovery has been improved, but the mechanism of IOR was not clear.
Based on basic reservoir parameters, the experimental oil has a viscosity of 2.5 mPa·s, a density of 0.8 g/cm3, a freezing point of −47 °C, and a boiling range of 180–310 °C. It is 99.7% anhydrous kerosene. Deionized water used in the experiment has a viscosity of 1 mPa·s, a density of 1 g/cm3, a freezing point of 0 °C, and a boiling point of 100 °C. The experimental water is formation water configured with deionized water, and the formation water ions are shown in Table 1. Appropriate amounts of Sudan I and black ink were added to the oil and water, respectively, to color them yellow and black to make observation easier. The majority of the experimental sand is composed of 80 mesh and 120 mesh quartz sand that are shaped like round spheres with irregular rhombuses; the material has a specific gravity of 2.5, a bulk density of 1.5, and a Mohs hardness of 6. Its composition is SiO2 (70–74%), Na2O (12–15%), CaO (8–10%), and MgO (1–3.8%).
In this experiment, the law of water flooding and the sweep characteristic of water flooding are primarily studied in relation to various development adjustment techniques. Consequently, a two-dimensional planar visualization physical simulation device is used in the experiment. The model can be rotated at any angle and measures 500 mm in length, 500 mm in breadth, and 20 mm in height. The two-dimensional planar visualizing experimental apparatus used in this study is shown in Figure 2. The model’s front side is made of pressure-resistant glass that can bear pressures of up to 1 MPa and can be used to record the dynamic changes in oil saturation as well as to be seen during the experiment.
The displacement system, reservoir simulation system, and data collection system make up the majority of the experimental device. The displacement system is primarily made up of a household UPUMP-100 constant pressure and speed pump, an air compressor, and a distilled water beaker that is directly connected to the reservoir simulation system and is used to power the displacement of oil by water. The fundamental component of the experiment is the reservoir simulation system, which comprises two identical two-dimensional flat plate models. Through valve control, it is utilized to model the two sets of reservoir development layer systems and various development adjustment techniques. The sweep map of water flooding, produced fluid and pressure gauge data, and the plane sweep coefficient through image recognition are all recorded using the data collection system. Figure 3 depicts the overall device’s composition and connection mode.

2.2. Experimental Parameters and Experimental Program

The experimental parameters are primarily based on the similarity criterion, and the physical parameters of the real reservoir, such as length, time, pressure, and velocity, are reasonably adjusted according to the experimental conditions in order to ensure that the results can be true to the real reservoir in any case. Geometric similarity, similar physical properties, and production dynamics similarity are the key factors taken into account for the design of the double-plate water-flooding experiment, with physical properties similarity and production dynamics similarity being the focus of this experiment.
The physical model parameters calculated by similarity criteria and the reservoir parameters for O1 and O3 in the K oil field are shown in Table 2. As a result, the actual reservoir parameters were converted to laboratory condition parameters based on the number of major similarity criteria screened for this experimental condition. During the sand filling procedure, the upper and lower plates were filled with 80 mesh and 120 mesh sand, respectively, taking into account the variations in the physical characteristics of the O1 and O3 layers in the K oil field. In order to confirm the validity of the experiment, some sand mixing was done during the actual sand filling session in order to accurately portray the heterogeneity.
To represent the reservoir, two plate models were filled with quartz sand of various meshes. Three sets of experimental programs in all were created to examine the sweep characteristic of water flooding using various development techniques. The current strategy for developing the K oil field is Experimental Program 1, which uses a staggered five-point well pattern with a 1/4 upper and lower stratigraphic structure. As a comparison plan, Experimental Program 2 uses the 1/4 upper and lower stratigraphic system coupled injection-production in a nine-point well design. According to Experimental Program 3, which serves as an adjustment experimental program, the upper and lower stratigraphic systems would alternately receive injections and production based on Experimental Program 1’s 90% water cut. The experimental programs are shown in Table 3.
In the experiment, a specific number of other mesh sands were mixed with the 80 mesh and 120 mesh quartz sand, respectively, to ensure a particular degree of heterogeneity in the upper and bottom layers. For the method of experiment to achieve MCA-IP, valve adjustment must be done continuously. Figure 4 displays the schematic representation of the specified design.

2.3. Experimental Steps and Procedures

Three primary stages make up this physical simulation process: experimental setup, displacement experiment, and data analysis. All experimental materials must be prepared, experimental equipment must be built, and sand must be filled and sealed as part of the experimental preparation process. The three primary stages of the displacement experiment are the air tightness check, the saturated oil step, and the water flooding step. The valves must be opened and closed strictly in line with the design of the experimental program during the MCA-IP. The map of the water-flooding sweep field, the injection pressure, and the oil and water output are the primary data points recorded during data analysis. These are the precise experimental procedures:
(a)
Blending sand with oil: Use Sudan I and black ink to dye the oil and water, respectively. Allow it to fully precipitate for a day after dyeing, then filter the precipitation via filter paper to protect the experimental phenomenon. To ascertain the sand mixing ratio of various plates, prepare 80 mesh and 120 mesh quartz sand, respectively, and test the permeability via the sand-filled pipe.
(b)
Filling and sealing with sand: In this experiment, oil and sand are mixed in a certain ratio, well combined, and then filled into two-dimensional flat plate models. The models are then compacted with wooden boards to avoid water channeling during the displacement phase. The device and glass plate are then sealed using sealant, and a steel plate is then added to further compact the seal and achieve a high level of sealing. The glue is then left to dry for two days.
(c)
Supplied evenly: Open all valves, examine the device’s air tightness, and if necessary, mix glue to repair any portions with poor sealing before letting it dry. Once the airtightness has been verified, connect the 2PB00C advection pump to saturate the oil. Set the continuous flow mode to 5 mL/min and continue until all production wells are steadily producing oil, at which point the saturation process is complete.
(d)
Displacement at constant speed: Set the experimental protection pressure to 5 MPa, connect the UPUMP-100 displacement pump, and choose a constant flow rate of 3 mL/min. This component has an intermediate container for experimental water so that water can be supplied to the model steadily and constantly.
(e)
Gathering of data: Adjust the camera position, link to the image recognition program to determine the plane sweep coefficient, and use the computer to gather real-time water-flooding oil sweeping field maps. Keep track of oil and water production data every 30 min to determine the water cut and recovery rates.

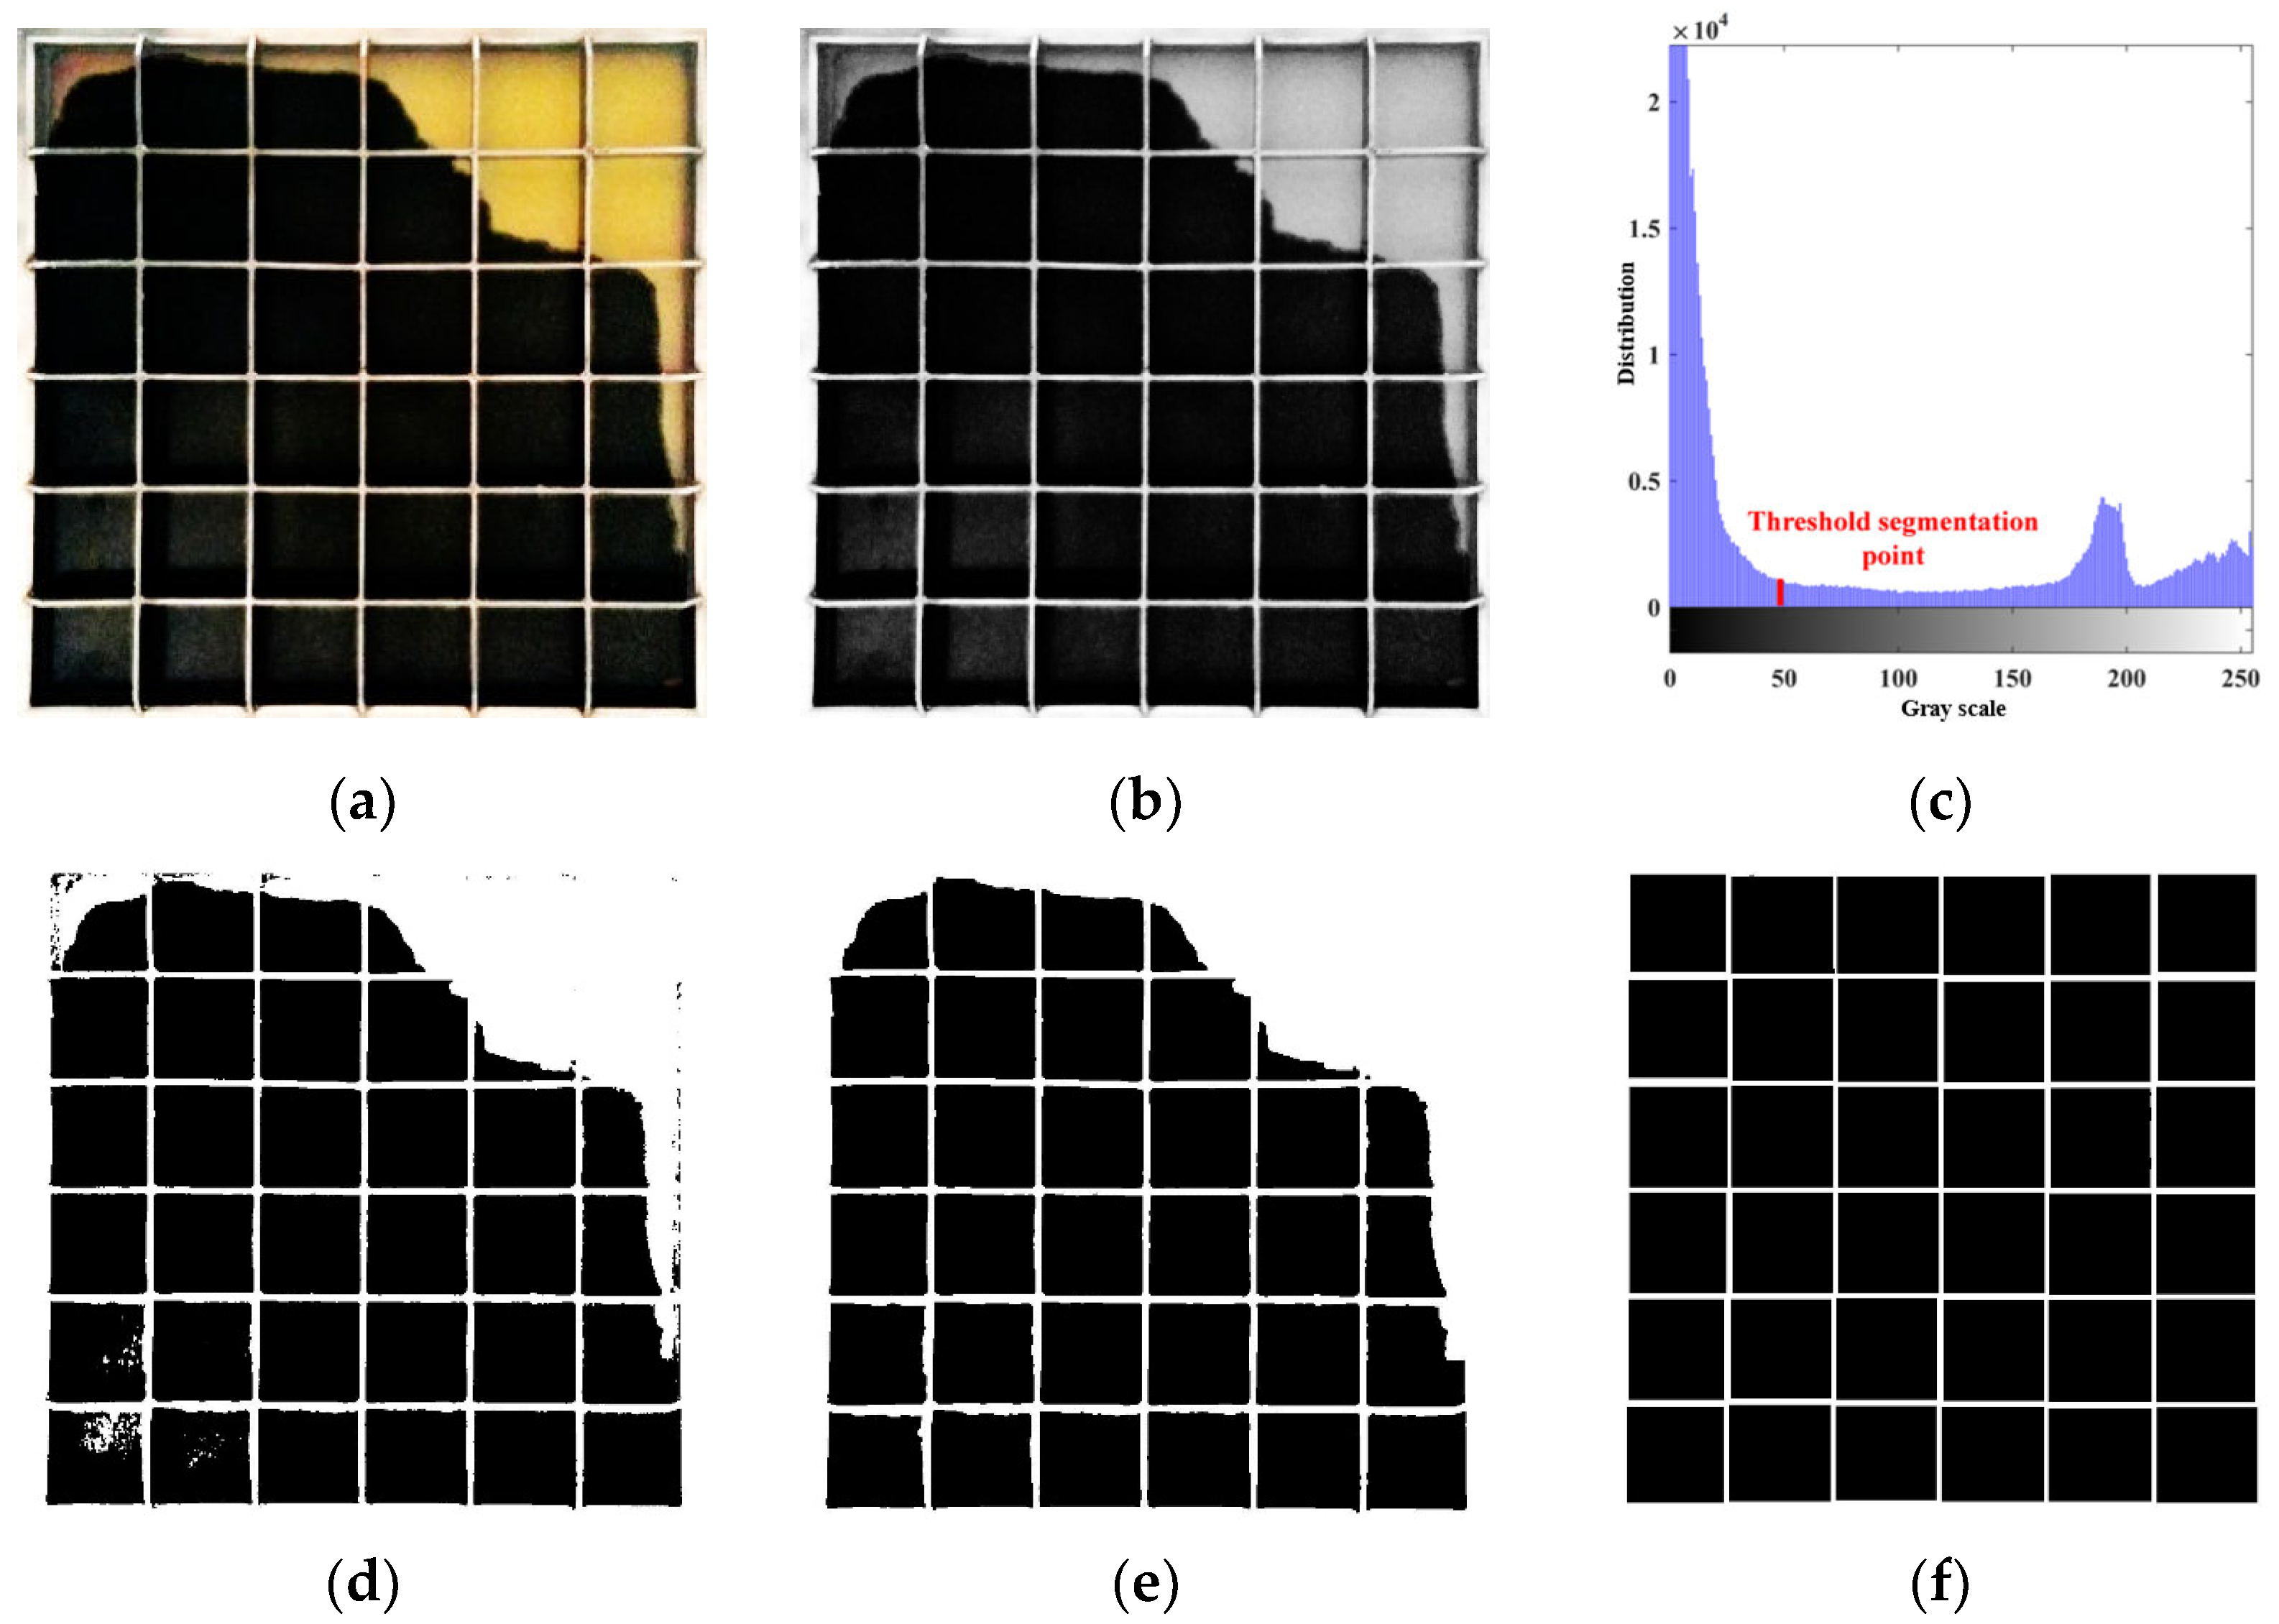
2.4. Calculation Method of Sweep Coefficient Based on Image Recognition

The plane sweep coefficients must be calculated at various stages after the camera has collected the sweeping field map. The grid counting approach has traditionally been used to determine the plane sweep coefficients for the flat plate model, although its calculation error is relatively high. The image segmentation method is initially utilized for picture position in an attempt to remedy the issue, but at this point, the binary image frequently has issues such as noise and edge roughness. Following smooth noise reduction using the morphological processing technique, the processed image is used to calculate the sweep coefficient. The expansion operation and erosion operation make up the basic morphology transformation, and the image processing process frequently employs the composite transform, which combines the two fundamental transformations. While the closed operation refers to the image expansion operation prior to the erosion operation, the open operation refers to the image erosion process.
In this image sweep calculation, the experimental original image is shown in Figure 5a and the grayscale image obtained by first performing grayscale processing and recognition is shown in Figure 5b. Then, threshold segmentation is used to perform image binarization. The gray value 48, which is the bottom point between the two peaks, is selected as threshold value the in the gray probability density function histogram. The pixel of the binary image is 903 × 903. The gray distribution map and the binary image after threshold segmentation are shown in Figure 5c,d. The binary image is processed by morphological operating, and then the local area is filled in to achieve edge smoothing and the additive noise of the image is filtered out, in order to obtain the binary image of the sweep field map as shown in Figure 5e. In the final calculation of the plane sweep coefficient, the interference of the needs to be eliminated, that is, the total area needs to eliminate the pixels occupied by the grid, as shown in Figure 5f. Finally, the plane sweep coefficient can be easily calculated according to Figure 5e,f.

3. Results and Discussion

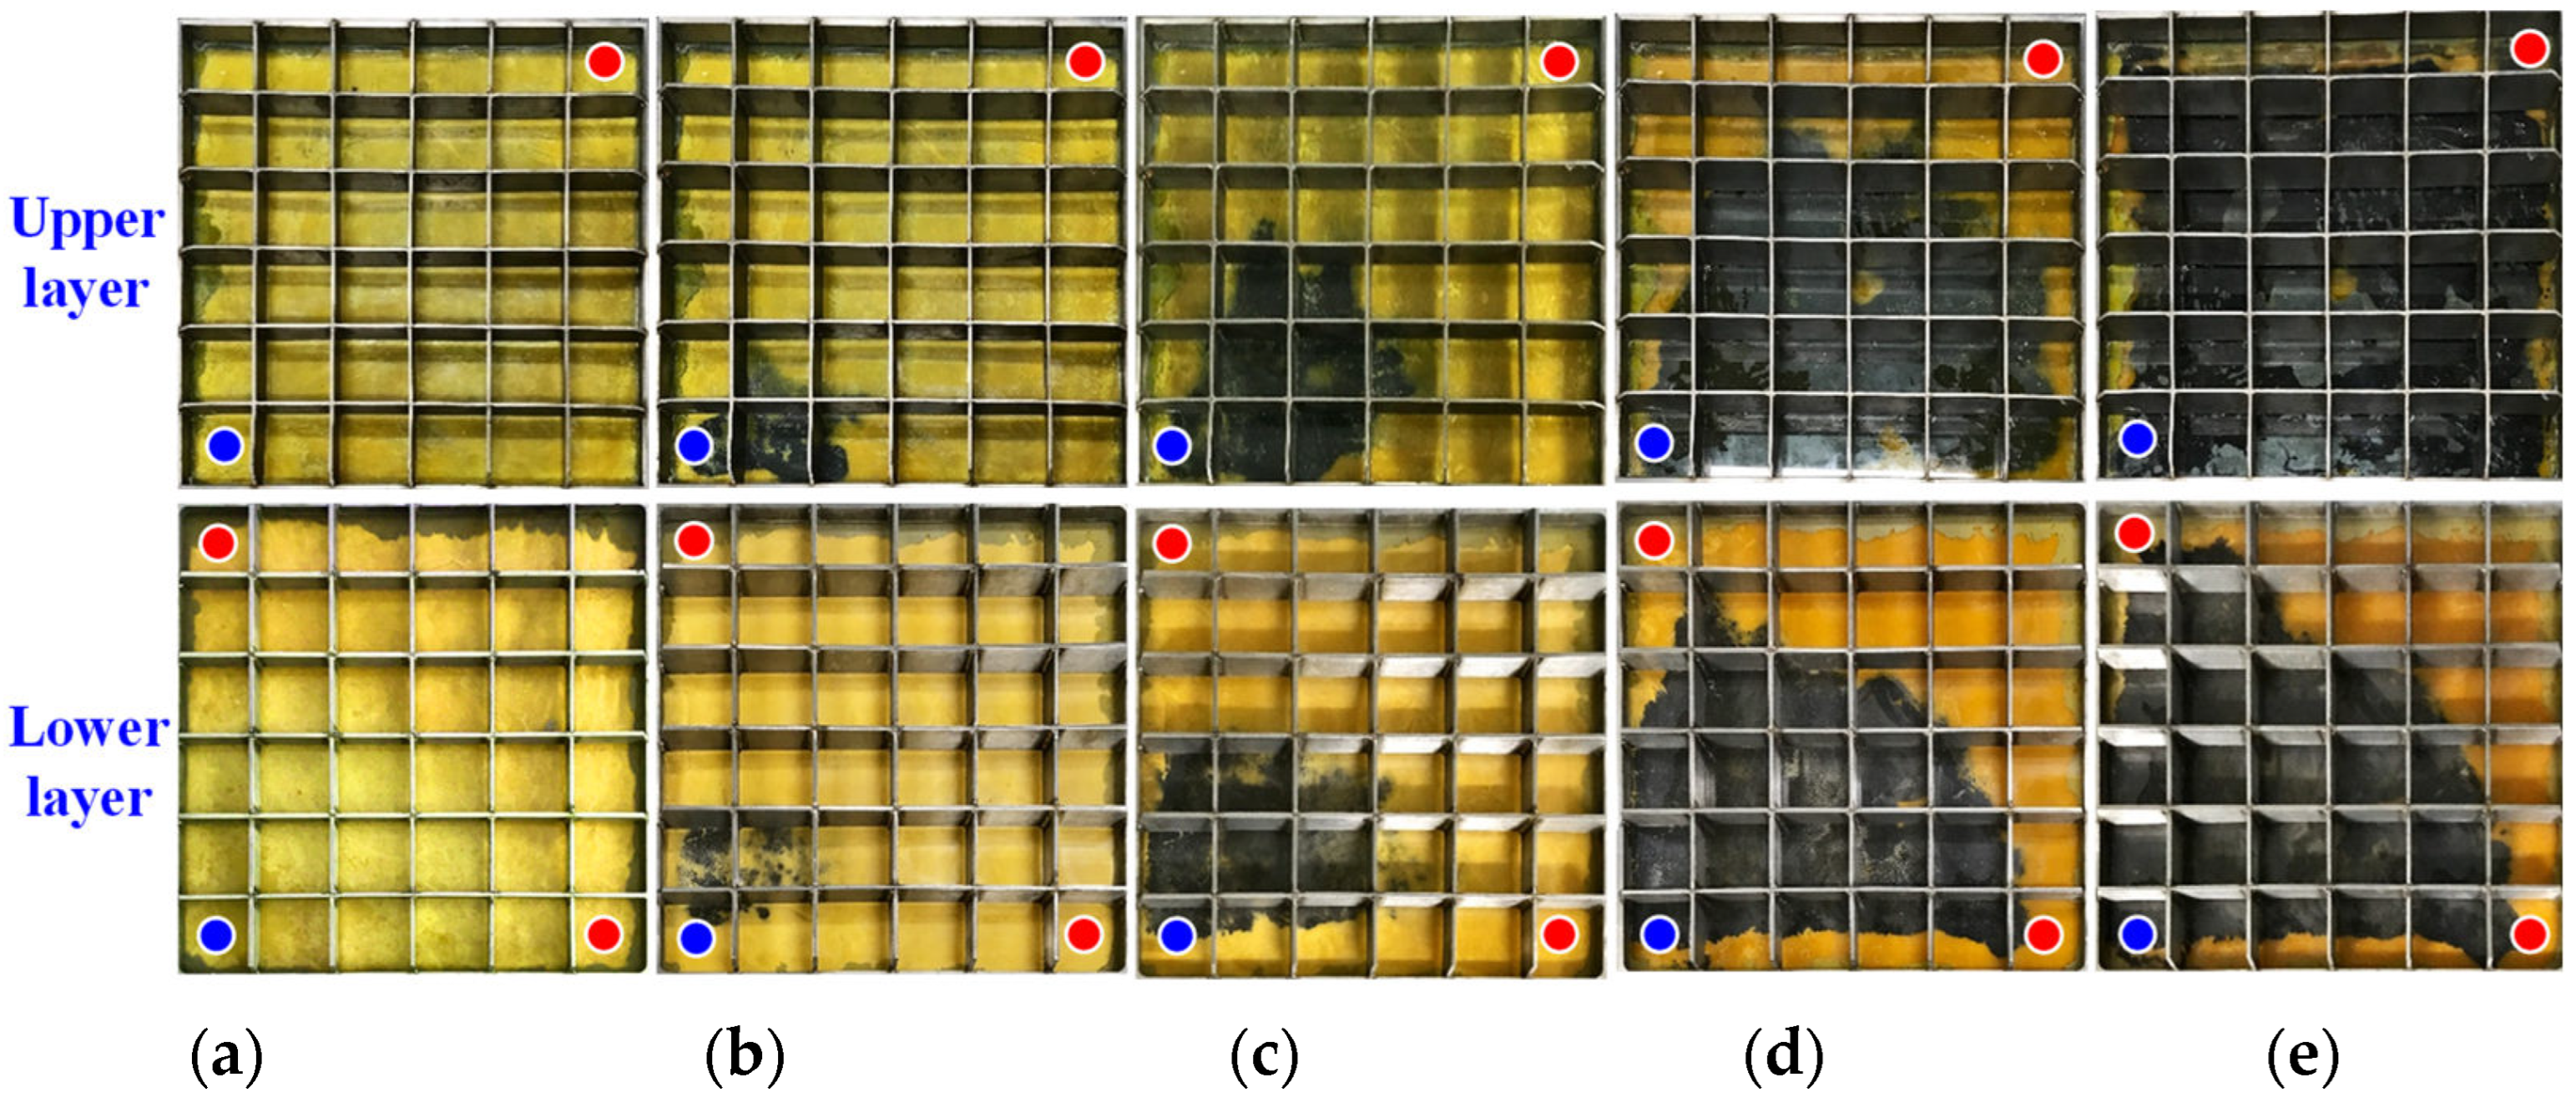
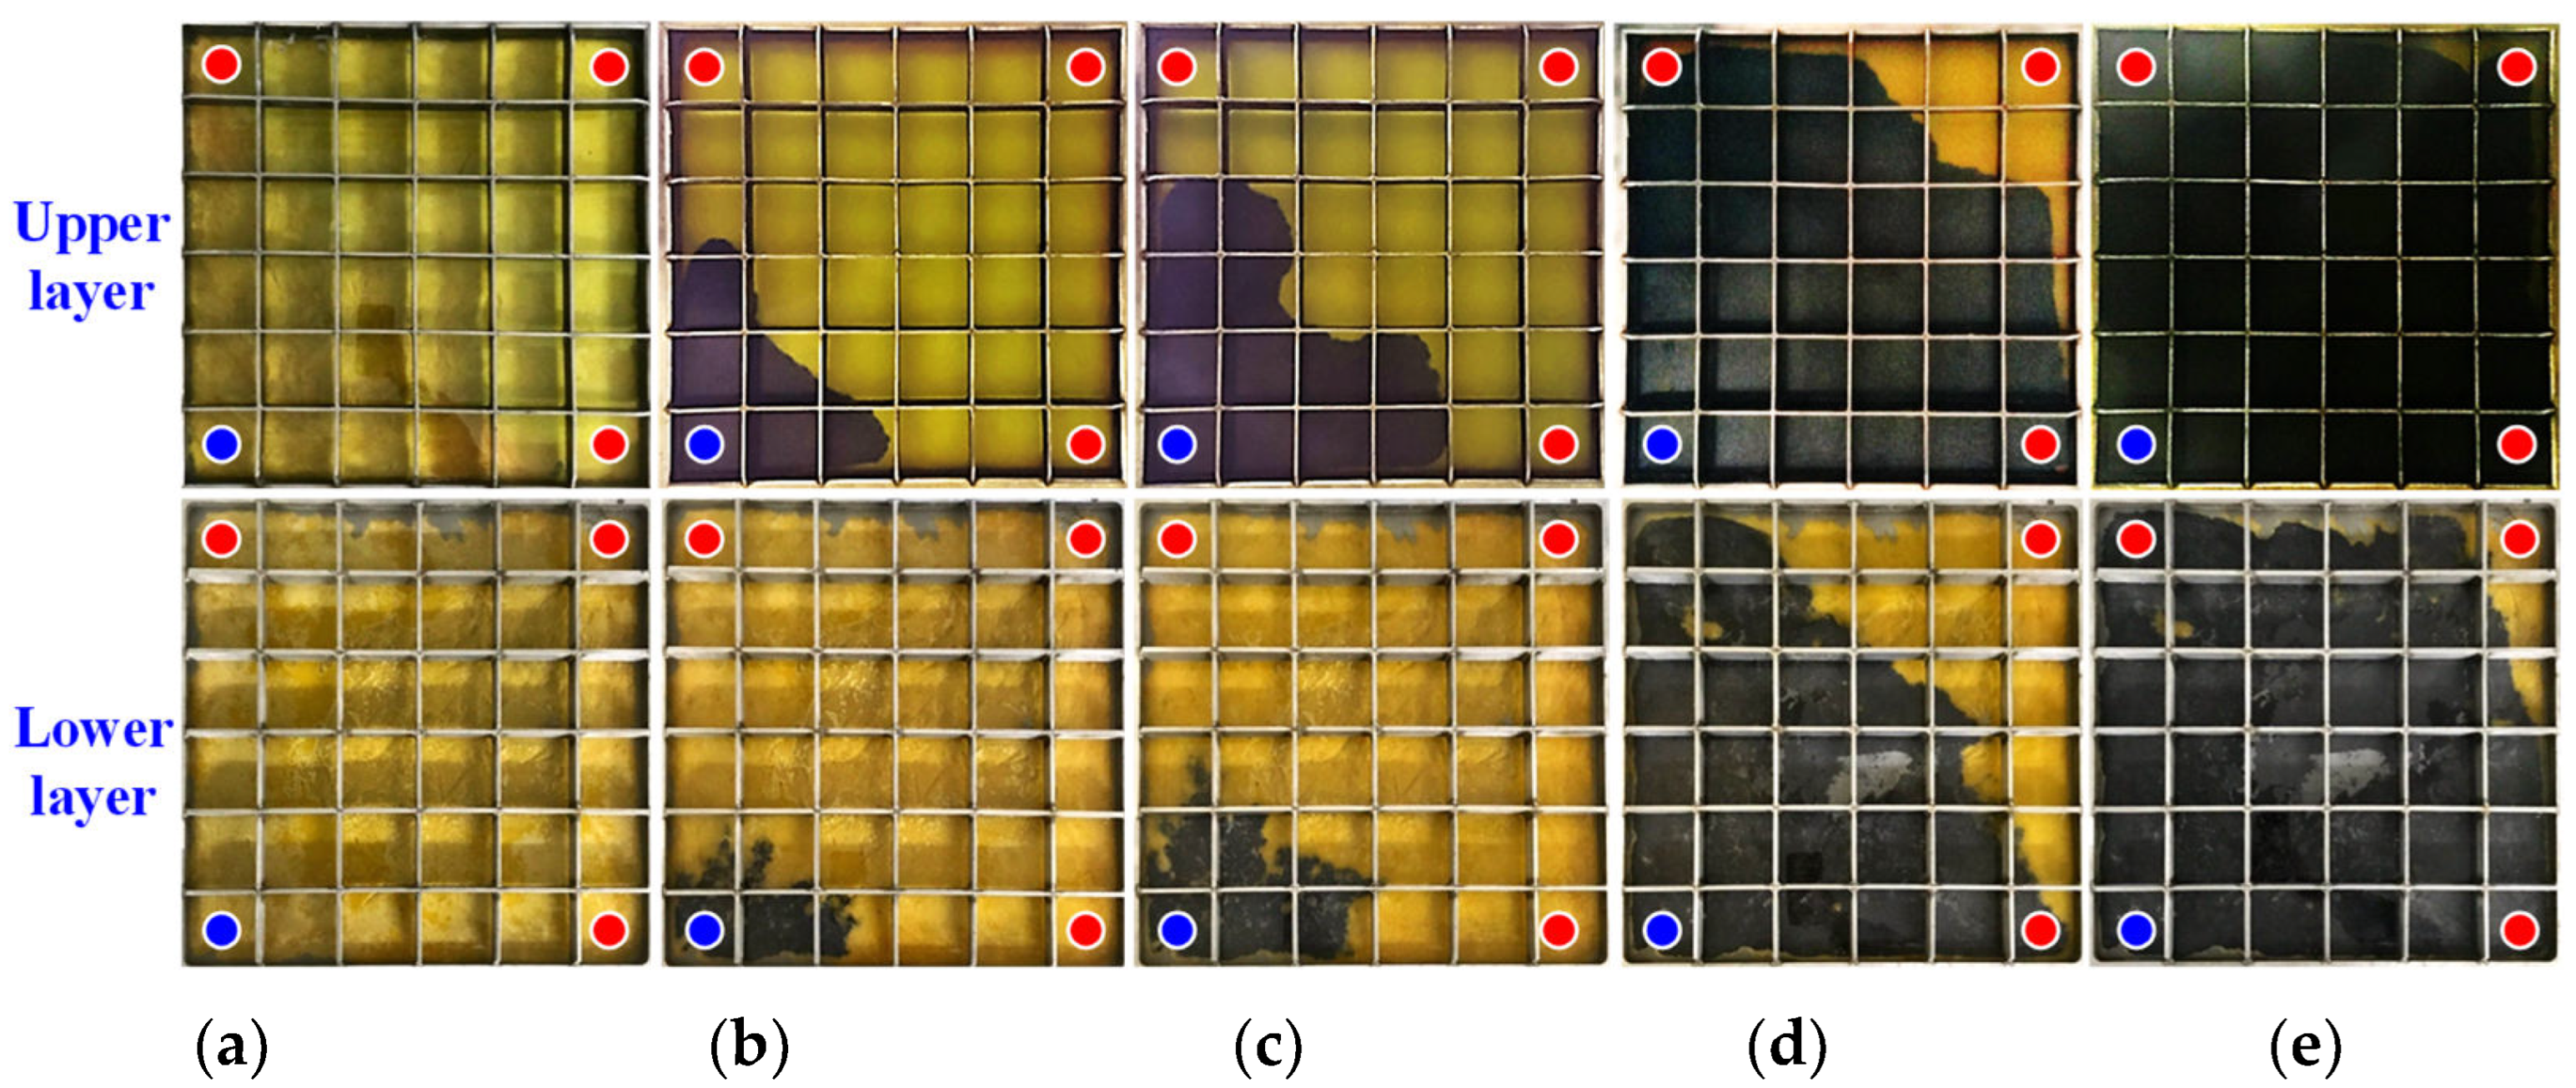
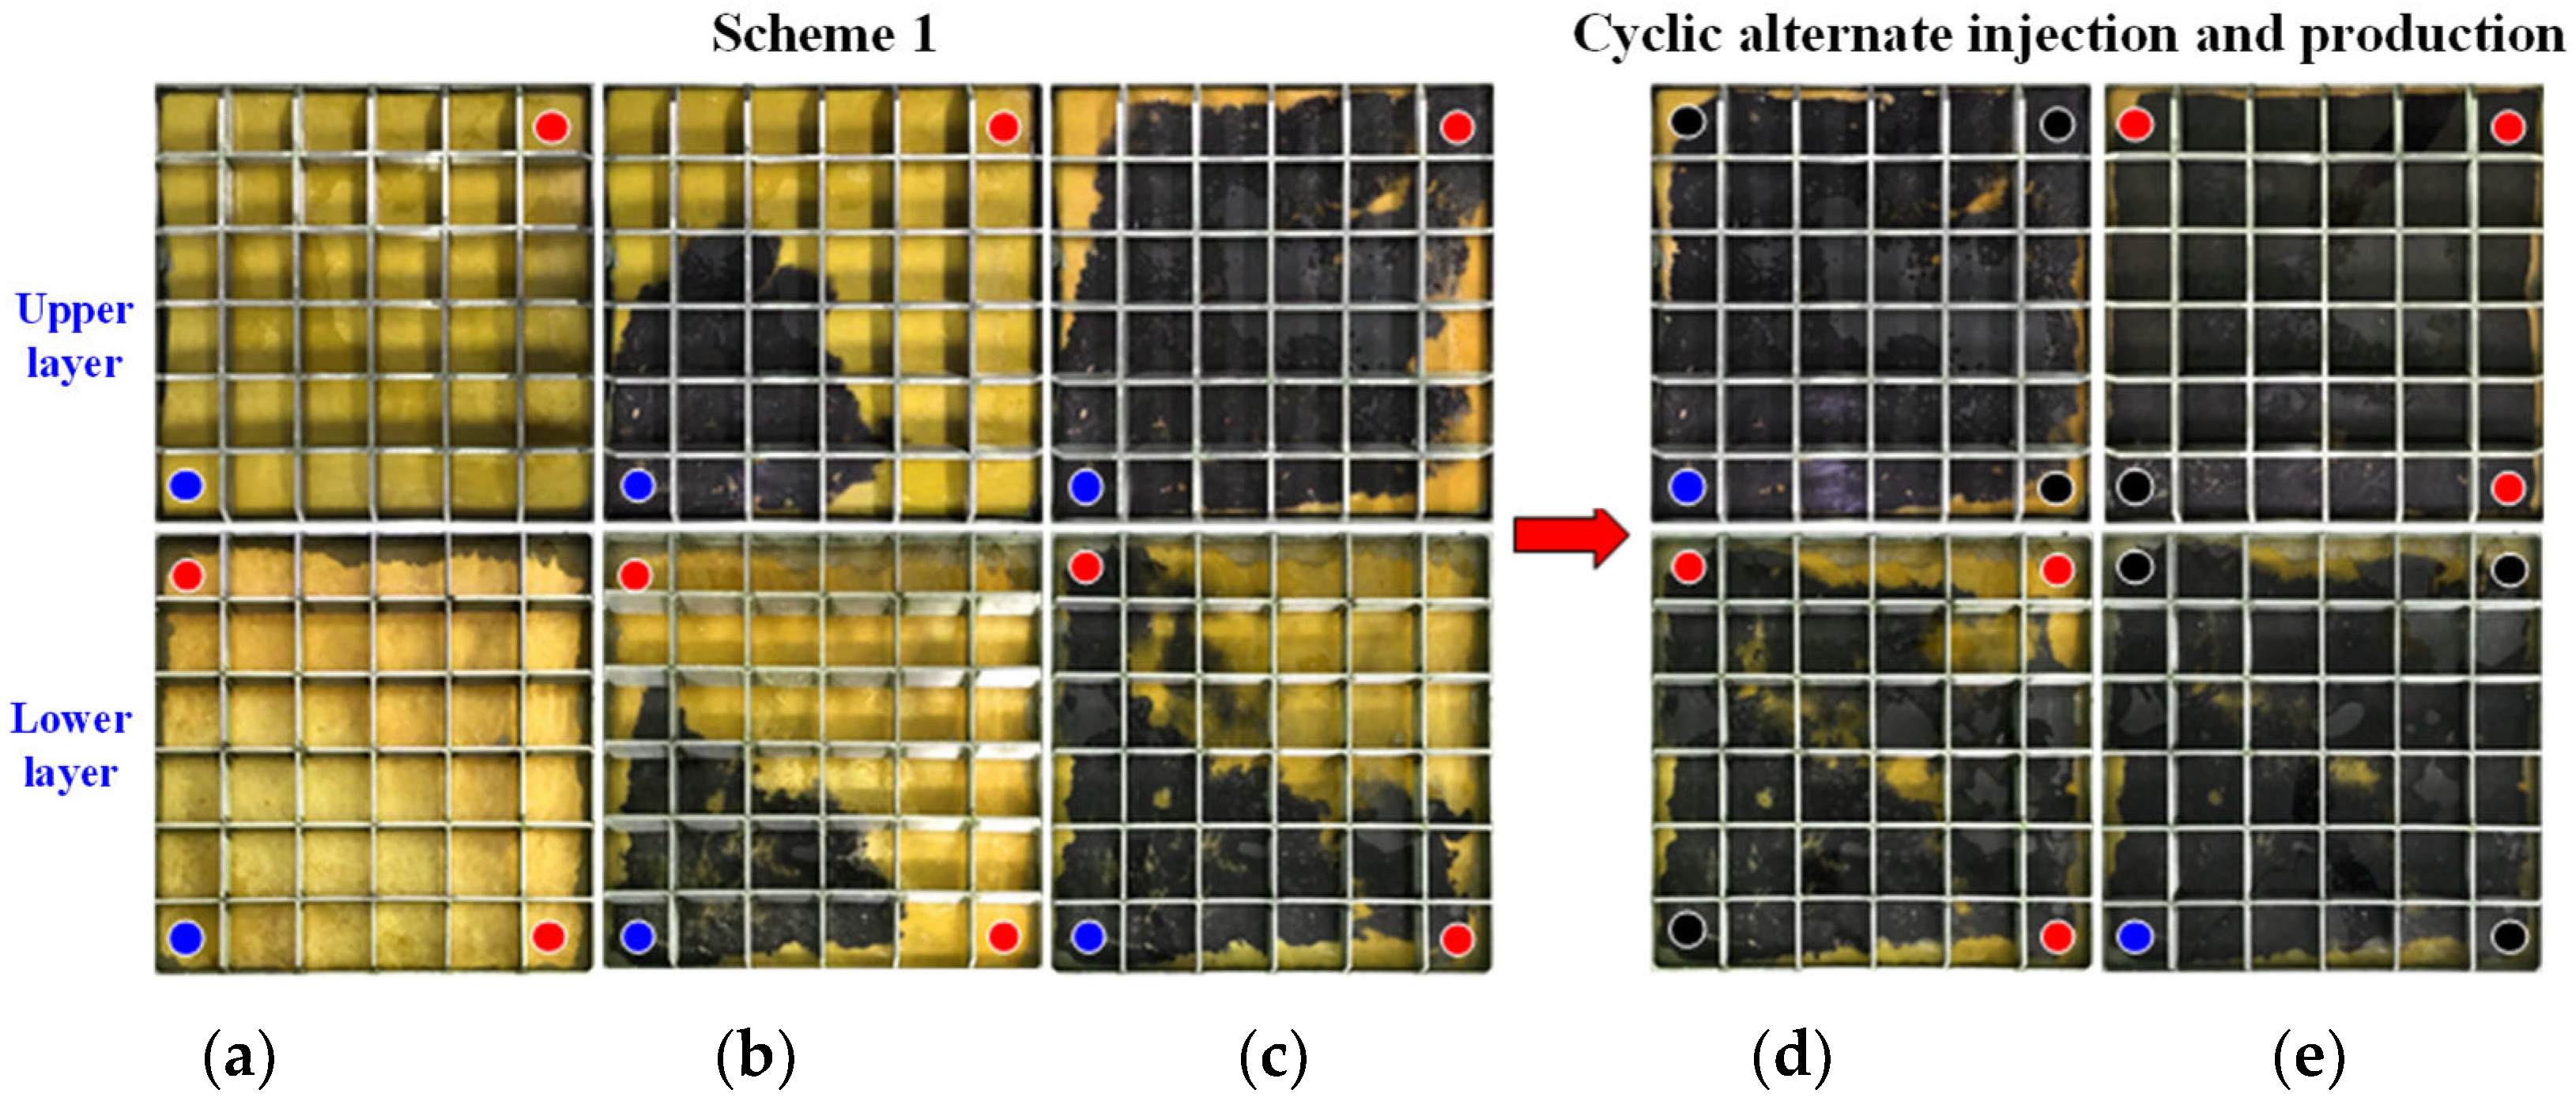
3.1. Sweep Characteristics

For Experimental Program 1 (1/4 upper and lower stratigraphic system staggered five-point well pattern combined injection-production) and Experimental Program 2 (1/4 nine-point well pattern combined injection-production), the water-flooding sweep field diagrams of the upper and lower stratigraphic system over time are shown in Figure 6 and Figure 7, respectively. The sweep characteristic of water flooding is largely consistent with the existing theory, according to the experimental findings. The field diagram’s properties allow us to separate the sweep characteristic of water flooding into two stages. The upper and lower layer system’s waterline gradually advances towards the production well in the early stages of production in the form of a quarter-arc with the water injection well at its center. This is known as the uniform advancement stage. The second stage is the mainstream line rush phase, wherein the upper and lower strata water lines, respectively, rush toward the well opening in the middle and late stages of production as water-flood front rushes down the injection–production mainstream line.
Figure 8 depicts the water-flooding sweep field diagram for Experimental Program 3 (Implementation of cyclic alternating injection and production at 90% water cut in Experimental Program 1) for the upper and lower layer systems with time. The sweep law of Experimental Program 1 was fully adopted at the start of the experiment, and its implementation manner was fully embraced as well. The cyclic alternating injection and production is started when the water cut approaches 90%. The sweep spreads to both sides of the major line and keeps growing. It is clear that the residual oil around the side well of the upper layer system and around the corner well of the lower layer system steadily declines.
Although the experimental visualization window allows for visual observation of the law of water flooding under various Experimental Programs, the plane sweep coefficients of the upper and lower flat plate models were separately calculated using the previously described digital image recognition method in order to quantitatively assess the impact of multi-layer unstable injection and production. The weighted average of the sweep coefficients using the stratigraphic coefficient was then used to determine the overall plane sweep coefficient. When comparing Figure 9 to Figure 10, it is clear that the three Experimental Programs’ limit sweep coefficients are in the following order: Experimental Program 3 > Experimental Program 2 > Experimental Program 1; this means that the sweep coefficient is largest following the implementation of the MCA-IP. When comparing Experimental Programs 2 and 1, the overall sweep is enhanced by roughly 19.52%, which is actually a result of the crossing well being represented. The overall sweep coefficient has increased by roughly 1.22% between Experimental Programs 3 and 2, which is actually due to the asynchronous injection-production. The overall sweep coefficient has increased by 20.74% when comparing Experimental Programs 3 and 1, which is due to the combined effects of reperforation and unstable injection–production.

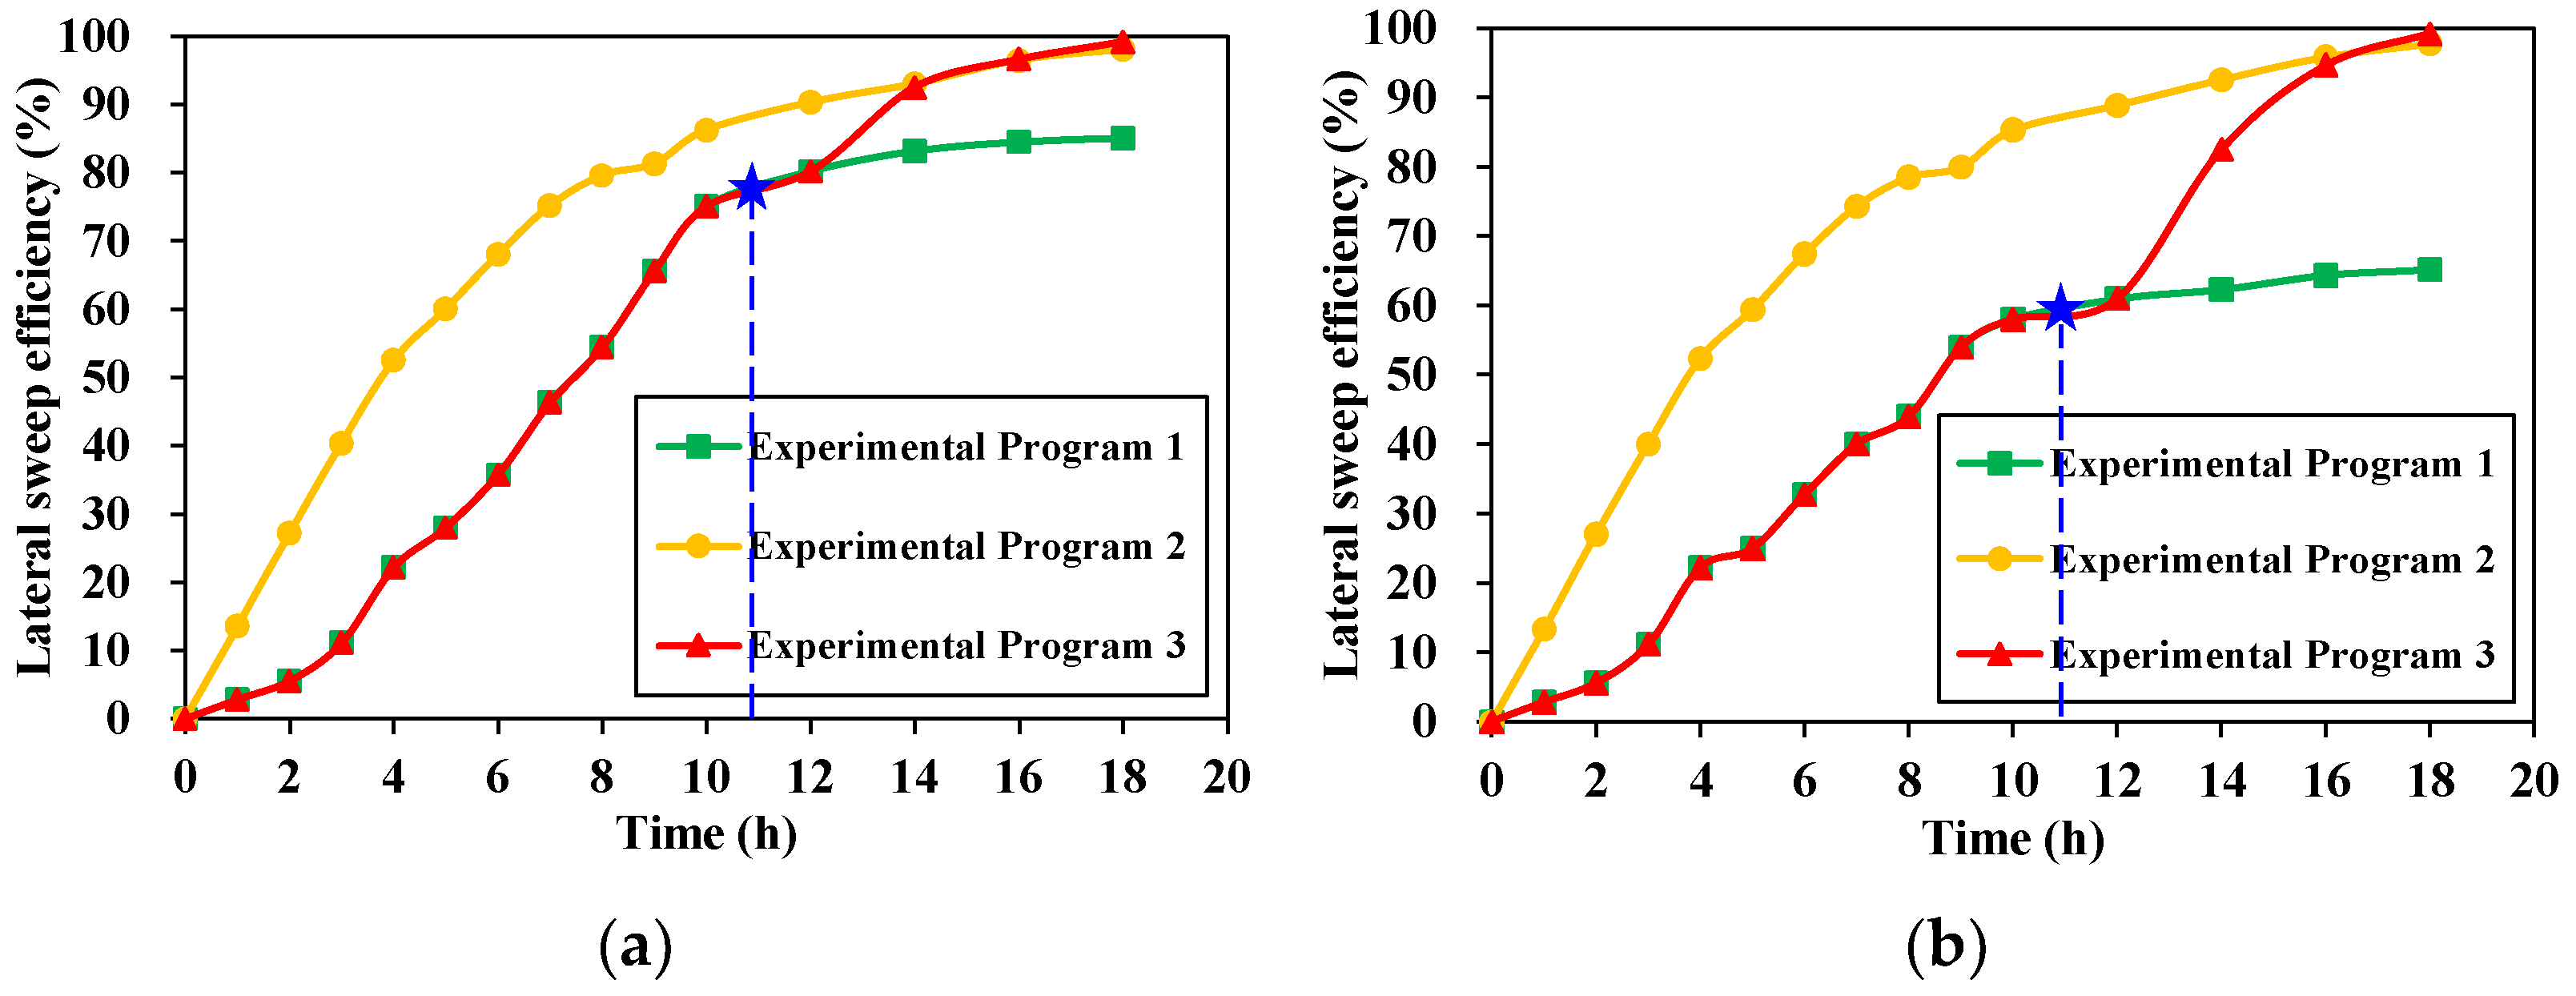
3.2. Production Performance Characteristic

The fluid production data were gathered and evaluated during the experiment in order to more accurately assess the effect of MCA-IP on sweep coefficient. Figure 10 illustrates the degree of recovery and water cut under various experimental situations. Due to the relatively low mobility, the displacement process resembles piston displacement and can be divided into two distinct production phases: the time during which waterless oil is recovered and the time during which the water cut rises rapidly. Comparing ng Figure 10a,c,e, it is clear that the rise in the degree of recovery following the adoption of the MCA-IP in Experimental Program 3 is mostly due to the contribution of the lower plate. The main cause is that the bottom plate corner well has a significant amount of residual oil, which increases the degree of recovery after reperforating. MCA-IP in Experimental Program 3 has the effect of greatly lowering the water cut, as can be observed by comparing Figure 10b,d,f.
In actuality, Experimental Program 1 is the present way of development for the South Kumkol reservoir, while Experimental Program 3 is intended to be implemented. This experiment accurately illustrates the law of expanding sweep and shows the viability of establishing MCA-IP to increase the sweep. Additionally, Experimental Program 2, which is used as a comparison, is clever in that it not only clarifies the contribution of MCA-IP under reperforating and unsteady injection–production to the sweep, but also reflects the law of sweeping under various well patterns. The experimental findings indicate that reperforating can raise the recovery level by about 10% after the adoption of a MCA-IP, whereas unstable injection–production can only do so by about 1%.

4. Conclusions

In this paper, the double-plate visual physical experiment has been performed to research the IOR mechanism of multi-layer cyclic alternate injection and production (MCA-IP); the conclusions are as follows:
(1)
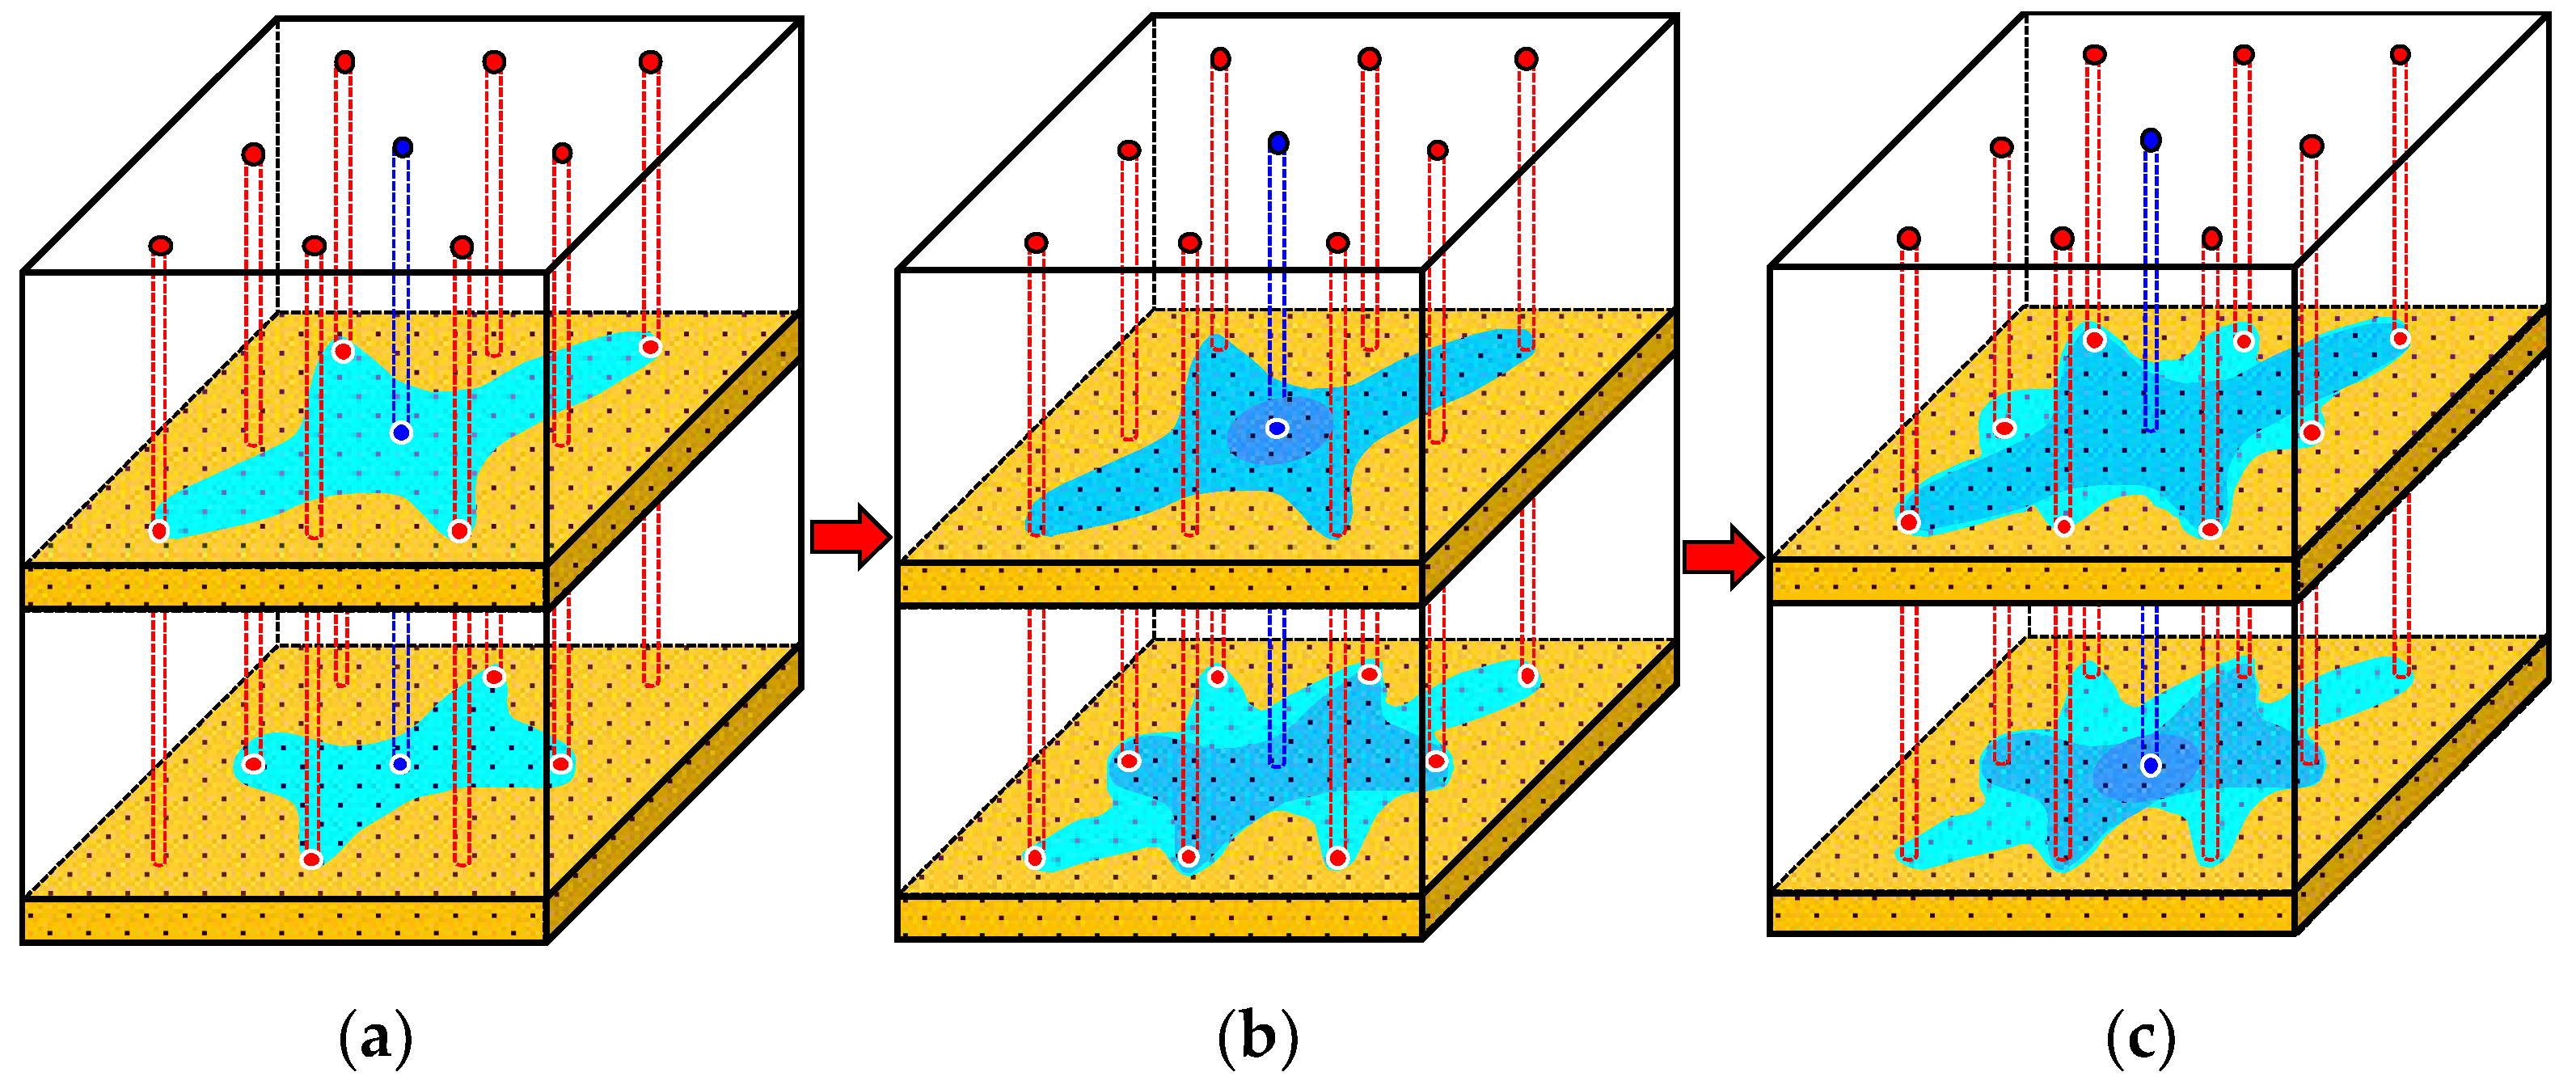
The water-flood front is rather uniform in the early stage of production, but it rushed along the mainstream line in the mid-stage. After the completion of MCA-IP, the sweep area steadily grows and extends to both sides of the main streamline.
(2)
The IOR mechanism of MCA-IP mainly includes reperforation, well-pattern encryption, and asynchronous injection–production. Based on image recognition to quantitatively describe the sweep coefficient, reperforating and encrypting enhance the sweep by about 19.52%, asynchronous injection–production increases the sweep coefficient by about 1.2%, and overall sweep increases by about 20.7%.
(3)
Oil production and water consumption are both increased and decreased by MCA-IP. According to the experimental data statistics, the MCA-IP method can increase the oil recovery by about 11% and reduce the water cut by about 6%.

Author Contributions

Conceptualization, L.Z. and L.F.; methodology, J.W.; software, L.F.; validation, L.C.; formal analysis, Z.J.; investigation, L.F.; resources, L.C.; data curation, Z.J.; writing—original draft preparation, Z.J.; writing—review and editing, Z.J.; visualization, L.F.; supervision, L.Z.; project administration, L.Z.; funding acquisition, L.Z. All authors have read and agreed to the published version of the manuscript.

Funding

This research was funded by CNPC Major Technology Project, grant number 2021D-3201.

Institutional Review Board Statement

Not applicable.

Informed Consent Statement

Not applicable.

Data Availability Statement

Not applicable.

Conflicts of Interest

The authors declare no conflict of interest.

References

  1. Gao, J.N. Evaluation Method for Water Flooding Development Effect in Extra High Water Cut Period; China University of Petroleum: Beijing, China, 2019. [Google Scholar]
  2. Han, D.K. Precisely predicting abundant remaining oil and improving the secondary recovery of mature oilfields. Acta Pet. Sin. 2007, 2, 73–78. [Google Scholar] [CrossRef]
  3. Jackson, M.D.; Vinogradov, J.; Hamon, G.; Chamerois, M. Evidence, mechanisms and improved understanding of controlled salinity waterflooding part 1: Sandstones. Fuel 2016, 185, 772–793. [Google Scholar] [CrossRef]
  4. Khurshid, I.; Al-Attar, H.; Alraeesi, A. Modeling cementation in porous media during waterflooding: Asphaltene deposition, formation dissolution and their cementation. J. Pet. Sci. Eng. 2018, 161, 359–367. [Google Scholar] [CrossRef]
  5. Liu, H.H. Study on Remaining Oil Droplet Dynamic Conditions and Water Flood Efficiency Changing Mechanisms in the Ultra-High Water Cut Period; Southwest Petroleum University: Chengdu, China, 2013. [Google Scholar]
  6. Makhotin, I.; Orlov, D.; Koroteev, D. Machine Learning to Rate and Predict the Efficiency of Waterflooding for Oil Production. Energies 2022, 15, 1199. [Google Scholar] [CrossRef]
  7. Waburoko, J.; Xie, C.; Ling, K. Effect of Well Orientation on Oil Recovery from Waterflooding in Shallow Green Reservoirs: A Case Study from Central Africa. Energies 2021, 14, 1223. [Google Scholar] [CrossRef]
  8. Chaabi, O.; Kobaisi, M.A.; Haroun, M. Quantifying the Low Salinity Waterflooding Effect. Energies 2021, 14, 1979. [Google Scholar] [CrossRef]
  9. Almarri, M. Efficient History Matching of Thermally Induced Fractures Using Coupled Geomechanics and Reservoir Simulation. Energies 2020, 13, 3001. [Google Scholar] [CrossRef]
  10. Wang, J.; Liu, H.; Zhang, J. Lost Gas Mechanism and Quantitative Characterization during Injection and Production of Water-Flooded Sandstone Underground Gas Storage. Energies 2018, 11, 272. [Google Scholar] [CrossRef]
  11. Cui, C.; Li, S.; Yang, Y.; Wang, B.; Wu, Z. Planar zoning regulation and control method of reservoir at ultra-high water cut stage. Acta Pet. Sin. 2018, 39, 1155–1161. [Google Scholar] [CrossRef]
  12. Cuo, G.; Wenrui, H.; Yiqiang, L.; Ruicheng, M.; Zilin, M. Prediction of oil-water relative permeability with a fractal method in ultra-high water cut stage. Int. J. Heat Mass Transf. 2019, 130, 1045–1052. [Google Scholar] [CrossRef]
  13. Lee, B.H.; Lee, S.K. Probing the water distribution in porous model sands with two immiscible fluids: A nuclear magnetic resonance micro-imaging study. J. Hydrol. 2017, 553, 637–650. [Google Scholar] [CrossRef]
  14. Olayiwola, S.O.; Dejam, M. Effect of Silica Nanoparticles on the Oil Recovery During Alternating Injection with Low Salinity Water and Surfactant into Carbonate Reservoirs. In Proceedings of the SPE Annual Technical Conference and Exhibition, Virtual, 26–29 October 2020. [Google Scholar]
  15. Olayiwola, S.O.; Dejam, M. Comprehensive experimental study on the effect of silica nanoparticles on the oil recovery during alternating injection with low salinity water and surfactant into carbonate reservoirs. J. Mol. Liq. 2021, 325, 115178. [Google Scholar] [CrossRef]
  16. Olayiwola, S.O.; Dejam, M. A comprehensive review on interaction of nanoparticles with low salinity water and surfactant for enhanced oil recovery in sandstone and carbonate reservoirs. Fuel 2019, 241, 1045–1057. [Google Scholar] [CrossRef]
  17. Martin, F.D.; Colpitts, R.M. Standard Handbook of Petroleum and Natural Gas Engineering; Gulf Professional Publishing: Houston, TX, USA, 1996; pp. 1–362. [Google Scholar] [CrossRef]
  18. Li, Z.; Shao, X.; Qiu, Y. Methods and effects of cyclic waterflooding in the southern oilfields of daqing placanticline. SPE Adv. Technol. Ser. 1997, 5, 20–23. [Google Scholar] [CrossRef]
  19. Yang, Y. Study on the Development and Adjustment of Hydrodynamics in the High Water Cut Stage of XianHe Fault Block Reservoir. Master’s Thesis, China University of Petroleum (East China), Qingdao, China, 2019. [Google Scholar]
  20. Zhao, X.; Liu, X.; Yang, Z.; Wang, F.; Zhang, Y.; Liu, G. Experimental study on physical modeling of flow mechanism in volumetric fracturing of tight oil reservoir. Phys. Fluids 2021, 33, 107–118. [Google Scholar] [CrossRef]
  21. Zhang, Y.; Liu, X.; Li, D.; Chang, L.; Liu, G. Physical simulation experiment method of water breakthrough mechanism and plugging effect of horizontal well in tight reservoir. Energy Rep. 2022, 8, 9610–9617. [Google Scholar] [CrossRef]
  22. Niu, Z.; Yang, Z.; Chang, Y.; Zhang, Y.; Luo, Y. Numerical studies on displacement-imbibition process of pore-network extracted from the microfluidic chip. J. Pet. Sci. Eng. 2022, 225, 110686. [Google Scholar] [CrossRef]
  23. Li, H.; Wang, K.; Han, X.; Zheng, J. Research on heterogeneous compound flooding system based on dispersed particle gel. Adv. Geo-Energy Res. 2019, 3, 156–164. [Google Scholar] [CrossRef]
  24. Safonov, E.N.; Lozin, E.V. Enhanced oil recovery methods: Reality, perspectives, scientific problems. Neft. Khozyaistvo Oil Ind. 2003, 4, 46–48. [Google Scholar]
  25. Chang, H.; Liu, Y.; Lei, Y. A comprehensive workow for real time injection-production optimization based on equilibrium displacement. Adv. Geo Energy Res. 2020, 4, 260–270. [Google Scholar] [CrossRef]
  26. Li, S.; Hou, S. A brief review of the correlation between electrical properties and wetting behaviour in porous media. Capillarity 2019, 2, 53–56. [Google Scholar] [CrossRef]
  27. Mahmud, W.M. Impact of salinity and temperature variations on relative permeability and residual oil saturation in neutral-wet sandstone. Capillarity 2022, 5, 23–31. [Google Scholar] [CrossRef]
  28. Lv, J.R. Hydrodynamic Regulation Approach Mechanism and Application to Pu Taohua Oil Field. Master’s Thesis, Daqing Petroleum Institute, Daqing, China, 2008. [Google Scholar]
  29. Zhao, C.S.; Lv, J.R.; Yang, D.G. Research on the application of cyclic water flood techniques in Pubei2 block reservoir of Daqing Oil field. Pet. Geol. Recovery Effic. 2008, 6, 76–79. [Google Scholar]
  30. Hou, R.; Han, T.Z. Experimental Research on Periodic Water Injection for Enhanced Oil Recovery in Cha 12–16 Well Area of Chaheji Oilfield. Pet. Geol. Recovery Effic. 1997, 4, 29. [Google Scholar]
  31. Li, D.X.; Pu, Y.G.; Xu, X.L. Unstable Waterflooding Fashion in latter Development Period of Liangjialou Oilfield. Pet. Geol. Oilfield Dev. Daqing 2002, 5, 23–26. [Google Scholar]
  32. Cao, G. To improve development result of low permeability reservoir by cyclic waterflooding. Spec. Oil Gas Reserv. 1996, 3, 24–27. [Google Scholar]
  33. Dong, W.L.; Li, C. Shuanghe Oilfield Periodic Water Injection Mineral Test. Pet. Geol. Eng. 2001, 15, 29–31. [Google Scholar]
  34. Wang, Z.X.; Zeng, L.F.; Gu, J.W. Unstable water injection mechanism and its field application in loose sandstone reservoir. Pet. Geol. Oilfield Dev. Daqing 2008, 27, 59–63. [Google Scholar]
  35. Wang, X.L.; Wang, J.L.; Wang, D.L. Study on cyclic water injection test in Gasikule Oifield. Spec. Oil Gas Reserv. 2005, 12, 50–52. [Google Scholar]
  36. Weng, G.F.; Deng, Z.X.; Zhang, Z.S. Experimental study on periodic water injection of Lun 16 block in Ziyin Oilfield. Pet. Geol. Eng. 2007, 21, 48–51. [Google Scholar]
  37. Zhang, B.; Jin, S.C.; Xu, Y.L. Pilot test of unstable water injection in Luo 4 well block of Jiyuan Oilfield. Petrochem. Ind. Appl. 2010, 29, 54–56. [Google Scholar]
Figure 1. Schematic diagram of multi-layer cyclic alternate injection and production. (a) There are currently two development layers; (b) first half period of cyclic alternate injection and production; (c) second half period of cyclic alternate injection and production.
Energies 16 01546 g001
Figure 2. Schematic diagram of plate visual physical device; (a) physical diagram of the two-dimensional flat model; (b) theoretical diagram of the two-dimensional flat model.
Energies 16 01546 g002
Figure 3. Schematic diagram of the connection of each device of the two-dimensional visualization experiment of dual-plate water drive. This device includes three systems: the data collection system, the displacement system, and the reservoir simulation system.
Energies 16 01546 g003
Figure 4. Schematic diagram of the experimental program. (a) Experimental Program 1: one production well and one injection well in the upper layer, two production wells and one injection well in the lower layer; (b) Experimental Program 2: three production wells and one injection well in the upper layer, three production wells and one injection well in the lower layer; (c) Experimental Program 3: Experimental Program 1: one production well and one injection well in the upper layer, two production wells and one injection well in the lower layer; first half period of cyclic alternate injection and production: three production wells and one shut-in well in the upper layer, three shut-in wells and one injection well in the lower layer; second half period of cyclic alternate injection and production: three shut-in wells and one injection well in the upper layer, one shut-in well and three production wells in the lower layer.
Energies 16 01546 g004
Figure 5. Schematic diagram of image recognition and processing. (a) Experimental original image; (b) image grayscale recognition; (c) image grayscale distribution histogram; (d) binary image after threshold segmentation; (e) morphologically processed images; (f) total area of the excluded grid.
Energies 16 01546 g005
Figure 6. Sweeping field map of Experimental Program 1; (a) Images of the upper and lower layers at hour 0; (b) images of the upper and lower layers at hour 3; (c) images of the upper and lower layers at hour 6; (d) images of the upper and lower layers at hour 12; (e) images of the upper and lower layers at hour 18.
Energies 16 01546 g006
Figure 7. Sweeping field diagram of Experimental Program 2; (a) images of the upper and lower layers at hour 0; (b) images of the upper and lower layers at hour 3; (c) images of the upper and lower layers at hour 6; (d) images of the upper and lower layers at hour 12; (e) images of the upper and lower layers at hour 18.
Energies 16 01546 g007
Figure 8. Sweeping field diagram of Experimental Program 3; (a) images of the upper and lower layers at hour 0; (b) images of the upper and lower layers at hour 6; (c) images of the upper and lower layers at hour 12; (d) images of the upper and lower layers at hour 15; (e) images of the upper and lower layers at hour 18.
Energies 16 01546 g008
Figure 9. Quantitative evaluation of the spread coefficient of different experimental conditions; (a) plane sweep coefficient-time curve of upper plate; (b) plane sweep coefficient-time curve of lower plate; (c) overall plane sweep coefficient-time curve; (d) comparison histogram of limit spread of each Experimental Program. The blue dotted lines represent the cyclic alternating injection and production timing in Experimental Program 3.
Energies 16 01546 g009aEnergies 16 01546 g009b
Figure 10. Schematic diagram of image recognition and processing; (a) upper plate recovery degree-time curve; (b) upper plate water cut-time curve; (c) lower plate recovery degree-time curve; (d) lower plate water cut-time curve (e) overall recovery degree-time curve (f) overall water cut-time curve. The blue dotted lines represent the cyclic alternating injection and production timing in Experimental Program 3.
Energies 16 01546 g010
Table 1. Formation water ions.
Ion TypeIon Content
/mg·L−1
Ion TypeIon Content
/mg·L−1
Total Salinity
/mg·L−1
K+ + Na+22,989Cl-450,202527,846
Ca2+44,544NH4+1188
Mg2+7357Br-1566
Table 2. Oil reservoir and laboratory experiment parameter table.
Similarity CriterionFormula ExpressionOil Reservoir ParametersPhysical Model Parameters
geometric similaritySimilar length–width ratio: L1/L2
Similar length–height ratio: L1/H
Similar porosity: ϕ
O1 porosity: 24.7%
O3 porosity: 22.5%
O1 permeability: 500 mD
O3 permeability: 200 mD
Flat1 porosity: 25%
Flat2 porosity: 22%
Flat1 permeability: 3000 mD
Flat2 permeability: 1200 mD
physical properties similaritySimilar oil–water density ratio: ρo/ρw
Similar oil–water mobility ratio: kowcμw/kworμo
Crude oil viscosity: 1.07–3.24 mPa·s
Formation water viscosity: 0.48–0.8 mPa·s
Crude oil viscosity: 2.5 mPa·s
Formation water viscosity: 1 mPa·s
production dynamics similaritySimilar production pressure difference: Δp
Similar injection–production ratio: I/Q
Injection-production ratio: 1
Water injection speed: 1000–1050 m3/d
Injection-production ratio: 1
Water injection speed: 3 mL/min
Table 3. Oil reservoir and laboratory experiment parameter table.
Experimental ProgramReservoir MaterialSpecific Implementation Plan
1Upper layer: 80 mesh quartz sand
Lower layer: 120 mesh quartz sand
1/4 upper and lower stratigraphic system staggered five-point well pattern combined injection-production to 98% water cut
2Upper layer: 80 mesh quartz sand
Lower layer: 120 mesh quartz sand
1/4 nine-point well pattern combined injection-production to 98% water cut
3Upper layer: 80 mesh quartz sand
Lower layer: 120 mesh quartz sand
Implementation of MCA-IP to 98% water cut at 90% water cut for Experimental Program 1. The injection-production cycle is 30min, and the injection-production ratio remains 1:1
Disclaimer/Publisher’s Note: The statements, opinions and data contained in all publications are solely those of the individual author(s) and contributor(s) and not of MDPI and/or the editor(s). MDPI and/or the editor(s) disclaim responsibility for any injury to people or property resulting from any ideas, methods, instructions or products referred to in the content.

