

Review on Greenhouse Gases Emission in the Association of Southeast Asian Nations (ASEAN) Countries


1
PT. PLN (Persero) Puslitbang Ketenagalistrikan (Research Institute), Jakarta 12760, Indonesia
2
Study Program of Environmental Engineering, Faculty of Civil and Environmental Engineering, Institut Teknologi Bandung, Bandung 40134, Indonesia
*
Author to whom correspondence should be addressed.
Energies 2023, 16(9), 3920; https://doi.org/10.3390/en16093920
Submission received: 14 February 2023
/
Revised: 30 April 2023
/
Accepted: 1 May 2023
/
Published: 6 May 2023
(This article belongs to the Special Issue Energy and Environmental Sustainability 2023)
Abstract
:The Association of the Southeast Asian Nations (ASEAN) region is a critical contributor to global development from an environmental perspective. This study has reviewed carbon emissions from energy generation, influence factors from the population, economic growth and renewable energy, emission and energy intensity projection, spatial distribution characteristics, and decarbonization strategy. This work utilizes a comparison methodology between ASEAN countries in the emission intensity and energy intensity in the future projection of electricity conditions in 2030 or 2040, as well as opportunities for reducing greenhouse gas (GHG) emissions as determined by the national policies of each government. The results show that Indonesia, Vietnam, Thailand, and Malaysia produce 79.7% of the electricity in the ASEAN region. As a developing country, Indonesia has the largest population and gross domestic product (GDP) but has the highest predicted emission intensity, of 0.97 CO2e/MWh, in 2030. Vietnam is predicted to have an emission intensity of about 3.56t-CO2e/cap and 0.747t-CO2e/GDP in 2030. Vietnam is expected to increase in energy intensity to 1241 MWh/GDP, while Brunei Darussalam has a high energy intensity of 11.35 MWh/cap. However, the capacity of solar power plants (more than 11 GW) and wind-power plants (2384 MW) have generally increased in ASEAN from 2015 to 2019, indicating the positive development of renewable energy source (RES) use. The national policies strongly influence the estimated GHG emission in ASEAN by aggressively replacing fossil fuels with RESs. Support, via government policies, can reduce the cost of electricity generation from RESs is needed to increase and enhance the installment of clean power generation systems. In future work, the research needs to consider the intermittent characteristics of variable RES in power system operation.
1. Introduction
The Association of the Southeast Asian Nations (ASEAN) region is an essential contributor to global development from economic and environmental points of view. In terms of greenhouse gas (GHGs) emissions, the power sector offers significant opportunities to achieve emission reductions by leveraging technology and national policies [1,2]. The ASEAN member states (AMS) have made various efforts to be able to meet the emission reduction targets that have been previously set [3]. According to the Paris agreement, policies regarding carbon emission mitigation in AMS are inseparable from the understanding in the ASEAN plan of action for energy cooperation (APAEC) and nationally determined contributions (NDC).
The cooperation of AMS in the power sector for energy security, connectivity, and integration in the ASEAN region is stated in APAEC. Strategies and action plans that are closely related to electricity development are clean coal technology (CCT) and renewable energy sources (RES) [4,5,6]. The use of RES has significantly reduced CO2 emissions [7,8,9].
Additionally, there are other strategies and action plans, such as building the ASEAN power grid (APG) and the trans-ASEAN gas pipeline (TAGP) [10,11]. The development of APG and TAGP would allow for the optimization of regional energy resources and the assurance of sustainable energy development through reducing GHGs [6].
The NDC document in the Paris agreement contains a country’s climate commitments and actions communicated to the world through the United Nations framework convention on climate change (UNFCCC). In 2015, 196 countries, including the AMS, agreed to the Paris agreement to jointly hold the global temperature rise below 2 degrees Celsius and keep it closer to 1.5 degrees Celsius. Moreover, it increases the ability to adapt to the impacts of climate change and increases climate resilience and low-emission development while maintaining food production. AMS also agreed to align funding flows with low-emissions and climate-resilient development paths.
In addition to the policies of each AMS and NDC, population, gross domestic product (GDP), and electricity production based on energy sources also influence GHGs. Population number and population growth determine electricity demand and production. Population data can also be used to analyze energy intensity (GWh/cap) or GHG emission intensity (t-CO2e/cap). These values may describe the adequacy of the energy supply, the need for energy efficiency, and the individual’s contribution to GHG emissions. GDP is also a critical indicator to determine a country’s economic conditions and GHG emissions for a certain period [12,13]. GDP is the added value of all business units or the total value of goods and services produced by all economic units in a particular country. Energy intensity (GWh/GDP) and emission intensity (t-CO2e/GDP) can also describe the financial condition of the energy supply and the behavior of energy use in AMS.
Many previous studies have focused on GHG emissions from the electricity sector for different countries to quantify total CO2 emissions, emission intensity values, and GHGs drivers, and only some of them focus on the ASEAN region. Some studies have investigated the relationship between electricity consumption, economic growth, and carbon emission for Nigeria between 1970 and 2008 [14], for Iran between 1971 and 2011 [15], and for seven selected Asia-Pacific and North American countries between 1990 and 2030 [16]. Saidi and Hammami have identified the amount of carbon emissions for three regional panels, including Europe and North Asia, Latin America and Caribbean and Sub-Saharan, North Africa and the Middle Eastern [17]. Other studies have analyzed the impact of renewable energy sources (RESs) on emission intensity in Turkey [18], Greece [19], and China [20]. Therefore, emission intensity, energy intensity, and RE contribution projections are explicitly conducted for the ASEAN region based on each AMS electricity development plan scenario in this study. Various factors’ influence must be considered to identify future opportunities for GHG emission reductions. Regarding the causal relationship between economic growth, energy consumption, and CO2 emissions, the literature studies indicate that empirical studies’ results vary considerably. The nature and direction of causality may differ from country to country [21].
2. Methods
General information on AMS, such as economic level (in the form of GDP), electrification rate (proportion of the population with access to electricity energy sources), energy consumption, and composition of energy sources (between fossil fuels and RES) are needed to identify the electricity conditions in the ASEAN region. More detailed information is also required related to coal-fired power plants (CFPPs) in AMS in the form of projected generating capacity (MW), operating hours of the plant (OH), boiler technology used, amount of fossil fuel consumption (t/year), characteristics of the fuel used, as well as national policies of emission reduction targets. Baseline data from various sources can be used to calculate CO2e emissions from power generation activities in AMS. Two primary data sources that are often used in various studies for the ASEAN region are the ASEAN center of energy (ACE) [22] and the International Energy Agency (IEA) [23].
Each AMS sets a specific target for reducing GHG, stated in the national electricity development plan, following the agreement pledged by NDC and APAEC. Scenarios are developed considering the availability of energy resources within the country, economic condition, and development of RES, as follows in Table 1.
Most of the power plants in the ASEAN region are CFPPs. Therefore, the CO2e emissions calculation from CFPPS requires information regarding the type of boiler (subcritical, supercritical, ultra-supercritical, fluidized bed technology) and year of operation. Each AMS’s total power generation capacity can be analyzed using the following equation [22].
where:
- PCFPP,AMS = total installed power generation capacity in AMS.
- PSubC,i = i-th subcritical.
- PSC,i = i-th supercritical.
- PUSC,i = i-th ultra-supercritical.
- PFB,i = i-th fluidized bed.
- t = year of operation.
The principle of CO2 emissions calculation is performed by applying an emission factor based on power plant operating time [34], as shown in Equation (2) or fuel consumption [35] in Equation (3).
where:
- EGm,y = the total electricity production by power plant m in year y (MWh).
- EFm,y = CO2 emission factor by power plant m in year y (t-CO2/MWh).
- m = power plant operating in year y.
- y = year of operation.
- EmissionsGHG,fuel = GHG emissions from a particular type of fuel (t-GHGs/year).
- Fuel Consumptionfuel = the amount of fuel used (TJ/year), in this case, the amount of fuel equivalent to the electricity production.
- EFGHG,fuel = default emission factor of a GHG based on a specific fuel type (t-GHGs/TJ).
The projection of CO2e emissions was performed using three alternative calculations, which depend on the available data from the national electricity development plan at each AMS. The first approach used population data, GDP, and annual electricity production per energy source (coal, oil, and gas). The calculation of CO2 emissions from CFPPs was carried out by applying emission factors from ACE based on coal quality and the type of boiler technology. Meanwhile, the measure of CO2 emissions from oil and gas power plants utilized emission factors from the intergovernmental panel on climate change (IPCC) [35]. To obtain CO2e emissions from oil and gas power plants, calculated CH4 and N2O emissions were multiplied by global warming potential (GWP) from the IPCC fifth assessment report (AR5). After obtaining the total contribution of CO2e emissions from each energy mix, the emission intensities (t-CO2e/GWh, t-CO2e/cap, and t-CO2e/GDP) and energy intensity (MWh/cap and MWh/GDP) were generated.
The second approach applied population data, GDP, total electricity production every year, and the percentage of the energy mix in the baseline year and end of the projection year. Since the energy mix along the projection range was unknown, a constant increase in the energy mixes every year was estimated using Equation (4).
where:
- EMpy = percentage of energy mix at the end of projection year (%).
- EMby = percentage of energy mix in baseline year (%).
After obtaining a constant energy mix in the projection range, the annual electricity production every year per energy source (GWh) was determined by using Equation (5) as:
where:
- EGfuel,y = the total electricity production per energy source in year y (GWh).
- EG = the total annual electricity production (GWh).
- EM = percentage of energy mix (%).
Calculating CO2e emissions, emission intensity, and energy intensity is performed similarly to the first approach using Equation (2).
The third approach used population data, GDP, electrification rate, electricity production in the baseline year, the energy mix in the baseline, and the end of the projection year. Because the electricity production in the projection year is unknown, the electricity production per capita (GWh/cap) derived from baseline data (Equation (6)) is generated and utilized in calculating the total electricity production year.
where:
- EGcap = electricity production per capita (GWh/capita).
- EGby = the total electricity production in the baseline year (GWh).
- Pby = the population number in the baseline year (capita).
The annual electricity production within the projection range is estimated based on the electricity production per capita, the number of populations in the projected year, and each country’s electrification rate (%) using Equation (7). The CO2e emissions and energy intensity were calculated similarly to the first and second approaches.
where:
- EG = the total annual electricity production (GWh).
- EGcap = electricity production per capita (GWh/capita).
- P = the population number (capita).
- ER = electrification ratio (%).
3. Results and Discussion
3.1. Baseline Data of Carbon Emissions
Based on IEA baseline data [36], the electricity sector in AMS is heterogeneous, with significant variations between countries in terms of electricity production per capita and the intensity of carbon dioxide emissions from electricity production. Figure 1 shows four countries, i.e., Indonesia, Vietnam, Thailand, and Malaysia, which produce 79.7% of the electricity in the ASEAN region (2019). AMS uses fossil fuels (gas, oil, and coal) and other energy sources, such as biofuel, waste, hydro, geothermal, solar, and wind. Fossil fuels are the primary energy source in almost all AMS, except in Laos, where hydropower becomes the primary energy source.
Electricity production in Indonesia and Philippines emits the highest carbon emission, although they have the lowest electricity production per capita compared to other AMS, as indicated in Figure 2.
Indonesia and the Philippines utilize coal as the primary energy source, the main source of CO2e emission. Based on [36], the world’s electricity production in 2019 was 23.835 billion MWh with a population of 7.673 billion [37]; therefore, the global average of electricity production in the world was about 3.11 MWh/cap.
3.2. Influencing Factors of Carbon Emissions Level
The determinants of carbon emissions include population, economic growth (GDP), and the share of renewable energy.
3.2.1. Population and Economic Growth
Population and GDP growth play a critical role in increasing carbon emissions by impacting demand for higher electricity consumption [38]. Indonesia is a developing country in the ASEAN with the largest population and total area. As a member of the G20, Indonesia’s GDP is the largest in the region. The country’s burgeoning population is the largest in the AMS and the fourth largest globally. The information related to carbon emission targets in the AMS are shown in Table 2.
3.2.2. Renewable Energy Contribution
Based on baseline data in 2019, the AMS are significantly reliant on fossil fuels for power generation [36]. Brunei Darussalam and Singapore rely almost entirely on natural gas. More than 60% of electricity generation in Thailand, Vietnam, Malaysia, Philippines, and Indonesia are dependent on a coal and natural gas energy mix.
With a significant margin, hydropower is the ASEAN region’s largest non-fossil fuel contributor to electricity production (Figure 3). Hydropower is the primary energy source in Laos, Cambodia, and Myanmar. Cambodia, Indonesia, Laos, Malaysia, and the Philippines have plans to expand large-scale hydropower in the coming decades, especially for micro-hydro plants. However, constructing hydropower plants has significant environmental and social impacts, especially when built on a large scale. The effects on regional food security and the environmental impacts on biodiversity and natural flows of water and sediment are well documented in the Mekong region [41]. Rising costs of hydropower plant construction and an increasing understanding of how drought and climate change affect hydropower productivity could hinder plans to expand large-scale hydropower.
The trend in renewable electricity production by source (non-combustible) in AMS over the 1990–2020 period is shown in Figure 4.
The capacity of solar power plants (Figure 5) and wind-power plants (Figure 6) have generally increased in AMS, indicating positive RES use development. Based on Figure 5 and Figure 6, within four years (2015 to 2019), Photovoltaic (PV) mini-grid capacity increased almost six times (from under 2 GW to more than 11 GW). The majority of increased RES use has occurred in Vietnam and Thailand, although other countries also have a sharp increase in RES utilization through the implementation of PV mini-grid capacity. Vietnam’s success in developing solar and wind power is supported by the government’s strong commitment to renewable energy development, carbon pricing policies, and reduced fossil fuel subsidies [42]. In 2019, solar power plants accounted for 10% of installed RES capacity in Vietnam and nearly 6% in Thailand. The use of wind-power plants has grown at a slower rate, with capacity tripling from 800 MW in 2015 to 2384 MW in 2019.
Policymakers in many ASEAN countries face the challenge of simultaneously expanding power generation to meet growing demand, improve electricity access and grid reliability, and implement RES technologies. Based on the ASEAN RE target of 23% by 2025 [11], AMS is slowly transitioning towards modern renewable technologies. The widespread perception that RES is expensive and technically complicated has slowed the transition to using clean energy. However, these perceptions oppose the declining trend of RES installment prices. The rapid deployment of PV mini-grid in Vietnam and geothermal power development in the Philippines provide essential lessons for enhancing the RES transition elsewhere in the ASEAN region.
3.3. Projection of Carbon Emissions
The projected level of carbon emissions in the AMS is shown Figure 7. In contrast to other nations, Indonesia and Vietnam had greater increases in carbon emissions between 2020 and 2030.
Carbon emissions are divided into emission intensity and energy intensity categories.
3.3.1. Emission Intensity Projection
The results of emission intensity projections for various AMS scenarios are presented by identifying the influence of electricity production (Figure 8), demographic development (Figure 9), and economic condition (Figure 10). The projected emission intensities in t-CO2e/MWh of each AMS from 2020 to 2040 are shown in Figure 8. Data show that, in 2020, Indonesia, Vietnam, and the Philippines had the highest CO2e emission intensities with the value of 0.85, 0.65, and 0.59t-CO2e/MWh, respectively. The relatively high emission intensities in these countries are directly related to using coal as the primary source of electricity generation. These countries are also ASEAN’s leading fossil fuel producers, of which 88% is represented by Indonesia. The availability of abundant coal resources in these countries influences the choice of energy sources.
Singapore and Myanmar had 0.205 and 0.112t-CO2e/MWh emission intensities. Singapore has a relatively low emission intensity. Its energy sources come from fossil fuels with less intensive carbon, such as gas (93%). In comparison, Myanmar has the lowest emission intensity in the ASEAN region because 64.5% of its energy sources are renewable (mainly hydropower).
In 2030, Indonesia is predicted to still have the highest CO2e emission intensity, followed by Vietnam. In 2030, electricity production (GWh) from coal in Vietnam is predicted to be greater than Indonesia 1 and Indonesia 2. However, Vietnam has a lower emission intensity because the total electricity production (GWh) in Vietnam is more significant (Vietnam 1 is 572,000 GWh, and Vietnam 2 is 632,000 GWh) than Indonesia (Indonesia 2 for 444,096 GWh, and Indonesia 3 for 445,096 GWh). In addition, the mix of energy sources from gas and RE in Vietnam is also higher than in Indonesia. The most significant factor affecting the value of emission intensity is the type of energy source used. The availability of resources determines the type of energy source utilized to generate electricity.
The projected emission intensities in a unit of t-CO2e/cap for AMS from 2020 to 2040 are shown in Figure 9. In 2020, the emission intensities were 3.40, 2.58, 2.09, and 2.06t-CO2e/cap for Brunei Darussalam, Malaysia, Laos, and Singapore, respectively. Brunei has the highest emission intensity in t-CO2e/cap, which also means that every person in Brunei produces more CO2e due to their increased electricity consumption activities than any country in the ASEAN region. Laos is also noted to have a high intensity of tons-CO2e/cap emissions, but this is because Laos is the largest electricity exporter in the ASEAN region, to countries such as Thailand [43] and Malaysia [44], not because of high electricity consumption. In 2030, countries with the highest emission intensity in t-CO2e/cap are predicted to shift to Vietnam 2 (3.56t-CO2e/cap), Vietnam 1 (3.35t-CO2e/cap), Brunei Darussalam (2.97t-CO2e/cap), Malaysia (2.11t-CO2e/cap), Singapore (2.02t-CO2e/cap), and Laos (1.84t-CO2e/cap), then the country with the lowest emission intensity will be Cambodia 2 (0.372t-CO2e/cap). Vietnam in 2030 is predicted to have the ambition to increase electricity production by 2.2 times compared to 2020, with coal as the primary energy source. The projected emission intensities in t-CO2e/GDP for AMS from 2020 to 2040 are shown in Figure 10.
Based on Figure 10, in 2020, Laos had the highest emission intensities (0.774t-CO2e/GDP), while in 2030, Vietnam 2 is predicted to have the highest emission intensities (0.747t-CO2e/GDP). Laos has set a very high target of RE proportion in the energy mix in 2030 (70% of RE). Therefore, it has the highest gradient reduction in emission intensities and is predicted to be able to set a CO2e emission intensity of 0.38t-CO2e/GDP in 2030. The emission intensity value in tons of CO2e/GDP is influenced by electricity production from fossil fuels, especially coal, RE proportion in the energy mix, and the GDP of each country. Countries with a low GDP tend to have higher emission intensity per GDP.
3.3.2. Energy Intensity Projection
The energy intensity projections in units of electricity production per capita (MWh/cap) from 2020 to 2040 are shown in Figure 11. Brunei and Singapore had the highest energy intensity value in 2020 and are set to remain constant until 2030 (11.38 MWh/cap and 10.06 MWh/cap, respectively). Brunei and Singapore are producing more electricity for their citizens than other ASEAN countries. Energy intensity values indicate the amount of energy consumed by individuals in each country. Residents in Brunei and Singapore use a lot more energy than other countries, i.e., the average in ASEAN is 3.12 MWh/cap in 2020 and 3.88 MWh/cap in 2030.
The energy intensity projections in units of electricity production per GDP (MWh/GDP) from 2020 to 2040 are shown in Figure 12. In 2020, Laos (1.534 MWh/GDP) and Vietnam 2 (0.999 MWh/GDP) had the highest value of energy intensity, while in 2030, Vietnam 2 is predicted to be higher (1241 MWh/GDP) than Laos (0.907 MWh/GDP). The average energy intensity in the ASEAN region is 0.479 MWh/GDP in 2020 and 0.471 MWh/GDP in 2030. A high value of energy intensity in units of MWh/GDP indicates that the electricity production in a country such as Laos is relatively cheaper than other countries in the ASEAN region.
Figure 13 and Figure 14 represent variations in electricity production (proportional to the circle image), CO2e emission intensity (t-CO2e/GWh), and energy intensity (MWh/cap) in 2020 and 2030. Two figures denote the shifting in emission and energy intensity for each country as electricity production and population growth over time.
Figure 13 indicates that, in 2020, Indonesia had the highest emission intensity while Myanmar had the lowest. The value of energy intensity for the Philippines, Indonesia, Cambodia, and Myanmar was less than 2 MWh/cap. Vietnam and Thailand were between 2 and 4 MWh/cap. Laos and Malaysia were between 4 and 6 MWh/cap, while Brunei Darussalam and Singapore were the highest, with a value between 10 and 12 MWh/cap. For comparison, the average energy intensity in the ASEAN region in 2020 is around 3.1 MWh/cap.
Figure 14 shows that, in 2030, Indonesia is predicted to have the highest emission intensity, while Singapore is predicted to have the lowest. Most countries increase their electricity production, which also leads to an increase in energy intensity. However, there is no increase in energy intensity for Brunei and Singapore. Countries that have already had high energy intensity, such as Brunei and Singapore, do not intend to increase their energy intensity, and they intend to focus on energy intensity reduction. The high energy intensity (MWh/cap) indicates the high level of electricity consumption per individual and a modern lifestyle where most of the equipment that supports daily life uses electricity.
Table 3 shows differences in electricity production (GWh), emission intensity (t-CO2e/GWh), and energy intensity (MWh/cap) between 2030 and 2020.
Based on Table 3, Vietnam has the most aggressive plans to increase its electricity production, followed by Indonesia. The plan to increase electricity production is accompanied by a reasonably high energy mix from fossil fuel with relatively low CO2 emissions factors, such as gas and RE, resulting in a reduction in emission intensity (50.4t-CO2e/GWh for Vietnam 2 scenario and 25.4t-CO2e/GWh for the Vietnam 1 scenario). Likewise, the Indonesia 2 scenario (optimal scenario) resulted in an emission intensity reduction of 44t-CO2e/GWh, and the Indonesia 3 scenario (low carbon scenario) resulted in an emission intensity reduction of 100.6t-CO2e/GWh.
3.4. Spatial Distribution Characteristics
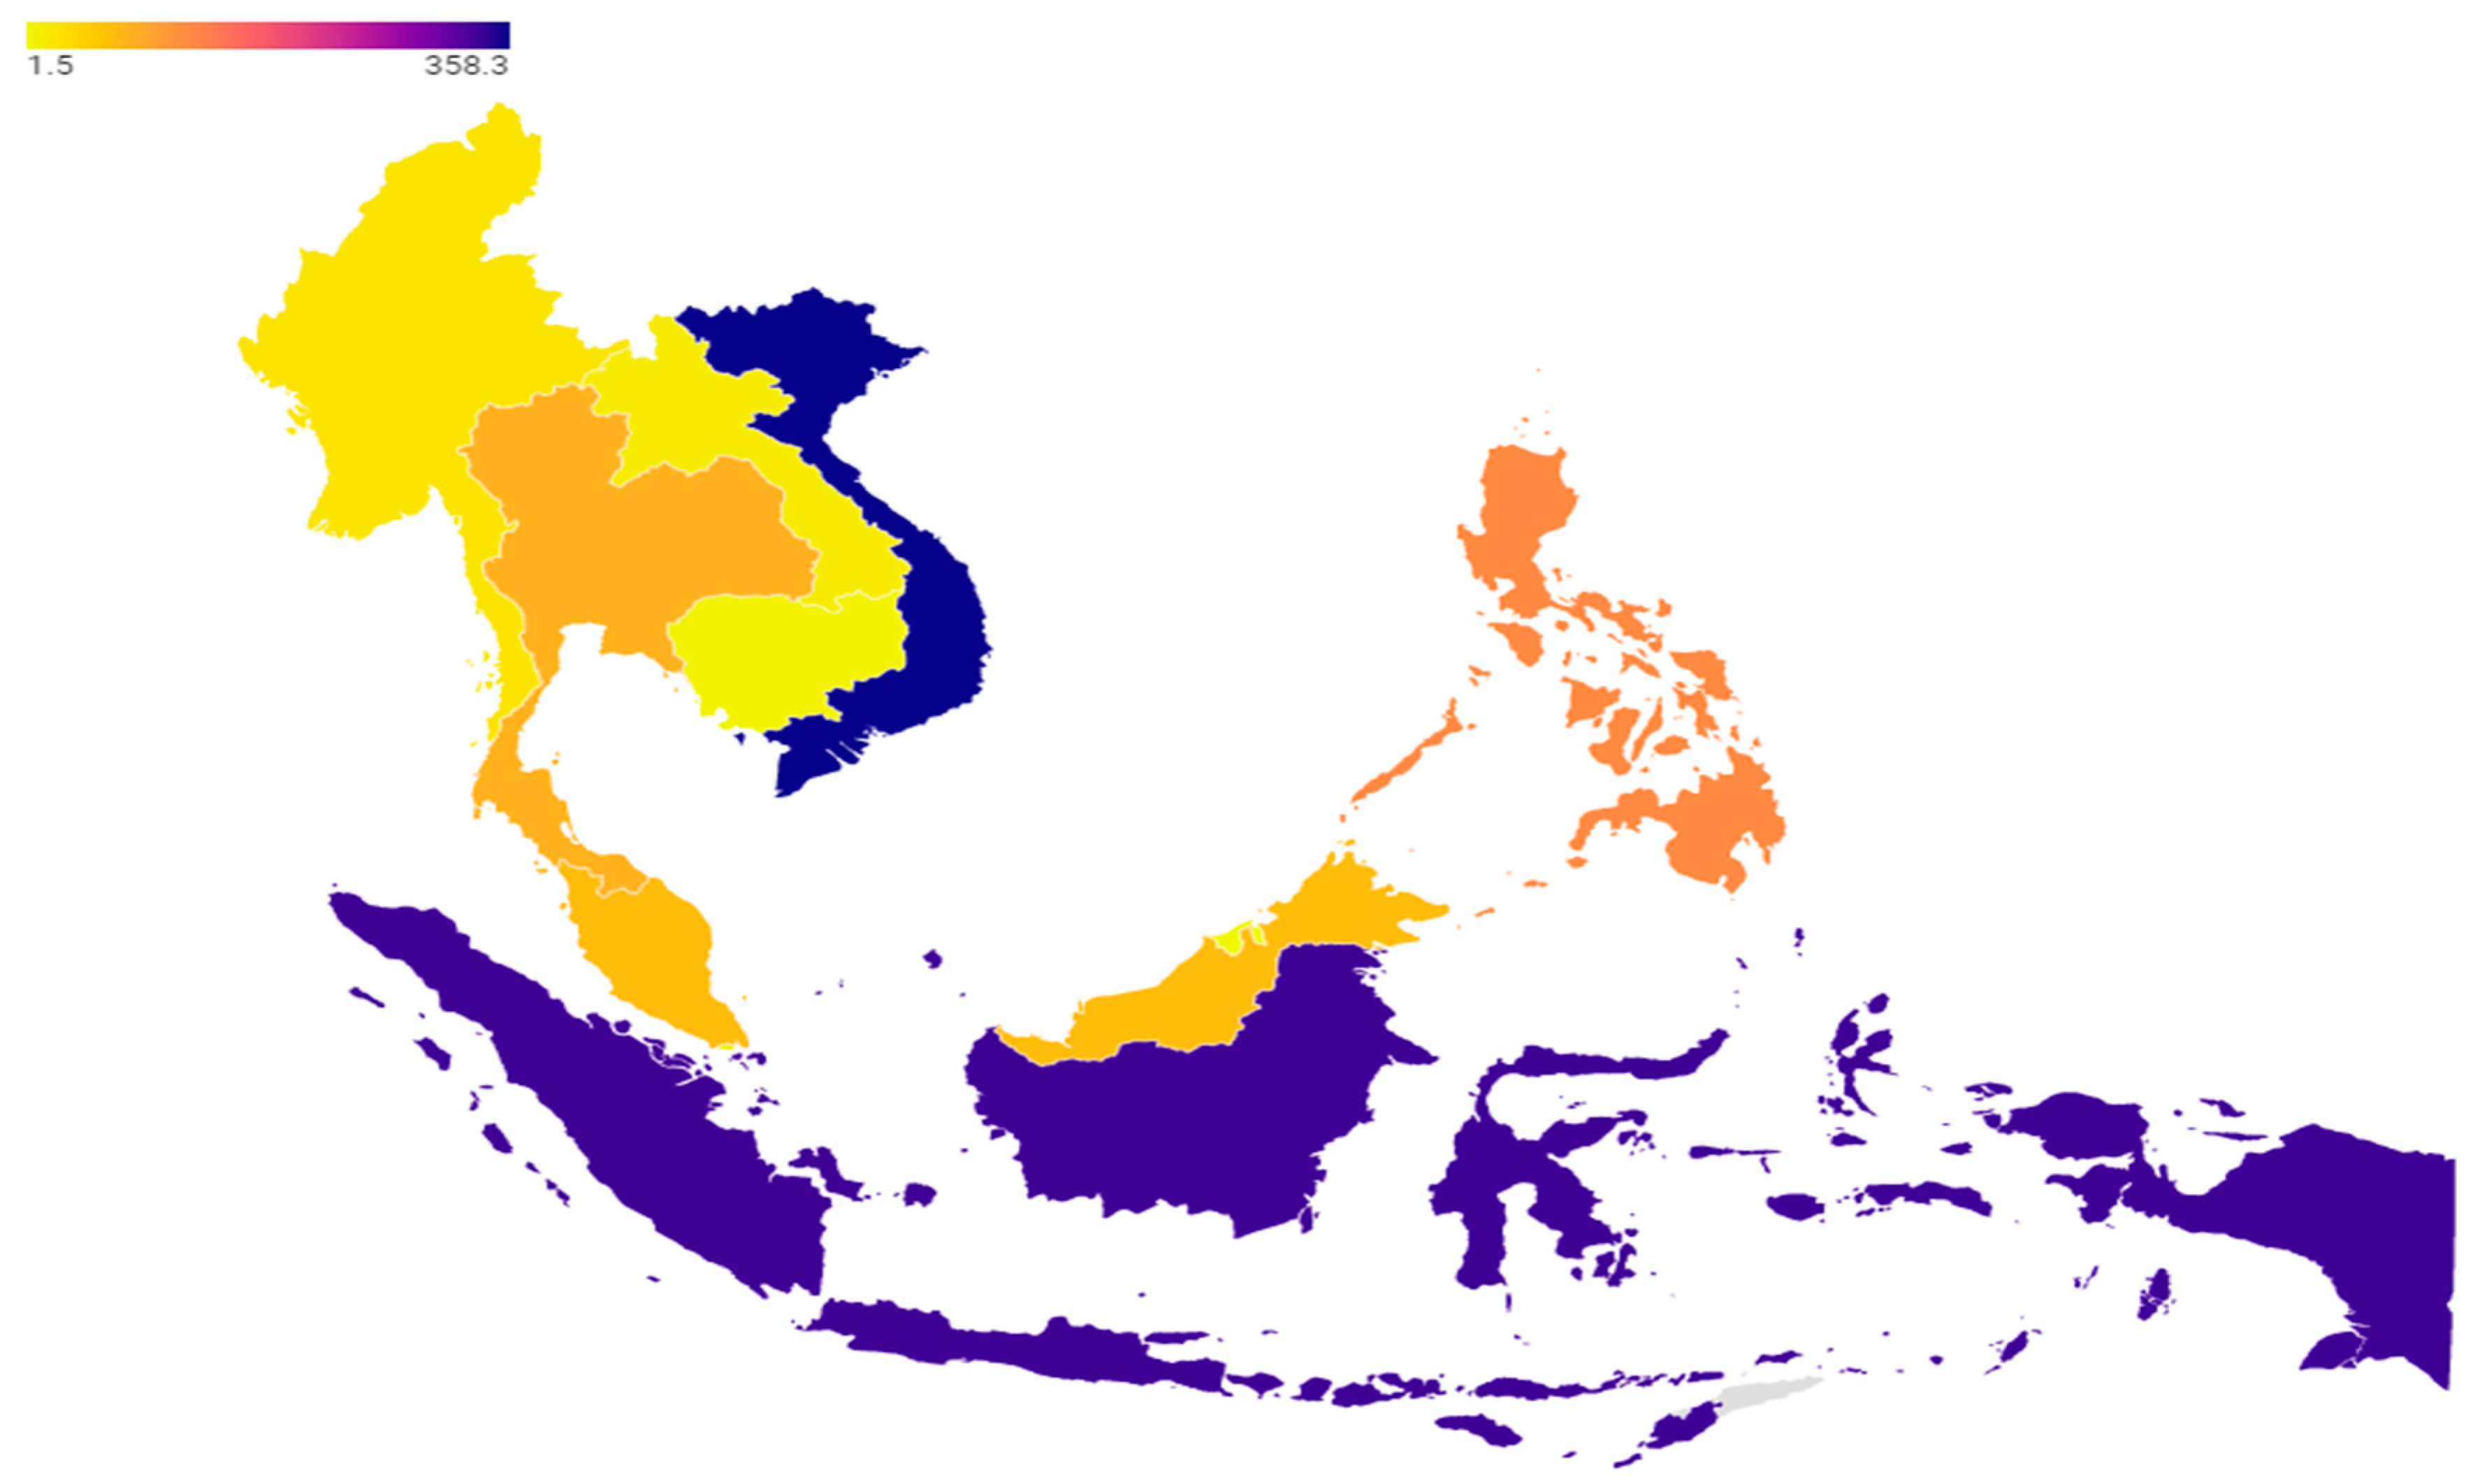
The spatial distribution characteristics in the AMS are shown in Figure 15. In contrast to other nations, Indonesia and Vietnam had more significant increases in carbon emissions in 2030 with the value of 335.3 and 358.3Mt-CO2e. In comparison, Brunei Darussalam has the lowest emission in the ASEAN region with 1.5 Mt-CO2e because its energy sources are renewable, being mainly from hydropower.
3.5. Decarbonization Strategies
The RE installation can significantly impact CO2e emission reduction if it replaces CFPPs. The AMS are targeting emission reduction of CO2e emissions by increasing RE or using an energy source with less carbon emission in the energy mix to replace coal [45,46]. Until 2030, coal and other fossil fuels will still represent a significant proportion of the energy mix. In addition to coal being a tremendous natural resource in some ASEAN countries, RE power plants’ Levelized Cost Of Electricity (LCoE) is still higher than CFPPs [47].
However, there is currently a global energy transition, including in the ASEAN countries, and this energy transition is occurring rapidly and will result in significant changes to human life. This trend will have far-reaching implications for businesses, governments, and individuals in the coming decades. The trends that shape the future of energy are driven by local trends, which will occur at varying speeds. The innovation of RE technology and its large-scale deployment has enabled the rapid reduction in energy costs for RE installation, led by solar and wind technologies. In just a decade (2010–2019), the prices of PV modules and wind turbines have fallen by 89% and 59%, respectively [48]. ASEAN countries could also strengthen their capacity by expanding cooperation with the United Nations Economic and Social Commission for Asia and the Pacific Repository (UN ESCAP) and joining the International Renewable Energy Agency (IRENA) [42].
Wars have affected the economy, monetary system, international commerce and progress, nature, and energy. The energy impact of the war between Russia and Ukraine will play a key role in energy supply, particularly in terms of CO2 emissions. Nuclear energy is one of the essential low-carbon alternative energy strategies required to reduce emissions [49]. This new energy contributes to reducing environmental degradation in the USA, France, Russia, South Korea, Canada, Ukraine, Germany, and Sweden; findings from [50] show that ammunition emissions are positively correlated with the aforementioned military parameters and global carbon emissions. There is a connection between global carbon emissions and the number of Ukrainian military personnel. The AMS’s national policies of the electricity development plan relevant to the projected GHG emissions must consider the effect of war, especially in the 2030 to 2040 nuclear scenario.
4. Conclusions
The projection of CO2e emissions and intensity from electricity generation activities in the ASEAN region has been carried out according to the national development plan of each AMS. The population and GDP growth significantly increase energy production and consumption in the AMS. The electricity supply needs to be improved to meet the growing demand. The GDP directly affects the individual income, thus influencing the lifestyle, which relies more on electricity consumption. Electricity generation is directly related to the CO2e emission and intensity if fossil fuels are still utilized as the source of energy for the electricity sector.
The study’s results indicate that, as a developing country, Indonesia has the largest population and gross domestic product (GDP) but is predicted to have the highest 0.97 CO2e/MWh emission intensity in 2030. Vietnam is predicted to have an emission intensity of about 3.56t-CO2e/cap and 0.747t-CO2e/GDP in 2030. Vietnam is expected to increase its energy intensity to 1241 MWh/GDP, while Brunei Darussalam is expected to have a high energy intensity of 11.35 MWh/cap. However, the capacity of solar power plants (more than 11 GW) and wind-power plants (2384 MW) have generally increased in the ASEAN from 2015 to 2019, indicating positive renewable energy source (RES) use development. The national policies of the electricity development plan strongly influence the projected CO2e emissions and intensity plan. Policies that address replacing coal with lower carbon energy sources, such as gas, will not have significant impacts if the proportion of coal in the energy mix is still high. Compared with other ASEAN countries, Indonesia and Vietnam need to develop a comprehensive strategy to significantly decarbonize the electricity sector to reduce carbon emissions. Aggressive policies in replacing CFPPs with RE power plants affect CO2e emissions and intensity reduction. Feed-in tariffs, RE auctions, or corporate RE procurement should be bolstered as strong policy supports for mitigating investment risks and expanding RE technology deployment. Southeast Asia has a high potential for wind and solar availability throughout the year, which is a significant capital in the development of RE technology.
Despite its importance, this study has limitations. In the future, researchers can investigate the role of renewable energies in reducing carbon emissions from the electricity sector by considering the intermittent characteristics of renewable energy and the development trend of RE plants.
Author Contributions
Conceptualization M.T. and K.D.; methodology, K.D.; resources, M.T.; data curation, A.S.E.; writing—original draft preparation, K.D. and M.T.; writing—review and editing, H.B.T. All authors have read and agreed to the published version of the manuscript.
Funding
This research received no external funding.
Data Availability Statement
Not applicable.
Acknowledgments
This study was supported by PT. PLN (Persero) Puslitbang Ketenagalistrikan (Research Institute), and Study Program of Environmental Engineering of Institut Teknologi Bandung.
Conflicts of Interest
The authors declare no conflict of interest.
References
- Erdiwansyah; Mahidin; Mamat, R.; Sani, M.S.M.; Khoerunnisa, F.; Kadarohman, A. Target and Demand for Renewable Energy Across 10 ASEAN Countries by 2040. Electr. J. 2019, 32, 106670. [Google Scholar] [CrossRef]
- Ang, B.W.; Su, B. Carbon Emission Intensity in Electricity Production: A Global Analysis. Energy Policy 2016, 94, 56–63. [Google Scholar] [CrossRef]
- Lau, H.C. Decarbonization Roadmaps for ASEAN and Their Implications. Energy Rep. 2022, 8, 6000–6022. [Google Scholar] [CrossRef]
- Shi, X. The Future of ASEAN Energy Mix: A SWOT Analysis. Renew. Sustain. Energy Rev. 2016, 53, 672–680. [Google Scholar] [CrossRef]
- Jiang, H.; Gao, Y.; Xu, P.; Li, J. Study of Future Power Interconnection Scheme in ASEAN. Glob. Energy Interconnect. 2019, 2, 549–559. [Google Scholar] [CrossRef]
- Shi, X. ASEAN Power Grid, Trans-ASEAN Gas Pipeline and ASEAN Economic ASEAN Power Grid, Trans-ASEAN Gas Pipeline and ASEAN Economic Community; ASEAN: Jakarta, Indonesia, 2014; pp. 1–18. [Google Scholar]
- Peng, X.; Tao, X.; Zhang, H.; Chen, J.; Feng, K. CO2 Emissions from the Electricity Sector During China’s Economic Transition: From The Production to the Consumption Perspective. Sustain. Prod. Consum. 2021, 27, 1010–1020. [Google Scholar] [CrossRef]
- Inglesi-Lotz, R.; Dogan, E. The Role of Renewable Versus Non-Renewable Energy to the Level of CO2 Emissions a Panel Analysis of Sub- Saharan Africa’s Βig 10 Electricity Generators. Renew. Energy 2018, 123, 36–43. [Google Scholar] [CrossRef]
- Lau, H.C.; Zhang, K.; Bokka, H.K.; Ramakrishna, S. A Review of the Status of Fossil and Renewable Energies in Southeast Asia and Its Implications on the Decarbonization of ASEAN. Energies 2022, 15, 2152. [Google Scholar] [CrossRef]
- Ahmed, T.; Mekhilef, S.; Shah, R.; Mithulananthan, N.; Seyedmahmoudian, M.; Horan, B. ASEAN Power Grid: A Secure Transmission Infrastructure for Clean and Sustainable Energy for South-East Asia. Renew. Sustain. Energy Rev. 2017, 67, 1420–1435. [Google Scholar] [CrossRef]
- ASEAN Plan of Action for Energy Cooperation (APAEC) 2016–2025; The ASEAN Centre for Energy: Jakarta, Indonesia, 2015.
- Namahoro, J.P.; Wu, Q.; Xiao, H.; Zhou, N. The Impact of Renewable Energy, Economy and Population Growth on CO2 Emissions in the East African Region: Evidence from Common Correlated Effect Means Group and Asymmetric Analysis. Energies 2021, 14, 312. [Google Scholar] [CrossRef]
- Zaekhan, Z.; Nachrowi, N.D. The Lmpact of Renewable Energy and GDP per Capita on Carbon Dioxide Emission in the G-20 Countries. Econ. Financ. Indones. 2015, 60, 145–174. [Google Scholar] [CrossRef]
- Akpan, G.E.; Akpan, U.F. Electricity Consumption, Carbon Emissions and Economic Growth in Nigeria. Int. J. Energy Econ. Policy 2012, 2, 292–306. [Google Scholar]
- Ahmad, N.; Du, L. Effects of Energy Production and CO2 Emissions on Economic Growth in Iran: ARDL Approach. Energy 2017, 123, 521–537. [Google Scholar] [CrossRef]
- Malla, S. CO2 Emissions from Electricity Generation in Seven Asia-Pacific and North American Countries: A Decomposition Analysis. Energy Policy 2009, 37, 1–9. [Google Scholar] [CrossRef]
- Saidi, K.; Hammami, S. The Impact of CO2 Emissions and Economic Growth on Energy Consumption in 58 Countries. Energy Rep. 2015, 1, 62–70. [Google Scholar] [CrossRef]
- Sahin, H.; Esen, H. The Usage of Renewable Energy Sources and Its Effects on GHG Emission Intensity of Electricity Generation in Turkey. Renew. Energy 2022, 192, 859–869. [Google Scholar] [CrossRef]
- Orfanos, N.; Mitzelos, D.; Sagani, A.; Dedoussis, V. Life-Cycle Environmental Performance Assessment of Electricity Generation and Transmission Systems in Greece. Renew. Energy 2019, 139, 1447–1462. [Google Scholar] [CrossRef]
- Li, X.; Chalvatzis, K.J.; Pappas, D. China’s Electricity Emission Intensity in 2020—An Analysis at Provincial Level. Energy Procedia 2017, 142, 2779–2785. [Google Scholar] [CrossRef]
- Jafari, Y.; Othman, J.; Nor, A.H.S.M. Energy Consumption, Economic Growth and Environmental Pollutants in Indonesia. J. Policy Model. 2012, 34, 879–889. [Google Scholar] [CrossRef]
- ASEAN CO2 Emissions from Coal-Fired Power Plants: A Baseline Study; The ASEAN Centre for Energy: Jakarta, Indonesia, 2021.
- IEA. Technology Roadmap High-Efficiency, Low-Emissions Coal-Fired Power Generation; IEA: Paris, France, 2012. [Google Scholar]
- Brunei Darussalam National Determined Contribution (NDC) 2020; Ministry of Development Brunei Darussalam: Bandar Seri Begawan, Brunei, 2020.
- Philippine Energy Plan (PEP) 2018–2040; Department of Energy Republic of the Philippines: Taguig City, Philippines, 2018.
- Rencana Usaha Penyediaan Tenaga Listrik (RUPTL) PT PLN (Persero) 2021–2030; PLN: Jakarta, Indonesia, 2021.
- The General Department of Energy With Input From the General Department of Petroleum, M. of Mi. and E. of C. In Cambodia Basic Energy Plan; Economic Research Institute for ASEAN and East Asia (ERIA): Jakarta, Indonesia, 2019.
- Power Development Plan 2020–2030 of Lao PDR; Ministry of Energy and Mines Lao PDR: Vientiane, Laos, 2020.
- Malaysian Investment Development Authority. Available online: https://www.mida.gov.my/ (accessed on 22 December 2021).
- The Government of the Republic of the Union of Myanmar National Energy Management Committee. Myanmar Energy Master Plan. 2015. Available online: https://policy.asiapacificenergy.org/node/2923 (accessed on 1 December 2021).
- Singapore’s Update of Its First Nationally Determined Contribution (NDC) and Accompanying Information. Singapore, 2020.
- Thailand Power Development Plan 2018–2037 (PDP 2018); Ministry of Energy: Bangkok, Thailand, 2018.
- Farley, W. Williams Vietnam’s Draft Master Plan VIII-What It Means For Renewable Energy. Available online: https://www.wfw.com/articles/vietnams-draft-master-plan-viii-what-it-means-for-renewable-energy/ (accessed on 1 December 2021).
- UNFCCC Tools to Calculate the Emission Factor for an Electricity System. Available online: https://cdm.unfccc.int/methodologies/PAmethodologies/tools/am-tool-07-v1.1.pdf/history_view (accessed on 15 November 2021).
- Gomez, D.R.; Watterson, J.D.; Americano, B.B.; Ha, C.; Marland, G.; Matsika, E.; Namayanga, L.N.; Osman-Elasha, B.; Saka, J.D.K.; Treanton, K. Chapter 2: Stationary Combustion. In IPCC Guidelines for National Greenhouse Gas Inventories; Institute for Global Environmental Strategies: Kanagawa, Japan, 2006; pp. 1–48. [Google Scholar]
- IEA Data and Statistics. Available online: https://www.iea.org/data-and-statistics. (accessed on 15 November 2021).
- Data Commons Timeline. Available online: https://datacommons.org/tools/timeline#&place=Earth&statsVar=Count_Person. (accessed on 20 November 2021).
- Vivid Amalia Khusna; Deni Kusumawardani Decomposition of Carbon Dioxide (CO2) Emissions in ASEAN Based on Kaya Identity. Indones. J. Energy 2021, 4, 101–114. [CrossRef]
- IEA Fuels and Technologies. Available online: https://www.iea.org/fuels-and-technologies (accessed on 15 November 2021).
- Statista. Available online: https://www.statista.com/statistics/796245/gdp-of-the-asean-countries/ (accessed on 15 November 2021).
- Phoumin, H.; Herberg, M.E.; Tsafos, N.; Weatherby, C. Powering Southeast Asia Meeting The Region’s Electricity Needs; The National Bureau of Asian Research: Seattle, DC, USA; Washington, DC, USA, 2020. [Google Scholar]
- Overland, I.; Sagbakken, H.F.; Chan, H.-Y.; Merdekawati, M.; Suryadi, B.; Utama, N.A.; Vakulchuk, R. The ASEAN Climate and Energy Paradox. Energy Clim. Chang. 2021, 2, 100019. [Google Scholar] [CrossRef]
- Kyophilavong, P.; Souphonphacdy, D.; Komany, S.; Tounalom, K. Decarbonization in Lao PDR: The Options and Challenges. 2021. Available online: https://www.climateworkscentre.org/wp-content/uploads/2022/02/Lao-PDR-Report-Phase-1_Sept-21.pdf (accessed on 13 February 2023).
- Asian Development Bank. Lao People’s Democratic Republic Energy Sector Assessment, Strategy, and Road Map; Asian Development Bank: Mandaluyong, Philippines, 2019. [Google Scholar]
- Lau, H.C. Decarbonization of ASEAN’s Power Sector: A Holistic Approach. Energy Rep. 2023, 9, 676–702. [Google Scholar] [CrossRef]
- Tongsopit, S.; Kittner, N.; Chang, Y.; Aksornkij, A.; Wangjiraniran, W. Energy Security in ASEAN: A Quantitative Approach for Sustainable Energy Policy. Energy Policy 2016, 90, 60–72. [Google Scholar] [CrossRef]
- Anbumozhi, V.; Arriola, F.; Burell, A.; Connet, D.; Dhakal, S.; Duan, X.; Huang, Z.; Jett, A.; Lu, X.; Malang, L.; et al. Financing Clean Energy in Developing Asia; Susantono, B., Zhai, Y., Shrestha, R.M., Mo, L., Eds.; Asia Development Bank: Mandaluyong, Philippines, 2021; Volume 1, ISBN 9789292629861. [Google Scholar]
- Arinaldo, D.; Prasojo, H.; Tampubolon, A.P.; Simamora, P.; Kurniawan, D.; Marciano, I.; Adiatma, J.C. Indonesia Energy Transition Outlook 2021: Tracking Progress of Energy Transition in Indonesia; Institute for Essential Services Reform (IESR): Jakarta, Indonesia, 2021; pp. 1–93. [Google Scholar]
- Pan, B.; Adebayo, T.S.; Ibrahim, R.L.; Al-Faryan, M.A.S. Does Nuclear Energy Consumption Mitigate Carbon Emissions in Leading Countries by Nuclear Power Consumption? Evidence from Quantile Causality Approach. Front. Environ. Sci. 2022, 1–23. [Google Scholar] [CrossRef]
- Sasmoko; Imran, M.; Khan, S.; Khan, H.U.R.; Jambari, H.; Musah, M.B.; Zaman, K. War Psychology: The Global Carbon Emissions Impact of the Ukraine-Russia Conflict. Front. Environ. Sci. 2023, 11, 228. [Google Scholar] [CrossRef]
Figure 1.
Electricity production (GWh) in AMS (2019) (reprinted from ref. [36]).
Figure 1.
Electricity production (GWh) in AMS (2019) (reprinted from ref. [36]).
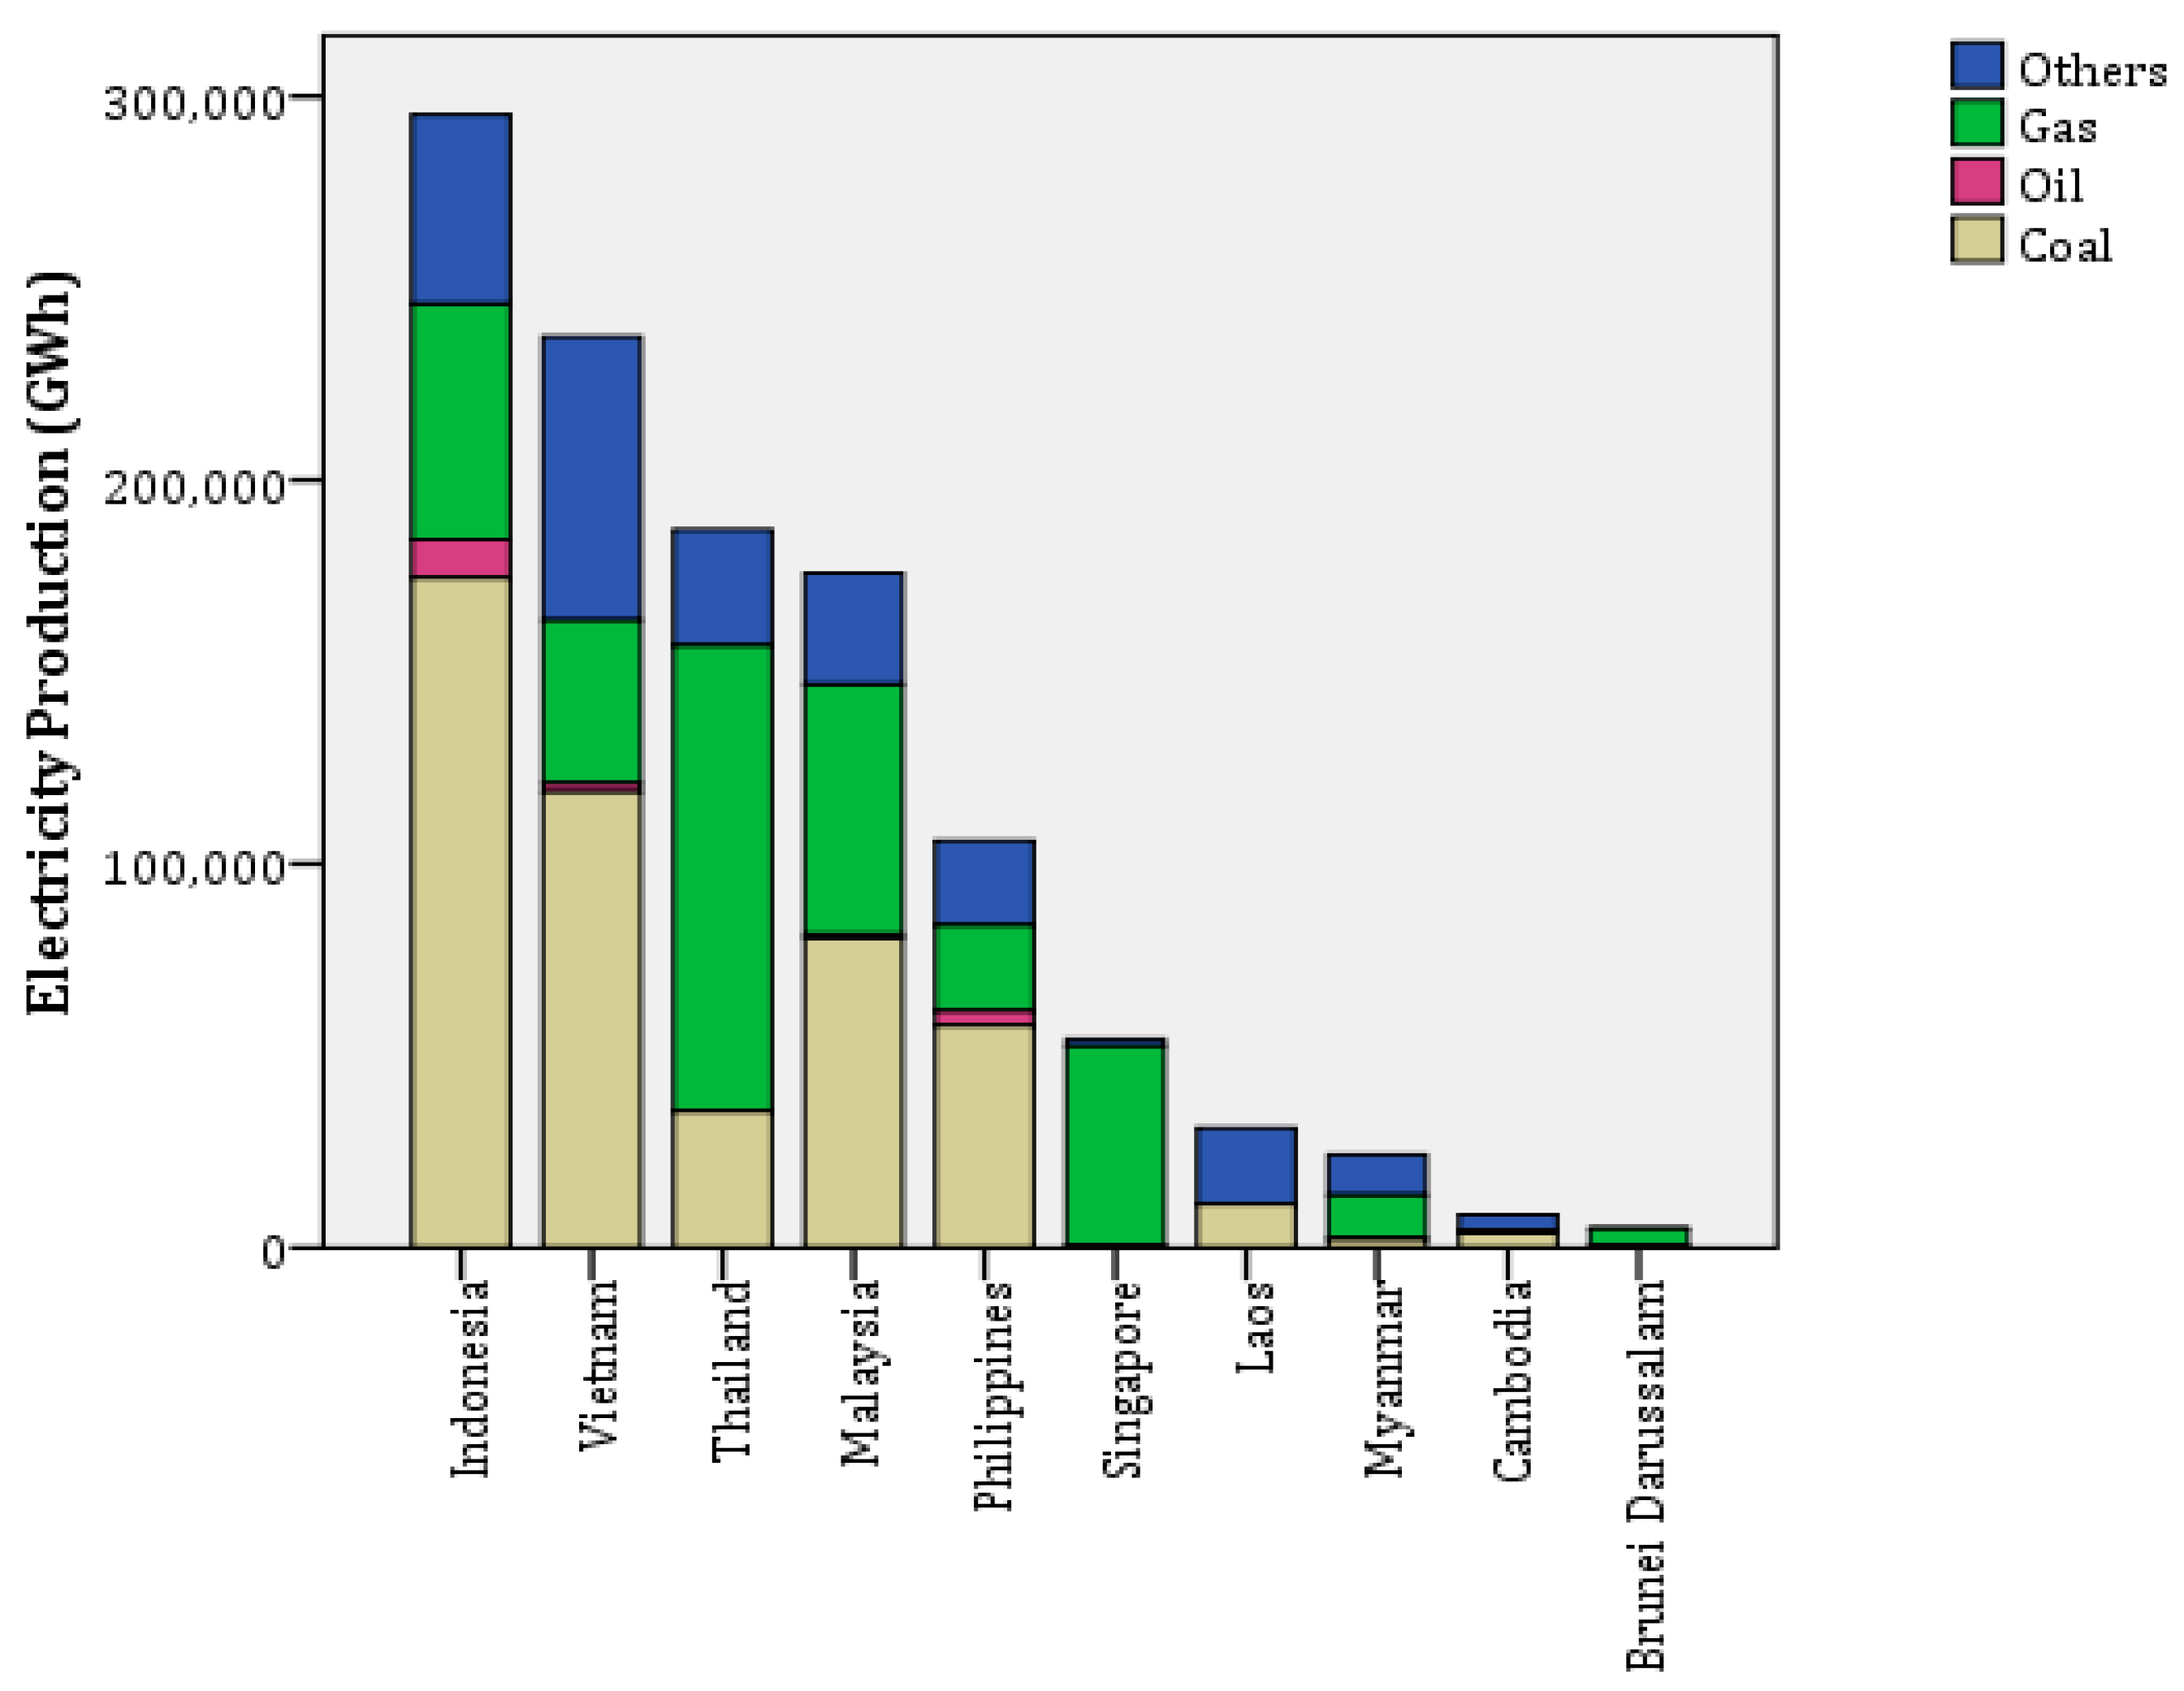
Figure 2.
CO2e emission intensity (t-CO2e/GWh) and electricity production (MWh/cap) in AMS 2019 (reprinted from ref. [36]).
Figure 2.
CO2e emission intensity (t-CO2e/GWh) and electricity production (MWh/cap) in AMS 2019 (reprinted from ref. [36]).
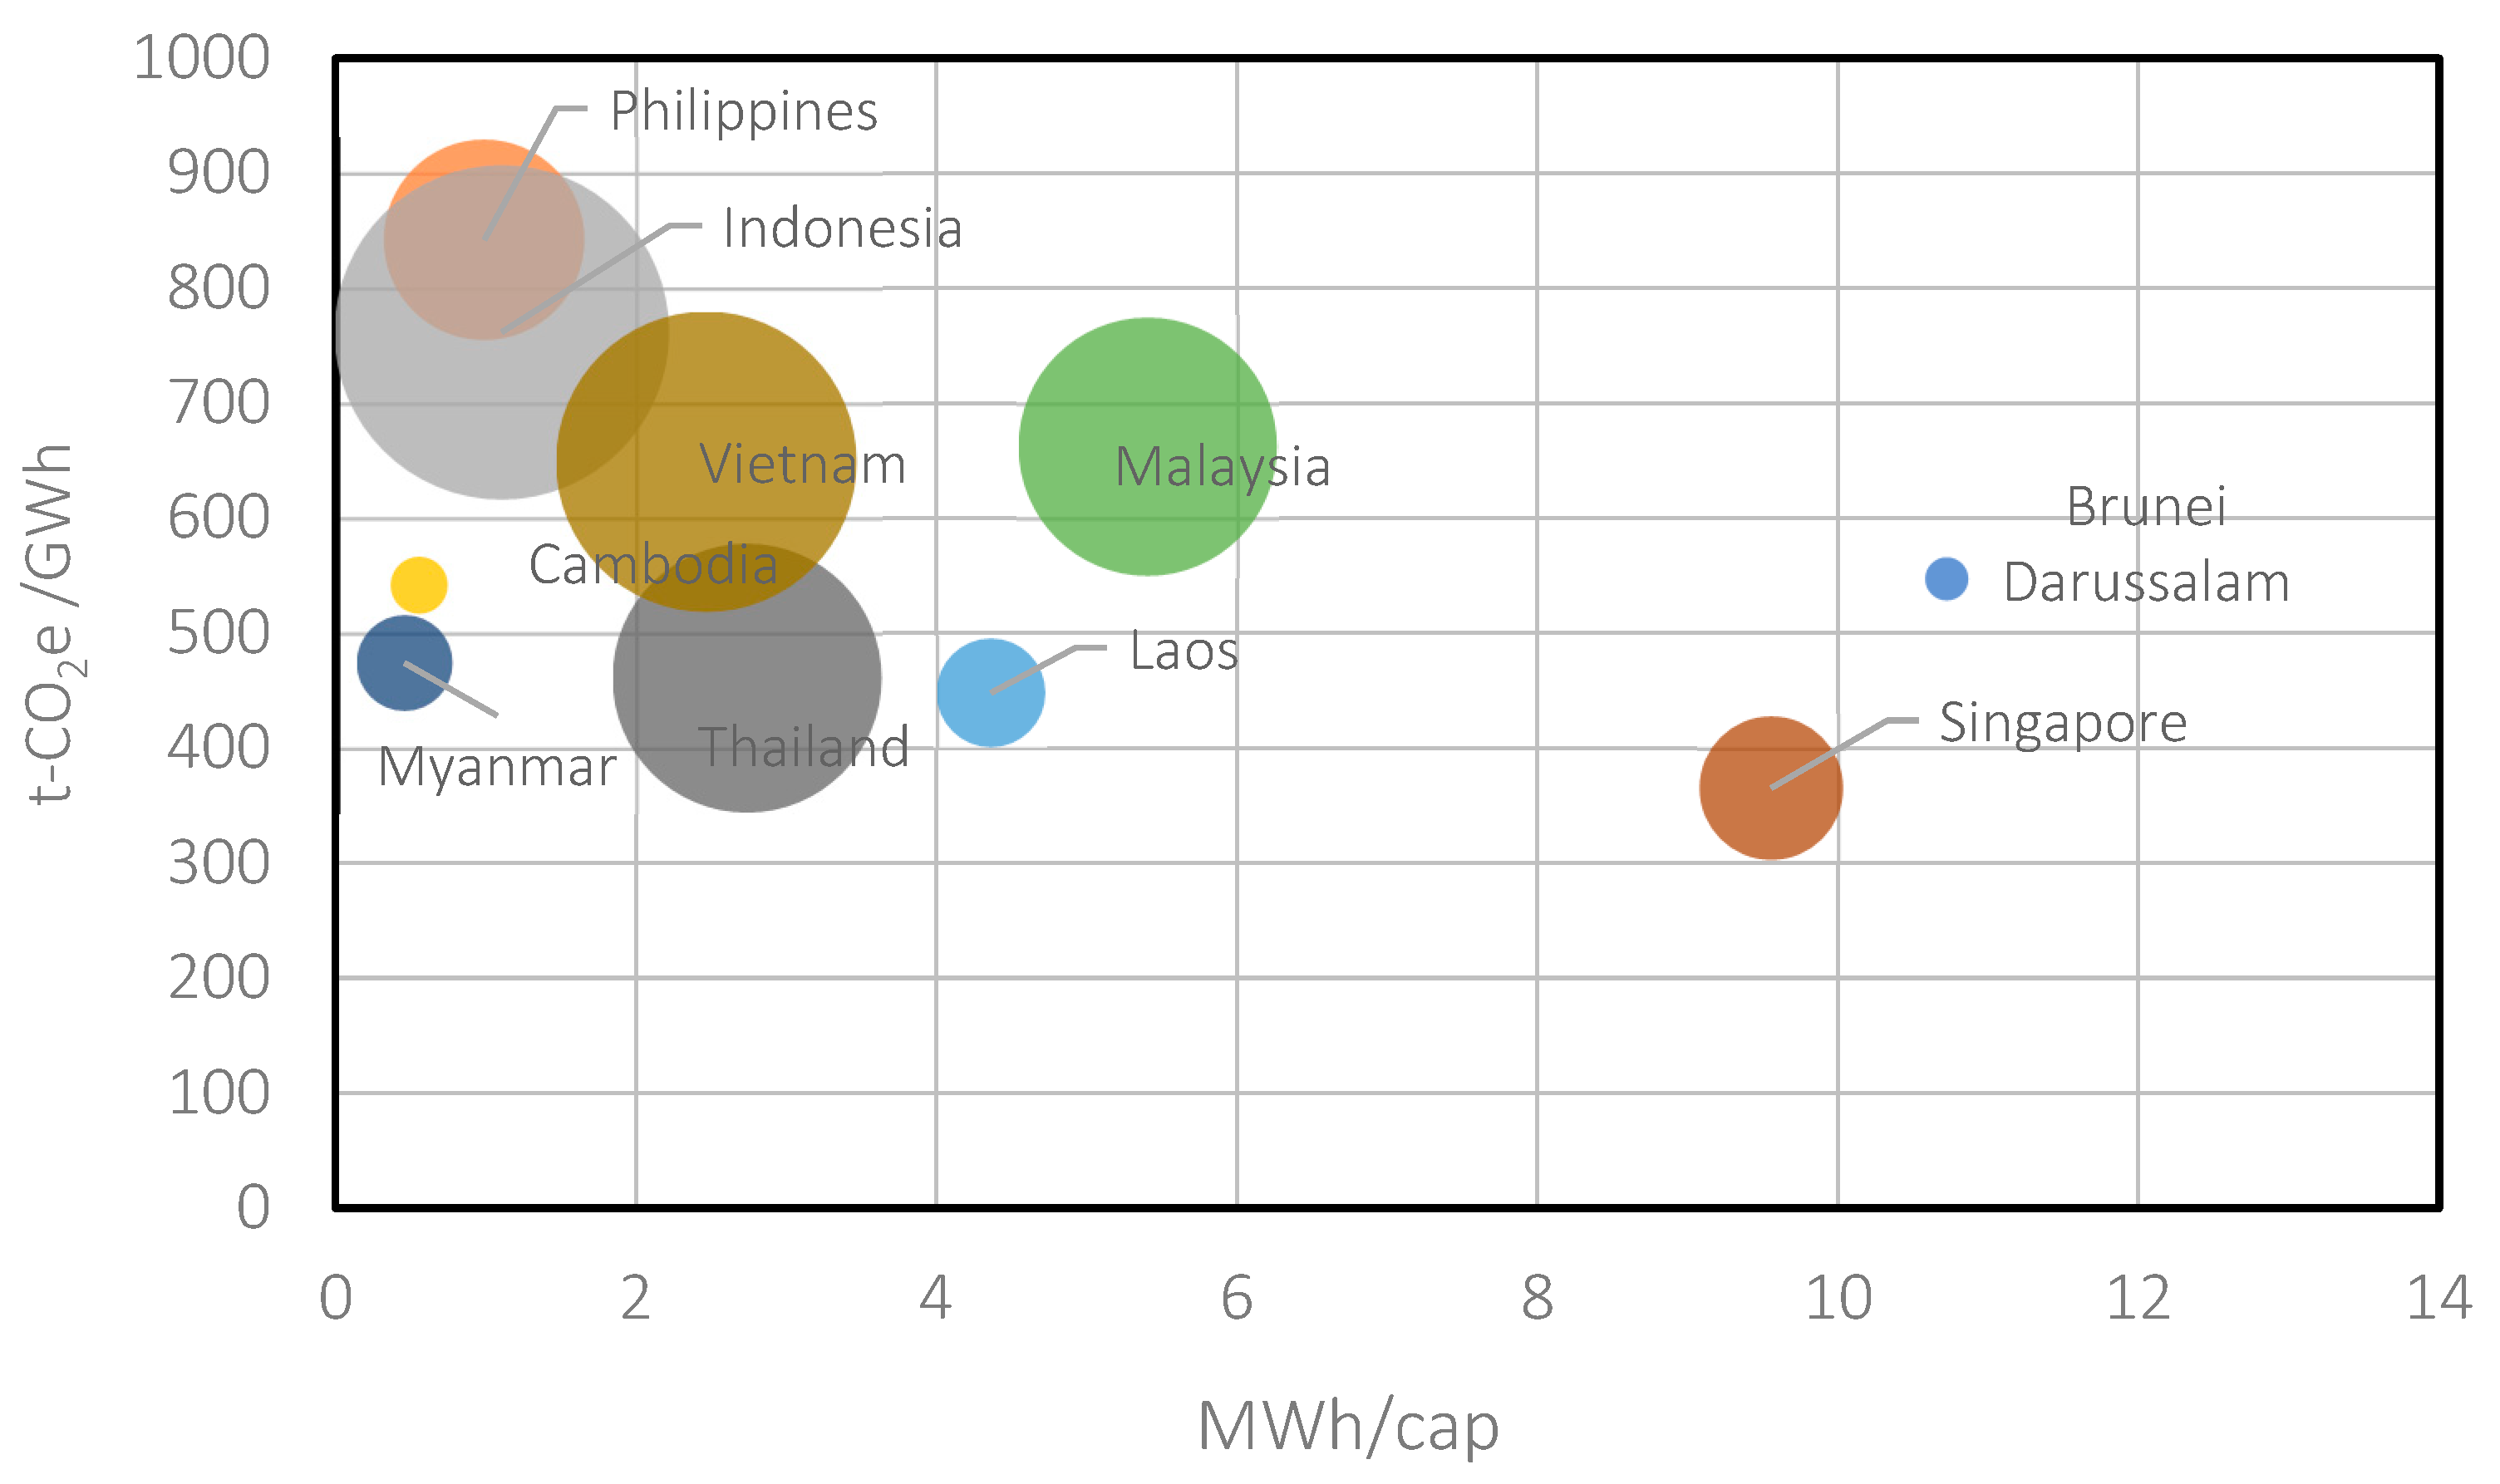
Figure 3.
Percentage of energy consumption by country (reprinted from ref. [41]).
Figure 3.
Percentage of energy consumption by country (reprinted from ref. [41]).
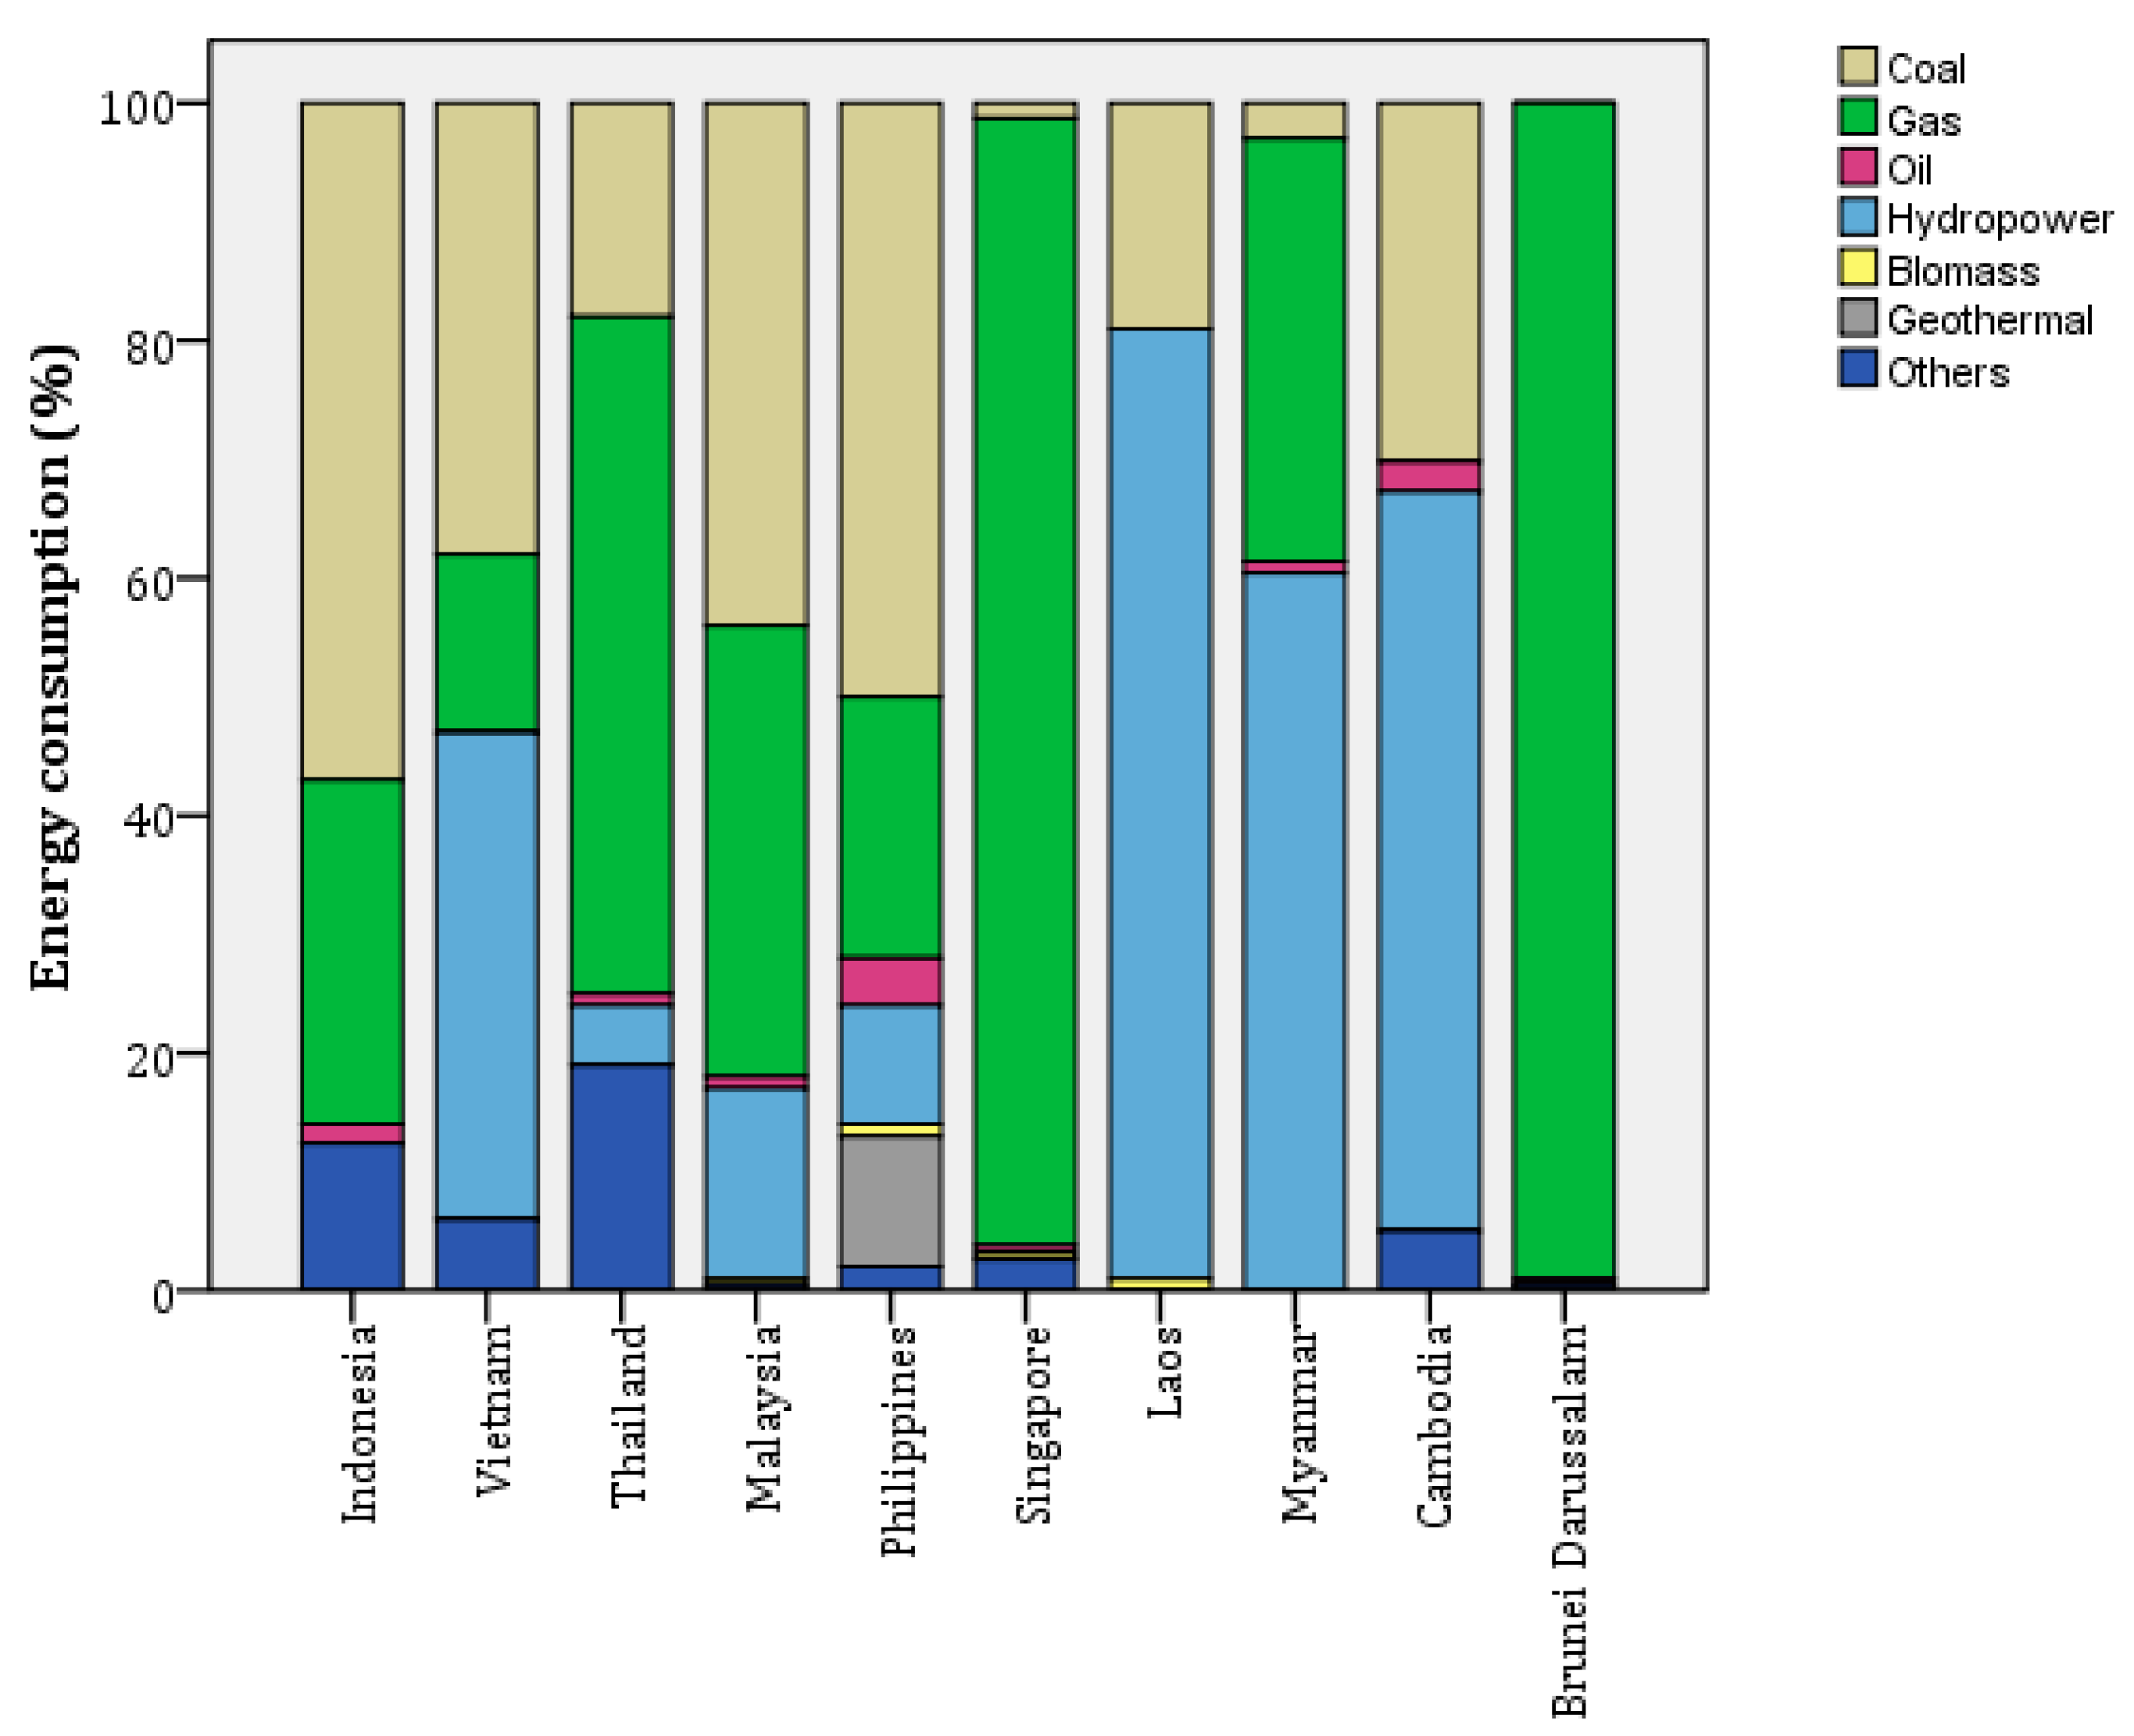
Figure 4.
Renewable electricity generation by source (non-combustible) in AMS (1990–2020) (reprinted from ref. [39]).
Figure 4.
Renewable electricity generation by source (non-combustible) in AMS (1990–2020) (reprinted from ref. [39]).
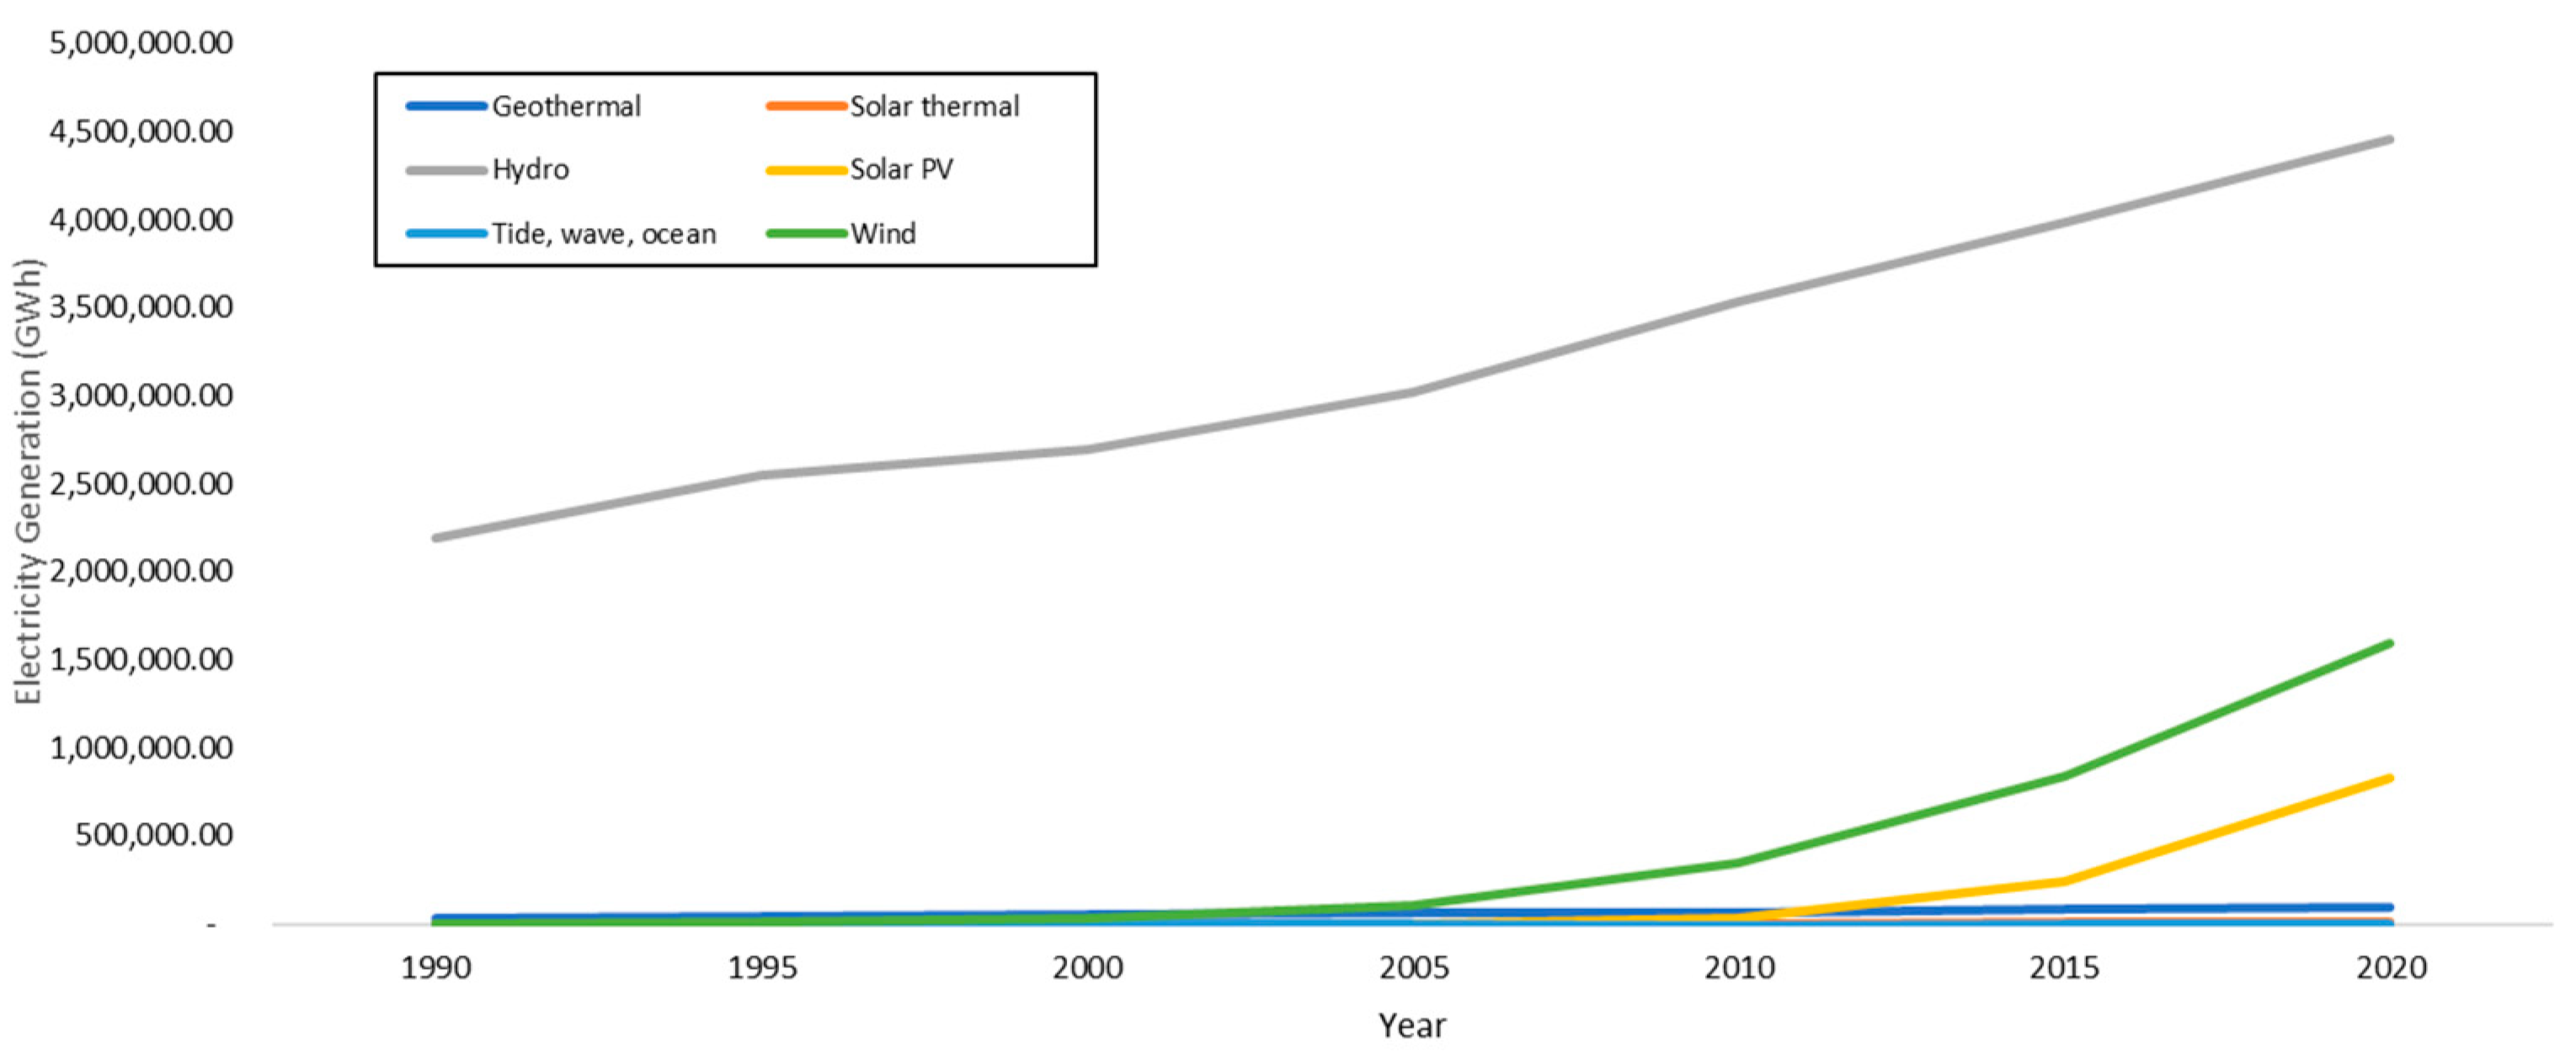
Figure 5.
Solar PV development in the ASEAN.
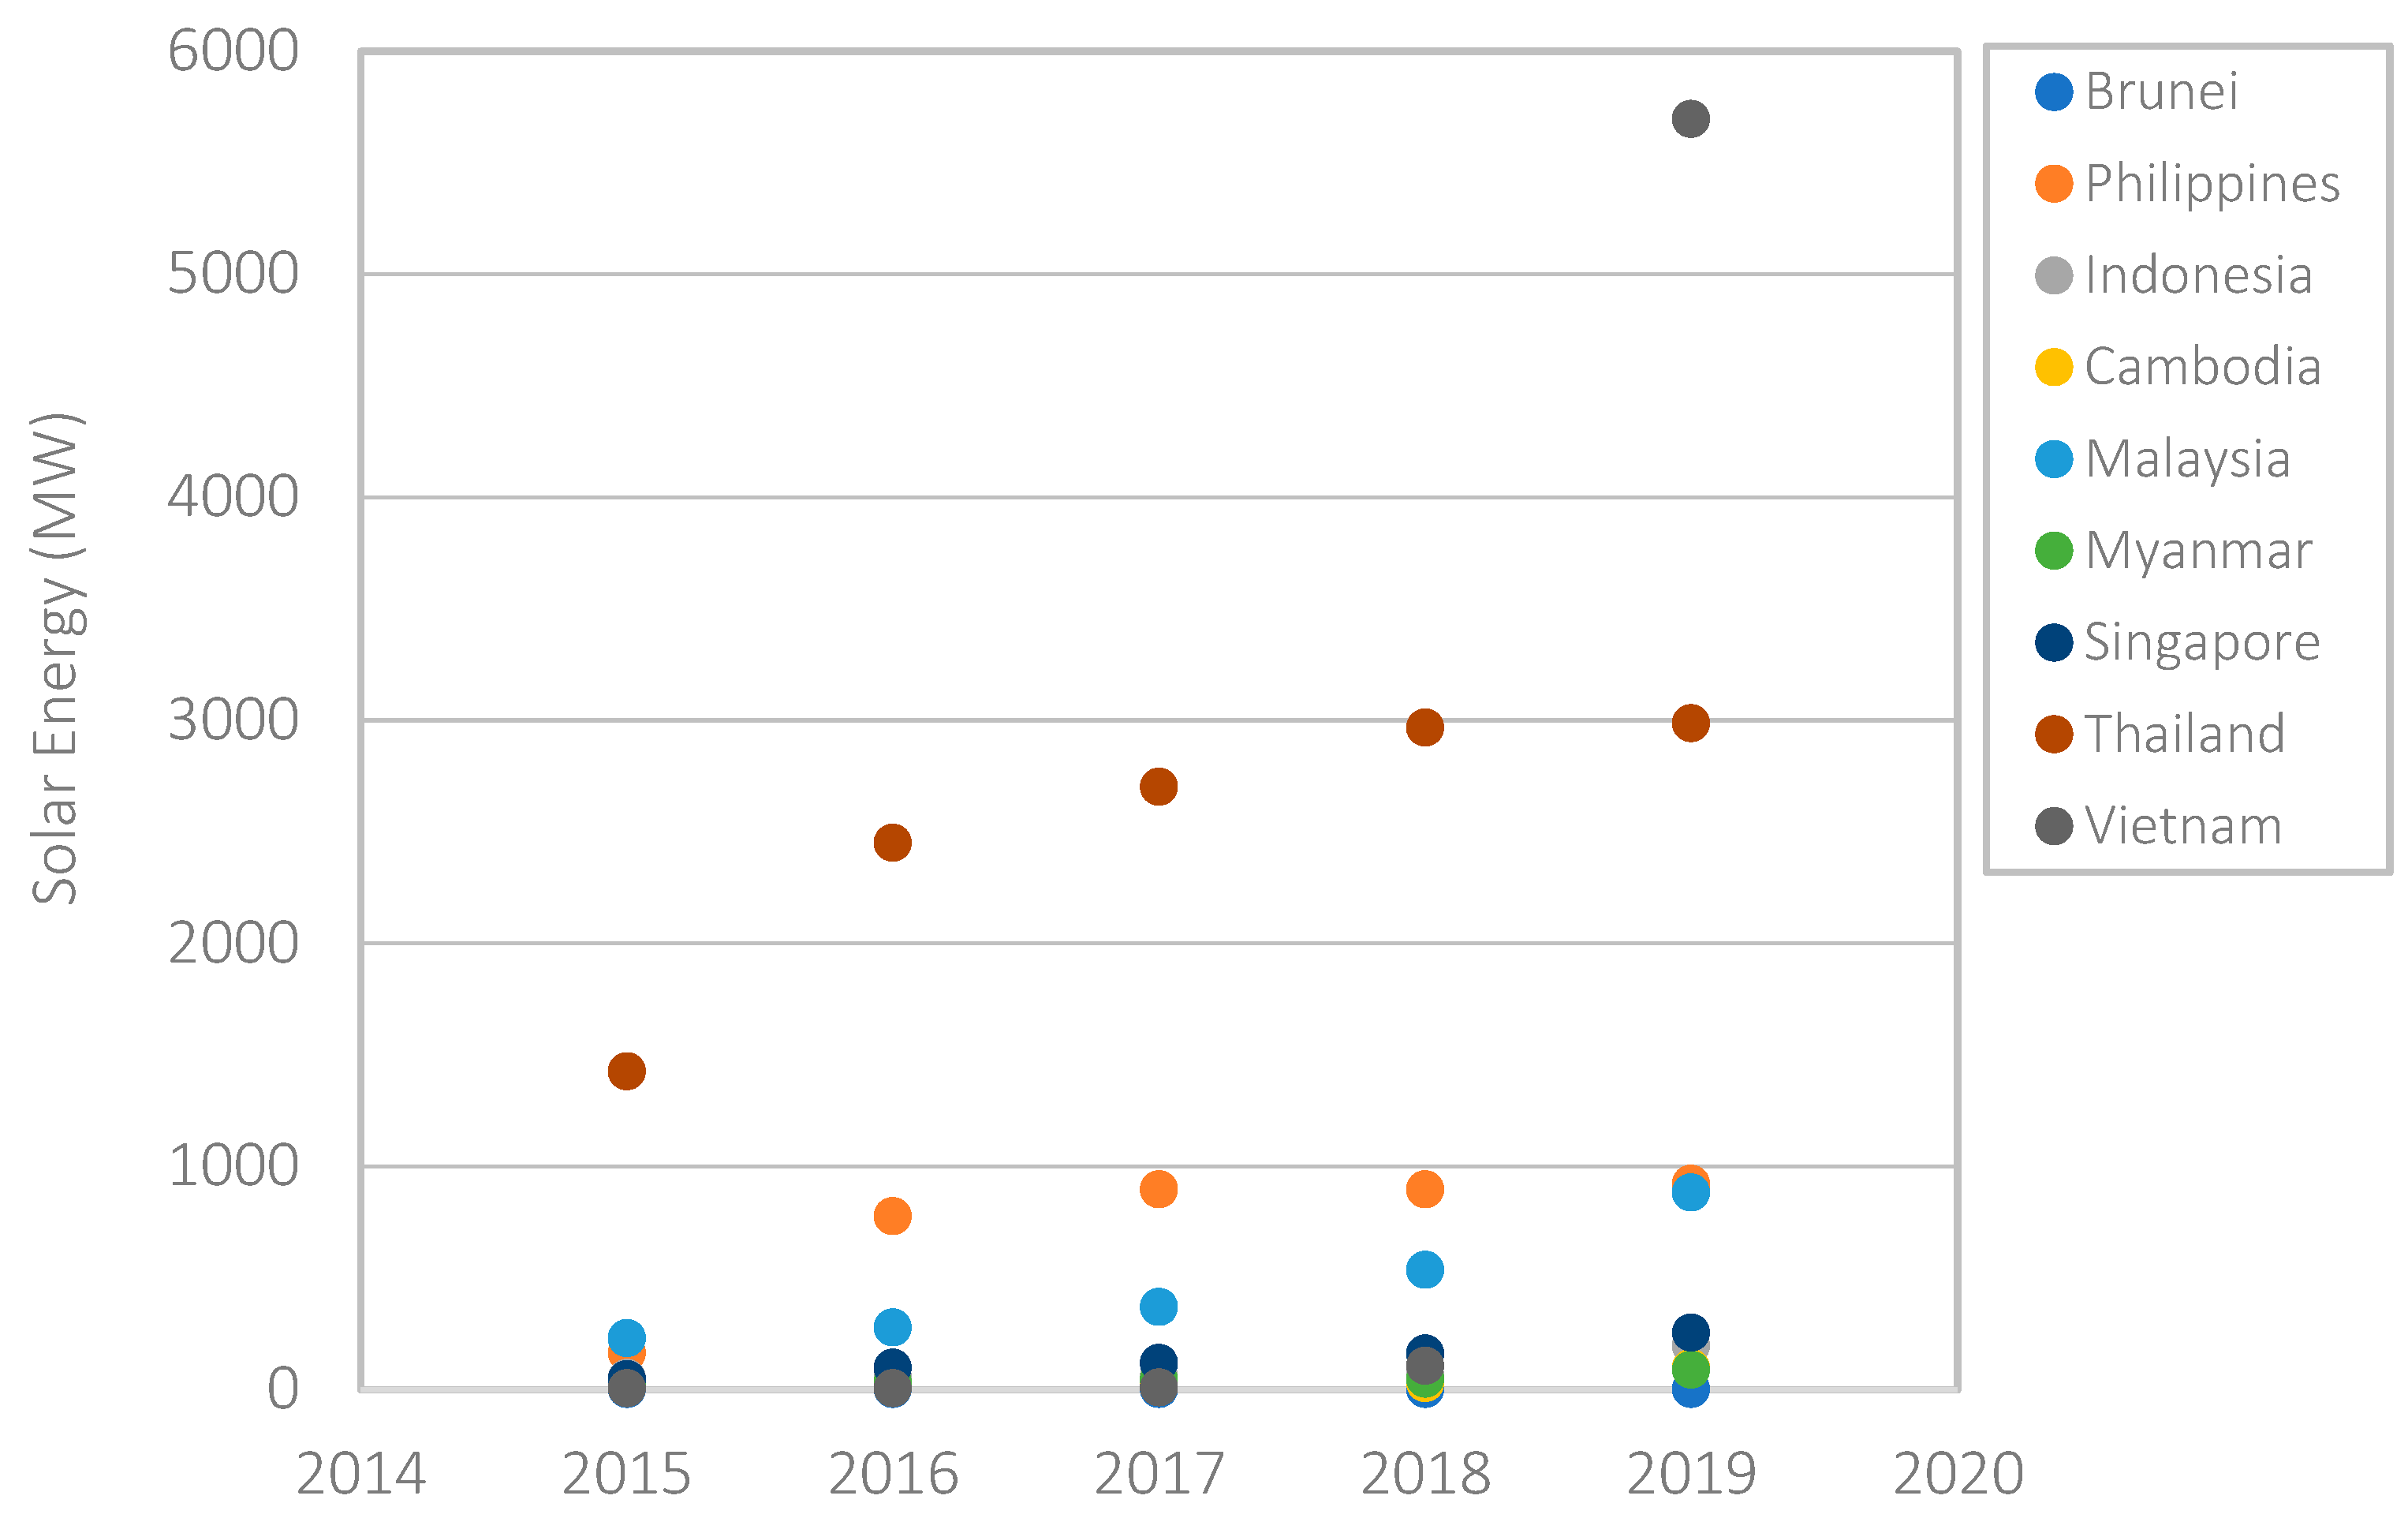
Figure 6.
Wind-power plant development in the ASEAN.

Figure 7.
Projection of carbon emissions level in AMS.
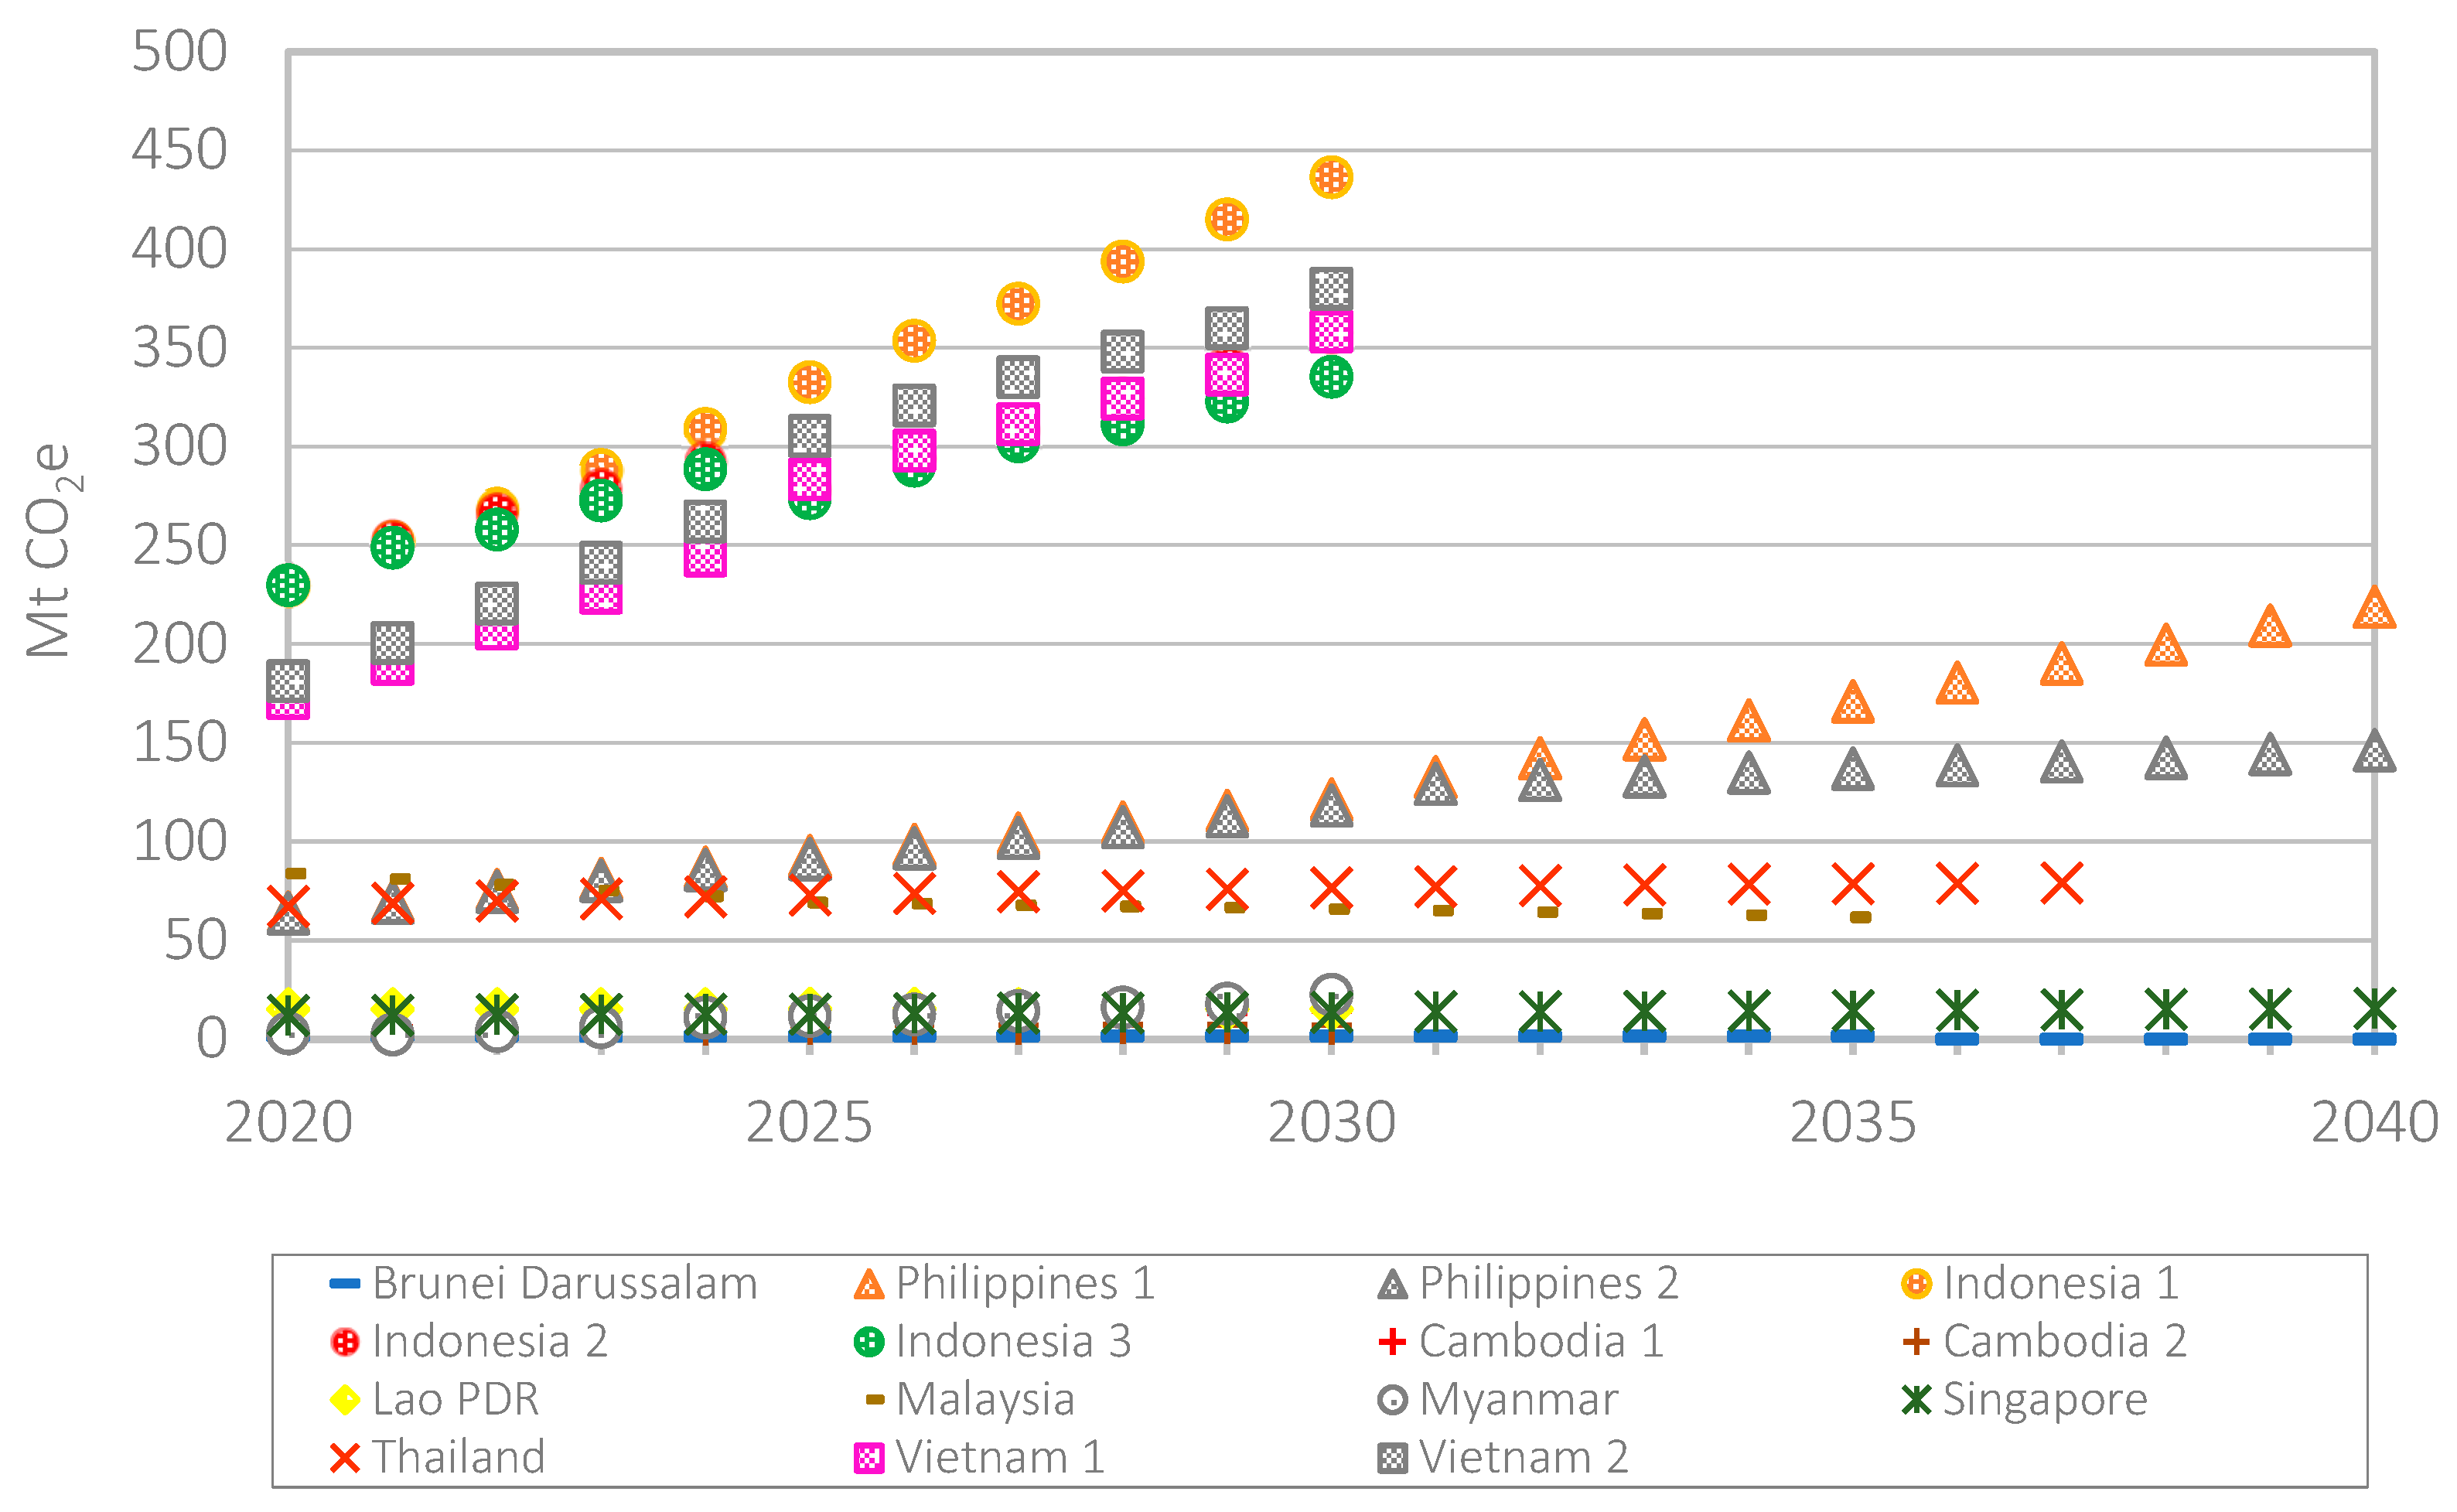
Figure 8.
Projection of emission intensity (CO2e/MWh) in AMS.
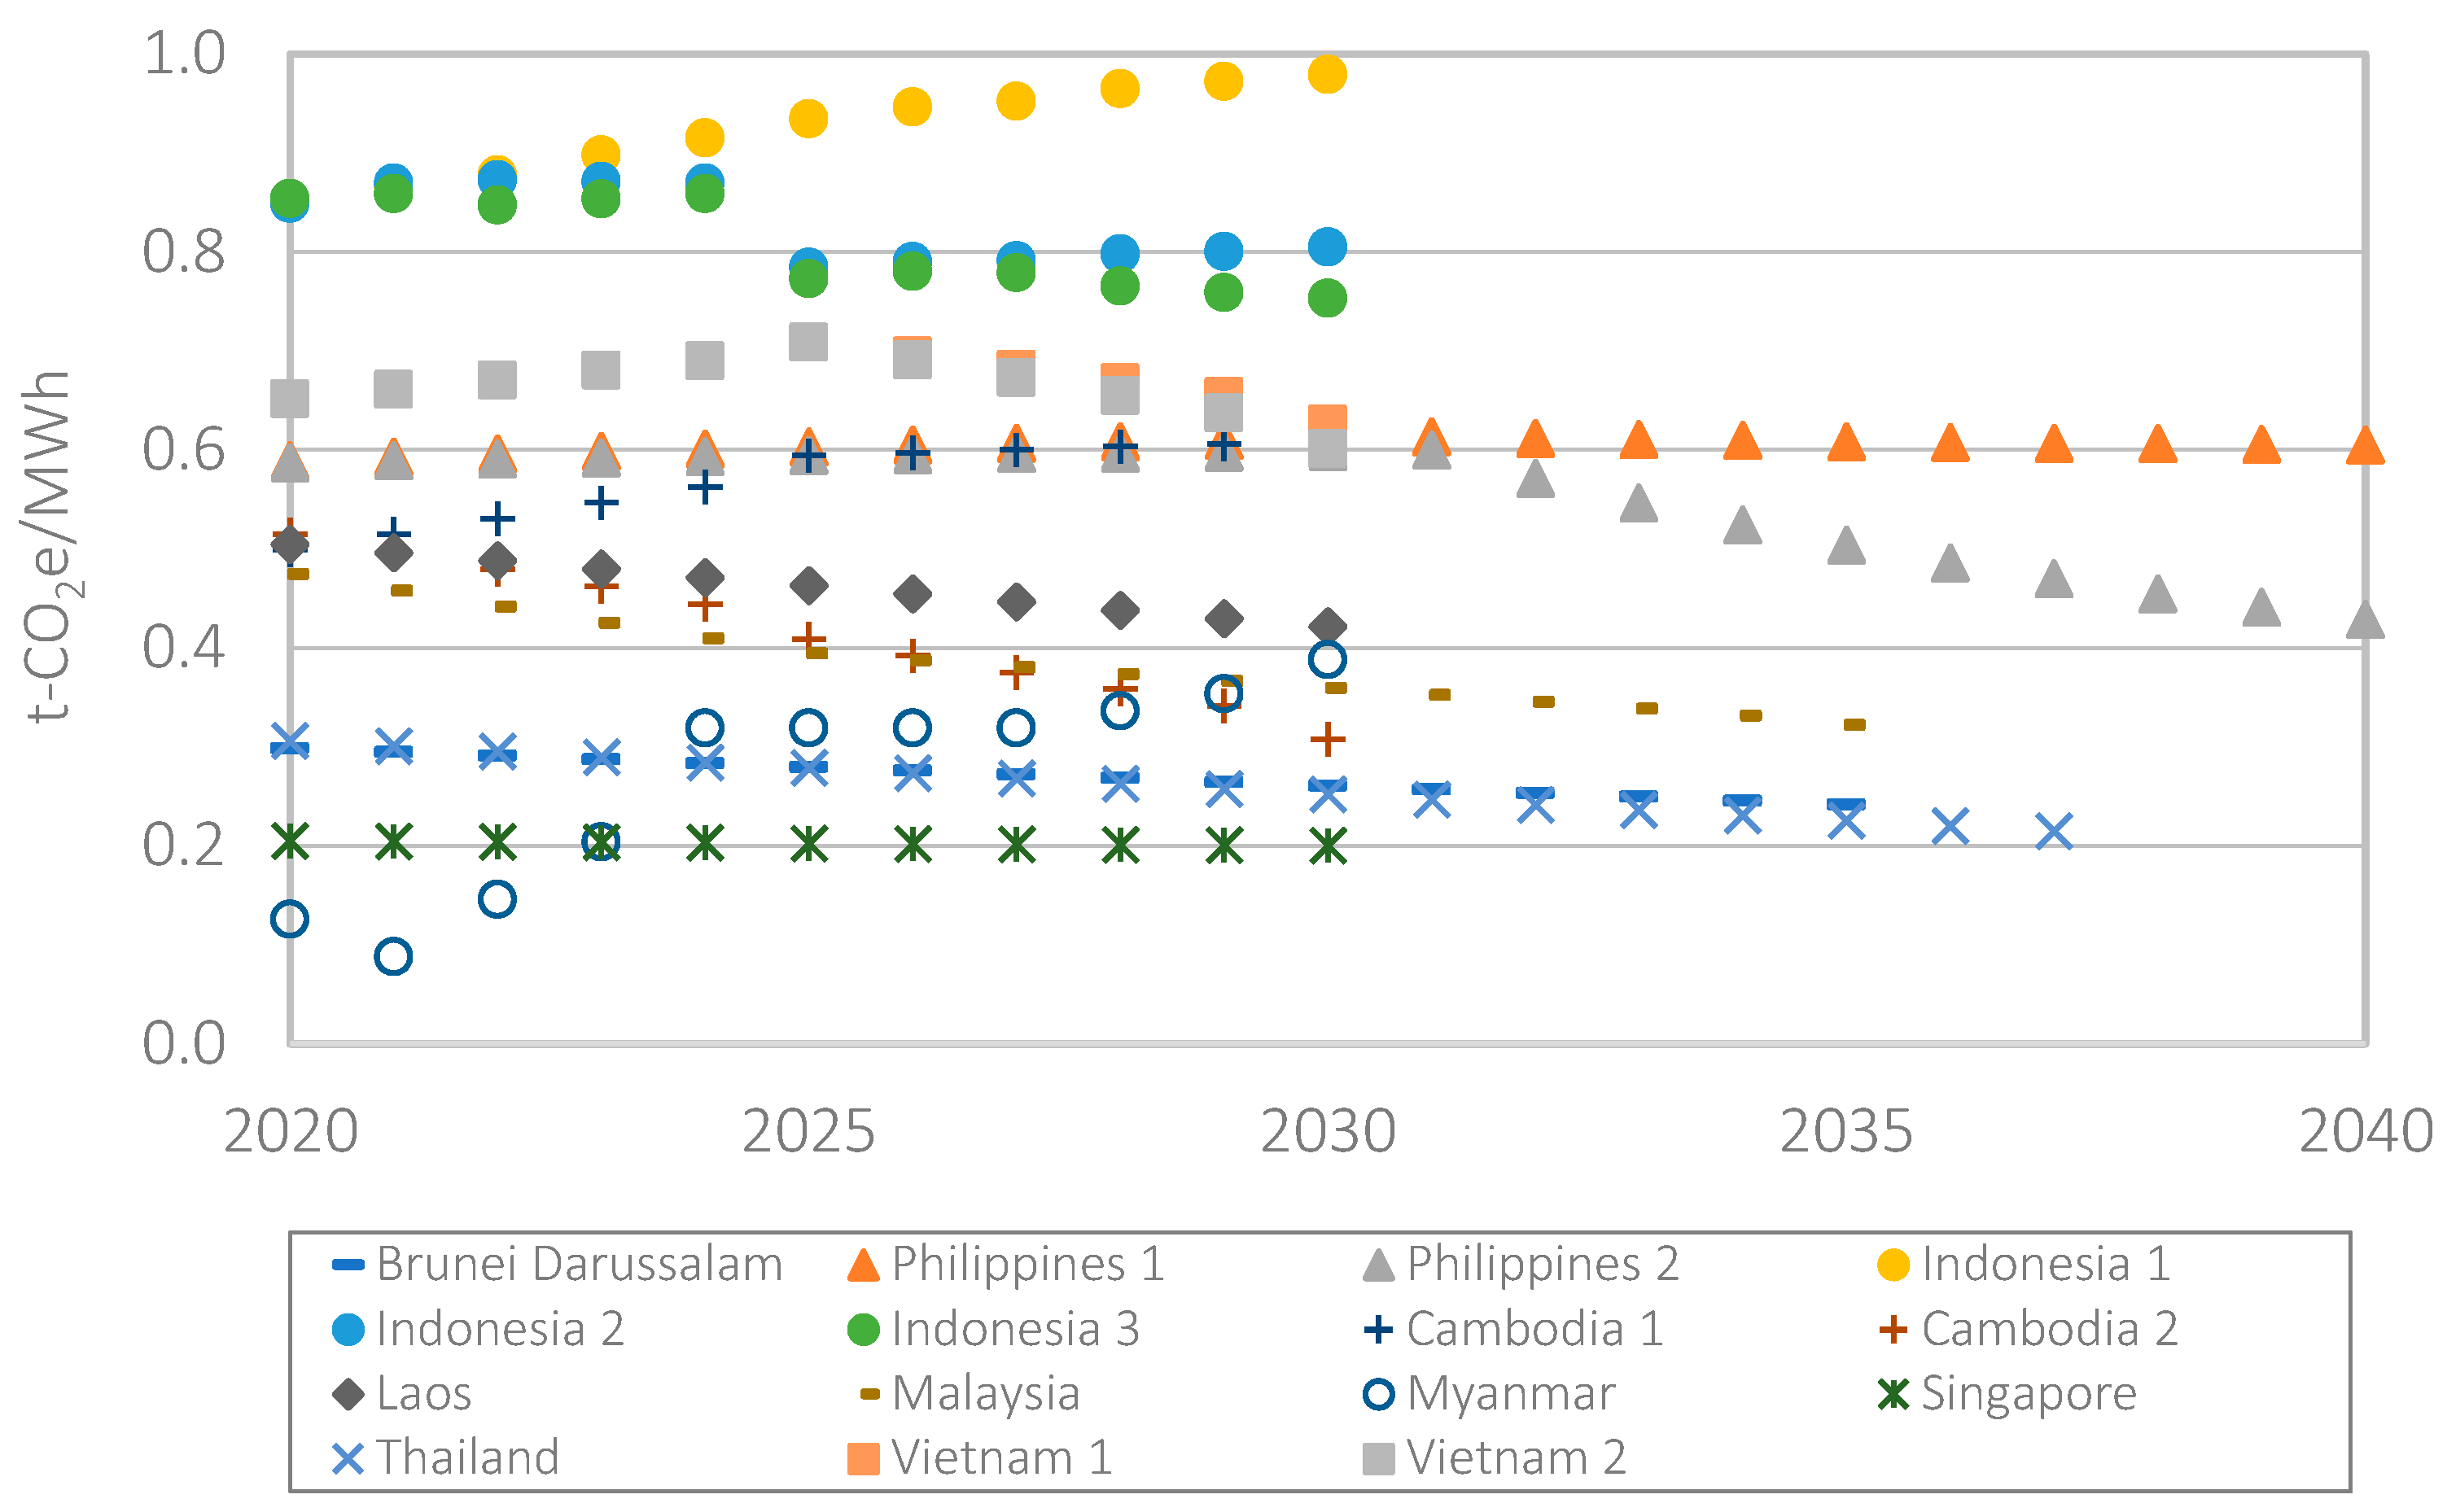
Figure 9.
Projection of CO2e per capita in AMS.
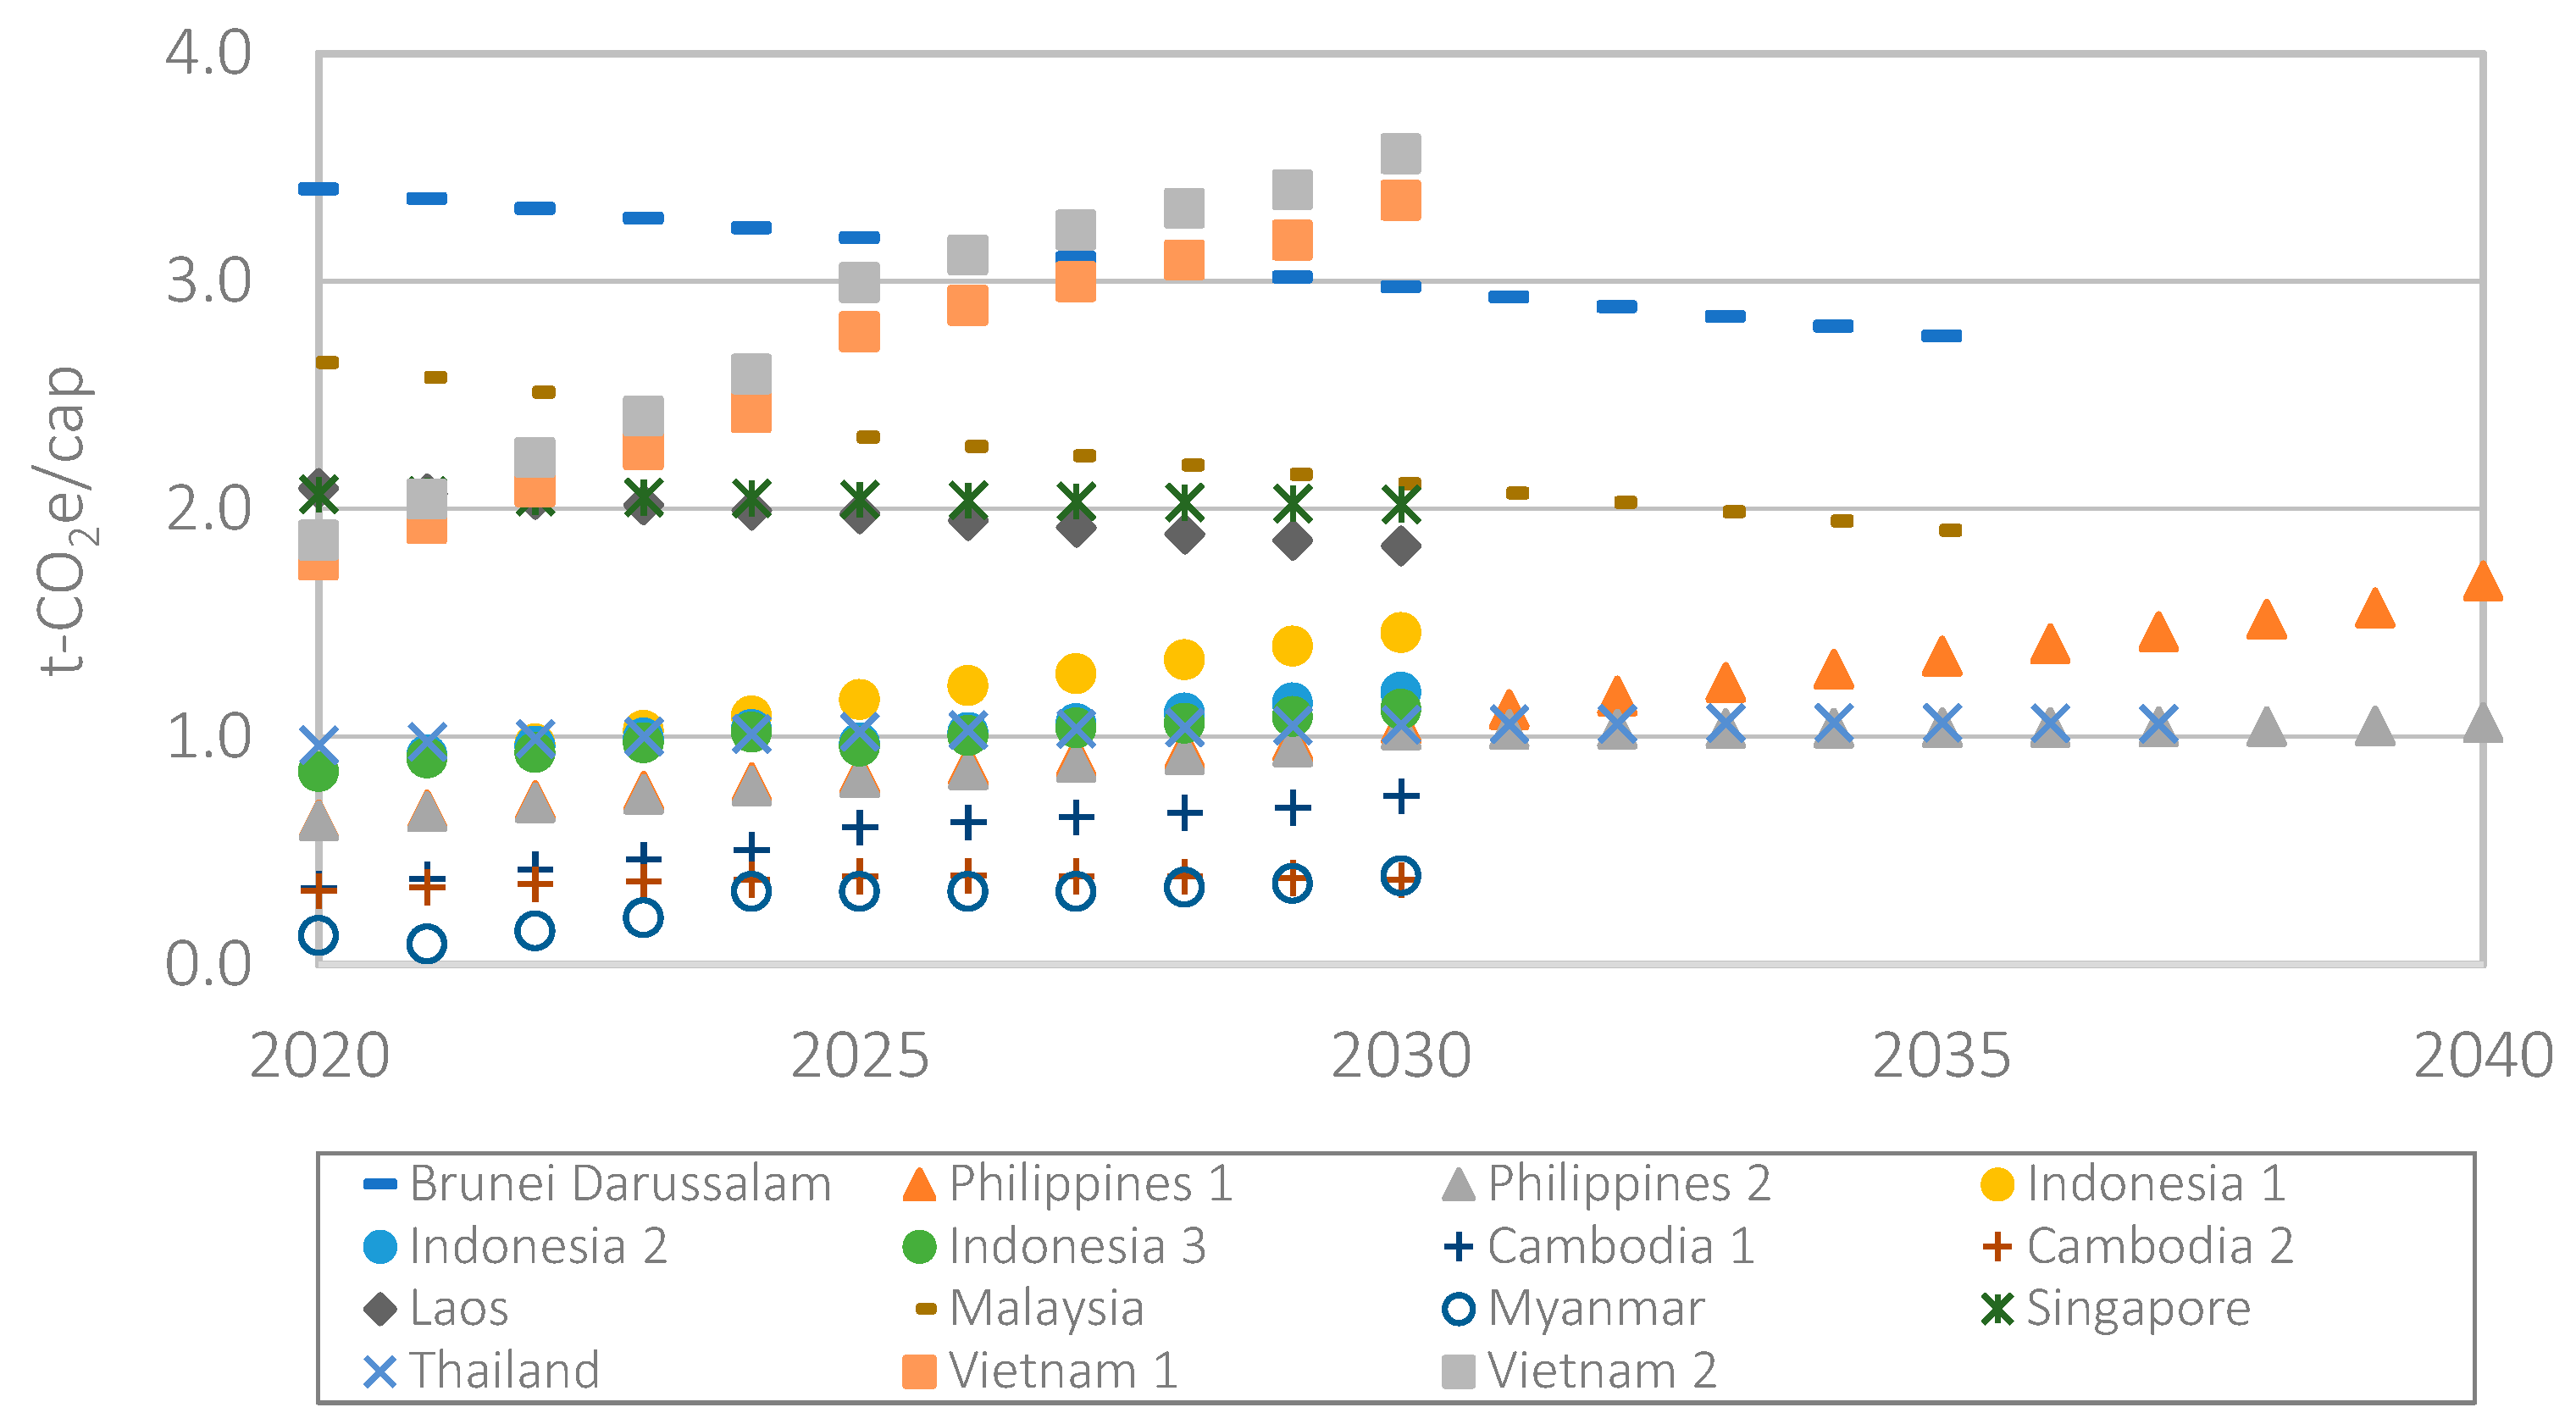
Figure 10.
Projection of CO2e per GDP in AMS.
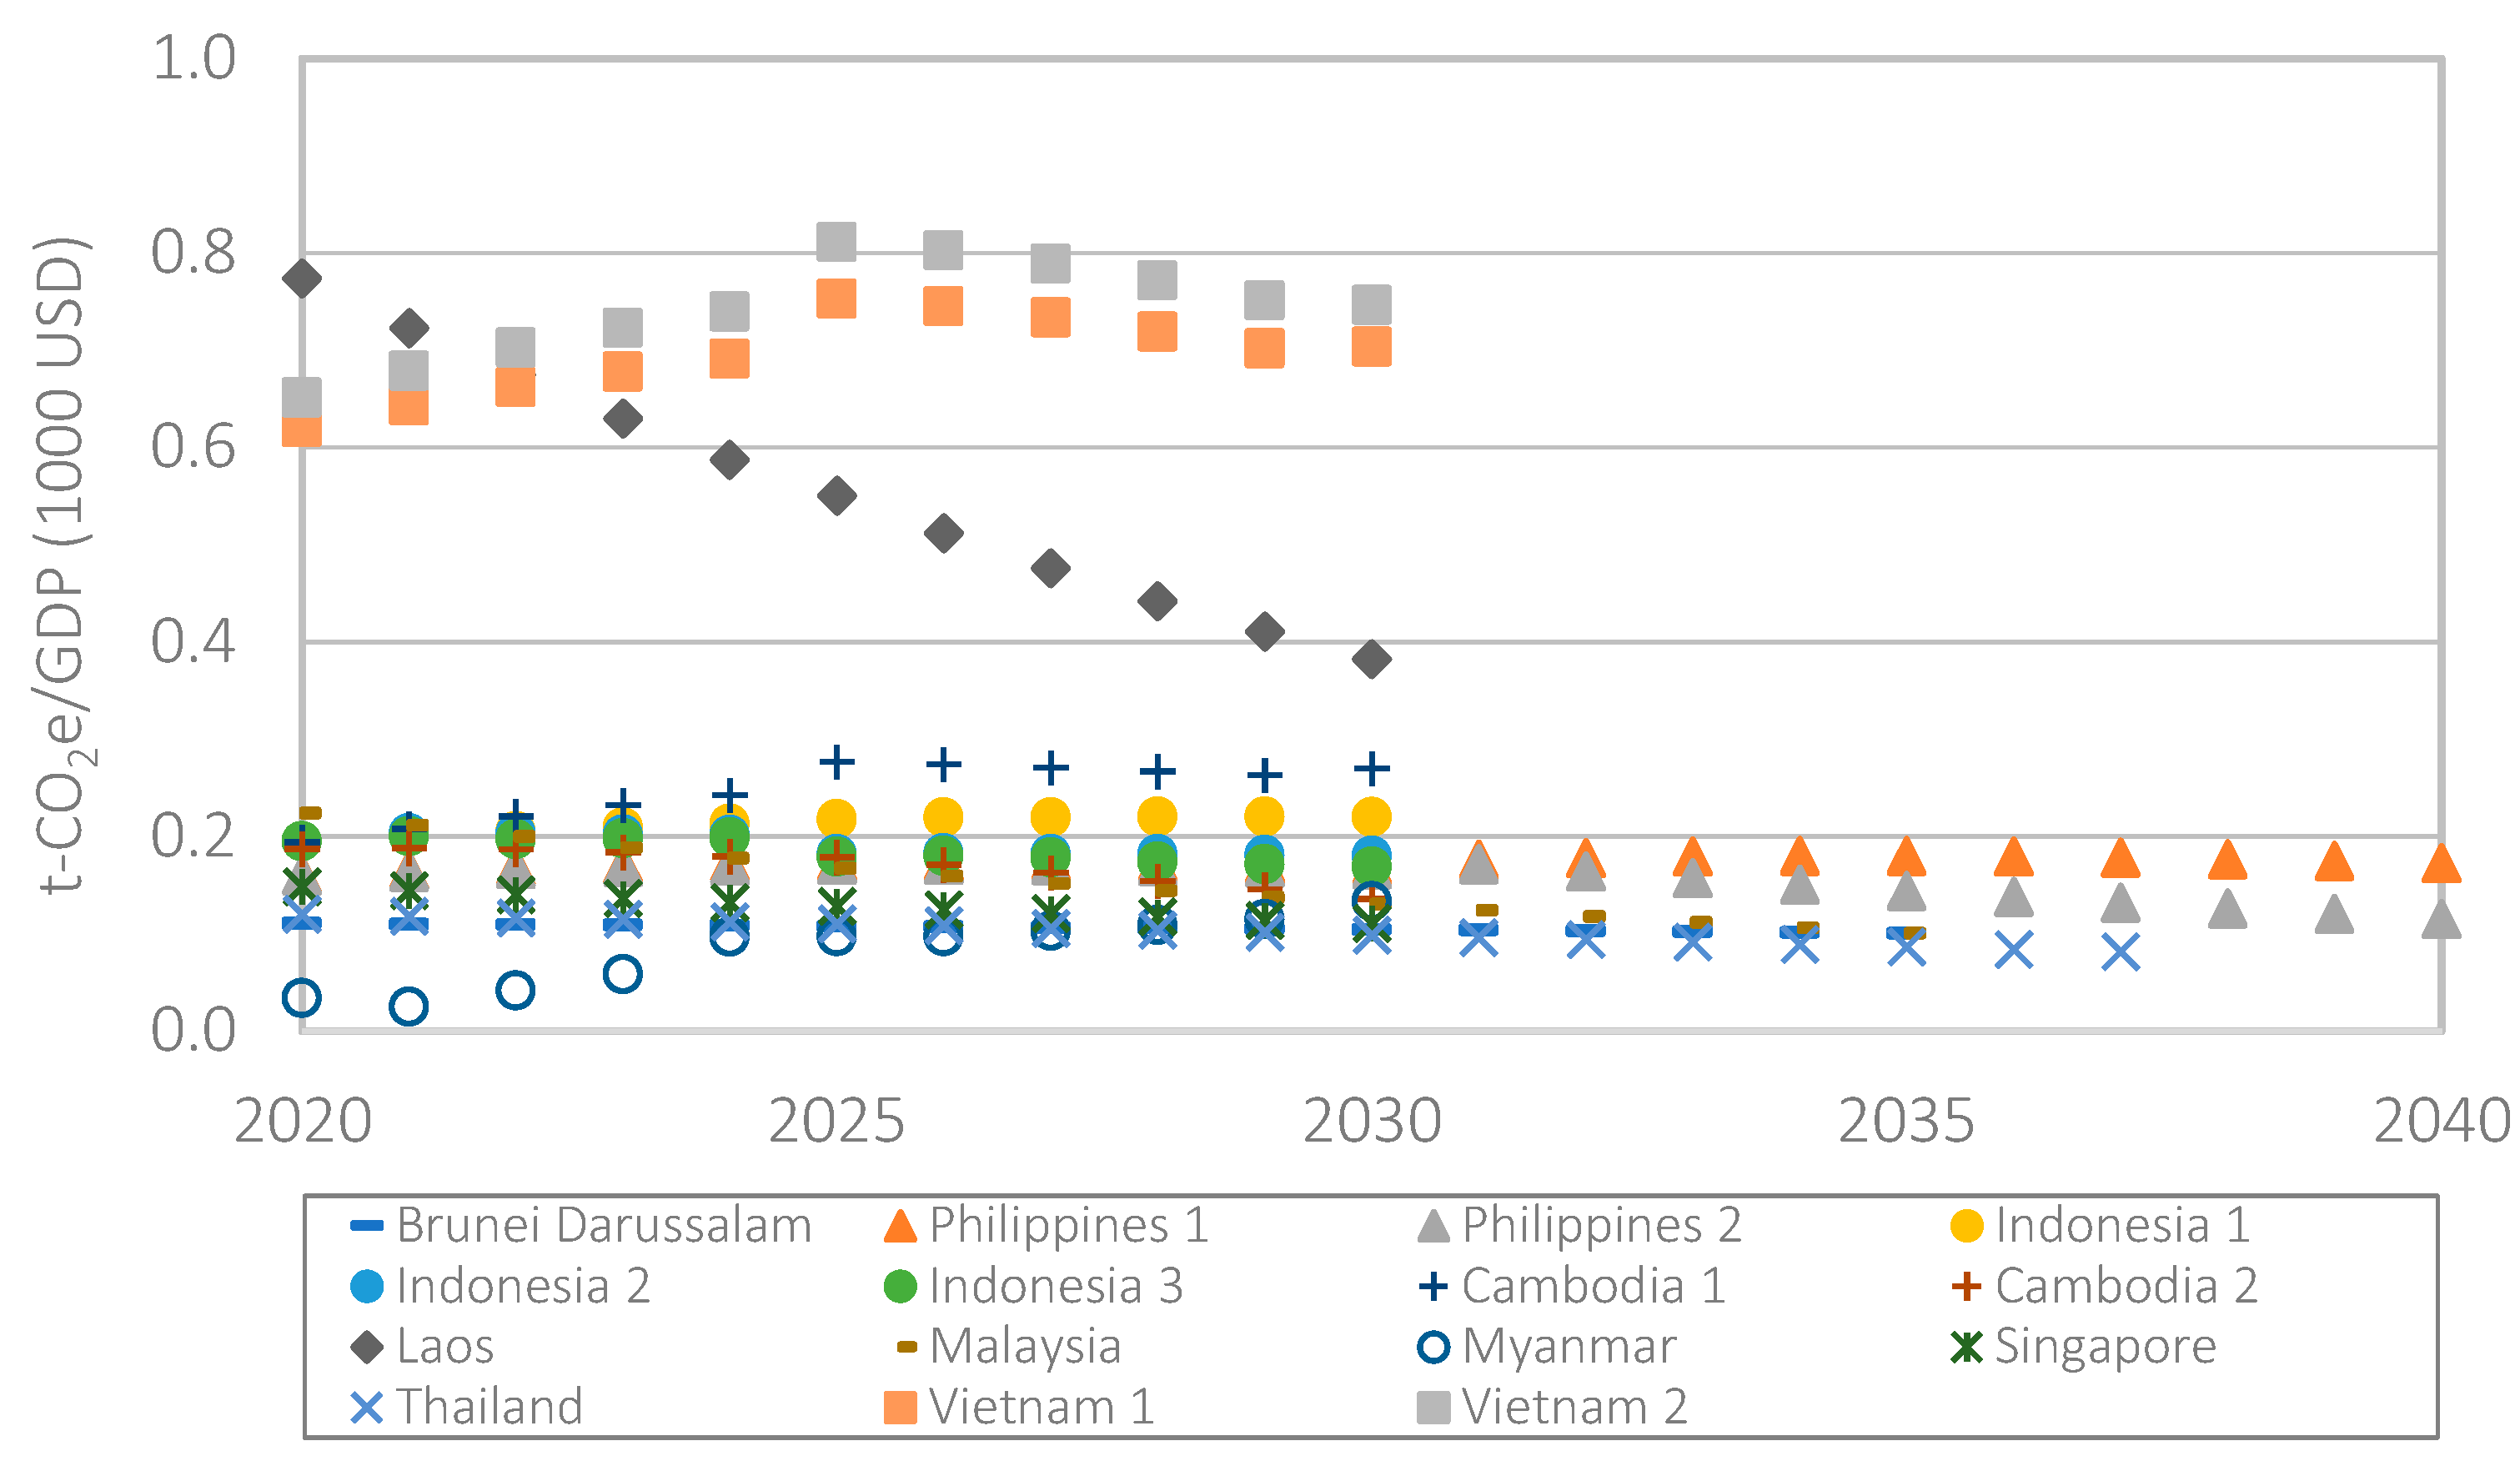
Figure 11.
Projection of energy intensity (MWh/cap) in AMS.

Figure 12.
Projection of energy intensity (MWh/GDP) in AMS.

Figure 13.
Relationship between electricity generation (GWh), emission intensity (CO2e/GWh), and energy intensity (MWh/cap) in AMS (2020).
Figure 13.
Relationship between electricity generation (GWh), emission intensity (CO2e/GWh), and energy intensity (MWh/cap) in AMS (2020).
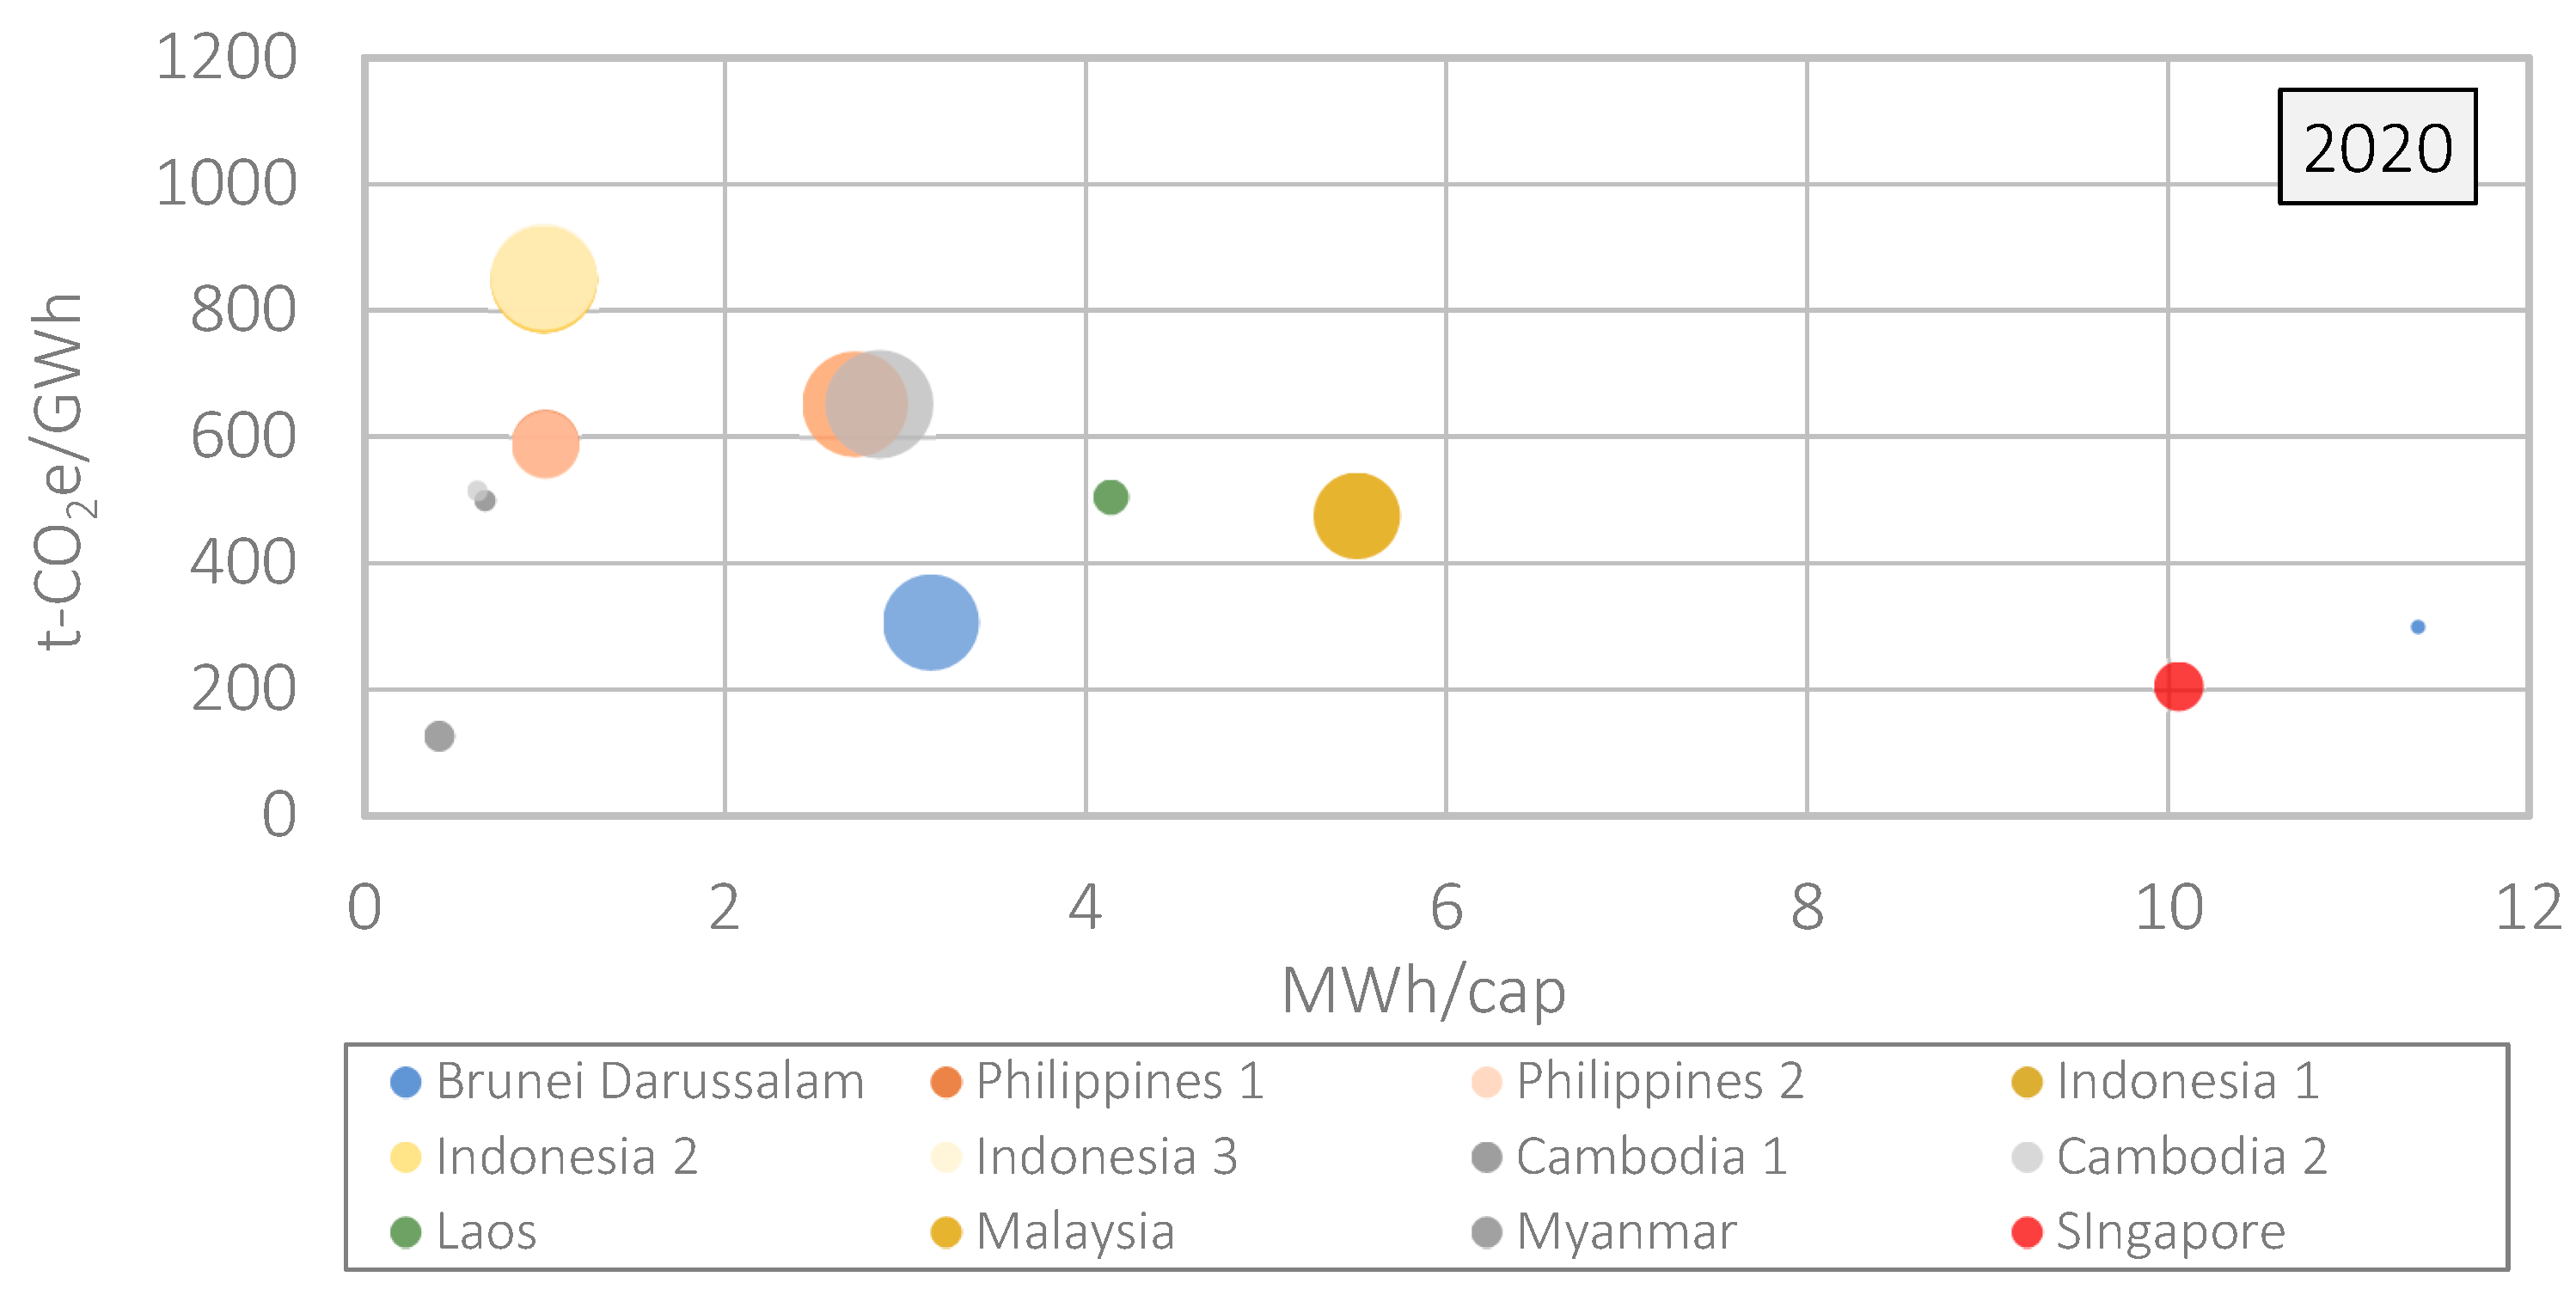
Figure 14.
Relationship between electricity generation (GWh), emission intensity (CO2e/GWh), and energy intensity (MWh/cap) in AMS (2030).
Figure 14.
Relationship between electricity generation (GWh), emission intensity (CO2e/GWh), and energy intensity (MWh/cap) in AMS (2030).

Figure 15.
Projection of AMS carbon emissions level in 2030.

Table 1.
AMS’s national strategy and commitment to carbon emission targets.
| Country | Target | Reference |
|---|---|---|
| Brunei Darussalam | RE 30% by 2035 | [24] |
| Philippines 1 (Reference Scenario) | RE 34.13%, coal 58.36%, oil 0.62%, gas 6.89% by 2030 RE 26.31%, coal 55.34%, oil 0.31%, gas 18.03% by 2040 | [25] |
| Philippines 2 (Clean Energy Scenario) | RE 31.9%, coal 56.16%, oil 0.63%, gas 11.31% by 2030 RE 38.15%, coal 34.22%, oil 0.33%, gas 27.29% by 2040 | [25] |
| Indonesia 1 (Business as Usual) | RE 8.21%, coal 78.71%, oil 0.41%, gas 12.67% by 2030 | [26] |
| Indonesia 2 (Optimal Scenario) | RE 22.83%, coal 64.09%, oil 0.41%, gas 12.67% by 2030 | [26] |
| Indonesia 3 (Low Carbon Scenario) | RE 24.78%, coal 59.37%, oil 0.4%, gas 15.44% by 2030 | [26] |
| Cambodia 1 (Existing Scenario) | RE 32.8%, coal 52.2%, oil 15% by 2020 RE 26%, coal 64.8%, oil 9.2% by 2025 RE 25.4%, coal 67.5%, oil 7.2% by 2030 | [27] |
| Cambodia 2 (Aggressive Scenario) | RE 35.8%, coal 56%, oil 8.1% by 2020 RE 53.3%, coal 46.4% by 2025 RE 65%, coal 35% by 2030 | [27] |
| Laos | RE 70%, coal 30% by 2030 | [28] |
| Malaysia | RE 31%, coal 31.38%, oil 0.55%, gas 37.07% by 2025 RE 40%, coal 22.38%, oil 0.55%, gas 37.07% by 2035 | [29] |
| Myanmar | RE 74.1%, coal 3.4%, gas 22.4% by 2021 RE 64%, coal 23.3%, gas 12.7% by 2024 RE 67.7%, coal 24%, gas 8.3% by 2027 RE 62.3%, coal 29.5%, gas 8.2% by 2030 | [30] |
| Singapore | RE 3% (2 GWp by solar) by 2030 | [31] |
| Thailand | RE 36%, coal 11%, gas 53% by 2037 | [32] |
| Vietnam 1 (Base Load Scenario) | RE 34.3%, coal 58.73%, gas 6.97% by 2025 RE 28.79%, coal 49.2%, gas 22.01% by 2030 | [33] |
| Vietnam 2 (High Load Scenario) | RE 34.3%, coal 58.73%, gas 6.97% by 2025 RE 28.79%, coal 49.2%, gas 22.01% by 2030 | [33] |
| Country | Electricity Used (TWh) | RE Share on Energy Mix (%) | Population (Thousand) | GDP (Billions USD) | Total Area (Sq. Km) |
|---|---|---|---|---|---|
| Brunei Darussalam | 5.3 | 0.5 | 433.3 | 13.5 | 5765.0 |
| Philippines | 92 | 1.0 | 108,116.6 | 376.8 | 300,000.0 |
| Indonesia | 268.1 | 12.4 | 270,625.6 | 1120.0 | 1,913,578.7 |
| Cambodia | 11.5 | 3.5 | 16,486.5 | 26,7 | 181,035.0 |
| Laos | 7.7 | 71.6 | 7169.5 | 18.8 | 236,800.0 |
| Malaysia | 168.3 | 0.5 | 31,949.8 | 364.7 | 331,388.0 |
| Myanmar | 15.1 | 0.1 | 54,703.6 | 68.8 | 676,576.0 |
| Singapore | 52.9 | 0.3 | 5703.6 | 374.4 | 728.0 |
| Thailand | 193.4 | 19 | 69,625.6 | 544.1 | 513,139.0 |
| Vietnam | 226 | 6 | 96,462.1 | 329.5 | 331,317.0 |
Table 3.
Changes in electricity production (GWh), emission intensity (CO2e/GWh), and electricity production per capita (MWh/Cap) in 2030 and 2020.
Table 3.
Changes in electricity production (GWh), emission intensity (CO2e/GWh), and electricity production per capita (MWh/Cap) in 2030 and 2020.
| Country | Δ (2030–2020) | ||
|---|---|---|---|
| GWh | t-CO2e/GWh | MWh/cap | |
| Brunei Darussalam | 572 | −37.9 | - |
| Philippines 1 | 98,721 | 20.4 | 0.65 |
| Philippines 2 | 98,086 | 10.7 | 0.65 |
| Indonesia 1 | 174,852 | 130.1 | 0.49 |
| Indonesia 2 | 174,852 | −44.0 | 0.49 |
| Indonesia 3 | 175,852 | −100.6 | 0.49 |
| Cambodia 1 | 12,424 | 113.1 | 0.54 |
| Cambodia 2 | 13,111 | −206.9 | 0.58 |
| Laos | 6005 | −83.3 | 0.22 |
| Malaysia | 27,635 | −148.9 | - |
| Myanmar | 43,244 | 275.8 | 0.70 |
| Singapore | 9305 | −4.3 | - |
| Thailand | 83,192 | −53.6 | 1.02 |
| Vietnam 1 | 307,000 | −25.4 | 2.63 |
| Vietnam 2 | 354,000 | −50.4 | 3.06 |
Disclaimer/Publisher’s Note: The statements, opinions and data contained in all publications are solely those of the individual author(s) and contributor(s) and not of MDPI and/or the editor(s). MDPI and/or the editor(s) disclaim responsibility for any injury to people or property resulting from any ideas, methods, instructions or products referred to in the content. |
© 2023 by the authors. Licensee MDPI, Basel, Switzerland. This article is an open access article distributed under the terms and conditions of the Creative Commons Attribution (CC BY) license (https://creativecommons.org/licenses/by/4.0/).
Share and Cite
MDPI and ACS Style
Triani, M.; Tambunan, H.B.; Dewi, K.; Ediansjah, A.S. Review on Greenhouse Gases Emission in the Association of Southeast Asian Nations (ASEAN) Countries. Energies 2023, 16, 3920. https://doi.org/10.3390/en16093920
AMA Style
Triani M, Tambunan HB, Dewi K, Ediansjah AS. Review on Greenhouse Gases Emission in the Association of Southeast Asian Nations (ASEAN) Countries. Energies. 2023; 16(9):3920. https://doi.org/10.3390/en16093920
Chicago/Turabian StyleTriani, Meiri, Handrea Bernando Tambunan, Kania Dewi, and Addina Shafiyya Ediansjah. 2023. "Review on Greenhouse Gases Emission in the Association of Southeast Asian Nations (ASEAN) Countries" Energies 16, no. 9: 3920. https://doi.org/10.3390/en16093920
Note that from the first issue of 2016, this journal uses article numbers instead of page numbers. See further details here.