Article

Role of Foreign Phases, Synergistic Effects, and Morphology in the HER Performance of Trimetallic Pentlandites with Non-Equimolar Co:Fe:Ni Ratio

Faculty of Materials Science and Ceramics, AGH University of Krakow, al. Mickiewicza, 30-059 Krakow, Poland
*
Author to whom correspondence should be addressed.
Energies 2024, 17(10), 2261; https://doi.org/10.3390/en17102261
Submission received: 30 March 2024 / Revised: 19 April 2024 / Accepted: 30 April 2024 / Published: 8 May 2024
(This article belongs to the Special Issue Advances in Hydrogen Energy III)

Abstract

:
Since pentlandites are among the most promising catalysts for hydrogen evolution reactions (HER), in this study, we investigated the influence of different cobalt, iron, and nickel substitutions in the cationic sublattice and the form of the material (powder, ingot, sintered pellet) on catalytic performance. This complements previous results regarding a multi-component approach in these chalcogenides. It was shown that in the case of sulfur-rich pentlandites with a non-equimolar ratio of Co, Fe, and Ni, the impact of intrinsic material properties is smaller than the surface-related effects. Among powder forms, catalysts based on a combination of Fe and Co perform the best. However, in volumetric forms, extremely high contents of individual metals are favorable, albeit they are associated with active precipitations of foreign phases. The presence of these phases positively affects the recorded currents but slows down the reaction kinetics. These findings shed light on the nuanced interplay between material composition, form, and HER properties, offering insights for tailored catalyst design.

1. Introduction

Nowadays, humanity faces two of the most important non-social challenges: environmental protection and energy sourcing. Despite significant advancements, the predominant reliance on coal, oil, and gas for energy extraction continues to impose substantial environmental costs, primarily in the form of greenhouse gas emissions (e.g., CO2). One of the most promising alternatives for energy generation is pure hydrogen, of which combustion via fuel cells results in water as a byproduct. However, the current methods of hydrogen production, particularly through the steam conversion of hydrocarbon fuels (such as propane, gasoline, diesel, methanol, or ethanol), pose challenges due their high operating temperatures and associated environmental pollution [1,2,3].
To mitigate these challenges and obtain green hydrogen both in terms of low manufacturing contamination and chemical purity, water electrolysis emerges as a viable solution. This process can be divided into two half reactions: the hydrogen evolution reaction (HER) at the cathode and oxygen evolution reaction (OER) at the anode [1,4,5,6,7,8,9]. Key parameters for assessing HER characteristics, such as reaction onset (overpotential, η) and the so-called Tafel slope, provide insight into electrode reaction mechanisms and kinetics. In particular, the overpotential value is so far accepted in the literature as an indicator for comparing across different material classes to enable an assessment of their relative efficiency in terms of HER [1,4,5,6]. Another benchmarking parameter is the aforementioned Tafel slope, which represents both the kinetic ratio and the main kinetic mechanism of hydrogen evolution. The generally accepted mechanism of HER in acidic media consists of three elementary reaction steps [10,11,12]:
Volmer: H3O+ + e → Hads + H2O (σ = 120 [mV dec−1])
Heyrovsky: Hads + H+ + e → H2 (σ = 40 [mV dec−1])
Tafel: Hads + Hads → H2 (σ = 30 [mV dec−1])
The Volmer step describes the reduction of a proton into hydrogen adsorbed on a free active site, followed either by the evolution of molecular hydrogen through proton transfer (Heyrovski step) or the recombination of two adsorbed protons (Tafel step). It is accepted that at low overpotential, the Volmer step is followed by parallel Heyrovski and Tafel steps, while at a higher overpotential, the Tafel part is negligible. As each of these steps may be a kinetic limiting factor for the whole HER process, voltammetry techniques are typically used as a tool for establishing the main kinetic mechanisms. It is generally accepted that lower Tafel slopes indicate a better catalyst. Similarly, sometimes the exchange current density j0 is determined (which is indirectly necessary to determine the Tafel slope). If the exchange current density is high, it indicates that the surface of the electrode is more active [10,11,12].
Considering both the overpotential and the Tafel slope values, platinum remains the benchmark material in this field. It reaches overpotential at a current density of –10 [mA/cm2], an (η10) of ~29 [mV] [13] and a Tafel slope of −29 [mV dec−1], indicating the Volmer–Tafel mechanism of hydrogen evolution. Despite its favorable properties, its cost and limited availability drive the exploration for alternative materials, such as CFeCoP reaching an η10 of 132, for example [mV] [14]. On the other hand, known materials are being modified, with nanostructuring achieving very good catalytic parameters. For instance, MoS2 nanosheets exhibit a very low Tafel slope at the level of 95 [mV dec−1] [13]. Another interesting structure in the field of hydrogen production is pentlandite, with a stoichiometry of TM9S8, where “TM” stands for transition metals (Co, Fe, Ni). In natural environments, materials with this stoichiometry can crystallize in a variety of substructures, from monoclinic (pyrothene) through to orthorhombic to cubic structures (pentlandite), with the latter occurring naturally as either Co9S8 or (Fe,Ni)9S8 [4,5]. Bimetallic Fe4.5Ni4.5S8 pentlandite, in particular, exhibits remarkable performance, even in rock-like geometry, with a recorded η10 at the level of 190 [mV] and Tafel slopes of 72 [mV] [13]. It is important to note that in the case of pentlandites, especially those rich in sulfur, the kinetics of the HER reaction are mainly associated with the so-called activation process [15]. This process is linked to the formation of sulfur vacancies, which expose bimetallic species with exceptionally favorable intermetallic distances and provide very proton-preferred active sites.
Pentlandite’s properties still differ from those of noble metals, but their high potential for application drives continuous efforts to enhance their catalytic performance. These efforts not only include nanostructuring and surface engineering but also investigating bulk materials. This approach offers significant simplification and cost reduction in production processes.
One of the simplest ways to enhance the catalytic performances of materials involves the strategic modification of their chemical composition, which influences both their structural and electronic properties. Previous research on pentlandites has explored various approaches, including a multicomponent approach [16,17,18], the dissolution of additional selenium into the sulfur sublattice [4,16,17], and initial attempts to optimize catalytic performance by modifying the cationic sublattice [19,20]. For example, substituting sulfur with selenium in pentlandite structures has been shown to significantly reduce the overpotential η120 from 489 [mV] for TM9S8 to 416 [mV] for TM9S7Se [21]. Similarly, tailoring the cationic sublattice has resulted in notable improvements, such as achieving an overpotential η50 of 378 [mV] for Fe2Co4Ni3S8 [19].
On the other hand, most of the research to date has focused on powder catalysts anchored to conductive substrates [22,23,24,25,26,27]. However, emerging research indicates that it is also feasible to fabricate, in bulk, materials that exhibit comparable or even superior electrocatalytic properties [4,13,16,18,20,28]. The form of the material significantly affects its transport properties, surface development, and the number of active sites, directly impacting electrochemical performance. Assemblies employing powder catalysts anchored to conductive electrodes usually feature a highly developed surface and a large number of active centers, leading to high electrochemical surface area (ECSA) values. In the case of sulfur-rich pentlandites, the powder catalyst approach causes an increased formation of sulfur vacancies, which are crucial for creating active sites and enhancing overall activity towards HER [15,16,21,29]. In turn, pentlandites utilized in volumetric forms exhibit reduced surface development and a limited ability to form sulfur vacancies. Yet, they may demonstrate remarkable performance due to improved charge-transfer abilities. Additionally, material properties stemming from intrinsic factors such as chemical composition and electronic structure begin to play a dominant role [19,21]. It is also worth investigating the influence of randomly oriented crystallites resulting from spontaneous crystallization (ingot samples) as well as the impact of thermal processing (sintered pellets) on microstructure and overall electrochemical properties. For instance, TM9S8 in powder form exhibits an overpotential η120 of 489 [mV], while in the rock-like sintered form, it shows an η120 of 342 [mV] [7].
Hence, it has been demonstrated that applying both strategies in materials design, namely tuning the chemical composition and modifying material form, holds promise for enhancing the catalytic properties of pentlandites. In this study, our aim was to integrate both approaches in designing cathodic materials for the HER process. We explored various ternary S-rich pentlandites with different compositions of individual metals, examining them in the forms of powders, ingots, and sintered pellets. This combined approach enabled us to gain a comprehensive understanding of the relationships between chemical composition, electronic structure, microstructure, and catalytic performance.

2. Materials and Methods

The desired elements were weighed into self-prepared quartz ampoules in the form of powders (Co—99.8% Alpha Aesar, Haverhill, MA, USA); Ni—99.8% Alpha Aesar) and granules (Fe—99.98% Alpha Aesar; S—99.999%) and sealed under quasi-vacuum conditions (10−3 [atm]). The samples were then pre-homogenized and synthesized in a tube furnace in a two-stage heat treatment process. The first stage consisted of heating the samples (heating rate: 1 [°Cmin−1]) to 1050 [°C] and annealing at this temperature for 24 h. The second stage included cooling the samples to 500 [°C] and annealing at this temperature for 72 h, which was followed by quenching in tap water at room temperature.
In this work, we focused on several ternary systems with varying cobalt, nickel, and iron contents, testing them in the form of powders, ingots, and sintered pellets. All the considered compositions, along with the abbreviations used in the subsequent sections of the work, are presented in Table 1.
The powder samples were obtained by grinding the synthesized ingots. For this purpose, a standardized milling procedure was employed using a planetary mill, allowing for the production of powders with a unimodal grain size distribution at the level of 0.6–2.5 [µm] (examined by Dynamic Light Scattering measurements; Figure S1). The ingot samples were fabricated by cutting off a flat piece of the samples after synthesis, without any additional processing. Pellet samples were produced by sintering as-prepared powders using the inductive hot pressing (IHP) method. The detailed sintering conditions are presented in the Supplementary Materials section. The ingots and pellet samples prepared in these ways were subjected to density tests using the Archimedes principle, and the volumetric measurements presented in Supplementary Materials section (Table S1 [30,31]). Structural characterizations included X-ray diffraction (XRD, Empyrean PANanalytical apparatus (CuKa radiation) equipment, Malvern Panalytical Ltd., England, UK) and scanning electron microscopy (SEM with an energy disperse X-ray spectroscopy (EDX) attachment, Thermoscientific Fischer Phenom XL scanning electron microscope equipped with EDX analyzer, ThermoFisher Scientific Inc., Carlsbad, CA, USA) studies that were applied at all the preparation stages (powder, ingots, sinters) to assess the chemical and phase compositions of the samples. The pre-milled powders were also measured in an inductively coupled plasma optical emission spectroscopy study (ICP-OES, PerkinElmer Optima 7300DV spectrometer, Shelton, Conn., USA; samples mineralized in concentrated HNO3 at a temperature of 523 [K] and a pressure of 8.1 × 10⁶ [Pa]) to determine the molar ratios between their elements.
The results of the structural characterizations are presented in the Supplementary Materials (Figures S3–S5; Table S2) and in Figure 1 (XRD studies). As can be observed, the materials were directly synthesized with close-to-equimolar proportions of cations and were single-phase products with the desired pentlandite structure. However, deviations, particularly in the samples rich in Fe or Ni, indicate the presence of additional sulfur-containing phases. It is also evident that the sintering process leads to further phase decomposition, as evidenced by the increased amounts of nickel and iron sulfide precipitations for Ni-rich and Fe-rich samples. An exception is the Co-rich samples (611 samples), which exhibit high stability and phase homogeneity in all the considered forms. Based on the SEM + EDX investigations, it can be stated that the pentlandite-based areas of the individual surfaces are characterized by unimodal element distributions with minor precipitations of iron and nickel sulfides (Figures S3–S5). It is worth mentioning at this point that this paper does not describe the study of a material with equal amounts of cations (Co3Fe3Ni3S8), since it this been described in detail in previous works [13,16,17].
The procedure of preparing working electrodes using the obtained materials, along with a comprehensive description of the measurement protocols, are provided in the Supplementary Materials. Electrochemical measurements were performed in the three-electrode system, with pentlandite acting as working electrode, a platinum black (Pt + Pt black) serving as a counter-electrode, and a silver chloride electrode (Ag/AgCl 3M KCl) serving as a reference electrode. Measurements were performed with 0.5M of H2SO4 as the electrolyte on the electrochemical measurement equipment (MTM-ANKO) at room temperature.
In the literature it is acceptable to compare the efficiency of HER processes as the overpotential needed to achieve a current value of −10 [mA/cm2] (η10), both for measurements normalized to the electrochemical surface active area (ECSA) and to the geometric surface. Due to the recorded current values, as well as the non-zero cathodic currents (associated both with charge accumulation on the surfaces and the presence of foreign phases), the results in terms of the ECSA were compared for specific values of −100 and −500 [mA/cm2] for ingots, −25 and −100 [mA/cm2] for pellets, and −50 and −250 [mA/cm2] for powders (denoted as η25, η50, η100, η250, and η500, respectively). Additionally, as the recorded current densities for powder catalysts as a function of geometric area are very low, overpotential values of −5 [mA/cm2] were taken into account.
To gain even more insight into the materials’ electrochemical performance, ab initio studies were performed by utilizing the density functional theory (DFT) using the Vienna ab initio calculation package [32,33,34]. Calculations were performed to obtain information about the density of the states and to evaluate the so-called electronic structure descriptors, such as the d- and p-band centers of TMs and S, respectively [18,35,36,37]. The pentlandites with corresponding stoichiometries were modelled in VESTA [38]. The structures were then relaxed by using the Perdew–Burke–Ernzerhof (PBE) exchange–correlation functional [39],a plane-wave cut-off energy of 300 eV, 3 × 3 × 3 k-point mesh, and energy convergence criteria set as 10−5 eV and 2∙10−2 eVÅ−2 for the electronic and ionic relaxations, respectively. Atomic spin orientation was included, and the initial magnetic moments were set to 2.5, 3.0, 2.0, and 1.0 for Co, Fe, Ni, and S, respectively. Self-consistent-field calculations with 10−6 eV convergence criterion were then used to evaluate the total energy of the systems. The total energy per atom Δ E f o r m was calculated by using Equation (1) and used to assess the stability of the materials:
Δ E f o r m = E t o t , m a t e r i a l i = 1 n N i E t o t , e l e m e n t n ,  
where E t o t , m a t e r i a l total energy of the system, N i —number of atoms in the structure, and E t o t , e l e m e n t —total energy of the Co, Fe, Ni, and S subsystems. The density of states (DOS) was obtained by using the same k-point mesh, while the partial density of states (PDOS) was used to evaluate the electronic structure descriptors using Equations (2) and (3):
p b c = i = 1 n p i E e V , i i = 1 n p i ,  
d b c = i = 1 n d i E e V , i i = 1 n d i ,  
where p i ,   d i corresponds to the probability of finding electrons in the p and d orbitals of S and TMs, respectively; E e V , i energy that corresponds to the probability of finding an electron at an individual orbital.

3. Results and Discussion

3.1. Theoretical Characterization

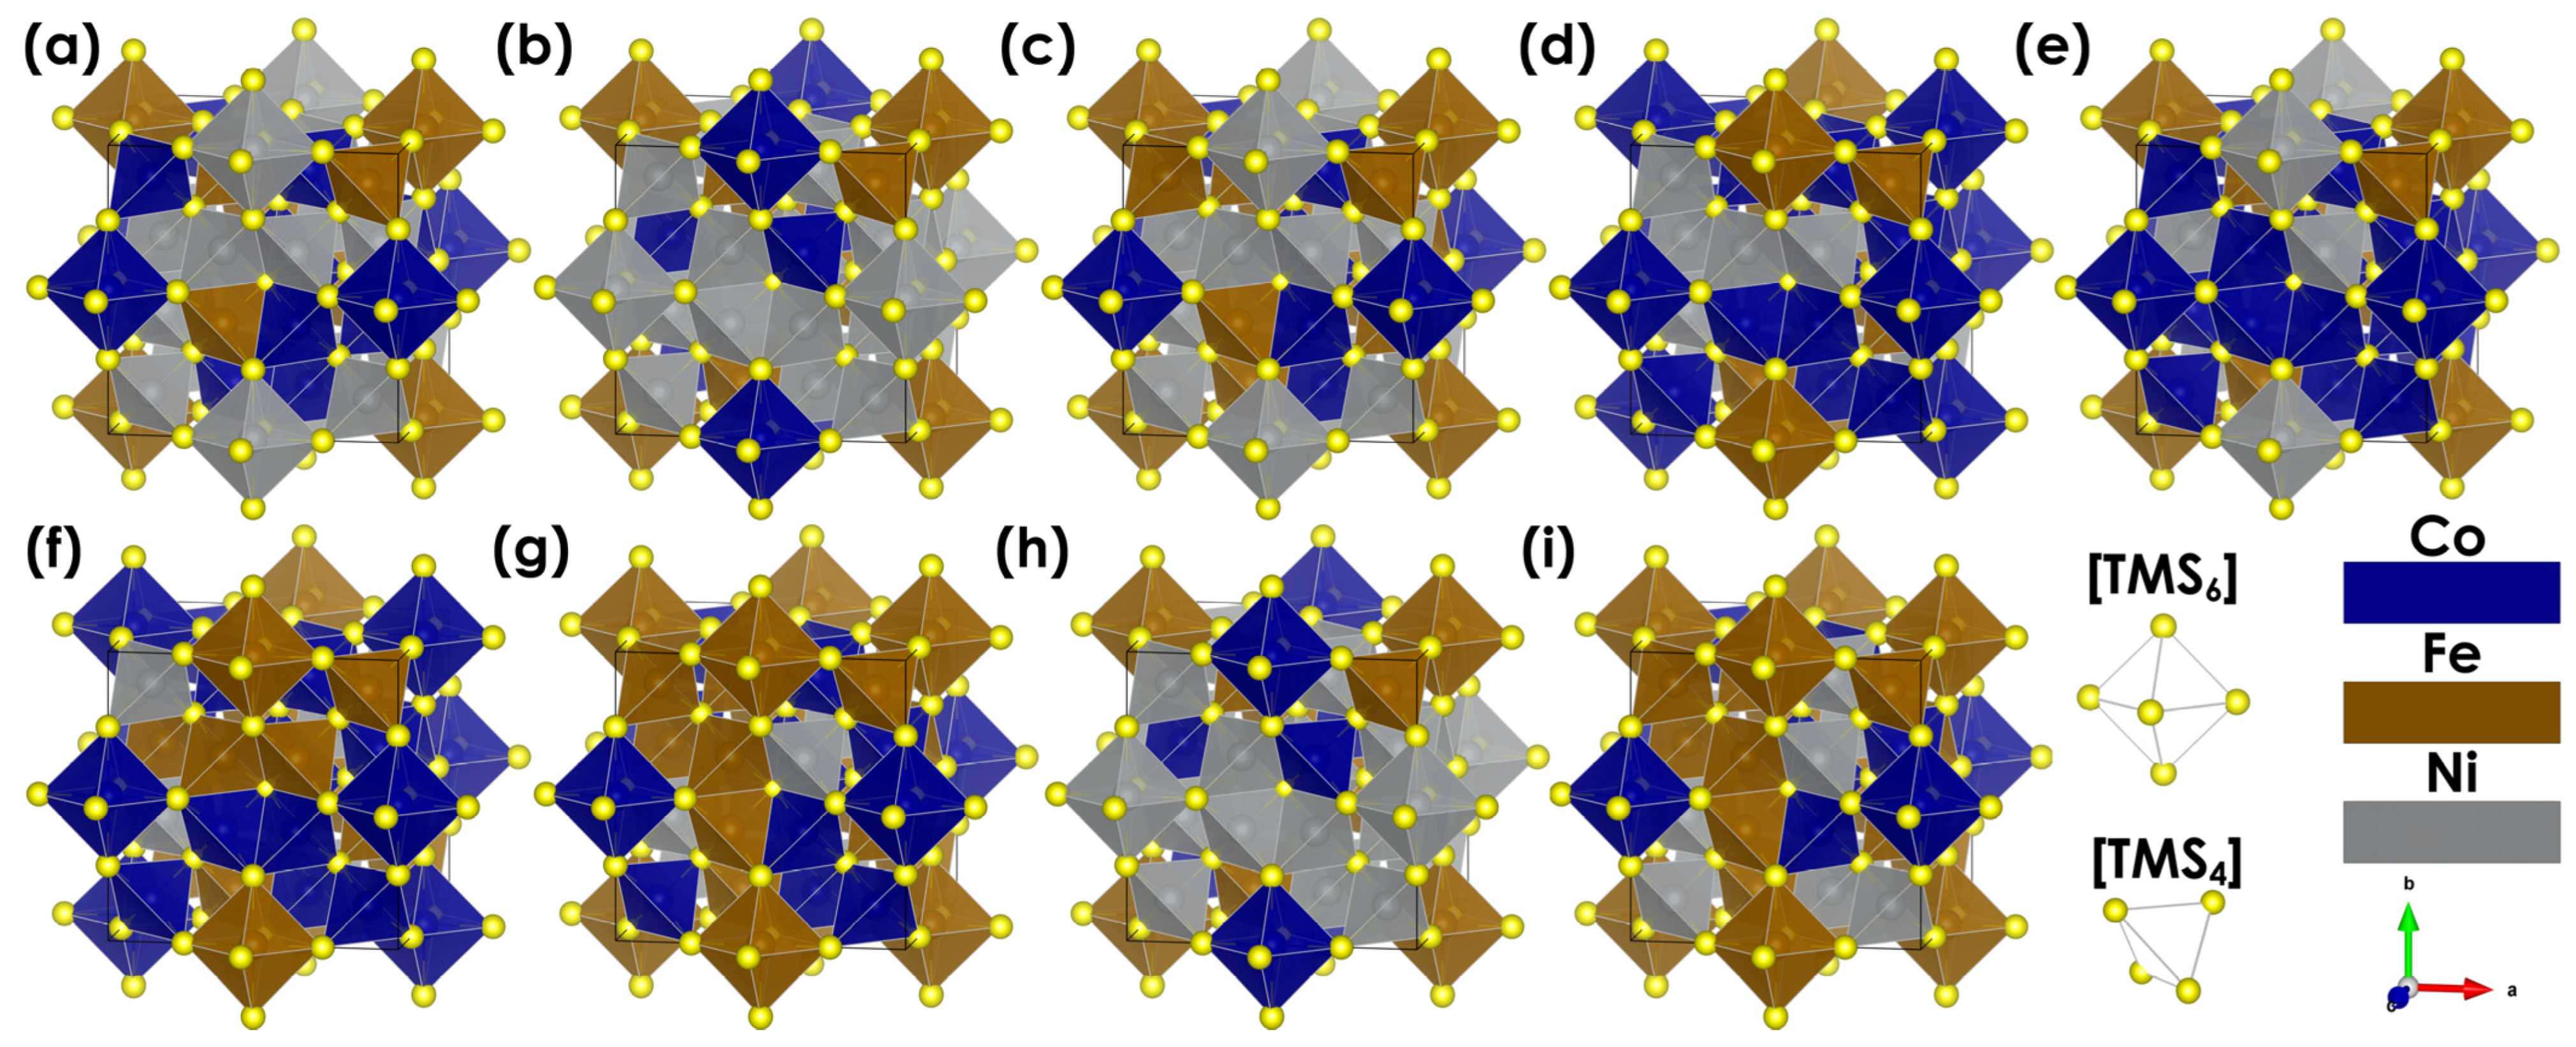
The pentlandite structure is characterized by cubic F m 3 ¯ m symmetry with a highly metallic framework. As noted by Lu et al., the structure can be further divided into substructures, ensuring a highly conductive backbone coupled with the presence of numerous bimetallic and Me-S active sites [21]. To showcase the effect of different cationic site occupations, 2 × 2 × 2 supercells were used (Figure 2). The metal atoms occupy either tetrahedral or octahedral sites that are related to 24e and 8c Wyckoff positions, respectively. The arrangement of atoms is semi-random, ensuring that at least two atoms of each metal are present in every site. Due to the nature of the work, we only consider intrinsic, not surface, properties.
Despite changing the cationic distribution, the relaxation process did not alter the lattice constants, with only 2% deviations observed from the initial volume (Table S3), indicating the great stability of these compounds and the capability to create solid solutions in a wide range of TM concentrations [19,40].
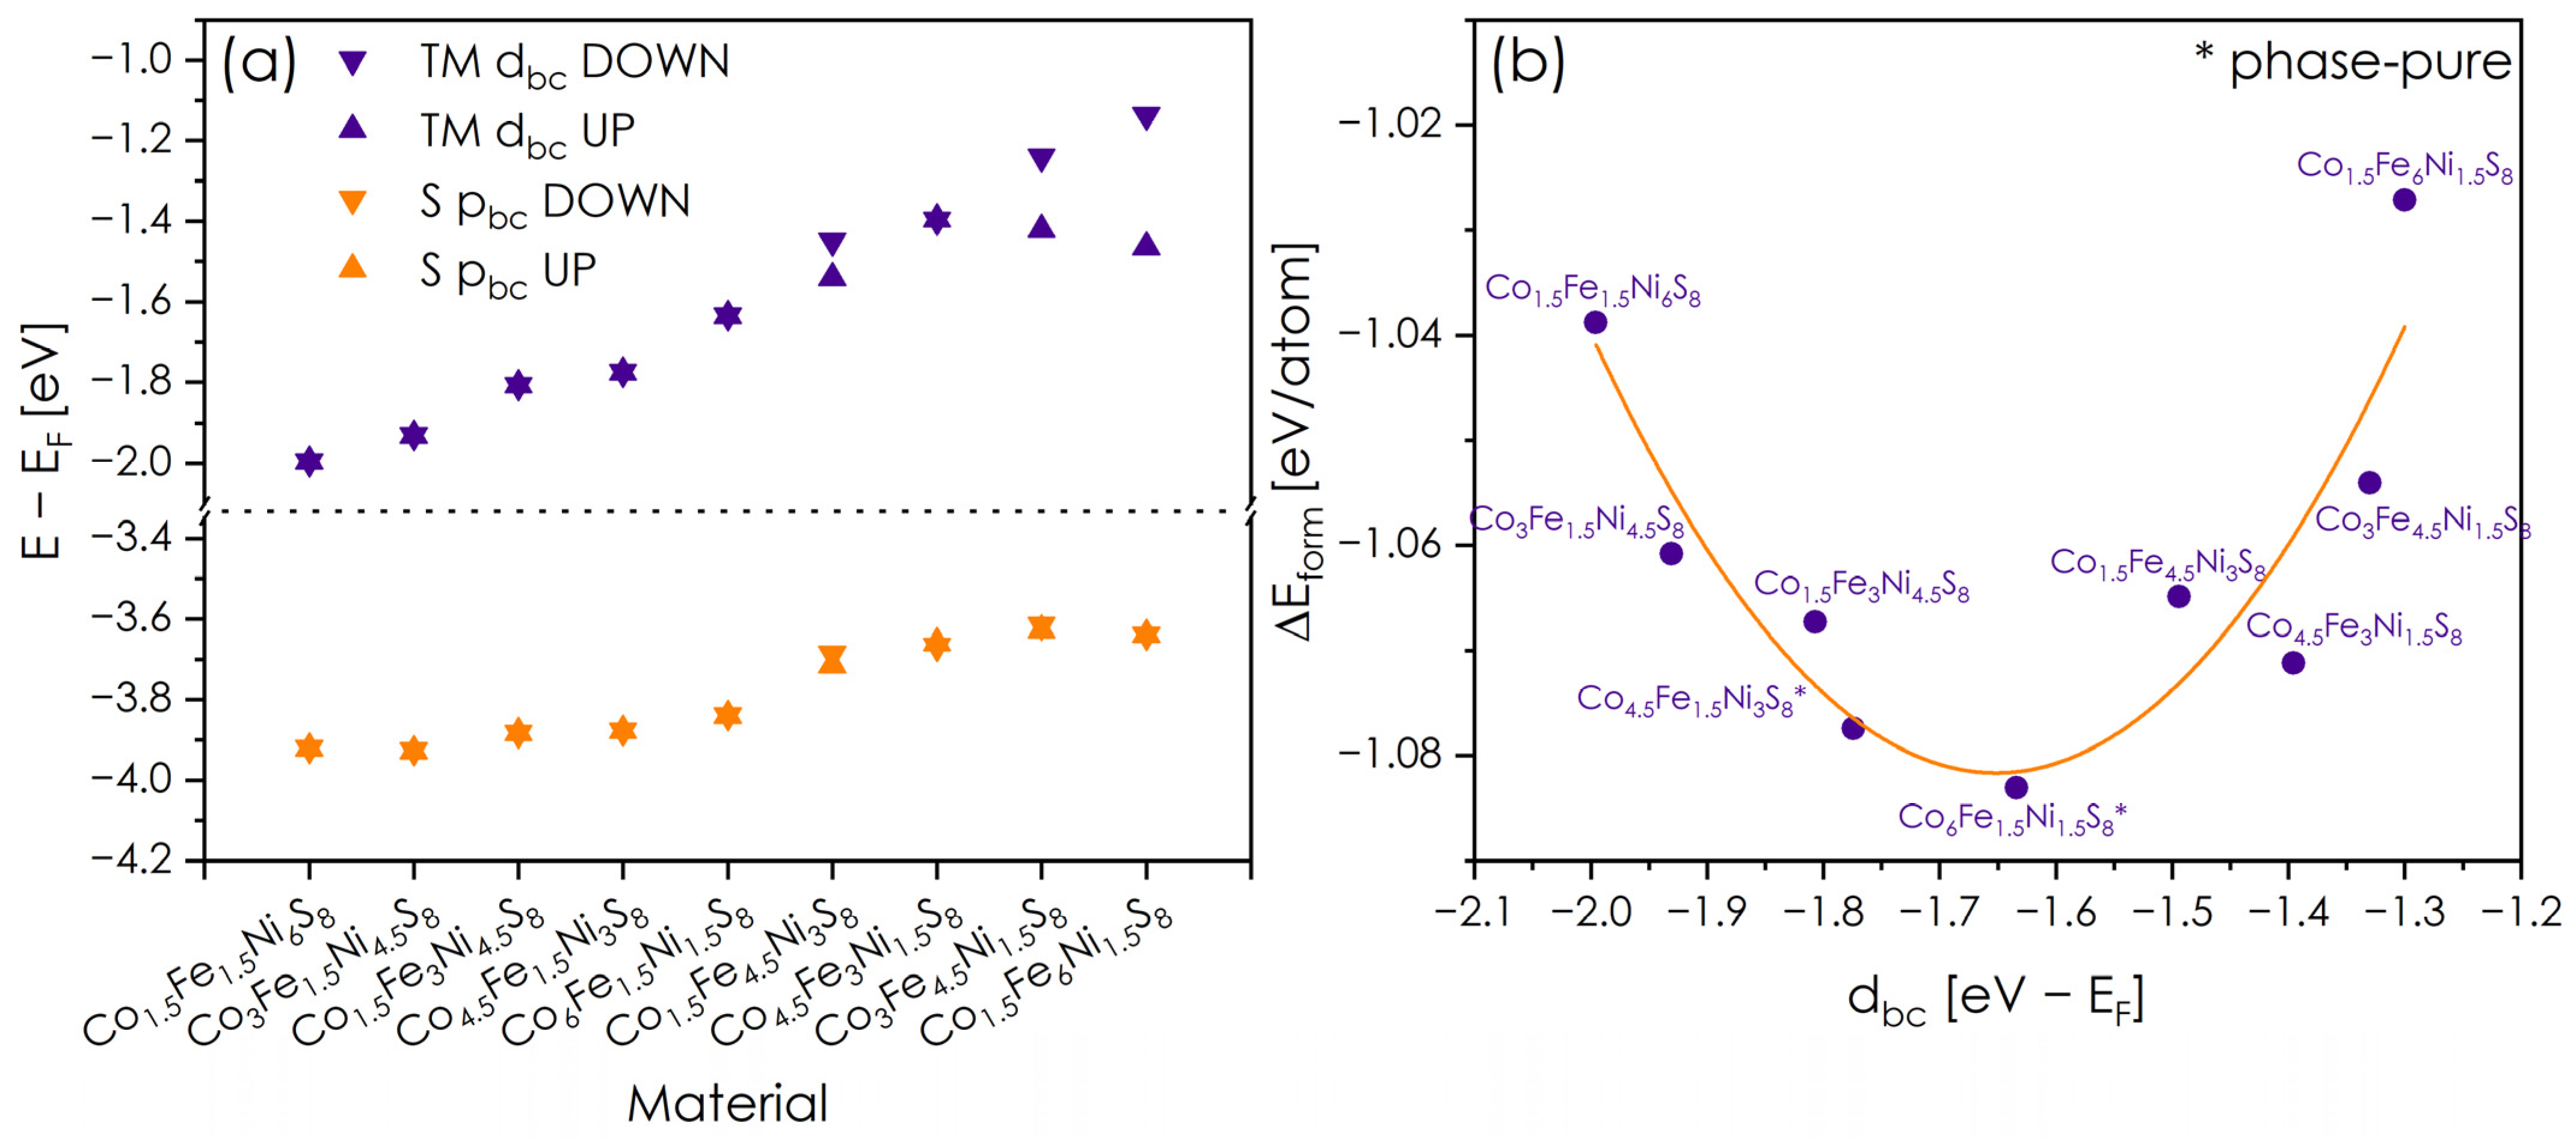
The density of states plots of the pentlandites (Figure S6) confirm that all the materials were metallic in nature, with strongly overlapping valence and conductive states [21]. Additionally, two main observations can be made. Except for “611” (Figure S6e), the states near the Fermi level were highly and uniformly populated, facilitating rapid charge transfer between the electroactive species and the electrode surface with increasing overpotential values. Moreover, disparities between the up- and down-spin densities were observed, with the latter being shifted to higher energies with respect to the Fermi level. This effect was particularly prominent for compositions with a higher Fe content, suggesting possible ferromagnetic characteristics. The electronic structure descriptors are presented in Figure 3a. Both dbc as well as pbc represent linear functions of the chemical compositions. However, the changes in the former are more pronounced than in the latter. As these parameters were derived from the TM and S PDOS, they inherited their main characteristics. Specifically, discrepancies between different electron spin polarizations for Fe-rich materials remained visible. The calculations indicated that Fe and Ni cause antagonistic effects on the electronic structure, with Fe/Ni shifting the dbc towards/away from the Fermi level and Co-rich compositions being characterized by intermediate values of these descriptors. Based on the literature evidence for chalcogenide systems, the upwards shift towards the Fermi level should be beneficial in terms of electrocatalytic performance [21,41,42]. Despite such premises, no straightforward relationship between the electronic structure descriptors and electrocatalytic performance was observed (Figure S7). This highlights the crucial role of anions present in the structures [15]. The sulfur activation process occurring in these materials masks the effect that electronic structure has on electrocatalytic activity, and thus simple concepts such as TMs band centers in pristine bulk structures are unable to properly predict the materials’ performance. A more insightful use of the DFT should include the surface energetics and vacancy formations along the surface density of states calculations.
On the other hand, the formation energies presented in Figure 3b serve as indicators of the materials’ stability. In this work, a clear correlation between the Δ E f o r m and the electronic structure of the pentlandite materials was observed. The local minimum of energy corresponded to dbc values in the range of [−1.7, −1.6] eV with respect to the Fermi level, with “611” being the closest. Any change in the configuration of the cationic sublattice translated into a higher total energy of the system. These calculations were confirmed by structural studies (Figure 1 and Figures S3–S5, Table S2), where only the “611” and “413” were phase-pure before and after sintering into pellets, which also aligns with the results obtained by Smialkowski et al. [19].

3.2. Catalytic Performance

For electrocatalytic testing, the geometric surface area, ECSA, and RF were determined for each material. Usually, the ECSA is represented by the double-layer capacitance (Cdl), which is shown in Figures S8–S13 [31]. The compiled values are depicted in Figure S14. In comparison to other forms, the powders exhibit the highest ECSA values while the pellets show the lowest, especially in relation to the working surface (Figure 4a and Table S4). Such results appear entirely justified due to the decreasing surface development. Increasing the density of the catalysts (ingots, sintered pellets) leads to a significantly higher ECSA, particularly in the Fe-rich samples. Combining high concentration of Fe and Co further increases the ECSA, suggesting that the high amounts of Fe and Co contribute to the higher formation of active sites. Conversely, samples with a large amount of nickel exhibit a reduction in the number of active centers. It is challenging to interpret these results due to the rare occurrence of the materials’ form as well as the lack of clear trends observed in other studies devoted to these materials [19]. Therefore, it seems that this may be more related to the phase purity of the materials rather than their parameters resulting from the occupation of the cationic sublattice. However, the change in the ECSA during measurements provides significantly more valuable information (Figure 4b). The estimated ECSA values before and after chronoamperometry are typical for the pentlandite activation process related to the formation of sulfur vacancies. This effect is observed for all powders and the majority of bulk materials. However, it is worth noting that for samples with a limited surface development, only those rich in Ni show a decrease in their ECSA during the measurements, suggesting that the presence of nickel itself, or more likely the presence of Ni-rich precipitates on the surface, significantly affects the adsorption/desorption processes of these materials. Similarly, the parameter of roughness factor (RF, Figure 4c), which is closely associated with the quantity of active sites, indicates that Fe- and Co-rich materials are the most promising, which is probably correlated to both the profound role of these two elements and the presence of Fe-rich foreign phases.
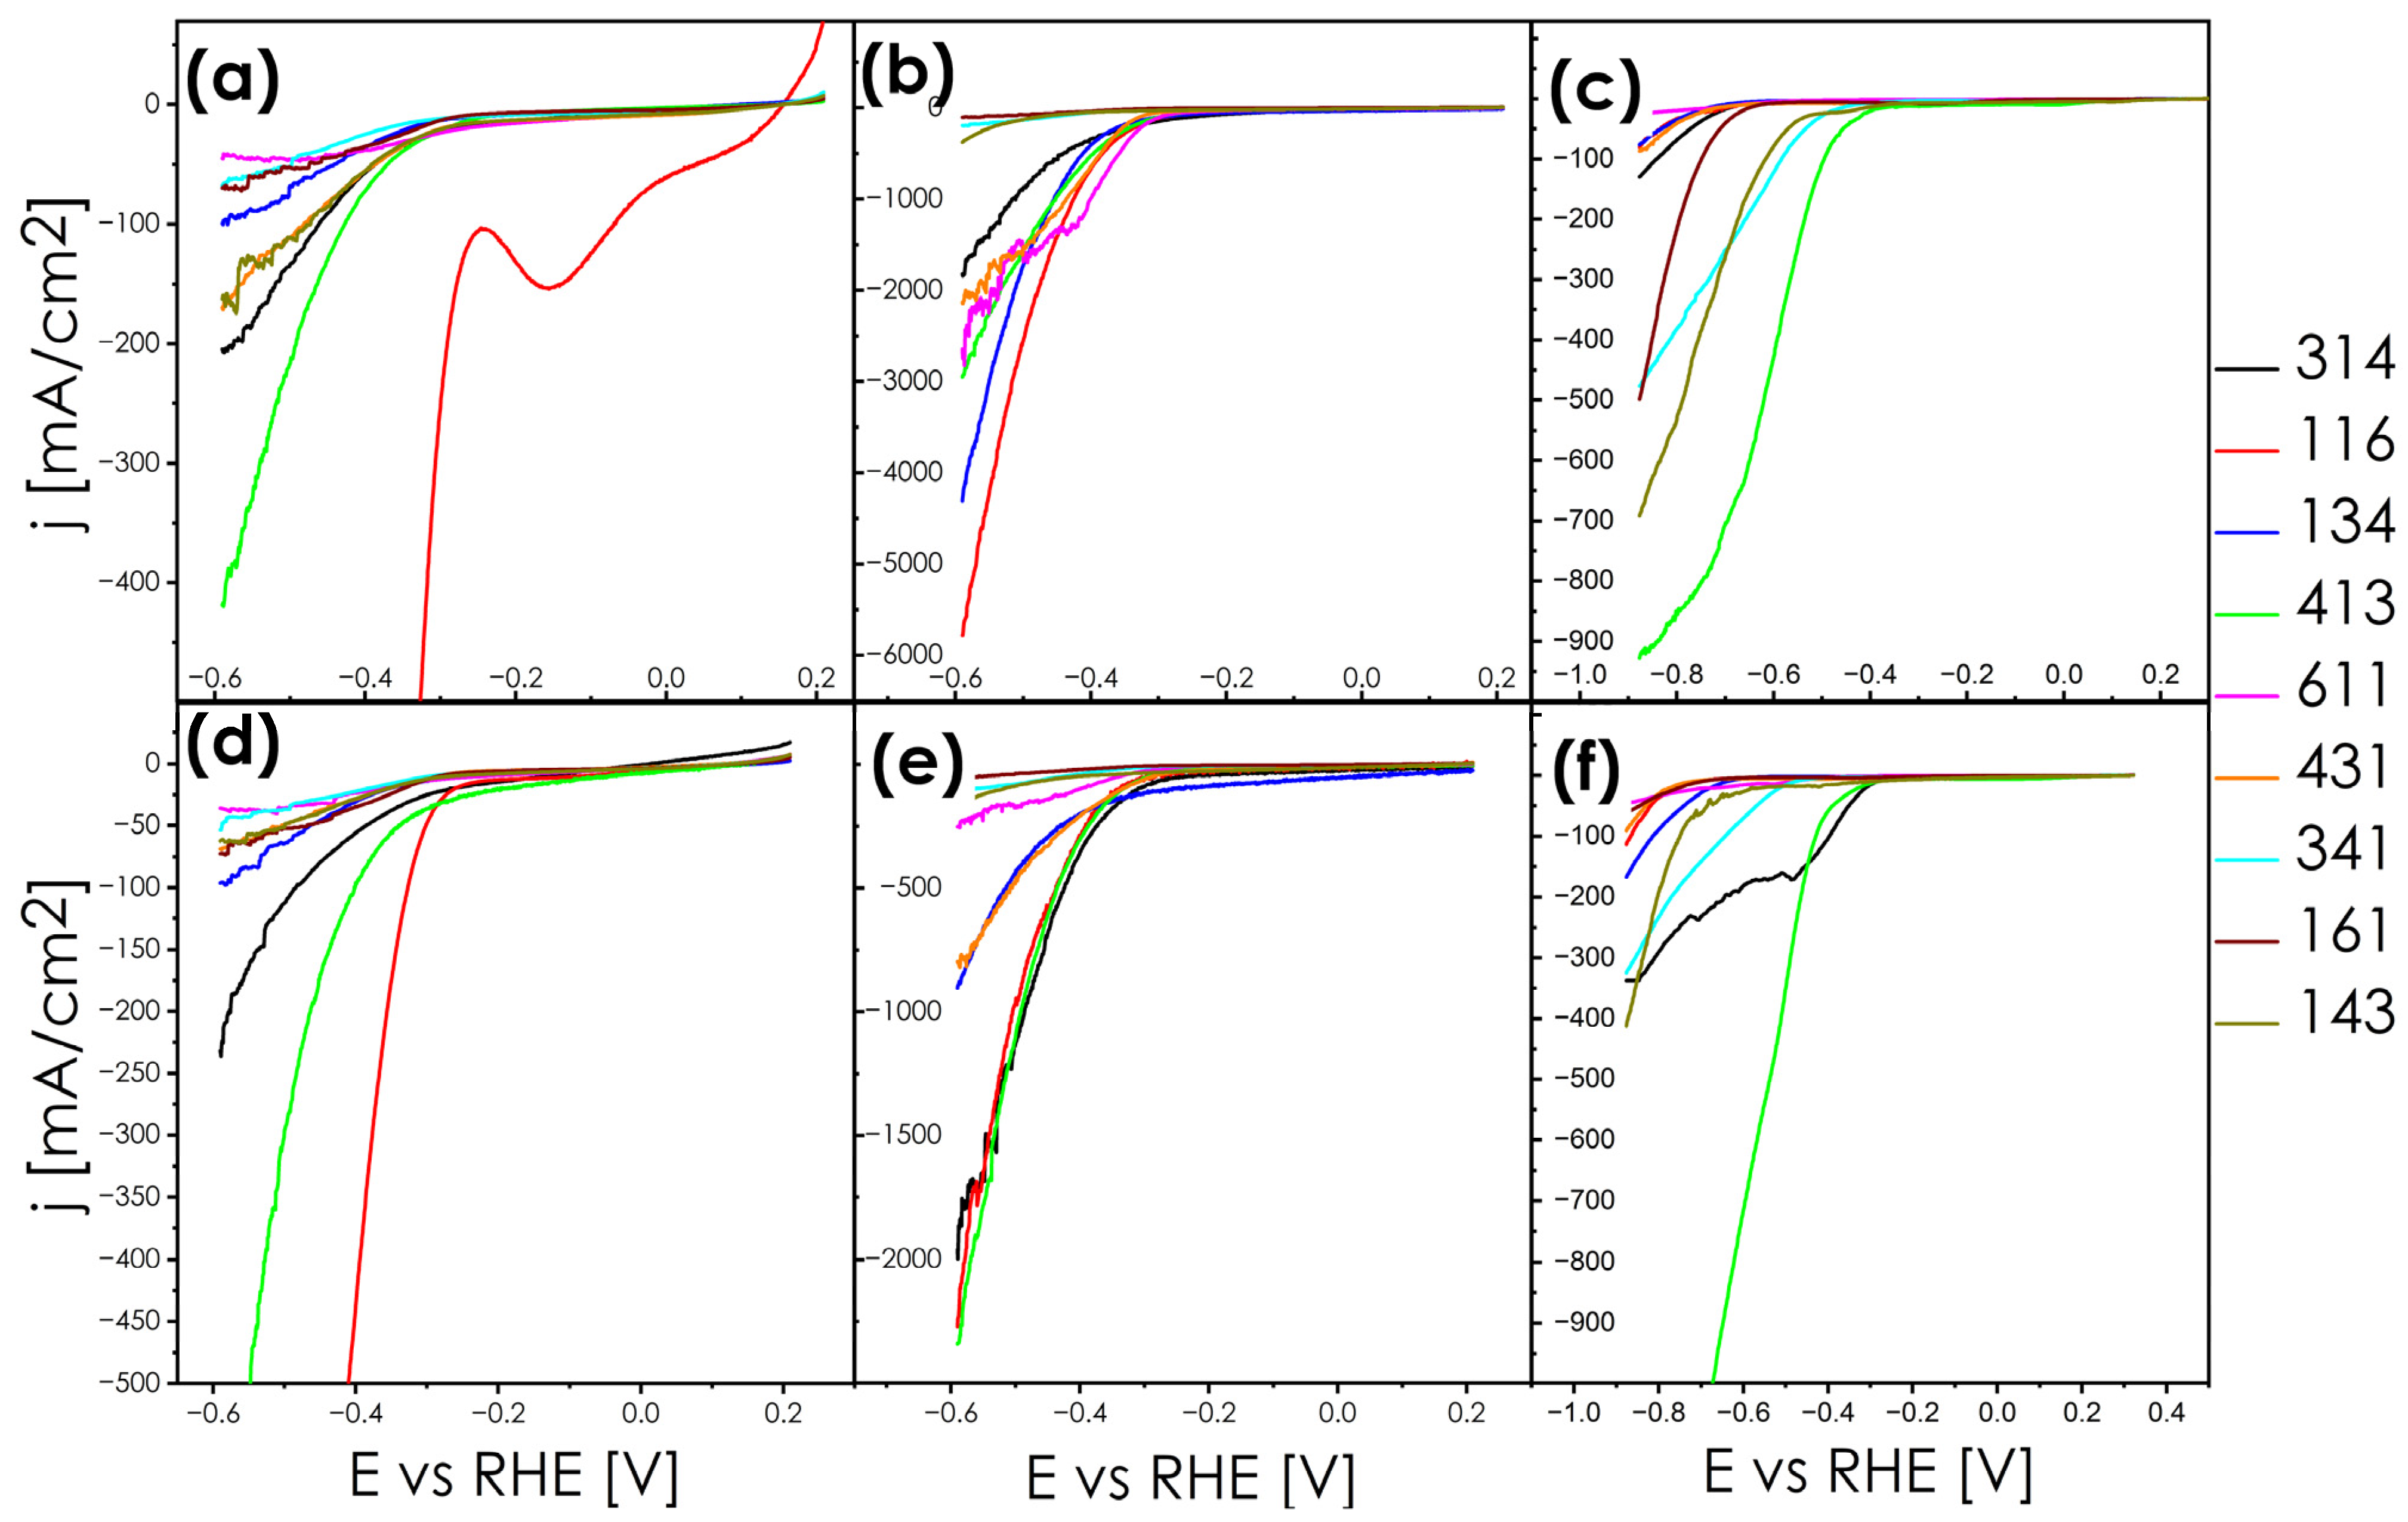
Taking into account the above-described results, it was expected that the lowest overpotentials would be achieved by the materials according to the ECSA and RF values (Table S4), i.e., for Fe-rich and Co-rich samples. However, the situation is not as straightforward as indicated by the results presented in Figure 5, where linear sweep voltammograms (LSV) normalized to ECSA for pellets, ingots, and powders are presented. It is striking that regardless of the material form, one of the best materials appears to be “413” in terms of both recorded overpotential values and durability. Based on the results presented in Table S5, this composition can be characterized by η25pre = 311 and η25post = 242 [mV/cm2], η100pre = −299 and η100post = 334 [mV/cm2], and η50pre = 457 and η50post = 388 [mV/cm2] for the pellet, ingot, and powder samples, respectively. Although this result may be surprising in relation to the ECSA, it indicates the typical behavior characteristic of pentlandites, highlighting the importance of phase homogeneity (pure-phased material). On the other hand, this is one of the compositions closest to the stoichiometry of equimolar Co3Fe3Ni3S8, which, according to the literature, exhibits some of the best catalytic parameters and highest durability due to the profound role of cobalt in this system [19]. Good catalytic activity towards HER for this “413” system cannot be correlated with the dbc presented in the previous section. It is accepted that better catalytic activity is expected for samples with a dbc close to the Fermi level, with the maximum seen at −1.1 eV (in relation to Fermi level); thus, Fe-rich samples should exhibit the best performance. This underlines that dbc can be treated as an effective descriptor of catalytic activity in pentlandites only in terms of equimolar Co:Fe:Ni ratios with varying S:Se contents [21], but it is rather ineffective in cases of different cation ratios. Here, the number of active sites related to S vacancies, as well as the arrangement of cations at the individual surfaces, dominate in regard to HER activity, which is likely due to metallic and bimetallic centers at the surfaces [19]. The remaining materials that exhibit good catalytic performance, such as Pe314, In314, In134, and Po143, also represent compositions oscillating near the equimolar cationic proportions. It is not possible to correlate these results with either ECSA nor catalytic activity descriptors, once again indicating the dominant role of the cationic arrangement and certain privileged positions in the system when all three elements are present in close coordination spheres. There may also be a synergistic effect that is particularly associated with the presence of cobalt. However, the presence of foreign phase precipitates appears to have the most significant impact here. Thus is particularly exemplified by the case of Pe116, which breaks the general trends occurring in these series and will be discussed in detail in the subsequent part of the article.
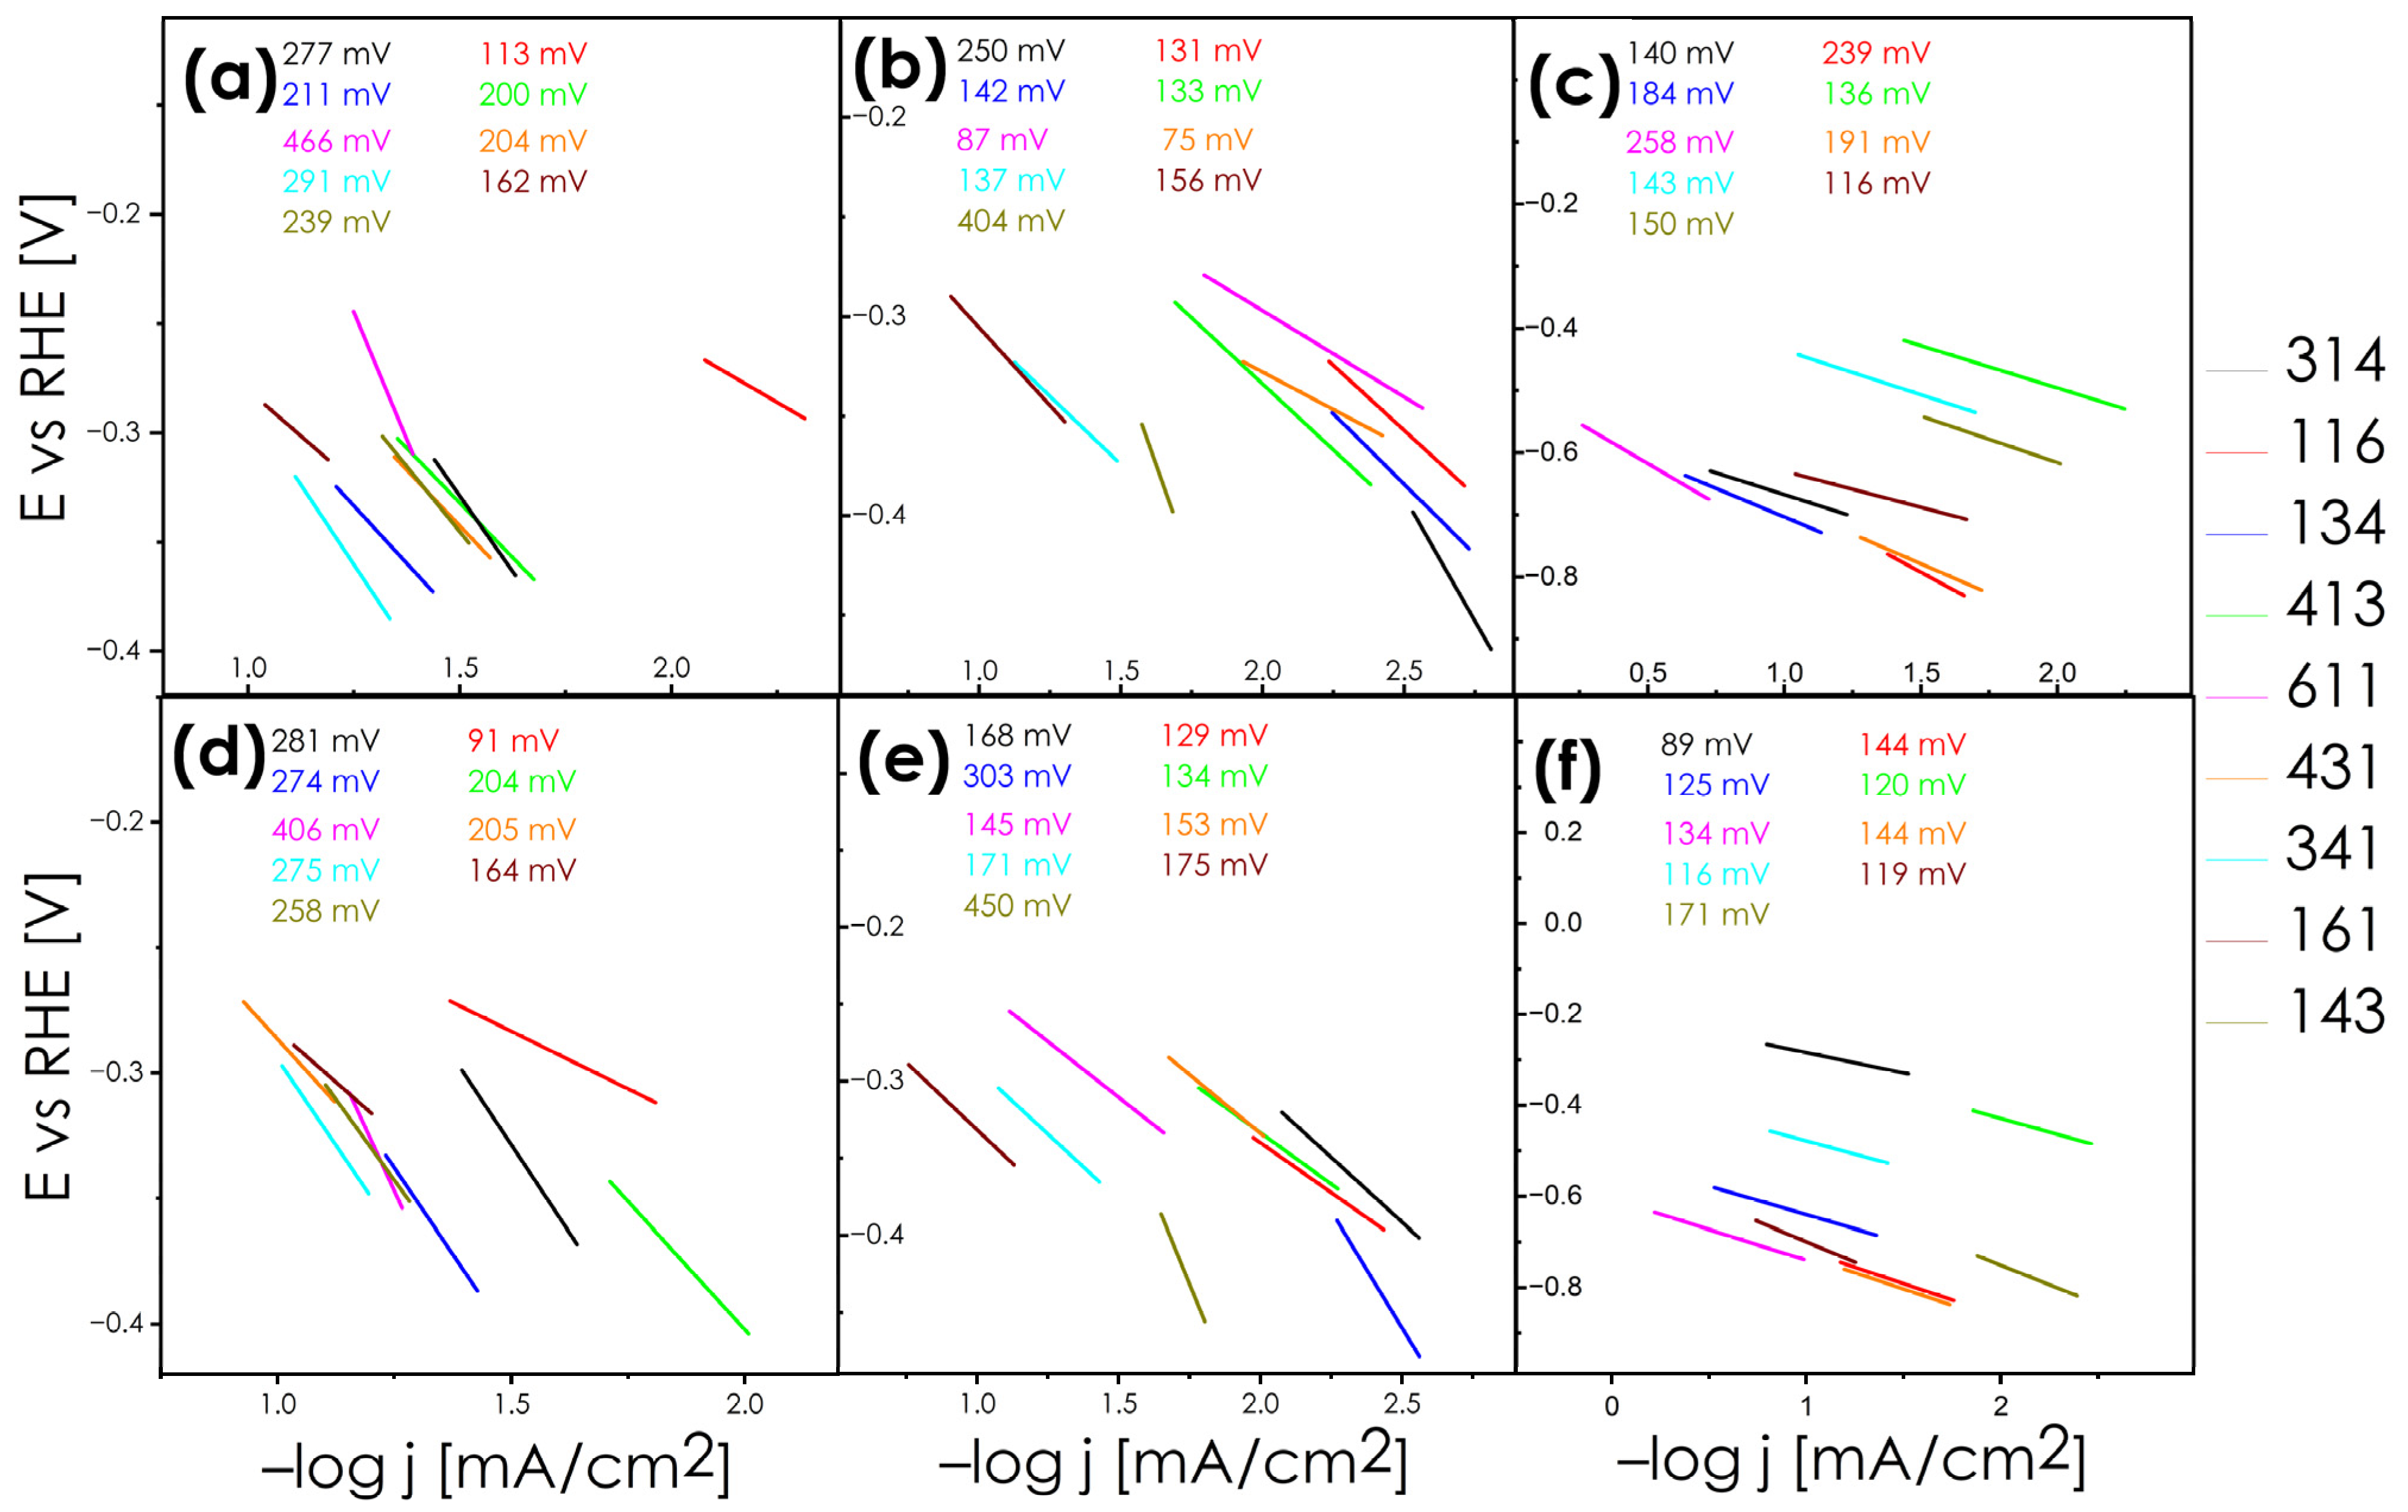
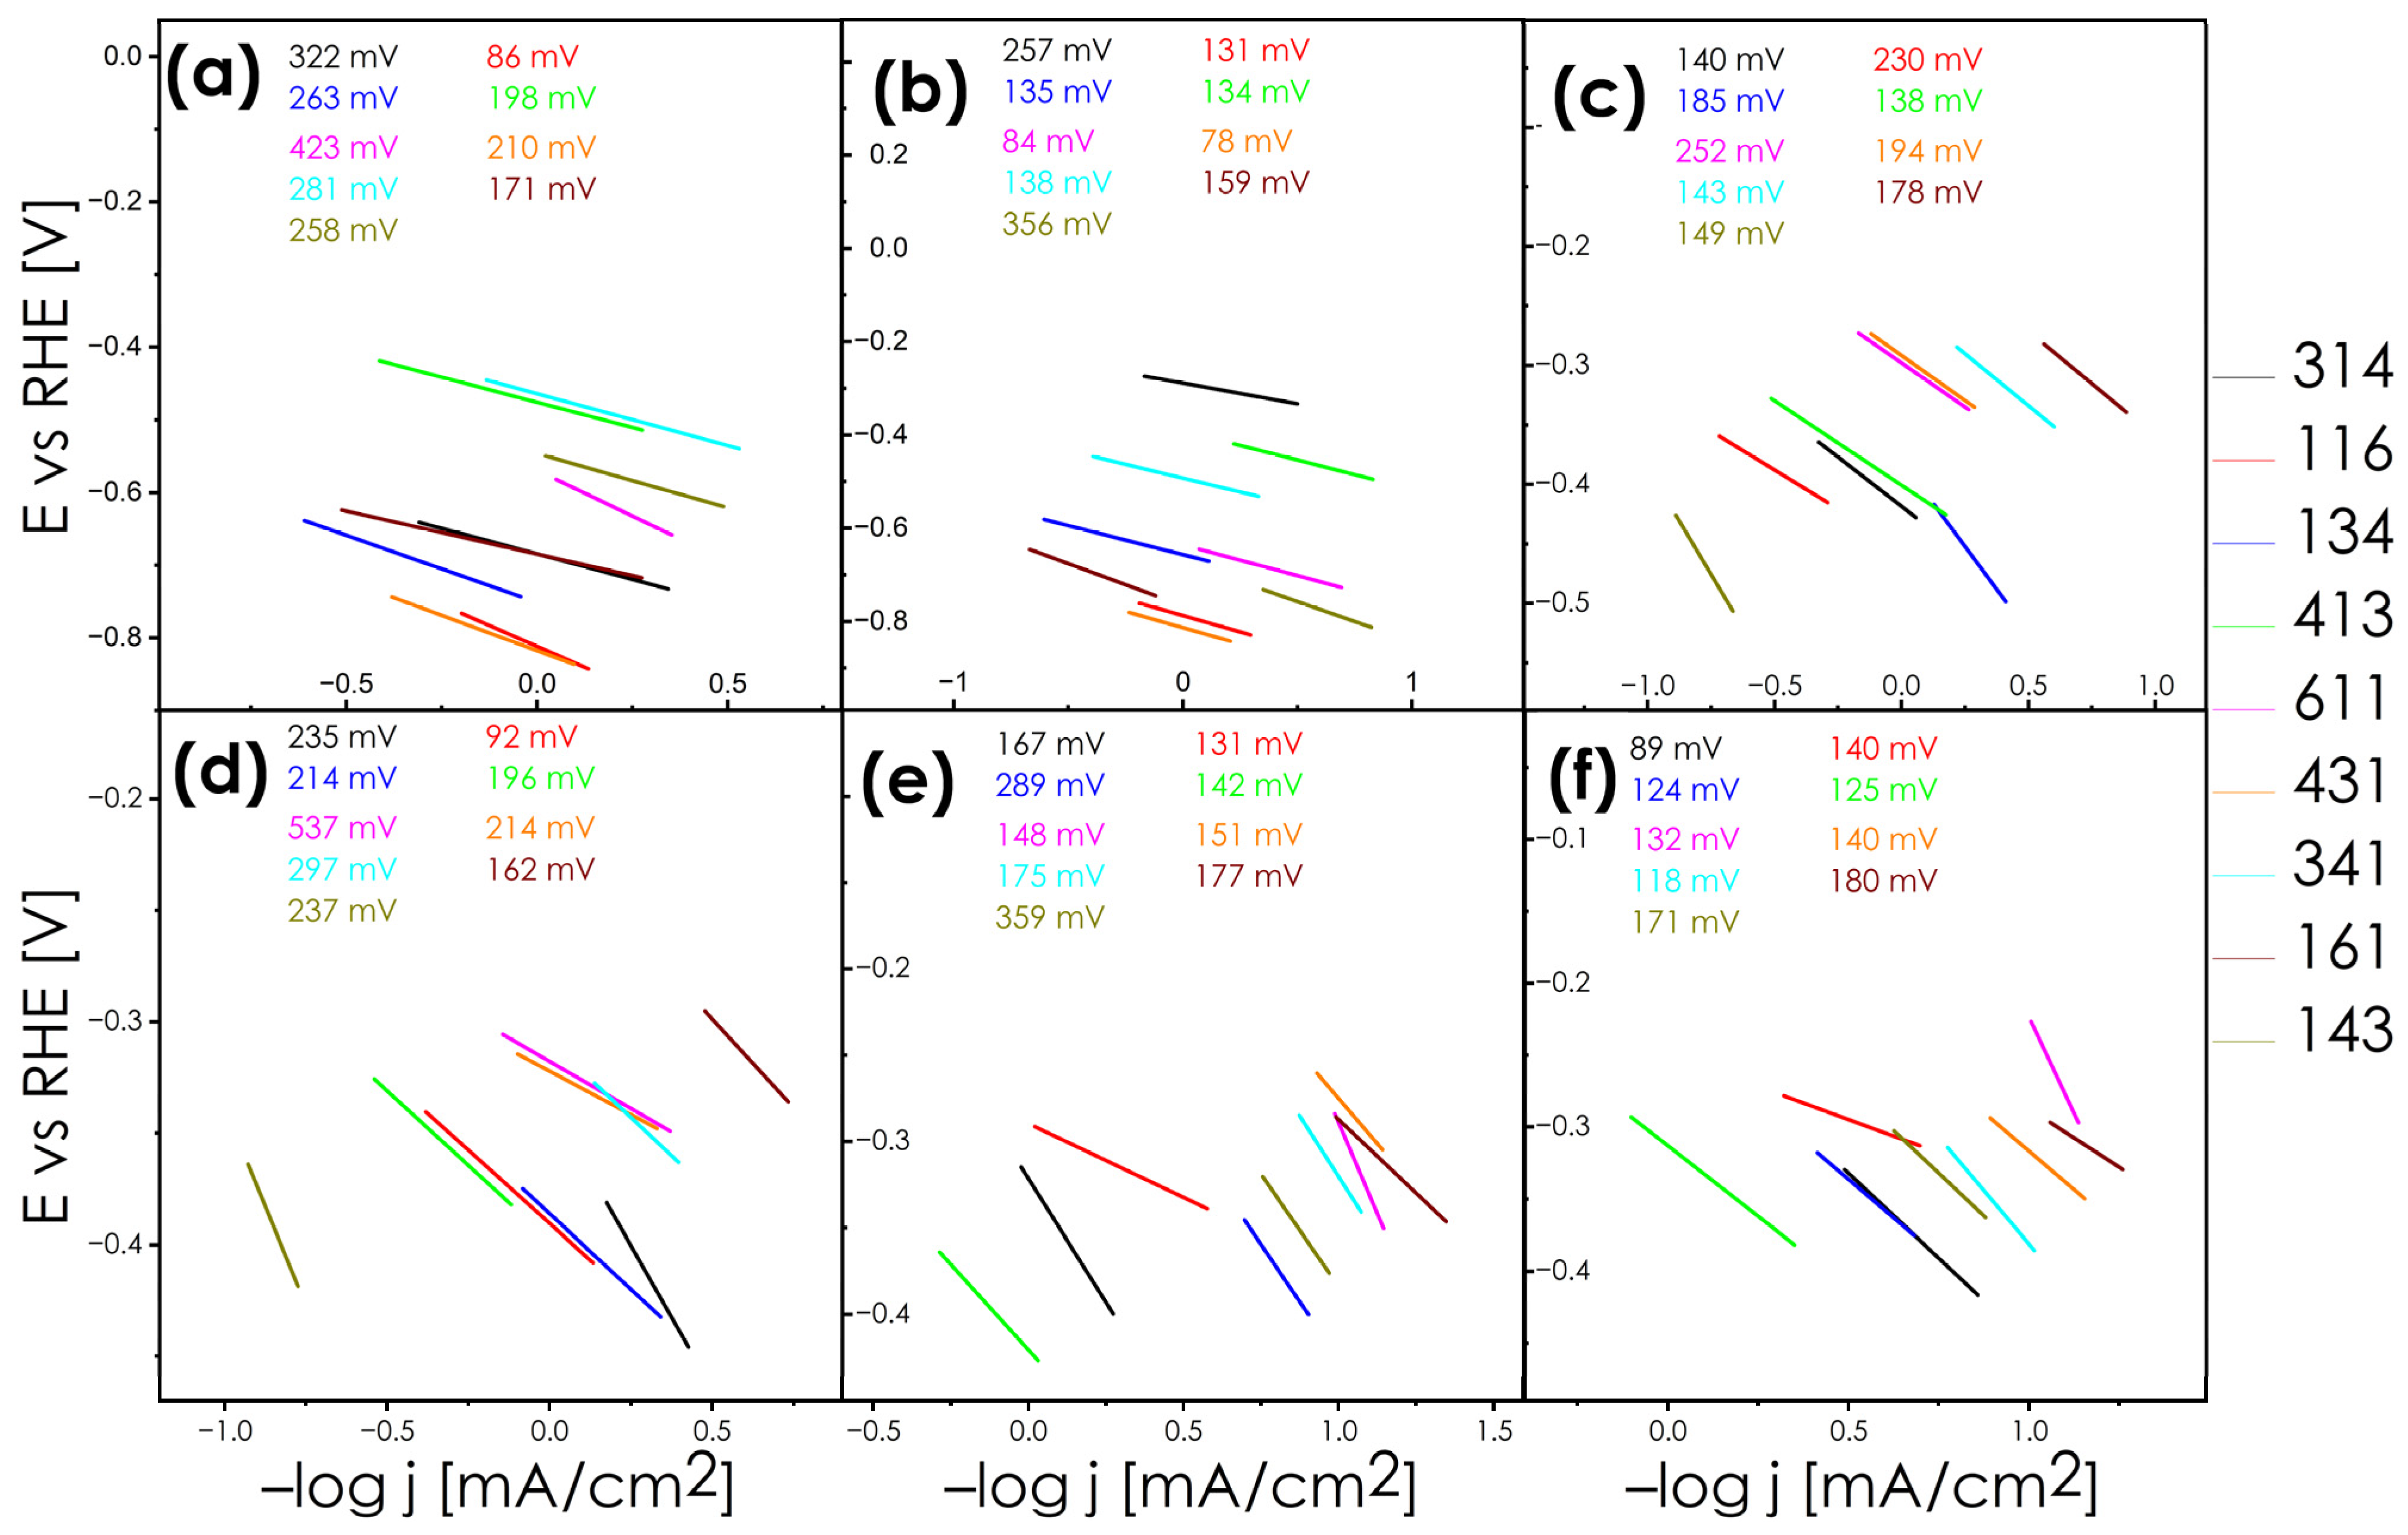
Tafel slope values are usually presented as a main indicator of the dominant mechanism of H2 adsorption. In contrary to the recorded overpotentials, some general trends can be observed here (Figure 6). As expected, the surfaces of the sintered pellets are rather inactive (Figure 6a,d), which is evident from the high values of both the Tafel slope and exchange current densities (Table S6). The lowest Tafel slope values at 113 and 162 [mV/dec] were observed for samples with extremely high concentrations of Fe and Ni (Pe161 and Pe116). Even the best performing values suggest a rather unfavorable Volmer–Heyrovski mechanism of hydrogen evolution, considering the chemisorption of a solvated proton with a subsequent reaction of this species with another solvated proton. This may be related to the presence of foreign phases, including metallic iron, as well as the exposure to metallic active centers, consistent with the results presented by Smialkowski [19]. Intermediate Tafel slopes at around 200 [mV/dec], which definitely point to a dominant Volmer–Heyrovsky mechanism of H2 adsorption, were observed for all the samples with cationic ratios close to the 1:1:1. The highest Tafel slope was recorded for the Co-rich sample (Pe611). This latter result indicates that an excessive concentration of cobalt, while positively affecting a material’s durability, binds sulfur atoms too strongly, preventing the creation of sulfur vacancies necessary to provide a high concentration of active sites. Much lower Tafel slope values were observed for the ingot samples (Figure 6b,e), and this can be attributed to their significantly more developed surfaces. In this case, samples In611 and In431 exhibit Tafel slopes clearly below 100 [mV/dec], indicating the desired Volmer–Tafel mechanism, wherein the rapid chemisorption of protons onto the surface is followed y a -limiting recombination reaction on the catalyst surface. It is worth noting that these two samples constitute single-phase systems, so the presence of precipitates does not hinder the mechanisms of active site formation that are characteristic of pentlandites. This distinction is particularly significant compared to the pellets described earlier, where the lowest Tafel slopes were observed for materials rich in metallic precipitates, highlighting the importance of surface development. The remaining ingots suggest a prevalence of the Volmer–Heyrovsky mechanism, with no clear correlation between the composition and these values being observed. A similar lack of correlation is noticeable for the powder catalysts. However, the results for the powders remain somewhat imprecise due to the ambiguous extent of the screen-printed electrodes. Nevertheless, based on the available results, materials rich in iron perform the best in terms of reaction kinetic ratio (Figure 6c,f).
Normalizing the obtained current densities to the geometric area (Figure 7), slightly different conclusions may be drawn. In the case of the sinters (Figure 7a,d), the best performing ones are those rich in iron, and possibly those in combination with cobalt such as Pe161, Pe431, and Pe341, while the weakest are those rich in nickel. An exception is again the extreme composition involving Ni (Pe116), for which the lowest η10 values were observed (342 mV, Table S5). It remains an open question as to whether the results obtained for the Fe- and Co-rich materials are a result of favorable chemical composition, including optimal dbc position, or if they are related to the phase homogeneity, or a result of the relatively catalytically active iron sulfide segregations (active catalyst on the surface of a well-conducting substrate). The latter effect is especially probably here, as we have observed such behavior in the case of pentlandites subjected to thermal treatment at higher temperatures [16]. However, the trend persists that the most stable materials are those for which the cation composition is closest to an equimolar composition, i.e., Pe431 and Pe341, also indicating some improvement in performance on prolonged electrolysis. Once again, the exceptions are the systems with extremely high contents of Co, Fe, and Ni, suggesting that a high activity of metallic species on the materials’ surface [15,40] was likely followed by further phase decomposition.
The performance of ingots is notably worse (Figure 7b,e). Here, the Fe-rich materials, possibly in combination with Co, perform the best, such as In161, In341, and In341, where η10 values of 377, 465, and 421 [mV] were recorded, with only slight deterioration of these values after 2 h of electrolysis. Once again, it can be noticed that the results for the powder catalysts (Figure 7c,f) as a function of geometric area (although unreliable due to the uncertain degree of coverage of the screen-printed electrode) are worst in comparison to the ingot and pellet ones. The best performing materials here are those with a relatively equimolar ratio of cations. This again suggests that surface effects are much more significant for S-rich pentlandites than for Se-rich ones [4,16].
On the other hand, the reaction kinetics of the tested materials as a function of geometric area are analogues to those normalized to ECSA (Figure 8). In the case of bulk materials (Figure 8a,b,e,f), the fastest reaction kinetics, are exhibited by systems with extremely high contents of Co, Fe, or Ni, as well as single-phased systems (611 and 413 series), indicating a relatively large contribution of favorable Volmer–Tafel mechanisms. In particular, the latter phenomenon seem to be correct as very similar observation were made for trimetallic pentlandites presented in [19]. For ingots, once again, the best performing materials are those that are single-phase, exhibiting Tafel slopes at 84 and 78 [mV/dec−1] for In611 and In431, respectively. These results clearly indicate that materials unaffected by any further processing are best when the typical properties of pentlandites can occur (activation process). In cases where the material surface is contaminated with foreign phases or subjected to some form of treatment, the resulting cases tend to depend on the chemical composition (in contrary to Se-rich pentlandites) [21]. It seems, therefore, to confirm that the presence of active precipitations may cause changes in ECSA as well as improve overpotentials at specific current densities, but negatively affects adsorption/desorption processes on the surface. In the case of the Tafel slopes for powders (Figure 8c,f), once again the key roles of iron and cobalt emerge, with an emphasis on the unfavorable influence of excessive contents of Co and Ni.
Interestingly, the results presented in this study for pellets indicate slightly inferior catalytic parameters compared to the other trimetallic pentlandites investigated in the same form. Particularly noteworthy are the results from our recent work [21], in which overpotentials η25 below 300 [mV] were obtained for the all considered compositions (Table S8). This result emphasizes that for materials rich in sulfur, the role of surface effects is crucial. In contrast, for single-phase materials rich in selenium [4,21], the contribution of the surface is much less significant, and the effect of chemical composition is much more pronounced. The role of the surface is even more pronounced in the samples with a well-developed surface, especially for ingots, where we observe the best parameters for single-phase materials. The recorded overpotentials and Tafel slopes in this case are at a comparable levels to those noted by other authors [13,19].
Attempting to identify certain general trends within the presented series, and disregarding the issue of phase homogeneity, we summarize the results in Figure 9. Interpreting the case of sintered pellets (Figure 9a) can be challenging since the lowest overpotentials do not always correlate with the lowest Tafel slopes. However, it is evident that the materials with an extreme concentration of individual metals (Pe611, Pe161, Pe116) perform the best in terms of all the considered parameters, namely ηGEO, ηECSA, RF, and Tafel slope. This relationship is clearly linked to the surface effects. The Pe611 sample is the only single-phase material, possessing the highest ability to create sulfur vacancies, while Pe161 and Pe116 are characterized by the highest contents of metallic segregations, providing additional active sites. For the ingot samples (Figure 9b), the Fe-rich sample (In161) stands out, possessing some of the best catalytic parameters but indicating low ηECSA at the same time. This finding is consistent with our previous research on bulk pentlandite and pseudo-spinel catalysts [18,21], underscoring the substantial influence of ECSA and RF on catalytic performance. In431 also stands out as a sample with one of the fastest HER mechanisms, which once again should be attributed to the crucial roles of both cobalt and phase purity. In the case of the powder catalysts, practically all of them have a very low RF, except for Po611, which again highlights the role phase homogeneity. The set best describing catalytic performance, however, belongs to the materials with nearly equimolar cationic ratios (Po 341, Po 413, Po143).

3.3. Co1.5Fe1.5Ni6S8 Phenomena

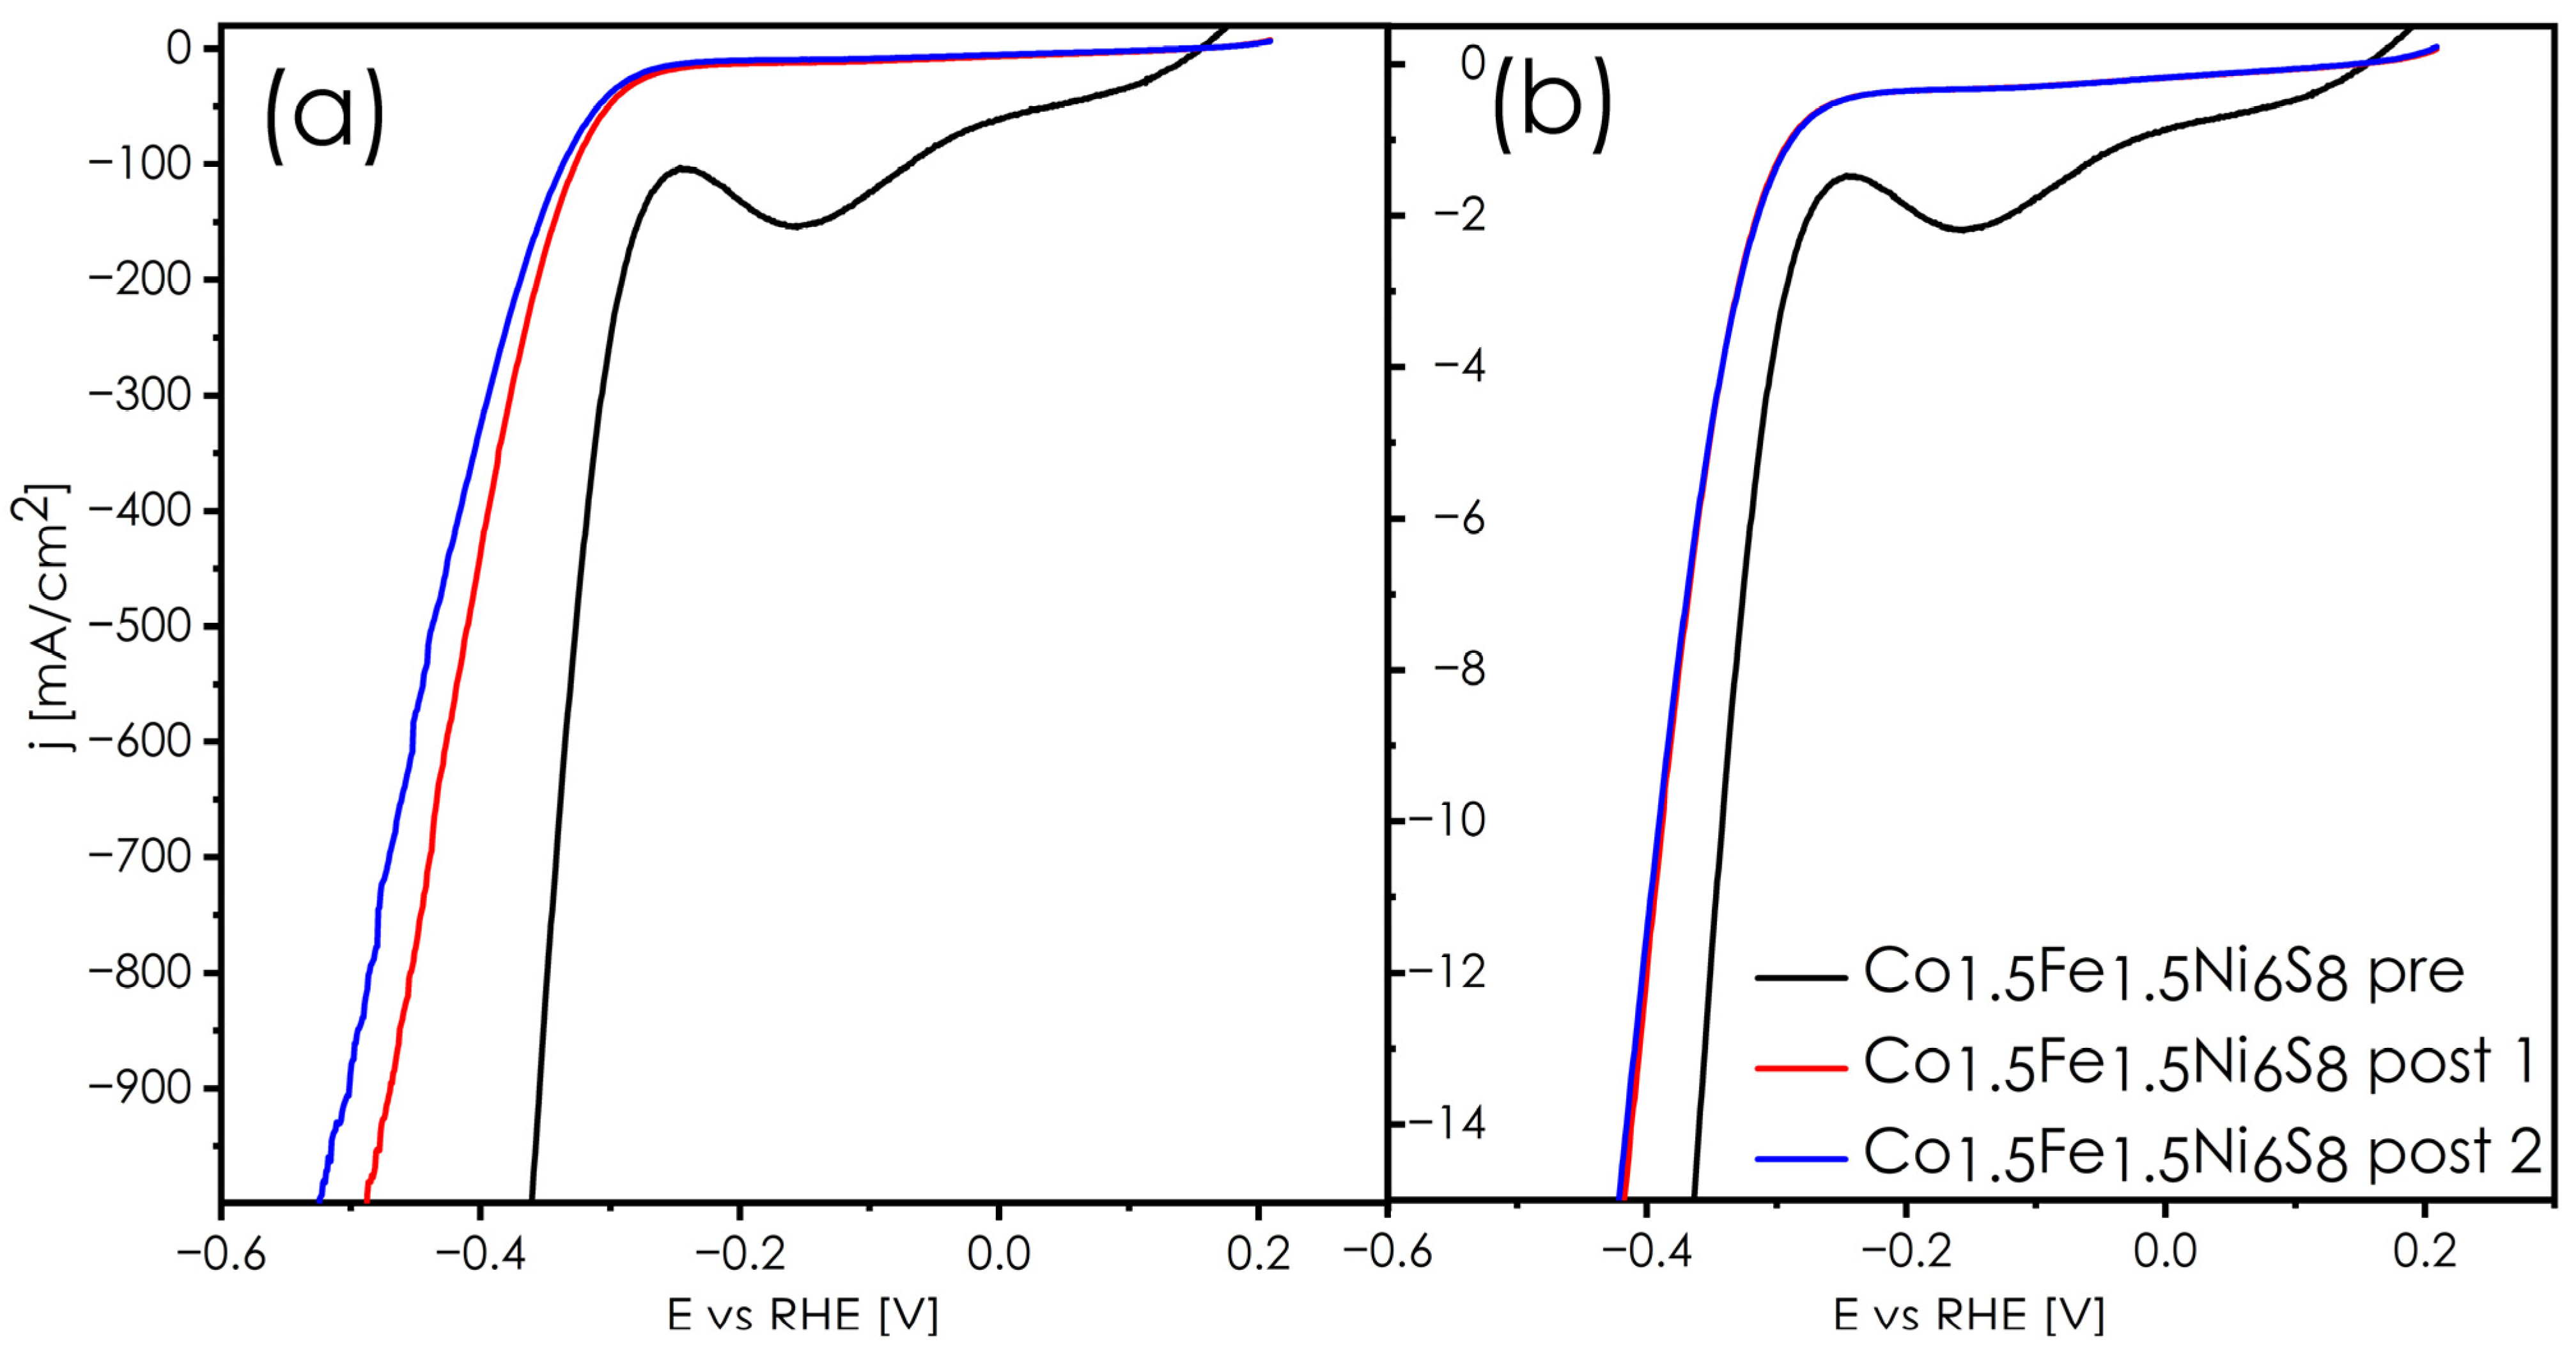
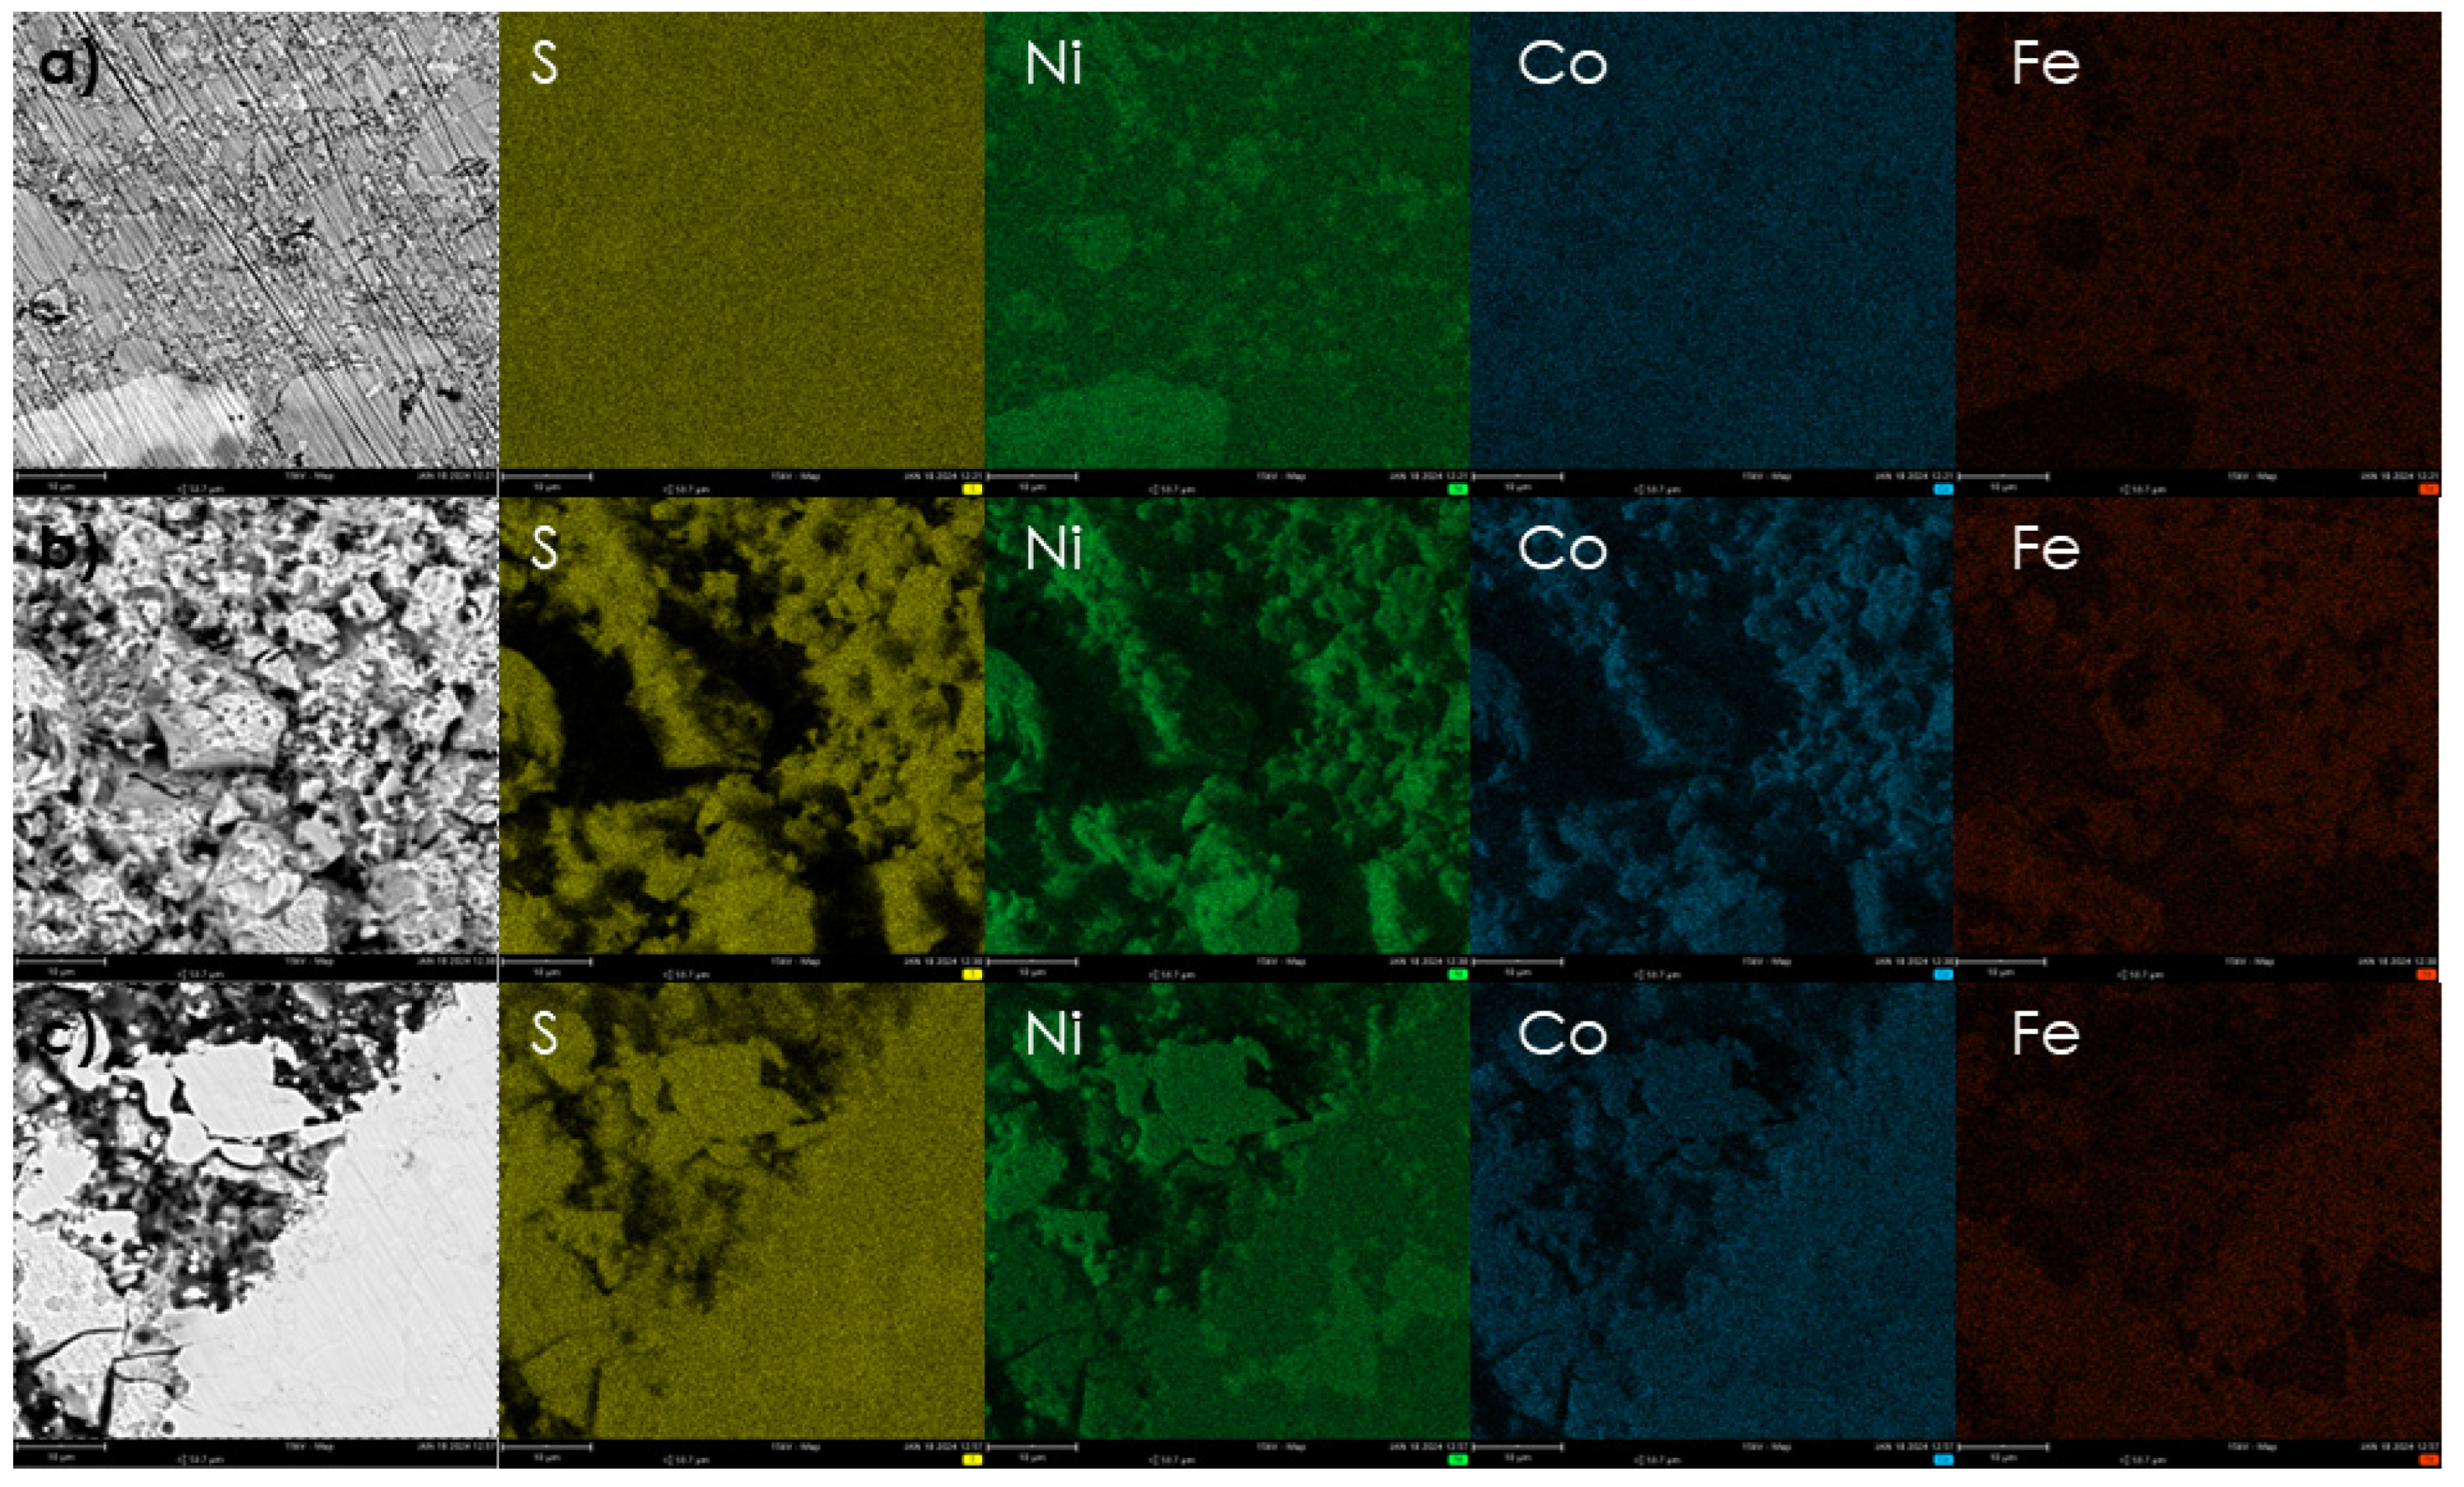
Materials with a nominal composition of Co1.5Fe1.5Ni6S8 constitute a very interesting case. Materials that already exhibit multi-phase composition after synthesis undergo further phase decomposition due to thermal treatment during the sintering process. In the cases described above, these foreign phase precipitations are typically catalytically active, creating the random yet favorable scenario of a catalyst anchored to another catalyst. In the case of sintered pellets, the highly conductive substrates are composed of strongly consolidated pentlandites. Although such composite systems often yield low overpotentials, as demonstrated, they can slow down the kinetics of the HER reaction. The initial stages of the Pe116 sample are no different, wherein the amount of nickel sulfide increases from about 4% after synthesis to about 12% upon sintering. These actively segregated nickel sulfide phases translate into very good HER efficiency, as depicted in Figure 10, both as a function of ECSA (Figure 10a) and of geometric surface area (Figure 10b), reaching η100 = 244 [mV] and η10 = 341 [mV] respectively. Additionally, a characteristic bend in the LSV curve associated with the reaction of NiS itself can be observed. Due to its unusual behavior, this material underwent additional processing according to the following scheme: surface cleaning 1 → ECSA 1 → HER 1 → chronoamperometry 1 → surface cleaning 2 → ECSA 2 → HER 2 → chronoamperometry 2 → surface cleaning 3 → ECSA 3 → HER 3. After the first chronoamperometry measurement, the properties of this material significantly deteriorated, resulting in overpotentials at the level of η100 = 327 and η10 = 388 [mV] as a function of ECSA and geometric area, respectively. However, subsequent chronoamperometry and LSV measurements caused practically no change to the catalytic performance of this material. The structural analysis (Figure 11) reveals that during operating conditions, the nickel sulfide (Figure 11a) contamination disappears (Figure 11b) and the remaining Ni-rich pentlandite becomes a single-phased system. In other words, there is no further decomposition of the system, and a thermodynamic equilibrium state is established, indicating the limit of nickel solubility in this system to be specifically near the Co1.42Fe1.37Ni5.21S8 composition (based on SEM-EDX). This is especially well observed in Figure 11c, where the areas affected and unaffected by the HER processing are presented.
This is also confirmed by examining the ECSA and RF of this material at subsequent measurement stages (Table 2). It can be noted that after the first cycle, the ECSA and RF increase due to the removal of NiS, which was blocking the active sites of the pentlandite itself. After the second cycle, further increases in the ECSA and RF are observed, but this time due to the characteristic activation process typical for pentlandites. This confirms previous the conclusions regarding the beneficial effect of precipitates on recorded overpotentials and the detrimental, and probably uncontrolled, influence on reducing ECSA, blocking active site formation, and slowing down the kinetics of the process.

4. Conclusions

The article delves into the structural, computational, and catalytic characterization of S-rich pentlandite materials across varying Co, Fe, and Ni concentrations and material forms. It reveals that, except for the equimolar Co3Fe3Ni3S8 system, only Co-rich materials or those with cation ratios nearing 1:1:1 remain as single-phase systems. Following additional thermal treatment (sintering), only Co4.5Fe1.5Ni3S8 and Co6Fe1.5Ni1.5S8 maintain single-phase structures, confirming the calculated formation energies and underscoring cobalt’s role in pentlandite stability. Additionally, it is demonstrated that bulk materials, regardless of phase composition, exhibit lower overpotentials for systems with extremely high iron, cobalt, or nickel contents. In contrast, powder catalysts perform best when rich in both Fe and Co, while those rich in Ni exhibit a weaker performance. Unlike pentlandites with variable S:Se ratios in the anionic sublattice, these composition-dependent relationships cannot be correlated with catalytic activity descriptors (dbc) or ECSA, emphasizing the role of metallic and/or bimetallic species associated with the activation processes. Consequently, changes in material form do not alter the diminishing impact of surface effects in favor of intrinsic material properties. This study underscores the importance of phase homogeneity, with single-phase materials demonstrating predictable behavior and favorable catalytic parameters. Conversely, multi-phase systems, where catalytically active phases, typically iron and nickel sulfides, are observed, yield low overpotentials at specific current densities but also lead to surface blockage and slowed HER kinetics. An exception is the Co1.5Fe1.5Ni6S8 compound, where nickel sulfide segregations disappear during operating conditions, leaving a single-phase pentlandite with moderate catalytic performance. This incidental Ni-rich pentlandite suggests nickel solubility in this structure, with a stoichiometry nearing Co1.42Fe1.37Ni5.21S8.
The cases of S-rich pentlandites serve as an excellent example of a system in which the multicomponent approach, synergistic effects, and intrinsic properties yield to surface effects associated with the formation of vacancies, metallic active sites, and the role of individual elements in stability issues.

Supplementary Materials

The following supporting information can be downloaded at: https://www.mdpi.com/article/10.3390/en17102261/s1, Figure S1. DLS results of the particles size as a function of (a) number and (b) volume distribution. Figure S2. Photos of powders applied to screen-printable electrodes (a) Po314; (b) Po116; (c) Po134; (d) Po413; (e) Po611; (f) Po431; (g) Po341; (h) Po161; and (i) Po143. Figure S3. SEM micrographs together with EDX mapping for: (a) Pe314; (b) Pe116; (c) Pe134; (d) Pe413; (e) Pe611; (f) Pe431; (g) Pe341; (h) Pe161; and (i) Pe143. Figure S4. SEM micrographs together with EDX mapping for: (a) In314; (b) In116; (c) In134; (d) In413; (e) In611; (f) In431; (g) In341; (h) In161; and (i) In143. Figure S5. SEM micrographs together with EDX mapping for: (a) Po314; (b) Po116; (c) Po134; (d) Po413; (e) Po611; (f) Po431; (g) Po341; (h) Po161; and (i) Po143. Figure S6. Total and partial density of states of examined materials: “314” (a), “116” (b), “134” (c), “413” (d), “611” (e), “431” (f), “341” (g), “161” (h), and “143” (i). Figure S7. Benchmarking parameters as a function of calculated dbc of examined materials: overpotential: at 10 mA/cm2 normalized to geometric area (a), at 25 [mA/cm2] normalized to ECSA (b), at 100 mA/cm2 normalized to ECSA (c); roughness factor (d), Tafel slope for current densities normalized to geometric area (e) and ECSA (f). Figure S8. CV voltammograms witch different scan rates for determining ECSA before/after stability tests for “pre” (a) Pe314; (b) Pe116; (c) Pe134; (d) Pe413; (e) Pe611; (f) Pe431; (g) Pe341; (h) Pe161; and (i) Pe143. Figure S9. [1]. CV voltammograms witch different scan rates for determining ECSA before/after stability tests for “post” (a) Pe314; (b) Pe116; (c) Pe134; (d) Pe413; (e) Pe611; (f) Pe431; (g) Pe341; (h) Pe161; and (i) Pe143. Figure S10. CV voltammograms witch different scan rates for determining ECSA before/after stability tests for “pre” (a) In314; (b) In116; (c) In134; (d) In413; (e) In611; (f) In431; (g) In341; (h) In161; and (i) In143. Figure S11. CV voltammograms witch different scan rates for determining ECSA before/after stability tests for “post” (a) In314; (b) In116; (c) In134; (d) In413; (e) In611; (f) In431; (g) In341; (h) In161; and (i) In143. Figure S12. CV voltammograms witch different scan rates for determining ECSA before/after stability tests for “pre” (a) Po314; (b) Po116; (c) Po134; (d) Po413; (e) Po611; (f) Po431; (g) Po341; (h) Po161; and (i) Po143. Figure S13. CV voltammograms witch different scan rates for determining ECSA before/after stability tests for “post” (a) Po314; (b) Po116; (c) Po134; (d) Po413; (e) Po611; (f) Po431; (g) Po341; (h) Po161; and (i) Po143. Figure S14. Charging current densities representing Cdl values for (a) pellets before chronoamperometry; (b) ingots before chronoamperometry; (c) powders before chronoamperometry; (d) pellets after chronoamperometry; (e) ingots after chronoamperometry; (f) powders after chronoamperometry. Table S1. Density of the ingot and sintered pellet samples. Table S2. The summary of the chemical and phase compositions of the considered materials, along with the fitting parameters. Table S3. Structural parameters as well as formation energies calculated for pentlandites and the elements building the pentlandite structure. Table S4. ECSA and RF values for all samples before and after the stability tests. Table S5. Summary of overpotentials for all pentlandite samples “pre” and “post” stability tests normalized to ECSA and geometric area. Table S6. Tafel slope values of pentlandites samples “pre” and “post” stability tests. Table S7. Charge-transfer resistance as determined by means of EIS. Table S8. Comparison of achieved currents to previously tested materials.

Author Contributions

M.K. (Maciej Kubowicz): conceptualization, investigation, data curation, formal analysis, methodology, visualization, writing—original draft, writing—review and editing. M.K. (Miłosz Kożusznik): investigation, visualization, writing—review and editing. T.K.: investigation. K.M.: investigation. A.M.: conceptualization, funding acquisition, investigation, project administration, resources, supervision, validation, visualization, writing—review and editing. All authors have read and agreed to the published version of the manuscript.

Funding

This work was financially supported by the National Science Centre, Poland, under grant no. 2022/45/B/ST8/03336. The APC was funded by the National Science Centre, Poland, under grant no. 2022/45/B/ST8/03336. T.K. and K.M. acknowledges the financial support of the Polish Ministry of Education and Science within the framework of Subvention for Science 2024. We acknowledge Poland’s high-performance computing infrastructure PLGrid (HPC Centers: ACK Cyfronet AGH) for providing computer facilities and support within computational grants no. PLG/2023/016825.

Data Availability Statement

The data presented in this study are available on request from the corresponding author. The data are not publicly available due to privacy restrictions.

Conflicts of Interest

The authors declare no conflicts of interest.

References

  1. Wang, S.; Lu, A.; Zhong, C.J. Hydrogen production from water electrolysis: Role of catalysts. Nano Converg. 2021, 8, 4. [Google Scholar] [CrossRef]
  2. Carmo, M.; Fritz, D.L.; Mergel, J.; Stolten, D. A comprehensive review on PEM water electrolysis. Int. J. Hydrogen Energy 2013, 38, 4901–4934. [Google Scholar] [CrossRef]
  3. Molenda, J. Fundamentalne znaczenie badañ naukowych dla rozwoju gospodarki wodorowej. Polityka Energ. 2008, 11, 61–68. [Google Scholar]
  4. Smialkowski, M.; Siegmund, D.; Pellumbi, K.; Hensgen, L.; Antoni, H.; Muhler, M.; Apfel, U.-P. Seleno-analogues of pentlandites (Fe4.5Ni4.5S8-: YSey, y = 1-6): Tuning bulk Fe/Ni sulphoselenides for hydrogen evolution. Chem. Commun. 2019, 55, 8792–8795. [Google Scholar] [CrossRef]
  5. Zhao, G.; Rui, K.; Dou, S.X.; Sun, W. Heterostructures for Electrochemical Hydrogen Evolution Reaction: A Review. Adv. Funct. Mater. 2018, 28, 1803291. [Google Scholar] [CrossRef]
  6. Seunghwa, L.; Aliki, M.; You-Chiuan, C.; Chen, H.M.; Xile, H. Tracking high-valent surface iron species in the oxygen evolution reaction on cobalt iron (oxy)hydroxides. Energy Environ. Sci. 2022, 15, 206–214. [Google Scholar] [CrossRef]
  7. Pang, H.; Wei, C.; Li, X.; Li, G.; Ma, Y.; Li, S.; Chen, J.; Zhang, J. Microwave-assisted synthesis of NiS2 nanostructures for supercapacitors and cocatalytic enhancing photocatalytic H2 production. Sci. Rep. 2014, 4, 3577. [Google Scholar] [CrossRef]
  8. Akinaga, Y.; Kawawaki, T.; Kameko, H.; Yamazaki, Y.; Yamazaki, K.; Nakayasu, Y.; Kato, K.; Tanaka, Y.; Hanindriyo, A.T.; Takagi, M.; et al. Metal Single-Atom Cocatalyst on Carbon Nitride for the Photocatalytic Hydrogen Evolution Reaction: Effects of Metal Species. Adv. Funct. Mater. 2023, 33, 2303321. [Google Scholar] [CrossRef]
  9. Zhibo, C.; Wensheng, J.; Guanzhen, C.; Biao, Z.; Yunhu, H.; Wei, H. Design and Synthesis of Noble Metal-Based Alloy Electrocatalysts and Their Application in Hydrogen Evolution Reaction. Nano Mikro Small 2023, 19, e2301465. [Google Scholar] [CrossRef]
  10. Ďurovič, M.; Hnát, J.; Bouzek, K. Electrocatalysts for the hydrogen evolution reaction in alkaline and neutral media. A comparative review. J. Power Sources 2021, 493, 229708. [Google Scholar] [CrossRef]
  11. Dubouis, N.; Grimaud, A. The hydrogen evolution reaction: From material to interfacial descriptors. Chem. Sci. 2019, 10, 9165–9181. [Google Scholar] [CrossRef]
  12. Shinagawa, T.; Garcia-Esparza, A.T.; Takanabe, K. Insight on Tafel slopes from a microkinetic analysis of aqueous electrocatalysis for energy conversion. Sci. Rep. 2015, 5, 13801. [Google Scholar] [CrossRef]
  13. Konkena, B.; Puring, K.J.; Sinev, I.; Piontek, S.; Khavryuchenko, O.; Dürholt, J.P.; Schmid, R.; Tüysüz, H.; Muhler, M.; Schuhmann, W.; et al. Pentlandite rocks as sustainable and stable efficient electrocatalysts for hydrogen generation. Nat. Commun. 2016, 7, 12269. [Google Scholar] [CrossRef]
  14. Tsai, F.-T.; Deng, Y.-T.; Pao, C.-W.; Chen, J.-L.; Lee, J.-F.; Lai, K.-T.; Liaw, W.-F. The HER/OER mechanistic study of an FeCoNi-based electrocatalyst for alkaline water splitting. J. Mater. Chem. A 2020, 8, 9939–9950. [Google Scholar] [CrossRef]
  15. Zegkinoglou, I.; Zendegani, A.; Sinev, I.; Kunze, S.; Mistry, H.; Jeon, H.S.; Zhao, J.; Hu, M.Y.; Alp, E.E.; Piontek, S.; et al. Operando Phonon Studies of the Protonation Mechanism in Highly Active Hydrogen Evolution Reaction Pentlandite Catalysts. J. Am. Chem. Soc. 2017, 139, 14360–14363. [Google Scholar] [CrossRef]
  16. Mikuła, A.; Kubowicz, M.; Mazurków, J.; Mars, K.; Smialkowski, M.; Apfel, U.-P.; Radecka, M. Tailoring the electrocatalytic activity of multicomponent (Co,Fe,Ni)9S8–xSex pentlandite solid electrodes. J. Mater. Chem. A 2023, 11, 7526–7538. [Google Scholar] [CrossRef]
  17. Mikuła, A.; Dąbrowa, J.; Kusior, A.; Mars, K.; Lach, R.; Kubowicz, M. Search for mid- And high-entropy transition-metal chalcogenides—Investigating the pentlandite structure. Dalt. Trans. 2021, 50, 9560–9573. [Google Scholar] [CrossRef]
  18. Mikuła, A.; Dąbrowa, J.; Kubowicz, M.; Cieślak, J.; Lach, W.; Kożusznik, M.; Smialkowski, M.; Apfel, U.-P. Synthesis, properties and catalytic performance of the novel, pseudo-spinel, multicomponent transition-metal selenides. J. Mater. Chem. A 2023, 11, 5337–5349. [Google Scholar] [CrossRef]
  19. Smialkowski, M.; Siegmund, D.; Stier, K.; Hensgen, L.; Checinski, M.P.; Apfel, U.P. Trimetallic Pentlandites (Fe,Co,Ni)9S8for the Electrocatalytical HER in Acidic Media. ACS Mater. Au 2022, 2, 474–481. [Google Scholar] [CrossRef]
  20. Smialkowski, M.; Tetzlaff, D.; Hensgen, L.; Siegmund, D.; Apfel, U.P. Fe/Co and Ni/Co-pentlandite type electrocatalysts for the hydrogen evolution reaction. Chin. J. Catal. 2021, 42, 1360–1369. [Google Scholar] [CrossRef]
  21. Mikuła, A.; Kubowicz, M.; Smialkowski, M.; Sanden, S.; Apfel, U.-P. Tuning the Electrocatalytic Properties of Trimetallic Pentlandites: Stability and Catalytic Activity as a Function of Material Form and Selenium Concentration. ACS Mater. Lett. 2024, 6, 1581–1592. [Google Scholar] [CrossRef]
  22. Trotochaud, L.; Ranney, J.K.; Williams, K.N.; Boettcher, S.W. Solution-cast metal oxide thin film electrocatalysts for oxygen evolution. J. Am. Chem. Soc. 2012, 134, 17253–17261. [Google Scholar] [CrossRef]
  23. Bentley, C.L.; Andronescu, C.; Smialkowski, M.; Kang, M.; Tarnev, T.; Marler, B.; Unwin, P.R.; Apfel, U.; Schuhmann, W. Local Surface Structure and Composition Control the Hydrogen Evolution Reaction on Iron Nickel Sulfides. Angew. Chem.–Int. Ed. 2018, 57, 4093–4097. [Google Scholar] [CrossRef] [PubMed]
  24. Zhao, Z.; Liu, H.; Gao, W.; Xue, W.; Liu, Z.; Huang, J.; Pan, X.; Huang, Y. Surface-Engineered PtNi-O Nanostructure with Record-High Performance for Electrocatalytic Hydrogen Evolution Reaction. J. Am. Chem. Soc. 2018, 140, 9046–9050. [Google Scholar] [CrossRef] [PubMed]
  25. Xiao, P.; Yan, Y.; Ge, X.; Liu, Z.; Wang, J.Y.; Wang, X. Investigation of molybdenum carbide nano-rod as an efficient and durable electrocatalyst for hydrogen evolution in acidic and alkaline media. Appl. Catal. B Environ. 2014, 154–155, 232–237. [Google Scholar] [CrossRef]
  26. Gao, W.; Shi, Y.; Zhang, Y.; Zuo, L.; Lu, H.; Huang, Y.; Fan, W.; Liu, T. Molybdenum Carbide Anchored on Graphene Nanoribbons as Highly Efficient All-pH Hydrogen Evolution Reaction Electrocatalyst. ACS Sustain. Chem. Eng. 2016, 4, 6313–6321. [Google Scholar] [CrossRef]
  27. Zhang, R.; Wang, X.; Yu, S.; Wen, T.; Zhu, X.; Yang, F.; Sun, X.; Wang, X.; Hu, W. Ternary NiCo2Px Nanowires as pH-Universal Electrocatalysts for Highly Efficient Hydrogen Evolution Reaction. Adv. Mater. 2017, 29, 2–7. [Google Scholar] [CrossRef] [PubMed]
  28. Puring, K.J.; Piontek, S.; Smialkowski, M.; Burfeind, J.; Kaluza, S.; Doetsch, C.; Apfel, U.-P. Simple methods for the preparation of non-noble metal bulk-electrodes for electrocatalytic applications. J. Vis. Exp. 2017, 2017, 4–9. [Google Scholar] [CrossRef]
  29. Lu, L.; Yu, S.; Tian, H. Theoretical insight into surface structures of pentlandite toward hydrogen evolution. J. Colloid Interface Sci. 2022, 607, 645–654. [Google Scholar] [CrossRef]
  30. Knop, O.; Ibrahim, M.A. Chalkogenides of the transition elements: II. Existence of the π phase in the M9S8 section of the system Fe–Co–Ni–S. Can. J. Chem. 1961, 39, 297–317. [Google Scholar] [CrossRef]
  31. McCrory, C.C.L.; Jung, S.; Ferrer, I.M.; Chatman, S.M.; Peters, J.C.; Jaramillo, T.F. Benchmarking Hydrogen Evolving Reaction and Oxygen Evolving Reaction Electrocatalysts for Solar Water Splitting Devices. J. Am. Chem. Soc. 2015, 137, 4347–4357. [Google Scholar] [CrossRef] [PubMed]
  32. Kresse, G.; Hafner, J. Ab initio molecular dynamics for liquid metals. Phys. Rev. B 1993, 47, 558–561. [Google Scholar] [CrossRef] [PubMed]
  33. Kresse, G.; Furthmüller, J. Efficiency of ab-initio total energy calculations for metals and semiconductors using a plane-wave basis set. Comput. Mater. Sci. 1996, 6, 15–50. [Google Scholar] [CrossRef]
  34. Kresse, G.; Furthmuller, J. Efficient iterative schemes for ab initio total-energy calculations using a plane-wave basis set. J. Phys. Chem. A 2020, 124, 4053–4061. [Google Scholar] [CrossRef] [PubMed]
  35. Hong, W.T.; Welsch, R.E.; Shao-Horn, Y. Descriptors of Oxygen-Evolution Activity for Oxides: A Statistical Evaluation. J. Phys. Chem. C 2016, 120, 78–86. [Google Scholar] [CrossRef]
  36. Hong, W.T.; Stoerzinger, K.A.; Lee, Y.-L.; Giordano, L.; Grimaud, A.; Johnson, A.M.; Hwang, J.; Crumlin, E.J.; Yang, W.; Shao-Horn, Y. Charge-transfer-energy-dependent oxygen evolution reaction mechanisms for perovskite oxides. Energy Environ. Sci. 2017, 10, 2190–2200. [Google Scholar] [CrossRef]
  37. Giuffredi, G.; Asset, T.; Liu, Y.; Atanassov, P.; Di Fonzo, F. Transition Metal Chalcogenides as a Versatile and Tunable Platform for Catalytic CO2and N2Electroreduction. ACS Mater. Au 2021, 1, 6–36. [Google Scholar] [CrossRef]
  38. Momma, K.; Izumi, F. VESTA 3 for three-dimensional visualization of crystal, volumetric and morphology data. J. Appl. Crystallogr. 2011, 44, 1272–1276. [Google Scholar] [CrossRef]
  39. Perdew, J.P.; Burke, K.; Ernzerhof, M. Generalized Gradient Approximation Made Simple. ACS Appl. Mater. Interfaces 1996, 77, 3865–3868. [Google Scholar] [CrossRef] [PubMed]
  40. Piontek, S.; Andronescu, C.; Zaichenko, A.; Konkena, B.; Puring, K.J.; Marler, B.; Antoni, H.; Sinev, I.; Muhler, M.; Mollenhauer, D.; et al. Influence of the Fe:Ni Ratio and Reaction Temperature on the Efficiency of (FexNi1-x)9S8 Electrocatalysts Applied in the Hydrogen Evolution Reaction. ACS Catal. 2018, 8, 987–996. [Google Scholar] [CrossRef]
  41. Tang, Y.; Yang, H.; Sun, J.; Xia, M.; Guo, W.; Yu, L.; Yan, J.; Zheng, J.; Chang, L.; Gao, F. Phase-pure pentlandite Ni4.3Co4.7S8 binary sulfide as an efficient bifunctional electrocatalyst for oxygen evolution and hydrogen evolution. Nanoscale 2018, 10, 10459–10466. [Google Scholar] [CrossRef] [PubMed]
  42. Zhou, J.; Dou, Y.; He, T.; Zhou, A.; Kong, X.-J.; Wu, X.-Q.; Liu, T.; Li, J.-R. Revealing the effect of anion-tuning in bimetallic chalcogenides on electrocatalytic overall water splitting. Nano Res. 2021, 14, 4548–4555. [Google Scholar] [CrossRef]
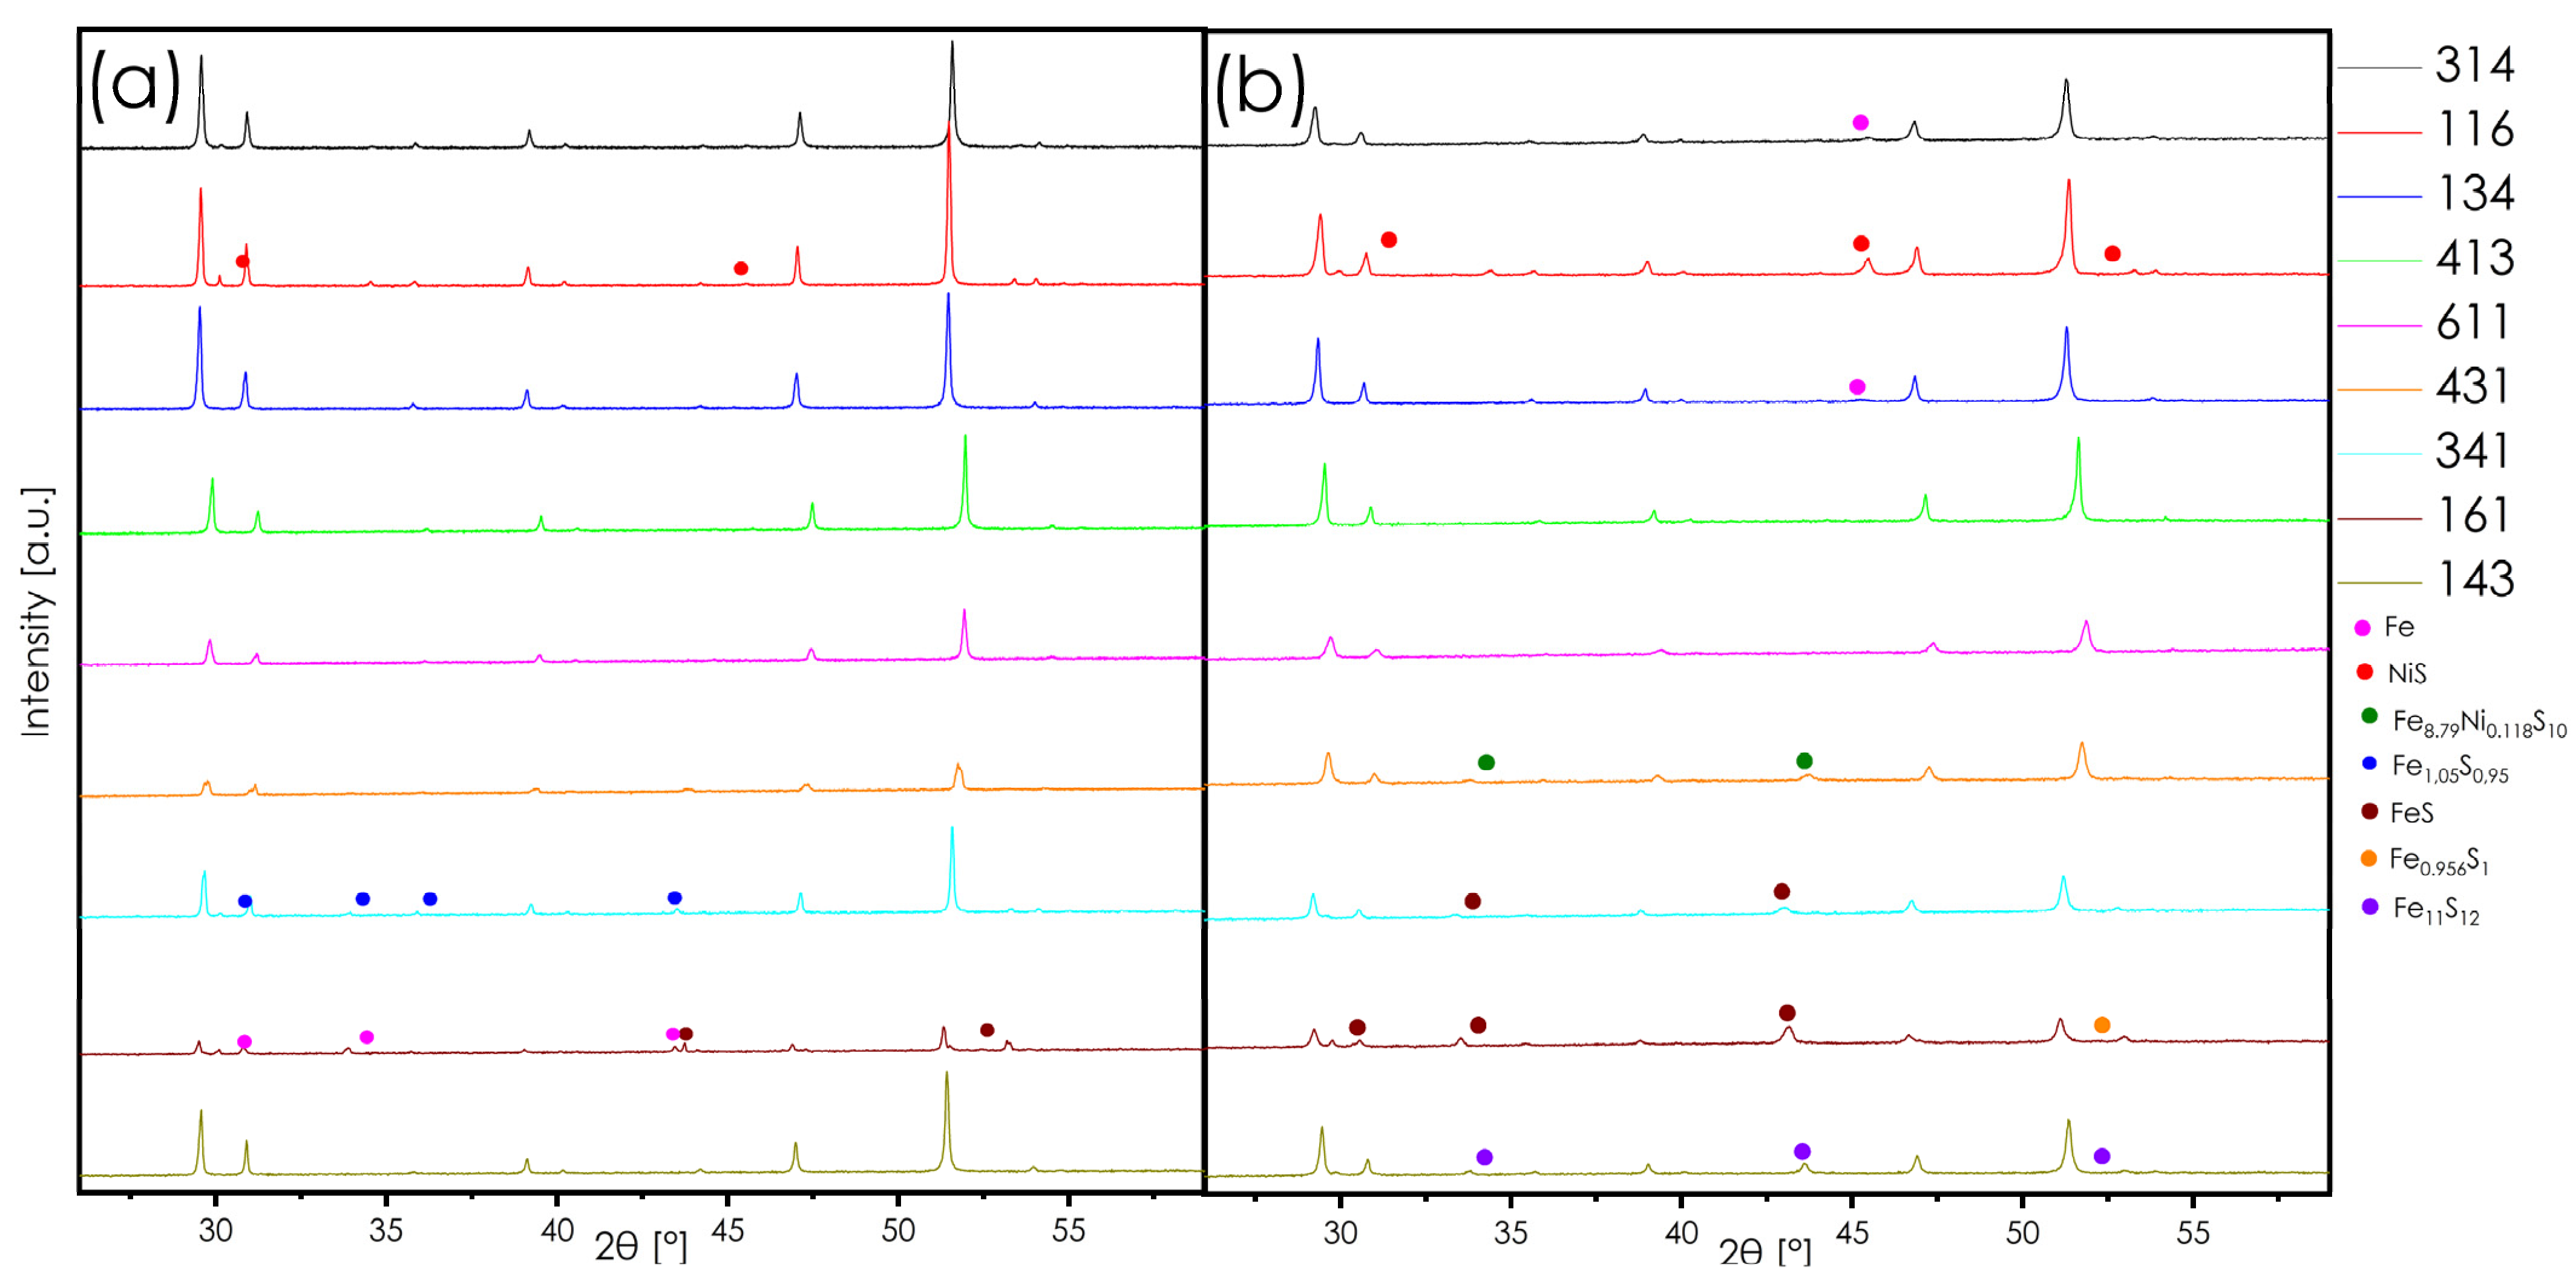
Figure 1. XRD patterns of (a) powder/ingot and (b) pellet samples.
Energies 17 02261 g001
Figure 2. Schematic representation of 2 × 2 × 2 supercells: “314” (a), “116” (b), “134” (c), “413” (d), “611” (e), “431” (f), “341” (g), “161” (h), “143” (i).
Energies 17 02261 g002
Figure 3. Electronic structure descriptors as a function of chemical composition (a); formation energy as a function of the dbc (b).
Energies 17 02261 g003
Figure 4. Working surface area (a) together with estimated changes in ECSA (b) and RF (c) prior to and after chronoamperometric measurements.
Energies 17 02261 g004
Figure 5. LSV curves recorded in 0.5 M H2SO4 at 6.25 [mV/s] sweep rate and normalized to ECSA for: (a) pellets before chronoamperometry; (b) ingots before chronoamperometry; (c) powders before chronoamperometry; (d) pellets after chronoamperometry; (e) ingots after chronoamperometry; and (f) powders after chronoamperometry.
Energies 17 02261 g005
Figure 6. Tafel slope recorded in 0.5 M H2SO4 at 6.25 [mV/s] sweep rate and normalized to ECSA for (a) pellets before chronoamperometry; (b) ingots before chronoamperometry; (c) powders before chronoamperometry; (d) pellets after chronoamperometry; (e) ingots after chronoamperometry; and (f) powders after chronoamperometry.
Energies 17 02261 g006
Figure 7. LSV curves recorded in 0.5 M H2SO4 at 6.25 [mV/s] weep rate and normalized to geometrical surface for (a) pellets before chronoamperometry; (b) ingots before chronoamperometry; (c) powders before chronoamperometry; (d) pellets after potentiometry; (e) ingots after chronoamperometry; (f) and powders after chronoamperometry.
Energies 17 02261 g007
Figure 8. Tafel slope values recorded in 0.5 M H2SO4 at 6.25 [mV/s] sweep rate and normalized to the geometric surface for (a) pellets before chronoamperometry; (b) ingots before chronoamperometry; (c) powders before chronoamperometry; (d) pellets after chronoamperometry; (e) ingots after chronoamperometry; and (f) powders after chronoamperometry.
Energies 17 02261 g008
Figure 9. General relationship between the chemical composition, RF, ƞECSA, ƞGEO, and Tafel slopes for (a) pellets; (b) ingots; and (c) powders.
Energies 17 02261 g009
Figure 10. LSV curves recorded in 0.5 M H2SO4 at [6.25 mV/s] sweep rate and normalized to (a) ECSA and (b) geometrical area for Co1,5Fe1,5Ni6S8 pellet.
Energies 17 02261 g010
Figure 11. SEM micrographs together with EDX elemental mapping for Co1.5Fe1.5Ni6S8 sintered pellet: (a) pre-measurement area; (b) post-measurement area; and (c) border of areas affected (left-top) and unaffected (right-bottom) by HER processing.
Energies 17 02261 g011
Table 1. Structured nomenclature of the samples studied in this work.
Nominal Chemical CompositionPelletIngotPowder
Co3Fe1.5Ni4.5S8Pe314In314Po314
Co1.5Fe1.5Ni6S8Pe116In116Po116
Co1.5Fe3Ni4.5S8Pe134In134Po134
Co4.5Fe1.5Ni3S8Pe413In413Po413
Co6Fe1.5Ni1.5S8Pe611In611Po611
Co4.5Fe3Ni1.5S8Pe431In431Po431
Co3Fe4.5Ni1.5S8Pe341In341Po341
Co1.5Fe6Ni1.5S8Pe161In161Po161
Co1.5Fe4.5Ni3S8Pe143In143Po143
Table 2. ECSA and RF values for Co1.5Fe1.5Ni6S8 pellet.
ECSA [cm−2 ×10³]RF [- ×103]
Pre1.7214.23
Post 13.3227.46
Post 24.2435.08
Disclaimer/Publisher’s Note: The statements, opinions and data contained in all publications are solely those of the individual author(s) and contributor(s) and not of MDPI and/or the editor(s). MDPI and/or the editor(s) disclaim responsibility for any injury to people or property resulting from any ideas, methods, instructions or products referred to in the content.