Article

Levelized Cost of Biohydrogen from Steam Reforming of Biomethane with Carbon Capture and Storage (Golden Hydrogen)—Application to Spain

1
Rafael Mariño Chair in New Energy Technologies, Comillas Pontifical University, Alberto Aguilera 25, 28015 Madrid, Spain
2
Repsol Foundation Chair in Energy Transition, Comillas Pontifical University, Alberto Aguilera 25, 28015 Madrid, Spain
3
Institute for Research in Technology, Comillas Pontifical University, Santa Cruz de Marcenado 26, 28015 Madrid, Spain
*
Author to whom correspondence should be addressed.
Energies 2024, 17(5), 1134; https://doi.org/10.3390/en17051134
Submission received: 29 January 2024 / Revised: 20 February 2024 / Accepted: 25 February 2024 / Published: 27 February 2024
(This article belongs to the Special Issue Advances in Hydrogen Energy III)

Abstract

:
The production of biohydrogen with negative CO2 emissions through the steam methane reforming of biomethane, coupled with carbon capture and storage, represents a promising technology, particularly for industries that are difficult to electrify. In spite of the maturity of this technology, which is currently employed in the production of grey and blue hydrogen, a detailed cost model that considers the entire supply chain is lacking in the literature. This study addresses this gap by applying correlations derived from actual facilities producing grey and blue hydrogen to calculate the CAPEX, while exploring various feedstock combinations for biogas generation to assess the OPEX. The analysis also includes logistic aspects, such as decentralised biogas production and the transportation and storage of CO2. The levelized cost of golden hydrogen is estimated to range from EUR 1.84 to 2.88/kg, compared to EUR 1.47/kg for grey hydrogen and EUR 1.93/kg for blue hydrogen, assuming a natural gas cost of EUR 25/MWh and excluding the CO2 tax. This range increases to between 3.84 and 2.92, with a natural gas cost of EUR 40/MWh with the inclusion of the CO2 tax. A comparison with conventional green hydrogen is performed, highlighting both prices and potential, thereby offering valuable information for decision-making.

1. Introduction

The energy crisis that Europe is experiencing, as well as global warming, have highlighted the need to decarbonise the energy sector. Hydrogen is considered a key vector for achieving this goal. Several international production targets have been set, such as 20 Mt by 2030 in the European Union [1]. In the case of Spain, current production is about 600 kt [2]; whereas, the National Hydrogen Roadmap aims to install 4 GW of electrolysers (approximately 400 kt) by 2030 [3]. This target has been recently updated in the draft published in June 2023 of the National Integrated Energy and Climate Plan (NIECP) to 11 GW (1100 kt) by 2030 [4].
Currently, the majority of globally produced hydrogen comes from the process known as steam methane reforming (SMR) of natural gas. In 2021, 62% of the production was attributed to this method [5]. The SMR process yields a gas with a high concentration of hydrogen (round to 75%), along with additional amounts of methane (2–6%), carbon monoxide (7–10%) and carbon dioxide (6–14%) [6]. Furthermore, the water–gas shift reaction process transforms carbon monoxide into hydrogen and carbon dioxide. Equations (1) and (2) show the two reactions mentioned above.
C H 4 + H 2 O C O + 3 H 2
C O + H 2 O C O 2 + H 2
Hydrogen produced by SMR is designated as grey hydrogen, emitting about 9 kg of CO2 per kg of hydrogen produced. In order to decarbonise this production, it is possible to replace the natural gas with biomethane, producing the so-called biohydrogen [7]. Such biohydrogen is labelled as renewable [8], and might even generate negative emissions [7]. This is because the biomethane, derived from organic waste, contains carbon captured from the atmosphere by plants. These plants are eventually converted into organic waste, with plants and livestock serving as intermediate transformers. Thus, if the CO2 captured in the SMR process is stored (CCS), it is definitely removed from the atmosphere, generating negative emissions. The authors have proposed the label “golden” for this biohydrogen with negative emissions based on SMR with CCS from biomethane [9], as the hydrogen might be considered as green, which would be transformed into yellow (golden) if we assimilate the CCS with the blue colour.
Spain has a high potential for the production of biogas from organic waste. Preliminary estimations identified a potential range from 44 TWh/year [10] to 60–90 TWh/year [11]. The most comprehensive and recent study by the Spanish gas association (SEDIGAS) [12] estimates a potential of 163 TWh/year. The production of biogas is carried out through the process known as anaerobic digestion, which is the first step to obtain biomethane. This widely known process has an efficiency in the range of 72–85% [13]. After obtaining biogas, it is necessary to convert it into biomethane. This conversion process is designated as upgrading, where impurities and CO2 in the biogas are removed, obtaining nearly pure methane, indistinguishable from natural gas. Figure 1 summarises the procedure to produce golden hydrogen.
Regarding CO2, there are two stages in which it is produced, as sketched in Figure 1: the first is during the upgrading of the biogas and the second is during the reforming of the biomethane. To obtain golden hydrogen, capturing the CO2 from the SMR process is proposed, due to the complexity in managing the CO2 released in the upgrading, given the numerous biogas facilities distributed throughout the country. Since it is a process with a high concentration of CO2, the capture efficiency can reach a yield of 90% [5]. Between 2013 and 2020, three large facilities (capturing more than 0.8 Mt CO2/year) in the world produced blue hydrogen: one in the US (2013) with a capture capacity of 1 Mt CO2/year, and two in Canada with 1 Mt CO2/year (2015) and 1.3 Mt CO2/year (2020). In the same period, the total number of facilities incorporating large carbon capture units was 21, with an overall capture capacity of 39.4 Mt CO2/year [14]. The starting of nine large facilities between 2026 and 2030 has been announced in the UK, with an initial overall foreseen capture of 14.5 Mt CO2/year [15]. The Spanish Geological Survey has carried out a study identifying the preferred locations for storage in Spain [16], developing a map [17], where the total estimated capacity is higher than 11 Gt.
The use of biohydrogen with negative emissions (HyBECCS) is garnering significant attention from the research community. Rosa et al. [18] assessed the potential in Europe of HyBECCS derived from biogas by SMR with CCS. They focus on this technology due to its maturity (technology readiness level of nine for SMR and from seven to eight for SMR with CCS). Proposed substrates included crop residues, urban organic waste and livestock manure, with the study examining the supply chain’s integration of production and demand. Negative emissions emerged as a powerful tool for decarbonising hard-to-electrify sectors, and it was possible to integrate several energy carriers in a flexible way to achieve them.
In this sense, Moioli et al. [19] proposed the use of biomass to produce renewable gases through two methods: anaerobic digestion of organic waste to generate biogas and biomass gasification to produce syngas, which is subsequently converted to hydrogen. In both cases, biogenic CO2 is produced, which can either be stored to achieve negative emissions or combined with hydrogen from electrolysis with renewable sources to produce biogenic synthetic methane. This approach envisages a complex system that transforms biomass, organic waste and surplus renewable electricity into biomethane, synthetic biogenic methane or other synthetic biofuels and negative CO2 emissions.
Lefranc et al. [20] explored the application of golden hydrogen in fuelling a bus fleet in Madrid, demonstrating that negative emissions allowed for saving biomethane when golden hydrogen powers the buses equipped with fuel cells. Yagüe et al. [21] assessed its application in the tile sector, revealing substantial resource savings attributed to the negative emissions, which added an extra decarbonising capacity to golden hydrogen, in being more efficient in the use of the biomethane for the same level of decarbonising.
While the production of HyBECCS from biomethane via SMR offers notable benefits such as the use of existing infrastructure, technology maturity and stable feedstock prices, it is not the sole method for HyBECCS production. Full et al. [22] investigated dark photosynthesis with CCS as an alternative biohydrogen production with negative emissions production pathway. They report a levelized hydrogen cost ranging from EUR 4/kg without CO2 revenue internalization to EUR 0.44/kg when accounting for it, based on a EUR 195/t CO2 price for negative emissions.
The key to the negative emissions lies in the CO2 supply chain management, as it was revealed in a recent communication from the European Commission to the Parliament [23]. In this document, an EU-wide industrial carbon management strategy was proposed that included the following: CO2 capture for storage, from both fossil and biogenic sources, and direct atmospheric removal and utilization of captured CO2, for example, for industrial uses such as synthetic fuels. Whilst initially both fossil and biogenic CO2 might be used by industry, a shift towards biogenic CO2 is foreseen for greater climate benefits. The Commission also envisages some challenges in managing this CO2, particularly due to regulatory issues and the European Trade System’s failure to recognise negative emissions. This lack of recognition complicates the assignment of a market price to the captured and stored biogenic CO2, thereby not providing incentives for this process. The European Commission has also recently released a report [24] assessing the required transport network to manage the captured CO2 between potential sources to users and storage. The authors estimate a need for a 19,000 km network from 2025 to 2050 with a required investment range of EUR 9.3 billion–EUR 23.1 billion; it is recommended that the development of storage capacities be located in southern and eastern Europe to reduce investment costs. The cross-border problems are also analysed, concluding that quality standards for transport and storage are essential.
As it is shown in the literature review, the analysis of biohydrogen with negative emissions is an emerging research area, encouraged by an increasing interest in carbon capture and storage technologies. Although the different processes involved are known, a detailed cost analysis encompassing the entire supply chain is missing.
In this paper, a detailed study of the different stages of golden hydrogen production and the costs associated with each of them has been conducted to assess economic viability, translated into the levelized cost of hydrogen (LCOH). The process encompasses the production of biogas, the subsequent upgrading, injection of biomethane into the natural gas grid, production of hydrogen in centralised hubs with CO2 capture and finally, its transport and storage in geological sites. After a validation of the methodology with current costs of grey and blue hydrogen, the model is applied to four scenarios for golden hydrogen production, each involving different substrates and volumes of biomethane according to actual forecasts in Spain. This part of the supply chain has been revealed as a key issue, affecting not only the cost, but also the availability of golden hydrogen. Special attention was given to the locations of the production plant and the storage site, taking into account their impacts on the transport network for both hydrogen and CO2. A sensitivity analysis was carried out to reveal the key aspects affecting the LCOH and a comparison with the current costs of grey, blue and green hydrogen was made. The results facilitate the identification of stages with a greater relative impact on the LCOH, providing insights for cost optimization.

2. Methodology

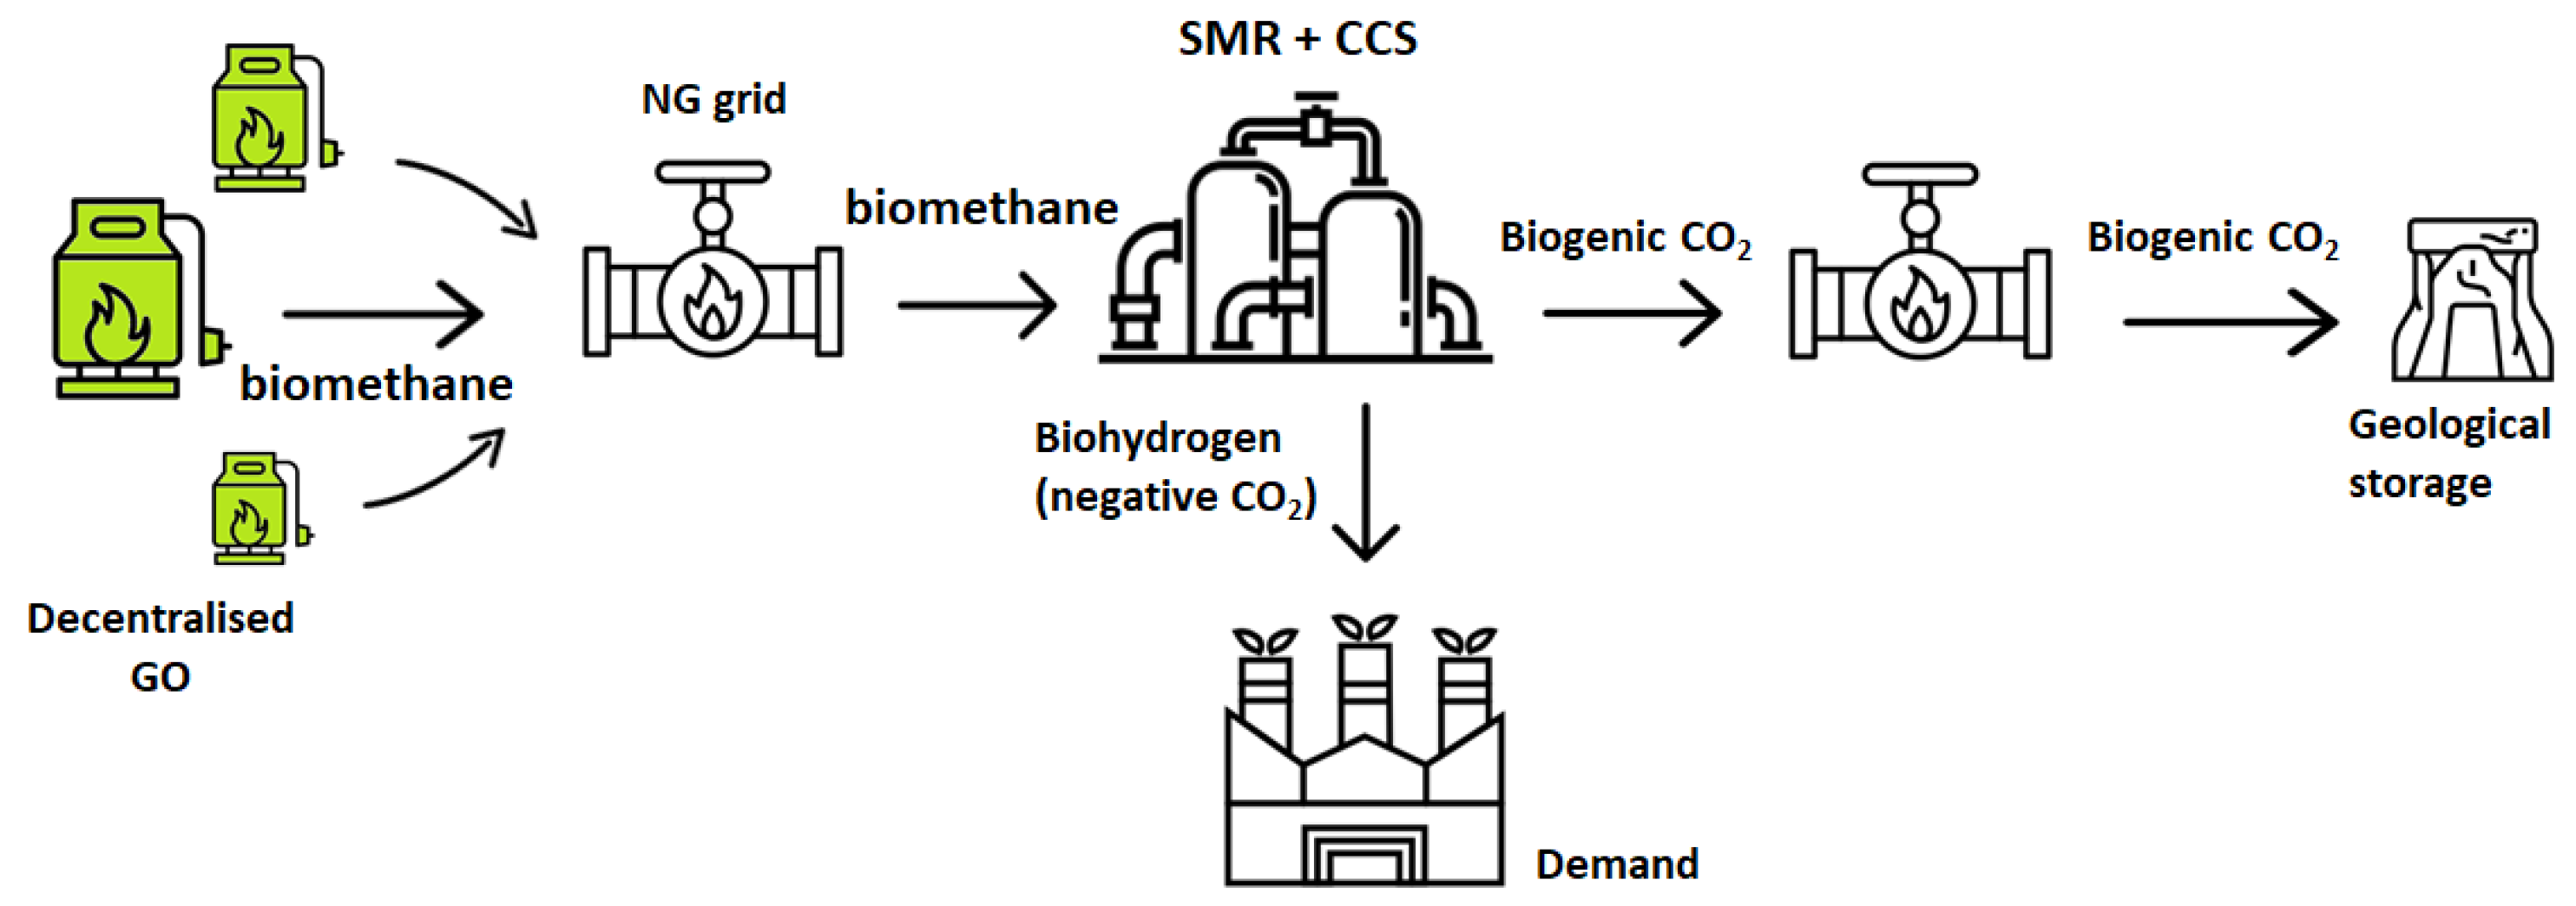
2.1. Golden Hydrogen Production and Supply Chain

The key to golden hydrogen lies in the use of a mature technology such as steam methane reforming, but replacing the usual feedstock, natural gas, with biomethane. The SMR process consists of two steps, summarised in Equations (1) and (2). The first step involves the reforming of methane with steam, producing CO and H2. Since this reaction is endothermic and requires temperatures in the range of 700 °C–1100 °C [25], an additional quantity of methane is burned to achieve these conditions. The second step of the process aims to increase the hydrogen production, and involves the water gas shift reaction, shown in Equation (2). The burning of the additional quantity of methane leads to a reduction in hydrogen production, summarised in Equation (3), where HMR represents the hydrogen-to-methane ratio, η S M R stands for the efficiency of the process and LHV represents the lower heating value of methane (9.952 kWh/Nm3) and hydrogen (3 kWh/Nm3).
H M R = η S M R · L H V C H 4 L H V H 2
The mass ratio of carbon dioxide to hydrogen (CHMR) is given by Equation (4), where M stands for the molar mass of CO2 (44 kg/kmol) and H2 (2 kg/kmol).
C H M R = M C O 2 H M R   ·   M H 2
Regarding the carbon dioxide capture potential, if the CO2 capture system is placed on the flue gas using monoethanolamine, the most optimal capture rate can be obtained (90%) [26]. Employing typical efficiency values [26], Soler et al. [9] obtained the results listed in Table 1, where the mass of hydrogen obtained regarding methane consumption was assessed.
As the key difference between golden hydrogen and blue hydrogen lies in the replacement of natural gas with biomethane, it is necessary to include its management in the supply chain, as outlined in Figure 2. Regarding the biomethane, it is obtained in a distributed way from different substrates. In 2023, there were 12 plants operating in Spain, with an overall production of 522 GWh/year and other 19 plants in construction with a total anticipated production of 1197 GWh/year [9]. Each plant injects its production into the natural gas (NG) grid, commercializing it through guaranties of origin (GO) certificates, approved in Spain in 2023 [27]. A guarantee of origin certificate is an electronic certificate for 1 MWh of renewable gas, including its tracking. Once the biomethane is available in the grid, the centralized SMR + CCS plant redeems the required GOs and produces hydrogen and biogenic CO2. As mentioned earlier, 90% of the CO2 released by the SMR plant is captured, while the remaining 10% is released into the atmosphere. The costs and issues of transporting CO2 are lower than in the case of hydrogen, so the SMR + CCS plant is preferably located close to the demand, and the captured CO2 is injected into the CO2 grid, and transported in supercritical state to the geological storage sites [28]. In Spain, the most available sites for storage are deep saline aquifers, with existing experimental works in Hontomín (Burgos) [29].

2.2. Levelized Cost of Hydrogen

To determine the cost of hydrogen production, the levelized cost of hydrogen was employed, using the formulation of Bejan [30]. The LCOH consists of two components: capital expenditure (CAPEX) and operational expenditure (OPEX), as outlined in Equation (5).
L C O H = C A P E X + O P E X
The CAPEX is determined by Equation (6), where INV represents the investment, HP is the annual hydrogen production and CRF is the capital recovery factor.
C A P E X = I N V · C R F H P
The capital recovery factor is given by Equation (7), where wacc is the weighted average capital cost, and N is the lifespan of the project.
C R F = w a c c · 1 + w a c c N 1 + w a c c N 1
Regarding the OPEX (Equation (8)), it includes the cost of biomethane (bm), operation and maintenance (om) and the cost of CO2 management (CO2).
O P E X = O P E X b m + C o m · C E L F o m + O P E X C O 2
The cost of biomethane (Equation (9)) includes the cost of biogas (bg), upgrading (ug) and injection into the natural gas grid (inj).
O P E X b m = C b g · C E L F b g + C u g · C E L F u g + C i n j · C E L F i n j
The cost of CO2 management (Equation (10)) includes the cost of transportation from the SMR plant to the geological storage site (tpt), injection and storage in the geological site (stg) and the CO2 tax (tax).
O P E X C O 2 = C t p t · C E L F t p t + C s t g · C E L F s t g C t a x · C E L F t a x
The cost of any x-th item (Cx) is given at year zero in a mass basis (EUR/kg H2), and all of them are accumulated and annualized using the constant escalation levelization factor (CELF), given in Equation (11). For Equations (11) and (12), r is the nominal escalation rate (equal to zero for all items except for the carbon tax).
C E L F x = k x · 1 k x N 1 k x · C R F
k x = 1 + r x 1 + w a c c x
Considering r equal is to zero leads to the factor in brackets in Equation (11) being equal to the inverse of the capital recovery factor CRF and thus the constant levelization factor CELFX becomes one. The weighted average capital cost used is 8%, according to the International Energy Agency (IEA) [14].

2.3. Considerations on CO2

In this work, CO2 was only captured in the SMR plant, not in the upgrading process. This is seen as a preliminary step in deploying this technology, facilitating the transportation of CO2 to its geological storage site from concentrated generation points. Therefore, the CO2 removed in the upgrading process was released into the atmosphere for simplicity, although it might be commercialised as biogenic CO2 for e-fuels production. In order to assign an economic value to the captured CO2, two possibilities were considered. On one hand, negative emissions might be commercialised in a future trade system (currently not allowed). On the other hand, the CO2 might be used to produce e-fuels or green chemicals. In the latter case, no negative emissions would be accounted for (except if the CO2 remains in the chemical product) but the economic value assigned can be taken as the one in the trade system, as biogenic CO2 is replacing fossil one. Such cost would be accounted for as negative, as it would be considered an income. In any case, EUR 80/t CO2 was taken as the cost for the CO2 removed [31]. This value was updated with a nominal rate of 8%, according to the IEA, which considers a CO2 tax in 2019 of EUR 15/t CO2 and of EUR 180/t CO2 in 2050 [14], thus resulting in 8.3%.

2.4. Cost of Biomethane

The costs associated with biomethane include three main components: production of biogas, upgrading to biomethane and grid injection. The biogas cost depends on the substrate used in its production. Table 2 summarises the main substrates available in Spain [10]. It is evident that the collection process significantly influences the cost, with substrates linked to urban waste having lower costs. Using the hydrogen production ratio given in Table 1 (18.54 t H2/GWh-HHV CH4) and the lower and higher heating value of methane (9.952 kWh/Nm3 and 11.04 kWh/Nm3, respectively), the cost of biogas can be obtained per unit of mass of hydrogen produced, as summarised in Equation (13), where Cbge stands for the cost of biogas per unit of energy (EUR/MWh-LHV).
C b g = 0.04862 · C b g e
The second step in producing biomethane involves the upgrading of the biogas, which includes a cleaning process to remove impurities (such as H2S and others), obtaining a mixture of CO2 and CH4, followed by a second operation to remove the CO2. A scaling behaviour is observed in these costs, with Table 3 providing representative values based on the volume flow rate of the treated biogas [10]. Taking into account the heating values of CH4 and the hydrogen production ratio when CCS is applied (18.54 t H2/GWh HHV CH4), it is possible to obtain the curve fit given in Equation (14), where Qbg stands for the volume flow rate of biogas (Nm3/h).
C u g = 3.84 · Q b g 0.265
The average production of biomethane plants in Spain in 2023 was 545 Nm3/h [32]. Assuming a concentration of 65% of methane in biogas [10], the average biogas flow rate was 838 Nm3/h. Thus, the upgrading cost can be assessed for this average flow rate, resulting in EUR 0.645/kg H2.
The last cost associated with biomethane is the injection cost for different flow rates, as given in Table 4 [10]. Applying the same conversion as in the upgrading process, Equation (15) is derived.
C i n j = 50.35 · Q b g 0.758
Using the average production of biomethane plants in Spain, the injection cost results in EUR 0.306/kg H2.

2.5. Investment of SMR Plant

Lipman [6] provided the levelized cost of hydrogen obtained from natural gas using SMR with and without CCS, along with information on efficiency, natural gas cost and plant size. Table 5 displays the values obtained without CCS, and Table 6 includes the values with CCS. The costs are given in USD 2003, which were converted into EUR 2020 subsequently. In both tables, the last column (cNG_cH2, share of the natural gas cost in the LCOH) was calculated in the current study, assuming that the LCOH depends only on investment and natural gas costs, that is, neglecting the operation and maintenance costs. In this sense, the investment cost obtained includes a conservative margin. The cNG_cH2 value was derived from Equation (16), where CNG stands for the cost of natural gas (USD/GJ) and CH2 represents the levelized cost of hydrogen (USD/GJ).
c N G _ c H 2 = C N G C H 2   ·   η S M R
In Table 5 and Table 6, it is observed that cNG_cH2 increases with the production (size) of the plant. In other words, the relative investment cost decreases as the size of the plant increases.
Utilizing Equation (16) and neglecting the operation and maintenance costs, as mentioned earlier, the investment of the plant could be expressed by Equation (17). In this equation, the higher heating value of hydrogen (39.38 kWh/kg) was used; INV stands for the investment (USD2003) and P represents the hydrogen production (kg/day). Table 7 provides the resulting investment.
I N V = C H 2 · 39.38 · 3600 10 6 · 1 c N G _ c H 2 · P · 365 C R F
Applying Equation (17), the scaling law given in Equation (18) was obtained, with the currency (dollars) referred to year 2003.
I N V n o C C S _ 2003 = 44,068 · P 0.713
The investment for the plant with CCS was obtained as a summation of Equation (18) plus another scaling law that measures the difference between both plants. By applying Equations (16) and (17) to Table 6, the investment of SMR with CCS was obtained (third column in Table 8). Subtracting from it the investment corresponding to the second and third rows in Table 7 (no CCS plant investment for the same hydrogen production), the fourth column in Table 8 was achieved, representing the incremental cost of the CCS plant compared to no CCS. The scaling law for this difference is given in Equation (19), and thus the investment in SMR plants with CCS is expressed by Equation (20), with the currency (dollars) referred to 2003.
I N V C C S _ 2003 I N V n o C C S _ 2003 = 6132 · P 0.8592
I N V C C S _ 2003 = 44,068 · P 0.713 + 6132 · P 0.8592
The scaling laws obtained in Equations (18) and (20) should be updated to the current time. Instead of applying a time scaling factor, such as CEPCI (chemical engineering plant cost index) or a similar metric, data from the IEA Greenhouse Gas R&D Programme (IEAGHG) [33] were used. In this report, the cost for a SMR plant producing 100,000 Nm3/h (214,286 kg/day) of hydrogen with and without CCS is provided, referred to 2020. The investment without CCS was EUR 175.35 million, whereas with CCS, it reached EUR 308.96 million. By maintaining the scale factor and updating the constants in Equations (18) and (20), Equations (21) and (22) were derived, with the currency (euros) referred to 2020.
I N V n o C C S = 27,727 · P 0.713
I N V C C S = 27,727 · P 0.713 + 3511 · P 0.8592

2.6. Cost of Operation and Maintenance of SMR Plant

The report of the IEAGHG [33] also provides details on the cost of operation and maintenance for the plant with a capacity of 100,000 Nm3/h, summarised in Table 9. This table includes only fixed costs. Regarding variable costs (methane, makeup water, chemicals and catalysts), the cost of methane accounts for 99.4%, so only this cost has been considered for simplicity’s sake. The steam required for the process is usually produced by a cogeneration plant, which also exports electricity to the grid, whose revenue has not been considered. Thus, converting the costs given in Table 9 into relative costs results in EUR 0.096/kg H2 in plants without CCS and EUR 0.148/kg H2 in plants with CCS.

2.7. CO2 Costs

The costs associated with CO2 included biogenic CO2 removed from the SMR flue gases, transportation of CO2 to its geological storage site, injection in this site and the CO2 tax. With the assumed nominal rate (8%) for the CO2 tax (EUR 80/t CO2), its CELF resulted in 2.342. Considering 8.64 t CO2 captured for each ton of hydrogen produced, the levelized cost of CO2 captured was EUR −1.619/kg H2.
The second cost linked to CO2 is the transportation to the geological storage site. Itul et al. [34] estimated costs between EUR 1.8 and 12/t CO2 in the US, depending on distance and volume. In the case of the EU, a typical cost of EUR 5/t CO2 was considered for short onshore pipelines (180 km) and small volumes (2.5 Mt/year). As an indication, in the case of a large plant (609,000 kg/day), the CO2 captured reaches 1.92 Mt CO2/year. To be conservative, an average value of EUR 6.90/t CO2 was considered, which was converted into EUR 0.06/kg H2.
The last cost related to CO2 is storage, also provided in [34]. In the case of deep saline aquifers, the estimated range was EUR 2–12/t CO2. Higher costs (EUR 2–20/t CO2) would be expected for off-shore depleted oil and gas reservoirs. An average value of EUR 11/t CO2 was considered in this work, converted into EUR 0.1/kg H2.

2.8. Assumptions for Validation

In order to validate the model, grey and blue hydrogen LCOH were used for comparison. Three representative natural gas costs were selected: EUR 25, 40 and 60/MWh-HHV. The lowest price corresponded to costs prior to the Ukrainian war, the intermediate cost was similar to the current cost, and the highest cost reflected an intermediate value between the high peaks during the first two years of the mentioned war.
Regarding the size of the plant, three cases were considered: 200 t H2/year, 9000 t H2/year and 300,000 t H2/year, representing small, medium and large units, respectively, according to [6].

2.9. Scenarios Considered

In the case of the biohydrogen, the LCOH is heavily dependent on the biomethane cost, which, in turn, is greatly influenced by the substrate used to obtain biogas. Additionally, biomethane production is limited, so it is necessary to perform an assessment of the potential production of a region or country. This section considers a recent study developed by SEDIGAS [12] regarding the potential of biomethane in Spain. Four scenarios have been considered. Scenario 1 assumes that the substrate is only the organic fraction of municipal solid waste (MSW), with the SMR plant located close to the waste treatment plant, allowing the injection cost of biomethane to be neglected. The annual hydrogen production is set to 2700 tons, based on a treatment plant for 1,000,000 inhabitants [18]. In scenario 2, the mix of substrates and biomethane potential (11.04 TWh) has been taken from [10], which aligns well with the Biogas Roadmap [35] and the NIECP [4] of Spain. Scenarios 3 and 4 consider the analysis carried out by SEDIGAS [12], but with two approximations. This is managed in this way because the most important substrate foreseen by SEDIGAS to produce biomethane is constituted by intermediate crops (58.8 TWh), but it is not clear that such potential can be deployed, at least in the near term. For this reason, scenario 3 considers only 20% of the potential of intermediate crops, whereas scenario 4 includes the total potential foreseen by SEDIGAS. Table 10 summarises the potential of each scenario along with the assumed biogas cost. Weighting each cost with the potential of biomethane, the assessed average biogas cost was EUR 35/MWh for scenario 1, EUR 48.27/MWh for scenario 2, EUR 56.60/MWh for scenario 3 and EUR 60.47/MWh for scenario 4, all on an LHV basis.

3. Results

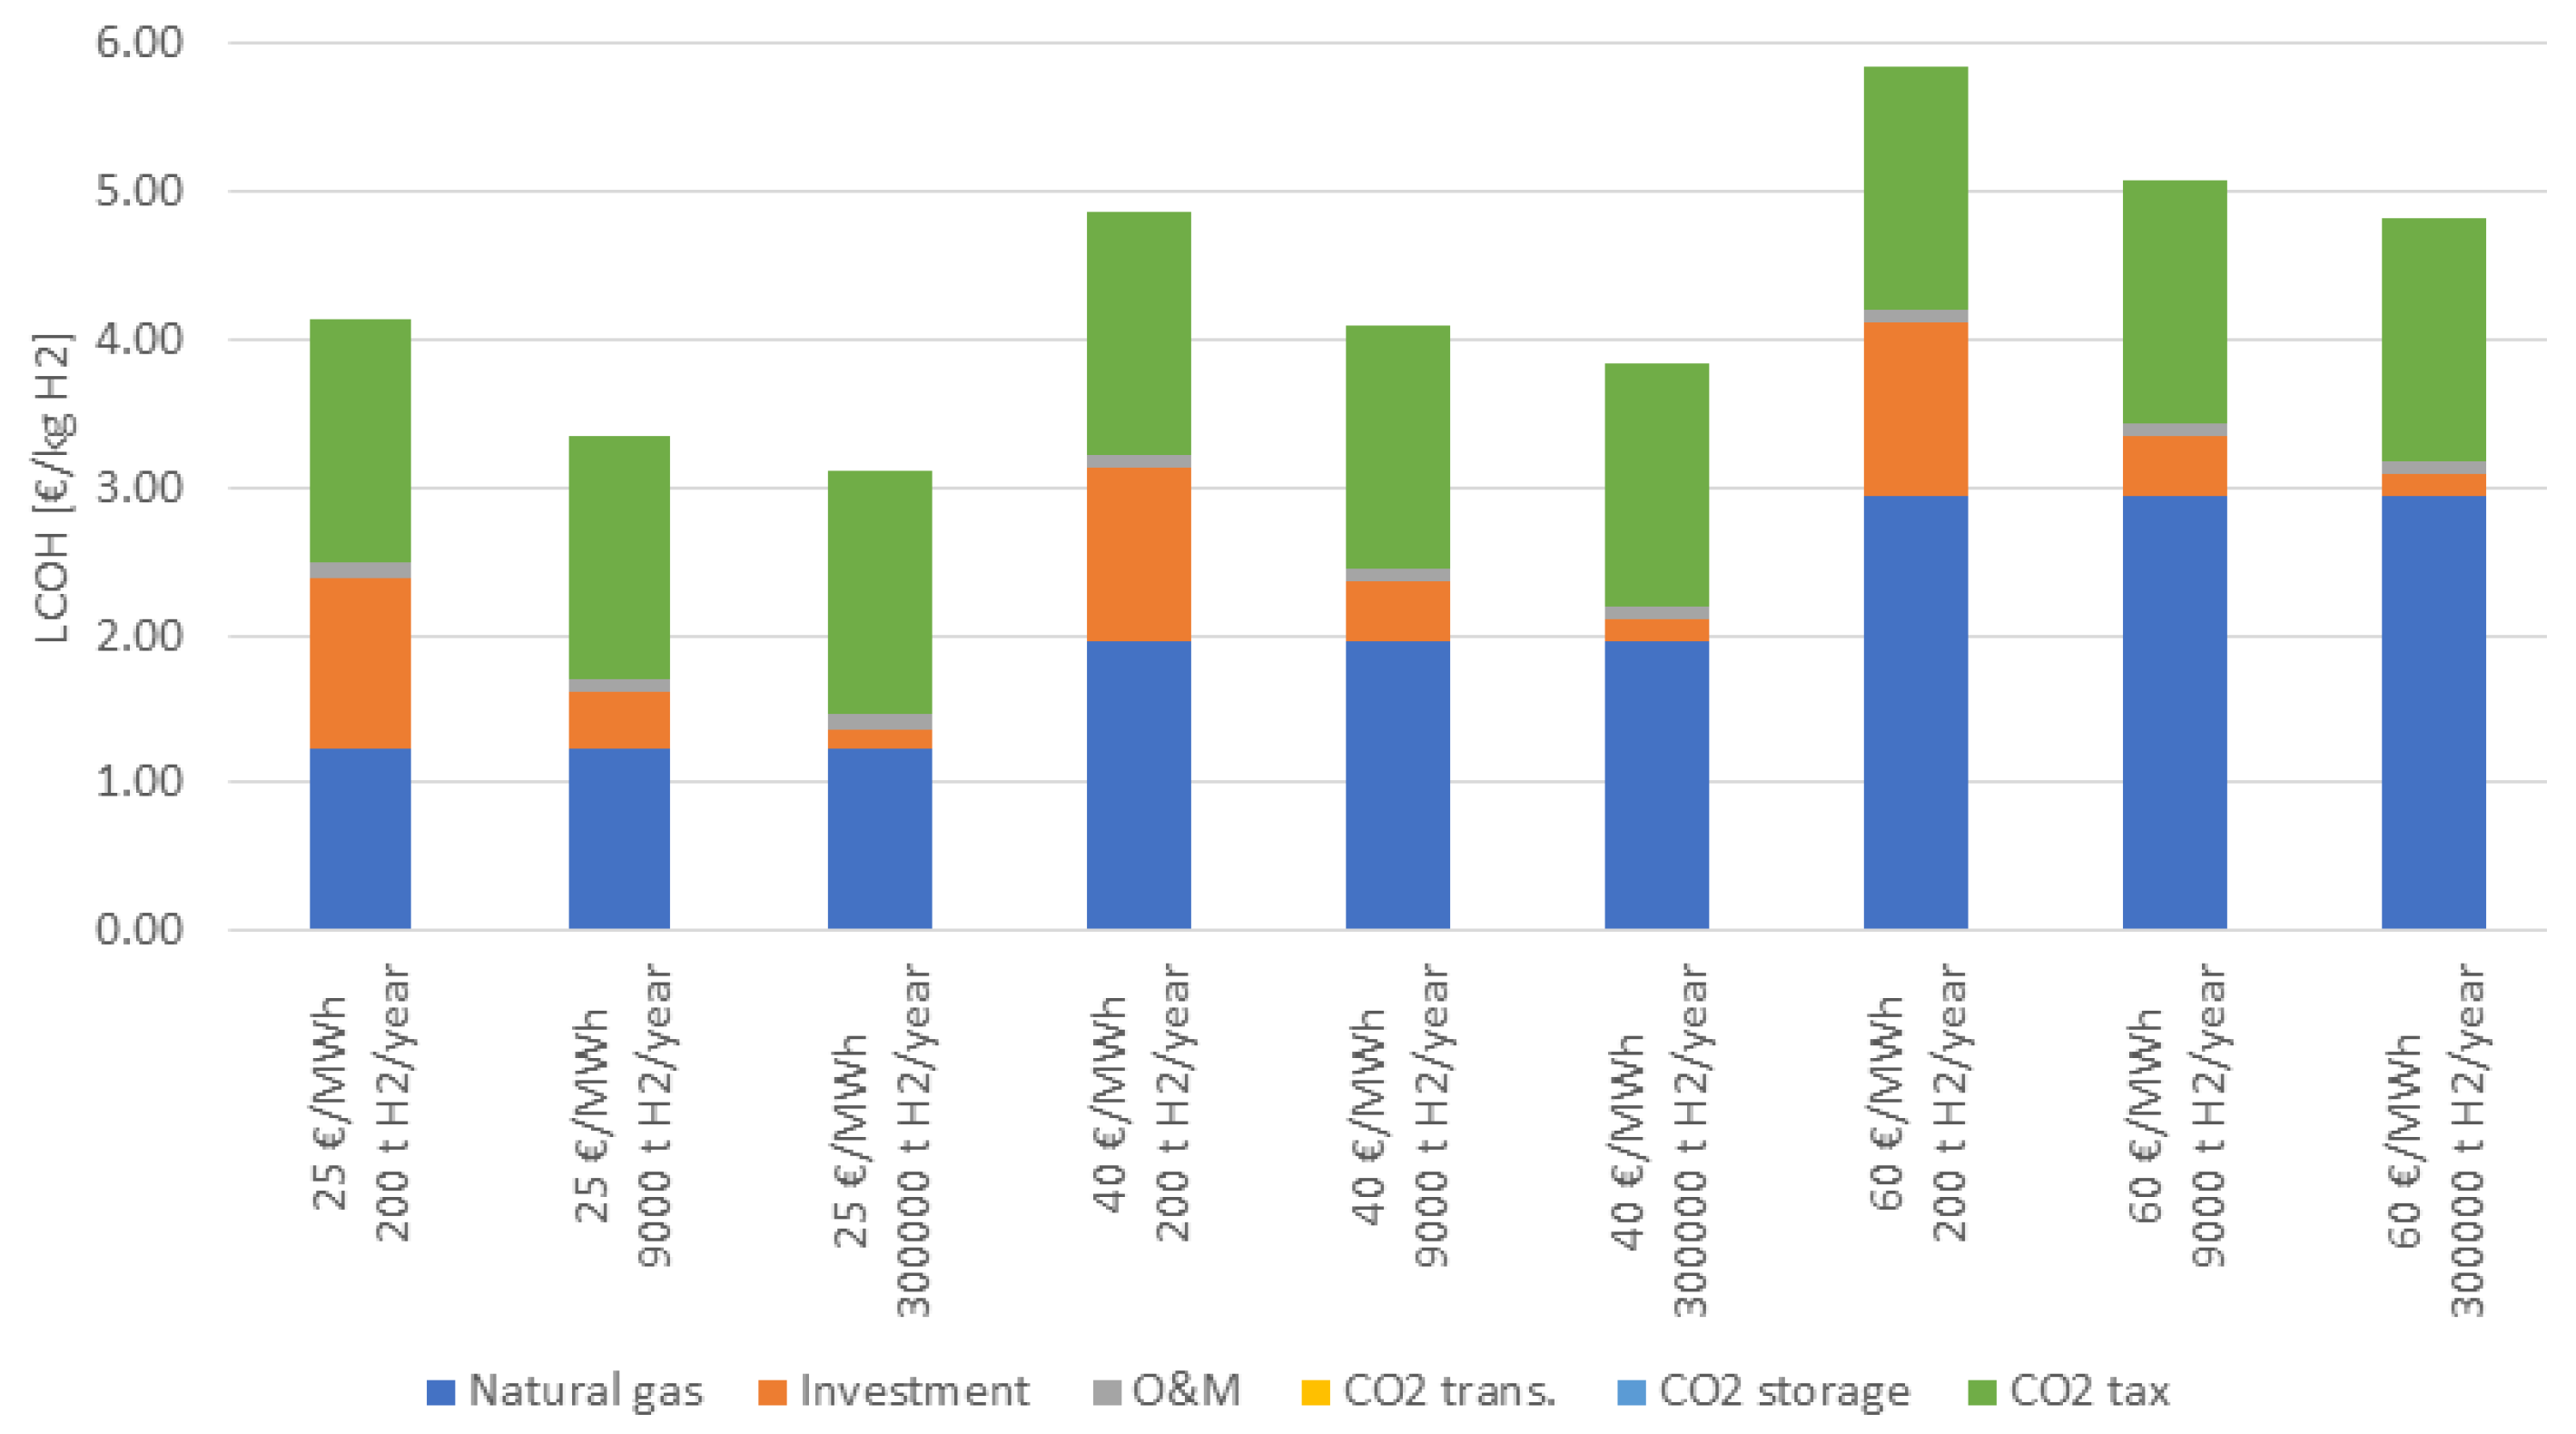
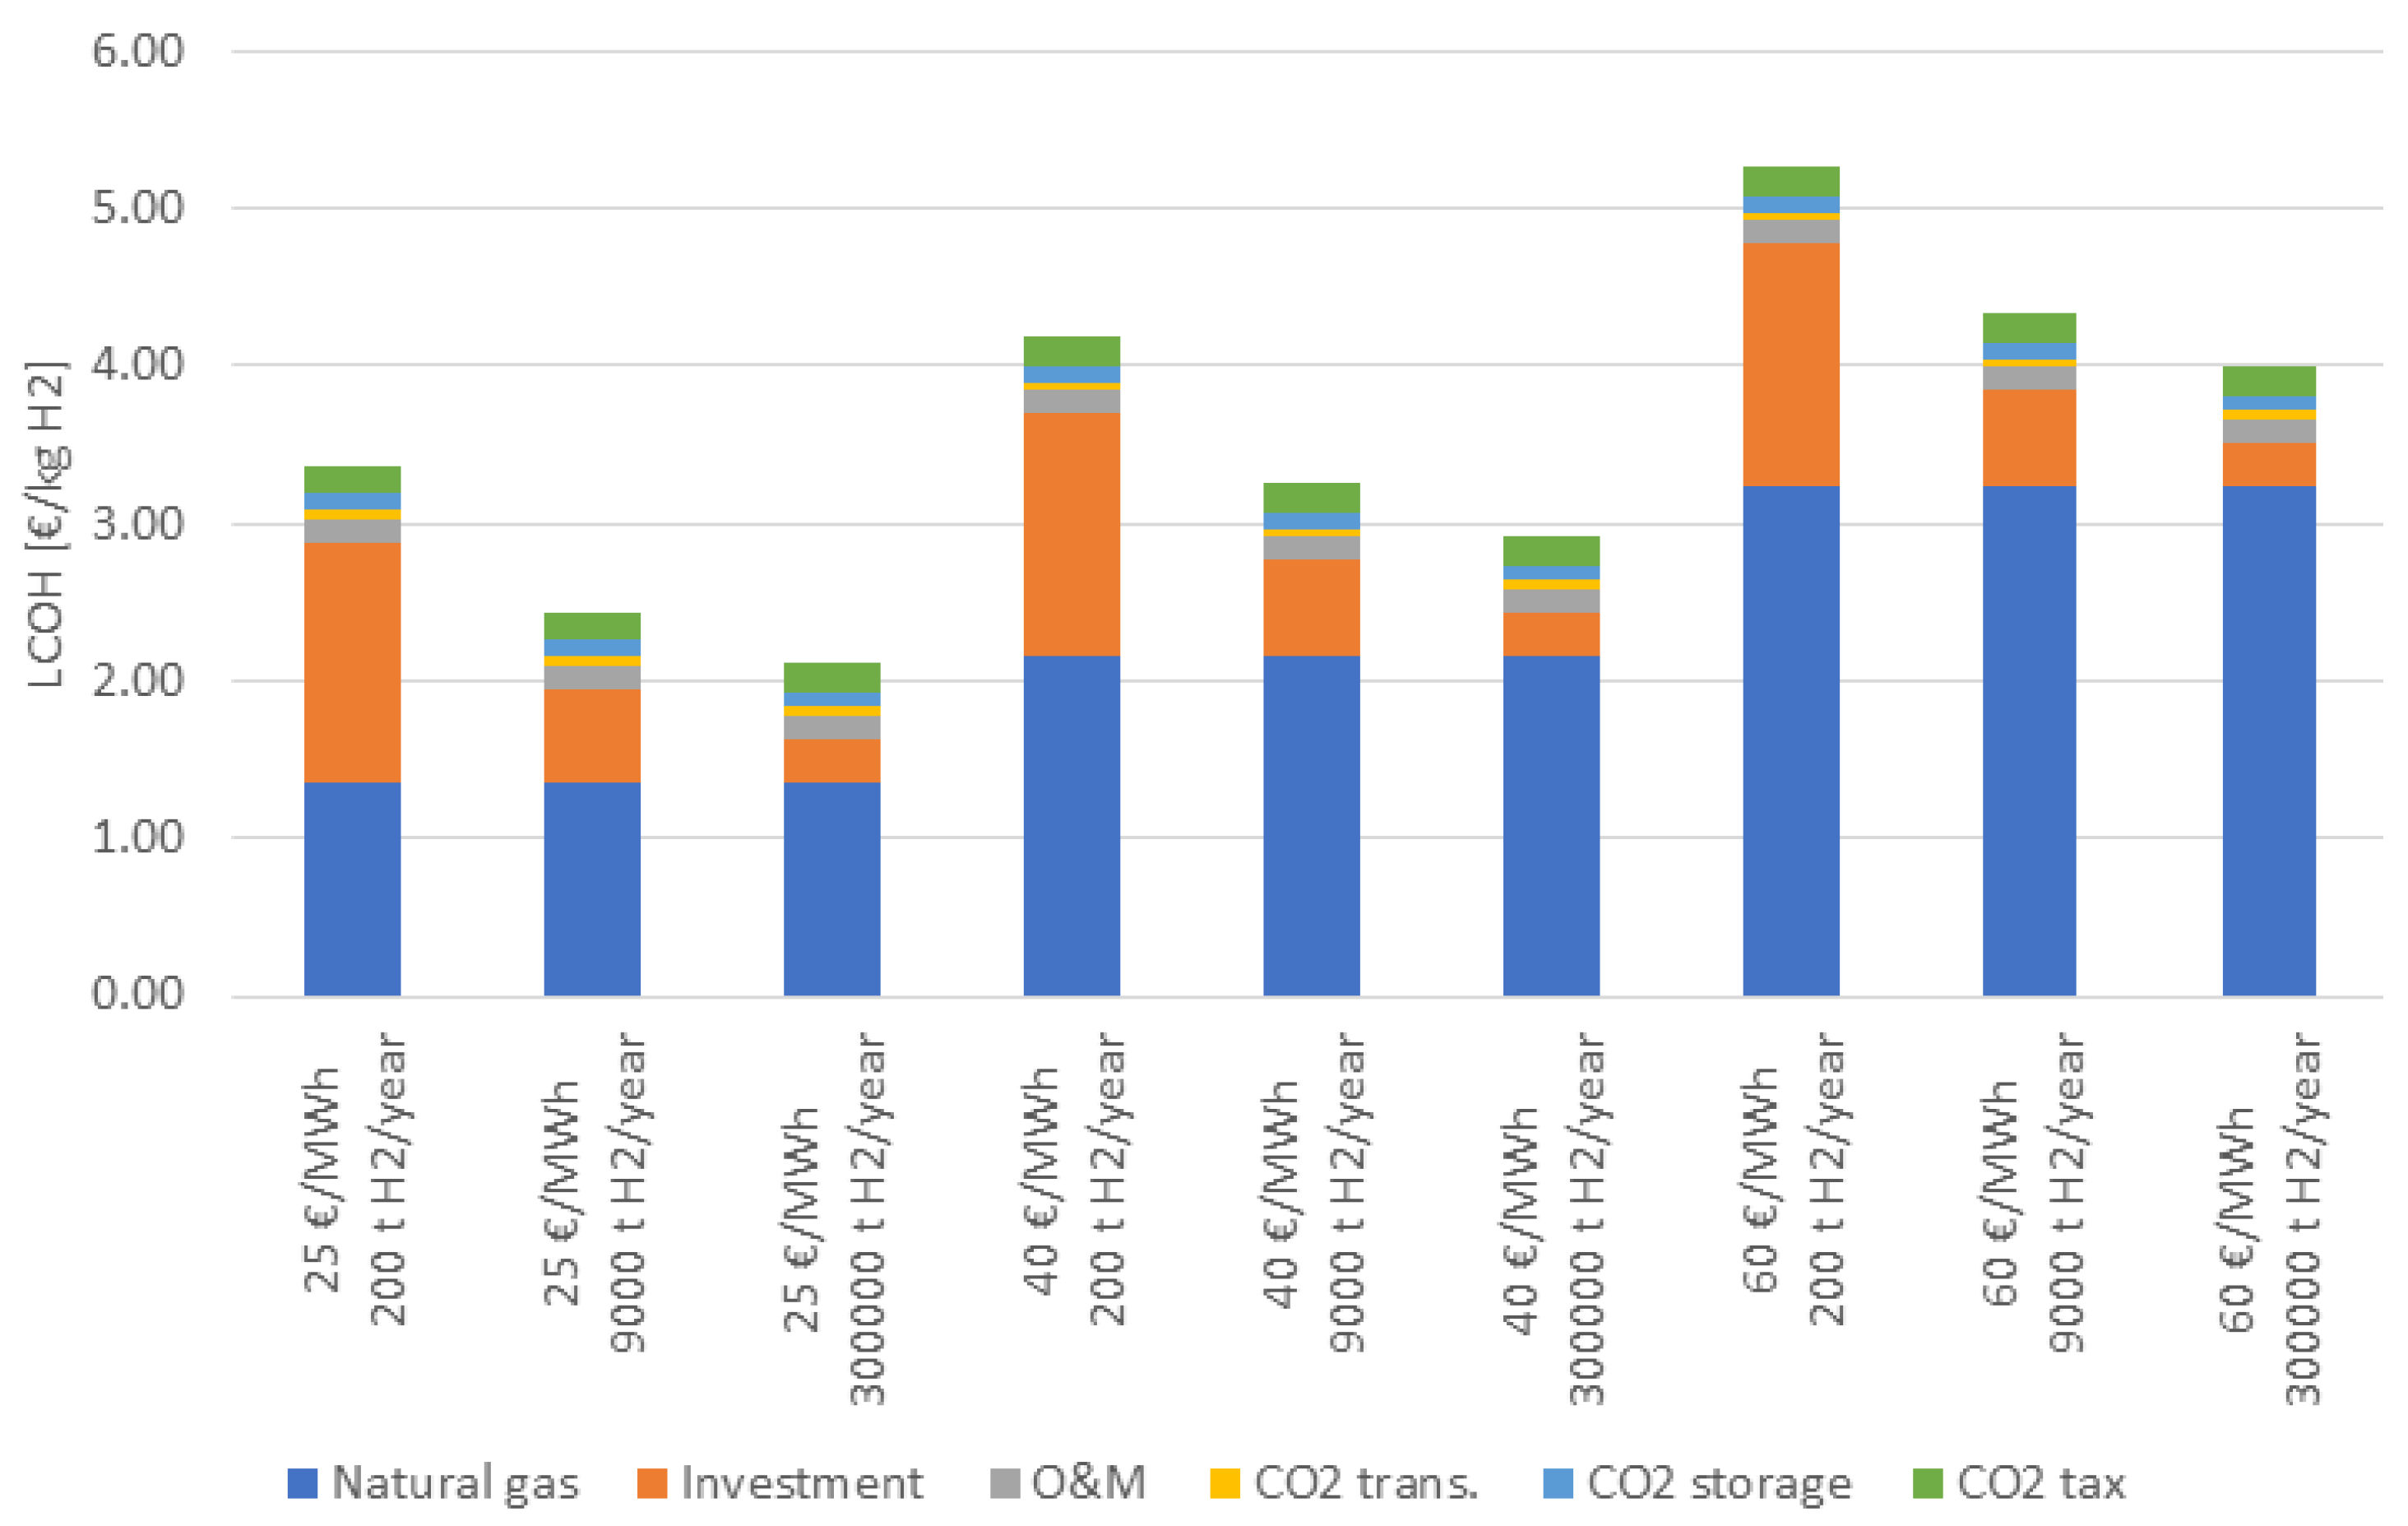
3.1. Validation of the Model

Before obtaining the cost of golden hydrogen, the cost model was validated determining the costs of grey and blue hydrogen and comparing them with current references. The influence of scale and gas prices was also assessed. Figure 3 shows the LCOH obtained for grey hydrogen, and Figure 4 for blue hydrogen. The CO2 costs were reduced to EUR 0.34/kg H2 in the blue hydrogen. In both cases (grey and blue hydrogen), the share of the investment was low, except for the small unit at any natural gas price.
According to data from the IEA [14], the maximum LCOH for grey hydrogen from natural gas with SMR is EUR 1.49/kg H2 (EUR 22/MWh-HHV for natural gas cost, investment corresponding to a plant of 9000 t H2/year, carbon tax of EUR 15/t CO2 with a nominal rate of 0, and the rest of assumptions similar to those considered in the proposed model). Introducing these assumptions into the model, the cost for a medium size plant with the lowest natural gas cost resulted in EUR 1.7/kg H2, indicating good agreement with the IEA data. Using data from the EU [2], the average LCOH in EU members in 2022 was EUR 5.7/kg H2, corresponding to an average natural gas price of EUR 76.32/MWh [36]. Scaling the last column in Figure 3 from EUR 60/MWh to EUR 76.32/MWh, an LCOH of EUR 5.62/kg H2 was obtained, demonstrating good agreement as well. In the case of blue hydrogen, IEA considers USD 2.1/kg H2, whereas the model with the same assumptions produced EUR 2.11/kg H2, achieving good agreement too.
Finally, the cost of CO2 capture can be determined by excluding the CO2 tax, transportation and storage and considering the CO2 capture ratio (8.64 kg CO2/kg H2). In this case, in the scenarios with a natural gas cost of EUR 25/MWh, the obtained cost ranged from EUR 62.92/t CO2 (small size) to EUR 35.33/t CO2 (large size), in accordance with the IEA [37].

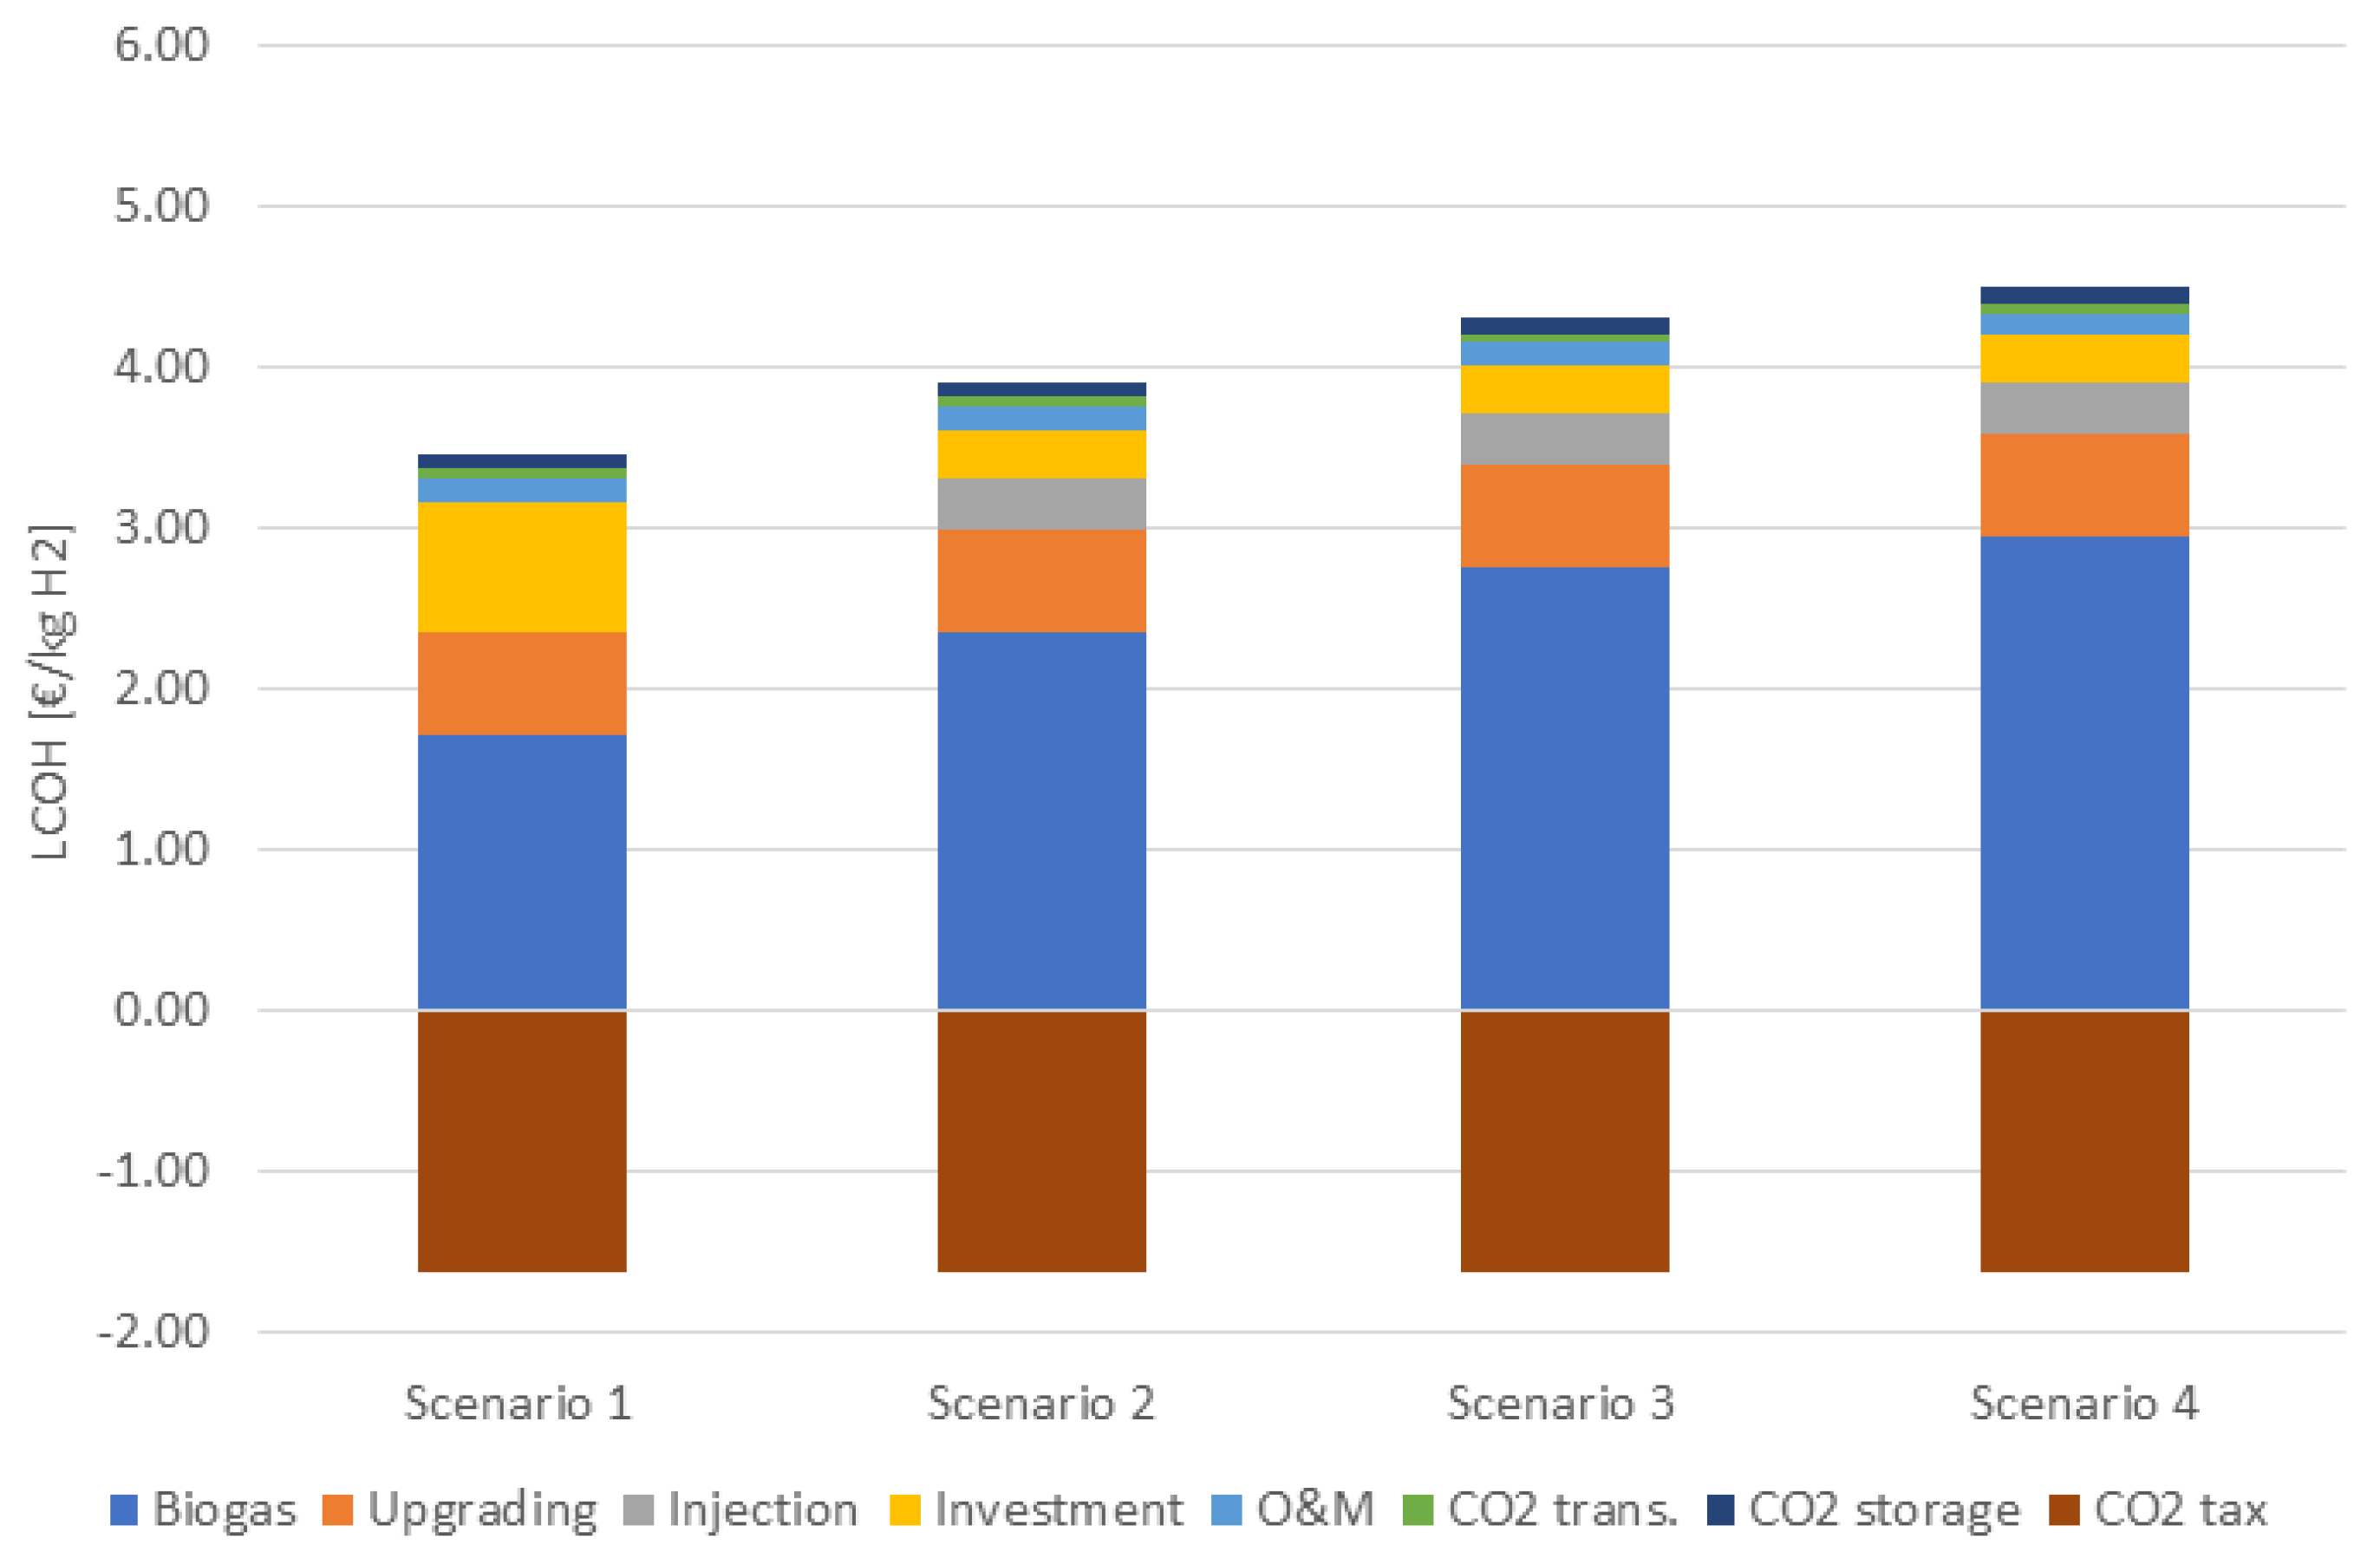
3.2. Scenarios Analysis

Table 11 displays the number of SMR plants required to harness the total potential of each scenario. In scenario 1, the unitary production was set to 2700 t H2/year, whereas in the rest, a large plant (609,000 kg H2/day) was used as the baseline. The hydrogen potential in scenarios 1 and 2 was 147 kt/year and 205 kt/year, respectively (between 25% and 34% of current demand). The hydrogen potential in scenarios 3 and 4 was 2151 kt and 3022 kt, respectively (3.6 and 5 times the current demand).
Figure 5 illustrates the levelized cost of golden hydrogen in the considered scenarios. As expected, the cost of the feedstock (biomethane) was higher than the cost of natural gas in fossil hydrogen. For biohydrogen, the biomethane cost (including biogas, upgrading and injection) ranged from EUR 2.35/kg H2 in scenario 1 to EUR 3.89/kg H2 in scenario 4. In comparison, in fossil hydrogen the natural gas cost varied from EUR 1.23/kg H2 (assuming a natural gas cost of EUR 25/MWh-HHV) to EUR 2.95/kg H2 (for a natural gas cost of EUR 60/MWh-HHV). Despite the fluctuation in biogas cost across the scenarios, the LCOH of golden hydrogen exhibited a minimal variation, ranging from EUR 1.84/kg H2 to EUR 2.88/kg. On the other hand, with similar natural gas costs (EUR 40/MWh-LHV to EUR 60/MWh-LHV) the LCOH of blue hydrogen in large SMR units spanned from EUR 2.92/t H2 to EUR 4/t H2. The income from CO2 taxes enabled achieving a comparable cost between golden and blue hydrogen when the latter was based on natural gas costs between EUR 25/MWh-HHV and EUR 40/MWh-HHV, with golden hydrogen even attaining lower costs than blue hydrogen for higher natural gas costs.

4. Discussion

An interesting revelation from the analysis was the impact of carbon tax on the competitiveness of different hydrogen production methods. Figure 3 and Figure 4 show how the inclusion of carbon tax incentivised the use of blue hydrogen, where capture of CO2 cost was competitive compared with cases with low CO2 concentrations (steel, cement, power generation and direct air capture) [37]. This low cost also appeared in large units of golden hydrogen production (scenario 3), where EUR 50.8/t CO2 was obtained. This economic advantage positions it as a compelling technique for atmospheric CO2 removal. In comparison, direct air capture costs ranged from EUR 125/t CO2 to EUR 279/t CO2, reinforcing the economic viability of golden hydrogen in the decarbonization landscape [37].
The key to the golden hydrogen’s competitiveness lies in the negative cost associated with the carbon tax. Initially positioned at EUR −1.62/kg H2 due to the 8% nominal escalation rate, this substantial value is justified by the IEA predictions. If we consider the carbon tax cost with a CELF equal to one, akin to the other components of the OPEX, the negative cost reduces to EUR −0.69/kg H2. This adjustment still guarantees the competitiveness of golden hydrogen, highlighting its potential role as a key player in the collective effort towards sustainable and economically viable decarbonization.
Alongside generating revenue, negative emissions play a key role in decarbonisation, especially in hard-to-electrify industries. In this sense, blue hydrogen is associated with emissions of 0.96 kg CO2/kg H2, whereas green hydrogen produced through renewable electrolysis results in zero emissions. Golden hydrogen, on the other hand, achieves negative emissions, amounting to −8.64 kg CO2/kg H2 [9], and can reach up to −11.6 kg CO2/kg H2 when CO2 from the biogas upgrading process is captured and stored [18]. These negative emissions produce a bonus in the decarbonisation, allowing the supplementation of golden hydrogen with fossil natural gas without losing decarbonisation potential. To illustrate this, Figure 6, taken from Soler et al. [9], shows that a blend of 72% of golden hydrogen with 28% of fossil methane produces zero CO2 emissions. However, 100% of green hydrogen (renewable electrolysis) should be employed for the same goal.
The current demand of hydrogen in Spain is 600,000 t/year, mainly used in chemical industries and refineries [3]. The proposed NIECP [4] foresees a demand of approximately 1.1 Mt for green hydrogen from renewable electrolysis (11 GW electrolysers) by 2030. With the current production of biomethane in Spain, the production of golden hydrogen would hardly reach 200 kt. However, if the potential estimated by SEDIGAS [12] (scenario 4) were fully dedicated to produce golden hydrogen, it could surpass 3 Mt. Considering a more realistic potential (scenario 3), production could exceed 2 Mt. Thus, to achieve the NIECP 2030 production target with golden hydrogen would require only 52% of the biomethane potential under realistic assumptions (scenario3) or 37% with the full deployment of intermediate crops (scenario 4). In the former case, the LCOH is EUR 2.69/kg H2 and in the latter it is EUR 2.88/kg H2, both significantly lower compared to the current LCOH for green hydrogen with renewable electrolysis, ranging from EUR 4/kg to EUR 4.5/kg for electrolyser investment between USD 1000/kW to USD 650/kW and an electricity cost of EUR 65/MWh. To achieve costs similar to those of golden hydrogen, the electricity costs should be around EUR 20/MWh for the same investment cost [38].
A key factor to use golden hydrogen is the availability of storage sites. As previously mentioned, the estimated storage capacity in Spain [17] is 11 Gt of CO2. If all the realistic biomethane potential (scenario 3) were converted into golden hydrogen, the annual CO2 captured would amount to 18.6 Mt, indicating a reserve capacity of 592 years.
A key factor in the development of golden hydrogen is the scalability and maturity of the SMR with CCS process. This technology has seen significant improvements since 2003, when Lipman [6] gathered various data used in this work to assess the investment costs for such plants. In his report, Lipman details two facilities: a smaller scale plant (24,000 kg H2/day) and a larger one (609.000 kg H2/day). From 2013 to 2020, the IEA [14] reported three plants producing blue hydrogen, with capacities ranging from 317,098 kg/day to 412,227 kg/day. Rosa et al. [18] assigned a technology readiness level of 9 to SMR technology and between 7 and 8 to SMR with CCS. This high maturity is reflected in the investment costs: the IEAGHG [33] estimated the investment for a plant of 214.286 kg H2/day of capacity at EUR 308.96 million in 2020. Comparatively, a similar facility in 2003, using direct correlations derived from Lipman [6] (Equation (20)), would have required an investment of EUR 512.03 million. Using the CEPCI index [39] for 2003 (402) and for 2020 (596.2), the investment estimated from Lipman’s data scales to EUR 759.4 million, approximately 2.46 times the current estimate provided by IEAGHG. This cost reduction can be attributed to the learning process experienced over nearly 20 years.
The breakdown presented in Figure 5 shows that the cost of biomethane is the most important component of the LCOH of golden hydrogen, followed by revenue derived from the CO2 tax. For plants of small capacity, as depicted in scenario 1, the investment cost also plays a crucial role. While the cost of biomethane is expected to remain stable, it may still exhibit some uncertainty, as it relies on long-term purchase agreements and the biomethane market is just beginning to develop. On the other hand, although the CO2 tax is expected to be high in the long term, its current value is subject to volatility. These three variables have been selected for a sensitivity analysis of the golden hydrogen’s LCOH, as shown in Figure 7. Except for the scenarios with significant nominal escalation rates of the CO2 tax, the LCOH remains parallel to the horizontal axis, indicating low sensitivity to CO2 tax variations. Specifically, an increase in the CO2 tax rate results in a lower LCOH for a given biogas cost. Conversely, a decrease in the CO2 tax rate, even to negative values, leads to an increase in the LCOH for a given biogas cost, albeit with a limit. Moreover, the LCOH is strongly dependent on the biogas cost, as anticipated from Figure 5. The additional cost of LCOH for low production levels (low investment cost) necessitates a lower biogas cost to maintain the same LCOH as with higher production levels.

5. Conclusions

As the global community intensifies its efforts towards decarbonization, the imperative to explore diverse and innovative pathways becomes increasingly evident. The quest for sustainable energy solutions requires a multi-technological approach. In this context, the proposed model to assess the LCOH of golden hydrogen emerges as a noteworthy contribution, aligning with the broader goal of reducing carbon emissions across various sectors.
Validated against the LCOH benchmarks of grey and blue hydrogen, the model not only demonstrates robustness but also highlights the potential of golden hydrogen as a competitive and environmentally responsible alternative. In contrast to blue hydrogen, golden hydrogen exhibits lower costs, with dependence of the feedstock cost compensated by the revenues from negative emissions. Moreover, the higher stability in the costs of biogas is a positive point for golden hydrogen.
Additionally, the production of golden hydrogen leverages the maturity of SMR technology, being necessary to deploy the CCS in both capture and storage aspects. Considering the pivotal role of CCS in achieving net-zero emissions [14,28], an anticipated surge in CCS adoption underscores the strategic positioning of golden hydrogen in the evolving energy landscape.
The analysis conducted on the production and costs of golden hydrogen has its Achilles’ heel in the management of captured CO2. Whereas the capture and storage exhibit high technology readiness levels, the infrastructure required for transporting CO2 from the SMR facility to geological storage sites is still under development. However, the European Commission is encouraging its expansion in the coming years. This network development should be complemented by the inclusion of negative emissions in the European Trade System, in order to generate revenue for golden hydrogen production. In this sense, the volatility of the CO2 tax presents another barrier to the promotion of this energy carrier, especially in the short term.

Author Contributions

Conceptualization, L.Y., J.I.L. and E.A.; Data curation, L.Y.; Formal analysis, E.A.; Funding acquisition, E.A.; Investigation, L.Y.; Methodology, L.Y. and J.I.L.; Project administration, E.A.; Resources, E.A.; Software, L.Y.; Supervision, J.I.L., E.A. and J.C.R.; Validation, J.I.L., E.A. and J.C.R.; Visualization, L.Y.; Writing—original draft, L.Y.; Writing—review & editing, J.I.L., E.A. and J.C.R. All authors have read and agreed to the published version of the manuscript.

Funding

This research was funded by Rafael Mariño Chair on New Energy Technologies of Comillas Pontifical University.

Data Availability Statement

Data are contained within the article.

Conflicts of Interest

The authors declare no conflicts of interest. The funders had no role in the design of the study; in the writing of the manuscript; or in the decision to publish the results.

Abbreviations

List of Acronyms
AcronymMeaning
HyBECCSBiohidrogen with carbon capture and storage
CAPEXCapital expenditures
CEPCI(chemical engineering plant cost index)
CCSCarbon capture and storage
EUEuropean Union
GOGuaranty of origin
HHVHigher heating value
IEAInternational Energy Agency
IEAGHGInternational Energy Agency Greenhouse Gas R&D Programme
LCOHLevelized cost of hydrogen
LHVLower heating value
MSWMunicipal solid waste
NGNatural gas
NIECPNational Integrated Energy and Climate Plan
OPEXOperation expenditures
SEDIGASSpanish Gas Association
SMRSteam methane reforming
WWTPWaste water treatment plant
List of Symbols
SymbolMeaningUnits
CELFConstant escalation levelization factor-
CHMRMass ratio of carbon dioxide to hydrogen-
CCostEUR/kg H2
cNG_cH2Ratio of cost of natural gas to hydrogen-
CRFCapital recovery factoryear−1
ηEfficiency-
HHVHigher heating valuekWh/Nm3
HMRHydrogen-to-methane ratio-
HPHydrogen annual productionkg/year
INVInvestmentEUR or USD
kRatio of increase in nominal escalation rate and wacc-
LHVLower heating valuekWh/Nm3
MMolar masskg/kmol
NNumber of yearsyear
QVolume flow rate Nm3/hNm3/h
rNominal escalation rate-
waccWeighted average capital cost-
PDaily hydrogen productionkg/day
List of Subscripts
SubscriptMeaning
bgbiogas
bgebiogas per unit of energy
bmbiomethane
injinjection
omoperation and maintenance
stgstorage
taxtaxes
tpttransport
ugupgrading
xx-th component of cost

References

  1. European Commission. Repower EU Plan, Brussels 18.5.2022. Available online: https://energy.ec.europa.eu/system/files/2022-05/COM_2022_230_1_EN_ACT_part1_v5.pdf (accessed on 27 January 2024).
  2. Bortolotti, M.; Collins, P.; Timmermans, M. (Eds.) Clean Hydrogen Monitor, Hydrogen Europe. 2023; Available online: https://hydrogeneurope.eu/wp-content/uploads/2023/10/Clean_Hydrogen_Monitor_11-2023_DIGITAL.pdf (accessed on 9 January 2024).
  3. Ministry for Ecological Transition and the Demographic Challenge (MITERD). Hydrogen Roadmap: A Commitment to Renewable Hydrogen. 2020. Available online: https://www.miteco.gob.es/es/ministerio/planes-estrategias/hidrogeno.html#:~:text=Hydrogen%20Roadmap%3A%20a%20commitment%20to%20renewable%20hydrogen&text=The%20development%20of%20renewable%20hydrogen,high%20added%20value%20green%20economy (accessed on 29 January 2024). (In Spanish)
  4. Energy National Secretary. Updating Draft of National Integrated Energy and Climate Plan, MITERD. 2023. Available online: https://www.miteco.gob.es/content/dam/miteco/es/energia/files-1/_layouts/15/Borrador%20para%20la%20actualizaci%C3%B3n%20del%20PNIEC%202023-2030-64347.pdf (accessed on 9 January 2024). (In Spanish)
  5. IEA. Global Hydrogen Review. 2022. Available online: https://www.iea.org/reports/global-hydrogen-review-2022 (accessed on 29 January 2024).
  6. Lipman, T. What Will Power the Hydrogen Economy? Present and Future Sources of Hydrogen Energy. University of Cali-fornia-Davis. July 2004. Available online: https://itspubs.ucdavis.edu/download_pdf.php?id=172 (accessed on 29 January 2024).
  7. Lou, Y.; Fan, Z.; Friedmann, J.; Corbeau, A.; Agrawal, M.; Khatri, A. The Potential Role of Biohydrogen in Creating a Net-Zero World. Columbia Center of Global Energy Policy. January 2023. Available online: https://www.energypolicy.columbia.edu/publications/the-potential-role-of-biohydrogen-in-creating-a-net-zero-world/ (accessed on 29 January 2024).
  8. Green Hydrogen Coalition. Green Hydrogen Guidebook. 2022. Available online: https://www.ghcoalition.org/guidebook (accessed on 29 January 2024).
  9. Soler, V.; Linares, J.; Arenas, E.; Romero, J. Hydrogen from Municipal Solid Waste as a Tool to Compensate Unavoidable GHG Emissions, 12CNIT 2022. Available online: https://repositorio.comillas.edu/xmlui/bitstream/handle/11531/66977/CNIT_11_Hydrogen_from_municipal_rev1.pdf?sequence=1&isAllowed=y (accessed on 29 January 2024).
  10. Feliu, A.; Flotats, X. Los Gases Renovables. Un Vector Energético Emergente. Fundacion Naturgy. 2019. Available online: https://www.fundacionnaturgy.org/publicacion/los-gases-renovables-un-vector-energetico-emergente/ (accessed on 29 January 2024).
  11. EBA. Biomethane Production Potentials in the EU. Guidehouse. July 2022. Available online: https://www.europeanbiogas.eu/wp-content/uploads/2022/07/GfC_national-biomethane-potentials_070722.pdf (accessed on 29 January 2024).
  12. SEDIGAS. Estudio de la Capacidad de Producción de Biometano en España. 2023. Available online: https://estudio-biometano.sedigas.es/wp-content/uploads/2023/03/sedigas-informe-potencial-biometano-2023.pdf (accessed on 29 January 2024).
  13. Rawoof, S.; Kumar, P.; Vo, D.; Subramanian, S. Sequential production of hydrogen and methane by anaerobic digestion of organic wastes: A review. Environ. Chem. Lett. 2020, 19, 1043–1063. [Google Scholar] [CrossRef]
  14. IEA. CCUS in Clean Energy Transitions, IEA, Paris. 2020. Available online: https://www.iea.org/reports/ccus-in-clean-energy-transitions (accessed on 9 January 2024).
  15. CCUS-Enabled Production Working Group, Hydrogen UK. CCUS-Enabled Production Report. 2023. Available online: https://iea.blob.core.windows.net/assets/181b48b4-323f-454d-96fb-0bb1889d96a9/CCUS_in_clean_energy_transitions.pdf (accessed on 9 January 2024).
  16. Sun, X.; Alcalde, J.; Bakhtbidar, M.; Elío, J.; Vilarrasa, V.; Canal, J.; Ballesteros, J.; Heinemann, N.; Haszeldine, S.; Cavanagh, A.; et al. Hubs and clusters approach to unlock the development of carbon capture and storage—Case study in Spain. Appl. Energy 2021, 300, 117418. [Google Scholar] [CrossRef]
  17. Spanish Geological Survey (IGME). Potential Geological Storages for CO2 in Spain. Available online: https://info.igme.es/almacenesco2 (accessed on 9 January 2024).
  18. Rosa, L.; Mazzotti, M. Potential for hydrogen production from sustainable biomass with carbon capture and storage. Renew. Sustain. Energy Rev. 2022, 157, 112123. [Google Scholar] [CrossRef]
  19. Moioli, E.; Schildhauer, T. Negative CO2 emissions from flexible biofuel synthesis: Concepts, potentials, technologies. Renew. Sustain. Energy Rev. 2022, 158, 112120. [Google Scholar] [CrossRef]
  20. Lefranc, L.; Linares, J.I.; Santos, A.M.; Arenas, E.; Martín, C.; Moratilla, Y. The role of golden hydrogen in the decarbonising of urban buses. In Proceedings of the ECOS 2023—36th International Conference on Efficiency, Cost, Optimization, Simulation and Environmental Impact of Energy Systems, Las Palmas de Gran Canaria, Spain, 25–30 June 2023. [Google Scholar]
  21. Yagüe, L.; Linares, J.I.; Arenas, E.; Romero, J.C. Bio-hydrogen with CCUS (golden hydrogen) as decarbonisation tool in hard-to-abate industrial sectors. Application to tile sector in Spain. In Proceedings of the 13th National and 4th International Conference in Engineering Thermodynamics, Castellón de la Plana, Spain, 29 November–1 December 2023. [Google Scholar]
  22. Full, J.; Geller, M.; Ziehn, S.; Schliess, T.; Miehe, R.; Sauer, A. Carbon-negative hydrogen production (HyBECCS): An exemplary techno-economic and environmental assessment. Int. J. Hydrogen Energy 2024, 52, 594–609. [Google Scholar] [CrossRef]
  23. European Commission. Towards an Ambitious Industrial Carbon Management for the EU, COM (2024) 62 Final, Strasbourg, 6.02.2024. Available online: https://eur-lex.europa.eu/legal-content/EN/TXT/?uri=COM%3A2024%3A62%3AFIN (accessed on 16 February 2024).
  24. Tumara, D.; Uihlein, A.; Hidalgo González, I. Shaping the Future CO2 Transport Network for Europe, Joint Research Centre, European Commission. 2024. Available online: https://publications.jrc.ec.europa.eu/repository/handle/JRC136709 (accessed on 16 February 2024).
  25. Morante, J.R.; Andreu, T.; García, G.; Gullera, J.; Tarancón, A.; Torrell, M. Hydrogen. Energy Vector of a Decarbonised Economy. Naturgy Foundation. 2019. Available online: https://www.fundacionnaturgy.org/publicacion/hidrogeno-vector-energetico-de-una-economia-descarbonizada/ (accessed on 9 January 2024). (In Spanish).
  26. Leguijt, C.; Nieuwenhuijse, I.; Jaspers, D.; Jongsma, C.; Beeftink, M.; Baltac, S.; Wilson, M.; O’Sullivan, C.; Mattos, A. Low-Carbon Hydrogen from Natural Gas: Global Roadmap, IEA Greenhouse Gas R&D Programme. 2022. Available online: https://documents.ieaghg.org/index.php/s/YKm6B7zikUpPgGA?path=%2F2022%2FTechnical%20Reports#pdfviewer (accessed on 9 January 2024).
  27. ENAGAS. Guarantees of Origin Website. Available online: https://www.enagas.es/en/technical-management-system/general-information/guarantees-origin/ (accessed on 9 January 2024).
  28. Barlow, H.; Shahi, S.; Loughrey, M. State of the Art: CCS Technologies 2023. Technical Report, Global CCS Institute. 2023. Available online: https://www.globalccsinstitute.com/wp-content/uploads/2023/10/State-of-the-Art-CCS-Technologies-2023_09_Final.pdf (accessed on 9 January 2024).
  29. de Dios, J.C.; Martínez, R. The permitting procedure for CO2 geological storage for research purposes in a deep saline aquifer in Spain. Int. J. Greenh. Gas Control 2019, 91, 102822. [Google Scholar] [CrossRef]
  30. Bejan, A.; Tsatsaronis, G.; Moran, M. Thermal Design & Optimization; John Wiley & Sons: Hoboken, NJ, USA, 1996. [Google Scholar]
  31. EMBER. Carbon Price Tracker. Available online: https://ember-climate.org/data/data-tools/carbon-price-viewer/ (accessed on 9 January 2024).
  32. GASNAM. Map of Biomethane Production Plants in Spain. Available online: https://gasnam.es/terrestre/mapa-de-plantas-de-produccion-de-biometano/ (accessed on 29 January 2024).
  33. Techno-Economic Evaluation of SMR Based Standalone Hydrogen Plant with CCS. IEAGHG Technical Report 2017-02. February 2017. Available online: https://ieaghg.org/exco_docs/2017-02.pdf (accessed on 9 January 2024).
  34. Itul, A.; Diaz Rincon, A.; Eulaerts, O.D.; Georgakaki, A.; Grabowska, M.; Kapetaki, Z.; Ince, E.; Letout, S.; Kuokkanen, A.; Mountraki, A.; et al. Clean Energy Technology Observatory: Carbon Capture Storage and Utilisation in the European Union—2023 Status Report on Technology Development, Trends, Value Chains and Markets, Publications Office of the European Union, Luxembourg. 2023. Available online: https://publications.jrc.ec.europa.eu/repository/handle/JRC134999 (accessed on 9 January 2024).
  35. Energy National Secretary. Roadmap of Biogas, MITERD. 2022. Available online: https://www.miteco.gob.es/content/dam/miteco/es/energia/files-1/es-es/Novedades/Documents/00HR_Biogas_V6.pdf (accessed on 9 January 2024). (In Spanish)
  36. Trading Economics Website. EU Natural Gas. Available online: https://tradingeconomics.com/commodity/eu-natural-gas (accessed on 9 January 2024).
  37. IEA. Is Carbon Capture Too Expensive? IEA, Paris. 2021. Available online: https://www.iea.org/commentaries/is-carbon-capture-too-expensive (accessed on 9 January 2024).
  38. IRENA. Making the Breakthrough: Green Hydrogen Policies and Technology Costs. International Renewable Energy Agency. Abu Dabi. 2021. Available online: https://www.irena.org/-/media/Files/IRENA/Agency/Publication/2020/Nov/IRENA_Green_Hydrogen_breakthrough_2021.pdf (accessed on 16 February 2024).
  39. Maxwell, C. Cost Indices. Available online: https://toweringskills.com/financial-analysis/cost-indices/#cepci-2001-to-present (accessed on 16 February 2024).
Figure 1. Stages for the production of golden hydrogen.
Energies 17 01134 g001
Figure 2. Supply chain of golden hydrogen.
Energies 17 01134 g002
Figure 3. Levelized cost of grey hydrogen obtained with the proposed model.
Energies 17 01134 g003
Figure 4. Levelized cost of blue hydrogen obtained with the proposed model.
Energies 17 01134 g004
Figure 5. Levelized cost of golden hydrogen obtained with the proposed model.
Energies 17 01134 g005
Figure 6. Decarbonisation potential of blends of H2 (green or golden) with pure methane.
Energies 17 01134 g006
Figure 7. Sensitivity analysis of levelized cost of golden hydrogen.
Energies 17 01134 g007
Table 1. Conversion ratios for SMR with or without CO2 capture. Adapted from Soler et al. [9].
Substrate η S M R
[p.u.]
HMR
k m o l H 2 k m o l C H 4
CHMR
k g C O 2 k g H 2
H2 Production
t H 2 G W h H H V C H 4
CO2 Captured
k g C O 2 k g H 2
Without CCS0.7592.528.7420.360
With CCS0.6912.290.9618.548.64
Table 2. Costs of biogas based on substrates [10].
SubstrateCost (EUR/MWh-LHV)
Biodegradable waste in a sanitary landfill6–10
Organic fraction of municipal solid waste30–40
Wastewater treatment plant (WWTP) sludge30–40
Cereal stubble45–55
Corn (whole plant)65–75
Pig manure65–75
Table 3. Costs of upgrading as a function of the volume flow rate of treated biogas [10].
Volume flow rate of biogas (Nm3/h)20050010002000
Cost of upgrading (EUR/MWh-LHV)18–2014–1811–149–12
Table 4. Costs of biomethane injection based on the volume flow rate of treated biogas [10].
Volume flow rate of biogas (Nm3/h)20050010002000
Cost of injection (EUR/MWh-LHV)15–208–125–72–4
Table 5. Economic data for SMR plants without CCS [6].
Hydrogen Production
(kg/day)
LCOH
(USD/GJ)
Natural Gas Cost
(USD/GJ)
η S M R (%)cNG_cH2
(%)
48024.756.166041.48
24,0009.734.277260.95
609,0005.53.08167.34
609,0006.63.98172.95
609,0006.854.18173.89
Table 6. Economic data for SMR plants with CCS [6].
Hydrogen Production
(kg/day)
LCOH
(USD/GJ)
Natural Gas Cost
(USD/GJ)
η S M R (%)cNG_cH2
(%)
24,00012.414.277247.79
609,0007.203.08151.44
Table 7. Investment of SMR without CCS plants derived from the data in Table 5.
Hydrogen Production (P)
(kg/day)
INVnoCCS
(USD2003)
4803,846,130
24,00050,448,185
609,000605,214,704
609,000601,471,108
609,000602,510,996
Table 8. Investment of SMR with CCS plants derived from data in Table 6 and incremental investment of CCS plants compared to no CCS plants.
Hydrogen Production
(kg/day)
cNG_cH2
(%)
INVCCS_2003
(USD)
INVCCS_2003 − INVnoCCS_2003
(USD)
24,00047.7986,032,63335,584,449.54
609,00051.441,177,984,909.19572,770,204.78
Table 9. Operation and maintenance costs of SMR plants of 100,000 Nm3/h of hydrogen production capacity (currency, euros, referred to 2020) [33].
ConceptSMR without CCS
(EUR/year)
SMR with CCS
(EUR/year)
Direct labour2,280,0002,580,000
Administrative991,7141,323,590
Insurance1,709,5203,053,280
Maintenance2,564,2804,579,920
Total7,545,51411,536,790
Table 10. Potential of biomethane in the scenarios considered based on different substrate availability. The last column represents the assumed biogas cost, obtained from Table 2.
SubstratePotential
(TWh)
Scenario 1
Potential
(TWh)
Scenario 2
Potential
(TWh)
Scenario 3
Potential
(TWh)
Scenario 4
Biogas Cost
Assumed
(EUR/MWh-LHV)
Agricultural waste 4.524.824.850–60 *
Manure 0.925.525.570
Intermediate crops 0.011.858.870
Forest waste 0.027.727.770
Industry waste 2.26.46.450
Organic fraction MSW 7.921.87.97.935
WWTP sludge 0.63.03.035
Landfill gas 1.18.88.88
Total7.9211116163
(*) A cost of 50 EUR/MWh-LHV is assumed for scenarios 3 and 4. In scenario 2, a cost of EUR 60/MWh-LHV is assumed due to a blend of manure and lignocellulosic matter [10].
Table 11. Number of SMR plants required to harness the potential of each scenario and unitary hydrogen production.
SubstratePotential
(TWh)
Total Hydrogen Production
(t/day)
Number of SMR PlantsUnitary Hydrogen
Production
(kg/day)
Scenario 17.92402.3557397
Scenario 211558.71558,740
Scenario 3116589210589,216
Scenario 4163828014591,393
Disclaimer/Publisher’s Note: The statements, opinions and data contained in all publications are solely those of the individual author(s) and contributor(s) and not of MDPI and/or the editor(s). MDPI and/or the editor(s) disclaim responsibility for any injury to people or property resulting from any ideas, methods, instructions or products referred to in the content.

