
Machine Learning Technologies in the Supply Chain Management Research of Biodiesel: A Review

1
Department of Industrial and Systems Engineering, Dongguk University-Seoul, Seoul 04620, Republic of Korea
2
Department of Environmental Horticulture & Landscape Architecture, College of Life Science & Biotechnology, Dankook University, Cheonan-si 31116, Republic of Korea
*
Author to whom correspondence should be addressed.
Energies 2024, 17(6), 1316; https://doi.org/10.3390/en17061316
Submission received: 8 February 2024
/
Revised: 5 March 2024
/
Accepted: 8 March 2024
/
Published: 9 March 2024
(This article belongs to the Special Issue Energy from Agricultural and Forestry Biomass Waste)
Abstract
:Biodiesel has received worldwide attention as a renewable energy resource that reduces greenhouse gas (GHG) emissions. Unlike traditional fossil fuels, such as coal, oil, and natural gas, biodiesel made of vegetable oils, animal fats, or recycled restaurant grease incurs higher production costs, so its supply chain should be managed efficiently for operational cost reduction. To this end, multiple machine learning technologies have recently been applied to estimate feedstock yield, biodiesel productivity, and biodiesel quality. This study aims to identify the machine learning technologies useful in particular areas of supply chain management by review of the scientific literature. As a result, nine machine learning algorithms, the Gaussian process model (GPM), random forest (RF), artificial neural network (ANN), support vector machine (SVM), k-nearest neighbor (KNN), AdaBoost regression, multiple linear regression (MLR), linear regression (LR). and multilayer perceptron (MLP), are used for feedstock yield estimation, biodiesel productivity prediction, and biodiesel quality prediction. Among these, RF and ANN were identified as the most appropriate algorithms, providing high prediction accuracy. This finding will help engineers and managers understand concepts of machine learning technologies so they can use appropriate technology to solve operational problems in supply chain management.
1. Introduction
For decades, worldwide attention has focused on renewable energy production to mitigate greenhouse gas (GHG) emissions. Although biodiesel cannot entirely replace petroleum-based fossil fuels, it remains a good option to reduce greenhouse gas (GHG) emissions and environmental pollution problems [1]. For example, biodiesel that is made of either vegetable oils or animal fat produces only 702.96 g of CO2 per liter, so it can reduce GHG emissions of petroleum diesel by 74% (i.e., 2689.27 g of CO2 per liter) [2]. Moreover, compared with petroleum diesel, biodiesel has two significant advantages. First, it is non-flammable and non-explosive, with a flash point of 423 K for biodiesel, compared to 337 K for petroleum diesel [3]. Second, it is biodegradable and non-toxic, and when burned as a fuel, significantly reduces toxic and other emissions [4].
Recently, due to the increase in petroleum prices and the implementation of financial incentives for its use [5], the cost of biodiesel use has become competitive compared to petroleum diesel. Illukpitiya and de Koff [6] found the total production cost of canola-based biodiesel involving feedstock and processing costs to be between USD 1.46 and 1.69 per liter. On the other hand, petroleum diesel production cost involving crude oil and refining costs is USD 0.50 per liter [7]. Although the production cost of biodiesel is approximately three times that of petroleum diesel production, incentive policies, such as biodiesel production and blending tax credit, provide USD 0.26 per liter in the U.S. [8], and biodiesel blending regulations for transportation use [9] have been enacted to increase the use of biodiesel.
However, from a long-term perspective, to make the cost of biodiesel competitive without any incentives and monetary supports given by government agencies, an efficient supply chain management of biodiesel should be considered. Traditionally, the cost of petroleum diesel consists of crude oil cost (51%), refining cost (21%), distribution and marketing cost (11%), and tax (16%) [7]. Similar to petroleum diesel, the efficient management of supply chain directly influences refining cost involving feedstock warehousing and the distribution cost of biodiesel, so that from the supply chain management perspective, there is the possibility of mitigating the sales cost of biodiesel [10]. Efficient supply chain management is one of the critical issues for the operational excellence of an organization; it can reduce operational costs while also improving the productivity of a supply chain [11]. With the growth of interest in environment-friendly and sustainable supply chain management, it becomes a more challenging issue for the long-term success of an organization [12]. This trend is not exceptional for the biofuel supply chain that produces either biodiesel or bioethanol using cellulose, hemicellulose, and lignin [13].
The goal of this study is to investigate how machine learning technologies are utilized for the supply chain management of biodiesel. In particular, the literature of three major application areas of feedstock yield prediction, biodiesel productivity prediction, and biodiesel quality prediction is reviewed. This review article contributes to informing engineers of which machine learning technologies are appropriate for a particular application area to enable the efficient management of a biodiesel supply chain.
The remaining sections are organized as follows: Section 2 addresses the characteristics of biodiesel supply chains, while Section 3 investigates recent studies of machine learning technologies applied to the supply chain management of biodiesel. Section 4 discusses the advantages and disadvantages of machine learning technology use in supply chain management; then, Section 5 concludes the study and findings.
2. Biodiesel Supply Chain Management
2.1. Biodiesel Production
The first step in biodiesel production involves selecting the appropriate feedstock, which relies on factors such as the chemical process, economic consideration, and the oil content in the chosen feedstock [14]. Biodiesel production can utilize various types of vegetable oil, animal fat, microbial oil, algal oil, and discarded oil [15]. Vegetable oils include soybean oil in the U.S., linseed and olive oil in Spain, sunflower oil in France, palm oil in Indonesia, guang pi in China, rapeseed oil in Germany, and canola oil in South Korea [16,17]. Four popular technologies can convert vegetable oil and/or animal fat to biodiesel [18]. These technologies are the direct use of mixed oil, the microemulsion of oil, the pyrolysis of oil, and the transesterification of oil. Among these technologies, transesterification is generally preferred for producing biodiesel, because it effectively reduces the viscosity [19].
Triglycerides are esters of saturated and unsaturated monocarboxylic acids and trihydric alcohol glycerides that are found in vegetable oils and animal oils, which in the presence of a catalyst can undergo a reaction with alcohol [20,21]. Due to the chemical and physical advantages, cost-effectiveness, and rapid reaction with triglycerides, methanol is normally used for the alcohol [2]. From this process, biodiesel is produced as the main product, while glycerin is a by-product [1]. Although transesterification is commonly used for biodiesel production, it is no longer efficient due to the high consumption of alcohol, which is associated with higher production cost [22]. Therefore, more environment-friendly methods with lower energy consumption have been explored, such as ultrasonic, microwave, hydrodynamic cavitation, membrane, plasma, reactive distillation, supercritical, co-solvent, rotatory, and plug flow techniques [23]. These methods can minimize the reaction time, energy consumption, and catalyst requirements.
2.2. Supply Chain Management
Similar to other manufacturing industries, the goal of supply chain management of biofuel is to identify a way of generating efficient flows of materials among vendors, facility warehouses, and customers [24]. In general, a supply chain consists of retailers, distributors, transporters, storage facilities, and suppliers [25]. It is the integration of all stages of the production lifecycle, starting from design and material sourcing, through manufacturing, to delivery to customers [26]. Supply chain management has been widely used to coordinate all the stages that in other contexts might appear independent. It acknowledges that any factor impacting a specific point in the supply chain influences its overall performance [27].
Although there are multiple issues involved in improving the performance of a biodiesel supply chain, the significant issues include transportation cost minimization, productivity maximization, and production cost minimization [28]. Therefore, in a grain-based biodiesel supply chain, activities involving feedstock harvesting, feedstock conversion to biodiesel, and biodiesel distribution should be considered for cost-effective supply chain management [29]. More specifically, the supply chain for grain-based biodiesel consists of seven stages of biomass production farm, biomass storage sites, pre-processing facilities, biorefineries, distribution centers, service stations, and customers. The first stage is to build cultivation facilities. This is because biodiesel is an energy made up of biomass, such as soybean and sunflower. The yield of biomass is heavily influenced by factors such as the duration of the harvest season, the timing of harvesting operations, and weather condition [30]. Therefore, the land availability and suitability for producing raw materials need to be determined [27]. After harvesting crops from cultivation facilities, they are moved to biomass storage sites. The storage of biomass is challenging; due to its high moisture content, it is necessary to use specialized storage systems to minimize any loss in the quantity and quality of biomass. Therefore, growers should focus not only on maximizing biomass yield but also on equipment availability, weather conditions, and the maturity of the plants [31]. The biomass is then moved to pre-processing facilities. Biomass should be pre-processed to reduce its moisture content and particle size. Smaller particles can improve the efficiency and speed of conversion [32]. After it is pre-processed, it is moved to biorefineries. In the above process of transporting feedstock, trailer trucks are mainly used [33]. The biomass can be converted into biodiesel in biorefineries [34]. In this process, transesterification is normally used to produce biodiesel [1]. Vegetable oil is transesterified with alcohol to produce biodiesel and glycerol [35]. The produced biodiesel is then moved to distribution centers and service stations that can supply customers [30]. In contrast to the trailer trucks used to transport feedstock, tanker trucks are used when transporting liquid such as biodiesel [33]. Biodiesel can be marketed either as pure biodiesel (B100) or transported to blending facilities to create a 10% blend (B10), which is then stored and distributed [35].
In addition, there are three decisions that should be considered to make an efficient biofuel supply chain. The decisions involve strategic, tactical, and operational decisions. The strategic decisions are decisions that are challenging to change in a short period, and these can be used to design a supply chain, including the location, capacity, and technology used in biorefineries. The tactical decisions are medium-term activities, ranging from a few months to one year, such as inventory planning. Lastly, the operational decisions are short-term activities that involve creating schedules for biofuel production units [36]. Therefore, to design an efficient biofuel supply chain, decisions must be optimized to reduce total costs or maximize profits for the entire system [24].
3. Machine Learning in Supply Chain Management of Biodiesel
Traditionally, mathematical modeling has been used as a tool to evaluate the performance of the supply chain of biodiesel [27]. However, over the decades, the number of studies applying machine learning technology to biodiesel has increased, because machine learning offers a promising alternative to conventional modeling methods dealing with the nonlinear and complex characteristics of the biodiesel supply chain [37]. Machine learning (ML), one of the types of artificial intelligence, has been widely recognized as a component of the Fourth Industrial Revolution in different scientific fields, including bioenergy [38]. It is a technology that enables computers to learn and make decisions without explicit programming [39]. Also, it provides a set of advanced data analysis methods based on mathematical, probability, and statistical principles that identify patterns among features within a dataset and enable prediction [40].
Nine popular machine learning algorithms used for the supply chain management of biodiesel are the Gaussian process model (GPM), random forest (RF), artificial neural network (ANN), support vector machine (SVM), k-nearest neighbor (KNN), AdaBoost regression, multiple linear regression (MLR), linear regression (LR), and multilayer perceptron (MLP). These nine algorithms are applied to feedstock yield estimation, biodiesel productivity prediction, and biodiesel quality prediction.
GPM refers to a set of random variables that when considered together follow a multivariate Gaussian distribution [41]. Also, it provides a robust Bayesian framework to effectively formulate an approximation problem, and it has been proven to provide predictions with good accuracy for geophysical studies [42]. RF is an ensemble of tree predictors, where each individual tree relies on the outcome of a random vector independently sampled and having an identical distribution for every tree within the forest. It has the advantage of preventing overfitting through the bagging process, which can improve prediction accuracy [43]. ANN is operated as an effective solution for modeling complex and poorly defined problems, and it is usefully applied to pattern recognition and a target value estimation [44]. SVM, which was first introduced by Cortes and Vapnik, originated from statistical learning theory and the concept of minimizing structural risk [45]. Initially used to solve classification, it was successfully developed over time and used for regression [41]. Recently, it has been implemented for classification, pattern recognition, and the analysis of regression due to it outperforming other methodologies [46]. KNN is an algorithm that was initially used in statistical applications. The fundamental idea of KNN is to identify a set of k samples from the training dataset that are closest to a given unknown sample [47]. In KNN, the K parameter, indicating the count of the nearest neighbors, plays an important role in determining the performance of the classifiers [48]. The AdaBoost algorithm was initially proposed by Yoav Freund and Robert Shapire as an approach to creating a robust classifier from a collection of weak classifiers [49]. Weight, indicating relative importance, is allocated during each training. Instances that were incorrectly classified by the last iteration are given greater weights, which are adjusted after each iteration [50]. MLR is a complex version of the simple LR designed for the dataset that involves multiple predictor variables and outcome variables [51]. MLP stands out as one of the most recognized ANN models. Due to its good capacity for nonlinear mapping, it has been widely utilized in pattern recognition, image processing, fusion approximation, and optimization computation [52]. The following sections address applications of these nine algorithms.
3.1. Machine Learning Algorithms for Feedstock Yield Estimation
The cost of biodiesel is greatly influenced by the feedstock used to produce biodiesel [53]. Therefore, predicting feedstock yield is a significant factor for the efficient supply chain management of biodiesel. Figure 1 illustrates a general process of crop yield estimation model development via a machine learning algorithm. Since each machine learning algorithm requires observed data for its modeling process, most studies collect data (e.g., climate data, climate change data, soil parameter data, and crop data) from a field experiment. Remote sensors such as a thermometer and a photosynthetically active radiation (PAR) sensor can be utilized for the data collection [54]. Once the dataset is built, supervised learning is conducted to develop a yield estimation model for a certain crop. The validated machine learning model is used to estimate crop yield under a designed scenario (e.g., a climate change scenario), and researchers can analyze the estimated results.
Yang et al. [55] sought to predict the yields of corn, soybean, winter wheat, spring wheat, cotton, and alfalfa using a two-step machine learning approach consisting of GPM and RF. In order to derive land productivity index and identify potential marginal lands, county-level crop yield data and remote sensed gross primary productivity (GPP) data are preprocessed and downscaled for machine learning. To be more specific, GPM estimated the ratio for a specific crop i in Equation (1):
where is a crop yield, and is the growing season GPP value of a specific crop i. County-level crop yield data averaged over the years 2008–2017, county average temperature, water availability involving the ratio of evapotranspiration (ET) over precipitation, and the percentage of land being irrigated were used to train GPM. The estimated ratio was applied to train the RF for each crop i (see Equation (2)), and each trained RF was applied to estimate the yield of each feedstock:
Figure 2 shows that RF generates bootstrap samples (i.e., ) from the original dataset L involving the independent variable x and dependent variable y. The bootstrap samples are used to train the individual decision tree , and the aggregation process in RF generates via Equation (3) to estimate the value of y [56]:
As a result, the two-step machine learning approach showed that the coefficient of determination () values of corn, soybean, winter wheat, spring wheat, cotton, and alfalfa were (0.95, 0.90, 0.92, 0.93, 0.86 and 0.83), respectively [55]. Since this approach narrows down the scope of modeling training, it is possible to accurately capture uncertainty associated with the production of each crop type.
Barbosa et al. [57] estimated the soybean yield in Brazil based on three different machine learning algorithms of RF, ANN, and SVM. The study collected the meteorological information and soybean yield data from 2008 to 2017, and seven independent variables (i.e., temperature, precipitation, crop evapotranspiration, real crop evapotranspiration, storage, deficit, and surplus) were considered for the yield prediction. Particularly, the NASA-POWER platform was used to collect meteorological data., and Camargo’s 1971 method was used to compute potential evapotranspiration and cultivation evapotranspiration.
Table 1 describes the database matrix of 36 columns by 936 rows. In Table 1, each independent variable was stratified into five sub-variables from November to March (i.e., five months) according to the grain planting and harvesting calendar in Brazil [57].
The preprocessed database matrix was used for machine learning with RF, ANN, and SVM. Unlike the RF algorithm shown in Figure 2, the ANN model consists of multiple layers, and Equation (4) represents the nth output at layer L () in ANN:
where is the bias with n nodes at l layer; is a weight between l and () layers; and is an input node I [58]. The Python scikit-learn version 0.23.2 was used to conduct the machine learning, and hyperparameters such as a rectified linear unit function, an optimization solver weight using the Quasi-Newton method, a learning rate, an alpha penalty parameter, the number of interactions, and the number of neurons in each layer were defined to identify the optimum structure of ANN in terms of estimation accuracy [57]. Three different measures were utilized to evaluate the estimation accuracy, and Equations (5)–(7) illustrate the root mean square error (RMSE), coefficient of determination (R2), and mean estimation error (ME), respectively.
where is the observed data; is the estimated data; is the mean of the observed data; and is the total number of estimated data. The three measures were used in the k-fold cross-validation (CV) test, which divides a test dataset into smaller k sets for performance evaluation of a machine learning algorithm in the Scikit-Learn library. This model validation process was also applied to the SVM modeling illustrated in Equation (8).
where is a vector of L input features; is any nonlinear function mapping the input data into a high-dimensional feature space with ; is a weight vector; and is the hyperplane bias. To estimate an appropriate weight vector, a kernel function (), such as radial basis function kernel, linear kernel, and polynomial kernel, can be used [56]. Equation (9) represents the radial basis function (RBF) kernel which is known as the squared Euclidean distance between two feature vectors such as and . Equation (10) represents the linear kernel which is used when the observed data are linearly separable. Equation (11) represents a polynomial kernel with the degree of polynomials (d), and it is used when the observed data can be explained by a polynomial combination of existing features.
Table 2 describes the estimation accuracy of RF, ANN, and SVM with three different kernels. Barbosa et al. [57] found that RF showed the best performance in terms of with a value of 0.81, while the values of ANN and SVM were 0.77 and 0.74, respectively. Nevertheless, all three algorithms showed a high prediction accuracy of feedstock yield.
3.2. Machine Learning Algorithms for Biodiesel Productivity Prediction
Similar to the yield prediction, multiple machine learning algorithms have been used for biodiesel productivity prediction. Jin et al. [50] estimated the biodiesel production quantity using four different machine learning algorithms of RF, KNN, SVM, and AdaBoost regression. The dataset involving 381 individual observations with 13 distinct experimental cases was collected under five independent variables of catalyst loading (wt.%), feedstock type, molar ratio of methanol to oil, reaction time (min), and reaction temperature (°C). Table 3 describes the input and output variables used in the study.
In the study, the performance of the four machine learning algorithms was evaluated via RMSE (see Equation (5)). Equation (12) is used to estimate the output y via the average of the nearest neighbor output in KNN. Unlike RF and SVM (see Section 3.1 for more detail about the algorithms), KNN computes distance (e.g., Euclidian distance and Manhattan distance) between data points for its modeling training:
In KNN, the selection of k-nearest neighbors is the most critical task because it significantly affects the estimation accuracy of the algorithm. To this end, the interest-specific classification technique selects k by evaluating the prediction accuracy over different k values. Table 4 describes the selection result of k-nearest neighbors in the study [50].
The optimum value of k was selected in terms of RMSE so that the devised KNN has the minimum deviation between observed data and estimated data when k = 3 in Table 4.
On the other hand, AdaBoost regression trains weight via multiple iterations with different sub-training datasets. Initially, a model has an equal weight as dataset D, and replace sampling is performed on D to obtain an adjusted weight with sub-dataset D1. This replace sampling continues until the best weight with the least value of a loss function is identified. Figure 3 illustrates the overall process of AdaBoost regression [59].
Among the four algorithms, RF was selected as the best algorithm to predict biodiesel production quantity with the lowest values of RMSE for both the training (2.778) and validation (5.178) datasets. In the training dataset, the RMSE values of KNN, SVM, and AdaBoost were 4.081, 8.650, and 6.941, while in the validation dataset, the RMSE values were 6.332, 12.122, and 8.332, respectively.
Gautam et al. [60] utilized linear regression (LR), multilayer perceptron (MLP), and KNN to estimate the production quantity of biodiesel from three independent variables of reaction duration, catalyst concentration, and methanol quantity/molar ratio. Notice that MLP can be illustrated as a feed-forward ANN, so that the weight between l and () layers () in Equation (4) is trained without feedback loops [58]. Figure 4 illustrates MLP with two hidden layers [61]. In Figure 4, all nodes in the hidden and output layers are neurons with nonlinear activation functions. Backpropagation is widely used for supervised learning in MLP. The learning process consists of four steps: (1) the sum of the product of inputs and their weights is computed; (2) a bias factor is added; (3) the sum with the activation function is fed into MLP; and (4) the output of the perceptron is achieved as its outcome [60].
Table 5 describes the results of estimation performance evaluation of LR, KNN, and MLP. The mean absolute percentage error (MAPE) between the observed data () and estimated data () was used for the evaluation (see Equation (13)), and the minimum value of MAPE represents the highest estimation accuracy.
In the evaluation, three different dependent variables were considered such as Non-Pre-treated Linseed Methyl Ester (NPLME), Water Pre-treated Linseed Methyl Ester (WPLME), and Enzymatic Pre-treated Linseed Methyl Ester (EPLME). The values of LR, KNN, and MLP were 0.7030, 0.8554, and 0.7864, respectively. Therefore, KNN was selected as the best machine learning algorithm for biodiesel productivity prediction [60].
3.3. Machine Learning Algorithms for Biodiesel Quality Prediction
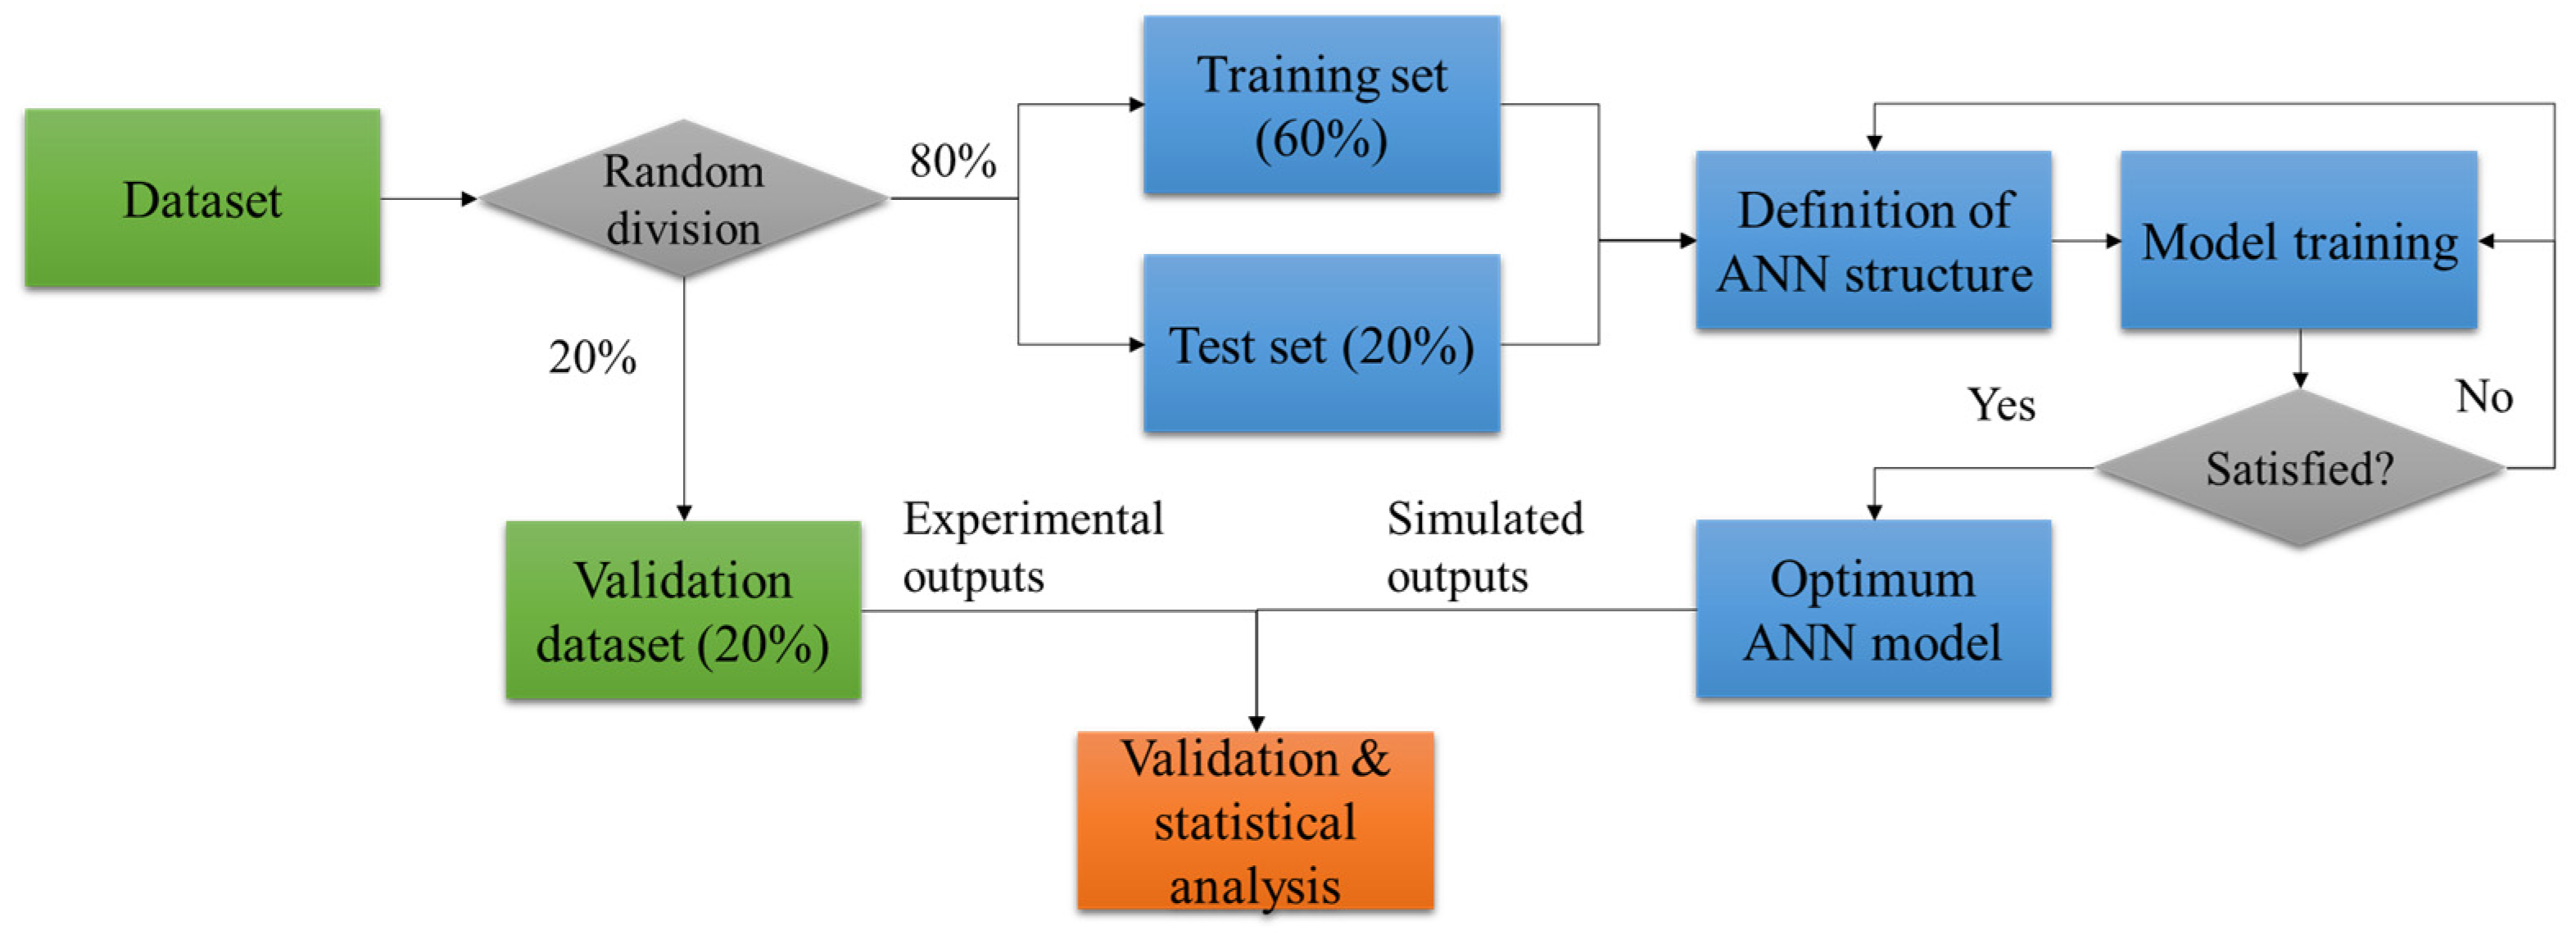
In general, the quality of biodiesel is evaluated in terms of density, viscosity, and cetane number. These properties play a crucial role in fuel combustion [62]. According to Rocabruno–Valdes et al. [63], ANN can be adapted to predict the density, dynamic viscosity, and cetane number of biodiesel from four independent variables involving the temperature, composition of methyl esters (C8:0, C10:0, C12:0, C14:0, C16:0, C16:1, C18:0, C18:1, C18:2, C18:3, C20:0, C20:1, C22:0, C22:1, C24:0), number of carbon atoms, and number of hydrogen atoms. Since ANN requires many data points for its training, the study collected 780 experimental points from different scientific articles. The collected data were randomly divided into a training set (60%), testing set (20%), and validation set (20%).
Figure 5 illustrates the general modeling procedure of ANN consisting of experimental data collection, ANN modeling, and validation and statistical analysis between the simulated and experimental outputs [64]. Rocabruno–Valdes et al. [63] utilized Matlab software (2015a) with a neural network toolbox for the ANN modeling, and they conducted sensitivity analysis on independent variables to identify the impact of independent variables on the response variables. The results showed that the correlation coefficient values for density, dynamic viscosity, and cetane number were 0.99208, 0.98255, and 0.91946, respectively. ANN provided high prediction accuracy for the three performance measures representing biodiesel quality.
Mairizal et al. [65] predicted the density (kg/m3), higher heating value (MJ/kg), viscosity at 40 °C (mm2/s), flash point (°C), and oxidative stability (min) of biodiesel via multiple linear regression (or multivariate linear regression), which is a well-known traditional statistical model. Three independent variables of feedstock polyunsaturated/monounsaturated fatty acids balance (PU/MU), iodine value (IV), and saponification value (SV) were considered. Seventeen oil types involving sunflower oil, peanut oil, hydrogenated coconut oil, hydrogenated copra oil, beef tallow, rapeseed oil, walnut oil, and another 10 blends, were considered. The study demonstrated strong correlations among most parameters except for flash point and oxidative stability. Equations (14)–(18) show the five multiple linear regression models.
The value of the density model was 95.4%, so the prediction model offers high prediction accuracy. The values of the higher heating value, viscosity at 40 °C, flash point, and oxidative stability of biodiesel were 76%, 95.5%, 95.7%, and 94.1%, respectively. Unlike other machine learning algorithms, MLP enables the identification of significant factors in the prediction model, and it provides equations requiring simple calculation without using any machine learning library, as shown in Equations (14)–(18).
4. Discussion
In Section 3, applications of machine learning (ML) algorithms, feedstock yield prediction, biodiesel productivity prediction, and biodiesel quality prediction were investigated. Nine machine learning algorithms, namely, GPM, RF, ANN, SVM, KNN, AdaBoost regression, MLR, LR, and MLP, were applied to feedstock yield estimation, biodiesel productivity prediction, and biodiesel quality prediction. Although there are multiple machine learning algorithms, there exists a general machine learning procedure consisting of data collection, machine learning with a training dataset, model evaluation with a test dataset, and model validation. The validated model can be utilized to estimate values of a dependent variable (e.g., feedstock yield, biodiesel productivity, and biodiesel quality) under a designed scenario (e.g., a climate change scenario).
In feedstock yield prediction, supervised machine learning algorithms involving RF, GPM, ANN, and SVM are frequently used with historical climate data (e.g., temperature, precipitation, crop evapotranspiration, real crop evapotranspiration, storage, deficit, and surplus). Among the four ML algorithms, RF is selected as the best-performing algorithm.
Similarly, RF is also widely used in biodiesel productivity prediction with high prediction accuracy. Jin et al. [50] found that RF showed better performance than KNN, SVM, and AdaBoost regression to predict biodiesel production quantity from five independent variables (i.e., catalyst loading (wt.%), feedstock type, molar ratio of methanol to oil, reaction time (min), and reaction temperature (°C)). On the other hand, KNN [60] also provided high prediction accuracy, with an value of 0.8554 among LR, MLP, and KNN under three independent variables of reaction duration, catalyst concentration, and methanol quantity/molar ratio. Unlike LR, KNN does not require any correlations between variables, so it enables the development of more flexible models than LR. However, the performance of KNN is heavily dependent on the selection of the K parameter, which may result in unreliable performance in different datasets [48].
In biodiesel quality prediction, ANN and MLR were widely utilized to predict the density, dynamic viscosity, flash point, higher heating value, oxidative stability, and cetane number [63,65]. Because there are multiple factors influencing the quality of biodiesel, the ML algorithms involving multivariate inputs are mainly utilized, and correlation analysis was simultaneously conducted. Traditional statistical modeling algorithms, such as LR and MLR, provided lower prediction accuracy than other machine learning algorithms that enable nonlinear relationships between variables to be explained [66]. Nevertheless, those statistical approaches can identify significant variables (or predictors) in the prediction model. Considering that machine learning algorithms are recognized as a black-box approach [67], the limitation can be resolved by integrating the advantages of multiple algorithms.
5. Conclusions and Future Directions
This study reviewed the scientific literature to identify the machine learning technologies that are useful in particular areas of supply chain management. Nine machine learning algorithms of the Gaussian process model (GPM), random forest (RF), artificial neural network (ANN), support vector machine (SVM), k-nearest neighbor (KNN), AdaBoost regression, multiple linear regression (MLR), linear regression (LR), and multilayer perceptron (MLP) were used for feedstock yield estimation, biodiesel productivity prediction, and biodiesel quality prediction. Among the nine algorithms, RF was recognized as the best algorithm for feedstock yield estimation and biodiesel productivity prediction. Its R2 values were higher than 0.80 in different cases. ANN also provided high prediction accuracy, and its R2 values were higher than 0.75; in particular, it was utilized in biodiesel quality prediction. Another seven algorithms also provided reasonable prediction accuracy in various supply chain management cases. Considering that most machine learning algorithms can provide high prediction accuracy in different problems, their popularity can be expected to increase in the future. Nevertheless, most machine learning algorithms are still recognized as a black-box approach; hence, traditional statistical approaches should be simultaneously utilized to overcome the limitations of machine learning algorithms.
Author Contributions
Conceptualization, S.K. (Sojung Kim) and S.K. (Sumin Kim); methodology, S.K. (Sojung Kim) and J.S.; software, S.K. (Sojung Kim) and S.K. (Sumin Kim); validation, J.S. and S.K. (Sojung Kim); resources, S.K. (Sojung Kim); writing—original draft preparation, J.S. and S.K. (Sojung Kim); writing—review and editing, S.K. (Sojung Kim) and S.K. (Sumin Kim); visualization, J.S.; project administration, S.K. (Sojung Kim); funding acquisition, S.K. (Sojung Kim). All authors have read and agreed to the published version of the manuscript.
Funding
This work was supported by a Basic Science Research Program through the National Research Foundation of Korea (NRF) funded by the Ministry of Education (No. RS-2023-00239448).
Data Availability Statement
Data are contained within the article.
Acknowledgments
The authors gratefully acknowledge the support of the NRF of Korea, which is funded by the Ministry of Education.
Conflicts of Interest
The authors declare no conflicts of interest.
References
- Abbaszaadeh, A.; Ghobadian, B.; Omidkhah, M.R.; Najafi, G. Current biodiesel production technologies: A comparative review. Energy Convers. Manag. 2012, 63, 138–148. [Google Scholar] [CrossRef]
- Ma, F.; Hanna, M.A. Biodiesel production: A review. Bioresour. Technol. 1999, 70, 1–15. [Google Scholar] [CrossRef]
- Demirbas, A. Biodiesel; Springer: London, UK, 2008; pp. 111–119. [Google Scholar]
- Yusuf, N.N.A.N.; Kamarudin, S.K.; Yaakub, Z. Overview on the current trends in biodiesel production. Energy Convers. Manag. 2011, 52, 2741–2751. [Google Scholar] [CrossRef]
- Knothe, G. Analyzing biodiesel: Standards and other methods. J. Am. Oil Chem. Soc. 2006, 83, 823–833. [Google Scholar] [CrossRef]
- Illukpitiya, P.; de Koff, J.P. Economics of Small-Scale Biodiesel Production; Tennessee State University: Nashville, TN, USA, 2014; pp. 1–3. [Google Scholar]
- Volta Oil. What Determines Retail Prices for Gasoline and Diesel? Available online: https://voltaoil.com/what-makes-up-retail-price-for-gasoline/ (accessed on 17 October 2023).
- U.S. Department of Energy. Biodiesel Production and Blending Tax Credit. Available online: https://afdc.energy.gov/laws/5831# (accessed on 17 October 2023).
- U.S. Department of Energy. Biodiesel Laws and Incentives in Tennessee. Available online: https://afdc.energy.gov/fuels/laws/BIOD?state=tn (accessed on 17 October 2023).
- Habib, M.S.; Omair, M.; Ramzan, M.B.; Chaudhary, T.N.; Farooq, M.; Sarkar, B. A robust possibilistic flexible programming approach toward a resilient and cost-efficient biodiesel supply chain network. J. Clean. Prod. 2022, 366, 132752. [Google Scholar] [CrossRef]
- Sharma, V.; Vijayaraghavan, T.A.S.; Ram, T.L.R. Resolving operational paradox of sustainable supply chain: A decision framework approach. Socio-Econ. Plan. Sci. 2023, 87, 101565. [Google Scholar] [CrossRef]
- Hiloidhari, M.; Sharno, M.A.; Baruah, D.C.; Bezbaruah, A.N. Green and sustainable biomass supply chain for environmental, social and economic benefits. Biomass Bioenergy 2023, 175, 106893. [Google Scholar] [CrossRef]
- Mridha, B.; Pareek, S.; Goswami, A.; Sarkar, B. Joint effects of production quality improvement of biofuel and carbon emissions towards a smart sustainable supply chain management. J. Clean. Prod. 2023, 386, 135629. [Google Scholar] [CrossRef]
- Karmakar, A.; Karmakar, S.; Mukherjee, S. Properties of various plants and animals feedstocks for biodiesel production. Bioresour. Technol. 2010, 101, 7201–7210. [Google Scholar] [CrossRef]
- Ambat, I.; Srivastava, V.; Sillanpää, M. Recent advancement in biodiesel production methodologies using various feedstock: A review. Renew. Sustain. Energy Rev. 2018, 90, 356–369. [Google Scholar] [CrossRef]
- Bajpai, D.; Tyagi, V.K. Biodiesel: Source, production, composition, properties and its benefits. J. Oleo Sci. 2006, 55, 487–502. [Google Scholar] [CrossRef]
- Ge, J.C.; Yoon, S.K.; Song, J.H. Combustion and emission characteristics of a diesel engine fueled with crude palm oil blends at various idling speeds. Appl. Sci. 2022, 12, 6294. [Google Scholar] [CrossRef]
- Grebemariam, S.; Marchetti, J.M. Biodiesel Production Technologies; Nova Science Publishers, Inc.: Hauppauge, NY, USA, 2017. [Google Scholar]
- Babadi, A.A.; Rahmati, S.; Fakhlaei, R.; Barati, B.; Wang, S.; Doherty, W.; Ostrikov, K.K. Emerging technologies for biodiesel production: Processes, challenges, and opportunities. Biomass Bioenergy 2022, 163, 106521. [Google Scholar] [CrossRef]
- Meher, L.C.; Sagar, D.V.; Naik, S.N. Technical aspects of biodiesel production by transesterification—A review. Renew. Sustain. Energy Rev. 2006, 10, 248–268. [Google Scholar] [CrossRef]
- Leung, D.Y.; Wu, X.; Leung, M.K.H. A review on biodiesel production using catalyzed transesterification. Appl. Energy 2010, 87, 1083–1095. [Google Scholar] [CrossRef]
- Shuit, S.H.; Ong, Y.T.; Lee, K.T.; Subhash, B.; Tan, S.H. Membrane technology as a promising alternative in biodiesel production: A review. Biotechnol. Adv. 2012, 30, 1364–1380. [Google Scholar] [CrossRef] [PubMed]
- Bashir, M.A.; Wu, S.; Zhu, J.; Krosuri, A.; Khan, M.U.; Aka, R.J.N. Recent development of advanced processing technologies for biodiesel production: A critical review. Fuel Process. Technol. 2022, 227, 107120. [Google Scholar] [CrossRef]
- Awudu, I.; Zhang, J. Uncertainties and sustainability concepts in biofuel supply chain management: A review. Renew. Sustain. Energy Rev. 2012, 16, 1359–1368. [Google Scholar] [CrossRef]
- Frazelle, E. Supply Chain Strategy: The Logistics of Supply Chain Management; McGraw-Hill: New York, NY, USA, 2020. [Google Scholar]
- Madenas, N.; Tiwari, A.; Turner, C.J.; Woodward, J. Information flow in supply chain management: A review across the product lifecycle. CIRP J. Manuf. Sci. Technol. 2014, 7, 335–346. [Google Scholar] [CrossRef]
- Papapostolou, C.; Kondili, E.; Kaldellis, J.K. Development and implementation of an optimisation model for biofuels supply chain. Energy 2011, 36, 6019–6026. [Google Scholar] [CrossRef]
- De Jong, S.; Hoefnagels, R.; Wetterlund, E.; Pettersson, K.; Faaij, A.; Junginger, M. Cost optimization of biofuel production—The impact of scale, integration, transport and supply chain configurations. Appl. Energy 2017, 195, 1055–1070. [Google Scholar] [CrossRef]
- Avami, A. A model for biodiesel supply chain: A case study in Iran. Renew. Sustain. Energy Rev. 2012, 16, 4196–4203. [Google Scholar] [CrossRef]
- An, H.; Wilhelm, W.E.; Searcy, S.W. Biofuel and petroleum-based fuel supply chain research: A literature review. Biomass Bioenergy 2011, 35, 3763–3774. [Google Scholar] [CrossRef]
- Kim, S.; Kim, S. Hybrid simulation framework for the production management of an ethanol biorefinery. Renew. Sustain. Energy Rev. 2022, 155, 111911. [Google Scholar] [CrossRef]
- Kasim, F.H.; Harvey, A.P. Influence of various parameters on reactive extraction of Jatropha curcas L. for biodiesel production. Chem. Eng. J. 2011, 171, 1373–1378. [Google Scholar] [CrossRef]
- Ghelichi, Z.; Saidi-Mehrabad, M.; Pishvaee, M.S. A stochastic programming approach toward optimal design and planning of an integrated green biodiesel supply chain network under uncertainty: A case study. Energy 2018, 156, 661–687. [Google Scholar] [CrossRef]
- Mirhashemi, M.S.; Mohseni, S.; Hasanzadeh, M.; Pishvaee, M.S. Moringa oleifera biomass-to-biodiesel supply chain design: An opportunity to combat desertification in Iran. J. Clean. Prod. 2018, 203, 313–327. [Google Scholar] [CrossRef]
- Andersen, F.; Iturmendi, F.; Espinosa, S.; Díaz, M.S. Optimal design and planning of biodiesel supply chain with land competition. Comput. Chem. Eng. 2012, 47, 170–182. [Google Scholar] [CrossRef]
- Abbasi, M.; Pishvaee, M.S.; Mohseni, S. Third-generation biofuel supply chain: A comprehensive review and future research directions. J. Clean. Prod. 2021, 323, 129100. [Google Scholar] [CrossRef]
- Aghbashlo, M.; Peng, W.; Tabatabaei, M.; Kalogirou, S.A.; Soltanian, S.; Hosseinzadeh-Bandbafha, H.; Mahian, O.; Lam, S.S. Machine learning technology in biodiesel research: A review. Prog. Energy Combust. Sci. 2021, 85, 100904. [Google Scholar] [CrossRef]
- Sharma, V.; Tsai, M.L.; Chen, C.W.; Sun, P.P.; Nargotra, P.; Dong, C.D. Advances in machine learning technology for sustainable advanced biofuel production systems in lignocellulosic biorefineries. Sci. Total Environ. 2023, 886, 163972. [Google Scholar] [CrossRef]
- Mahesh, B. Machine learning algorithms-a review. Int. J. Sci. Res. 2020, 9, 381–386. [Google Scholar]
- Wang, Z.; Peng, X.; Xia, A.; Shah, A.A.; Huang, Y.; Zhu, X.; Zhu, X.; Liao, Q. The role of machine learning to boost the bioenergy and biofuels conversion. Bioresour. Technol. 2022, 343, 126099. [Google Scholar] [CrossRef] [PubMed]
- Schulz, E.; Speekenbrink, M.; Krause, A. A tutorial on Gaussian process regression: Modelling, exploring, and exploiting functions. J. Math. Psychol. 2018, 85, 1–16. [Google Scholar] [CrossRef]
- Camps-Valls, G.; Verrelst, J.; Munoz-Mari, J.; Laparra, V.; Mateo-Jimenez, F.; Gomez-Dans, J. A survey on Gaussian processes for earth-observation data analysis: A comprehensive investigation. IEEE Geosci. Remote Sens. Mag. 2016, 4, 58–78. [Google Scholar] [CrossRef]
- Breiman, L. Random forests. Mach. Learn. 2001, 45, 5–32. [Google Scholar] [CrossRef]
- Mabel, M.C.; Fernandez, E. Analysis of wind power generation and prediction using ANN: A case study. Renew. Energy 2008, 33, 986–992. [Google Scholar] [CrossRef]
- Cortes, C.; Vapnik, V. Support-vector networks. Mach. Learn. 1995, 20, 273–297. [Google Scholar] [CrossRef]
- Huang, C.; Davis, L.S.; Townshend, J.R.G. An assessment of support vector machines for land cover classification. Int. J. Remote Sens. 2002, 23, 725–749. [Google Scholar] [CrossRef]
- Thanh Noi, P.; Kappas, M. Comparison of random forest, k-nearest neighbor, and support vector machine classifiers for land cover classification using Sentinel-2 imagery. Sensors 2017, 18, 18. [Google Scholar] [CrossRef]
- Qian, Y.; Zhou, W.; Yan, J.; Li, W.; Han, L. Comparing machine learning classifiers for object-based land cover classification using very high resolution imagery. Remote Sens. 2014, 7, 153–168. [Google Scholar] [CrossRef]
- Rojas, R. AdaBoost and the super bowl of classifiers a tutorial introduction to adaptive boosting. Freie Univ. Berl. Tech. Rep. 2009, 1, 1–6. [Google Scholar]
- Jin, X.; Li, S.; Ye, H.; Wang, J.; Wu, Y.; Zhang, D.; Ma, H.; Sun, F.; Pugazhendhi, A.; Xia, C. Investigation and optimization of biodiesel production based on multiple machine learning technologies. Fuel 2023, 348, 128546. [Google Scholar] [CrossRef]
- Eberly, L.E. Multiple linear regression. In Topics in Biostatistics; Springer: Berlin/Heidelberg, Germany, 2007; pp. 165–187. [Google Scholar]
- Li, Y.; Cao, W. An extended multilayer perceptron model using reduced geometric algebra. IEEE Access 2019, 7, 129815–129823. [Google Scholar] [CrossRef]
- Elgharbawy, A.S.; Sadik, W.A.; Sadek, O.M.; Kasaby, M.A. Glycerolysis treatment to enhance biodiesel production from low-quality feedstocks. Fuel 2021, 284, 118970. [Google Scholar] [CrossRef]
- Kim, S.; Kim, S.; An, K. An integrated multi-modeling framework to estimate potential rice and energy production under an agrivoltaic system. Comput. Electron. Agric. 2023, 213, 108157. [Google Scholar] [CrossRef]
- Yang, P.; Zhao, Q.; Cai, X. Machine learning based estimation of land productivity in the contiguous US using biophysical predictors. Environ. Res. Lett. 2020, 15, 074013. [Google Scholar] [CrossRef]
- Rodriguez-Galiano, V.; Sanchez-Castillo, M.; Chica-Olmo, M.; Chica-Rivas, M.J.O.G.R. Machine learning predictive models for mineral prospectivity: An evaluation of neural networks, random forest, regression trees and support vector machines. Ore Geol. Rev. 2015, 71, 804–818. [Google Scholar] [CrossRef]
- Barbosa dos Santos, V.; Moreno Ferreira dos Santos, A.; da Silva Cabral de Moraes, J.R.; de Oliveira Vieira, I.C.; de Souza Rolim, G. Machine learning algorithms for soybean yield forecasting in the Brazilian Cerrado. J. Sci. Food Agric. 2022, 102, 3665–3672. [Google Scholar] [CrossRef]
- Kim, S.; Kim, S. Performance Estimation Modeling via Machine Learning of an Agrophotovoltaic System in South Korea. Energies 2021, 14, 6724. [Google Scholar] [CrossRef]
- Wang, C.; Xu, S.; Yang, J. Adaboost algorithm in artificial intelligence for optimizing the IRI prediction accuracy of asphalt concrete pavement. Sensors 2021, 21, 5682. [Google Scholar] [CrossRef]
- Gautam, S.; Kanakraj, S.; Henry, A. Computational approach using machine learning modelling for optimization of transesterification process for linseed biodiesel production. AIMS Bioeng. 2022, 9, 319–336. [Google Scholar] [CrossRef]
- Das, P.P.; Rabby, M.M.; Vadlamudi, V.; Raihan, R. Moisture content prediction in polymer composites using machine learning techniques. Polymers 2022, 14, 4403. [Google Scholar] [CrossRef]
- Verduzco, L.F.R. Density and viscosity of biodiesel as a function of temperature: Empirical models. Renew. Sustain. Energy Rev. 2013, 19, 652–665. [Google Scholar] [CrossRef]
- Rocabruno-Valdés, C.I.; Ramírez-Verduzco, L.F.; Hernández, J.A. Artificial neural network models to predict density, dynamic viscosity, and cetane number of biodiesel. Fuel 2015, 147, 9–17. [Google Scholar] [CrossRef]
- Alsugair, A.M.; Al-Gahtani, K.S.; Alsanabani, N.M.; Alabduljabbar, A.A.; Almohsen, A.S. Artificial Neural Network Model to Predict Final Construction Contract Duration. Appl. Sci. 2023, 13, 8078. [Google Scholar] [CrossRef]
- Mairizal, A.Q.; Awad, S.; Priadi, C.R.; Hartono, D.M.; Moersidik, S.S.; Tazerout, M.; Andres, Y. Experimental study on the effects of feedstock on the properties of biodiesel using multiple linear regressions. Renew. Energy 2020, 145, 375–381. [Google Scholar] [CrossRef]
- Kim, S.; Kim, S.; Green, C.H.M.; Jeong, J. Multivariate Polynomial Regression Modeling of Total Dissolved-Solids in Rangeland Stormwater Runoff in the Colorado River Basin. Environ. Model. Softw. 2022, 157, 105523. [Google Scholar] [CrossRef]
- Kim, S.; Kim, Y.; On, Y.; So, J.; Yoon, C.Y.; Kim, S. Hybrid Performance Modeling of an Agrophotovoltaic System in South Korea. Energies 2022, 15, 6512. [Google Scholar] [CrossRef]
Figure 1.
General process of crop yield estimation via machine learning model.

Figure 2.
Overall procedure of random forest (RF).

Figure 3.
Process of AdaBoost regression.
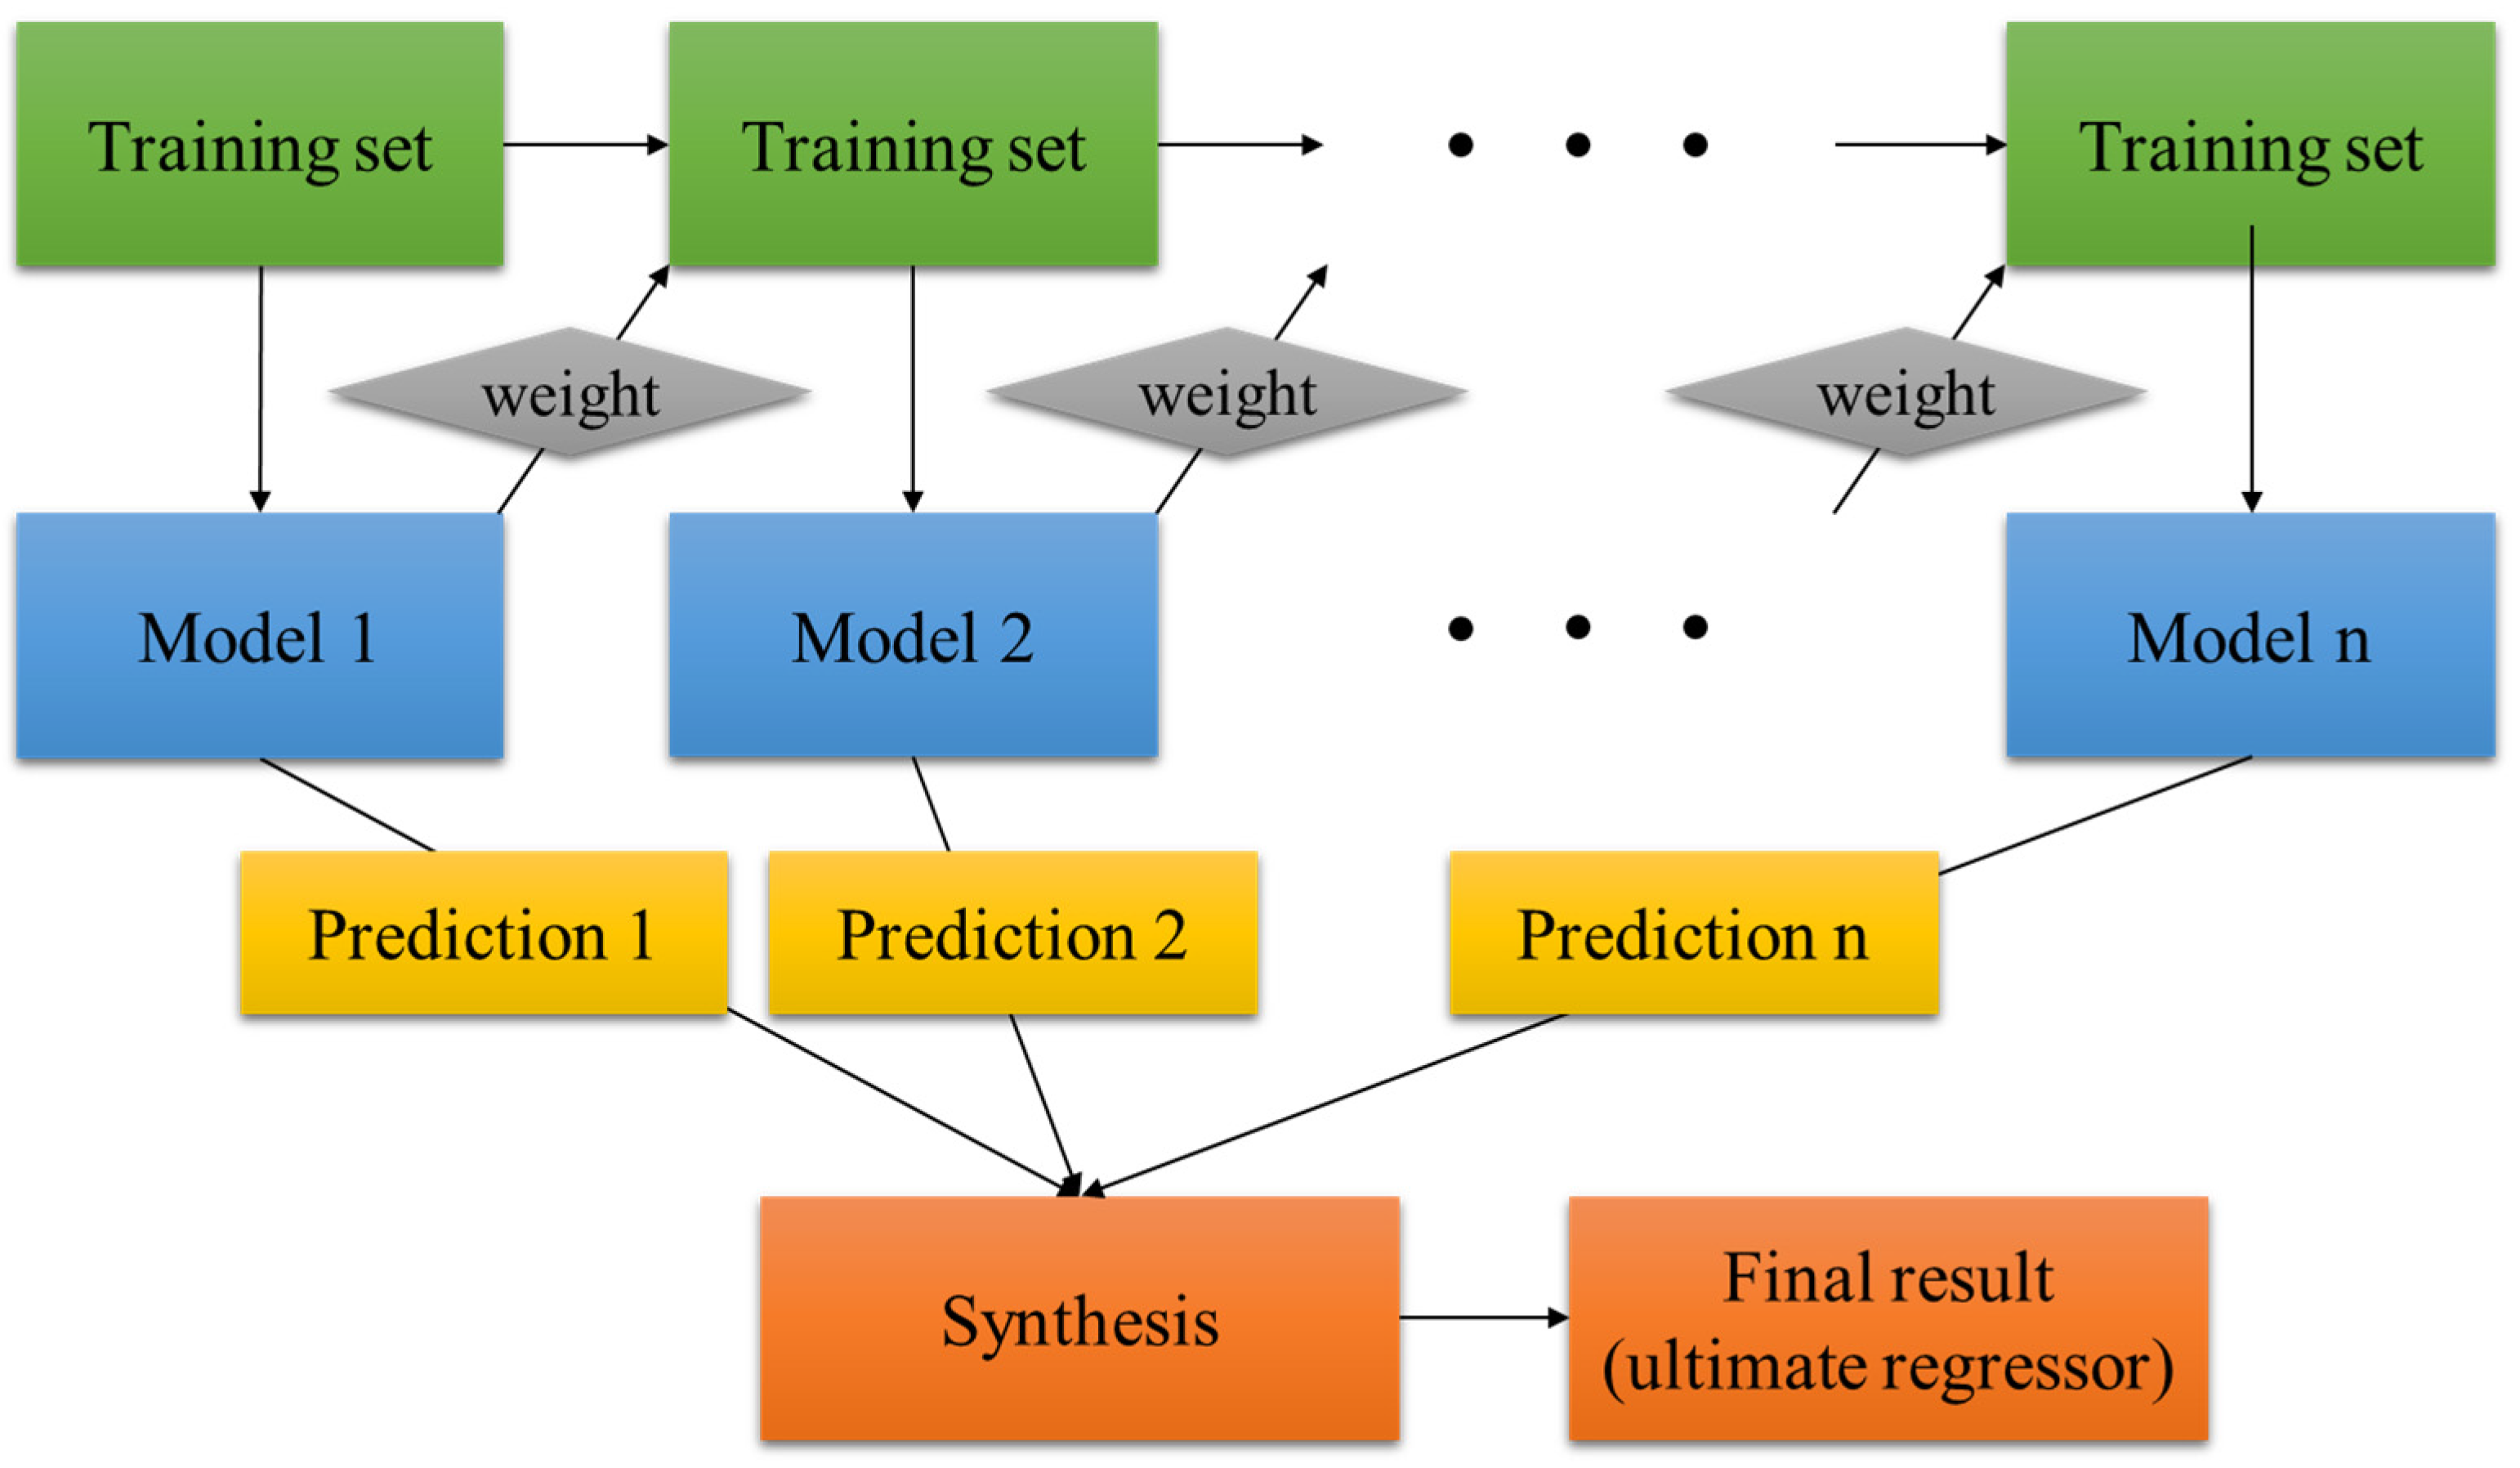
Figure 4.
Multilayer perceptron.
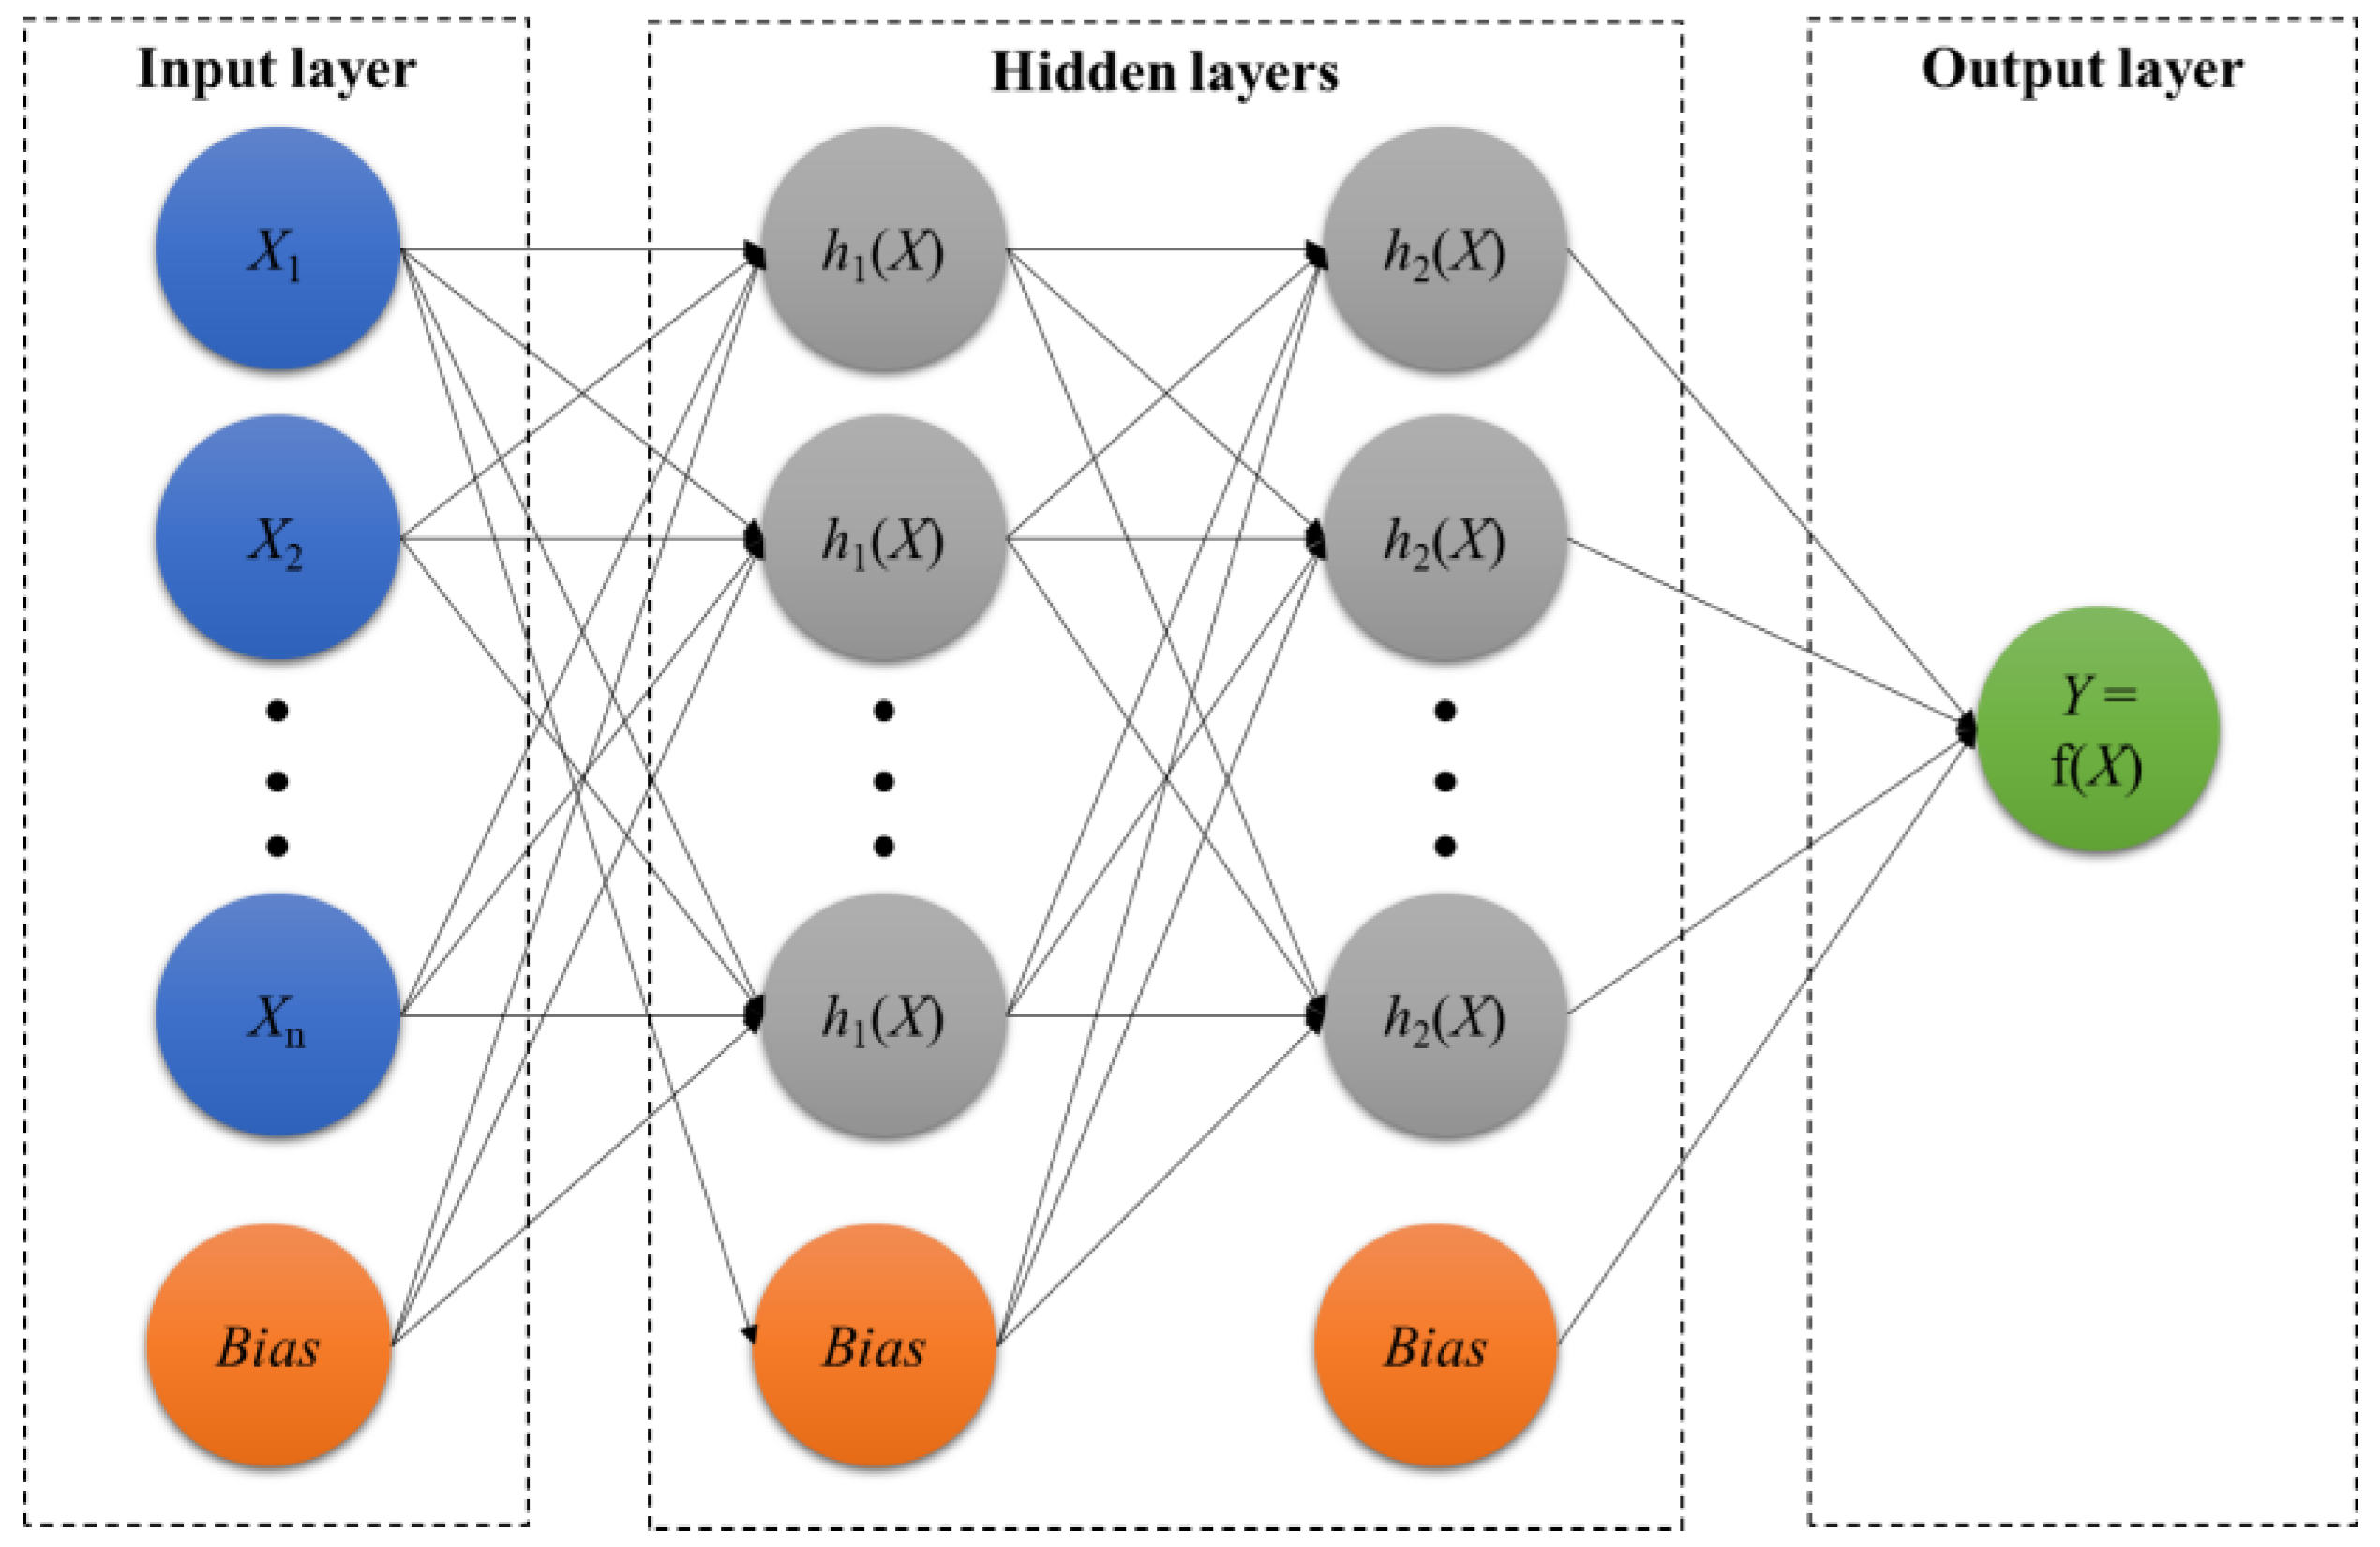
Figure 5.
Modeling procedure of ANN.

Table 1.
Data structure [57].
Table 1.
Data structure [57].
| Independent Variables | Nov. | Dec. | Jan. | Feb. | Mar. | Dependent Variable |
|---|---|---|---|---|---|---|
| Temperature (T, °C) | T1 | T2 | T3 | T4 | T5 | Annual average yield data |
| Precipitation (P, mm) | P1 | P2 | P3 | P4 | P5 | |
| Crop evapotranspiration (CET, mm) | CET1 | CET2 | CET3 | CET4 | CET5 | |
| Real crop evapotranspiration (AET, mm) | AET1 | AET2 | AET3 | AET4 | AET5 | |
| Storage (STO, mm) | STO1 | STO2 | STO3 | STO4 | STO5 | |
| Deficit (DEF, mm) | DEF1 | DEF2 | DEF3 | DEF4 | DEF5 | |
| Surplus (EXC, mm) | EXC1 | EXC2 | EXC3 | EXC4 | EXC5 | |
| Phases | Sowing & Vegetative | Flowering | Frutification | Maturation | Harvest |
Table 2.
Estimation accuracy of random forest (RF), artificial neural network (ANN), and support vector machine (SVM) [57].
Table 2.
Estimation accuracy of random forest (RF), artificial neural network (ANN), and support vector machine (SVM) [57].
| Algorithm | RMSE | R2 | ME |
|---|---|---|---|
| RF | 176.93 | 0.81 | 1.99 |
| ANN | 194.22 | 0.77 | −4.3 |
| SVM with radial base function kernel | 213.58 | 0.74 | −15.06 |
| SVM with linear kernel | 203.55 | 0.76 | 4.82 |
| SVM with polynomial kernel | 188.04 | 0.79 | 3.67 |
Table 3.
Description of input and output variables [50].
Table 3.
Description of input and output variables [50].
| Type | No. | Variables | Unit | Description |
|---|---|---|---|---|
| Inputs | 1 | Reaction time (t) | min | Numerical variable, 20–180 min |
| 2 | Reaction temperature (T) | °C | Numerical variable, 30–70 °C | |
| 3 | Catalyst weight (Wc) | wt.% | Numerical variable, 0.4–2% | |
| 4 | Methanol/oil molar ratio (M) | Not applicable | Numerical variable 3–15 | |
| 5 | Feedstock types (F) | Not applicable | Categorical variable, different biomass oil | |
| Outputs | 1 | Biodiesel yield (Y) | % | Numerical variable, 53.12–98.92% |
Table 4.
Root mean square error (RMSE) of k-nearest neighbor (KNN) with different k values [50].
Table 4.
Root mean square error (RMSE) of k-nearest neighbor (KNN) with different k values [50].
| k Values | RMSE | Result | |
|---|---|---|---|
| Training | Validation | ||
| 3 | 4.081 | 6.332 | Optimum |
| 4 | 4.567 | 6.444 | |
| 5 | 4.848 | 6.895 | |
| 6 | 5.186 | 7.166 | |
| 8 | 5.399 | 6.805 | |
| 10 | 5.670 | 6.520 | |
| 12 | 5.883 | 6.630 | |
| 16 | 6.101 | 6.969 | |
| 20 | 6.196 | 7.148 | |
Table 5.
Estimation performance of linear regression (LR), multilayer perceptron (MLP), and k-nearest neighbor (KNN) [60].
Table 5.
Estimation performance of linear regression (LR), multilayer perceptron (MLP), and k-nearest neighbor (KNN) [60].
| Model | NPLME | WPLME | EPLME | |||
|---|---|---|---|---|---|---|
| R2 | MAPE | R2 | MAPE | R2 | MAPE | |
| LR | 0.7309 | 14.4841 | 0.6824 | 9.8820 | 0.6959 | 9.1998 |
| KNN | 0.8680 | 7.9753 | 0.8217 | 5.5745 | 0.8765 | 4.7121 |
| MLP | 0.8415 | 8.5512 | 0.7761 | 7.9917 | 0.7417 | 7.6580 |
Disclaimer/Publisher’s Note: The statements, opinions and data contained in all publications are solely those of the individual author(s) and contributor(s) and not of MDPI and/or the editor(s). MDPI and/or the editor(s) disclaim responsibility for any injury to people or property resulting from any ideas, methods, instructions or products referred to in the content. |
© 2024 by the authors. Licensee MDPI, Basel, Switzerland. This article is an open access article distributed under the terms and conditions of the Creative Commons Attribution (CC BY) license (https://creativecommons.org/licenses/by/4.0/).
Share and Cite
MDPI and ACS Style
Kim, S.; Seo, J.; Kim, S. Machine Learning Technologies in the Supply Chain Management Research of Biodiesel: A Review. Energies 2024, 17, 1316. https://doi.org/10.3390/en17061316
AMA Style
Kim S, Seo J, Kim S. Machine Learning Technologies in the Supply Chain Management Research of Biodiesel: A Review. Energies. 2024; 17(6):1316. https://doi.org/10.3390/en17061316
Chicago/Turabian StyleKim, Sojung, Junyoung Seo, and Sumin Kim. 2024. "Machine Learning Technologies in the Supply Chain Management Research of Biodiesel: A Review" Energies 17, no. 6: 1316. https://doi.org/10.3390/en17061316
Note that from the first issue of 2016, this journal uses article numbers instead of page numbers. See further details here.