
Energy Consumption and Battery Size of Battery Trolley Electric Trucks in Surface Mines

School of Mechanical and Mining Engineering, The University of Queensland, Brisbane 4072, Australia
*
Author to whom correspondence should be addressed.
Energies 2024, 17(6), 1494; https://doi.org/10.3390/en17061494
Submission received: 23 February 2024
/
Revised: 14 March 2024
/
Accepted: 19 March 2024
/
Published: 21 March 2024
(This article belongs to the Section D2: Electrochem: Batteries, Fuel Cells, Capacitors)
Abstract
:Mining production, being one of the most energy-intensive industries globally, consumes substantial amounts of fossil fuels and contributes to extensive carbon emissions worldwide. The trend toward electrification and advanced developments in battery technology have shifted attention from diesel power to battery alternatives. These alternatives are appealing, as they contribute to decarbonisation efforts when compared to conventional diesel trucks. This paper presents a comprehensive review of recent technological advancements in powertrains for Mining Haulage Truck (MHT). It also compares these configurations based on mining system-level considerations to assess their future potential. The evaluated configurations include Diesel-Electric Truck (DET), Trolley Assist Truck (TAT), Battery-only Truck (BOT), Battery Trolley with Dynamic charging truck (BT-D), and Battery Trolley with Stationary charging truck (BT-S). According to the analysis, the energy demand for on-board diesel or battery power (excluding trolley power) in these alternative options is as follows: DET—681 kWh, BOT—645 kWh, TAT—511 kWh, BT-S—471 kWh, and BT-D—466 kWh. The paper also illustrates the theory of battery size design based on the current battery technology, battery material selection, battery package design, and battery size selection methods. In the case of tailored battery size selection, BOT, BT-D, and BT-S configurations require LiFePO4 (LFP) battery masses of 25 tonnes, 18 tonnes, and 18 tonnes, respectively. Based on a techno-economic assessment of battery MHT alternatives with a future perspective, it has been determined that BT-D requires the lowest amount of on-board battery energy. Furthermore, over a span of 20 years, BT-S has demonstrated the lowest on-board battery cost.
1. Introduction
1.1. Motivation
The mining industry plays a vital role in supplying essential raw materials that support the continuous development of the global economy and technological advancements. However, mining production worldwide consumes significant amounts of fossil fuels [1]. Consequently, addressing the energy consumption and emissions associated with mineral extraction is becoming imperative [2]. The Mining Haulage Truck (MHT) stands out as a major contributor to carbon dioxide (CO2) emissions in surface mines [3]. Currently, surface mining operations rely heavily on large MHT equipped with diesel-electric propulsion systems to transport ore or waste from loading sites within the mine pit to higher-elevation dump sites [4]. In terms of Greenhouse Gas (GHG) emissions, measured in CO2 equivalent, mineral loading and hauling operations account for 50.5%, 53.1%, and 37.1% of total GHG emissions in iron ore, bauxite, and coal mines, respectively [2]. Taking steps to mitigate emissions from truck fleets presents a significant opportunity to achieve a substantial reduction in the overall carbon footprint of mining facilities.
In order to tackle the significant emissions produced by MHT, the mining sector has been actively exploring innovative solutions to shift away from fossil fuels. In recent years, the industry has set more ambitious goals, aiming for complete decarbonisation of its fleet [5]. Electrification has emerged as one of the most effective measures to reduce emissions in the global transportation sector. The decarbonisation potential of Battery Electric Vehicles (BEVs), compared to conventional Internal Combustion Engine (ICE) vehicles, has gained broad attention [6]. However, the use of diesel hybrid electric propulsion in long-haul cycle trucks often has a limited impact on energy efficiency and emissions improvements [7]. Nevertheless, advancements in powertrain technology, materials, and batteries have created a consensus that the electrification of MHT holds promising prospects for reducing emissions. It is crucial to consider specific operational profiles when selecting an environmentally friendly powertrain solution for MHT, as they require different design criteria compared to passenger and heavy-duty vehicles to accommodate unique mining production conditions [2]. Recently, several mining companies, including BHP, Rio Tinto, Roy Hill, Vale, and FMG, have initiated trials with battery-powered trucks, providing invaluable learning experiences for the broader implementation of battery electric trucks in mining operations [8].
While the transition to battery technology in mining equipment offers promising emissions reduction possibilities, there are several unique characteristics and challenges specific to mining applications that require careful investigation. One crucial consideration is the significant disparity in energy density between diesel fuel and state-of-the-art lithium batteries used in current mining applications. Diesel fuel has a lower heating value of approximately 12,000 Wh/kg, whereas the specific energy of lithium batteries for mining applications currently stands at around 150 Wh/kg [9]. Even if taking into account tank-to-wheel efficiency, combustion engine-based systems have much higher specific energy compared to electric powertrains [10]. Hence, there is a need for research on battery sizing specifically tailored to mining battery-electric alternatives, considering the dedicated mining haul routes. Currently, the battery constitutes a significant portion of the capital cost, and appropriately sizing the battery for mining haulage applications can enhance the cost-effectiveness of mining systems [11].
This research provides a well-rounded perspective on 5 applications of MHT through modelling and visualising complex mining scenarios and making data-driven decisions in the manner of energy consumption analysis. BOT, BT-D, and BT-S are selected from these available technologies to achieve decarbonisation in the mining fleet and develop a surface material movement strategy. To continue this acceleration in mining battery truck adoption, a battery sizing method is developed in this paper for designing the proper battery mass for each application, not only from a battery characteristics perspective but also considering mining system deployment and economic value.
1.2. Literature Review
In recent years, researchers have made significant efforts to enhance traditional diesel powertrains through advanced technology and to develop battery electric powertrains for heavy-haul transportation. These endeavours have involved configuration comparisons, techno-economic assessments, and energy efficiency analyses. In a study by Knibbe et al. (2022) [8], real-world data obtained from multiple locomotives operating in the Australian rail freight industry was demonstrated to illustrate the limitations of state-of-the-art batteries. To assess the energy requirements of each route and explore the potential for energy regeneration, an energy model was created. Cunanan et al. (2021) [12] conducted a comprehensive review that illustrated the working mechanisms, performance metrics, and current advancements in Heavy-Duty Vehicle (HDV) powertrains. Additionally, The benefits and drawbacks of diesel, battery-electric, and hydrogen fuel cell engine technologies were highlighted in a detailed comparison. A holistic analysis of BEVs was investigated to assess their advantages and disadvantages. Ritter et al. (2021) [9] investigated the integration of battery-assisted trolley buses into an established trolley bus network for public transportation. Simulation and energy management optimization techniques were utilised to determine the potential energy savings. The findings revealed that incorporating battery assistance could lead to energy savings of up to 20% when compared to relying on conventional trolley buses.
Several studies have focused on comparing different powertrain options for MHT and analysing their impact in terms of emission reduction, cost-effectiveness, and energy consumption. Ertugrul et al. (2020) offered a comprehensive overview of the current state of mine electrification and emphasized the research prospects of battery-electric powertrain trucks [10], while Feng et al. (2022) [2] compared the energy efficiency and emissions of several emerging clean powertrain technologies with a benchmark MHT outfitted with a diesel engine and diesel electric drive. An integrated design and control optimisation technique was utilised to optimise them for a typical MHT. Kalantari et al. (2021) [5] undertook a study to present a renewable energy system that aimed to deliver electricity, haulage, and thermal power at remote mines by integrating renewable and multi-storage systems. Through a techno-economic evaluation, the study identified the most suitable renewable solutions for various mining methods. Mareev and Sauer (2018) [13] concentrated on the traction battery and catenary power system and studied the energy consumption of overhead catenary trucks under various configurations. Their results indicated that the energy consumption of overhead catenary trucks was comparable to battery-electric trucks and significantly lower than that of conventional diesel trucks. In the Sustainable Intelligent Mining System (SIMS) project, a field BEVs’ trial was discussed in Halim, et al. (2022) [14], which demonstrated that using BEVs improved working conditions in terms of reduced emissions, Diesel Particulate Matter (DPM), and noise, as perceived by mine workers surveyed during the trial. Mazumdar (2011) presented the performance improvement of trolley-assisted haul trucks through simulation studies and field experimental results [15]. The performance of a truck fleet utilising a trolley assist system was assessed by Cruzat et al. (2018) [16], showing noteworthy improvements including a 44% increase in uphill speed, a 16% decrease in travel time, and fuel savings of more than 85% per up-down cycle. Lindgren et al. (2022) [17] showcased the successful application of a battery trolley-dynamic system by the Swedish mining company Boliden. Simulation results indicated that battery-electric operation with trolley assist was more cost-effective than diesel-electric operation under reasonable assumptions.
The existing literature on battery technology predominantly focuses on optimizing battery parameters. In Refs. [3,4,11,18] proposed various mathematical models, such as Dynamic Programming (DP) or Machine Learning (ML) methods, are proposed for the operation of BEVs to predict and optimize Energy Management Strategies (EMS). These models aimed to minimize battery degradation costs, predict State-of-Charge (SOC) levels and battery aging, monitor Depth-of-Discharge (DOD), and State-of-Health (SOH), among other factors. Mareev et al. (2017) [19] conducted an analysis of energy consumption, required battery capacity, and charging infrastructure for BEVs within specific transportation scenarios. The study incorporated various constraints such as payload, charging infrastructure costs, and battery aging models, providing statistical predictions based on these factors. Xie et al. (2020) [20] established a convex objective function that includes battery size, DOD, battery aging, and fuel consumption, considering a bus operation profile. Energy recovery technology was widely implemented in battery electric alternatives, improving the performance and cost-effectiveness of BEVs. Terblanche et al. (2018) [21] investigated how various Energy Recovery System (ERS) technologies impact overall haulage costs in surface mines.
Despite the individual findings presented in these studies, there is currently a lack of an up-to-date and comprehensive review of recent technological advancements in MHT powertrains or a comprehensive comparison of these configurations based on mining system-level considerations to assess their future potential. Selecting and designing a suitable powertrain system for mining operations involves various factors. Not all energy storage systems and technologies used in conventional BEVs are perfectly suited for MHT applications. Battery powertrain alternatives offer advantages such as zero emissions and high efficiency. However, pure battery-electric propulsion faces challenges due to the low energy density of the Energy Storage System (ESS) and long battery charging times [7]. Given the high energy consumption nature of MHT, a significant ESS capacity is required to meet mining production requirements compared to conventional BEVs. Determining the appropriate battery size for MHT while considering mining haulage operations has become an urgent issue.
1.3. Aim and Objectives
In this study, the energy consumption competitiveness of five distinct configurations is evaluated and compared for low-emission and decarbonisation truck platforms. The evaluated configurations include:
- (a)
- Diesel-electric truck,
- (b)
- Trolley Assist truck,
- (c)
- Battery-only truck,
- (d)
- Battery Trolley with dynamic charging truck, and
- (e)
- Battery Trolley with a stationary charging truck.
A hypothetical typical mining truck operation profile is assumed, considering factors such as truck speed, load state, road gradient, and elevation profiles, to assess truck performance. The energy consumption of each configuration is evaluated based on the force parameters influencing the truck’s burden during the haul cycle using an energy consumption method. The selection of battery size is influenced by the round-trip road design and the application of various battery powertrain technologies. For this research, LiFePO4 (LFP) battery and Lithium Titanium Oxide (LTO) are chosen as battery chemical materials. The proper battery size is determined through truck energy simulations, considering different SOC values and battery Net Present Value (NPV) costs as evaluation criteria.
The paper is organized as follows: Section 2 provides an introduction and summary of MHT configurations, focusing on various powertrains and solution techniques within the current mining system-level condition. Section 3 explores a haul road simulation, including the creation of a hypothetical haul cycle, specific assumptions, and an analysis of truck performance. In Section 4, force parameter analysis is conducted to examine the energy consumption of different applications during a single-haul cycle. Section 5 discusses the selection of appropriate battery chemical materials and the theory of battery package design for MHT applications. This section also covers the methods for selecting battery size and includes a study on SOC and NPV. Finally, Section 6 and Section 7 present the related discussions and conclusions, respectively.
2. Mining Haul Truck Configurations
Conventional DET relies on fossil fuels and an ICE to generate the energy required for propulsion [12]. Figure 1a outlines a typical DET system diagram. The diesel-electric drive system that powers these trucks is made up of a powerful diesel engine, an electric alternator, and two electric drive motors that are mechanically incorporated into the truck’s rear wheels [22]. To date, the DET stands out as the most practical, adaptable, and extensively employed option among mining equipment [23].
In the mid-1970s, Several surface mines equipped with large off-highway electric trucks considered introducing Trolley Assist (TA) into their operations [23]. Figure 1c outlines a typical TAT system diagram. Compared to conventional DET, there is an overhead distribution connected to on-board power management via pantograph. Hence, by integrating the power management module, which generates power from a diesel engine, with overhead trolley electricity, additional fuel efficiency can be achieved. When the trucks are effectively connected to the overhead trolley, this integration leads to instant improvements in performance, such as increased speed [22]. The TA system proves to be the most economical solution uphill, where a significant portion of the total energy is consumed [23].
BOT uses on-board battery packages to power electric motors for their propulsion [12]. Figure 1b outlines a typical BOT system diagram. The BOT powertrain comprises battery packages, power management, and electric motors. Furthermore, BEVs commonly incorporate an ERS, which operates by capturing the potential energy that is typically dissipated during braking in traditional vehicles when descending downhill [12]. Moreover, electric motors employed in the BOT offer enhanced torque at low speeds compared to conventional ICE [24].
Battery Trolley (BT) aims to offer a haulage mining system using the full source of electrical power as a decarbonisation technology by integrating battery technology, TA systems, and ERS [23]. Figure 1d outlines a typical Battery Trolley Truck (BTT) system diagram. There are three BT configurations offered in mining haulage operations: battery trolleys with dynamic charging, battery trolleys with stationary charging, and battery trolley-dual trolley systems. The authors’ previous work [23,25], introduced more details about battery trolley systems, including mechanics, components, and characteristics. Because dual trolleys need higher upfront capital, this study only focuses on the simulation of both battery trolley-dynamic and battery trolley-stationary configurations.
Dynamic charging technology allows grid power to be used to power the electric drive motors and simultaneously charge the onboard truck battery packages while connected to the trolley system. In BT-D systems, the onboard battery can receive enough charging electricity from the uphill grid charging and the downhill energy recovery to balance energy consumption in one haul cycle. The stationary charging method requires a battery station for battery charging or battery swapping. The choice between charging and swapping methods depends on the charging C-rate (a measure of the rate at which a battery is discharged relative to its maximum capacity) [26] and swapping time. In this study, the battery swapping method was selected for further calculation and simulation. There are three options for choosing a battery location: on the crest of a pit, on the bottom of the pit, or in the middle of the long ramp. In the following simulation, this study assumes a battery station is located on the crest of the pit to provide ample space for infrastructure and truck parking. It’s important to note that the diesel alternatives (DET and TAT) are manual operations, while the battery alternatives (BOT, BT-D, and BT-S) are automatic applications without operators.
3. Haul Road Simulation
3.1. Haul Road Profiles
Surface mining contributes to the extraction of approximately two-thirds of the world’s industrial metals [5]. During actual mining operations, a mining truck follows a specific sequence: it is loaded with ore or waste material at the loading location, ascends to the designed point area to dump the material, and then descends back to the loading site without any load. These trucks predominantly operate off-road within a mine, repeatedly undergoing cycles of repeated speed, mine load, and climbing/descending [16].
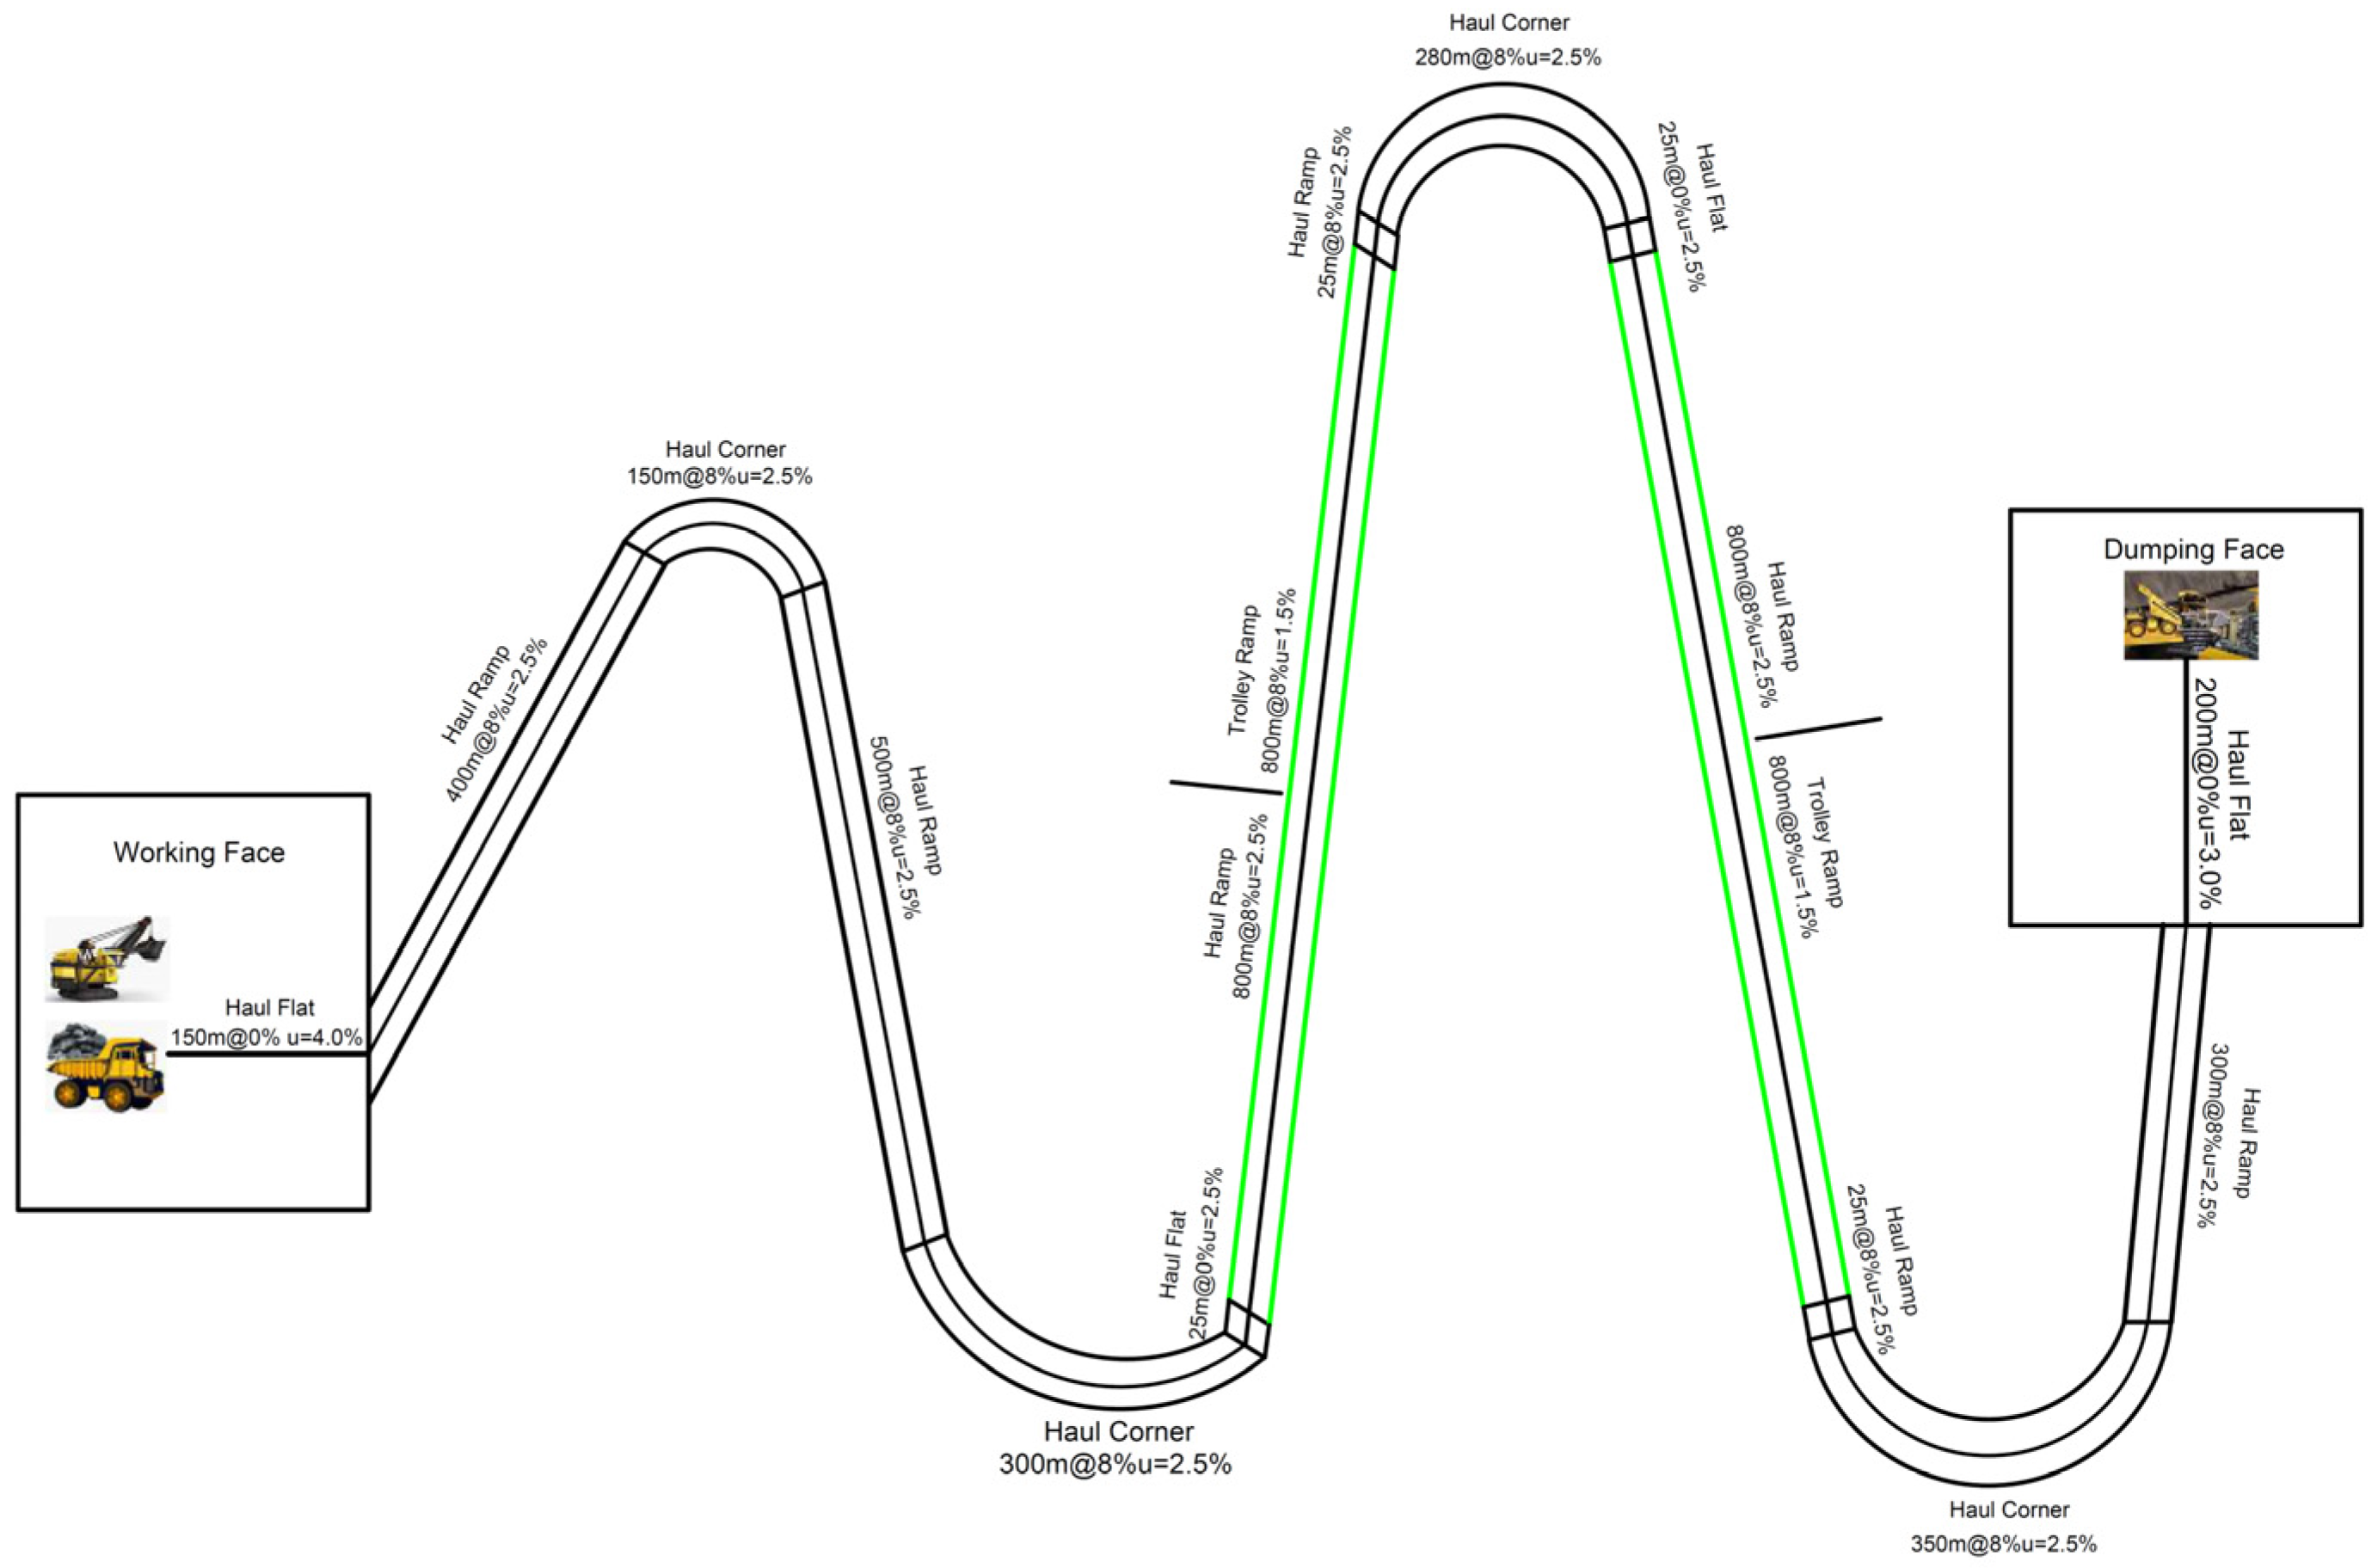
A typical hypothetical mining haul road was constructed for further simulation and comparison (Figure 2). The study focuses on the Komatsu 830E truck with a payload capacity of 220 tonnes. The total haulage distance is 8660 m, and there is an elevation of 314.4 m from the working face to the dumping face. The haul ramp has a gradient of 8%, while the haul flat section has a gradient of 0%. It is important to note that the green section in the figure represents the long-haul ramp or trolley ramp. In the DET and BOT conditions, there are two long-haul roads, each with a length of 800 m, while in the TAT and BTT conditions, there are two trolley ramps. Each trolley ramp consists of two segments, both 400 m long. Each segment is powered by a dedicated substation. Additionally, there is a 25 m flat road before the long trolley ramp to allow the truck to accelerate and reach the required approach speed. Figure 3 displays more profiles of the haul road, showing the relationships between gradient, load state, rolling resistance coefficient, and elevation with road distance. The green dashed line represents the trolley haul road condition, which has a rolling resistance coefficient of 1.5% to ensure a good connection between the pantograph and trolley lines, while the conventional haul road has a rolling resistance coefficient of 2.5%. The small subplot in the distance-elevation figure illustrates the 25-m flat road.
3.2. Simulation Assumption
In this hypothetical simulation, it is necessary to ensure some assumptions:
- The available time, utilisation time, and operating time are the same for five truck applications.
- As this simulation focuses on the operation of a single truck rather than a fleet, it does not take into account the fleet dispatching/bunching phenomenon or the limitations of trolley capacity.
- The power provided by the trolley is ample to charge the onboard battery through dynamic charging technology. The battery can efficiently receive an adequate amount of power at a reasonable charging rate, enabling it to quickly accumulate sufficient energy within a short period of time.
- All alternatives have the same Gross Vehicle Weight (GVW) and payload during the haul cycle.
- The consideration of volume constraints within the truck to accommodate onboard energy storage is not included in the analysis.
- Stationary charging is evaluated based on the battery swapping method rather than fast charging. The battery swapping process takes 20 min and is carried out after every two cycles.
- A battery station is installed on the crest of the pit, while the SOC is set as the initial capacity level at the loading point in order to match the mining cycle for simulation.
- Generally, trolley operation has the capability to handle steeper gradients, reaching up to 10%. The uphill segment design is typically 8–12% ramp grade. 10% is the most common design in Australia. However, for the purpose of better comparison, this study has standardized the gradient at 8% for all truck alternatives to follow international practice.
- Truck performance under varying weather conditions is not taken into consideration in this study. Additionally, it should be noted that battery performance is sensitive to ambient temperature. For the purpose of the analysis, the study assumes a default ambient temperature of 25 °C [21].
3.3. Truck Performance on the Haul Road
In terms of performance on the hypothetical road, the DET and TAT applications have a minimum speed of 12 km/h, while the battery alternatives have a minimum speed of 15 km/h [17], due to the higher wheel torque they provide at lower speeds. The maximum speed for all applications is set at 30 km/h. For the haul ramp speed or trolley ramp speed, this study adopts reasonable assumptions based on existing research (Table 1). Considering the battery swapping method used in the simulation, which takes 20 min, the simulation allocates 10 min for swapping in each cycle. It is important to note that mining trucks, due to the absence of traffic congestion, typically maintain a consistent and steady speed during their operation. This allows the speed profile of these trucks to be repeatedly reproduced, ensuring they cover the required distance for carrying loads within the mine [4].
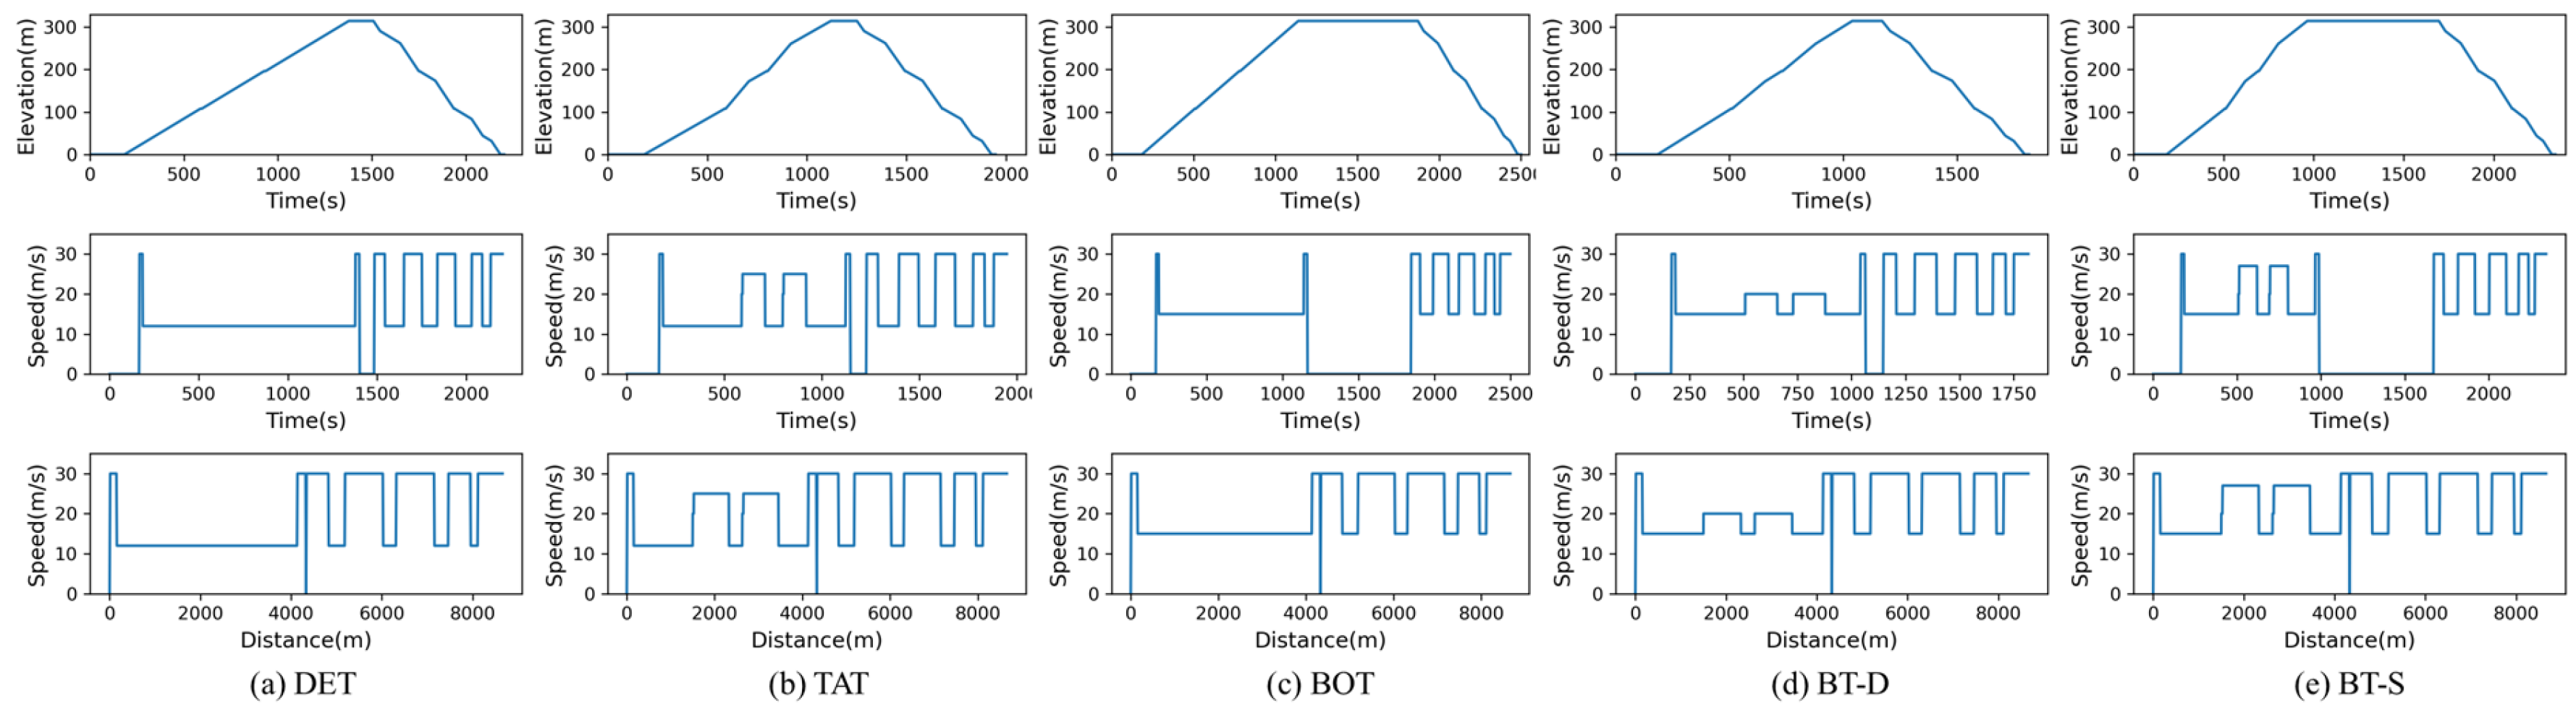
Figure 4 illustrates the performance of the 5 applications in a single haul cycle, depicting the relationships between time elevation, time speed, and distance speed. Based on the simulation results, the cycle time for DET is calculated as 2204 s. In contrast, the truck utilizing trolley assist experiences a shorter cycle time of 1947 s due to the acceleration provided by the trolley ramp, resulting in a speed of 25 km/h. However, BOT requires a longer cycle time of 2500 s due to the need for battery swapping, despite its higher speed on the haul road. In the case of the BT-D alternative, its trolley ramp speed is 20 km/h, slower than the TAT. This is because dynamic charging technology necessitates a relatively longer time to charge the truck’s onboard battery, meeting the energy consumption demands of the haul cycle. Nevertheless, the cycle time for the BT-D alternative is significantly shorter compared to the battery-only truck since there is no need for battery swapping, amounting to 1817 s. Regarding the BT-S alternative, its cycle time falls between that of the BT-D and BOT. It requires a relatively longer cycle time due to battery swapping compared to BT-D, yet it achieves a relatively shorter cycle time compared to BOT thanks to its fast speed on the trolley ramp.
Figure 5 provides the trucks’ operation time profiles, illustrating a comparison of cycle times for the five truck applications. The trucks’ arrival sequence at the ramp crest is as follows: BT-S—965 s, BT-D—1040 s, TAT—1121 s, BOT—1139 s, and DET—1377 s. This sequence is determined by the fact that BT-S achieves the highest speed on the haul ramp, while DET exhibits the slowest speed during the haulage period. In terms of completing one cycle, the sequence is as follows: BT-D—1817 s, TAT—1947 s, DET—2204 s, BT-S—2342 s, and BOT—2500 s. This order is influenced by the battery swapping process required for BT-S and BOT at the crest of the pit. These findings indicate that BT-S has the shortest arrival time at the ramp crest due to its fast speed, while BT-D exhibits the shortest cycle time overall. TAT and DET follow with slightly longer cycle times, and finally, BOT has the longest cycle time due to the battery swapping process.
4. Energy Consumption Analysis
4.1. Force Parameter Analysis
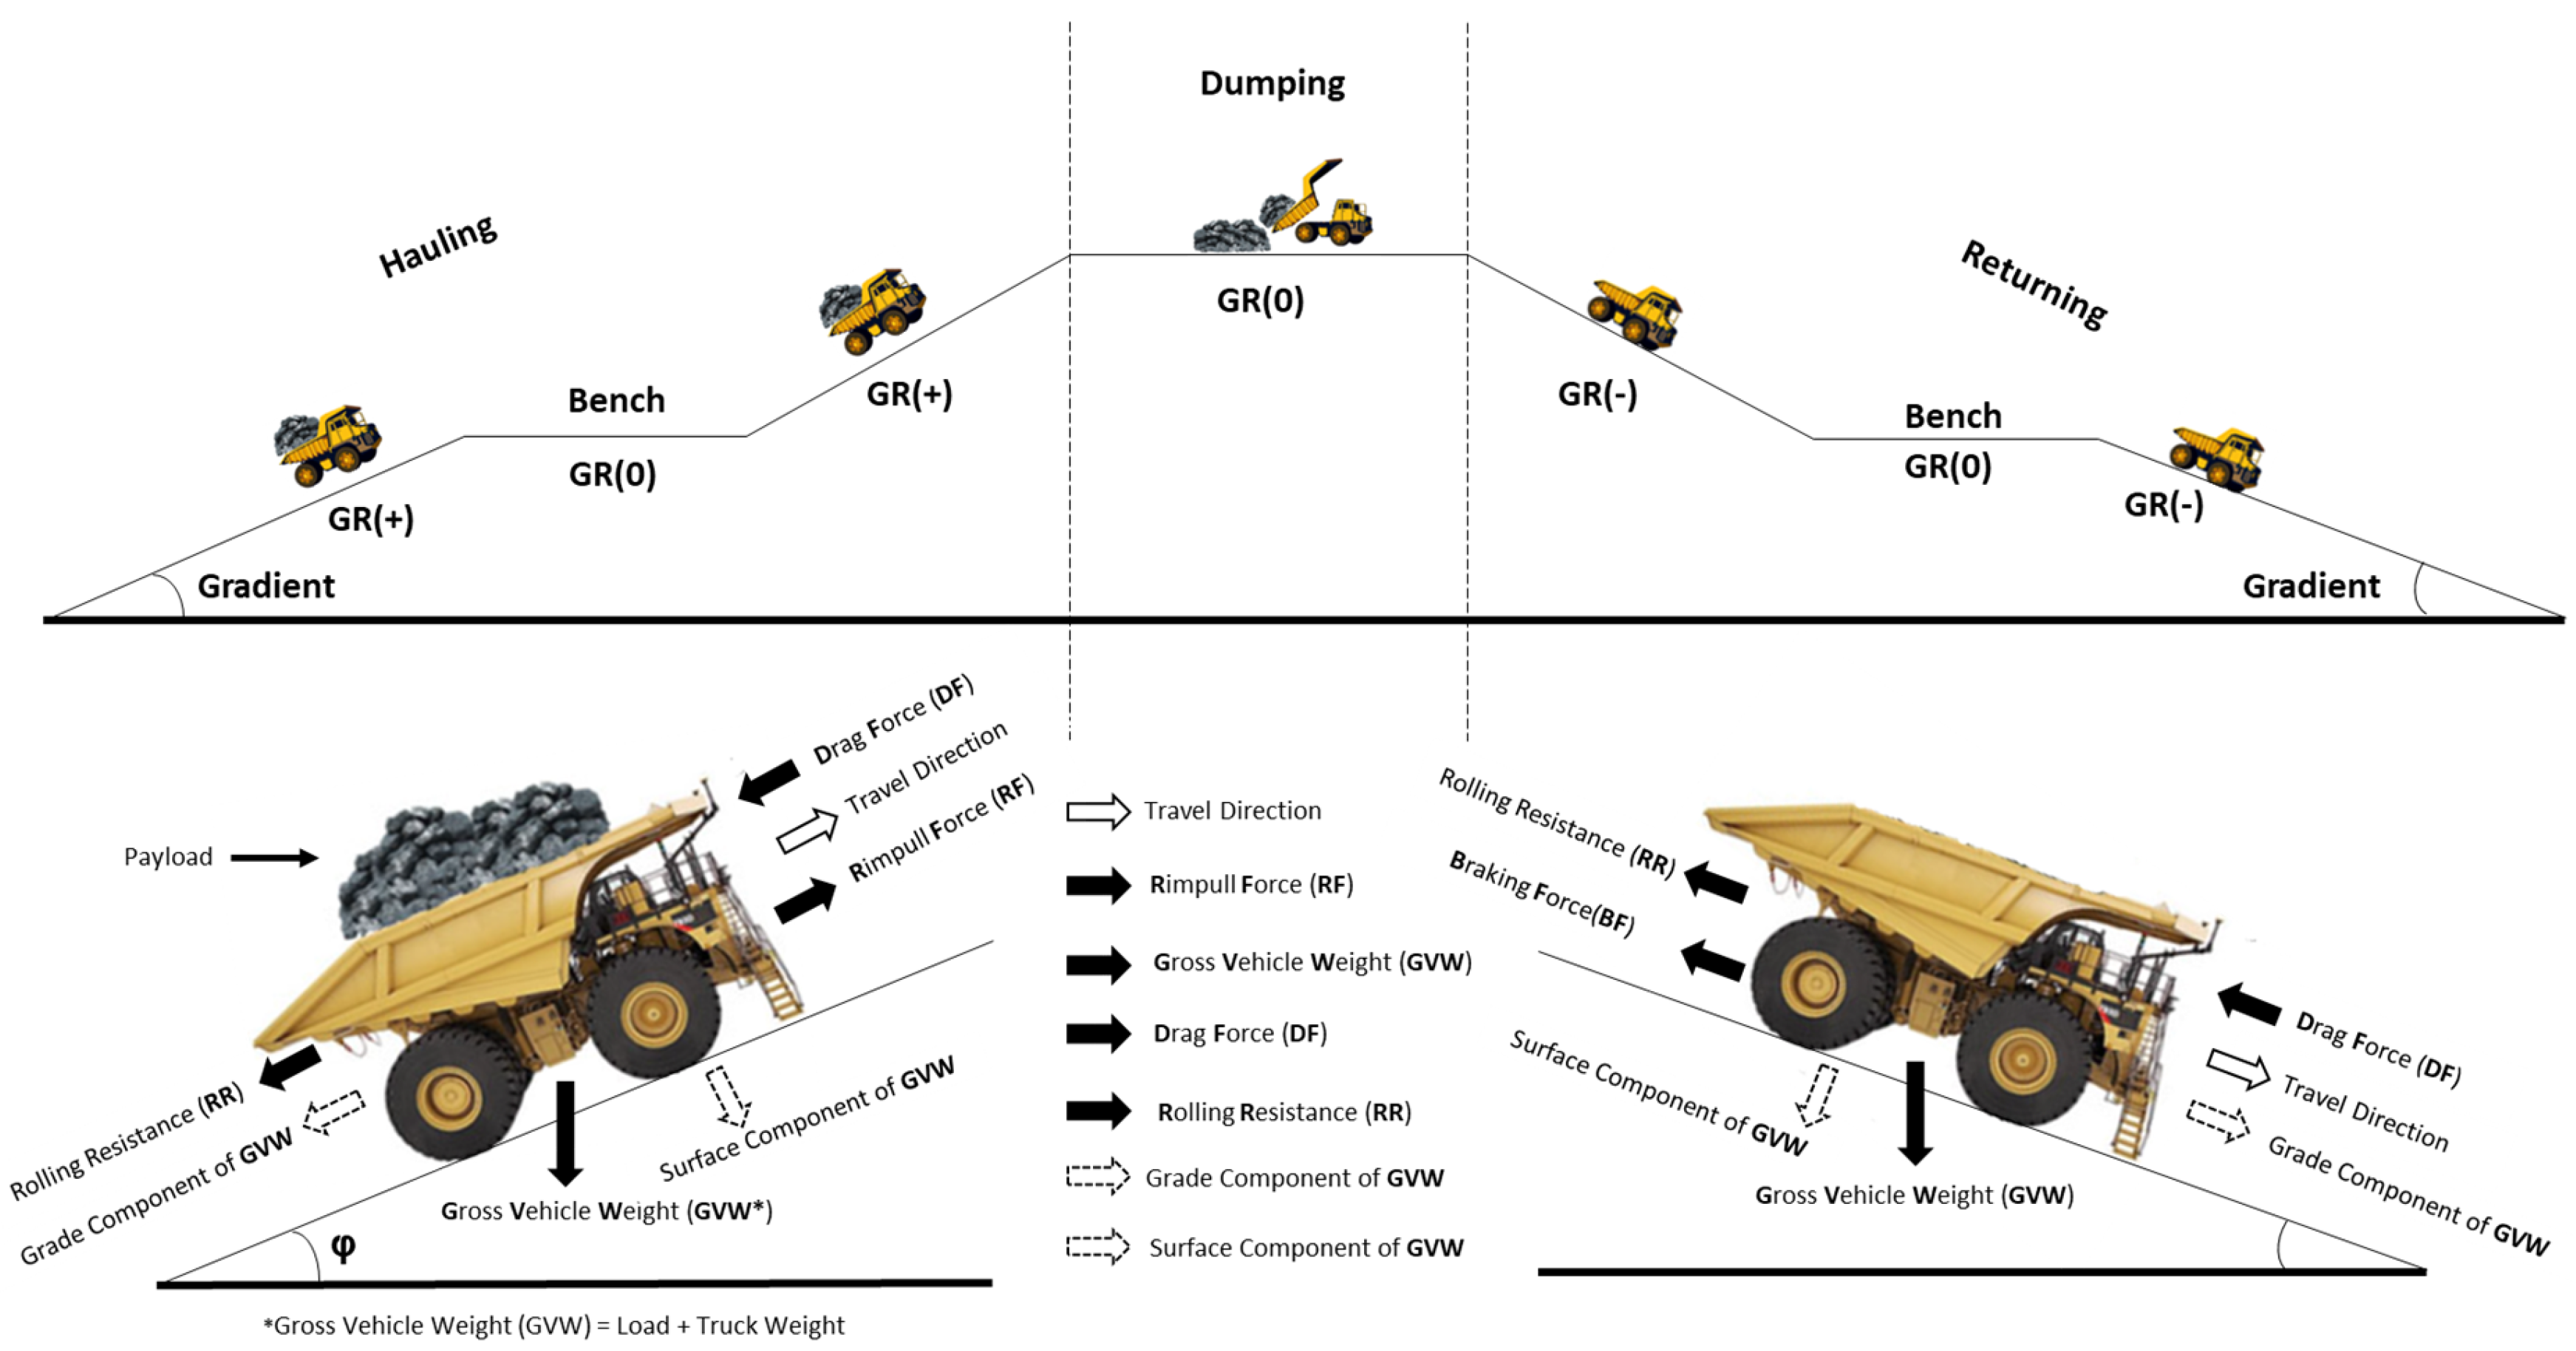
The energy consumption of MHT is affected by various parameters, with equipment characteristics and operating conditions being the most significant factors. These parameters play a crucial role in determining the overall energy usage of MHT during its operations [27]. This research applied a consistent base truck configuration and utilized the same haul road profile, which is part of the operating conditions. Additionally, an important aspect of the operating conditions is the force parameters that the trucks experience on the road. These force parameters have a significant impact on the energy consumption of the trucks (Figure 6).
They are (Figure 6):
- (a)
- Rolling Resistance (RR), which is the force that resists motion when the truck tyre rolls on the haul road.
- (b)
- GVW, which represents the total weight of MHT. It equals the weight of the empty vehicle plus the rated payload.
- (c)
- Rimpull Force (RF), which offers rimpull power to change the speed of a truck. It is sourced from the on-board engine.
- (d)
- Drag Force (DF), which means aerodynamic resistance, It is the force that resists air drag when the truck operates.
- (e)
- Braking Force (BF), which is the force that reduces truck speed, especially on the downhill section.
According to Newtonian mechanics, when MHT is cruising at constant speed on flat roads (φ = 0), the mechanical power consumed is spent to overcome the RR with the ground and the DF of the truck. The kinetic force is modelled as follows:
where is rolling resistance force; is drag force; is rimpull force; is kinetic force; CR and CD are the RR and DF coefficients, respectively; is the air density, kg/m3; and A is the cross-sectional area of the vehicle, m2; g is the gravitational acceleration, kg/s2; m is the GVW, kg; v is instant speed, m/s.
When MHT is operating on an uphill section (φ ≠ 0), the mechanical power consumed is spent to overcome the RR with the ground, the DF, the grade component of the GVW, and the acceleration of the truck. The kinetic force is modelled as follows:
when MHT is operating on a downhill section (φ ≠ 0), the mechanical power consumed is spent to overcome the RR with the ground, the DF, the grade component of the GVW, and the acceleration of the truck. The braking force is modelled as follows:
where is braking force; is the angle of ramp road.
4.2. Energy Consumption Calculation
All parts of energy consumption are modelled as fowling:
where are rolling resistance energy, drag energy, rimpull energy, gravitational potential energy, and braking energy in kWh, respectively. It is the default configuration for battery alternatives to install an ERS, which can capture approximately 50% of braking energy for the on-board battery for further use [8]. represents the total work source from all force parameters, kWh. Apart from the force energy, there is also consideration for the auxiliary energy required to power other onboard components. This auxiliary energy, although relatively small compared to the kinetic energy required, accounts for approximately 10–20% of the total force energy. The specific percentage may vary depending on the specific powertrain configurations implemented in the MHT. In Equation (7), means the total energy of the auxiliary system. Which consists of air conditioner energy (), cooling energy (), and hydraulic energy (), kWh. means the coefficient of air conditioning, which is 1–3% for diesel alternatives, and the mean is 2%, while it is 0% for battery alternatives due to no operator. is the coefficient of cooling system, which is 5–7% for diesel alternatives, and the mean is 6%, while it is 8–12% for battery alternatives, and the mean is 10% because battery packages have a higher cooling requirement for maintaining normal performance. is the coefficient of the hydraulic system, which is 2% for diesel and battery alternatives. represents the overall total energy of force energy and auxiliary energy that the truck needs in the whole haul cycle. The energy consumption of each part for 5 applications is shown in Figure 7.
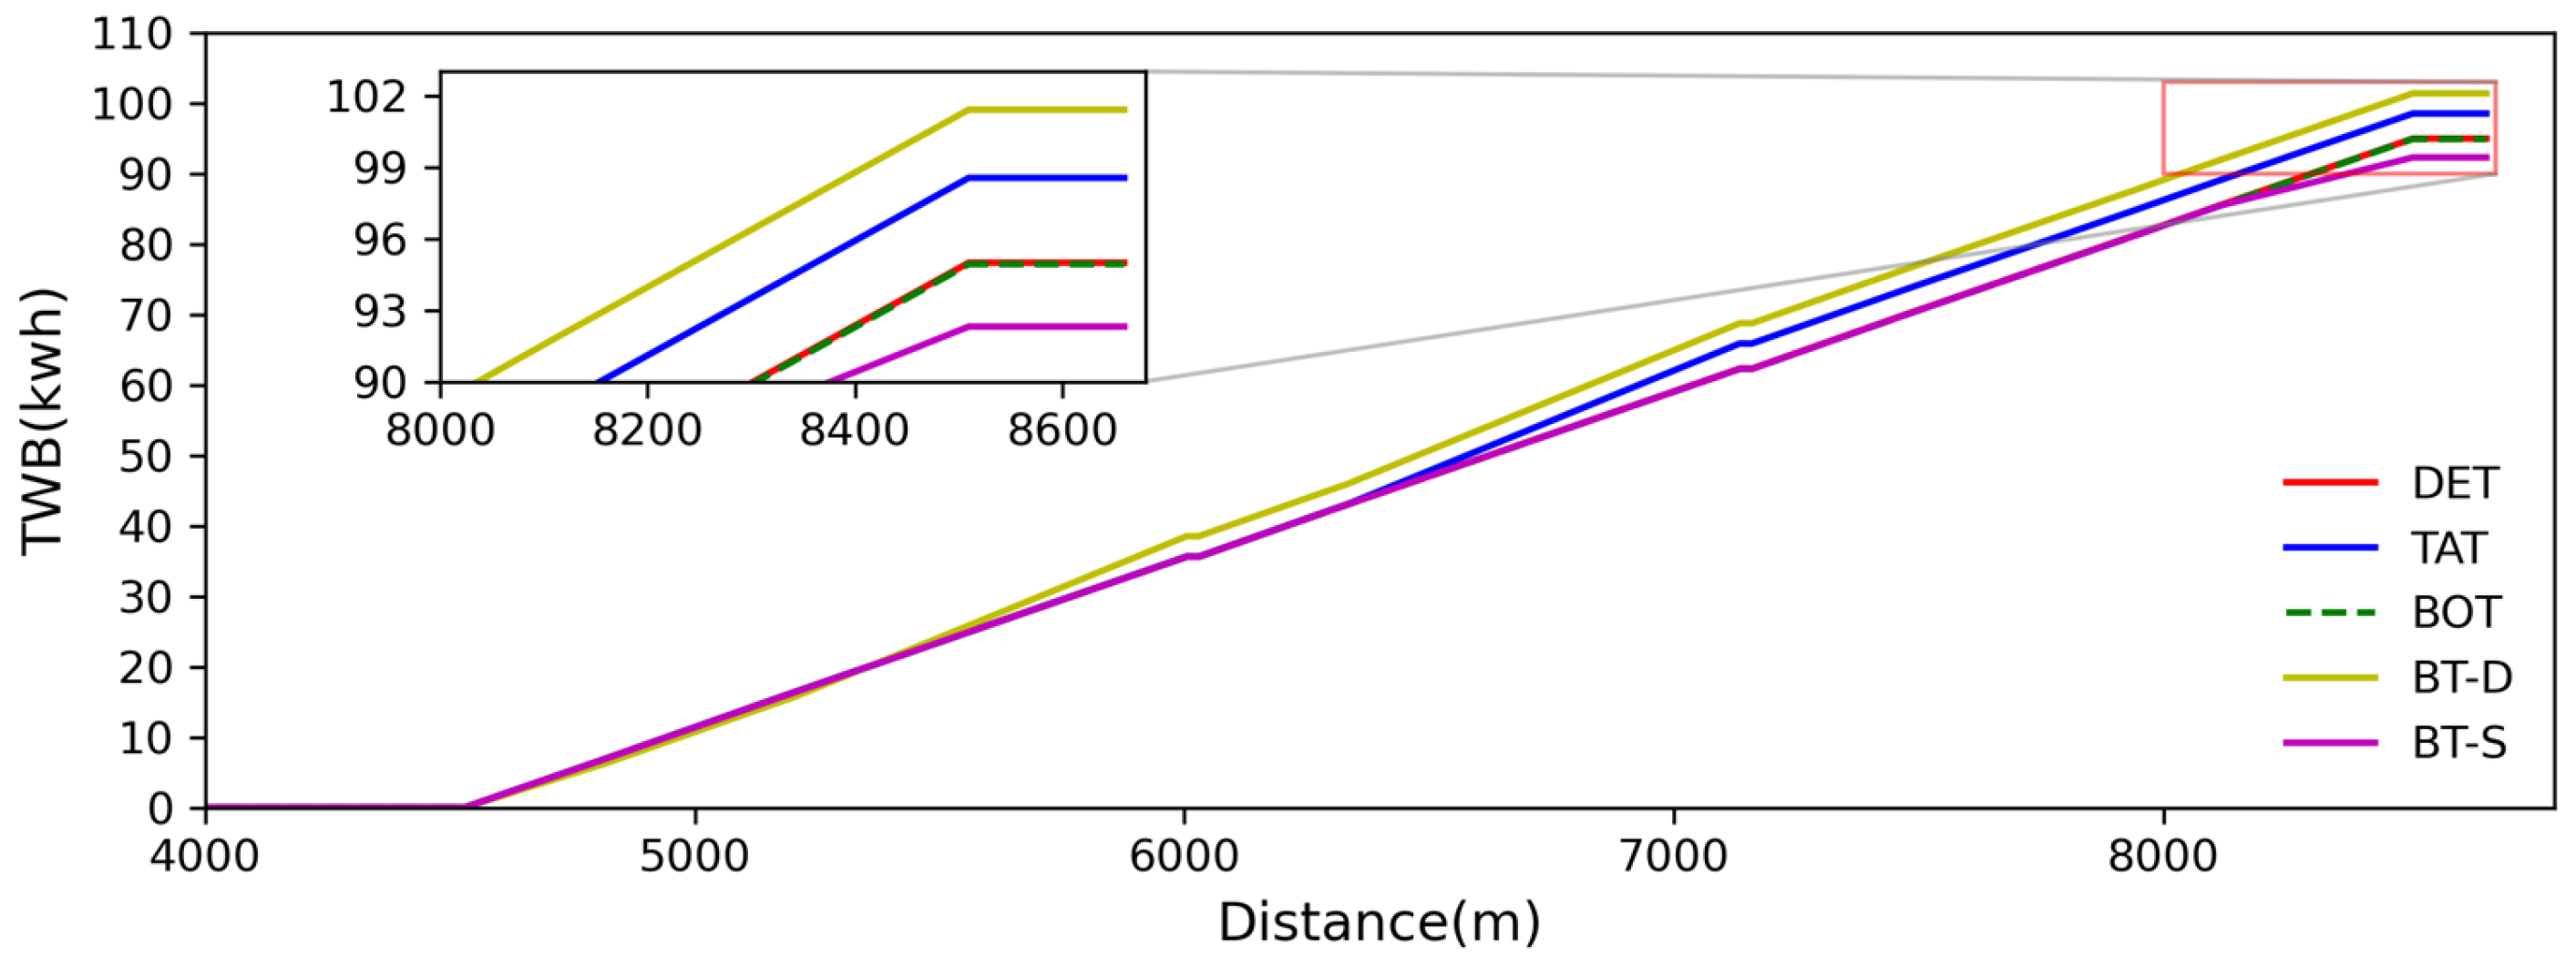
The energy requirements per cycle for different applications vary significantly. Figure 8 provides an energy comparison of all alternatives in terms of rimpull energy, drag energy, rolling resistance energy, and gravitational potential energy. TAT requires the highest total work of rimpull (TWRI), while BOT consumes the least. Despite the low speed on the haul road, the total work of drag (TWD) still shows that BT-S consumes more energy compared to others due to its faster speed. The total work of rolling resistance (TWR) and the total work of gravity (TWG) are the two major components of energy consumption. DET and BOT consume higher rolling resistance energy due to the 2.5% rolling resistance coefficient on the haul ramp, which is higher than the 1.5% coefficient on the trolley ramp. However, it should be noted that these calculations assume that all alternatives have the same GVW, which is why the gravitational potential energy is the same for all trucks. In reality, due to differences in onboard battery size and powertrain specifications, the gravitational potential energy required for each truck alternative would likely slightly differ.
Due to the GVW and significant changes in operating elevation, MHT experiences substantial loss of potential energy as it descends haul ramps in surface mines [20]. To mitigate this energy loss, ERS technology is successfully employed in various industrial applications to recover potential energy and reduce the amount of energy required to be carried onboard [8]. In Figure 9, it is evident that braking energy constitutes a relatively small portion of the total energy consumption. In this study, it is assumed that half of the braking energy is captured through the implementation of ERS.
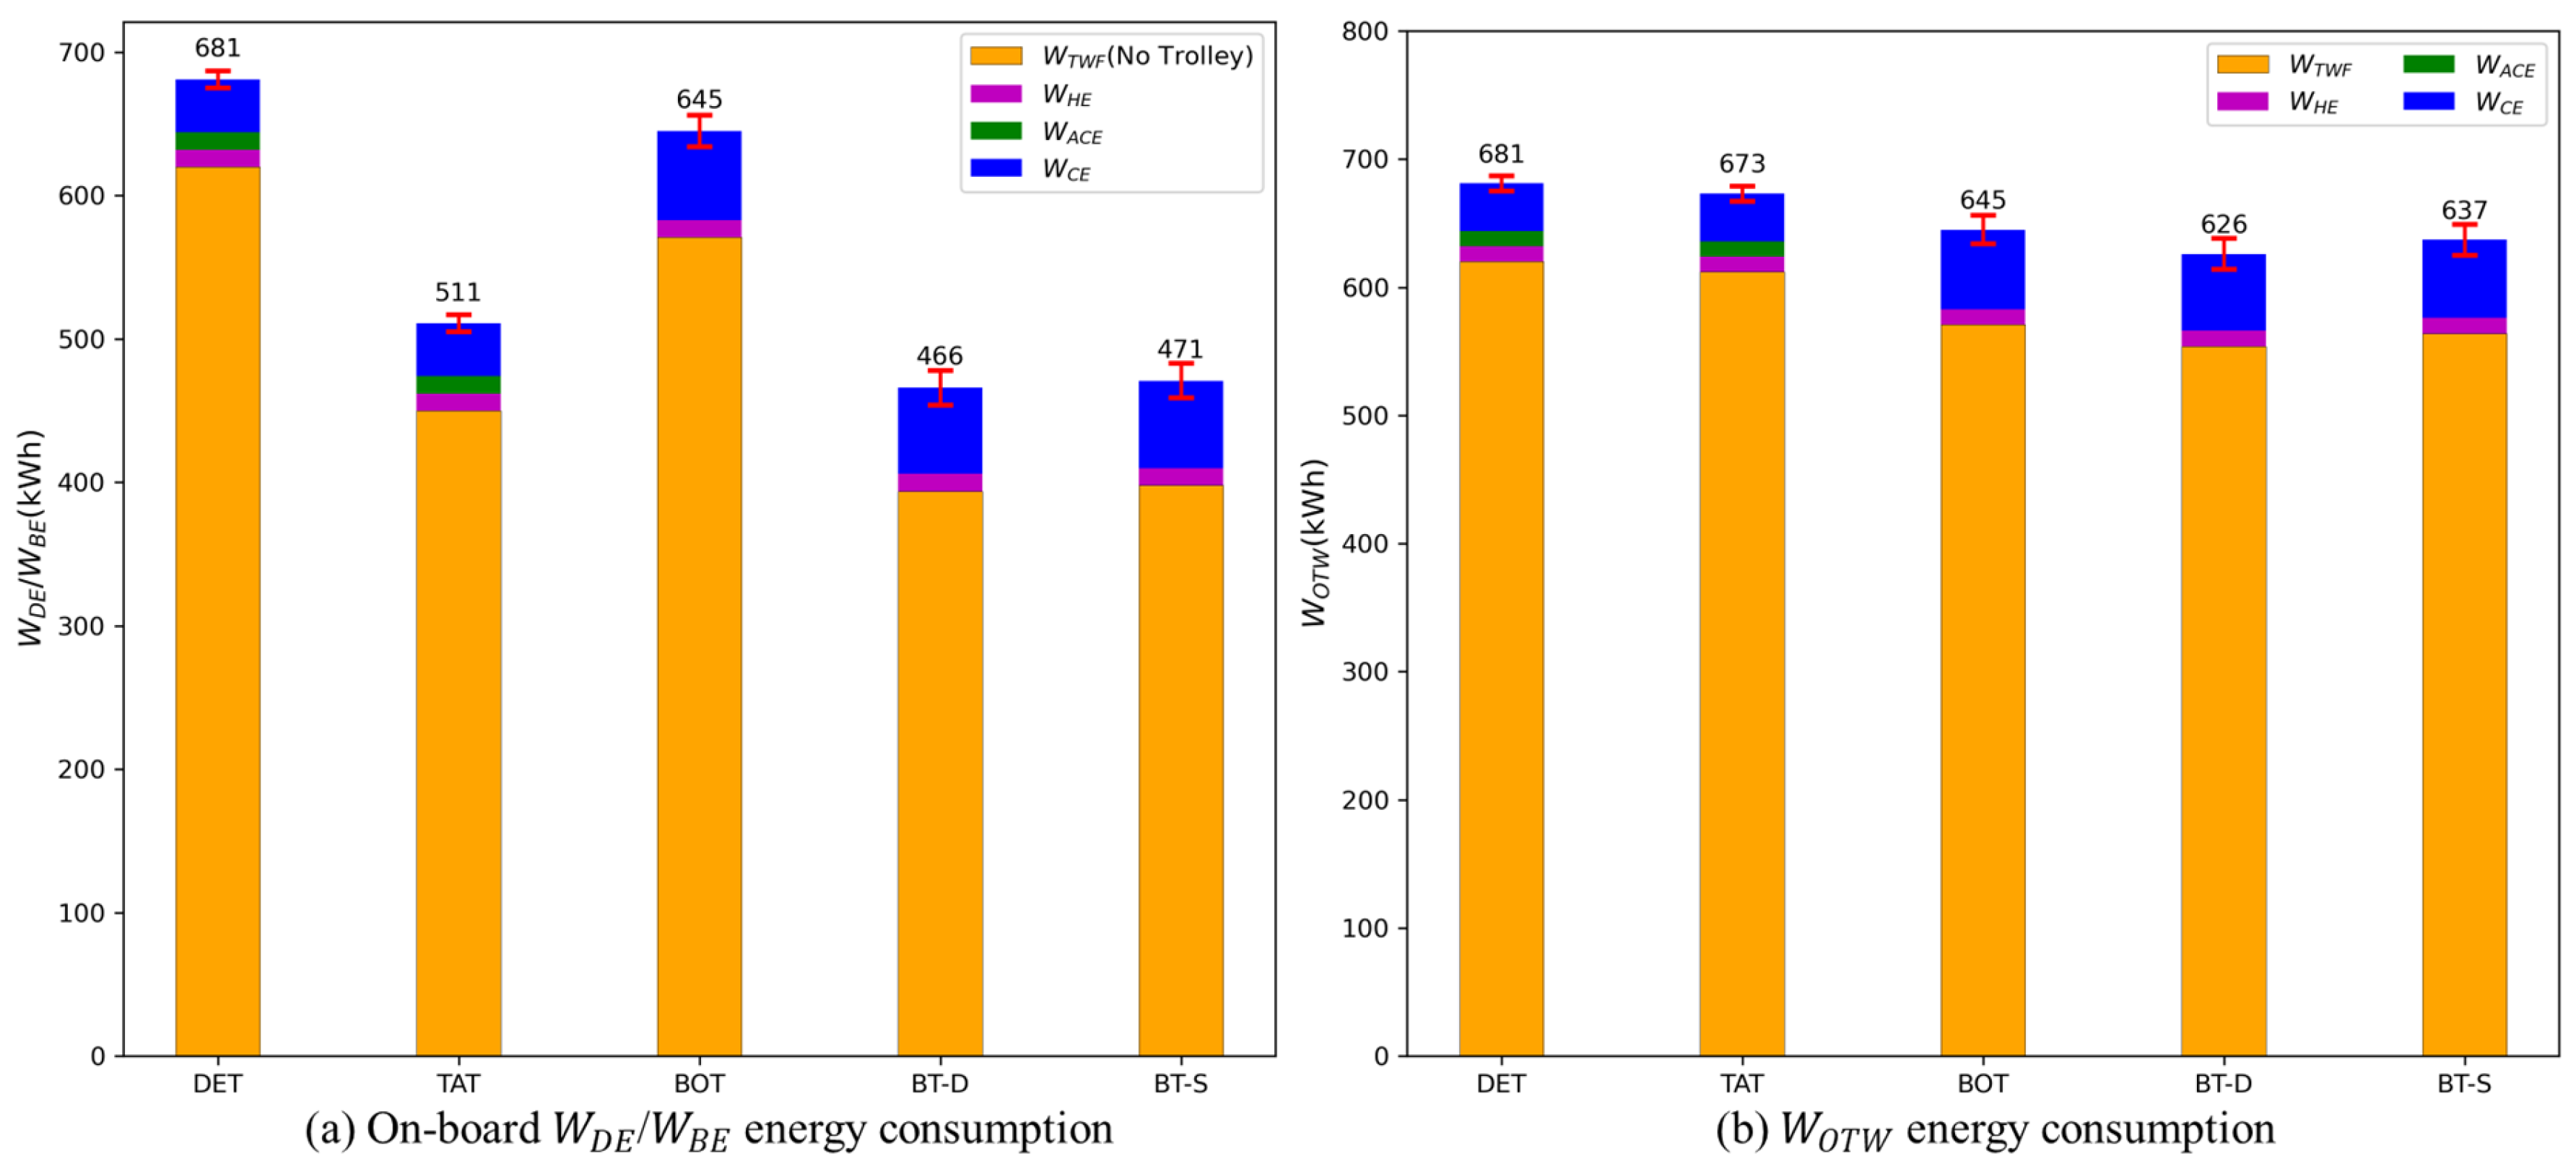
The primary contributors to energy consumption, including total work of force () and auxiliary energy (), are the on-board energy sources such as the diesel tank and battery packages. Figure 10a illustrates the components of on-board energy consumption, including diesel energy () and battery energy (). Trolley power proves effective in reducing the amount of on-board energy that needs to be carried. Although hydraulic energy (), air conditioner energy (), and cooling energy () constitute small portions of the total energy consumption, they still consume a significant amount of on-board energy, particularly in battery applications. In Figure 10b, the overall total energy () consumption for each application is presented. The results indicate that manual diesel-electric trucks have the highest energy consumption (681 kW/h), while automatic battery trolley dynamic trucks have the lowest energy consumption (626 kW/h). According to this study, the total energy gap between the different alternatives is less than 7%. However, if the study considers a higher proportion of trolley ramps and incorporates the impact of battery size and engine specifications, the gap between diesel trucks and battery alternatives may widen.
5. Battery Size Design and Comparison
5.1. Battery Material Selection
Lithium-Ion Batteries (LIBs) have become the dominant choice for various energy storage applications, primarily due to their longer lifespan and higher energy density compared to other battery types [4]. Among the different types of LIBs, LFP has gained widespread adoption in heavy-duty transportation, including MHT. This is because LFP offers advantages such as lower cost, lower toxicity, well-established performance characteristics, excellent long-term stability, and suitability for a wider range of temperature variations. Given the heavy usage of MHT, the cycle life-span (the number of cycles until 80% of the initial capacity remains) becomes crucial in determining the frequency of battery replacements. Knibbe et al. [8] provided an explanation of the cycle life-spans of prevailing battery categories, including LFP, lithium nickel manganese cobalt oxide (NMC), lithium nickel cobalt aluminium oxide (NCA), and LTO (Figure 11). The expected cycle life-spans of NMC and NCA chemistries (shown in green and pink, respectively) are relatively low compared to LFP (shown in yellow). While LFP offers a lower cycle lifespan than LTO (shown in blue), both LFP and LTO exhibit high cycle life-spans, reaching up to 4000 and 20,000 cycles, respectively, when operated at 25 °C and a moderate charge/discharge rate. However, LTO has drawbacks such as lower energy density and higher cost. Nonetheless, it demonstrates excellent performance in terms of efficiency, power (Max C-rate), and safety [8]. Given its superior cycle life-span, which can significantly reduce battery replacement costs associated with end-of-life, this study selects LTO as another research target for simulation.
5.2. Battery Package Design
Based on the characteristics of LFP and LTO batteries, along with the parameters of the selected battery packages, Table 2 presents the relevant details. The discharging range for these MHT applications is set to be between 20% and 95% to ensure battery health [28]. The estimated battery lifespan is based on the number of cycles required for the cell chemistries to reach 80% of their initial capacity, taking into account a battery life degradation of 20% [8]. Battery efficiency represents the overall efficiency from the tank to the end use, including both the tank-to-wheel and tank-to-auxiliary efficiencies. According to the findings of a previous study [12], the tank-to-wheel efficiency of a BEV is estimated to be around 68%, with a range spanning from 64.4% to 86%. The losses in efficiency can be attributed to factors such as powertrain friction and electrical resistance encountered during the transmission of electricity. The battery efficiency is assumed to be 80% in this study. The energy density of LFP is 150 Wh/kg, while that of LTO is 75 Wh/kg. Additionally, the cost of LFP is USD 240/kWh, while the cost of LTO is USD 750/kWh [8].
The battery package design allows for a 25% discharging range margin, 20% battery degradation loss over the life, and 20% battery efficiency loss, which typically account for 65% of the battery “nameplate” capacity. Note that the real usable capacity we can consume in normal MHT operation is merely 35% of the total capacity, as shown in Figure 12 [8].
5.3. Battery Size Design and Comparison
The reasonable battery mass (MB) of BOT, BT-D, and BT-S should be calculated based on the above parameters, which are on-board battery energy per cycle (WBE), cycle times per battery swapping (St), discharging range loss (LDR), battery degradation loss (LBD), battery efficiency loss (LBE), and battery energy density (DBE). Although BT-D has no need for swapping batteries, the St equals 2 for further calculation and comparison, which enables its battery to stay in shallow DOD for better battery health.
The battery size selection for battery alternatives can be executed using two methods: “tailored battery size selection” and “unified battery size selection”. In the tailored battery size selection method, each battery application (BOT, BT-D, and BT-S) is equipped with a dedicated battery mass that fulfills its minimum on-board energy requirement. This approach aims to minimize the battery mass while providing sufficient payload capacity. For the purposes of this study, we have assumed the same battery size for BT-D and BT-S applications, principally because of battery performance comparison and interoperability concerns related to operating a mixed fleet. In BT-D-only applications, the size of the battery could be further reduced to meet one cycle energy consumption. According to Equation (8), the calculated outcomes based on the tailored battery size selection method are presented in Table 3.
From the perspective of LFP, the BOT application requires a battery mass of 25 tonnes due to its higher on-board energy requirement. On the other hand, both BT-D and BT-S applications require 18 tonnes of battery mass due to the additional trolley power they utilize. However, when considering LTO batteries with lower energy density, all alternatives require larger battery masses compared to LFP. For LTO, the BOT, BT-D, and BT-S applications require battery masses of 50 tonnes, 36 tonnes, and 36 tonnes, respectively. In terms of initial battery capacity, it should be set at 95% of the total battery capacity. This results in initial battery capacities of 3563 kWh (95% of 3750 kWh) for LFP and 2565 kWh (95% of 2700 kWh) for LTO, as shown in Figure 13.
Note that SOC represents the level of charge of an electric battery relative to its capacity and is typically expressed as a percentage. However, in this study, the SOC is represented by the actual value in kWh instead of a percentage. After one cycle, the SOC values for BOT and BT-S are 2756 kWh and 1976 kWh, respectively. After two cycles, these values decrease to 1949 kWh and 1386 kWh, respectively. In the case of BT-D, the SOC behaves differently due to dynamic charging technology, which aims to keep the battery level within the discharging range (below 95% of the total battery capacity) to minimize power waste during trolley charging. According to Equation (9), the initial battery capacity of BT-D is set at 2284 kWh. After two rounds of dynamic charging, the SOC reaches the maximum level of 2565 kWh (95% of 2700 kWh). After one cycle, the SOC value of BT-D remains at 2284 kWh, and it remains the same even after two cycles.
where is battery initial capacity; is the dynamic charging trolley power in one cycle; is the on-board battery consumed energy until the truck disconnects trolley lines in the current haul cycle.
The unified battery size selection method refers to the approach where all battery applications (BOT, BT-D, and BT-S) are equipped with the same battery mass to fulfill the on-board energy requirement for all conditions. This method allows for flexible dispatching and scheduling of these battery alternatives, enabling the switching of the fleet they belong to in order to achieve higher productivity. Table 4 presents the calculated outcomes based on the unified battery size selection approach.
The larger battery sizes in the BT-D and BT-S configurations have several advantages. Firstly, they allow for more propulsion, resulting in lower energy consumption costs. Despite the higher capital costs and lower rated payload associated with larger batteries, the overall cost of energy consumption is reduced. Secondly, the ability to switch between BOT, BT-D, and BT-S based on mining production requirements and the fleet dispatching system is facilitated by the availability of larger batteries. This flexibility enables optimisation of the fleet and improves productivity. Furthermore, the battery packages used in BT-D and BT-S configurations primarily undergo shallow discharging cycles, which have a lesser impact on battery degradation compared to deep cycles. This characteristic helps preserve the overall health and performance of the battery over its lifespan. The initial battery capacities of BT-D and BT-S are set at 3563 kWh (95% of 3750 kWh), as shown in Figure 14. According to Equation (9), the initial battery capacity of BT-D is 3282 kWh. This will gradually decrease each cycle until, after two times of dynamic charging, the SOC will increase to the maximum level of 3563 kWh (95% of 3750 kWh).
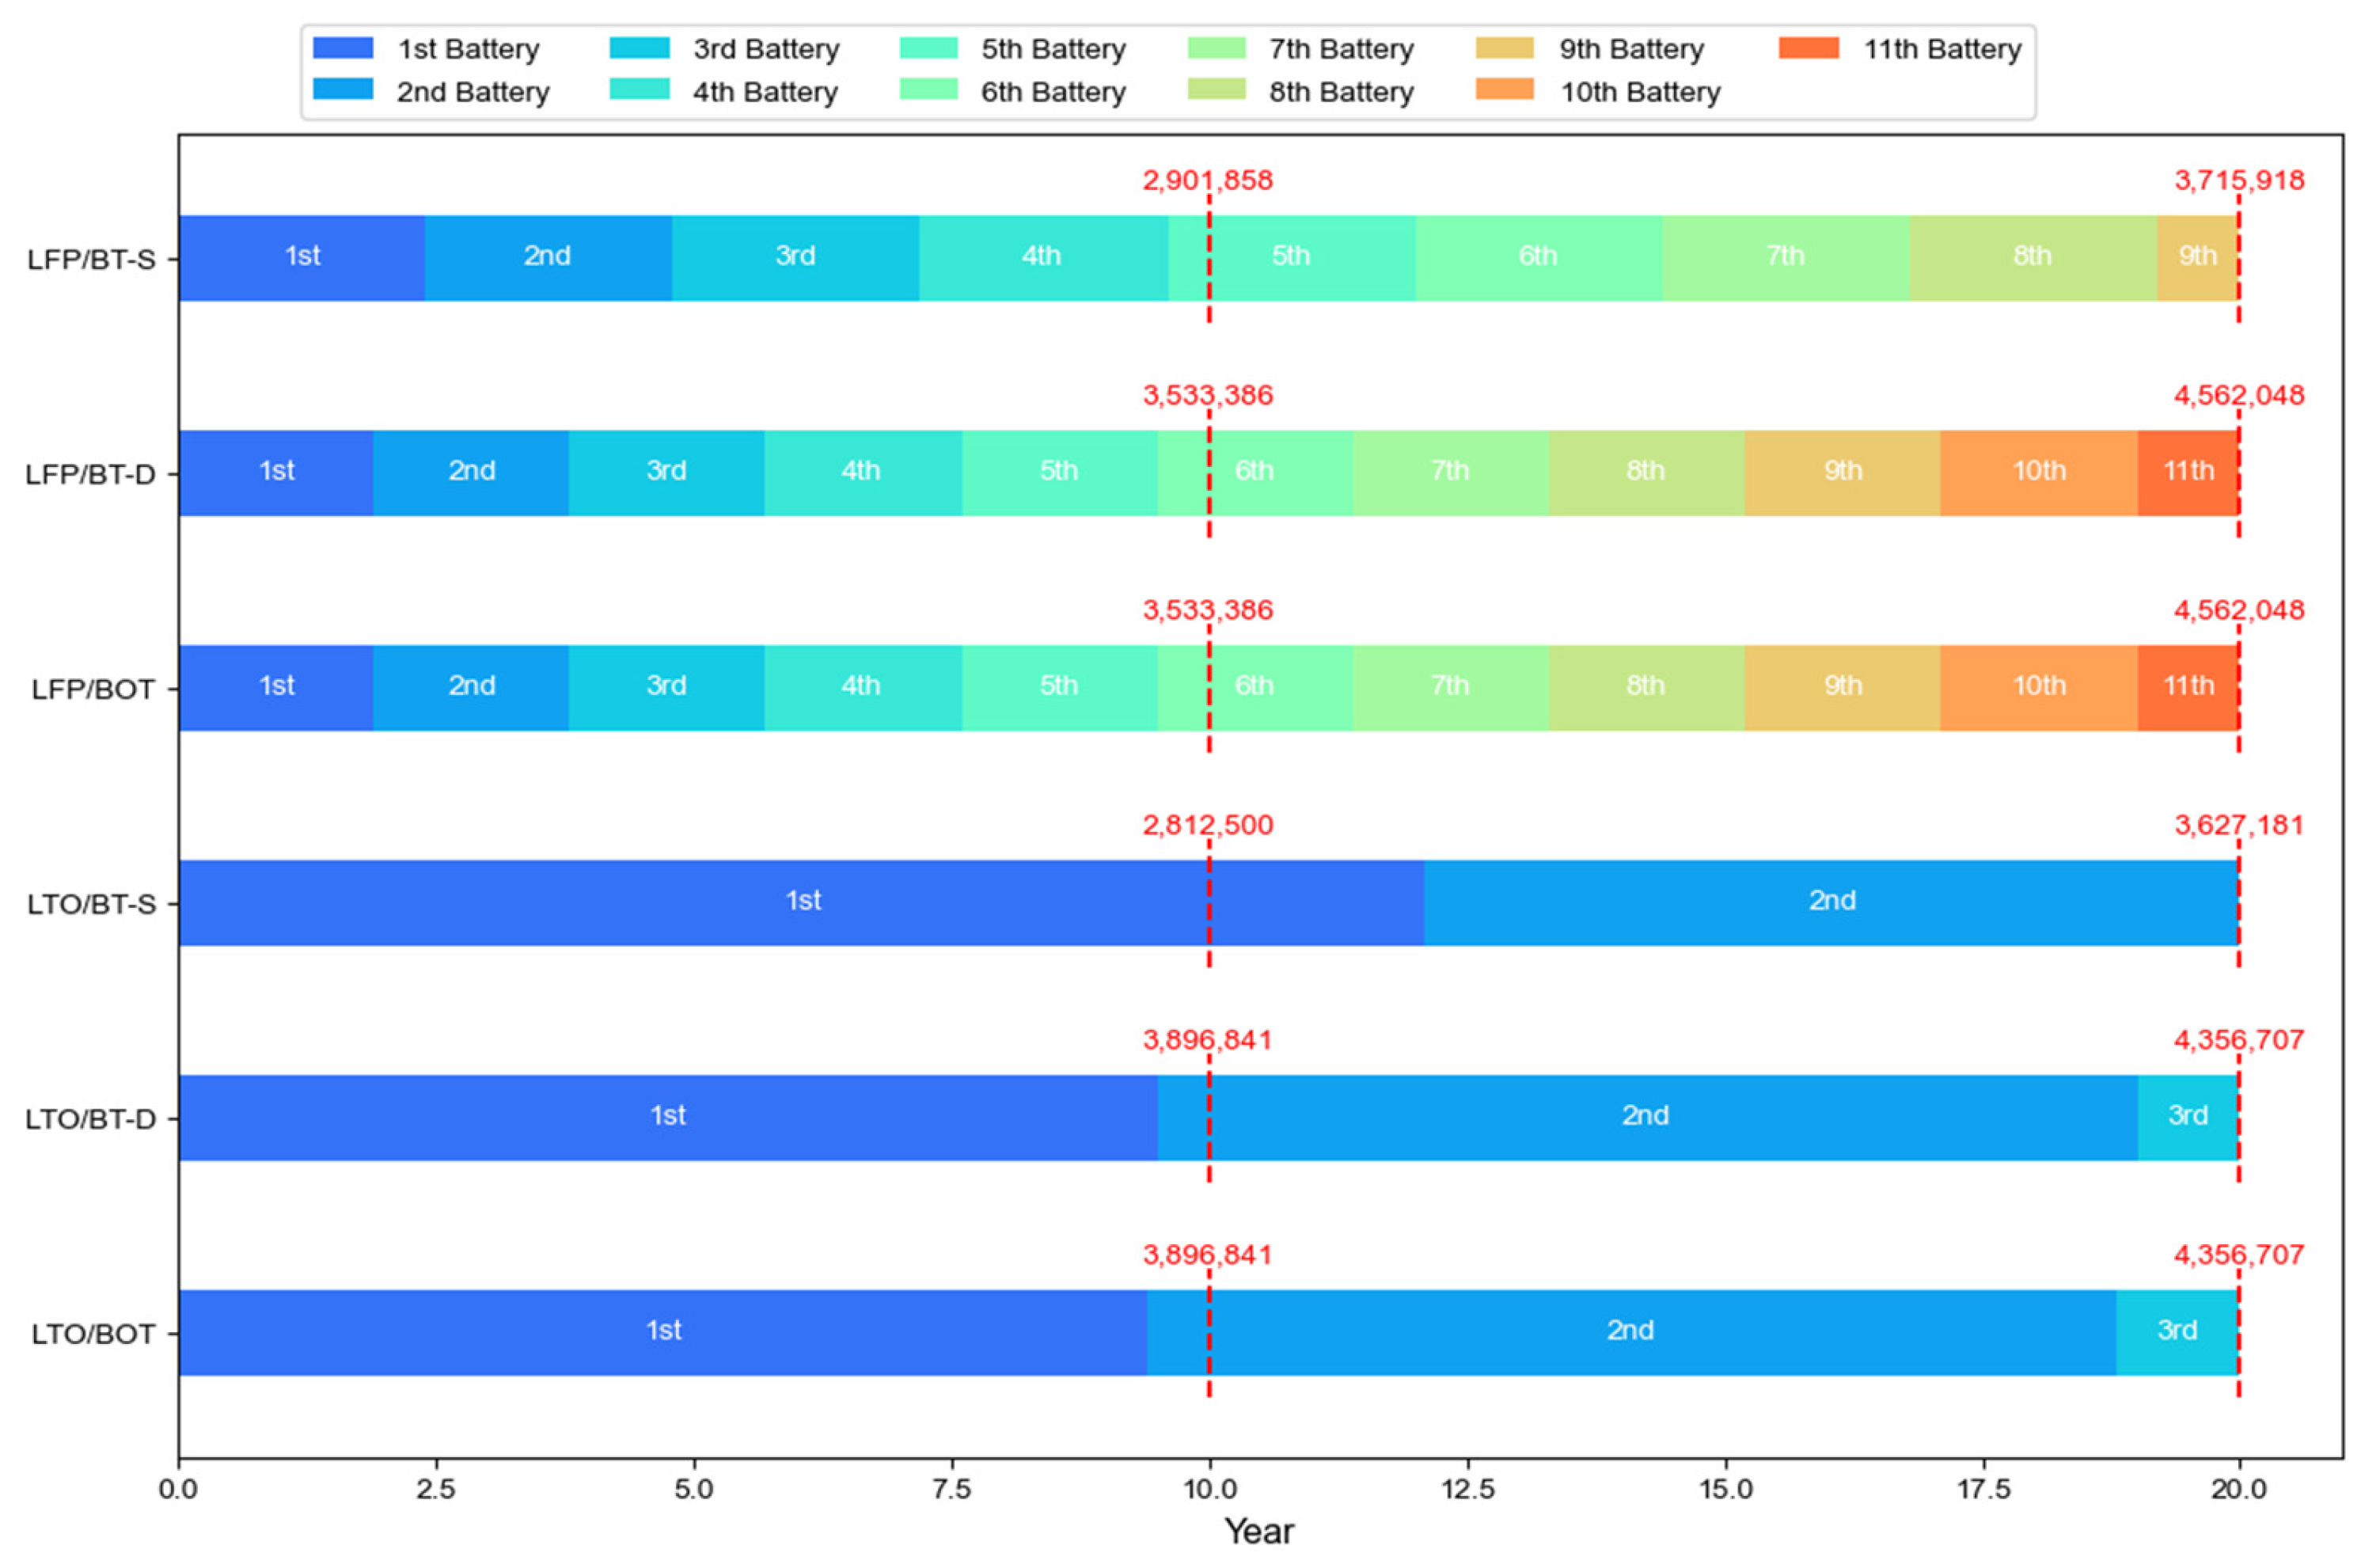
The operational expenses of a mining truck mainly consist of operator costs, tire costs, and diesel fuel costs. Among these, diesel fuel costs typically account for the largest portion of the overall operational expenditure [7]. However, with advancements in battery technology, the acquisition cost of a battery system has become a significant component of the expenses associated with battery powertrain alternatives. In this study, the NPV of costs for LFP and LTO battery systems over a typical 20-year life cycle of BOT, BT-D, and BT-S configurations was calculated using the energy consumption database. The costs considered only the combined battery packages required for each powertrain configuration. Other additional expenses, such as battery replacement at the end of their cycle life, were not included within the 20-year period. As shown in Figure 15, the resulting NPV of costs is as follows for the different applications: LFP/BT-S: USD 3.7 million; LFP/BT-D: USD 4.6 million; LFP/BOT: USD 4.6 million; LTO/BT-S: USD 3.6 million; LTO/BT-D: USD 4.4 million; LTO/BOT: USD 4.4 million.
In the given analysis, the LTO alternatives (LTO/BT-D and LTO/BOT) show lower NPV costs compared to their LFP counterparts over a 20-year period. This is because LTO batteries have a higher cycle lifespan and better durability, which results in fewer battery replacements and lower long-term costs. On the other hand, LFP/BT-S shows a lower NPV cost compared to LTO/BT-S because BT-S alternatives require fewer frequent battery replacements over the 20-year period, allowing the remaining battery life of LTO/BT-S to be utilized for an additional 5 years. If the additional cost of battery replacements were considered in the calculation, the NPV cost gap between LFP and LTO would widen further due to the more frequent battery replacements required by LFP alternatives.
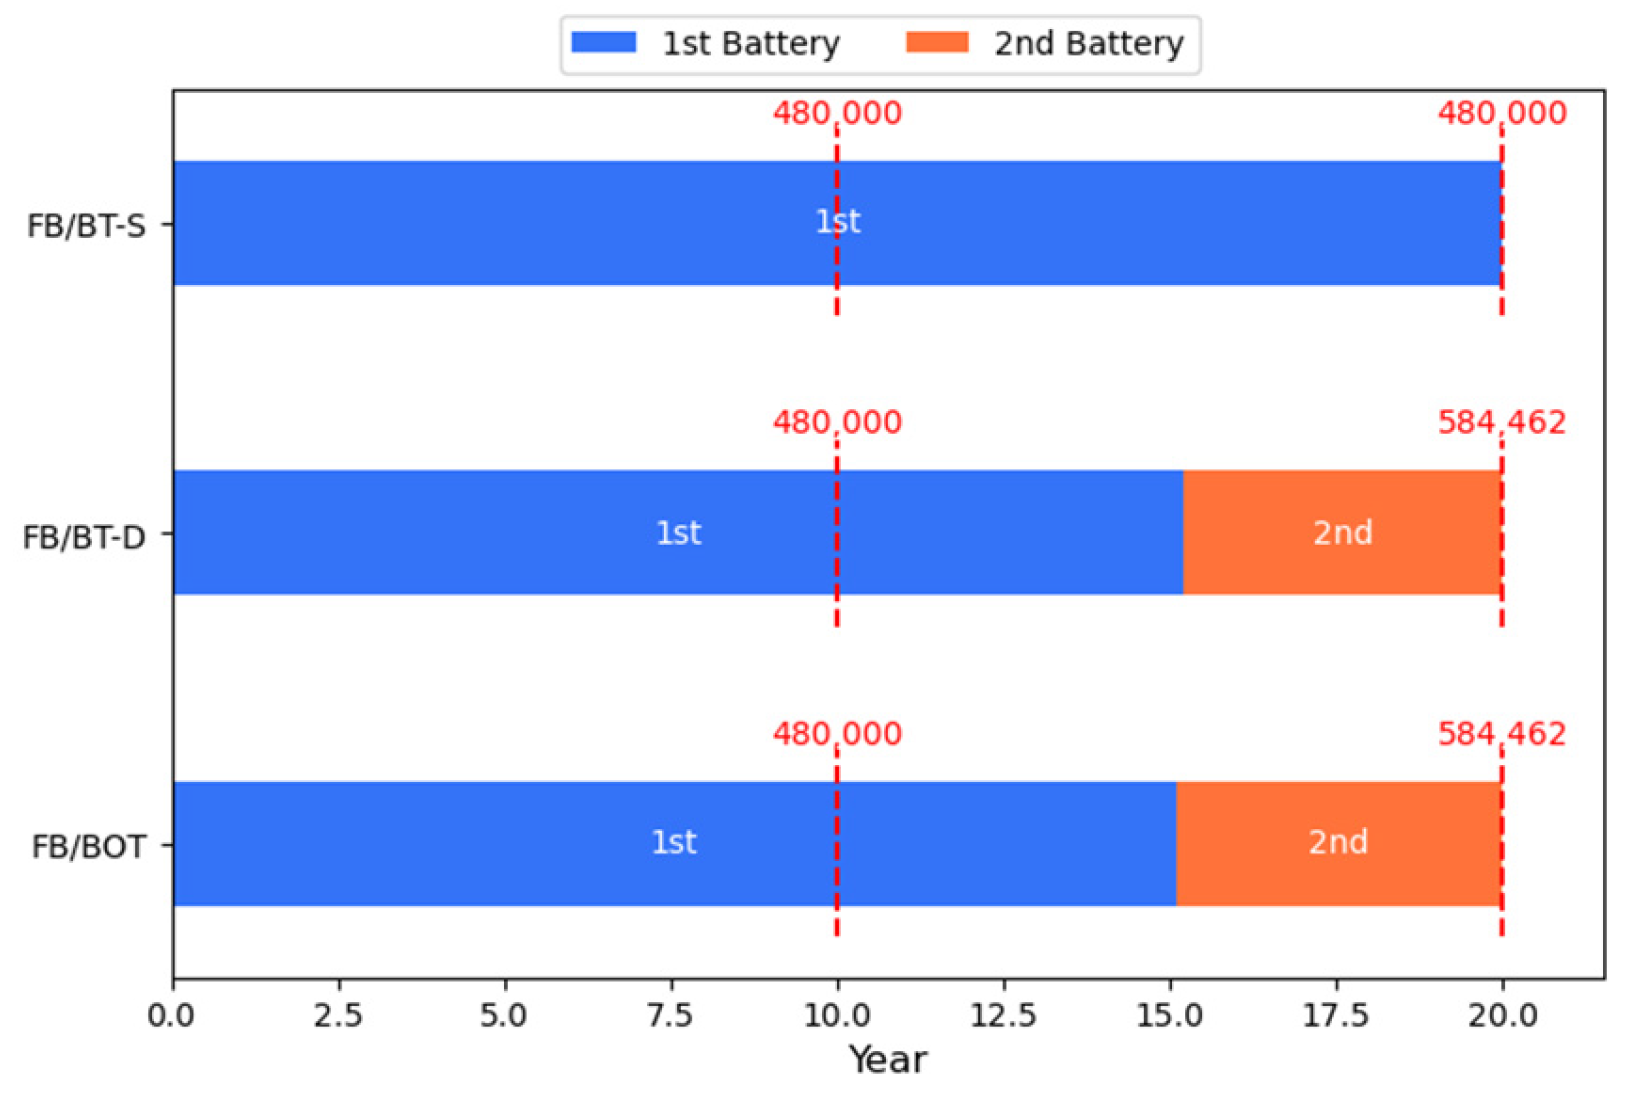
With the ongoing advancements in battery technology, batteries are becoming increasingly affordable while also improving in terms of life expectancy, energy density, and overall performance. This progress in battery technology highlights the need for regular updates to historical estimates of battery sizes and costs in different battery powertrain alternatives, as these estimates can quickly become outdated. As battery performance continues to evolve, it is crucial to consider the latest advancements and incorporate them into the analysis [8]. Figure 16 and Table 5 provide battery parameter values that are based on reasonable assumptions about future technological developments.
Figure 17 presents the NPV of battery costs based on future battery (FB) scenarios. The FB/BT-S application requires one battery package over a period of 20 years, with a total cost of USD 0.48 million. While the FB/BT-D and FB/BOT alternatives require two battery packages, with a total cost of USD 0.58 million.
6. Discussion
The selection of environmentally friendly powertrain solutions for MHT requires a different approach compared to on-road trucks. It is essential to carefully consider the specific operational profiles and requirements of MHT at individual mine sites when making decisions regarding new powertrain alternatives. In this study, a hypothetical haul road is simulated, and the energy consumption of various existing and emerging solutions for MHT is analysed. These solutions include diesel-electric, trolley assist, battery-electric, and battery trolley technologies. To conduct a more comprehensive energy analysis, a typical operation profile is collected, taking into account parameters such as truck speed, load state, road gradient, and elevation. This database enables a detailed assessment of energy consumption and performance for mining trucks. The energy consumption profiles of each application are presented based on force parameter analysis. Furthermore, the study explores the theory of battery size design, battery material selection, energy utilization of battery packages, and battery size selection methods, considering the current state of battery technology. Additionally, the battery SOC values and the NPV of costs are calculated based on both current and future battery developments.
The hypothetical haul road in this study represents a long-distance haul cycle commonly found in deep copper mines. However, it is important to note that haul road profiles can vary significantly depending on the material being mined. For example, in coal mines, haul roads are typically shorter and have less pronounced elevations. Therefore, when considering battery powertrain alternatives, the size of the battery needs to be tailored to the specific characteristics and requirements of the mine site. In addition to battery powertrains, the decision-maker in the mining industry must also consider the upfront capital and maintenance costs associated with trolley alternatives. Trolley operation can provide the advantage of higher gradients, up to 10%, which can effectively reduce haul ramp distance and minimize stripping workload. However, it is essential to evaluate the costs associated with installing and maintaining the trolley system. Furthermore, the cost of charging infrastructure represents a significant portion of the initial capital expenditure for BOT and BT-S applications. Therefore, when considering these alternatives, careful analysis of upfront capital costs, operating expenses, maintenance requirements, and trolley ramp designs should be conducted using appropriate mine planning and design methods. Practices regarding the servicing and maintenance of surface mining machines equipped with batteries can be inferred from current practices applied to underground battery electric vehicles. This analysis is crucial to ensuring that the selected applications are cost-effective and aligned with the specific needs of the mining operation.
The influence of weather conditions and ambient temperature has not been taken into account in this study. It is important to note that adverse weather conditions can significantly increase the rolling resistance coefficient, resulting in higher energy requirements for the trucks. Additionally, research on battery reliability and stability under different ambient temperatures is valuable for understanding the performance of battery-powered mining trucks. When operating in high-temperature mine sites, battery trucks face additional challenges such as increased cooling energy consumption and potential degradation of battery performance. This variation in ambient temperature can significantly affect auxiliary energy consumption, especially the cooling energy required for battery systems. The lower energy requirement of BT-D compared to BT-S is primarily due to the rolling resistance coefficient of 1.5 for trolley ramps, as well as the lower speed requirement, resulting in relatively less rimpull and drag energy consumption. It should be noted that the calculations for all alternatives assume a specific GVW. Furthermore, the differences in on-board battery size and powertrain specifications among the alternatives lead to variations in the gravitational potential energy required for each truck. This, in turn, affects the energy consumed during braking and the efficiency of energy recovery, which vary across different battery applications. To comprehensively assess the energy consumption and performance of battery-powered mining trucks, it is essential to consider factors such as weather conditions, ambient temperature, cooling energy requirements, and the specific characteristics of each powertrain configuration.
In battery package design, it is important to consider that only 35% of the total battery capacity is effectively utilised in battery application operation. Therefore, further research on battery degradation, efficiency, and DOD is crucial as battery alternatives are increasingly deployed at mine sites. These factors play a key role in accurately sizing the on-board battery packages for mining haul trucks. It is important to regularly update the estimations for battery sizes as battery technology and performance continue to evolve. The simulation in this study incorporates battery swapping every two cycles, with each swap taking approximately 20 min to complete, instead of relying solely on battery recharging. This approach accounts for the practical considerations of battery swapping as an alternative to recharging. Regarding the SOC simulation and battery size selection methods, because mining production cycles are different from battery performance cycles, this study chooses the loading point as the starting point when setting the SOC as the initial capacity level and the dumping point as the final reference for the SOC analysis based on the haul cycle simulation. However, it should be noted that the SOC should actually start at the battery station position, where the battery application swaps the battery when the battery package reaches the required initial battery capacity. From a practical perspective, a battery station is best suited for installation on the crest of the pit, where it can provide ample permanent space for building infrastructure and parking trucks in the surface mine. The specific timing for battery swapping, available time, and utilization time may vary depending on the system-level design and maintenance planning, which can be influenced by factors such as powertrain differences and the scheduling of maintenance activities. Surface mining operations involve multiple discrete processes, and the dispatching of the truck fleet has a significant impact on the performance and efficiency of battery-powered trucks. Optimizing mining productivity through the decarbonisation of the fleet system and considering battery sizing for battery alternatives at the system level is crucial for achieving the desired outcomes.
7. Conclusions
This paper has introduced battery MHT applications in mine sites, including truck performance associated with hypothetical road simulation, energy consumption based on force parameters, and battery size design according to current battery technology, which is used as a technical estimation to widely deploy battery alternatives. Conclusions are as follows:
- (1)
- Due to the TAT, BT-D, and BT-S configuration requirements, the haul road design should add a trolley ramp with a flat road for the accelerating truck to arrive at required the approach speed. The performance of each application is quite different: BT-S has the fastest speed (27 km/h) on the trolley ramp, while DET is the slowest (12 km/h) of the five applications. However, from the cycle time perspective, BOT needs the longest cycle time (2500 s), while its BT-D counterpart is only 1817 s due to the battery swapping operation for BOT.
- (2)
- Rolling resistance energy and gravitational potential energy are the biggest components in MHT energy consumption. Because the trolley application and ERS can effectively save energy for MHT alternatives, the total energy consumption of all applications is: DET—681 kWh; TAT—673 kWh; BOT—645 kWh; BT-S—637 kWh; BT-D—626 kWh. The on-board diesel or battery energy (excluding trolley power) required by these alternatives is DET—681 kWh; BOT—645 kWh; TAT—511 kWh; BT-S—471 kWh; BT-D—466 kWh, of which BT-D shows the best energy consumption performance.
- (3)
- This study selected LFP and LTO as battery sizing chemical materials due to their relatively higher cycle times, significantly longer life-spans, high energy density, and reliability in terms of efficiency, power, and safety. In regard to battery utilisation, battery package design shows only 35% of the battery “nameplate” capacity is real effective utilisation due to discharging range loss (25%), battery degradation loss (20%), and battery efficiency loss (20%). Based on tailored battery size selection, BOT, BT-D and BT-S need 25 tonnes, 18 tonnes and 18 tonnes LFP battery mass while they need 50 tonnes, 36 tonnes and 36 tonnes LTO battery mass respectively. After two haul cycle, the SOC of BOT, BT-D and BT-S is 1949 kWh, 2284 kWh and 1386 kWh, respectively. Based on unified battery size selection, BOT, BT-D, and BT-S need 25 t LFP battery mass, while they need 50 t LTO battery mass, respectively. After two haul cycles, the SOC of BOT, BT-D, and BT-S is 1949 kWh, 3282 kWh, and 2384 kWh. The resulting NPV of costs for different applications over 20 years is USD 3.7 M, USD 4.6 M, USD 4.6 M, USD 3.6 M, USD 4.4 M, and USD 4.4 M for LFP/BT-S, LFP/BT-D, LFP/BOT, LTO/BT-S, LTO/BT-D, and LTO/BOT, respectively. BT-S shows a significant advantage in on-board battery cost, taking into consideration an over hundred truck fleet in a big surface mine. The cost savings will be increased when the battery exchange expenditure is accounted.
A comprehensive techno-economic assessment was conducted to identify a feasible battery size in this study. In future research, it is recommended to develop a more accurate battery size model that considers additional factors specific to the unique conditions of mine sites. For instance, this study assumed favourable weather conditions with a constant temperature and typical long-distance haul roads in the battery sizing model. To further enhance research, utilizing real-world data to investigate actual route lengths and generate corresponding distributions would be beneficial. The decarbonisation of trucks should be evaluated on a case-by-case basis, as the risks and benefits will vary among different mines. With the industry’s growth and increasing decarbonisation efforts, advancements in renewable generation, battery technology, and alternative vehicles will make the business case for decarbonisation more compelling.
Author Contributions
Conceptualization, H.B. and P.K.; methodology, H.B. and P.K.; software, H.B.; validation, H.B. and P.K.; formal analysis, H.B. and P.K.; investigation, H.B. and P.K.; resources, H.B., P.K., M.K. and M.N.; data curation, H.B. and P.K.; writing—original draft preparation, H.B.; writing—review and editing, H.B., P.K., M.K. and M.N.; visualization, H.B.; supervision, P.K., M.K. and M.N.; project administration, H.B., P.K., M.K. and M.N. All authors have read and agreed to the published version of the manuscript.
Funding
This research received no external funding.
Data Availability Statement
The data presented in this study are available on request from the corresponding author.
Conflicts of Interest
The authors declare no conflict of interest.
Declaration
During the preparation of this work, the authors used ChatCPT-3.5 in order to edit English writing with better grammar and fluency. After using this tool, the authors reviewed and edited the content as needed and took full responsibility for the content of the publication.
Abbreviations
| AE | Auxiliary energy |
| ACE | Air conditioner energy |
| BOT | Battery-only truck |
| BT-D | Battery Trolley-dynamic |
| BT-S | Battery Trolley-stationary |
| BEVs | Battery electric vehicles |
| BT | Battery Trolley |
| BTT | Battery Trolley truck |
| BF | Braking force |
| BE | Battery energy |
| CO2 | Carbon dioxide |
| CE | Cooling energy |
| DET | Diesel-electric truck |
| DE | Diesel energy |
| DPM | Diesel particulate matter |
| DP | Dynamic programming |
| DF | Drag force |
| DOD | Depth-of-discharge |
| EMS | Energy management strategies |
| ESS | Energy storage system |
| ERS | Energy recovery system |
| FB | Future battery |
| GHG | Greenhouse gas |
| GVW | Gross vehicle weight |
| HDV | Heavy-duty vehicle |
| HE | Hydraulic energy |
| ICE | Internal combustion engine |
| LFP | LiFePO4 |
| LTO | Lithium titanium oxide |
| LIBs | Lithium-ion batteries |
| ML | Machine learning |
| MHT | Mining haulage truck |
| NPV | Net present value |
| RR | Rolling resistance |
| RF | Rimpull force |
| SIMS | Sustainable Intelligent Mining System |
| SOC | State of charging |
| SOH | State-of-health |
| TAT | Trolley Assist truck |
| TA | Trolley Assist |
| TWRI | Total work of the rimpull |
| TWD | Total work of drag |
| TWR | Total work of rolling resistance |
| TWG | Total work of gravity |
| TWF | Total work of force |
| OTW | Overall total energy |
| NMC | Lithium nickel manganese cobalt oxide |
| NCA | Lithium nickel cobalt aluminium oxide |
References
- Igogo, T.; Awuah-Offei, K.; Newman, A.; Lowder, T.; Engel-Cox, J. Integrating renewable energy into mining operations: Opportunities, challenges, and enabling approaches. Appl. Energy 2021, 300, 117375. [Google Scholar] [CrossRef]
- Feng, Y.; Liu, Q.; Li, Y.; Yang, J.; Dong, Z. Energy efficiency and CO2 emission comparison of alternative powertrain solutions for mining haul truck using integrated design and control optimization. J. Clean. Prod. 2022, 370, 133568. [Google Scholar] [CrossRef]
- Li, J.; Wu, X.; Xu, M.; Liu, Y. A real-time optimization energy management of range extended electric vehicles for battery lifetime and energy consumption. J. Power Sources 2021, 498, 229939. [Google Scholar] [CrossRef]
- Feng, Y.; Dong, Z. Optimal energy management with balanced fuel economy and battery life for large hybrid electric mining truck. J. Power Sources 2020, 454, 227948. [Google Scholar] [CrossRef]
- Kalantari, H.; Sasmito, A.P.; Ghoreishi-Madiseh, S.A. An overview of directions for decarbonization of energy systems in cold climate remote mines. Renew. Sustain. Energy Rev. 2021, 152, 111711. [Google Scholar] [CrossRef]
- Shi, S.; Zhang, H.; Yang, W.; Zhang, Q.; Wang, X. A life-cycle assessment of battery electric and internal combustion engine vehicles: A case in Hebei Province, China. J. Clean. Prod. 2019, 228, 606–618. [Google Scholar] [CrossRef]
- Feng, Y.; Dong, Z. Integrated design and control optimization of fuel cell hybrid mining truck with minimized lifecycle cost. Appl. Energy 2020, 270, 115164. [Google Scholar] [CrossRef]
- Knibbe, R.; Harding, D.; Cooper, E.; Burton, J.; Liu, S.; Amirzadeh, Z.; Buckley, R.; Meehan, P.A. Application and limitations of batteries and hydrogen in heavy haul rail using Australian case studies. J. Energy Storage 2022, 56, 105813. [Google Scholar] [CrossRef]
- Ritter, A.; Elbert, P.; Onder, C. Energy Saving Potential of a Battery-Assisted Fleet of Trolley Buses. IFAC-PapersOnLine 2016, 49, 377–384. [Google Scholar] [CrossRef]
- Ertugrul, N.; Kani, A.P.; Davies, M.; Sbarbaro, D.; Moran, L. Status of Mine Electrification and Future Potentials. In Proceedings of the 2020 International Conference on Smart Grids and Energy Systems (SGES), Perth, Australia, 23–26 November 2020; pp. 151–156. [Google Scholar] [CrossRef]
- Xie, S.; Zhang, Q.; Hu, X.; Liu, Y.; Lin, X. Battery sizing for plug-in hybrid electric buses considering variable route lengths. Energy 2021, 226, 120368. [Google Scholar] [CrossRef]
- Cunanan, C.; Tran, M.-K.; Lee, Y.; Kwok, S.; Leung, V.; Fowler, M. A Review of Heavy-Duty Vehicle Powertrain Technologies: Diesel Engine Vehicles, Battery Electric Vehicles, and Hydrogen Fuel Cell Electric Vehicles. Clean Technol. 2021, 3, 474–489. [Google Scholar] [CrossRef]
- Mareev, I.; Sauer, D. Energy Consumption and Life Cycle Costs of Overhead Catenary Heavy-Duty Trucks for Long-Haul Transportation. Energies 2018, 11, 3446. [Google Scholar] [CrossRef]
- Halim, A.; Lööw, J.; Johansson, J.; Gustafsson, J.; Van Wageningen, A.; Kocsis, K. Improvement of Working Conditions and Opinions of Mine Workers When Battery Electric Vehicles (BEVs) Are Used Instead of Diesel Machines—Results of Field Trial at the Kittilä Mine, Finland. Min. Metall. Explor. 2022, 39, 203–219. [Google Scholar] [CrossRef]
- Mazumdar, J. Performance improvement of mining haul trucks operating on trolley systems. In Proceedings of the 2011 IEEE Industry Applications Society Annual Meeting, Orlando, FL, USA, 9–13 October 2011; pp. 1–6. [Google Scholar] [CrossRef]
- Cruzat, J.V.; Valenzuela, M.A. Modeling and Evaluation of Benefits of Trolley Assist System for Mining Trucks. IEEE Trans. Ind. Appl. 2018, 54, 3971–3981. [Google Scholar] [CrossRef]
- Lindgren, L.; Grauers, A.; Ranggård, J.; Mäki, R. Drive-Cycle Simulations of Battery-Electric Large Haul Trucks for Open-Pit Mining with Electric Roads. Energies 2022, 15, 4871. [Google Scholar] [CrossRef]
- Wu, J.; Wei, Z.; Liu, K.; Quan, Z.; Li, Y. Battery-Involved Energy Management for Hybrid Electric Bus Based on Expert-Assistance Deep Deterministic Policy Gradient Algorithm. IEEE Trans. Veh. Technol. 2020, 69, 12786–12796. [Google Scholar] [CrossRef]
- Mareev, I.; Becker, J.; Sauer, D. Battery Dimensioning and Life Cycle Costs Analysis for a Heavy-Duty Truck Considering the Requirements of Long-Haul Transportation. Energies 2017, 11, 55. [Google Scholar] [CrossRef]
- Xie, S.; Hu, X.; Zhang, Q.; Lin, X.; Mu, B.; Ji, H. Aging-aware co-optimization of battery size, depth of discharge, and energy management for plug-in hybrid electric vehicles. J. Power Sources 2020, 450, 227638. [Google Scholar] [CrossRef]
- Terblanche, P.J.; Kearney, M.P.; Knights, P.F. Potential of on-board energy recovery systems to reduce the costs of diesel–electric mine truck haulage. Min. Technol. 2018, 127, 195–208. [Google Scholar] [CrossRef]
- Mazumdar, J. All electric operation of ultraclass mining haul trucks. In Proceedings of the 2013 IEEE Industry Applications Society Annual Meeting, Lake Buena Vista, FL, USA, 6–11 October 2013; pp. 1–5. [Google Scholar] [CrossRef]
- Bao, H.; Knights, P.; Kizil, M.; Nehring, M. Electrification Alternatives for Open Pit Mine Haulage. Mining 2023, 3, 1–25. [Google Scholar] [CrossRef]
- Marsden, O.W.; Marsden, J.O. Potential Pathways for Mining Operations to Transition to Renewable Energy—A Case Study. Min. Metall. Explor. 2021, 38, 1689–1699. [Google Scholar] [CrossRef]
- Bao, H.; Knights, P.; Kizil, M.; Nehring, M. Productivity estimation of battery trolley mining truck fleets. Int. J. Min. Reclam. Environ. 2023, 38, 144–166. [Google Scholar] [CrossRef]
- Power Sonic. Available online: https://www.power-sonic.com/blog/what-is-a-battery-c-rating/ (accessed on 1 October 2023).
- Awuah-Offei, K. (Ed.) Energy Efficiency in the Minerals Industry. In Green Energy and Technology; Springer International Publishing: Cham, Switzerland, 2018. [Google Scholar] [CrossRef]
- Moore, P. Surface Mining Trucks. Int. Min. 2022, 17, 50–67. [Google Scholar]
Figure 1.
Mining haul truck powertrain diagrams.

Figure 2.
Hypothetical mining haul road.

Figure 3.
Haul road profiles.

Figure 4.
Truck performance in one haul cycle.

Figure 5.
Truck cycle time for all applications.

Figure 6.
Force parameters of MHT [27].
Figure 6.
Force parameters of MHT [27].

Figure 7.
Energy consumption (kWh) heatmap.

Figure 8.
Energy consumption comparison of rimpull, drag, rolling resistance, and gravity.

Figure 9.
Energy consumption comparison of braking.

Figure 10.
Energy consumption comparison of / and .

Figure 11.
Battery lifespan (cycles) estimates for cell chemistries to reach 80% of initial capacity [8].
Figure 11.
Battery lifespan (cycles) estimates for cell chemistries to reach 80% of initial capacity [8].

Figure 12.
Battery total capacity design.

Figure 13.
Battery state of charging in tailored battery size selection.

Figure 14.
Battery state of charging in unified battery size selection.

Figure 15.
Battery NPV cost based on current LFP and LTO.

Figure 16.
Future battery development [8].
Figure 16.
Future battery development [8].

Figure 17.
Future battery NPV cost.


Table 1.
Truck operation parameters and outcomes.
| Parameters | DET | TAT | BOT | BT-D | BT-S |
|---|---|---|---|---|---|
| Minimum speed (km/h) | 12 | 12 | 15 | 15 | 15 |
| Maximum speed (km/h) | 30 | 30 | 30 | 30 | 30 |
| Haul ramp speed (km/h) | 12 [17] | 25 [16] | 15 [17] | 20 [17] | 27 [17] |
| Battery swapping time (s) | - | - | 600 | - | 600 |
| Cycle time (s) | 2204 | 1947 | 2500 | 1817 | 2342 |
Table 2.
Battery package parameters.
| Parameters | Values |
|---|---|
| Discharging range | 20–95% |
| Battery degradation | 20% |
| Battery efficiency | 80% |
| LFP energy density (Wh/kg) | 150 |
| LTO energy density (Wh/kg) | 75 |
| LFP cycle number | 4000 |
| LTO cycle number | 20,000 |
| LFP cost (USD/kWh) | 240 |
| LTO cost (USD/kWh) | 750 |
Table 3.
Tailored battery size selection.
| Applications | Rated LFP Mass (tonne) | Rated LTO Mass (tonne) | Rated on-Board Energy (kWh) |
|---|---|---|---|
| BOT | 25 | 50 | 3750 |
| BT-D | 18 | 36 | 2700 |
| BT-S | 18 | 36 | 2700 |
Table 4.
Unified battery size selection.
| Applications | Rated LFP Mass (tonne) | Rated LTO Mass (tonne) | Rated on-Board Energy (kWh) |
|---|---|---|---|
| BOT | 32 | 50 | 3750 |
| BT-D | 32 | 50 | 3750 |
| BT-S | 32 | 50 | 3750 |
Table 5.
Future battery parameters.
| Parameter | Value |
|---|---|
| Battery energy density (Wh/kg) | 500 |
| Battery cycle number | 30,000 |
| Battery cost (USD/kWh) | 120 |
Disclaimer/Publisher’s Note: The statements, opinions and data contained in all publications are solely those of the individual author(s) and contributor(s) and not of MDPI and/or the editor(s). MDPI and/or the editor(s) disclaim responsibility for any injury to people or property resulting from any ideas, methods, instructions or products referred to in the content. |
© 2024 by the authors. Licensee MDPI, Basel, Switzerland. This article is an open access article distributed under the terms and conditions of the Creative Commons Attribution (CC BY) license (https://creativecommons.org/licenses/by/4.0/).
Share and Cite
MDPI and ACS Style
Bao, H.; Knights, P.; Kizil, M.; Nehring, M. Energy Consumption and Battery Size of Battery Trolley Electric Trucks in Surface Mines. Energies 2024, 17, 1494. https://doi.org/10.3390/en17061494
AMA Style
Bao H, Knights P, Kizil M, Nehring M. Energy Consumption and Battery Size of Battery Trolley Electric Trucks in Surface Mines. Energies. 2024; 17(6):1494. https://doi.org/10.3390/en17061494
Chicago/Turabian StyleBao, Haiming, Peter Knights, Mehmet Kizil, and Micah Nehring. 2024. "Energy Consumption and Battery Size of Battery Trolley Electric Trucks in Surface Mines" Energies 17, no. 6: 1494. https://doi.org/10.3390/en17061494
Note that from the first issue of 2016, this journal uses article numbers instead of page numbers. See further details here.