
Thermal Management for a Stadium Power Supply Container Using a Rack-Level Air Cooling Strategy

1
Center of Physical Education, Xi’an Jiaotong University, Xi’an 710049, China
2
Key Laboratory of Thermo-Fluid Science and Engineering, MOE, School of Energy and Power Engineering, Xi’an Jiaotong University, Xi’an 710049, China
*
Author to whom correspondence should be addressed.
Energies 2024, 17(7), 1654; https://doi.org/10.3390/en17071654
Submission received: 20 February 2024
/
Revised: 20 March 2024
/
Accepted: 23 March 2024
/
Published: 29 March 2024
(This article belongs to the Special Issue Intelligent Phase Change Control and Thermal Management for Energy Applications)
Abstract
:This study investigates the airflow and thermal management of a compact electric energy storage system by using computational fluid dynamic (CFD) simulation. A porous medium model for predicting the flow resistance performance of the battery modules in a battery cabinet is developed. By studying the influence of rack shapes, the effects of heat exchanger arrangements and other parameters on the airflow and battery thermal distribution are analyzed. When applying a larger bottom air channel, the inlet flow uniformity of each battery cabin in the cabinet increases by 5%. Meanwhile, temperature standard deviation decreases by 0.18 while raising the flow rate from 3 m/s to 8 m/s, indicating better temperature uniformity in the battery cabin. When the charge–discharge ratio reaches 0.5 C, the temperature deviation of the entire cabinet significantly increases, reaching 8 K. Furthermore, a rack-level thermal management scheme is proposed to effectively reduce the thermal deviation of the container electric energy storage system and improve the overall temperature uniformity. Results reveal that the rack-level thermal management of the wavy cabinet in the electric storage container can effectively improve the thermal uniformity of the distributed battery cabin, and the overall thermal deviation is controlled within 1.0 K.
1. Introduction
In sports stadiums or large event venues, power supply and corresponding network configurations are critical [1]. The quality and capability should be guaranteed to provide lighting, audio-visual systems, media coverage, security systems, etc., especially in serious situations [2]. A stadium power supply container is an enclosure designed to house electric energy storage carriers (battery packs) and other electrical devices, which can provide sufficient power supply related equipment. An energy storage system within a container, utilizing batteries to store and release electricity, can fulfill the demand-side response, promoting the use of renewable energy resources such as solar and wind [3]. The battery is the most crucial component in the energy storage system, and it continues to convert energy during the charging and discharging process [4]. Figure 1 illustrates a typical stadium power supply electric container, which incorporates 192 batteries with over 800 kWh of electric energy.
Ensuring the battery remains in optimal performance and extending its lifespan is crucial to improving the cost-effectiveness of the entire energy storage system [5]. During the charge and discharge process, the continuous release of chemical reaction heat and the production of resistance heat inside the battery can lead to elevated and uneven temperatures within the battery and its connections [6]. Typically, the loading density of batteries inside the storage tank is high, and temperature deviations can not only impact the charging and discharging processes but also result in unbalanced performance among individual batteries, thereby affecting the overall efficiency of the battery compartment [7]. This can potentially lead to uncontrolled temperature, internal leakage, combustion, and even explosions [8]. Therefore, it is essential to investigate thermal management technology for container electric energy storage systems with high efficiency and reliability [9].
The container energy storage system is currently undergoing a new stage of development, and there is limited research on its thermal management [10]. In practical applications, the battery module stack inside the container energy storage system shares a high degree of similarity with the structure of a data center. Drawing inspiration from the thermal management scheme of data centers, Lin et al. [11] optimized the internal layout of the container energy storage system, effectively addressing the air bypass issue and enhancing temperature uniformity. Currently, a well-established thermal management method for such a stacked structure involves utilizing a centralized air-cooling system. In this system, the cabinet and the air conditioning system are connected by the upper air duct, allowing cold air to reach both sides of the battery cabin through the air duct for internal battery cooling. The hot air generated during operation is expelled by a fan located at the front side of the battery cabin. By simulating various air supply modes, Schmidt et al. [12] discovered that under-floor air supply could yield lower inlet temperatures for components located at higher positions, while air supply from the ceiling provided lower inlet temperatures for lower components. The raised floor design accentuates the temperature difference between the inside and outside frames. Nada et al. [13,14] conducted additional research on floor air supply, simulating the effects of different plenum depths, floor opening rates, and air conditioner placements on cooling efficiency. The simulation revealed that increasing plenum depth could enhance air flow uniformity in data centers but might also lead to increased hot air recirculation and cold air bypass, impacting the overall cooling effectiveness. Arghode et al. [15] noted that passive air supply with a fixed floor entrance channel was not conducive to cold air supply. In comparison to passive air supply, active air supply reduces the pressure difference between the plenum and the room, thereby reducing leakage loss.
However, the centralized air-cooling system based on cabinet distribution has disadvantages, such as a long air supply distance, significant impact on air flow, and complex air duct design. Sahini et al. [16] conducted a comparison of energy consumption between long-distance air-cooling and short-distance air-cooling designs with the same channel size. In simulations, they found that the energy consumption of the long-distance air-cooling system was three times that of the short-distance air-cooling system when the intake air temperature of the cabinet was the same. Consequently, many scholars began considering shortening the cooling distance and adopting the rack-level thermal management method with the battery module as the unit. Fakhim et al. [17] adjusted the server spacing and layout inside the cabinet, simulating and comparing the temperature distribution at the inlet and outlet of 11 cabinet layout schemes to analyze their thermal performance. The simulation revealed that the server’s location affected the outlet temperature, and the rack model with two servers and two gaps exhibited the best thermal performance. On the other hand, excessive heat can degrade components, reduce efficiency, and even lead to system failure. Several strategies are commonly employed in thermal management, such as heat sinks [18], heat exchangers [19], heat pipes [20,21], thermal interface materials [22,23], PCM materials [24,25], intelligent control algorithms [26], etc., involving a combination of active and passive cooling techniques.
As mentioned, previous studies focused on air flow management and thermal control uniformity in data center cooling [27,28]. Some studies report that the thermal behaviors in power supply containers differ significantly from those in data centers due to the differences in size, heat flux, and compactness of battery stacks. Meanwhile, the large-space air-cooling thermal management strategy is commonly applied due to characteristics of low cost and feasible arrangement. This paper simplifies the model of the battery cabin. It proposes a simplified porous media model based on battery arrangement, effectively reducing the complexity of modeling the packaged energy storage system. Through the creation of cabinet air duct models of various sizes, this paper simulates different inlet air temperatures and battery load conditions. Following a comparative analysis, it suggests a cabinet air duct structure to minimize thermal deviation. By enhancing the appearance of the closed cabinet and adjusting the heat exchanger’s position, this paper identifies the most suitable layout scheme for short-distance rack-level thermal management, aiming to achieve uniform flow distribution inside the cabinet.
2. Numerical Model and Validation
2.1. Porous Media Model of Batteries Cabin
In the battery energy storage system, batteries are systematically arranged within the battery cabin, creating an airflow gap between them. The battery cabin is assumed as a porous media structure with the batteries serving as the skeleton. Therefore, the porous media model can be employed for simplified processing, aiding in the reduction of grid node numbers and conserving computing resources.
The porous media model in the commercial software ANSYS Fluent (version 2021R1) is constructed based on the pressure loss experienced by the fluid flowing through the porous media. In contrast to the flow through an unimpeded channel, the fluid encounters additional resistance as it passes through the porous media region. Consequently, the porous media region can be treated as a fluid area with supplementary resistance, and this additional resistance serves as the source term in the momentum equation, as illustrated in Equation (1).
where Si is the momentum source term in the i direction; D and C are the matrixes representing the resistance coefficients; μ is the dynamic viscosity of the fluid; ρ is the density of the fluid.
For uniform porous media, the formula can be further simplified as follows:
where a is permeability; C2 is inertial resistance coefficient.
The resistance source term acts on the fluid, causing it to change in pressure. Therefore, the relationship between pressure drop and resistance source term can be expressed as follows:
where Δn is the thickness of the porous media region.
In the porous media model, the pressure drop can also be expressed as Equation (4) according to Darcy’s law.
where ν is the velocity of the liquid. Therefore, the inertial resistance coefficient and the viscous resistance coefficient can be expressed as follows:
It can be observed from the above formulas that the accuracy of the porous media assumption’s calculation depends on whether its resistance coefficient accurately reflects the flow resistance characteristics within the real battery pack model. The standard k-ε model is adopted to simulate turbulent flow, while the SIMPLE method is used for velocity–pressure coupling. The second-order upwind scheme is applied for the discretization of Continuity, Momentum, and Energy equations. The iterative process depicted in Figure 2 is utilized to establish the relationship between the resistance coefficient of the simplified porous media model and the structural parameters. The basic process is outlined as follows: Initially, an orthogonal experimental table is designed based on the battery pack’s structural dimensions using the Taguchi algorithm, with the number of cell rows and spacing inside the battery pack being the key variables. Subsequently, by creating a numerical calculation model of the actual structural battery cabin, the corresponding relationship between the flow rate and pressure drop under various structural forms is determined, and the resistance coefficients C2 and D for the corresponding structures are obtained through fitting. Following this, an empty battery cabin with the same dimensions as the battery cabin model, but lacking internal batteries, is designated as the porous zone. The resistance coefficient is then substituted to conduct simulation calculations, outputting pressure drops and comparing the consistency of the results between the porous media model and the real structural model. Figure 2 also compares the pressure drop obtained from the real battery pack model (ΔP) and the porous media model (ΔPporous). Note that the average and maximal deviation reaches 6.9% and 9.4%, respectively, indicating reasonable structural simplification.
Figure 3 depicts the dimensions of the lithium iron phosphate battery, measuring 72 mm × 175 mm × 218 mm. A total of 14 batteries, 7 on each side, are loaded into the battery cabin. Cold air inlets are situated on both the left and right sides of the battery cabin, while hot air is expelled from the front fan of the battery cabin. Since the non-homogeneous structures of exact battery packs are used in practical applications, batteries are regarded as blocks with an extremely high flow resistance along the battery thickness direction in the porous model. Meanwhile, the flow across batteries is alternatively located. However, in the porous model, the flow along the battery length direction is regarded as uniform flow in a pack.
For the mentioned battery pack type, the four parameters, namely column spacing (Lx), row spacing (Ly), column number (Nx), and row number (Ny), comprehensively characterize its structure. When creating the orthogonal test table for the real model, these four parameters should be organized and combined as variables. The variable ranges in this paper are presented in Table 1.
It is assumed that the resistance coefficient of porous media has the following relationship with the battery pack structure:
Considering that the airflow is influenced by the actual battery in both the X and Y directions, and the corresponding porous media region generates resistance source terms in both directions, it is essential to determine the pressure drop in both directions within the actual battery cabin. This allows for the calculation of resistance coefficients in both the X and Y directions, which are then substituted into the corresponding porous media model for simulation. The pressure drops from both models are compared and analyzed, leading to the correction of the resistance coefficients in the porous medium model. When the pressure drop error is less than 10%, it can be concluded that the porous media model aligns with the actual model, indicating successful correction of the resistance coefficients.
To ensure the validity of the results, the failure data in the simulation results are excluded, and a regression statistical analysis is conducted. The correlation expression for the resistance coefficient in the X direction is described as follows:
while the correlation expression for the resistance coefficient in the Y direction is described in Equations (11) and (12):
It should be noted that the correlation has certain limitations, and it currently applies only to the battery cabin model with 2–4 columns and 2–4 rows of batteries distributed inside the battery cabin, and the aspect ratio of the battery cabin is less than 1/2.
2.2. Air Cooling Model of Power Supply Container
The simplified model of the battery cabin module using the aforementioned porous medium can significantly enhance simulation efficiency. Building upon this, this paper models and simulates two typical thermal management modes: centralized air cooling and closed cabinet air cooling.
- (1)
- Centralized air-cooling model
Figure 4 illustrates the centralized air-cooling model. For top air supply, the most commonly used cooling method, a single cabinet model is selected, as shown in the figure below. In this model, the size of the cold air inlet channel at the top remains unchanged, while the size of the air channel at the bottom of the cabinet is altered to examine the impact of changes in the air supply channel inside the cabinet on the temperature distribution of the battery pack. Simultaneously, this paper investigates the temperature distribution inside the cabinet under different inlet air speeds and battery load conditions.
- (2)
- Closed cabinet air cooling model
Differing from centralized air cooling, the closed cabinet no longer features air ducts for cold air transportation. Instead, a heat exchanger is installed inside the cabinet to achieve the cooling effect. In this thermal management mode, each cabinet independently controls temperature and air flow to achieve localized cooling, effectively reducing thermal deviation between cabinets and mitigating the impact of out-of-control battery temperatures. Figure 5 illustrates a typical closed cabinet thermal management structure model. Due to the significant size difference in the flow regions of cabins and manifolds, the porous model is employed, considering the small mesh grid sizes in the battery cabin to enhance computational efficiency. The heat exchanger is positioned inside the cabinet, and the air cooled within the heat exchanger is directed to each battery cabin to absorb heat and regulate the battery surface temperature. Subsequently, the hot air is expelled by the battery cabin fan to return to the heat exchanger, with the cold and hot channels separated by the cabinet partition. Unlike the centralized air-cooling method, the closed cabinet’s airflow direction is largely determined by the flexible position of the heat exchanger. The maximum temperature is regarded as the criterion for mesh-independent study. Note that the temperature remains unchanged when the mesh node number reaches 900 k. Compared to the result with the most intensive mesh system, the discrepancy is less than 1.0%, indicating good mesh quality.
2.3. Numerical Model Validation
Note that due the limited number of experiments and numerical simulation studies on electric storage containers at present, this paper references the experimental data from Chu’s article [27] to validate the reliability and effectiveness of the modeling and simulation method. The standard 42 U test cabinet depicted in Figure 6 consists of five layers of cabin bodies. Each cabin body contains five heaters with a power of 1.5 kW, simulating the thermal behavior of data center servers. Fans are arranged on the back to cool the heaters through air absorption. The experiment was conducted in a constant temperature room, with the cabinet entrance temperature set at 295.15 K. The air volume of the single-layer cabin was measured using a hot-wire anemometer, and the air outlet temperature of the single-layer cabin was measured using an array of thermocouples.
The corresponding simulation model is developed based on the experimental cabinet structure size and boundary conditions. The simulated data are then compared with the experimental data, as illustrated in Figure 7. It can be observed that the error between the model analysis results and test data is within the range of 10%. This suggests that the model’s accuracy is sufficient to meet the requirements of engineering design and optimization.
3. Results and Discussion
3.1. Centralized Air Cooling
- (1)
- Effect of vertical air supply channel structure
The width of the air inlet channel above the battery cabinet is maintained at 60 mm, and the impact of the air duct structure on the temperature of the battery cabin is investigated by adjusting the air duct at the bottom (w). The inlet flow rate of cold air at the upper part of the battery cabinet is set as 5 m/s; the temperature is 293.15 K. The same fan curve is employed at the outlet of the battery cabin. The charge and discharge ratio are assumed as 0.1 C for the battery packs, implying a fixed heat output at 690 W/m3.
The temperature field analysis focuses on the middle section of the battery cabin inside the battery cabinet. In Figure 8, the temperature cloud image of the section is displayed for the four air supply channel models. The figure illustrates a consistent temperature distribution trend within the sections of the four air channel models: the upper part of the cabinet has a relatively lower temperature in the battery cabin, and as the position of the battery cabin descends, the internal temperature gradually increases. This temperature distribution trend aligns with the collected data from the previous container energy storage system. Notably, for the battery cabin at the bottom of the cabinet, the model with w = 20 mm exhibits a higher average temperature, and the temperature distribution of the battery cabin at the bottom of the cabinet fluctuates significantly compared to other air channel models. This variation is attributed to changes in the cabinet structure, impacting the overall pressure field under the influence of the inlet air flow, which subsequently affects the air flow.
The temperature cloud map of the cabinet interior section visually represents the cooling effect of cold air, but it does not allow for a quantitative comparison of the performance of the four air channel models. The use of FUI enables the visual display of the deviation between the inlet flow of each battery cabin in the cabinet and the average flow rate. As depicted in Figure 9, the FUI distribution trend among the four air channel models is generally consistent. This implies that the inlet flow into the battery cabin at the upper and lower ends of the cabinet deviates significantly from the average inlet flow, highlighting the impact of the battery’s position within the cabinet on the distribution of inlet flow. As the width of the air channel at the bottom decreases, the pressure at the lower part increases, compelling the air to flow downward.
Although the FUI at the inlet of the battery cabin in the four air channel models exhibits a certain variation trend, when the width of the bottom air channel is 30 mm, the flow at the inlet of the battery cabin becomes more uniform. However, considering the gradual reduction of the inlet air area, the average cabinet temperature is not the lowest. Figure 10 depicts the temperature standard deviation of the four air channel models in four cases. It is evident that an appropriate reduction in the width of the air channel at the bottom may result in a certain inclination in temperature deviation. The cold air in the cabinet can be distributed more evenly, which is attributed to the larger airflow where the section is smaller. For air channels of the same size, as the cold air speed decreases along the flow direction, the share of cold air reaching the bottom battery cabin decreases. Appropriately reducing the size of the air channel promotes the flow of air in the internal air channel. Note that the temperature uniformity decreases when the air channel size is reduced, and the cabinet temperature standard deviation and temperature uniformity coefficient show similar trend. Compared with the normal air channel size, reducing the size of the bottom air channel to 1/3 increases the temperature standard deviation by about 8%. Therefore, blindly reducing the size of the air channel will not reduce the average temperature distribution inside the cabinet, and the most appropriate size for the bottom air channel is when it is 2/3 of the original.
- (2)
- Effect of air supply velocity
Maintaining the inlet cold air temperature constant and varying the air flow rate at 3 m/s, 5 m/s, and 8 m/s, respectively, the corresponding FUI values for the three different inlet velocities of cold air are depicted in Figure 11a. When the inlet velocity of cold air is set at 5 m/s and 8 m/s, the FUI distribution trend remains entirely consistent; however, when the inlet velocity is reduced to 3 m/s, the FUI value experiences a slight increase. This suggests that increasing the inlet flow rate does not enhance the uniformity of the air distribution inside the cabinet. Figure 11b illustrates that the average temperature distribution trend of the battery cabin in the cabinet is consistent for the three types of cold air inlet flow rates. Figure 11c calculate temperature uniformity, showing that as the inlet flow rate increases, the standard deviation of the temperature in the cabinet decreases. This indicates that a higher inlet flow rate contributes to improved temperature uniformity in the cabinet.
- (3)
- Effect of battery heat output
The battery generates varying amounts of heat under different working conditions. In this paper, simulations were conducted for the working load of the battery cell with charge and discharge rates of 0.1 C, 0.2 C, and 0.5 C, corresponding to the temperature distribution of the battery cabin with heat dissipation values of 690 W/m3, 2150 W/m3, and 18,333 W/m3, respectively. Figure 12a illustrates the average temperature of each battery cabin in a cabinet. When the charge–discharge ratio of a single battery is set at 0.1 C and 0.2 C, the temperature difference of the battery cabin is not pronounced. However, when the charge–discharge ratio reaches 0.5 C, the temperature deviation of the entire cabinet significantly increases, reaching 8 K. Figure 12b compare the temperature uniformity of the battery cabin. It can be observed that when the battery unit operates at a high load, i.e., with a large heat output, a 0.01 increase in the temperature uniformity coefficient leads to a substantial rise in the temperature standard deviation, reaching 2.5.
During the charging and discharging process of lithium battery packs, temperature differences can lead to an increase in internal impedance, affecting the discharge capacity and charging speed of the battery pack. Additionally, temperature differences can exacerbate the capacity degradation of the battery pack, impacting its lifespan and performance. Therefore, to maximize the performance of the battery, it is necessary to conduct charging and discharging operations within an appropriate temperature range and avoid excessive temperature differences.
3.2. Rack-Level Air Cooling
When the heat exchanger is positioned in the upper part of the cabinet, as depicted in Figure 13, hot air enters the heat exchanger and exits from the right side after cooling. Simultaneously, cold air is heated by the battery cabin and flows out from the left side, creating a complete air circulation. It is observed that air flow generates a backflow phenomenon within the cabinet. This occurs because as cold air exits the heat exchanger outlet, its flow is impeded by the rear side wall of the cabinet, resulting in backflow when the air reaches the bottom of the closed cabinet, constrained by the bottom wall.
Figure 14 illustrates the internal temperature distribution and velocity distribution in the section of a closed cabinet. This visual representation clearly demonstrates the change in flow rate after the air flows out of the heat exchanger, providing great evidence of the existence of backflow.
When the heat exchanger is positioned at the lower part of the cabinet, the flow diagram is depicted in Figure 15. Arrows are used to indicate the air flow direction inside the heat exchanger. The above flow diagram reveals that the simulation results are consistent with the previous scenario: as the air is cooled in the heat exchanger and is expelled by the rear fan, the flow direction changes due to the large initial speed, causing the air to strike the rear wall. As a result, there is a significant downward or upward momentum, and most of the air flows either downward or upward. During the flow process, a portion of the air experiences a decrease in speed, leading to energy loss and backflow.
Figure 16 compares the FUI values and the average temperature of the battery cabin in the upper, middle, and lower heat exchanger arrangements. When the heat exchanger is positioned in the middle of the cabinet, the FUI value is relatively high, indicating a highly uneven flow distribution. However, due to the shorter air flow path resulting from the heat exchanger being located in the middle of the cabinet, the temperature deviation is smaller.
3.3. Improvement on Rack-Level Cooling
The backflow of cold air in the corner area of a rectangular cabinet can weaken its cooling effect. To minimize the occurrence of backflow, it is essential to eliminate potential flow-retarder areas. An effective approach involves altering the cabinet’s shell shape using the principles of bionics, as illustrated in Figure 17. The outlet air flow can naturally split up and down along a spiral path, and the upper and lower regions of the cabinet adopt a spiral with a smaller pitch. This arrangement allows the inner air flow to generate a corresponding annular flow along the spiral, reaching the entrance of the battery cabin in the middle of the cabinet with the compression of the outer air flow. The turbulence is accentuated as individual battery cabin outlet fans impart more kinetic energy to the air flow. The wavy, tapered design of the cabinet shell facilitates the return of hot air to the heat exchanger. Table 2 provides the helix parameters of the cabinet shell.
Figure 18 illustrates the streamline in the volute cabinet compared to that in the rectangular cabinet. The design of a larger pitch helical coil in the position of the heat exchanger allows the outlet airflow in the cold channel to naturally split upward and downward along the helical coil. Meanwhile, the helical coils with smaller pitches may maximize the utilization of circumferential flow vertically, enabling the inner airflow to generate corresponding circumferential movement along the helical coil while being pushed by the outer airflow towards the entrance of the battery compartment located in the middle of the cabinet. Additionally, the fans at the outlets of each battery pack impart more kinetic energy to the airflow, resulting in more pronounced airflow disturbances compared to the cold channel. As a result, the hot channel can fully utilize the wave-shaped design with a gradual tapering trend, facilitating the return of hot air to the heat exchanger.
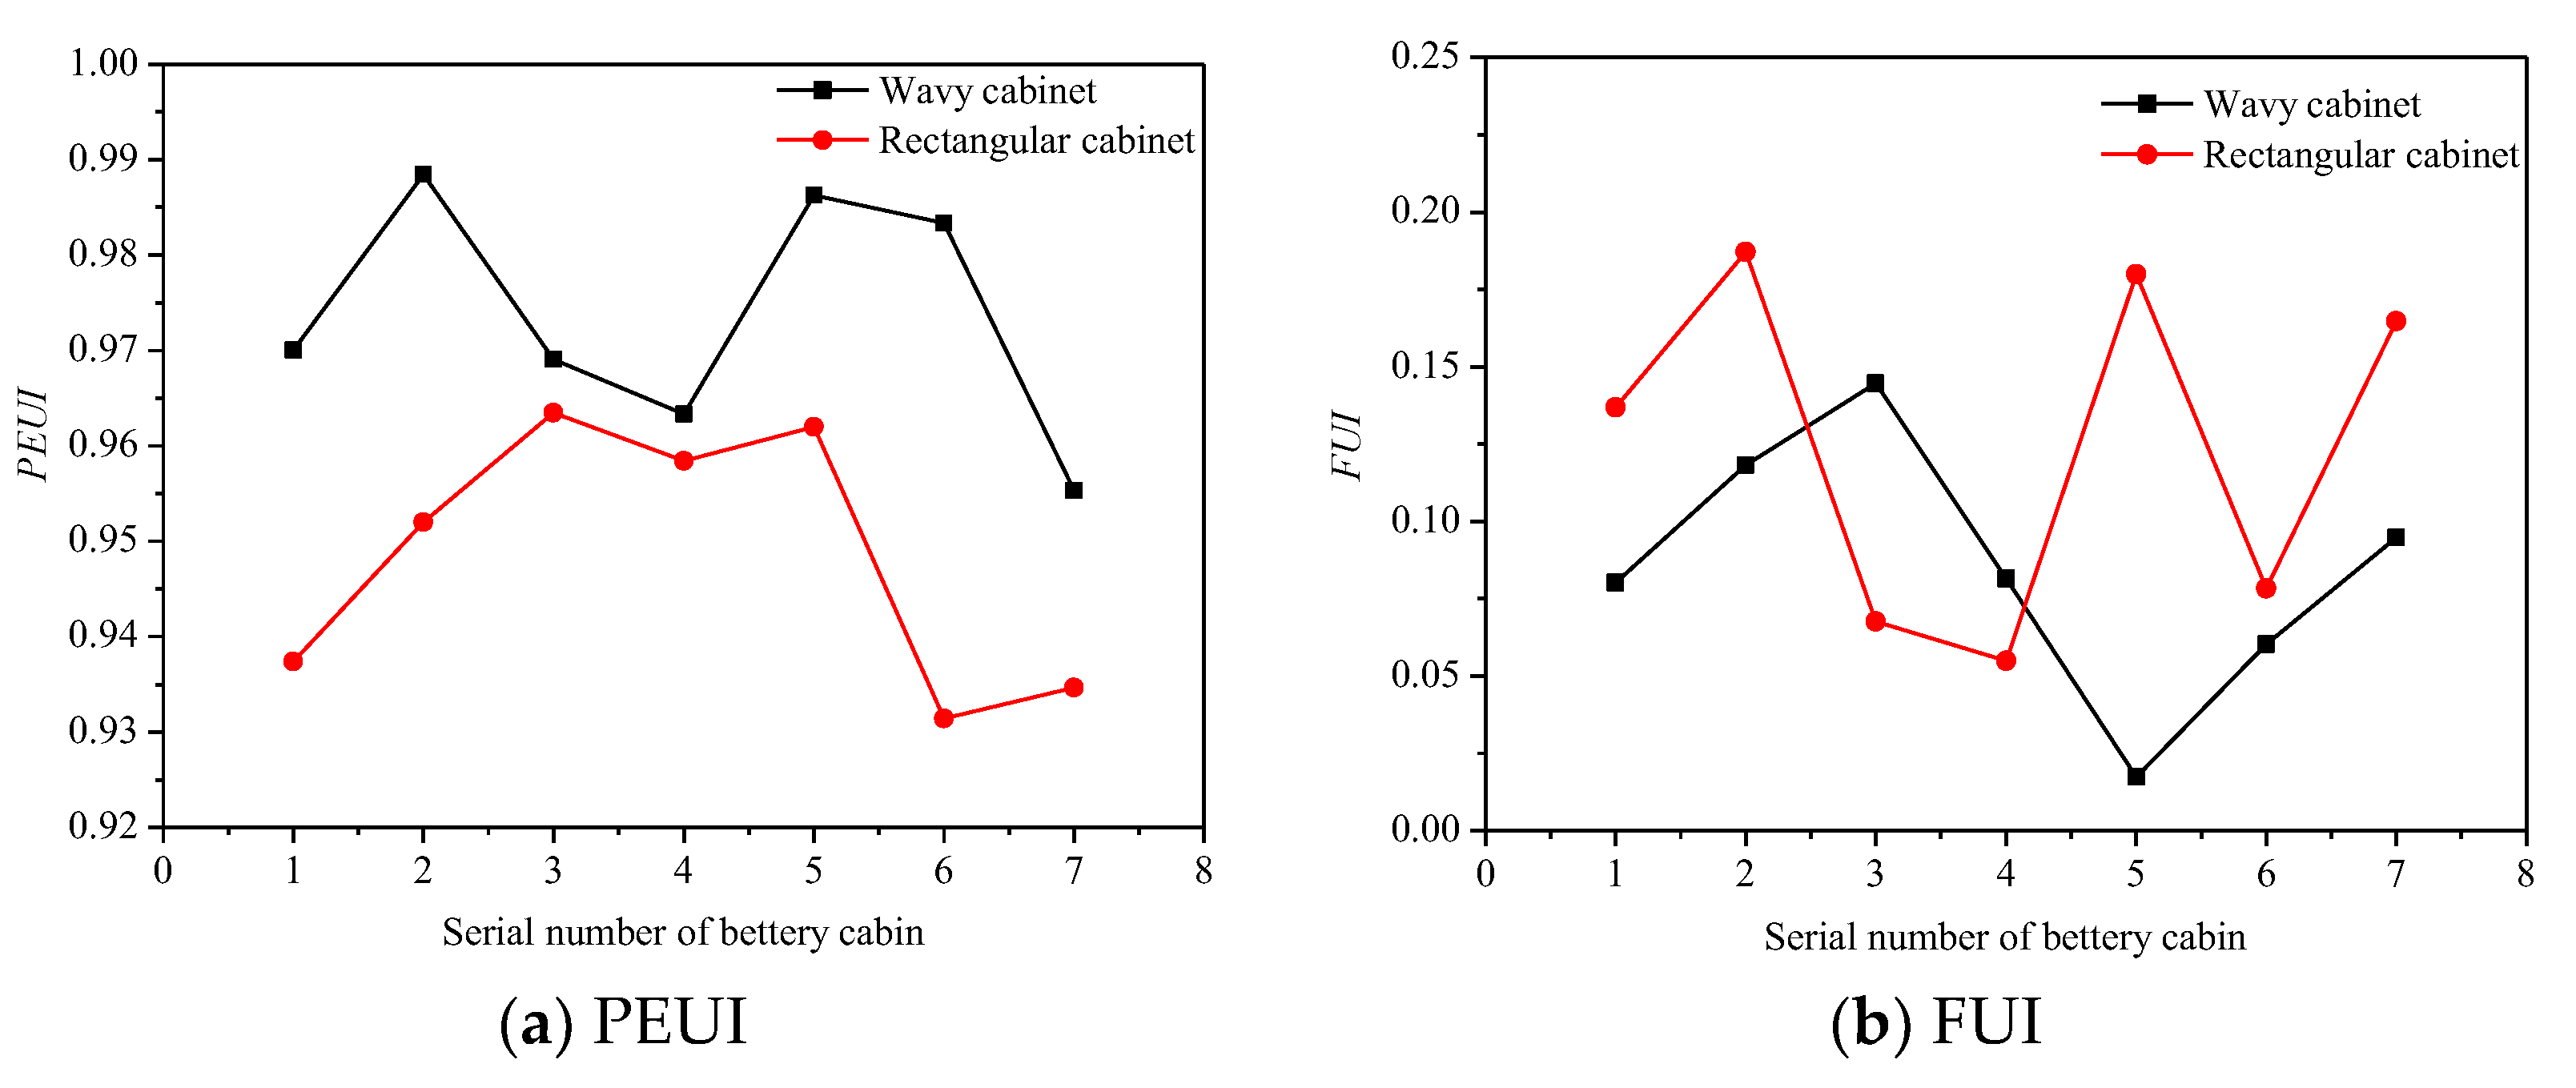
The PEUI value represents the ratio of the temperature difference between the inlet and outlet of the battery cabin and the inlet and outlet of the heat exchanger. Figure 19 shows that the PEUI value of the battery cabin in a wavy cabinet is higher than that in a rectangular cabinet, indicating that the use of a wavy cabinet can improve the utilization rate of cold air. The relatively low FUI value of the wavy cabinet indicates that the inlet flow uniformity is also improved. When a rectangular cabinet is used, the air flow, influenced by energy loss due to the limitation of the wall, reduces the inlet flow of the battery cabin near the heat exchanger, leading to an increase in the FUI value. The use of a wavy cabinet can mitigate the energy loss of air flow, resulting in a reduction of the FUI value of the battery cabin in the same position by about 0.1, thus improving uniformity.
Table 3 compares the average temperature of the battery cabin inside the two cabinets. It is evident that the average temperature of the battery cabin inside the wavy closed cabinet is lower than that of the rectangular closed cabinet. This indicates that although the wavy cabinet has a limited effect on the improvement of the FUI value, the PEUI value is significantly increased, and the energy utilization rate of cold air is high. In particular, the battery cabin at the upper and lower ends of the cabinet is greatly affected. At the same time, the wavy cabinet can reduce the internal thermal deviation of the battery cabin in the cabinet by about 0.1 K, improving the security of the energy storage system.
In practical applications, the total energy power is about 4 kWh in one battery pack and 28 kWh in one rack. Energy saving of one rack may reach about 2.4 kWh during one charging and discharging cycle. The total energy saved in a power supply container is big and considerable. In this regard, results obtained in this study may guide the thermal management design for power supply container, aiming to reach higher capacity density and power efficiency.
4. Conclusions
The power supply container can provide sufficient power guarantee for stadiums in emergency situations. The thermal management system is crucial for maintaining the stability of the power supply container’s performance. A reasonable thermal management design helps to increase the total capacity, efficiency, and safety of the power supply container. In this paper, we propose a simplified porous media model based on the battery arrangement in the container energy storage system, establishing an orthogonal experimental table for structural parameters in modeling and simulation. Utilizing the simulation results’ relationship between the flow rate and pressure drop, we derive a resistance correlation formula for the porous media model, effectively simplifying the modeling of the packaged energy storage system. Subsequently, different-sized cabinet air channel models are established to compare thermal management effects under various inlet air temperatures and battery loads.
This study reveals that reducing the bottom size of the air inlet channel promotes the downward flow of cold air to the bottom battery cabin. When the bottom air channel size is set to 2/3 of the original size, the inlet flow uniformity of each battery cabin in the cabinet increases by 5%. Increasing the inlet wind speed effectively improves the temperature uniformity of the battery cabin, with a temperature standard deviation decrease of 0.18 as the flow rate increases from 3 m/s to 8 m/s. Additionally, as the battery operating ratio increases, heat production rises proportionally. Under the same air supply volume, a higher battery heat output leads to greater temperature inequality inside the cabinet.
Applying the principle of bionics, a wave-shaped closed cabinet is designed. A comparison with a rectangular closed cabinet reveals that when the heat exchanger is located in the middle of the cabinet, the cold air energy utilization efficiency of the battery cabin in the wave-shaped cabinet increases by over 4%, and the average temperature of the cabinet decreases by 0.7 K.
Author Contributions
Conceptualization W.C.; Validation, Y.D. (Yue Dong); Investigation, Y.D. (Yi Ding); Data curation, Y.D. (Yi Ding); Writing—original draft, Y.D. (Yue Dong) and Y.Q.; Writing—review & editing, W.C.; Visualization, K.E.E.; Supervision, K.E.E., W.C. and Q.W. All authors have read and agreed to the published version of the manuscript.
Funding
This research was funded by National Science Foundation of China grant number 52206113.
Data Availability Statement
The original contributions presented in the study are included in the article, further inquiries can be directed to the corresponding author.
Conflicts of Interest
The authors declare no conflict of interest.
Nomenclature
| a | Permeability |
| C2 | Inertial resistance coefficient |
| D | Viscous resistance coefficient |
| Lx | Column spacing, mm |
| Ly | Linespacing, mm |
| Nx | Number of columns |
| Ny | Number of rows |
| ∆n | Thickness of porous media region, m |
| ∆p | Pressure drop, Pa |
| S | Additional resistance source term |
| ∆t | Time variation, min |
| ∆Tmax | Maximum temperature difference, K |
| v | Velocity of liquid, m/s |
| Greek symbols | |
| μ | Dynamic viscosity, Pa·s |
| ρ | Density of fluid, kg/m3 |
| Abbreviations | |
| FUI | Flow Uniformity Index |
| PEUI | Pack Energy Utilization Index |
References
- Javani, V.; Davarn Hagh, E. Energy Management in Stadiums by Using Hybrid Renewable Energy Systems. J. Adv. Sport Technol. 2021, 5, 99–108. [Google Scholar]
- Zhao, Y.; Hou, H.; Geng, S.; Liu, X.; Yan, X. Research on the optimization of power emergency supply dispatch system for large sports events. In Proceedings of the Fifth International Conference on Traffic Engineering and Transportation System (ICTETS 2021), Chongqing, China, 24–26 September 2021; SPIE: Bellingham, WA, USA, 2021; Volume 12058, pp. 185–193. [Google Scholar]
- Manni, M.; Coccia, V.; Nicolini, A.; Marseglia, G.; Petrozzi, A. Towards zero energy stadiums: The case study of the Dacia arena in Udine, Italy. Energies 2018, 11, 2396. [Google Scholar] [CrossRef]
- Madej, W.; Wojciechowski, A. Analysis of the charging and discharging process of LiFePO4 battery pack. Energies 2021, 14, 4055. [Google Scholar] [CrossRef]
- Du, J.; Chen, J.; Song, Z.; Gao, M.; Ouyang, M. Design method of a power management strategy for variable battery capacities range-extended electric vehicles to improve energy efficiency and cost-effectiveness. Energy 2017, 121, 32–42. [Google Scholar] [CrossRef]
- Hsu, S.P.; Lin, C.L.; Wu, J.Y. Balancing charge/discharge management for series/parallel battery packs. In Proceedings of the 7th IEEE Conference on Industrial Electronics and Applications (ICIEA), Singapore, 18–20 July 2012; IEEE: Piscataway, NJ, USA; pp. 613–618. [Google Scholar]
- Lelie, M.; Braun, T.; Knips, M.; Nordmann, H.; Ringbeck, F.; Zappen, H.; Sauer, D.U. Battery management system hardware concepts: An overview. Appl. Sci. 2018, 8, 534. [Google Scholar] [CrossRef]
- Huang, W.; Feng, X.; Han, X.; Zhang, W.; Jiang, F. Questions and answers relating to lithium-ion battery safety issues. Cell Rep. Phys. Sci. 2021, 2, 100285. [Google Scholar] [CrossRef]
- Chombo, P.V.; Laoonual, Y. A review of safety strategies of a Li-ion battery. J. Power Sources 2020, 478, 228649. [Google Scholar] [CrossRef]
- Buidin, T.I.C.; Mariasiu, F. Battery thermal management systems: Current status and design approach of cooling technologies. Energies 2021, 14, 4879. [Google Scholar] [CrossRef]
- Lin, Y.; Chen, Y.W.; Yang, J.T. Optimized thermal management of a battery energy-storage system (BESS) inspired by air-cooling inefficiency factor of data centers. Int. J. Heat Mass Transf. 2023, 200, 123388. [Google Scholar] [CrossRef]
- Schmidt, R.R.; Iyengar, M.; Vogel, M. Comparison between underfloor supply and overhead supply ventilation designs for data center high-density clusters/discussion. ASHRAE Trans. 2007, 113, 115. [Google Scholar]
- Nada, S.A.; Said, M.A. Effect of CRAC units layout on thermal management of data center. Appl. Therm. Eng. 2017, 118, 339–344. [Google Scholar] [CrossRef]
- Nada, S.A.; Said, M.A. Comprehensive study on the effects of plenum depths on air flow and thermal managements in data centers. Int. J. Therm. Sci. 2017, 122, 302–312. [Google Scholar] [CrossRef]
- Arghode, V.K.; Sundaralingam, V.; Joshi, Y. Airflow Management in a Contained Cold Aisle Using Active Fan Tiles for Energy Efficient Data-Center Operation. Heat Transf. Eng. 2016, 37, 246–256. [Google Scholar] [CrossRef]
- Sahini, M.; Kumar, E.; Gao, T. Study of Air Flow Energy within Data Center room and sizing of hot aisle Containment for an Active vs. Passive cooling design. In Proceedings of the 2016 15th IEEE Intersociety Conference on Thermal and Thermomechanical Phenomena in Electronic Systems (ITherm), Las Vegas, NV, USA, 31 May–3 June 2016; pp. 1453–1457. [Google Scholar]
- Fakhim, B.; Srinarayana, N.; Behnia, M. Thermal performance of data centers-rack level analysis. IEEE Trans. Compon. Packag. Manuf. Technol. 2013, 3, 792–799. [Google Scholar] [CrossRef]
- Faraji, H.; Yıldız, Ç.; Arshad, A.; Arıcı, M.; Choukairy, K.; El Alami, M. Passive thermal management strategy for cooling multiple portable electronic components: Hybrid nanoparticles enhanced phase change materials as an innovative solution. J. Energy Storage 2023, 70, 108087. [Google Scholar] [CrossRef]
- Chibani, A.; Dehane, A.; Merouani, S.; Bougriou, C.; Guerraiche, D. Melting/solidification of phase change material in a multi-tube heat exchanger in the presence of metal foam: Effect of the geometrical configuration of tubes. Energy Storage Sav. 2022, 1, 241–258. [Google Scholar] [CrossRef]
- Pang, B.; Lv, J.; Yan, C.; Fan, G.; Cheng, H. Modeling and performance analysis of separate heat pipe containing non-condensable gas for pool-type low-temperature heating reactor. Nucl. Eng. Des. 2024, 419, 112987. [Google Scholar] [CrossRef]
- Xu, X.; Zhang, X. Finite time thermodynamics analysis and research of pulsating heat pipe cold storage device. Energy Storage Sav. 2022, 1, 33–43. [Google Scholar] [CrossRef]
- Liu, Z.; Wang, C.C.; Wang, Q.; Chu, W. Enhancement on heat transfer and reliability of low melting temperature alloy based thermal interface materials. Int. Commun. Heat Mass Transf. 2024, 151, 107215. [Google Scholar] [CrossRef]
- Chen, Q.; Qin, D.; Ouyang, L.; Yang, X.; Zhang, Y. Understanding solid phase diffusion-bonding process of Ni (000)/α-Al2O3 (0001) interface. Energy Storage Sav. 2023, 2, 495–502. [Google Scholar] [CrossRef]
- Benkaddour, A.; Faraji, M.; Faraji, H. Numerical study of the thermal energy storage behaviour of a novel composite PCM/Concrete wall integrated solar collector. Mater. Today Proc. 2020, 30, 905–908. [Google Scholar] [CrossRef]
- Luan, Z.; Zhang, L.; Kong, X.; Li, H.; Fan, M. Experimental evaluation of factors affecting performance of concentrating photovoltaic/thermal system integrated with phase-change materials (PV/T-CPCM). Energy Storage Sav. 2024, 3, 30–41. [Google Scholar] [CrossRef]
- Chu, W.-X.; Lien, Y.-H.; Huang, K.-R.; Wang, C.-C. Energy saving of fans in air-cooled server via deep reinforcement learning algorithm. Energy Rep. 2021, 7, 3437–3448. [Google Scholar] [CrossRef]
- Chu, W.-X.; Hsu, C.-S.; Tsui, Y.-Y.; Wang, C.-C. Experimental investigation on thermal management for small container data center. J. Build. Eng. 2019, 21, 317–327. [Google Scholar] [CrossRef]
- Chu, W.-X.; Lee, P.-H.; Tsui, Y.-Y.; Wang, C.-C. Performance analysis of a simulated container data center subject to airflow resistance. Energy Effic. 2021, 14, 18. [Google Scholar] [CrossRef]
Figure 1.
Stadium power supply electric container and internal battery arrays.

Figure 2.
Schematic diagram and validation of the porous media model simplification process.
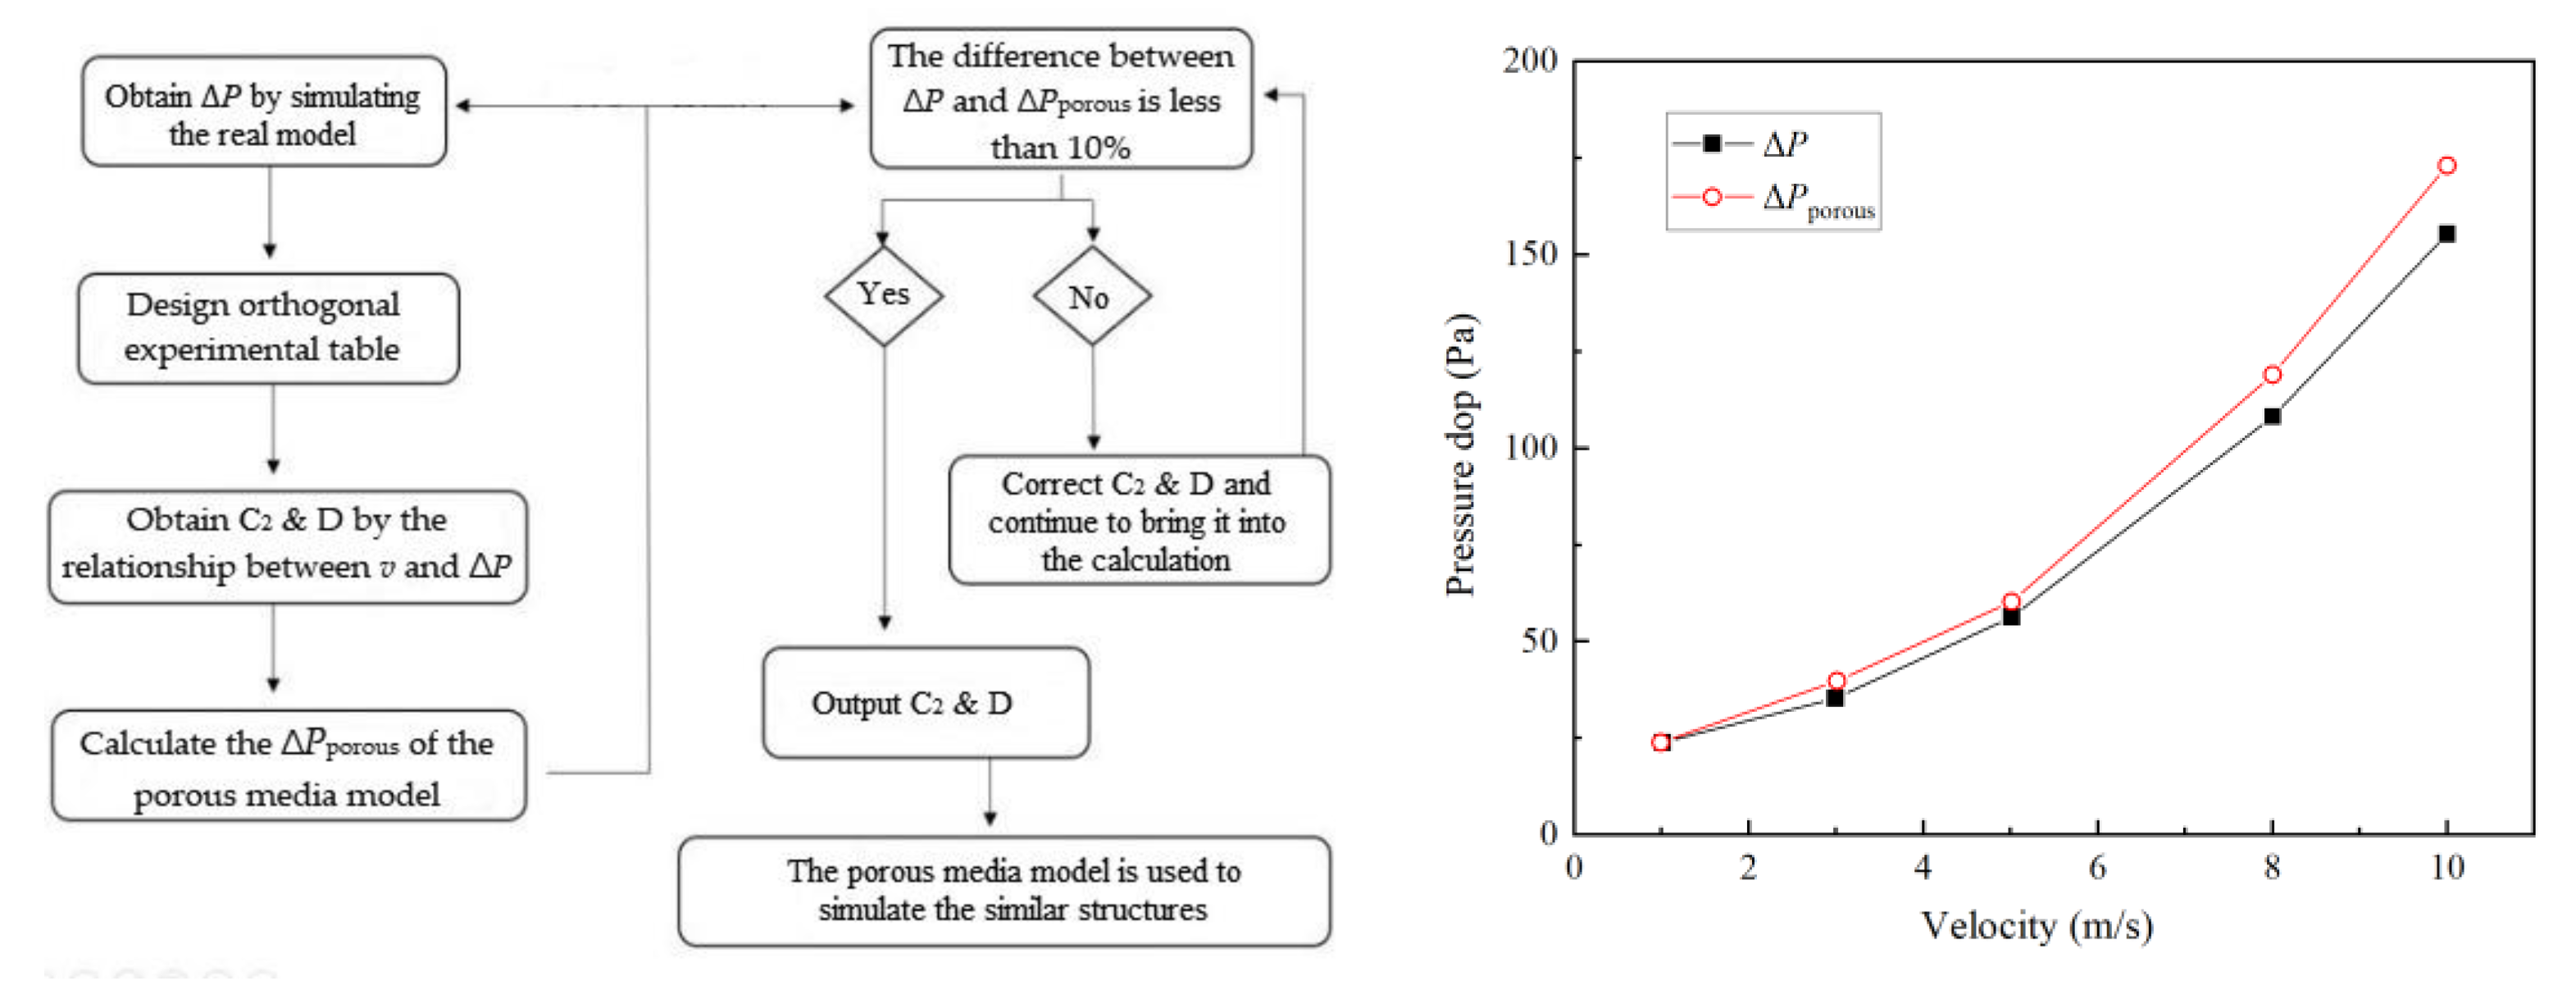
Figure 3.
Structure diagram of battery cabin and simplified model.
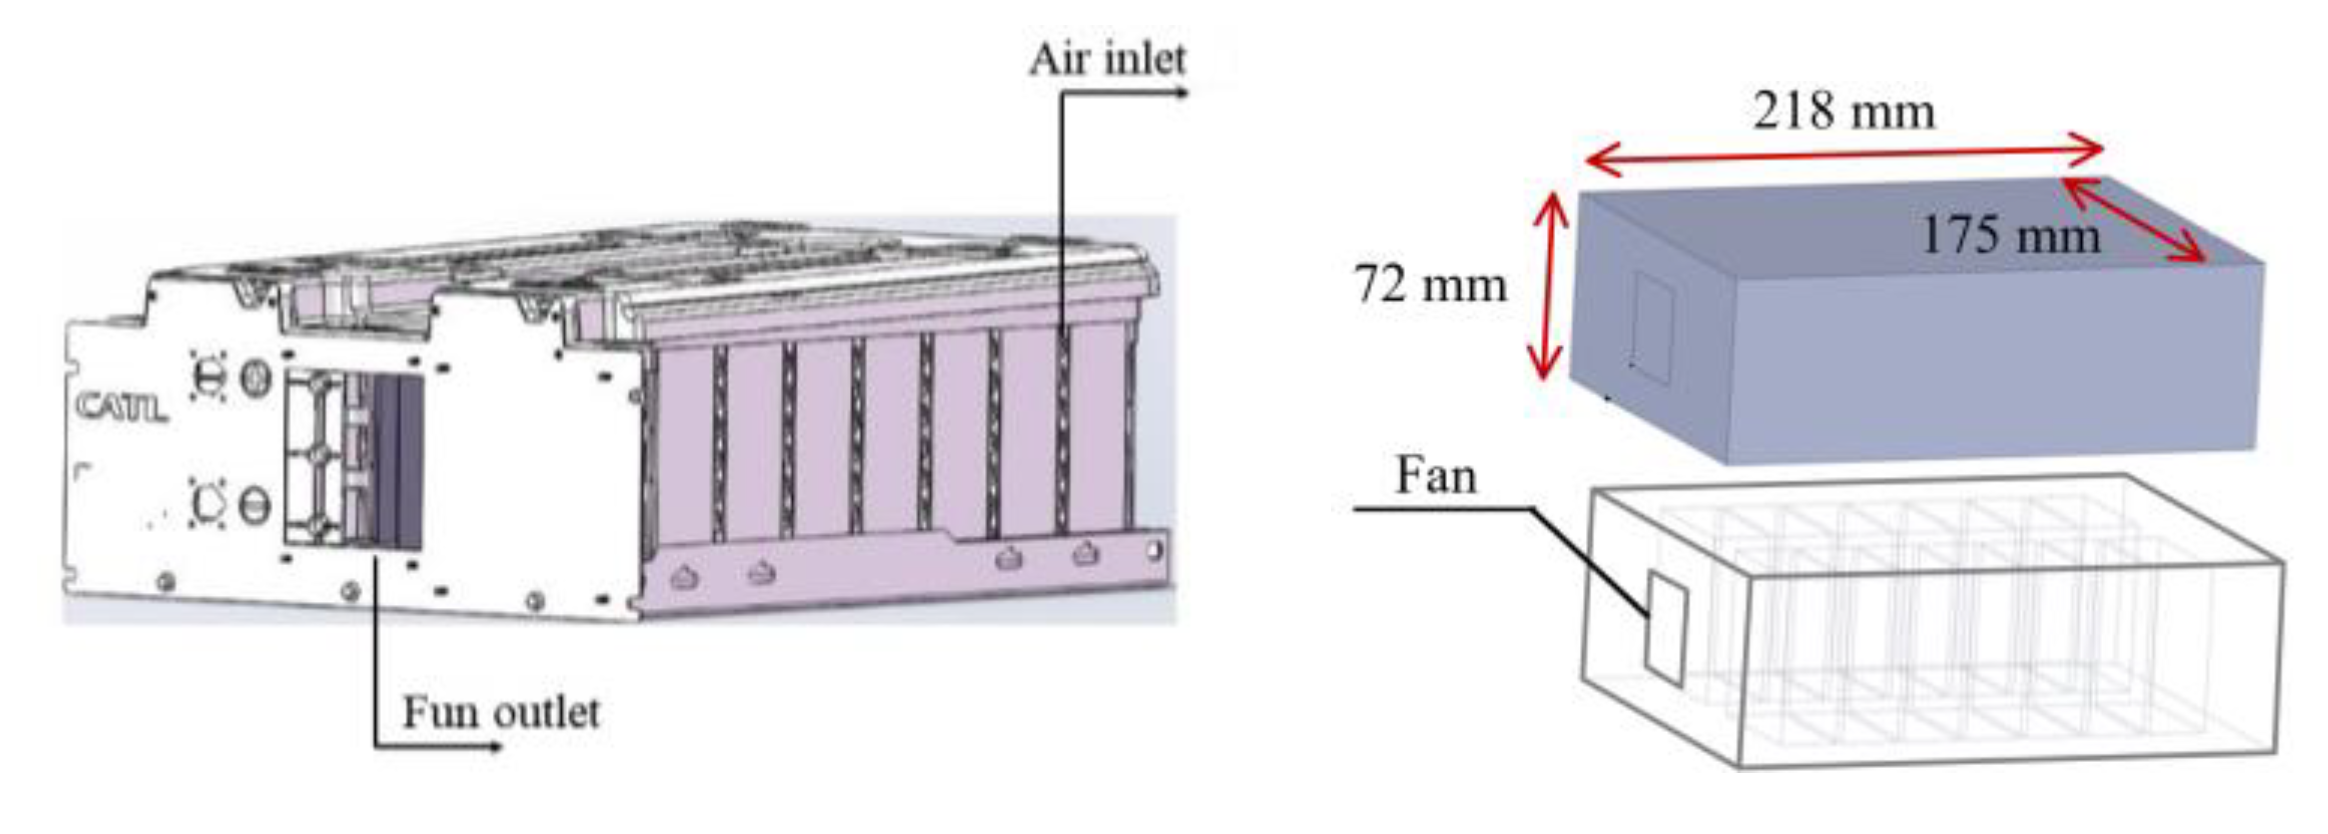
Figure 4.
Schematic diagram of centralized air-cooling model.
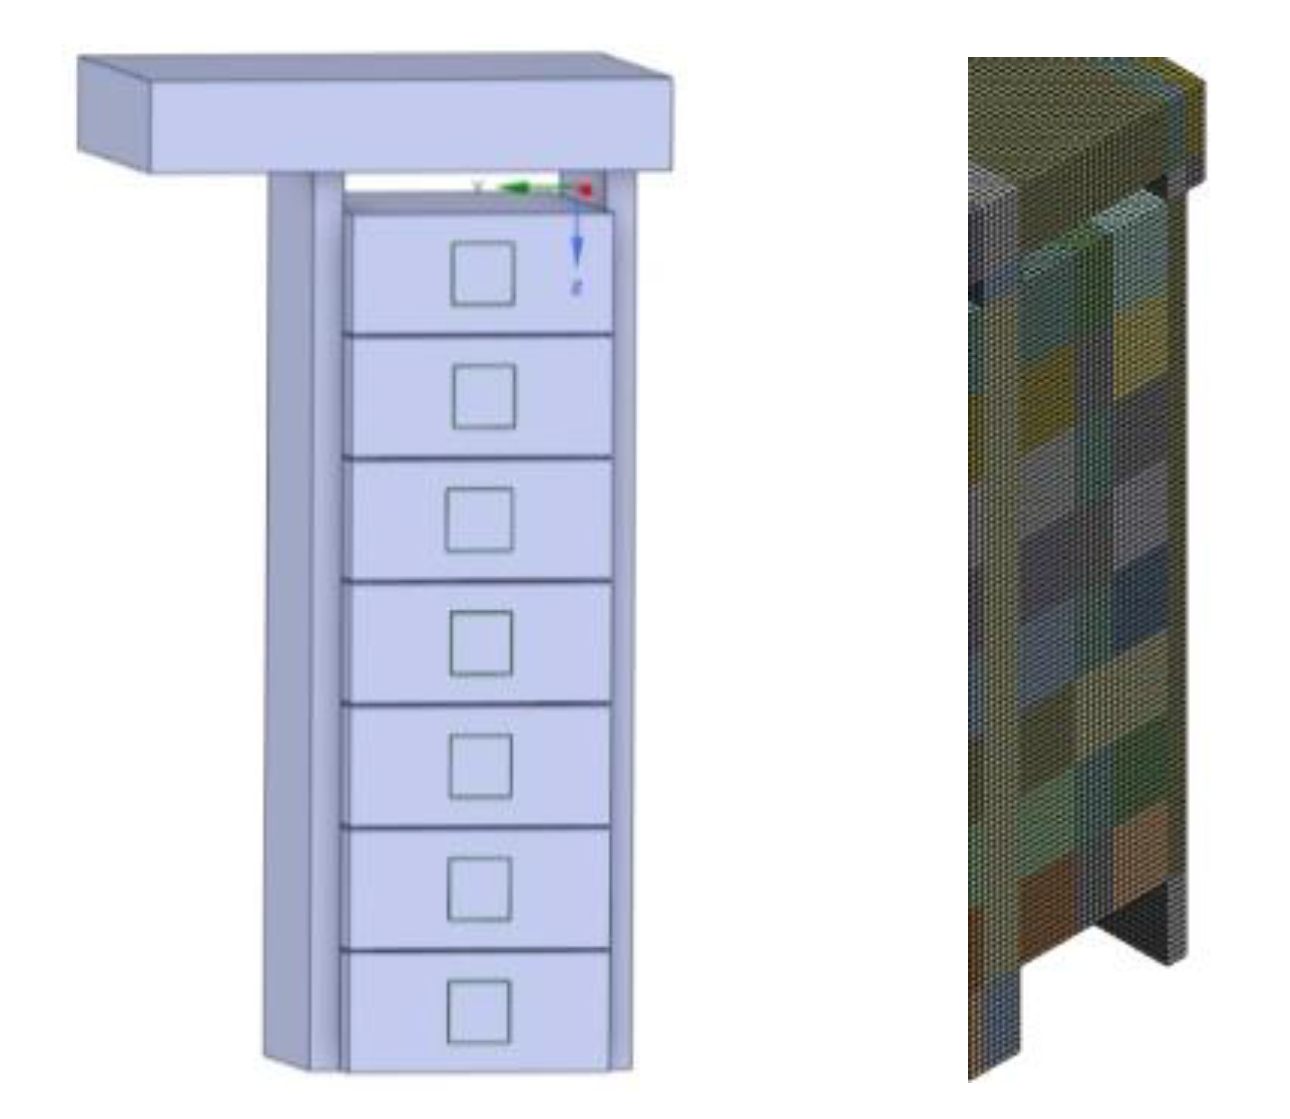
Figure 5.
Closed cabinet model diagram and mesh independent study.
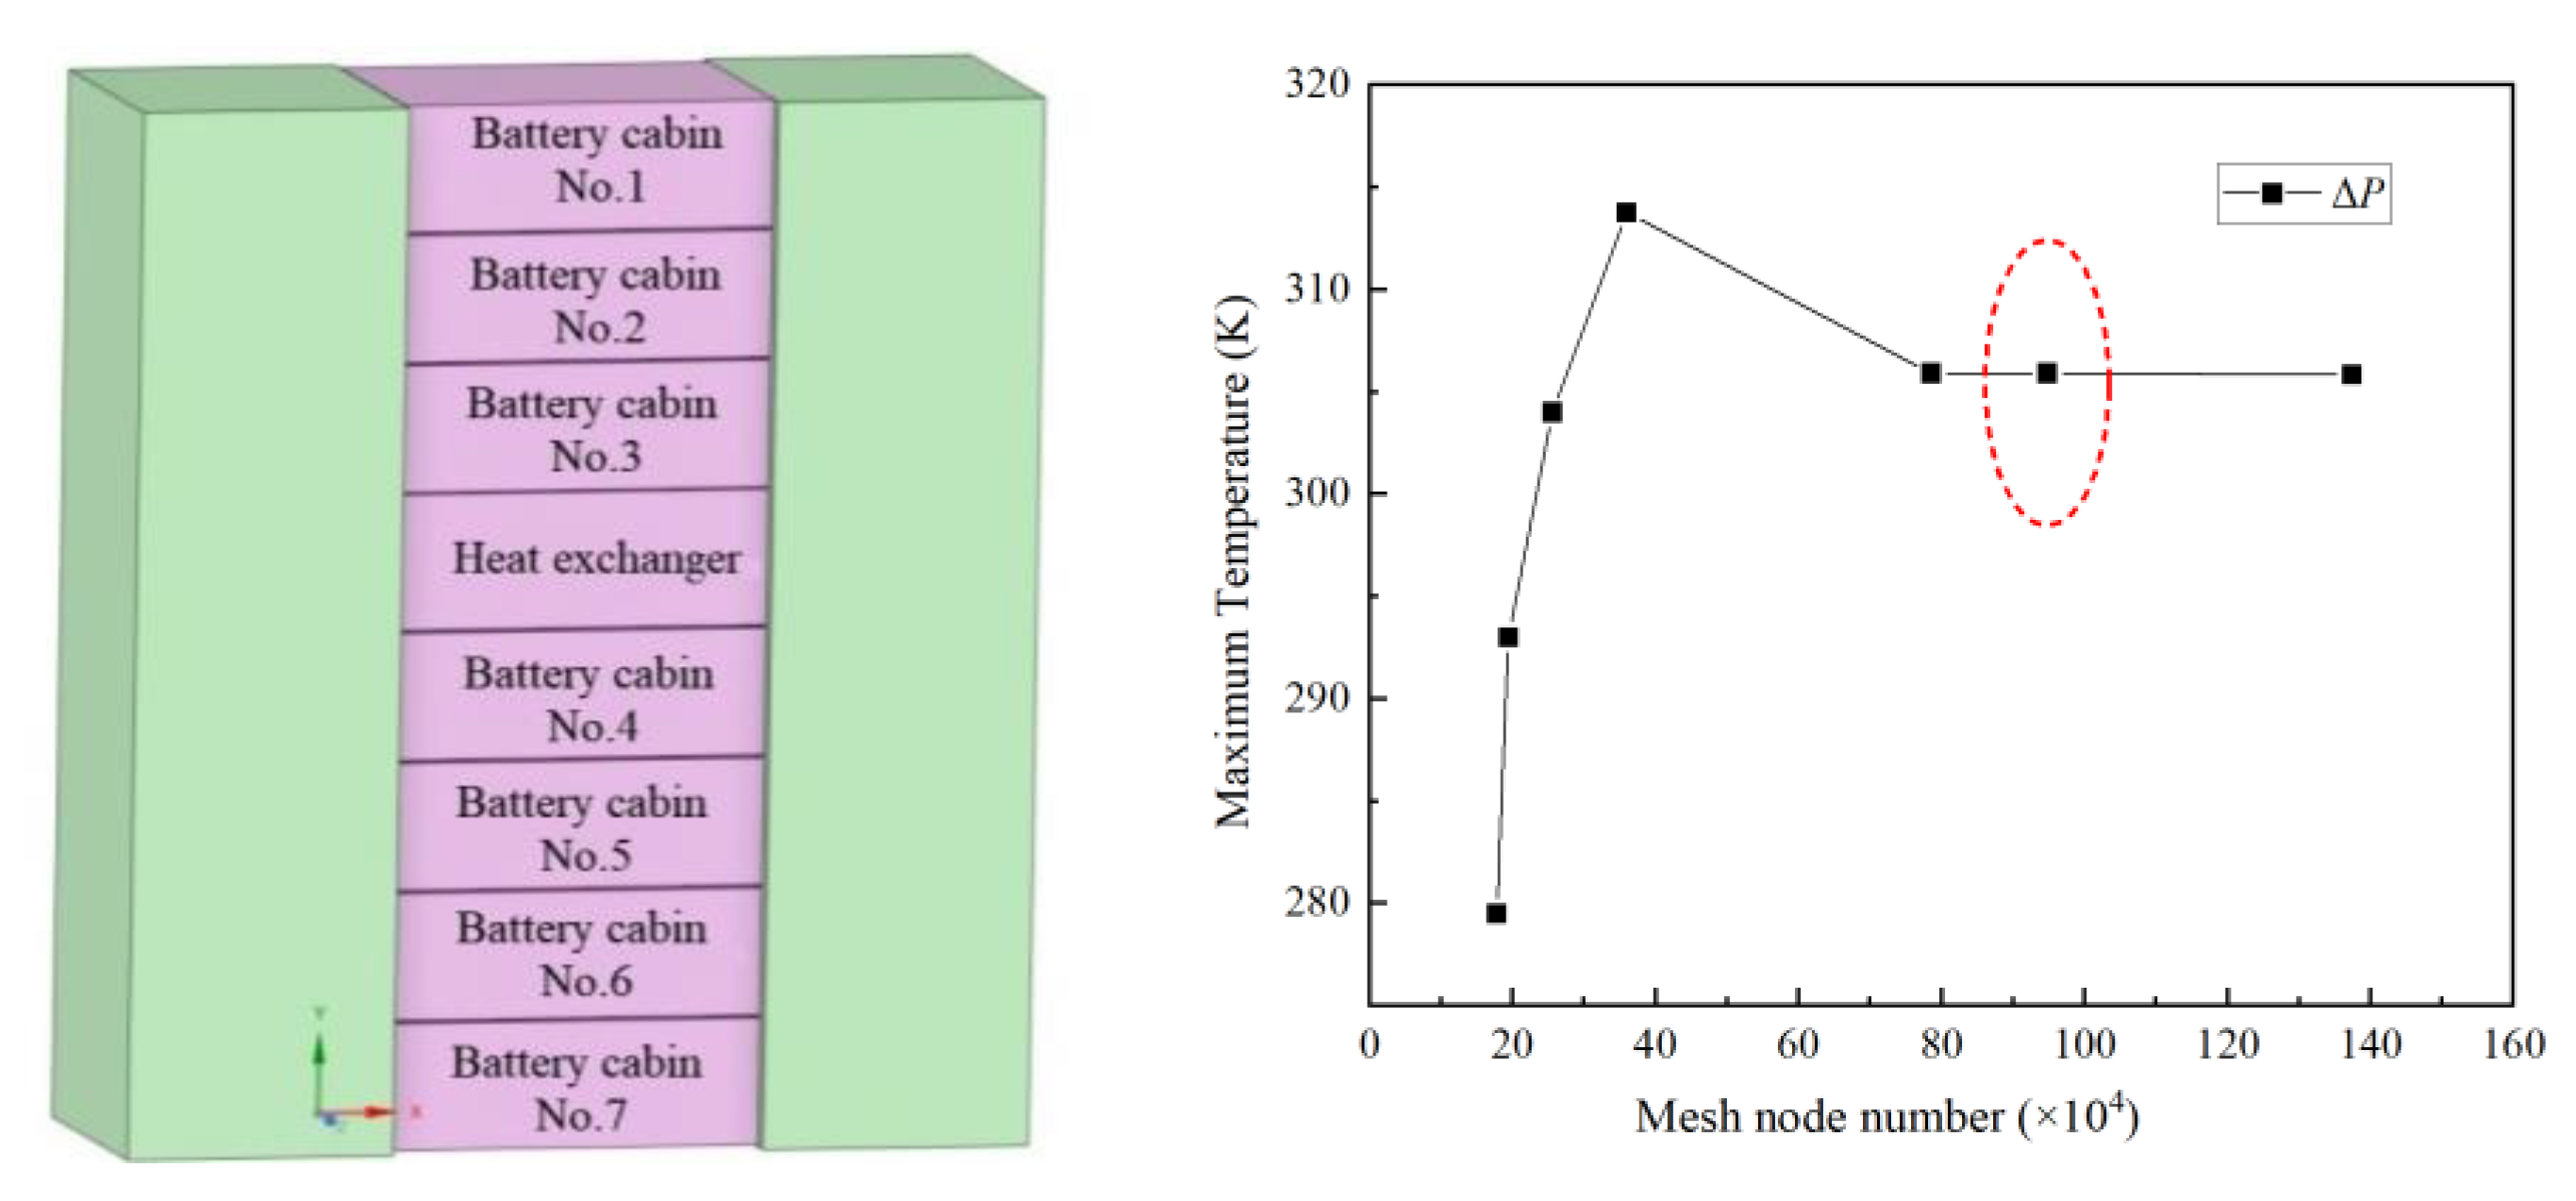
Figure 6.
Validation model diagram.
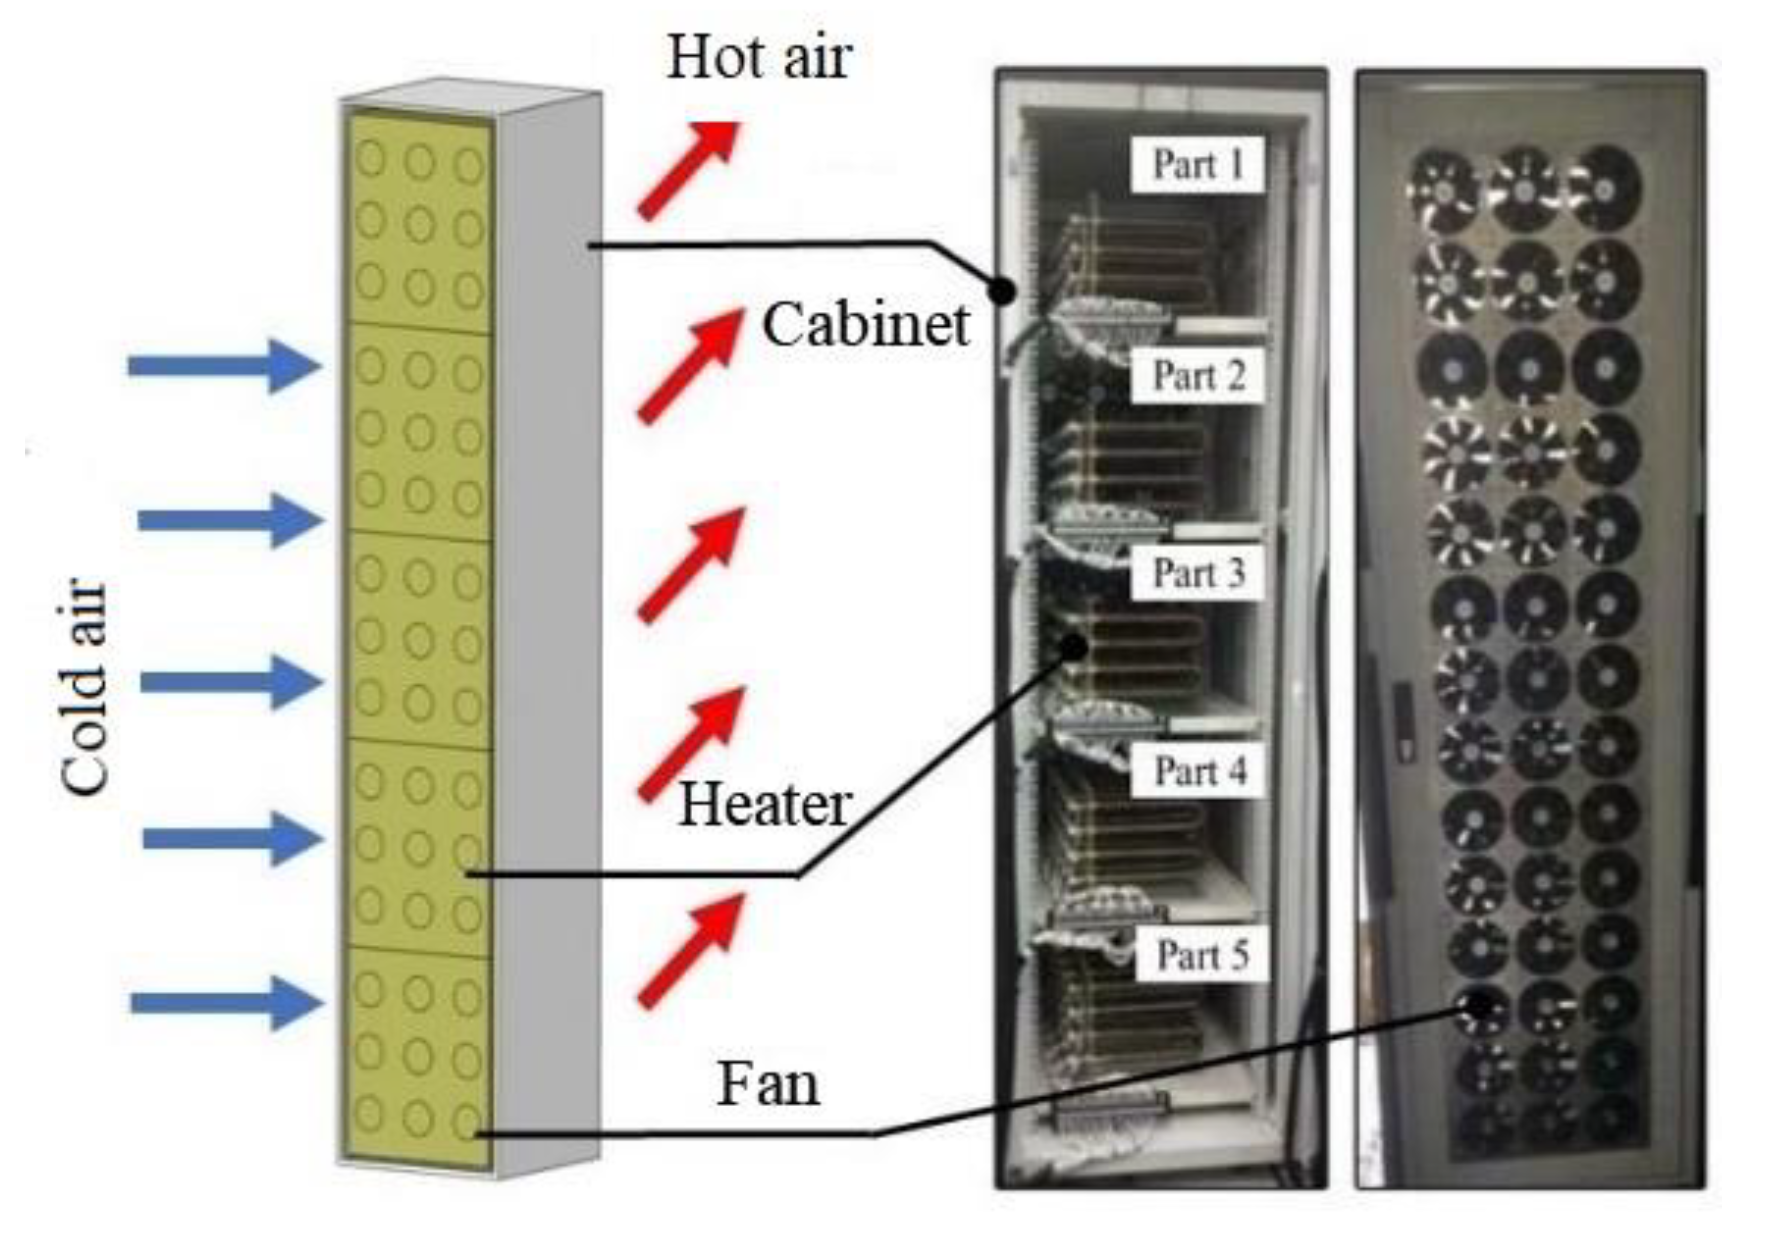
Figure 7.
Model verification results.
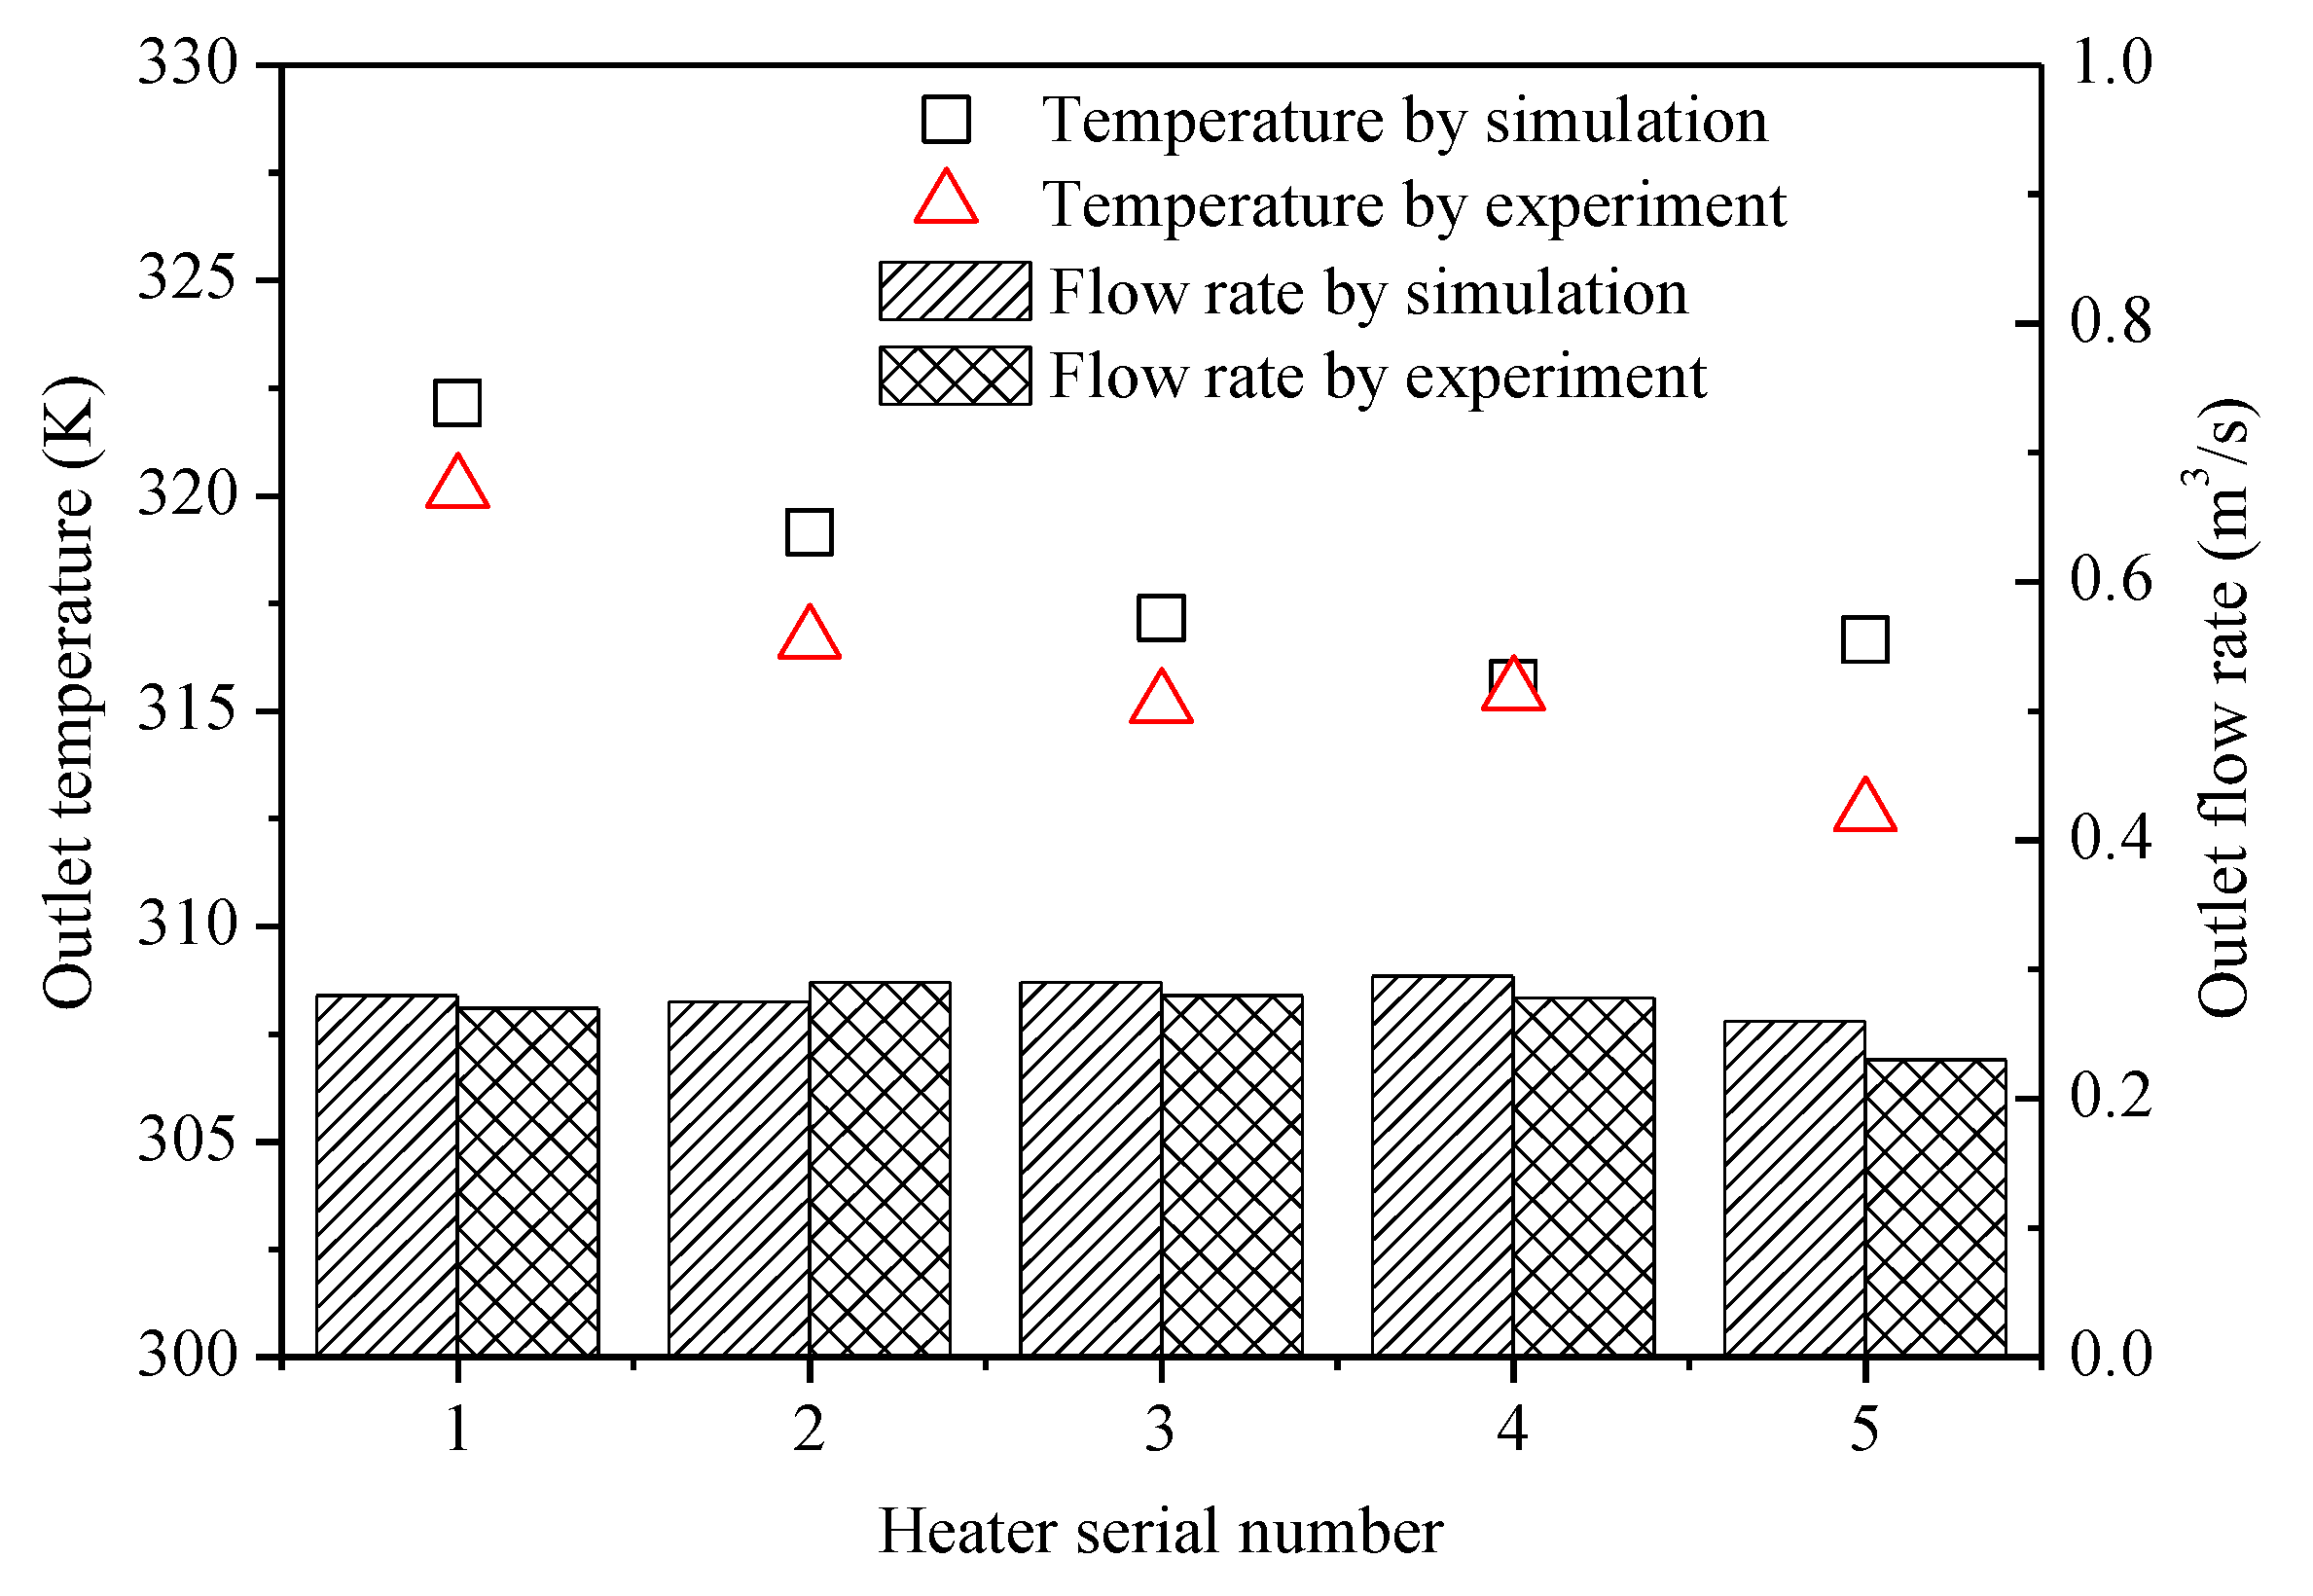
Figure 8.
Temperature cloud image of four air channel models.
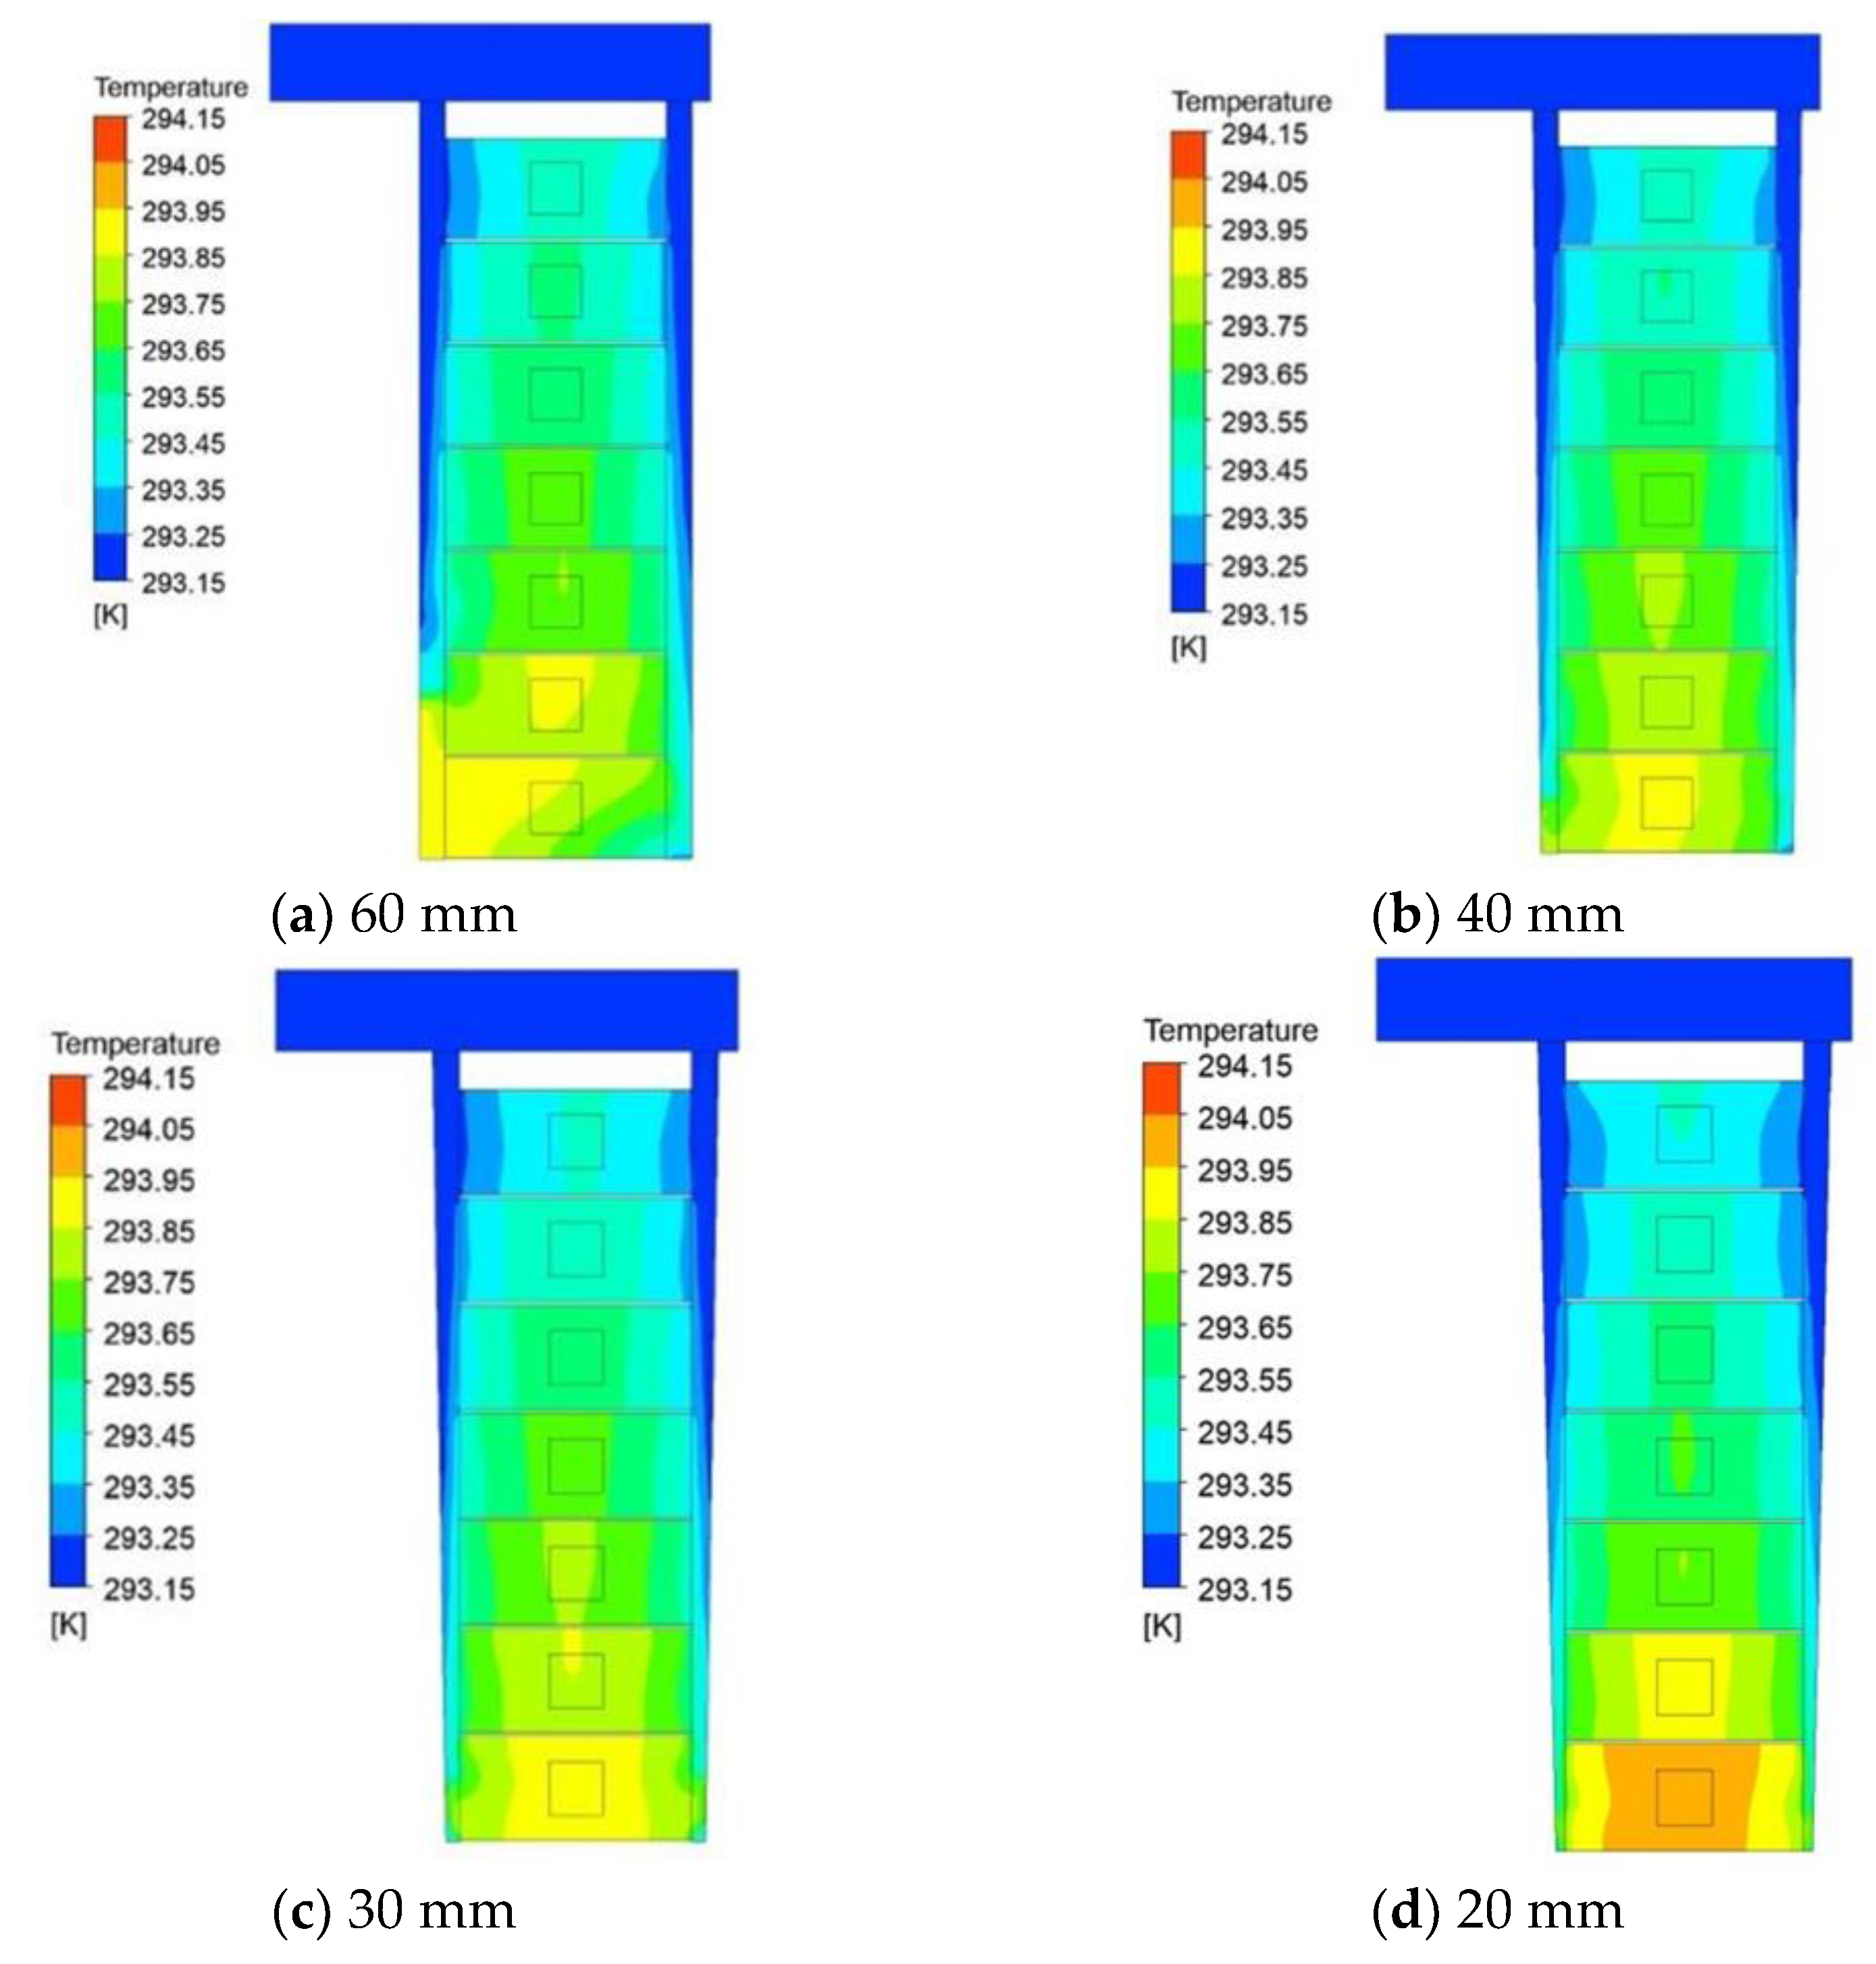
Figure 9.
Comparison of the FUI values of four air channel models.
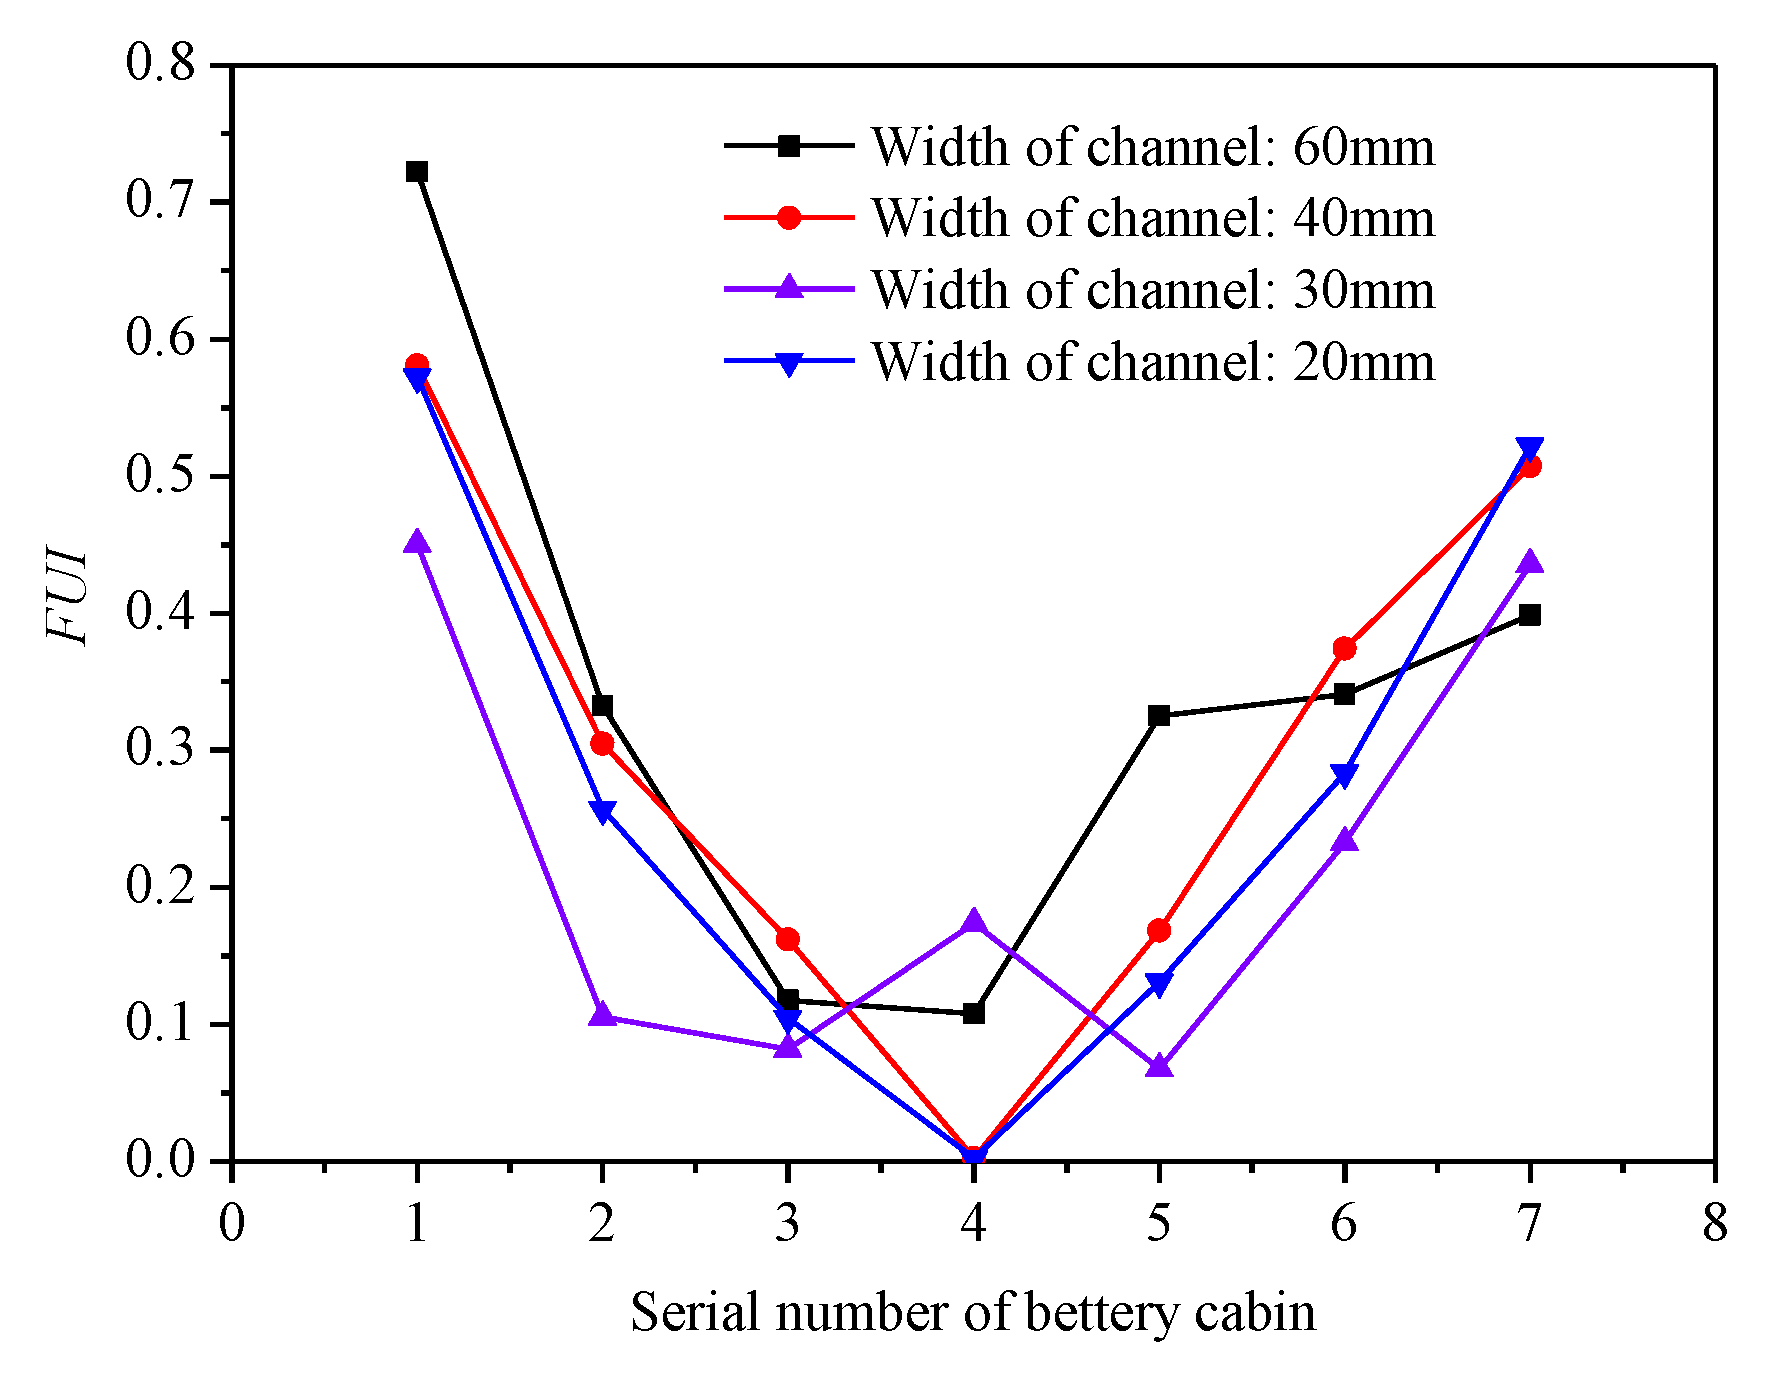
Figure 10.
Comparison of the temperature standard deviation of four air channel models.

Figure 11.
Comparison of cases under various inlet air velocities.
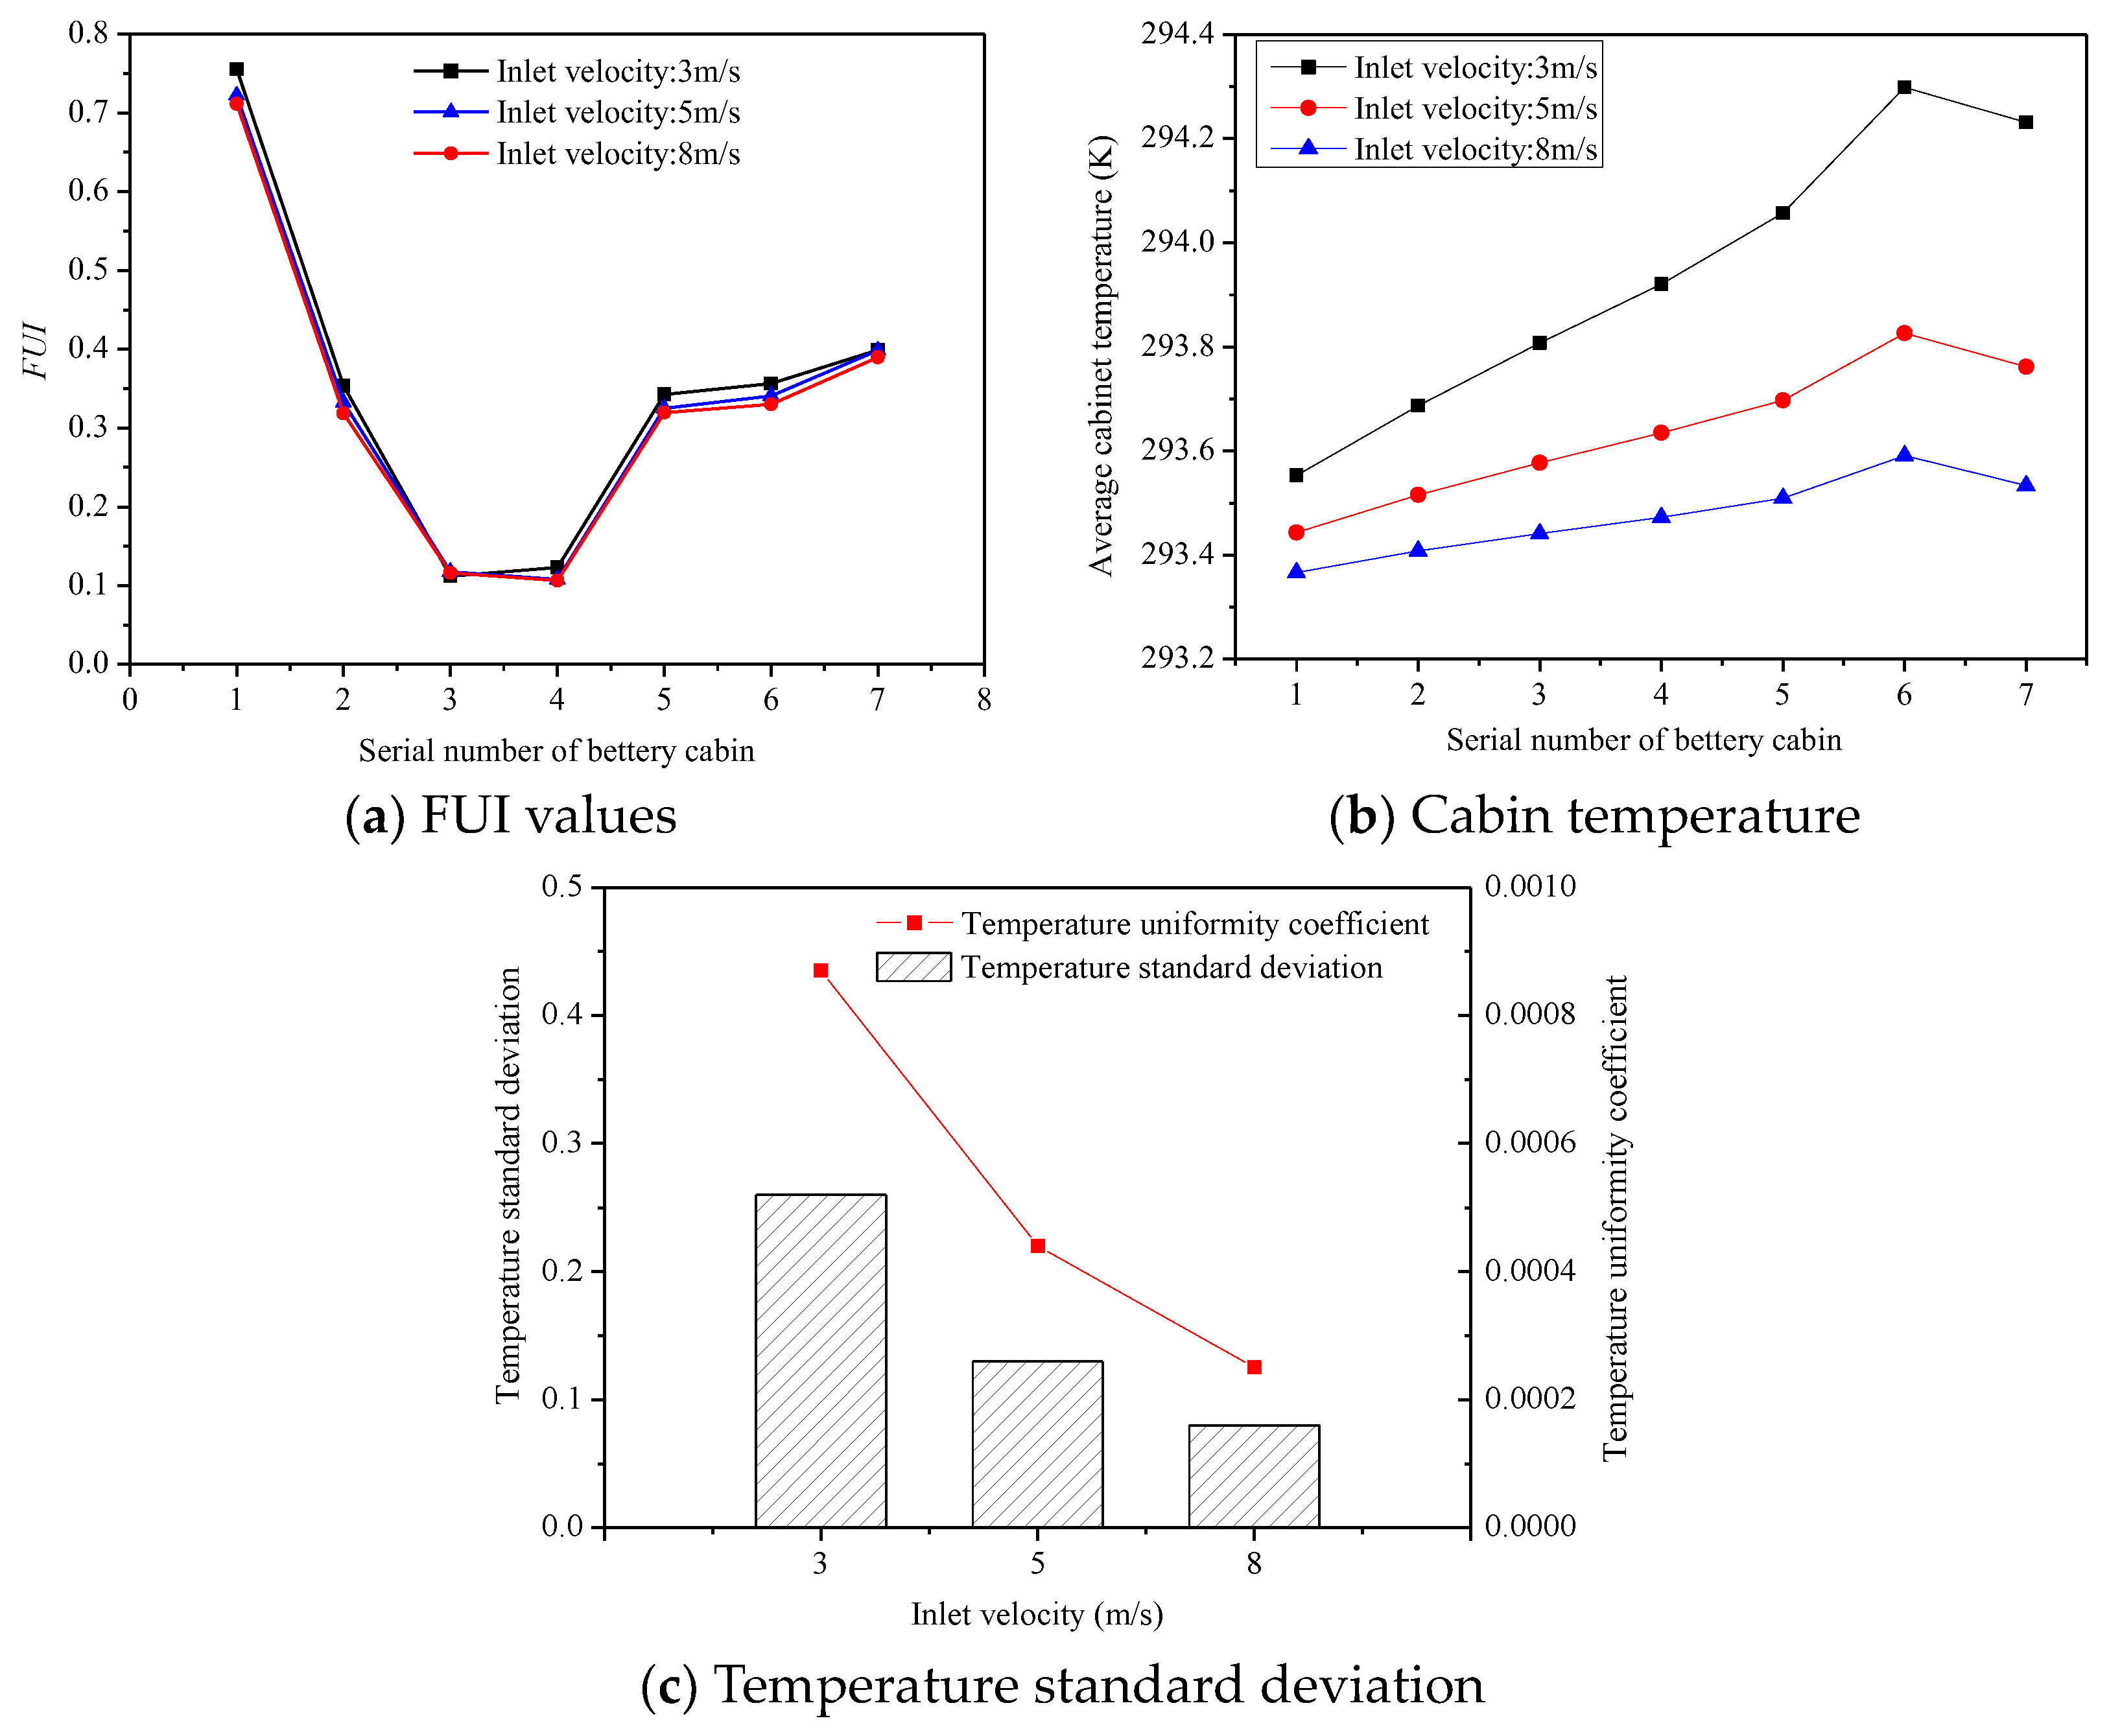
Figure 12.
Comparison of cases at different charge–discharge ratios.
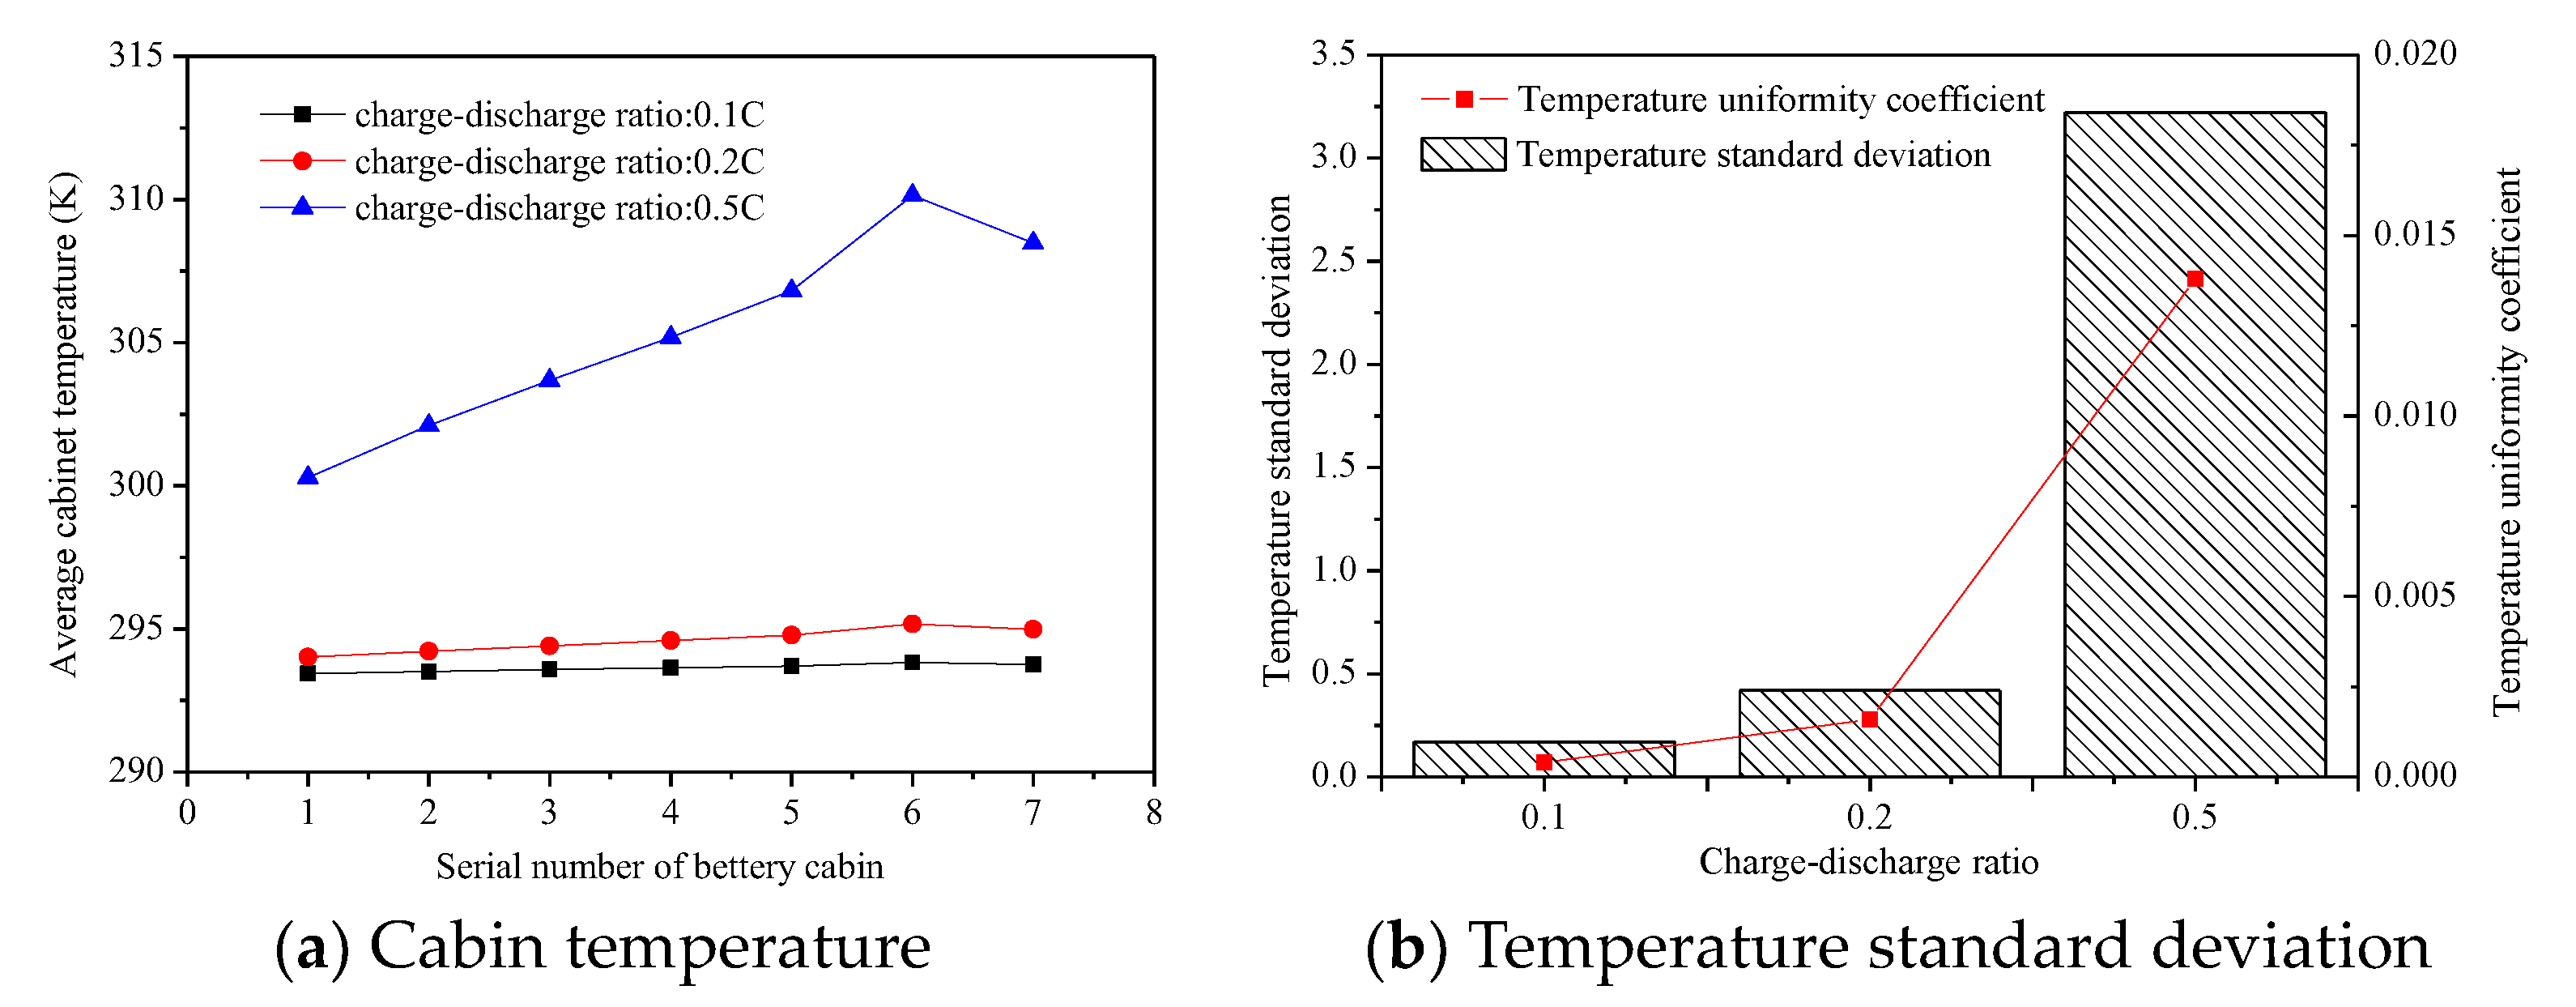
Figure 13.
Schematic diagram of the flow line of the cabinet with heat exchanger in the middle.

Figure 14.
Temperature and velocity cloud image of the heat exchanger in the middle of the cabinet.
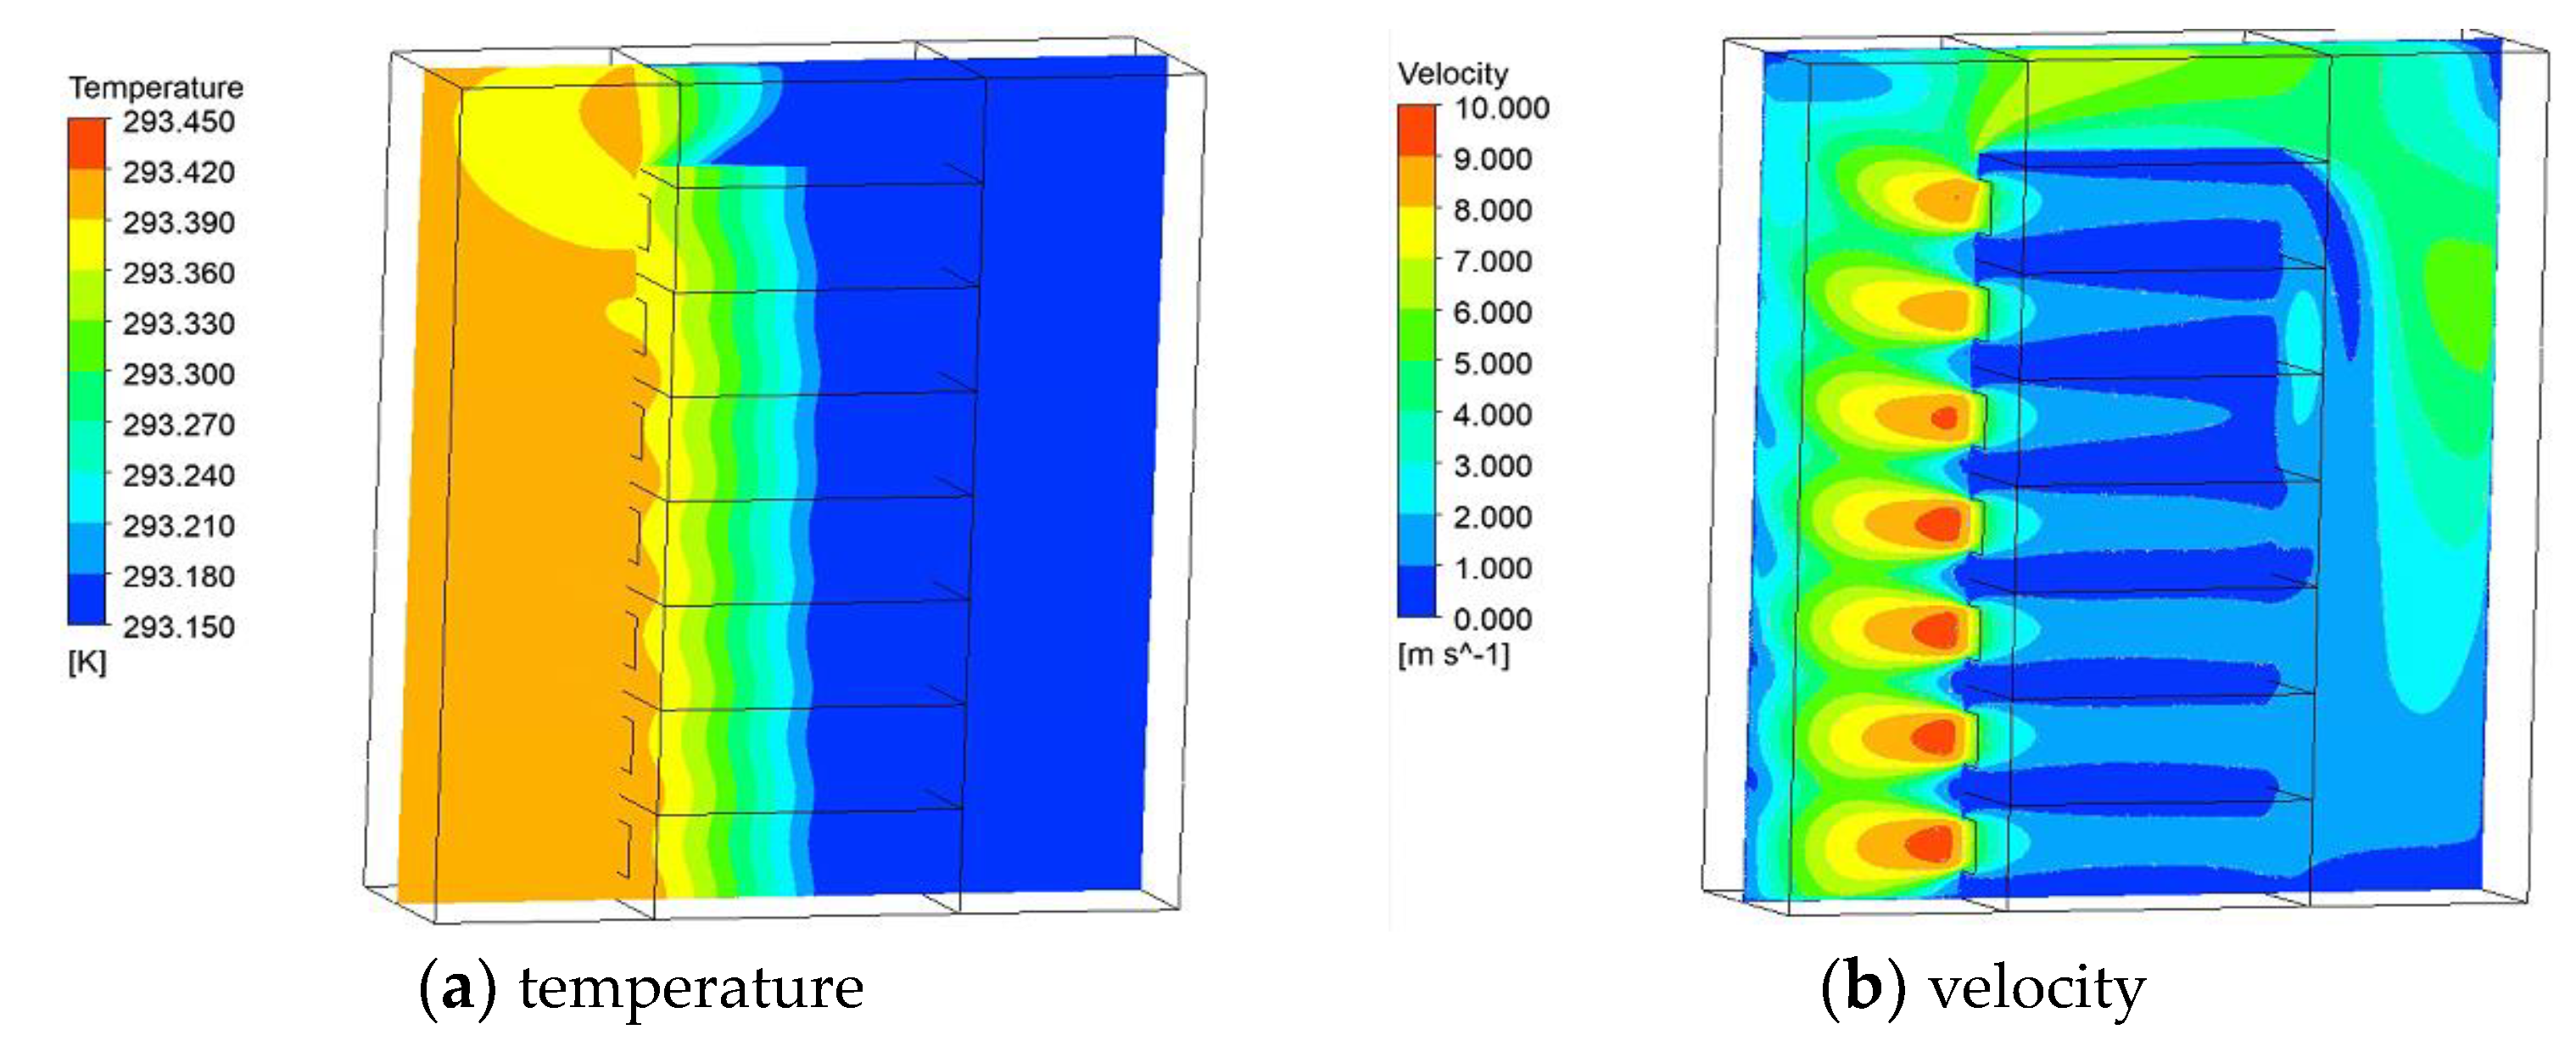
Figure 15.
Schematic diagram of the streamline the cabinet with heat exchanger at the bottom.
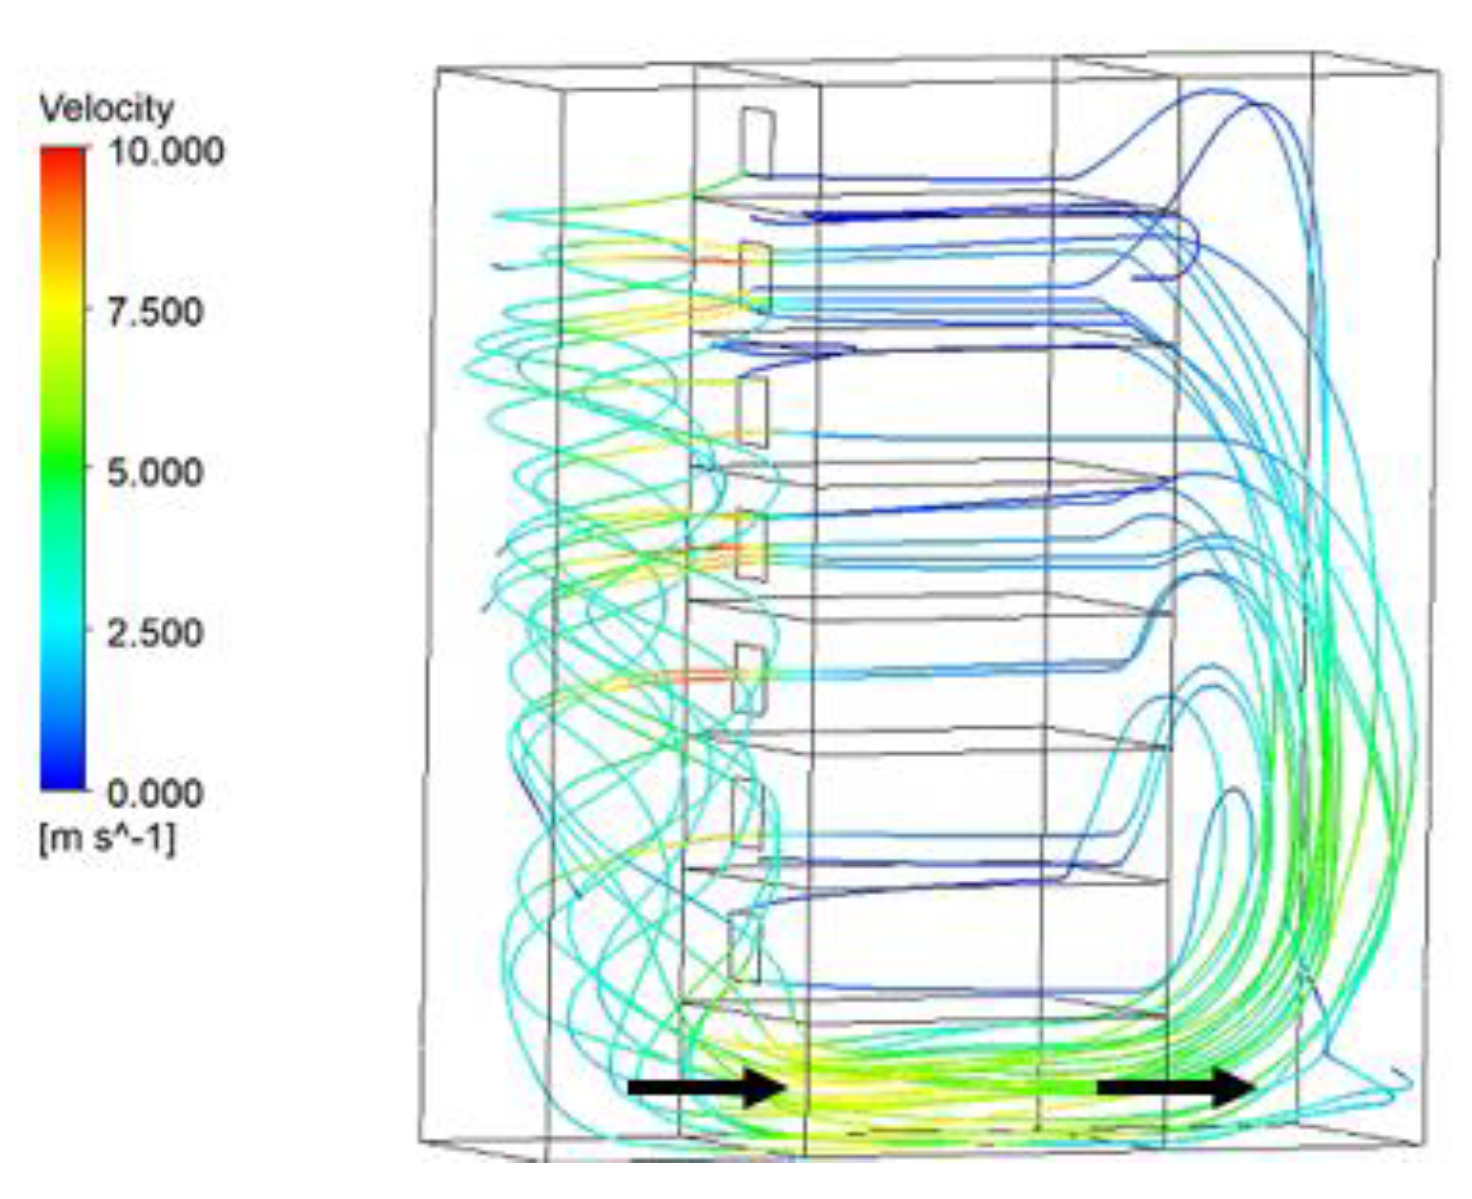
Figure 16.
Comparison of cases with different heat exchanger layouts.
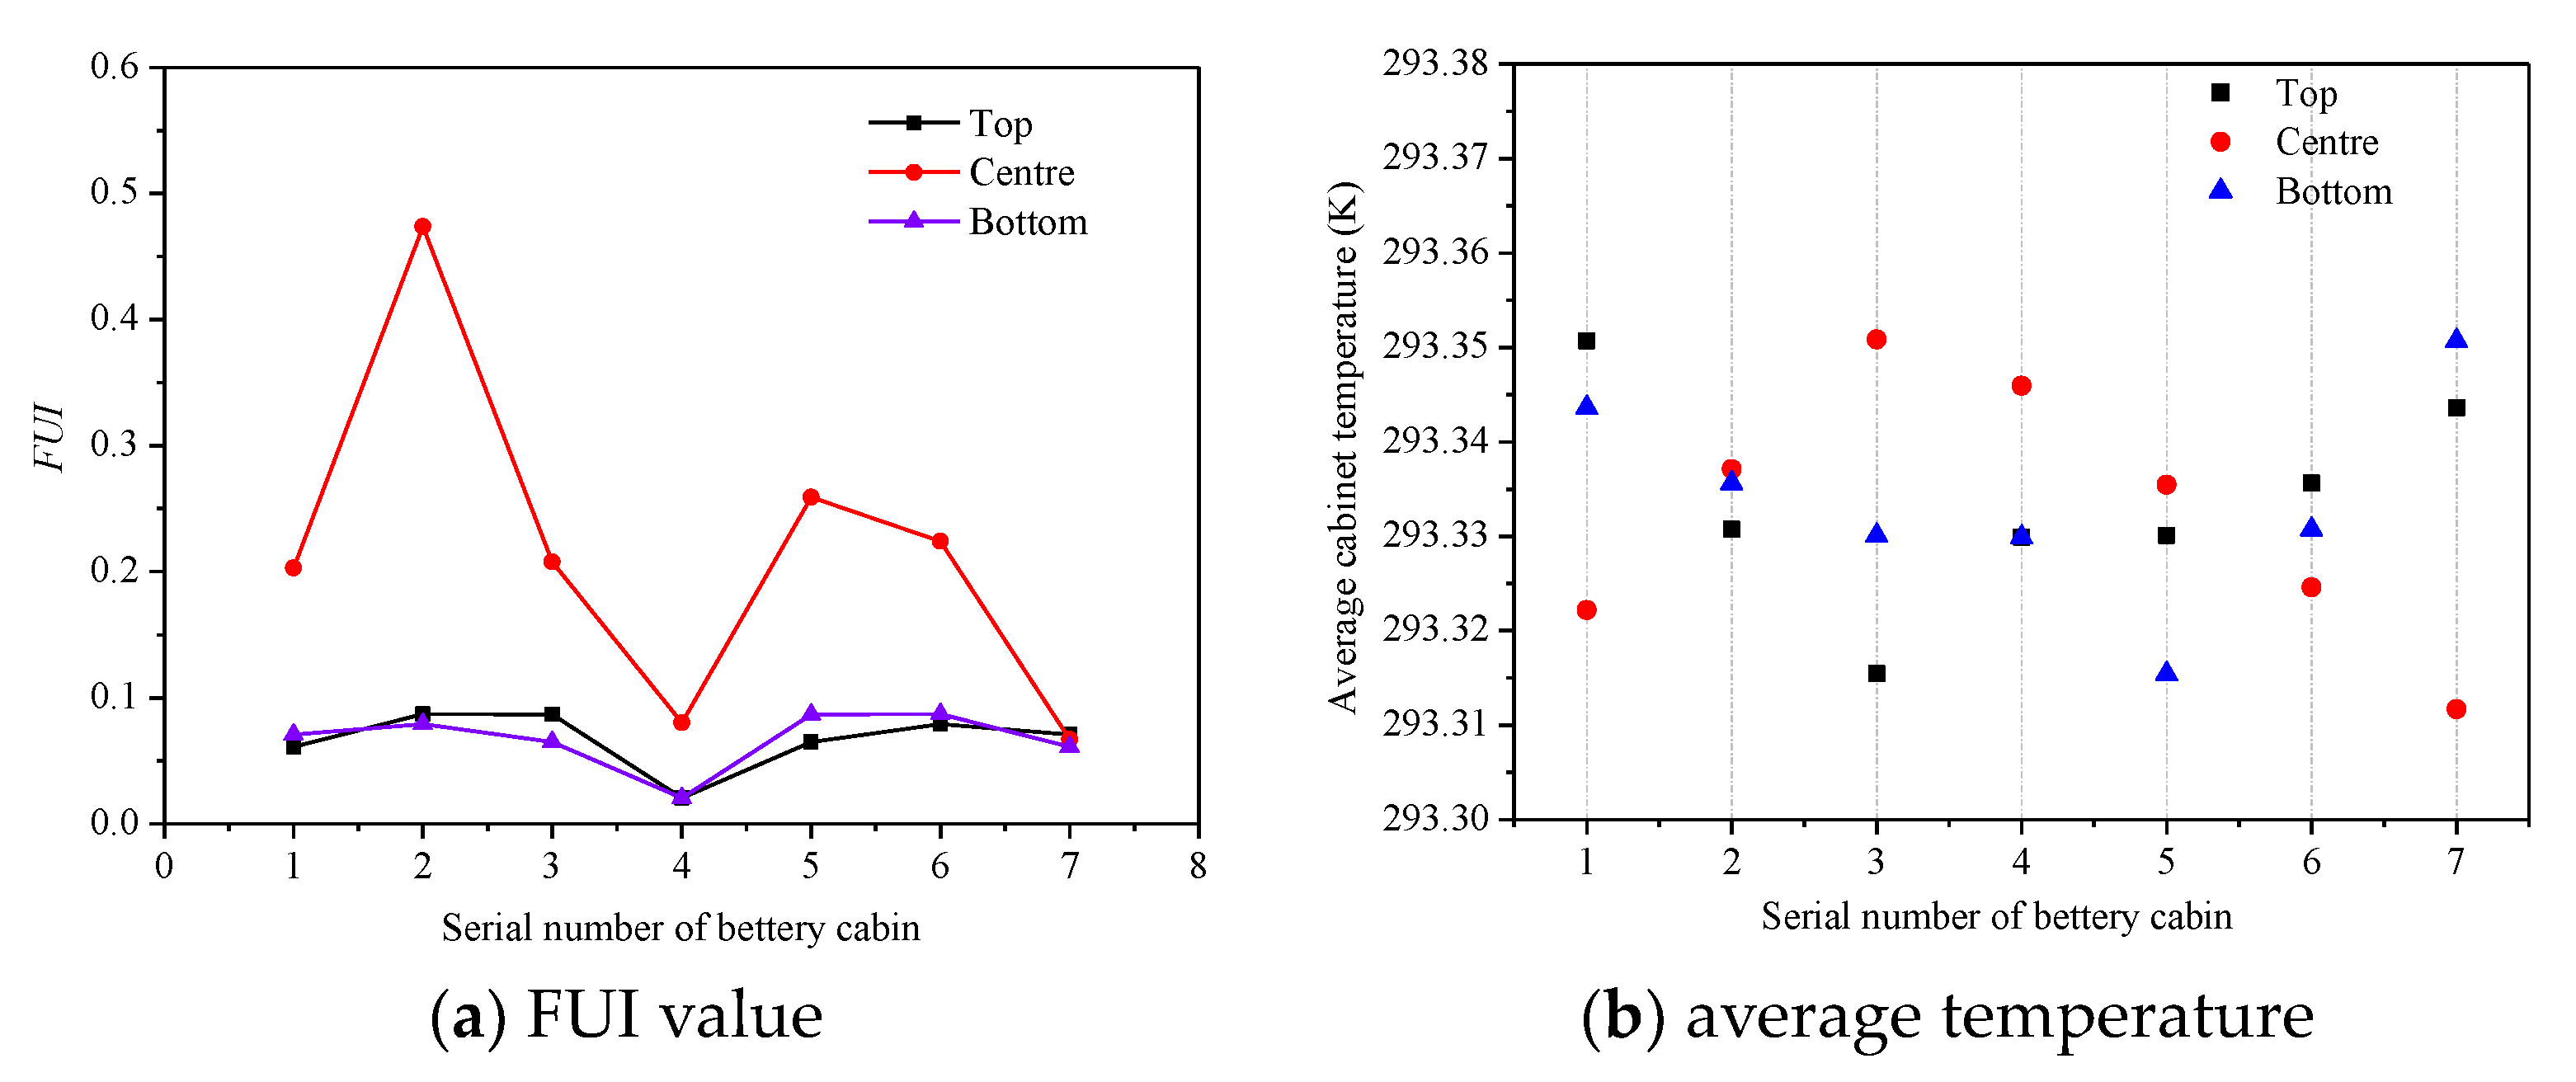
Figure 17.
Schematic diagram of a volute shape cabinet with a heat exchanger in the middle position.
Figure 17.
Schematic diagram of a volute shape cabinet with a heat exchanger in the middle position.
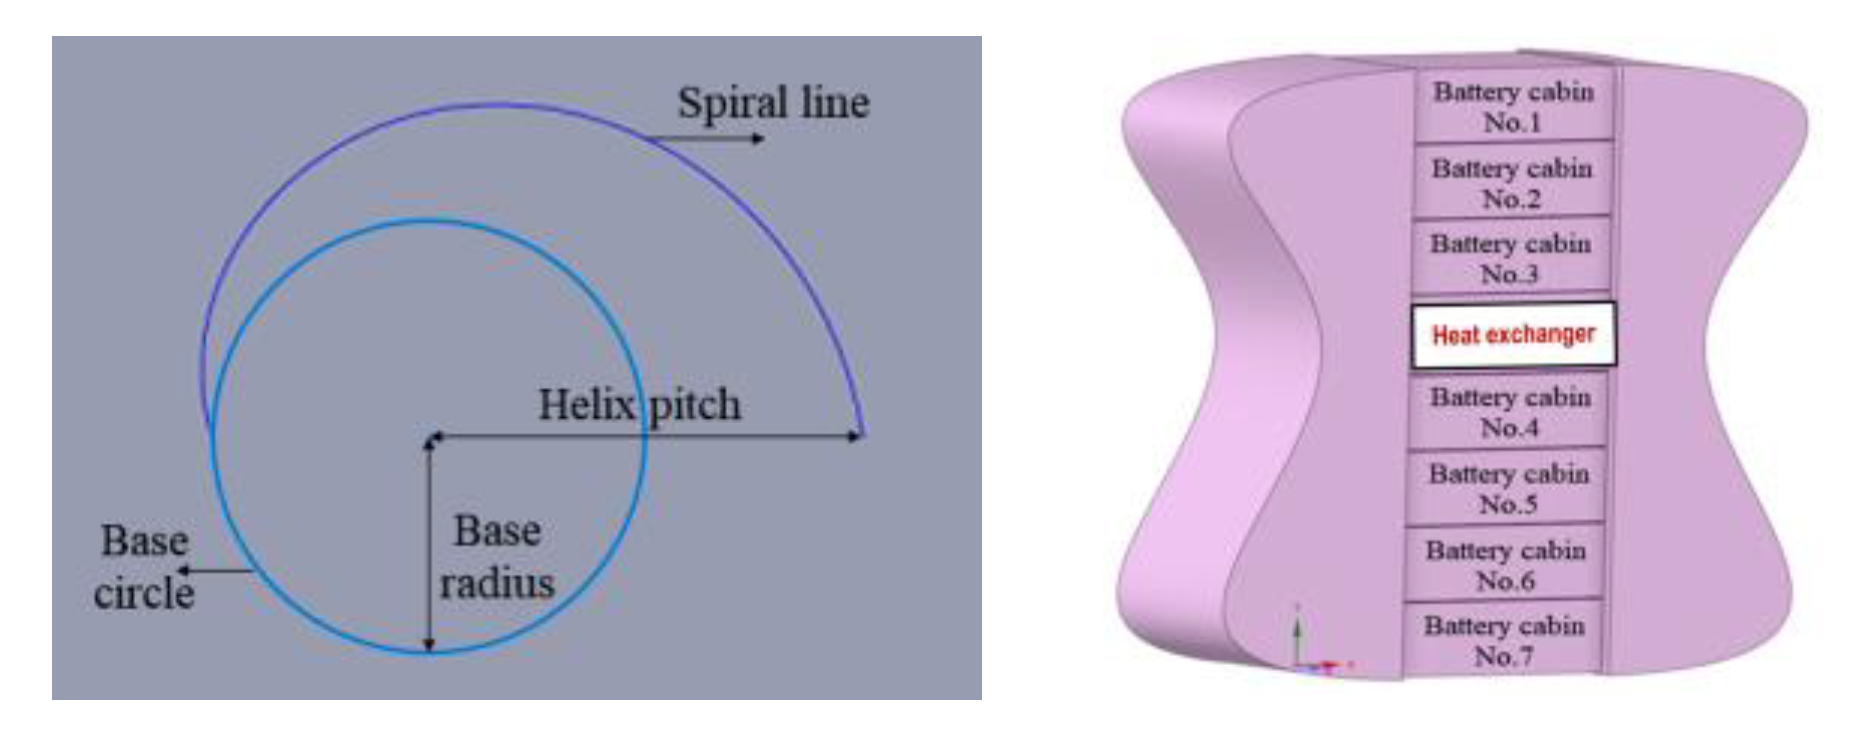
Figure 18.
Comparison of streamlines in rectangular and volute cabinets.
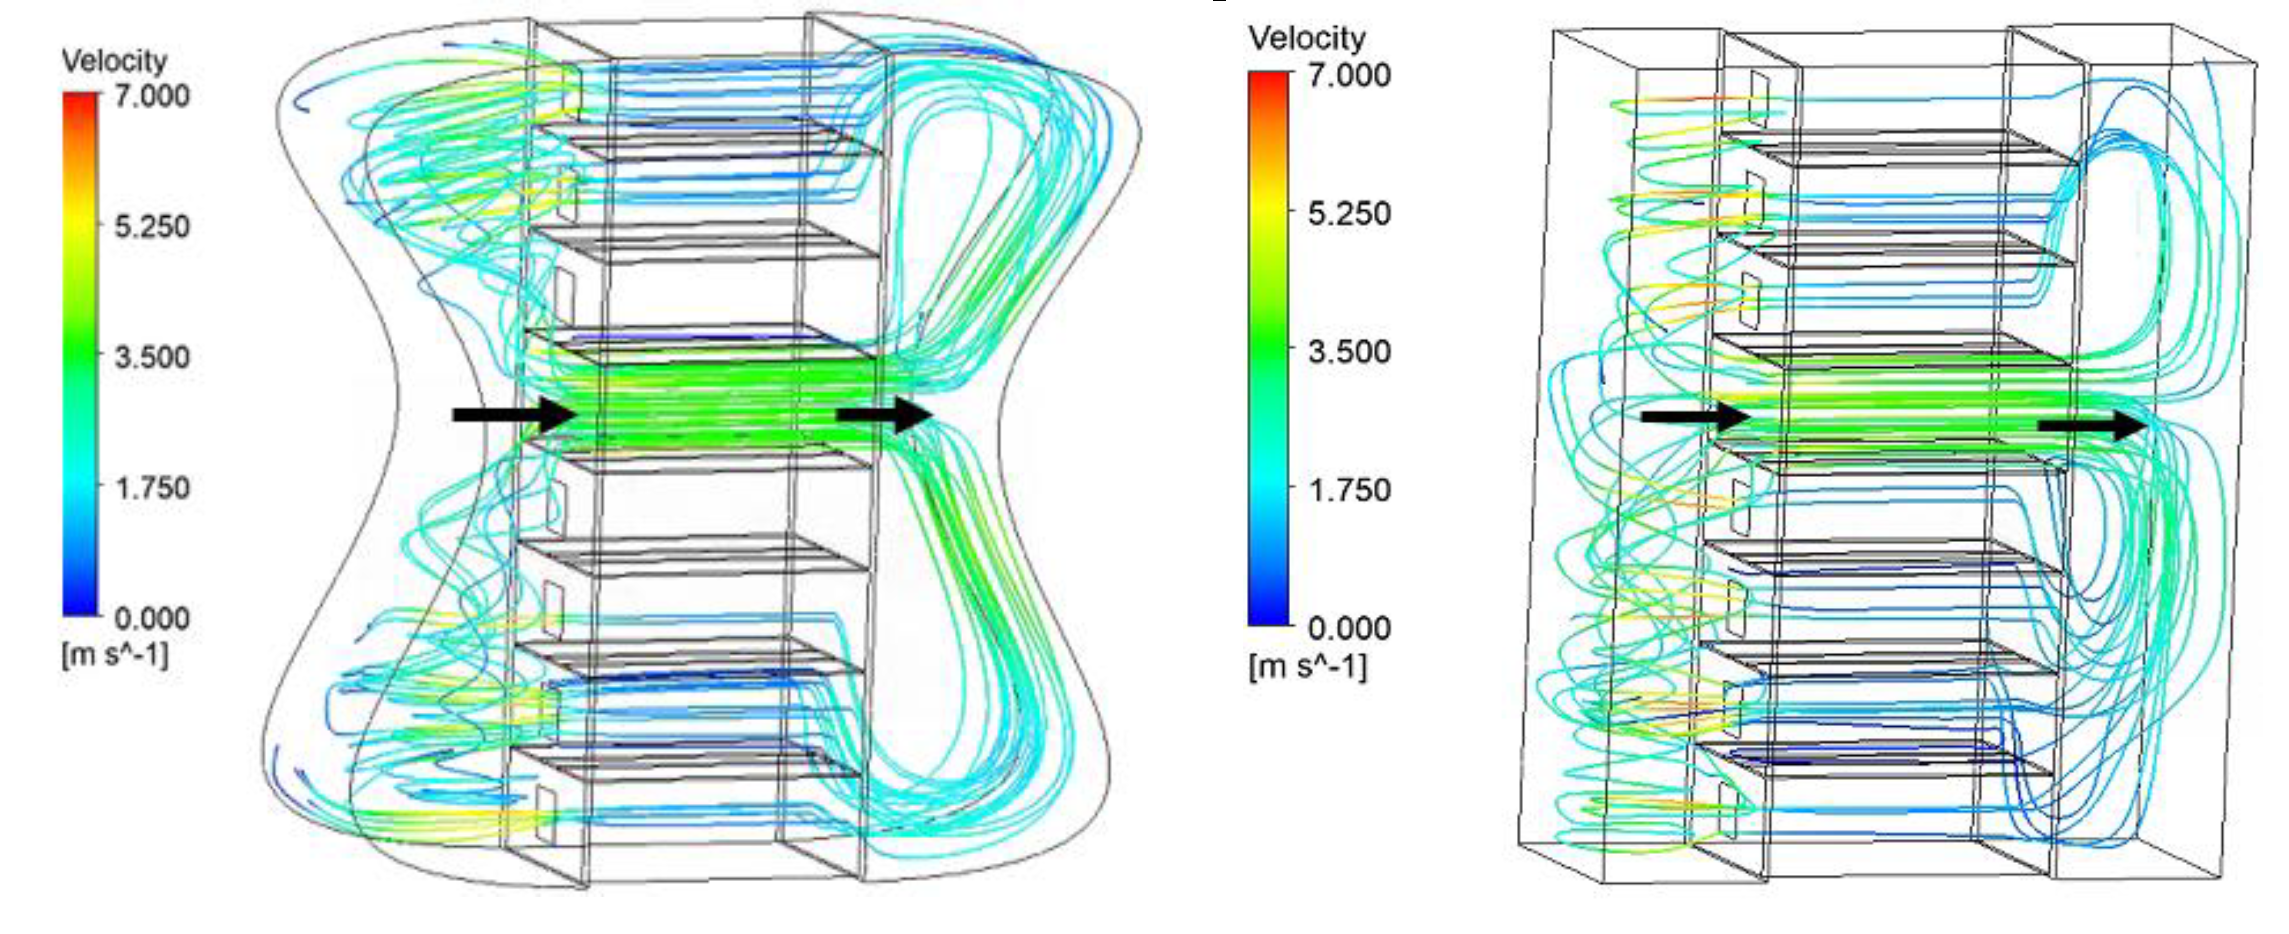
Figure 19.
Comparison of PEUI and FUI values of two closed cabinet models.

Table 1.
Battery layout variable parameters.
| Term | A Column Spacing Lx/mm | B Linespacing Ly/mm | C Number of Columns Nx | D Number of Rows Ny |
|---|---|---|---|---|
| Variables | A1: 15-30-15 | B1: 20 | C1: 2 | D1: 2 |
| A2: 30-60-30 | B2: 40 | C2: 3 | D2: 3 | |
| A3: 45-90-45 | B3: 60 | C3: 4 | D3: 4 | |
| L3 × 4 table array | ||||
| 1 | A1 | B1 | C1 | D1 |
| 2 | A1 | B2 | C2 | D2 |
| 3 | A1 | B3 | C3 | D3 |
| 4 | A2 | B1 | C2 | D3 |
| 5 | A2 | B2 | C3 | D1 |
| 6 | A2 | B3 | C1 | D2 |
| 7 | A3 | B1 | C3 | D2 |
| 8 | A3 | B2 | C1 | D3 |
| 9 | A3 | B3 | C2 | D1 |
Table 2.
Spiral setup for heat exchanger central arrangement.
| Spiral Position | Base Radius/mm | Helix Pitch/mm |
|---|---|---|
| Top | 300 | 400 |
| Centre | 100 | 200 |
| Bottom | 300 | 500 |
Table 3.
Comparison of the maximum temperature difference of battery cabins between two closed cabinet models.
Table 3.
Comparison of the maximum temperature difference of battery cabins between two closed cabinet models.
| Battery Cabin Number | Wavy Cabinet ∆Tmax/K | Rectangular Cabinet ∆Tmax/K |
|---|---|---|
| 1 | 0.37 | 0.47 |
| 2 | 0.38 | 0.47 |
| 3 | 0.37 | 0.45 |
| 4 | 0.37 | 0.46 |
| 5 | 0.37 | 0.46 |
| 6 | 0.37 | 0.48 |
| 7 | 0.39 | 0.48 |
Disclaimer/Publisher’s Note: The statements, opinions and data contained in all publications are solely those of the individual author(s) and contributor(s) and not of MDPI and/or the editor(s). MDPI and/or the editor(s) disclaim responsibility for any injury to people or property resulting from any ideas, methods, instructions or products referred to in the content. |
© 2024 by the authors. Licensee MDPI, Basel, Switzerland. This article is an open access article distributed under the terms and conditions of the Creative Commons Attribution (CC BY) license (https://creativecommons.org/licenses/by/4.0/).
Share and Cite
MDPI and ACS Style
Dong, Y.; Ding, Y.; Elfeky, K.E.; Qi, Y.; Chu, W.; Wang, Q. Thermal Management for a Stadium Power Supply Container Using a Rack-Level Air Cooling Strategy. Energies 2024, 17, 1654. https://doi.org/10.3390/en17071654
AMA Style
Dong Y, Ding Y, Elfeky KE, Qi Y, Chu W, Wang Q. Thermal Management for a Stadium Power Supply Container Using a Rack-Level Air Cooling Strategy. Energies. 2024; 17(7):1654. https://doi.org/10.3390/en17071654
Chicago/Turabian StyleDong, Yue, Yi Ding, Karem Elsayed Elfeky, Yu Qi, Wenxiao Chu, and Qiuwang Wang. 2024. "Thermal Management for a Stadium Power Supply Container Using a Rack-Level Air Cooling Strategy" Energies 17, no. 7: 1654. https://doi.org/10.3390/en17071654
Note that from the first issue of 2016, this journal uses article numbers instead of page numbers. See further details here.