1. Introduction
In the future power supply of the grid, the proportion of fossil energy will gradually decrease. At the same time, renewable energy sources (volatile renewable energy sources), represented by wind and solar energy, have a lot of room for growth and will gradually replace traditional energy sources. Renewable energy itself has strong volatility and randomness, and the power generated by it relies on power electronic equipment to access the power grid. Power electronic equipment with low immunity, weak support, and zero inertia characteristics will make grid security and stability issues increasingly prominent, and the accumulation of quantitative changes may trigger qualitative changes in the operating characteristics of the grid.
The transformation of the power system requires policy support from governments, grid companies, and power generation companies. The introduction of relevant policies can accelerate the progress of this process. Plans formulated by governments and grid companies, such as grid parity prices and carbon tax subsidies, can speed up the integration of renewable energy technologies, improve the efficiency of system power generation, and hasten the transition of the power system [
1,
2].
To ensure the consumption of renewable energy generation, China’s National Development and Reform Commission (NDRC) issued the “Full Coverage Mandatory Acquisition Regulation for Renewable Energy Electricity Volume”. The regulation states that power grid companies and related electric power institutions must enhance the consumption and efficient utilization of renewable energy according to the relevant provisions of the renewable energy consumption guarantee mechanism while ensuring the safety of the power grid. The grid side must ensure the consumption of the guaranteed acquisition electricity volume of renewable energy generation projects; power dispatch institutions should formulate corresponding power dispatch plans to guarantee the priority dispatch of renewable energy generation.
Regarding the challenges that large-scale utilization of renewable energy poses to power grid systems, there have been demonstrations of application technologies related to large-scale renewable energy utilization and integrated energy systems. Among these, there have been some research achievements in areas such as offshore wind power [
3], renewable energy hydrogen production [
4], photovoltaic–thermal hybrid systems [
5], wind energy thermal utilization [
6], and wind–solar-storage integrated energy systems, where renewable energy serves as the main source of electricity and integrated with other energy sources. These developments pave the way for a new pattern of diversified utilization of new energy. Renewable energy technologies can also be integrated into sustainable buildings and urban environments to reduce dependence on fossil fuels. For example, distributed photovoltaics can reduce carbon emissions and improve energy efficiency and recycling [
7]. In addition, as China’s renewable energy technology develops, the government can accelerate the transition to a new type of power system and mitigate the impacts of climate change by formulating preferential policies related to renewable energy, promoting sustainable development of the economy and the environment [
8]. So, with the increase in the proportion of renewable energy, how can we ensure stable and efficient consumption? Is the ultimate goal to realize 100% renewable energy consumption? Where will the inflection point of system consumption occur?
Pumped storage stations, the most developed flexible energy source with outstanding peak shaving and valley filling capabilities [
9], can flexibly manage energy supply and demand [
10], which is essential for addressing the issue of wind and solar absorption and guaranteeing the secure and reliable functioning of the power system [
11]. The study of the optimal scheduling of a combined power generation system (CPGS) with participating pumped storage stations is now a hot topic [
12]. Most studies consider economic efficiency [
13], power quality [
14], and environmental impact [
15] to be the primary goals of the optimal scheduling issue.
When it comes to economic advantages, the goal function may be separated into three parts: the greatest comprehensive operational benefit [
16,
17], the lowest comprehensive operating cost [
18,
19,
20], and a thorough assessment of system coordination and economy [
21,
22]. In the context of power quality, the objective function typically pertains to minimizing the generalized load fluctuation and peak-valley difference of the residual load [
23] while simultaneously ensuring optimal power output stability [
11]. When the primary aim is to achieve environmental sustainability, the objective function primarily takes into account the cost of carbon emissions. In the context of multi-objective optimization, it is common practice to integrate several individual objectives, including but not limited to maximizing economic gains, optimizing power quality, minimizing carbon emissions, and reducing output fluctuations [
24,
25,
26,
27,
28]. The aforementioned scheduling models for pumped storage stations in the context of combined power generation system from diverse energy sources represent optimal solutions. The outcomes of these solutions demonstrate the significant contribution of pumped storage stations towards the optimization of combined power generation systems.
Considering the economic and low-carbon operation of the combined power generation system, the problem of renewable energy consumption is also a key issue in the development of the combined power generation system. In the future, the installed capacity of renewable energy will continue to increase, and the power grid operation will continue to increase the risks of large operation fluctuations, load reduction, and power rationing. There are two main reasons for the abandonment of renewable energy: firstly, the grid frame at the end of the power grid is blocked [
29], as the output of renewable energy exceeds the transmission capacity of the power grid. The second reason is that the peak regulation of the power supply end is blocked [
30], as the renewable energy output exceeds the maximum adjustment range of the system. At present, current research on reasonable energy consumption can be divided into two categories: one is to find the balance point between the cost and benefit of renewable energy consumption [
31], and the second goal is to minimize the consumption cost of renewable energy in the entire society [
32]. Due to abundant renewable energy resources and large installed capacity in northwest China, the energy-abandonment rate is relatively high [
33]. The energy-abandonment rate of wind and solar in Gansu Province was approximately 6% and 2%, respectively, in 2022.
The optimal operation of pumped storage power stations in a multi-energy combined generation system is significantly impacted by the randomness and volatility of the source-load side data during the optimization process. Therefore, when analyzing the flexible potential of pumped storage power stations, it is necessary to fully consider the randomness and fluctuation characteristics of wind power, photovoltaic power, and grid loads, as well as the energy-abandonment rate. Based on this, this article takes an energy base in the western region of China as the research object. The clustering analysis algorithm is used to extract the characteristics of the year-round source load side data of the base. On this basis, a multi-objective optimization scheduling model is developed considering the minimum load fluctuation, total operating cost, and carbon emissions of the combined power generation system. Reasonable energy-abandonment operation of the combined power generation system is analyzed with ultra-high proportion of renewable energy.
The remainder of the study is structured as follows.
Section 2 presents the processing of typical daily source-load data for an energy base in the western region of China by the K-means algorithm;
Section 3 introduces the modeling of the combined power generation system considering the constraints and objective functions;
Section 4 provides the calculation method of reasonable energy-abandonment and the system simulations;
Section 5 presents the conclusions and future work.
2. The Selection of a Typical Day Using the K-Means Algorithm
The K-means algorithm is one of the most widely used clustering algorithms, which has the advantage of dividing the input unknown data set into multiple categories according to its internal data characteristics and has the advantage of fast convergence when searching for the local optimal solution. The traditional K-means algorithm needs to set the clustering number k in advance according to the characteristics of the required data. Therefore, this paper selects the point with the largest initial data density of each quarter as the initial clustering center; the points that are farthest from the initial cluster center and satisfy the density condition are selected as the cluster center by iterative calculation. Therefore, this paper intends to use the K-means algorithm to classify historical data affected by the seasonal variation factors of wind power and photovoltaic output. Additionally, the typical days of their output are screened.
Due to the seasonal characteristics of wind power, photovoltaic power, and load, the randomness and peak shaving characteristics of wind power are significant. The correlation between solar radiation and photovoltaic output is strongest. The daily output is relatively regular, and the load demand in winter and summer is relatively high, with consistent changes in output patterns across different seasons. To effectively capture seasonal features and generate representative typical scenes for the energy base in the western region of China, this article uses the K-means algorithm to divide the scenery and solar output scenes of the four seasons into four groups. The typical days for spring, summer, autumn, and winter are April 17, July 26, October 16, and January 17, respectively.
Figure 1 shows the average daily load curve and solar output curve obtained based on clustering technology. In terms of photovoltaic resources, autumn is particularly abundant. Output began to rise around 8 am, peaked around 1 pm, and reached its lowest point around 6 pm. This model highlights the significant stability and elasticity of output. Compared to photovoltaic resources, wind power generation exhibits significant changes, with significant differences between seasons and throughout the day. Peak production was observed in the early morning (0 am to 3 am) and afternoon of summer. In other seasons, this pattern is relatively consistent, reaching its peak at midnight, followed by a decrease in intensity. It is worth noting that wind power generation exhibits an anti-peak characteristic, with the lowest generation around noon, which is in stark contrast to solar power generation.
As depicted in
Figure 1b, a notable nonlinear correlation exists between the daily load across different seasons. The average daily load consistently surpasses 1100 MWh for all seasons at this stage. Notably, during the early hours of the day, the load is minimized, bottoming out around 7 am in spring. Contrary to the trend in the early morning, as the daily average load production nears 1300 MWh, the total daily load starts its ascent as morning progresses. This represents a 7% increase from the early morning demand. By the afternoon, the daily load exhibits fluctuations, initially declining and then climbing, with the average daily load remaining relatively stable compared to the morning values. Come evening, there is a pronounced upward trajectory for the daily load in each season, culminating at its zenith around 7 pm. Specifically, the autumn output peaks at approximately 1362 MWh at 19:00.
Upon conducting a macroscopic evaluation, it has been observed that the disparity between the peak and trough in typical daily load profiles is most pronounced during the summer months. Correspondingly, the pattern of counter-peak regulation by wind power generation is distinctly more evident in this season. This trend is accompanied by a more robust complementarity between wind and solar energy outputs. Consequently, the energy modulation efficacy of pumped storage is markedly enhanced under such typical daily conditions. In light of these findings, this research will pivot towards an in-depth analysis of representative summer daily load demands and the corresponding wind and solar energy production data to further elucidate this phenomenon.
4. Ultra-High Proportion Renewable Energy Access System
4.1. Calculation Method of Reasonable Energy-Abandonment
This study utilizes the pertinent parameters of the energy base in the western region of China as the foundation for analysis. The pumped storage station is equipped with four reversible pump turbine units that have a power rating of 300 MW. On average, this power station has a water-to-electricity conversion efficiency of 75%.
In the future, with the explosive growth of renewable energy installations, the high proportion of renewable energy and the withdrawal of traditional energy sources will exacerbate the difficulties in grid operation, transmission, and dispatch. The energy-abandonment rate of renewable energy will also rise further. Therefore, reducing the energy-abandonment rate and improving the stability of power grid operation by allocating reasonable peak shaving capacity have become key issues.
It is important to calculate the comprehensive cost curve between the power source and both sides of the power grid under different energy-abandonment rates. When the renewable energy generation on the power supply side remains constant, the system primarily increases the output of renewable energy by increasing its installed capacity. When the grid side’s consumption capacity for renewable energy generation remains stable, the main approach is to improve the grid structure and introduce new peak-shaving power sources to reduce the energy-abandonment rate. The current phase marks the early transition to a new type of power system characterized by a relatively small installed capacity of renewable energy on the power supply side. As the installed capacity of renewable energy increases in the future, the cost on the source side shows an exponential upward trend. Due to the introduction of flexible adjustable power sources in the early stage, the construction investment cost on the power grid side is relatively high. Therefore, as the energy-abandonment rate increases, the cost decrease shows a rapid to gradual trend. The comprehensive cost curve roughly presents a “concave” shape, and its valley value corresponds to the reasonable energy-abandonment rate of the combined power generation system.
The comprehensive cost composition of the system considered in this article is shown in
Figure 3. The schematic diagram of reasonable energy-abandonment points for the combined power generation system under different energy-abandonment rates is shown in
Figure 4.
This section considers the cost balance between the power source side and the grid side as the energy-abandonment rate point for the combined power generation system, and its expression is as follows.
In the formula, is the minimum value of the comprehensive cost of the system. In other words, within the function that describes the relationship between the energy-abandonment rates and the comprehensive cost, the obtained minimum value of the integrated cost corresponds to the most reasonable energy-abandonment rate ; represents energy-abandonment rate; is the functional relationship between the energy-abandonment rate and the comprehensive cost.
The development cost of source side energy mainly includes the daily average investment in renewable energy installation
, the daily operating cost of the system under different energy-abandonment rates
, and the cost of new energy construction
.
The investment in renewable energy installation is the daily average of the annual value of renewable energy investment, calculated at USD 980/kW for wind power and USD 588/kW for photovoltaic power, respectively.
In the formula, represents wind power, and photovoltaic power , , , are investment, withdrawal rate, operating years, and annual operating days.
To improve system consumption on the grid side, it is necessary to consider the cost of a newly built pumped storage power plant to solve system peak shaving problems,
$.
is the pumping cost of pumped storage power plants during peak shaving,
$.
is the coal cost of thermal power plants participating in peak shaving,
$.
is the flexibility transformation cost of existing thermal power plants,
$, and
is the network optimization cost of the power grid to enhance transmission capacity,
$.
The development of the pumped storage power station will serve the renewable energy base in the western region of China. In the future, it is necessary to study how to optimize the operation of pumped storage as a regulating power source for combined power generation systems and how to carry out reasonable energy abandonment in the case of an ultra-high proportion of new energy access.
4.2. Reasonable Energy-Abandonment Operation of the System
According to the development requirements of the renewable energy base in the western region of China, the access system for thermal power and the pumped storage power station is set with the same capacity and regulation capacity, and the penetration rate of renewable energy is over 50%. This means studying the consumption problem of ultra-high proportion renewable energy access systems when the peak shaving power capacity is constant. Under the condition of limited peak shaving power supply, as the penetration rate of renewable energy continues to increase, considering both sides of source and grid, and considering the issue of reasonable energy-abandonment rate, the impact of the proportion of renewable energy connected to the system and the energy-abandonment rate on the cost of the combined power generation system is studied. The capacity of connected renewable energy is set as shown in
Table 1.
For the combined power generation system with an ultra-high proportion of renewable energy integration, different energy-abandonment rates are set for each scenario, and the daily scheduling curve of each scenario is shown in
Figure 5.
Figure 5a–e shows the daily optimization scheduling results of these scenarios (1–5% energy-abandonment rate), where the system mainly increases the output of renewable energy by increasing the installed capacity of renewable energy. As the installed capacity of renewable energy on the source side continues to increase, the energy-abandonment rate also increases. From the overall analysis of
Figure 5, it can be concluded that when the penetration rate of renewable energy reaches over 50%, the conventional thermal power units connected to the system have been operating smoothly at the minimum output, while a high proportion of renewable energy connected to the system makes the thermal power units in the base load operation state. The system prioritizes the use of pumped storage units for peak shaving. As the penetration rate of renewable energy continues to increase, the capacity of pumped storage units participating in peak shaving also increases. The pumped storage units are in deep peak shaving mode to promote the consumption of high proportion renewable energy.
From
Figure 5a, it can be seen that when the renewable energy penetration rate is around 50%, the typical daytime and evening wind power output on this typical day is relatively high. Therefore, the pumped storage units store energy at 15:00, 17–19:00, and 22:00, respectively, and the units start and stop five times a day, which is relatively frequent. From
Figure 5b, it can be seen that when the wind and solar penetration rate is around 60%, the storage capacity of the pumped storage unit is about twice that of the penetration rate of 50%, the number of starts and stops of the pumped storage unit’s output is significantly reduced, and the output of the peak shaving power supply is also more stable. From
Figure 5c–e, it can be seen that when the penetration rate of renewable energy is around 70% and a very high proportion is connected to the system due to the extremely high proportion of wind and solar installed capacity, when the user’s load demand remains unchanged, only the output of renewable energy can be met. Therefore, the pumped storage unit approaches the full power state when pumping and storing energy.
The relationship between daily operation cost and energy-abandonment rate can be calculated according to the system’s daily dispatching results, as shown in
Figure 6.
From
Figure 6, the operating cost increases with the increase in the energy-abandonment rate under the same installed capacity conditions. However, as the proportion of renewable energy access continues to increase, the daily operating cost of the system decreases by 40% compared to the initial scenario when the penetration rate of renewable energy reaches over 70%. Moreover, when the penetration rate of renewable energy in the system increases from 60% to 70%, the operating cost decreases the fastest. When the penetration rate of renewable energy in the system reaches over 70%, the impact of directly reducing the operating cost of the source side by increasing the installed capacity of renewable energy is relatively small. Therefore, when the penetration rate of renewable energy is between 60 and 70%, from the perspective of the power source side, the operating cost changes within a large range and the growth of renewable energy installation has a significant impact on the system operation. Under the same energy-abandonment rate, the daily operating cost decreases with the increase of renewable energy penetration rate.
According to research on the daily operating cost of the source side, there is a reasonable energy-abandonment interval. To further determine its accuracy, a reasonable energy-abandonment rate is introduced to predict the impact of future renewable energy penetration rates on the power generation system. A reasonable energy-abandonment rate is beneficial for reducing system consumption costs and improving system energy utilization efficiency. According to research calculations on the planned renewable energy installed capacity in 2025, the wind curtailment rate in the western region of China has decreased from 8.6% in 2020 to 7.8% in 2025 [
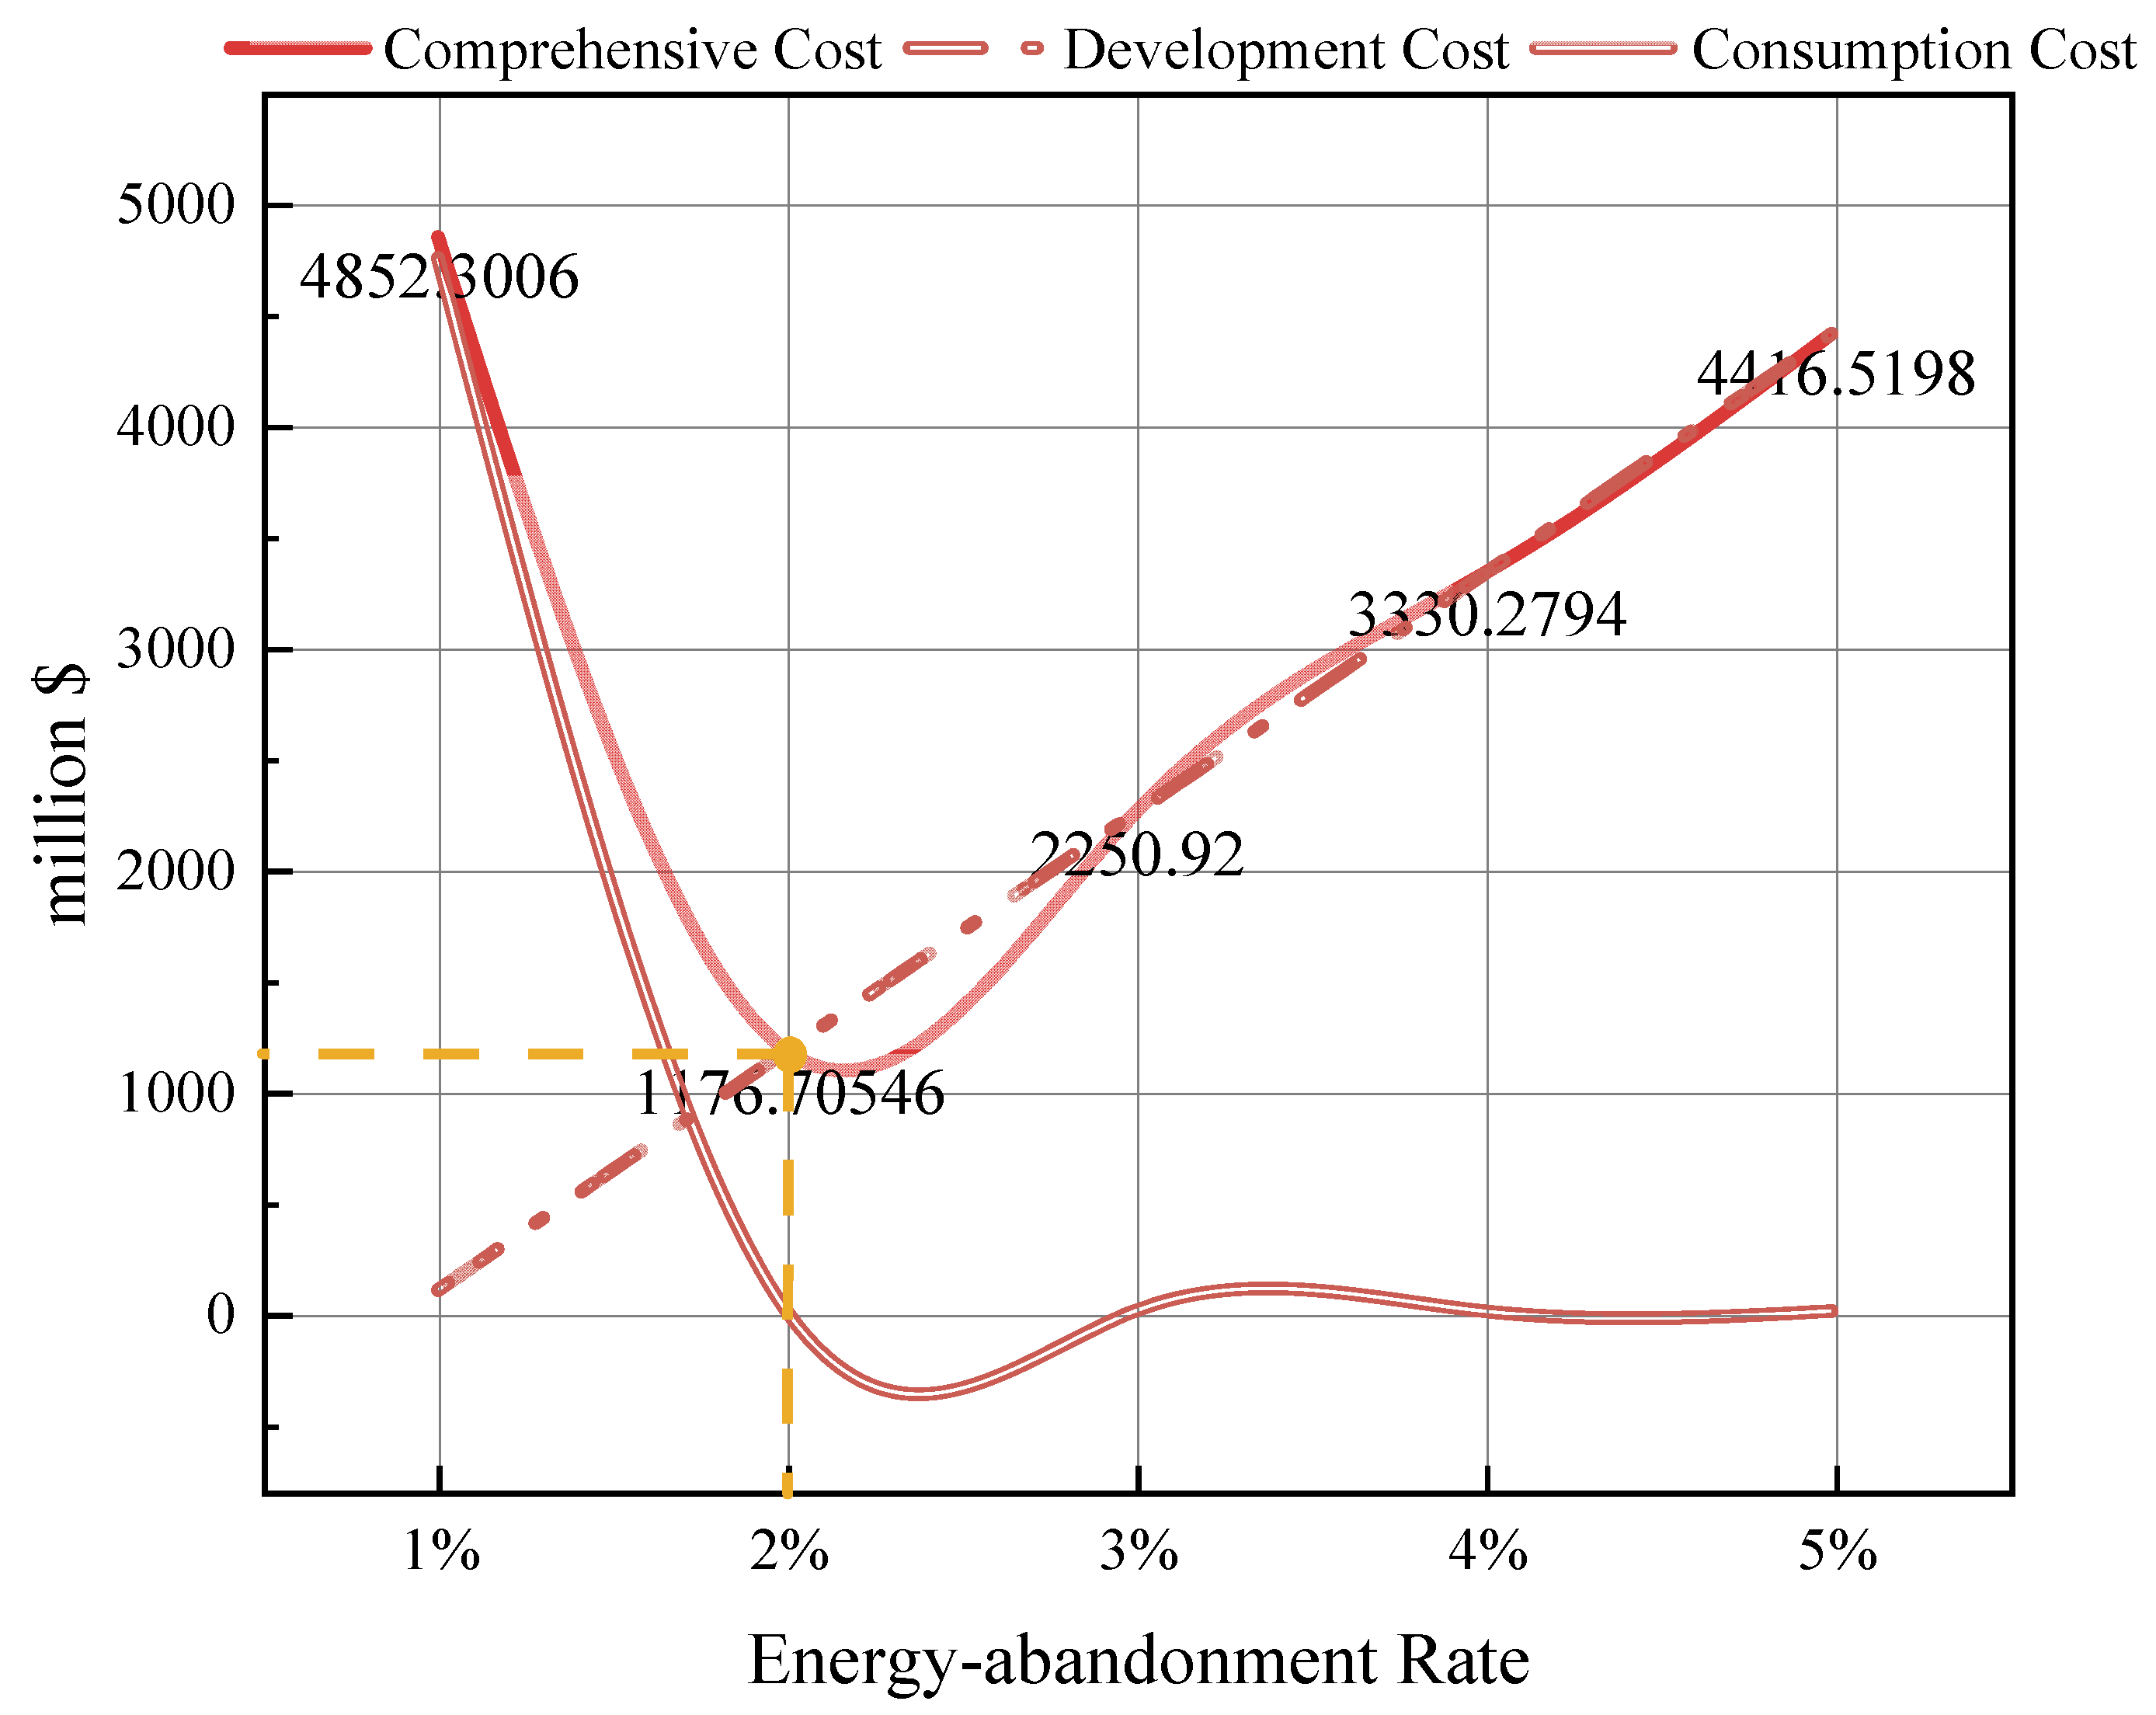
25]. According to statistics from the National Energy Administration, the wind curtailment and light curtailment rates in the western region of China in 2022 were 6% and 2%, respectively. This article studies the reasonable energy-abandonment rate of the combined power generation system when the energy-abandonment rate is within 1~5%. The curves for calculating the system power side cost, grid side cost, and system comprehensive cost are shown in
Figure 7.
From
Figure 7, the trend of the three sets of cost curves is basically consistent with the trend in the schematic diagram (in
Figure 4). Among them, the newly installed cost of renewable energy on the power side shows a linear increase with the continuous increase of the energy-abandonment rate. The cost of renewable energy consumption on the grid side has shown a sharp downward trend due to the lack of new flexible adjustable power sources in the system. The lowest point of the total cost curve is the energy-abandonment rate of 2%, which is within the range of 1% to 5% in this study. When the energy-abandonment rate is 2%, the combined power generation system is considered the lowest comprehensive cost on both sides of the source and grid, which is USD 11.77 million, of which the daily operating cost of the system is USD 0.87 million.
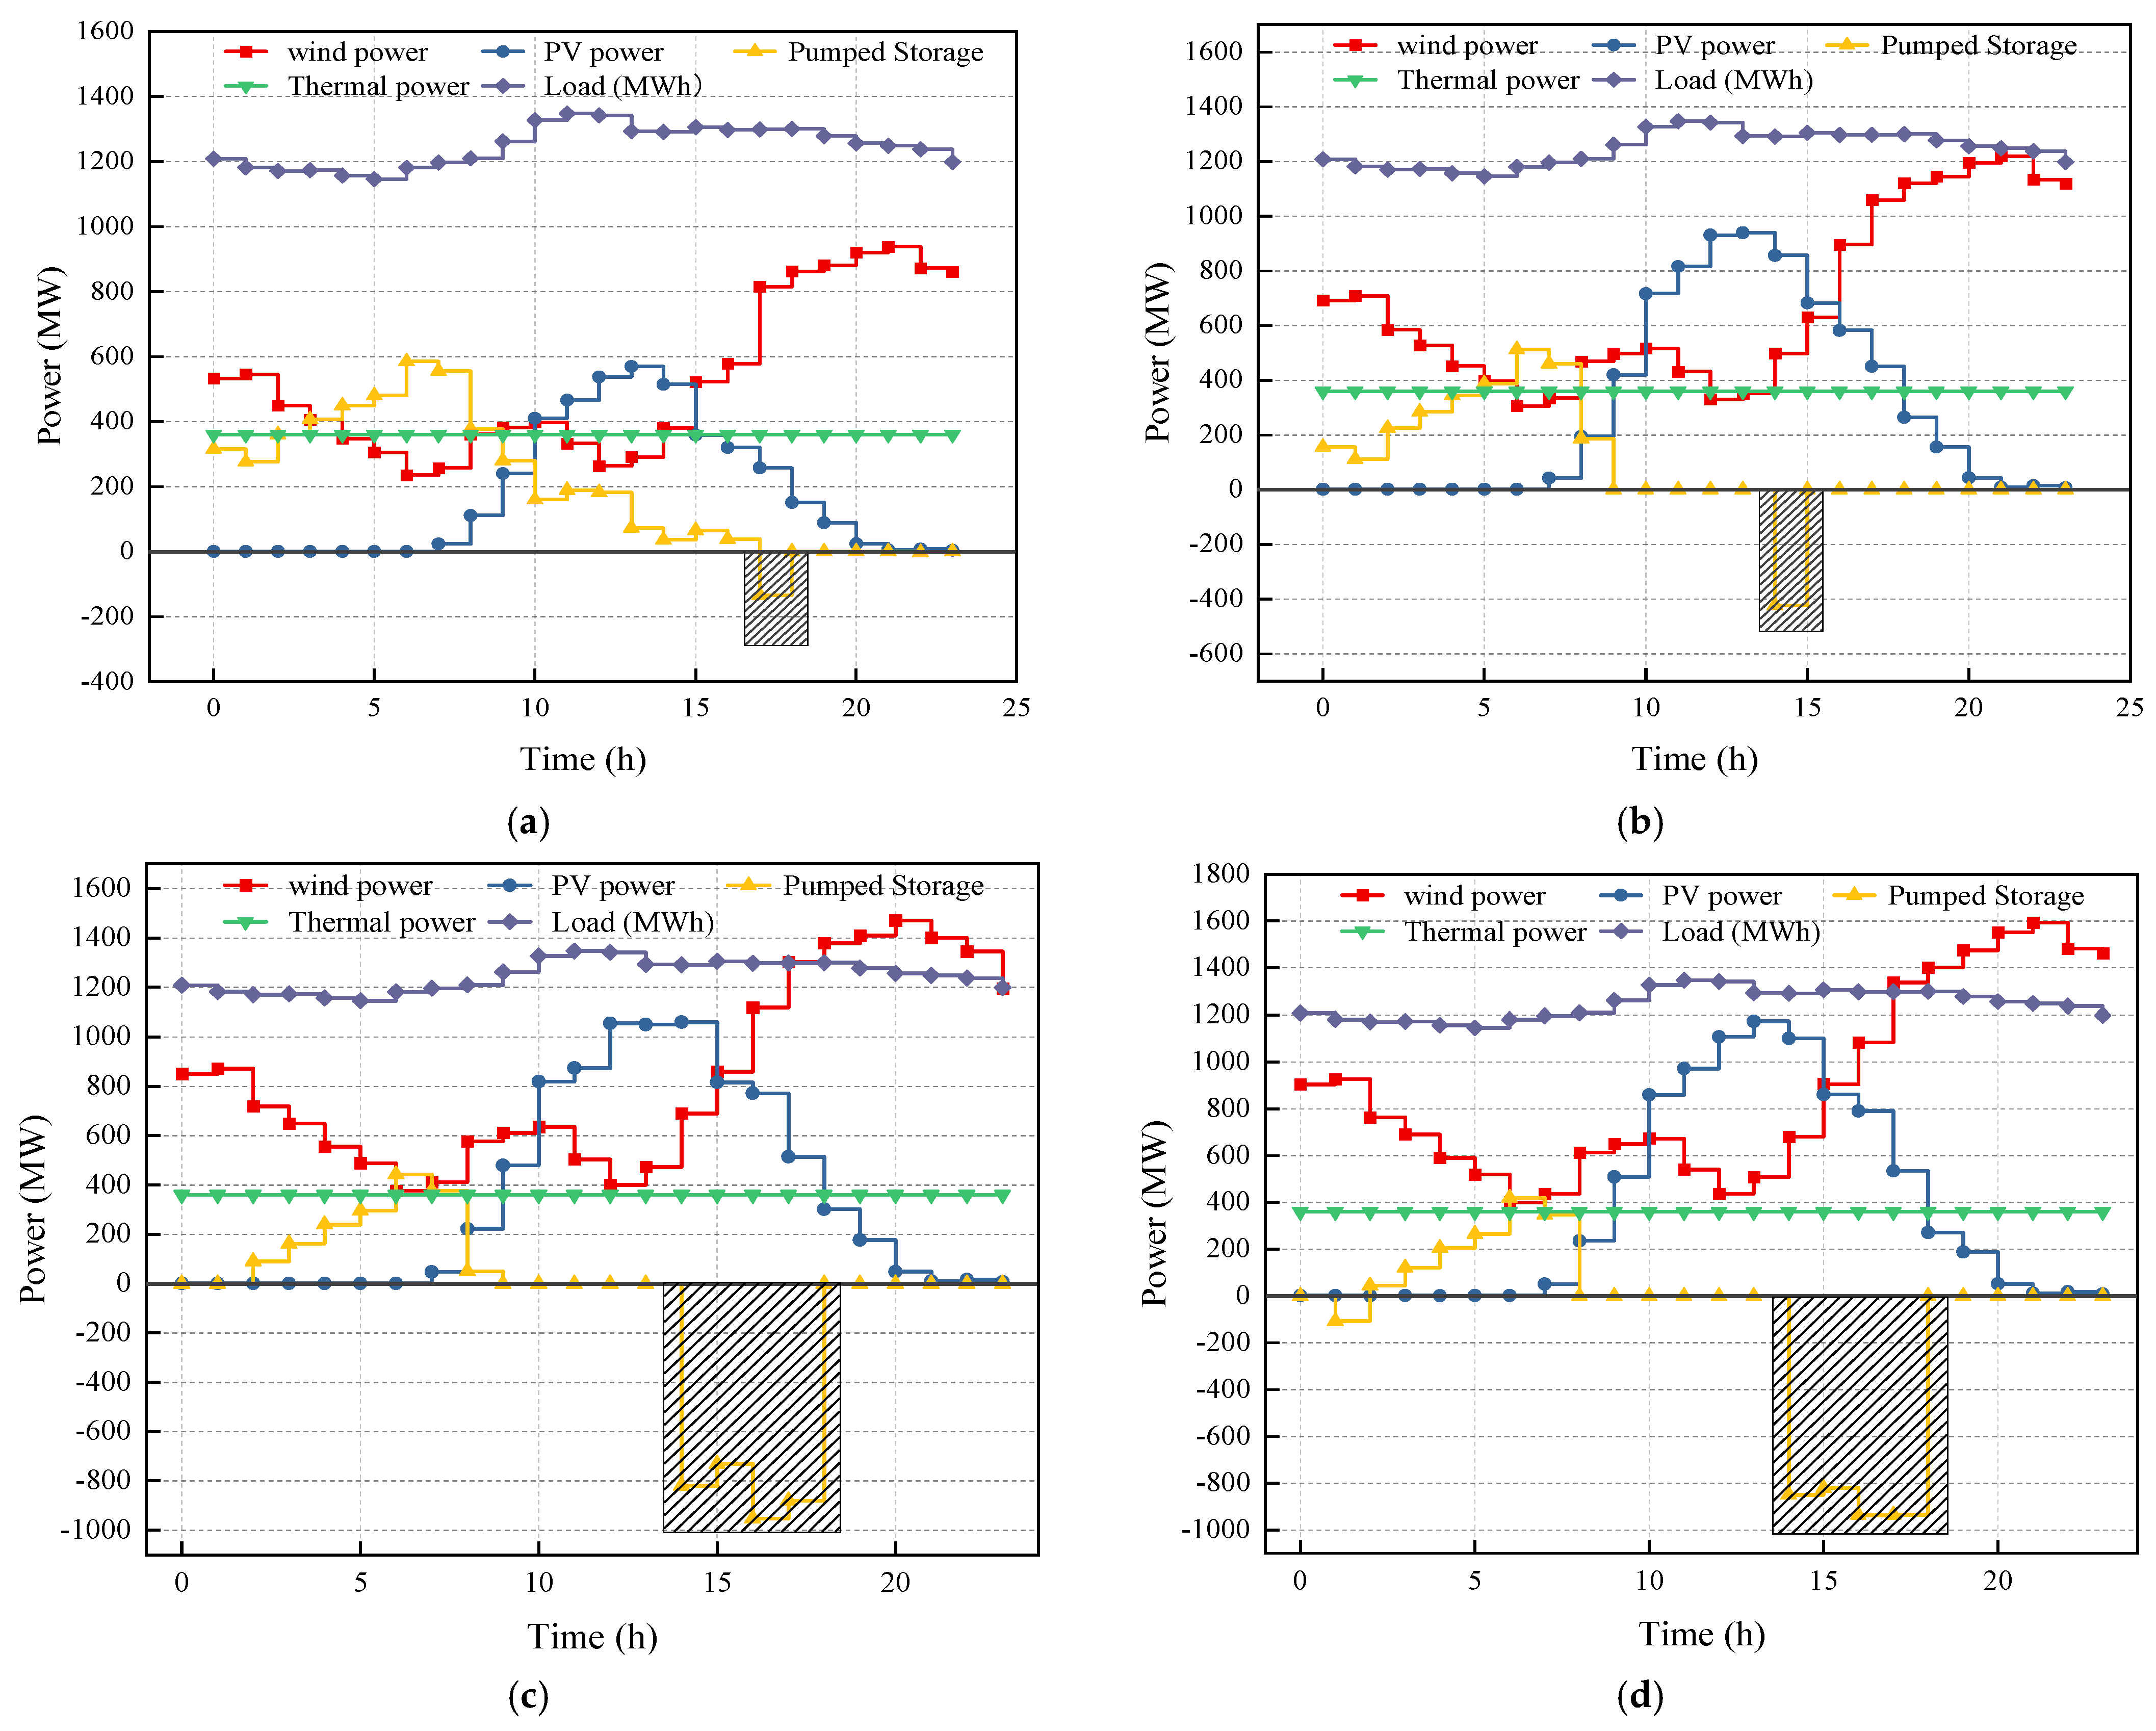
To further clarify the impact of a reasonable energy-abandonment rate on system optimization scheduling, the scheduling results for each scenario at a reasonable energy-abandonment rate of 2% are calculated as shown in
Figure 8.
From the analysis of
Figure 8a–d, it can be concluded that compared to the energy-abandonment rate set in
Figure 8, the overall startup and shutdown frequency of pumped storage units under a reasonable energy-abandonment rate is 1–2 times a day, greatly reducing the impact of frequent startup and shutdown of units on system operation. When the renewable energy permeability is between 50 and 60%, pumped storage units only store a small amount of energy in a short period in the afternoon during a typical day. When the renewable energy permeability is above 70%, Pumped storage units are typically at high-power energy storage from 14:00 to 19:00 during a typical day, and the units mainly play a role in active power regulation in the system.
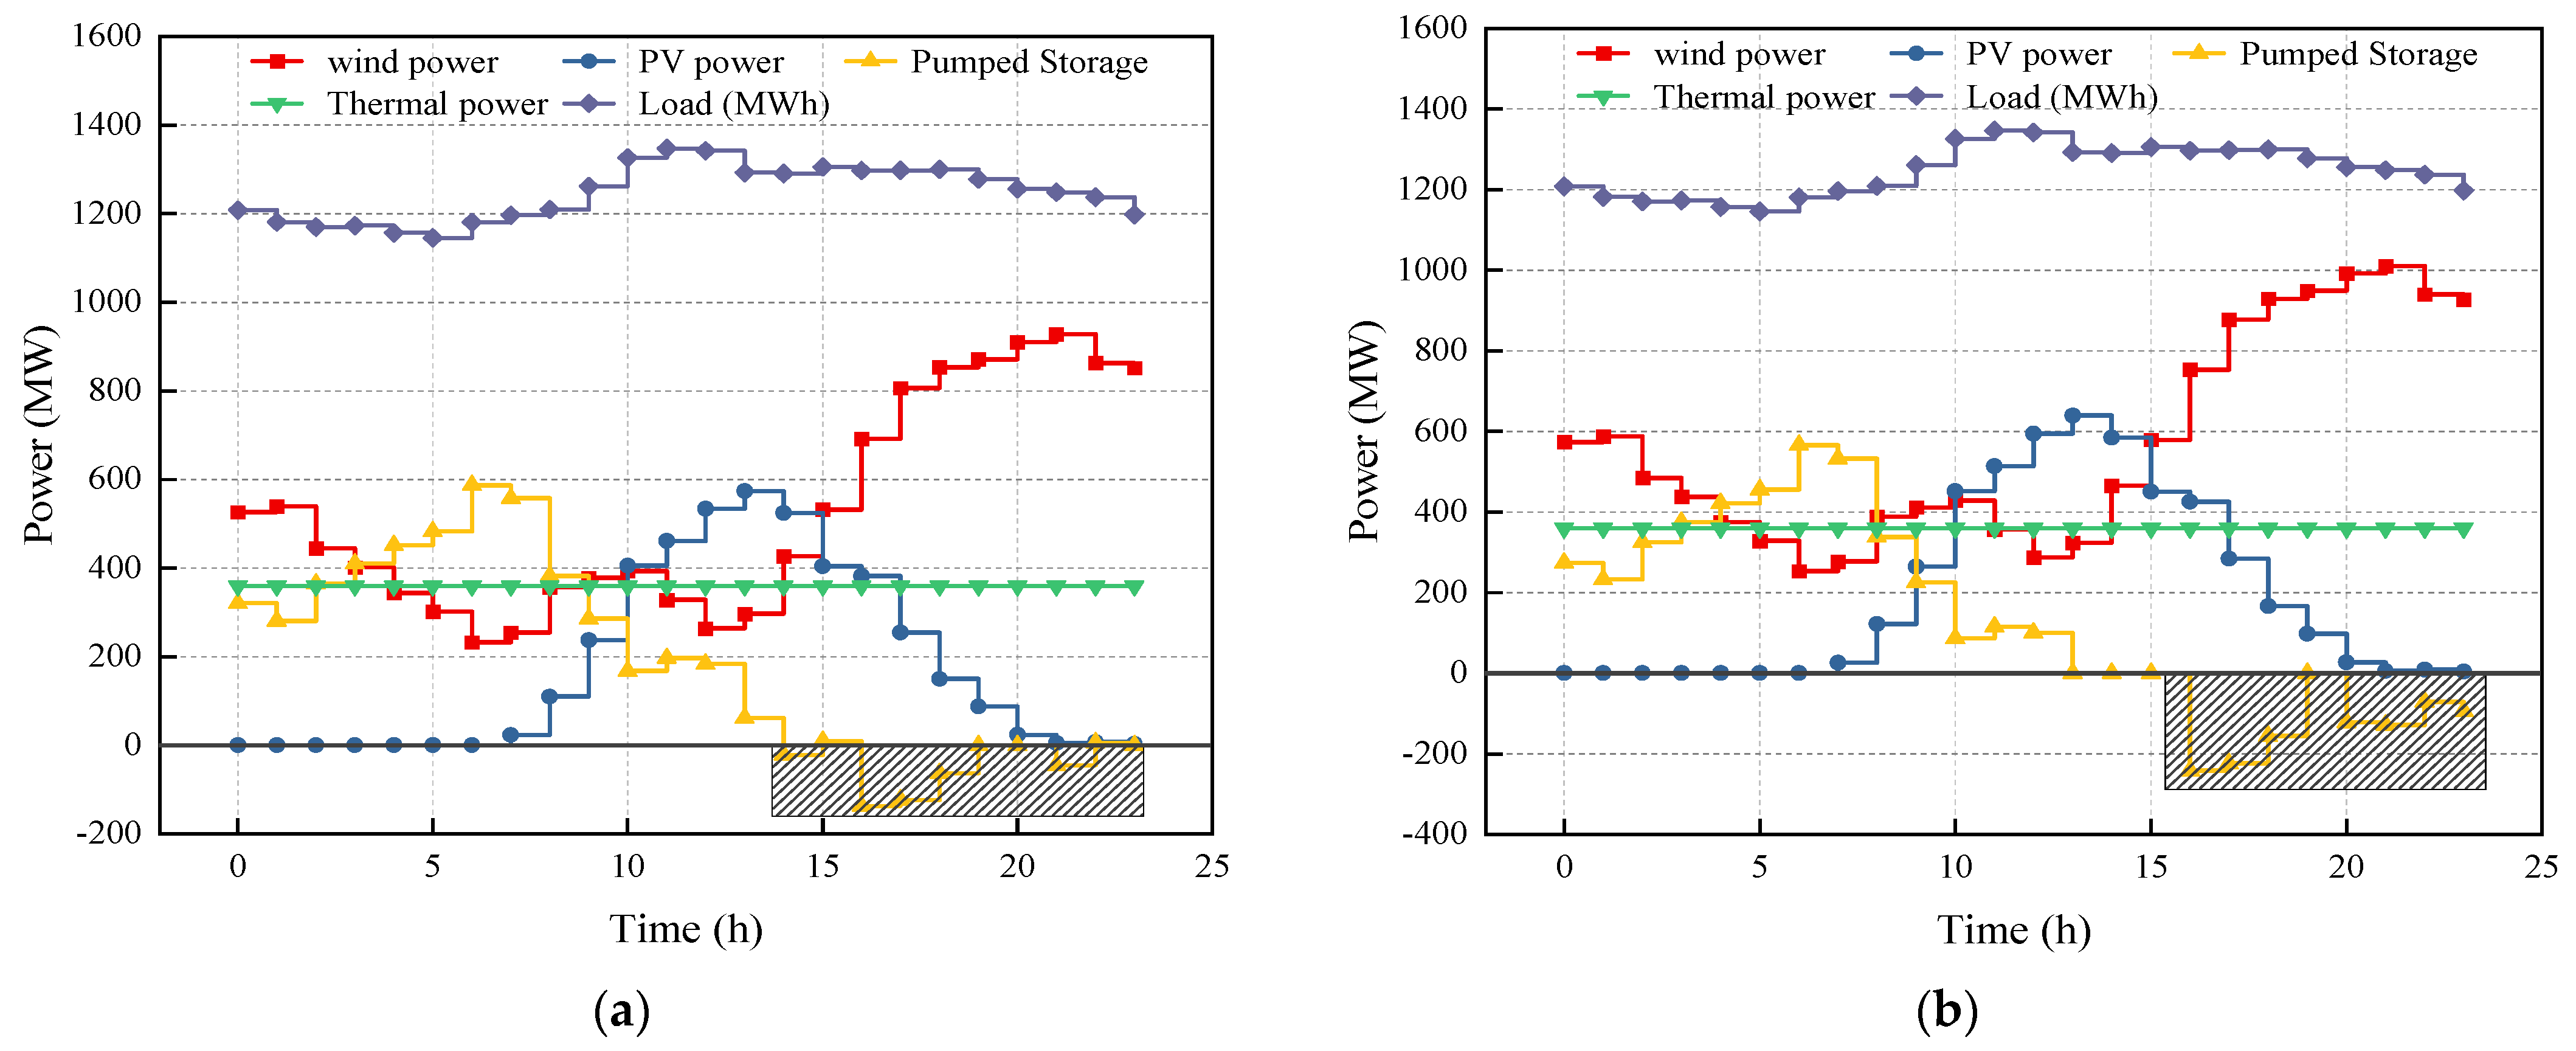
The analysis of reasonable energy-abandonment rate within the system should also consider the degree to which the combined output of renewable energy tracks the load. The relationship between the wind–PV power output curve and load is shown in
Figure 9.
As shown in
Figure 9, taking scenario 1 as an example, when the wind–solar output power is fully absorbed, there is a significant lag in the load tracking ability compared to when it is at a reasonable energy-abandonment rate. Generally speaking, wind power and load exhibit a significant anti-peak characteristic, while in the western region, wind power output is relatively large on summer evenings, and the anti-peak characteristic is less obvious. The combined output of wind–PV can meet the local load demand. When the energy-abandonment rate of renewable energy is 1%, it can be seen that its output curve is relatively consistent with that of complete absorption, and its load-tracking ability is poor. However, when the system’s renewable energy output is at a reasonable energy-abandonment rate, its load tracking ability is significantly enhanced, the abandoned energy is concentrated at noon, and the system operation is in a better state.
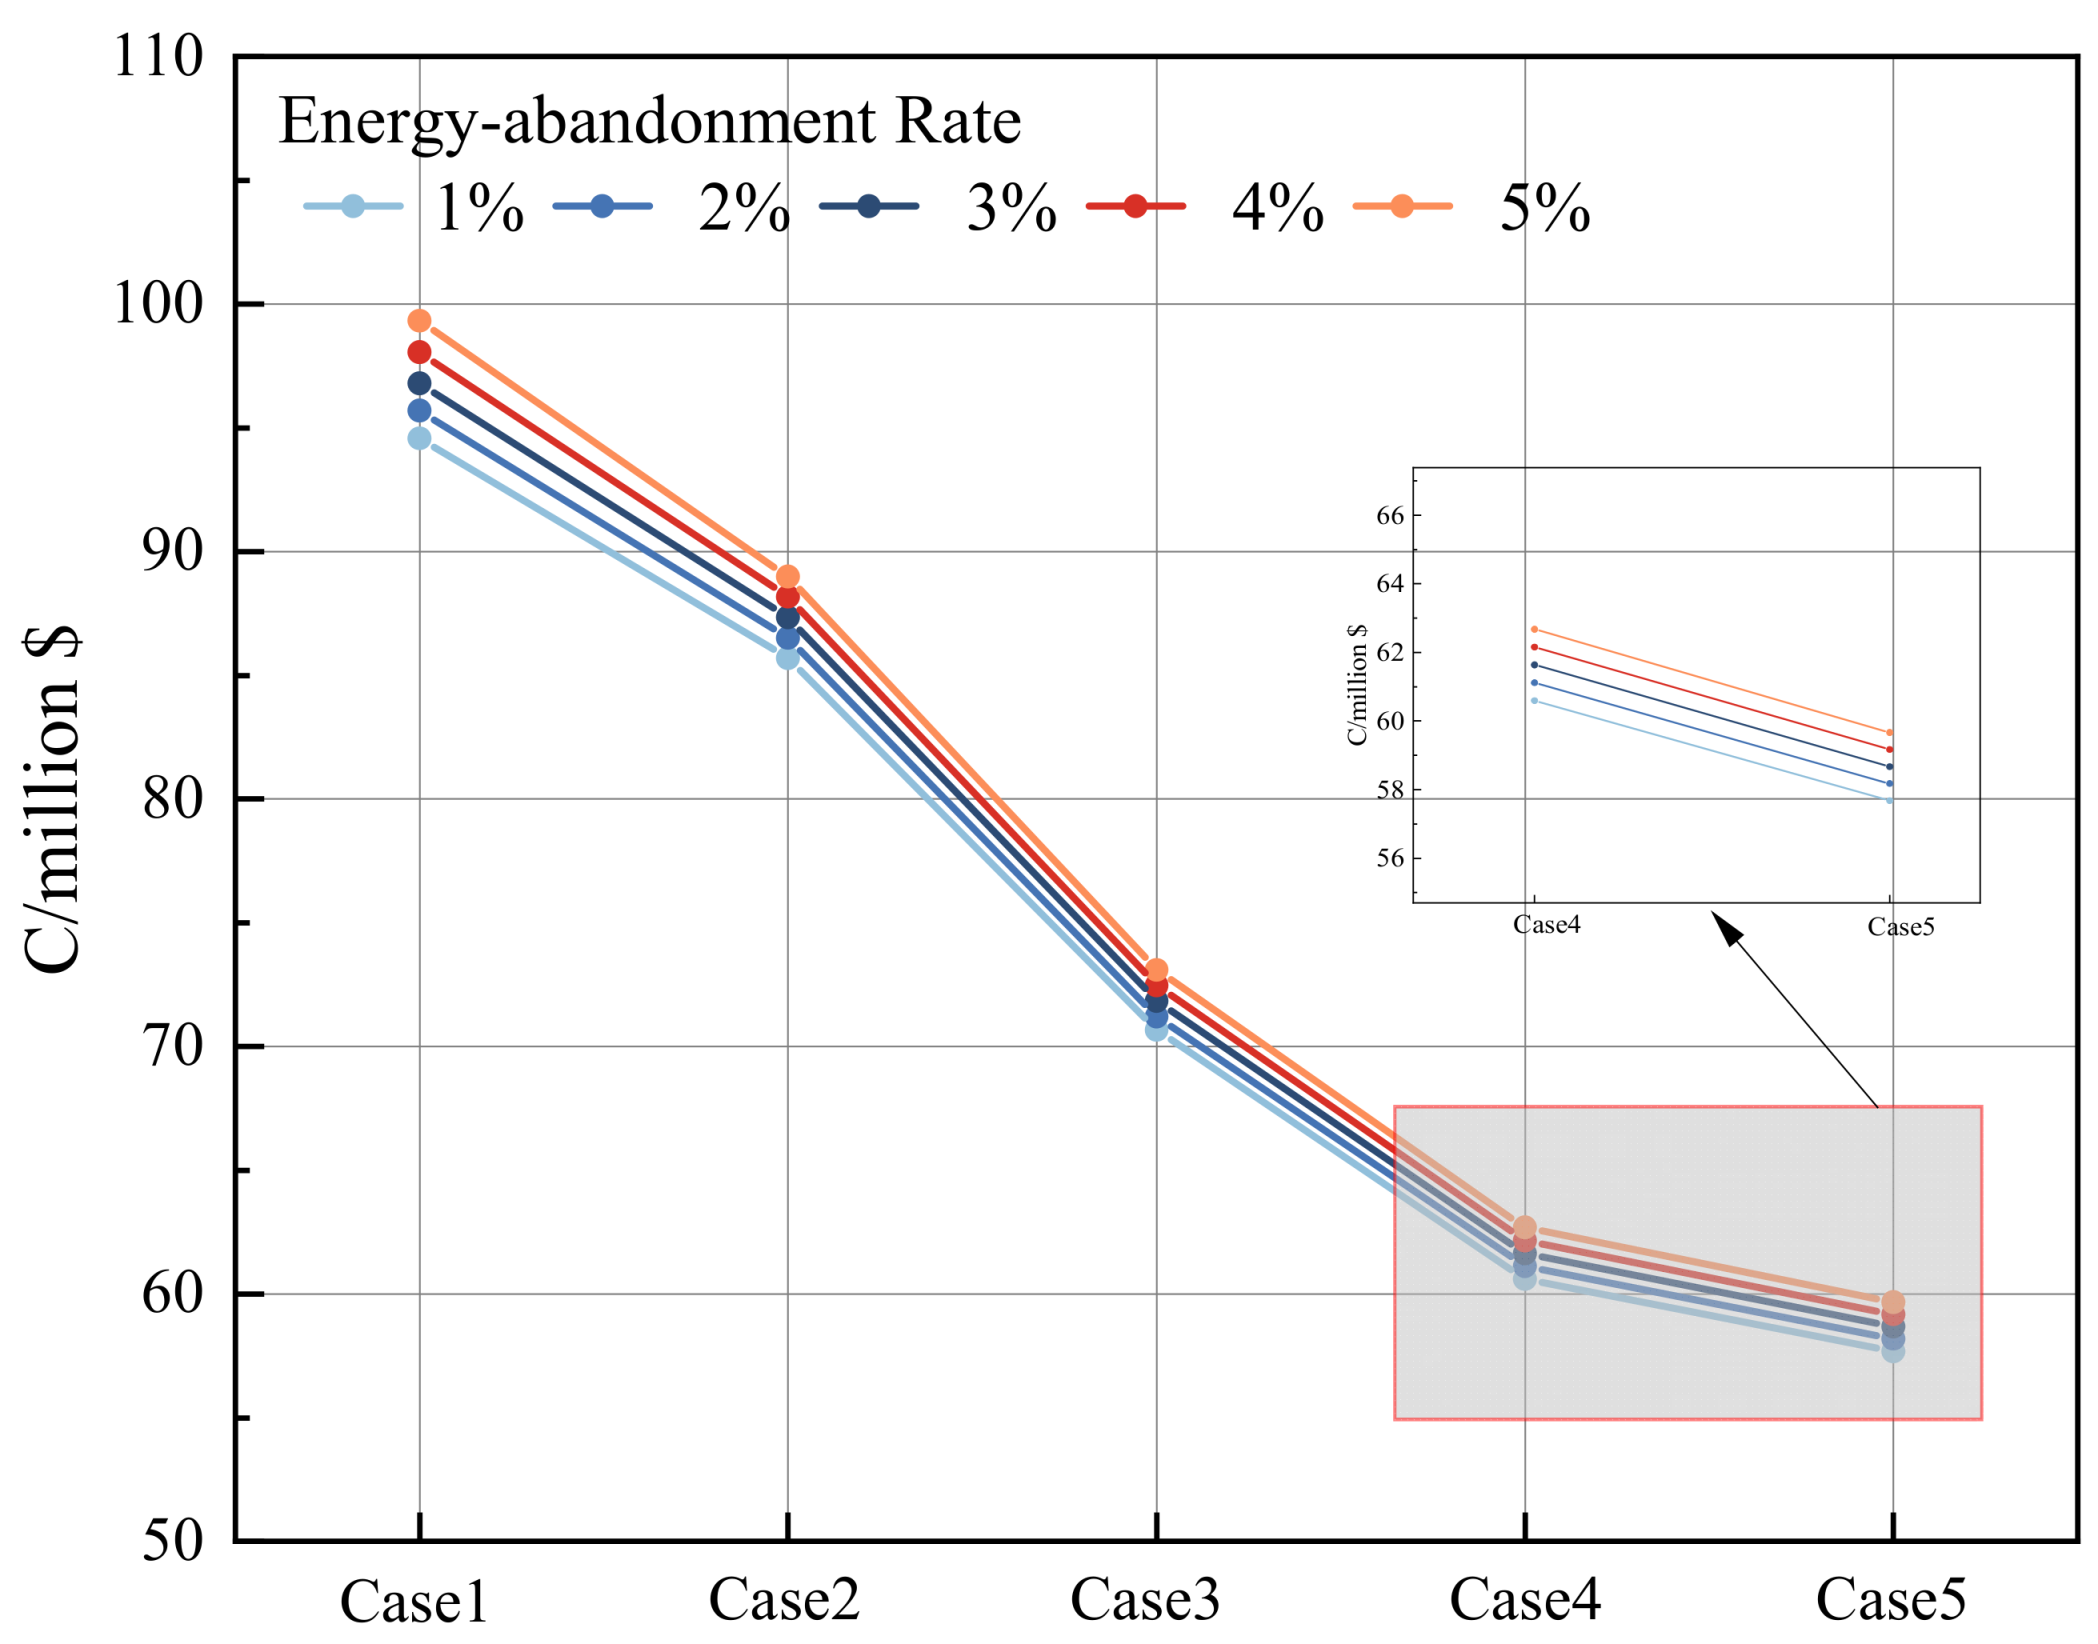
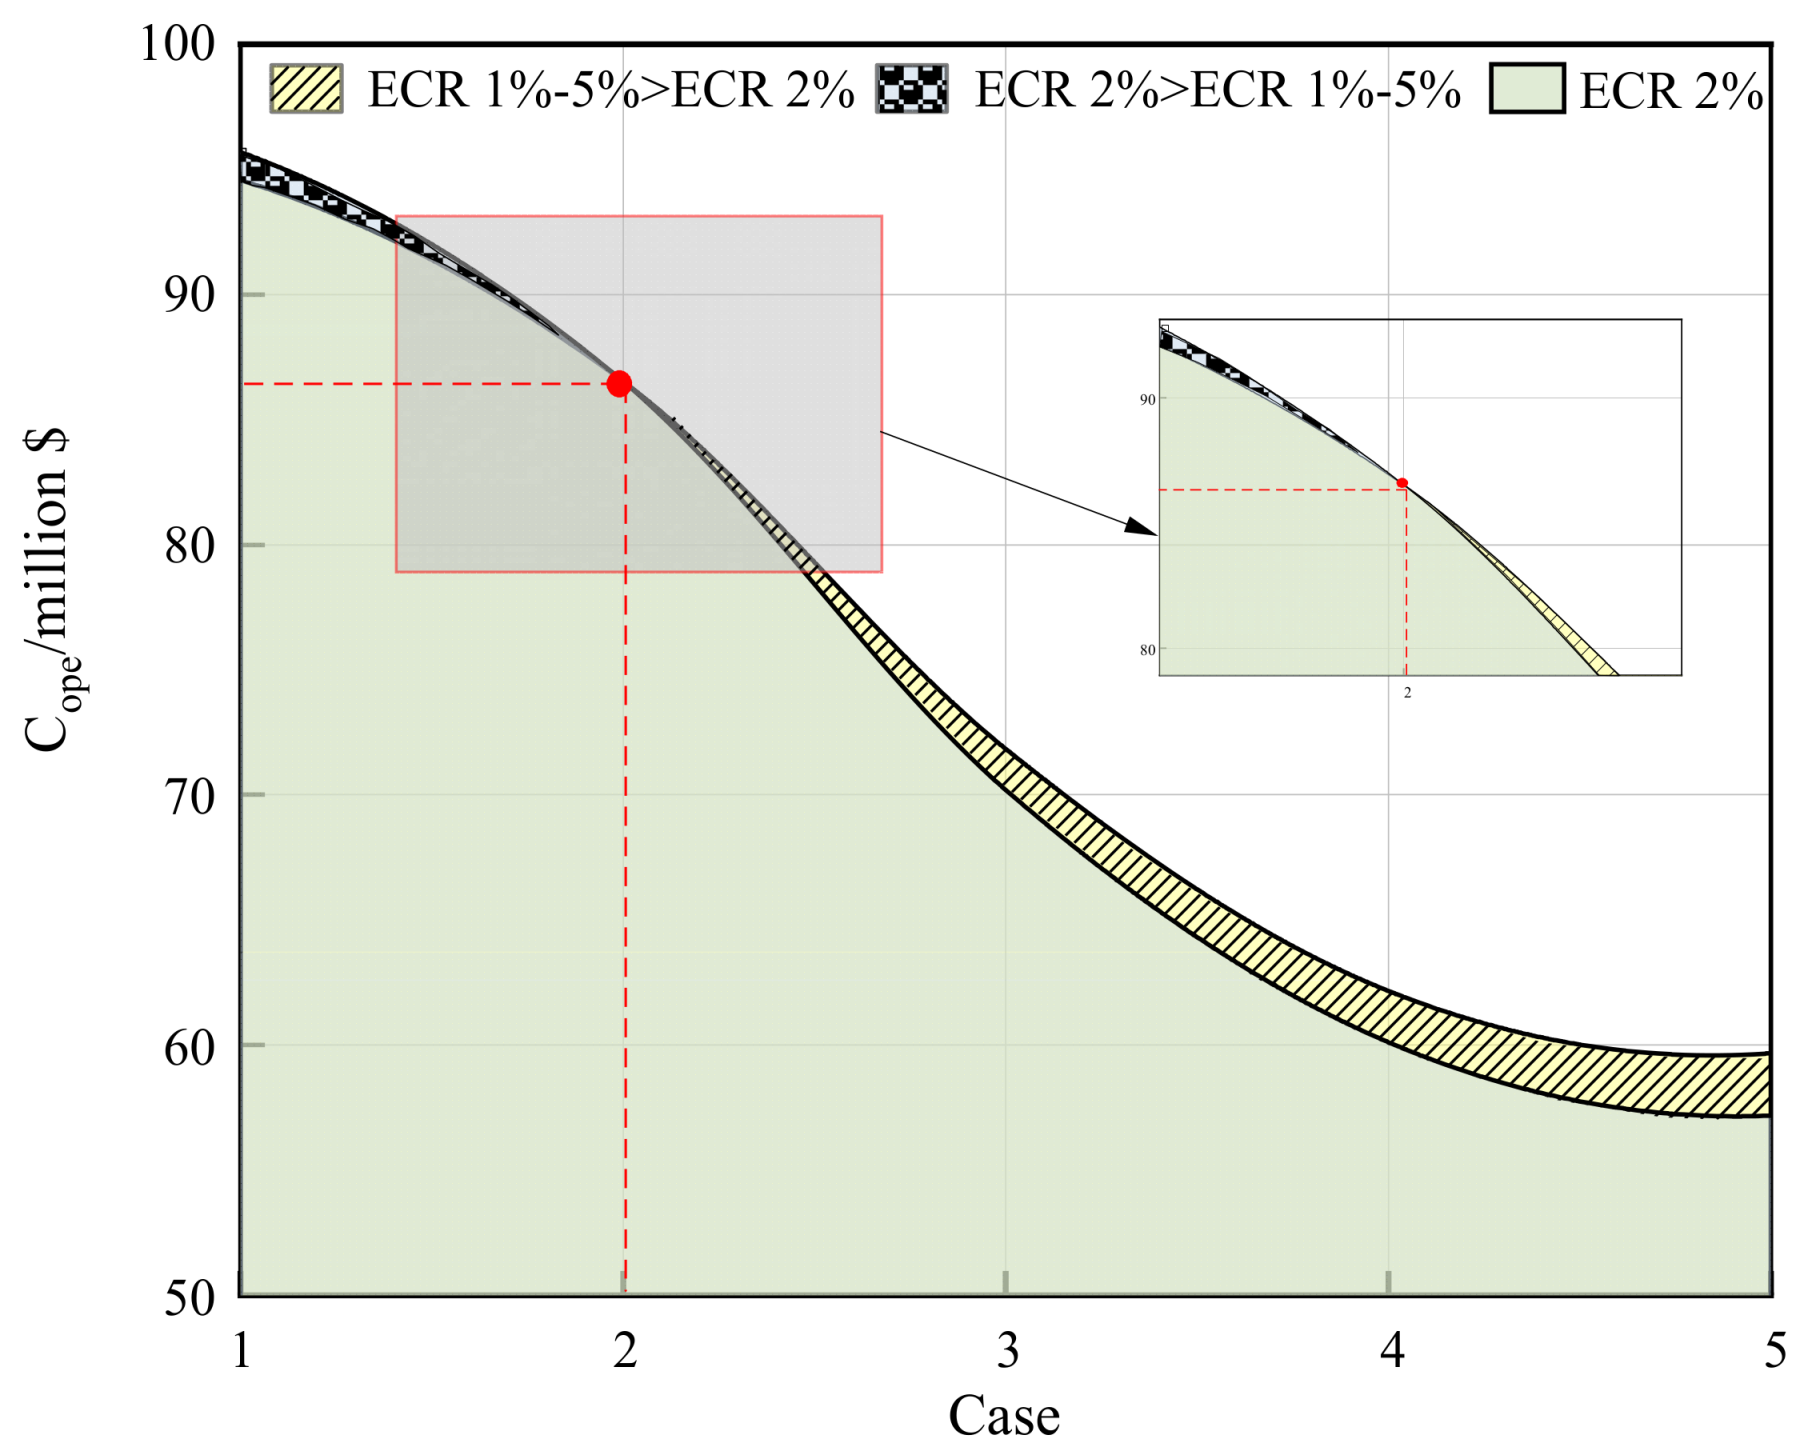
The correlation between reasonable energy-abandonment rate and system operating cost is also significant. The relationship curve between reasonable energy-abandonment rate, set energy-abandonment rate, and daily operating cost for each scenario is shown in
Figure 10.
From
Figure 10, it can be seen that the cost of scenario 1 under a reasonable energy-abandonment rate is slightly higher than that of the 1% energy abandonment scenario. The increase in abandoned electricity inevitably leads to an increase in system operating costs. However, according to the analysis in
Figure 8, it improves system stability and load-tracking intensity. As the proportion of renewable energy access increases, the impact of reasonable energy-abandonment rate on daily operating costs shows a class exponential relationship, with a gradual increase in the decrease. When the penetration ratio of renewable energy is between 50 and 60%, the decrease is 2.3%, while when the system is connected to the ultra-high proportion of renewable energy (>70%), the decrease jumps to 4.2%. Therefore, for the ultra-high proportion of renewable energy access systems, it is more important to keep the system operating at the calculated reasonable energy-abandonment rate.

 ,
, 


