

Anaerobic Digestion as a Possible Method of Managing Waste from Mushroom Production with Sewage Sludge as Co-Substrate


Department of Environmental Biotechnology, Faculty of Geoengineering, University of Warmia and Mazury in Olsztyn, 10-709 Olsztyn, Poland
*
Author to whom correspondence should be addressed.
Energies 2024, 17(8), 1938; https://doi.org/10.3390/en17081938
Submission received: 13 March 2024
/
Revised: 15 April 2024
/
Accepted: 18 April 2024
/
Published: 18 April 2024
(This article belongs to the Special Issue Biomass and Bio-Energy—2nd Edition)
Abstract
:The mushroom agroindustry generates a huge amount of waste from mushroom production (WMP). The composition of WMP is not standardized but differs mainly in terms of organic matter (OM) content and OM biodegradability. This makes WMP management, including anaerobic digestion (AD), a significant challenge. A potential solution could be co-digestion of WMP with municipal sewage sludge (SS), especially SS generated in small rural wastewater treatment plants (WWTPs). Therefore, this study investigated mesophilic methane production (MP) from WMP, SS, and mixtures of SS and WMP at ratios of 70:30, 50:50, and 30:70 (w/w OM). Even though the maximum cumulative MP from WMP was relatively low (approx. 60 NL/kg OM), co-digesting WMP with SS increased both MP and the methane content of the biogas: with 30%, 50%, and 70% shares of SS, MP increased almost 2, 2.5, and 3.3 times, and the methane content increased to 61%, 62%, and 64%, respectively. As the SS content was increased, the kinetic coefficients of MP and OM removal decreased (from 0.211 to 0.146 d−1 and from 0.215 to 0.152 d−1), whereas the initial rate of MP and of OM removal increased (from 12.5 to 36.8 NL/(kg OM·d) and from 0.51 kg OM/(m3·d) to 0.59 kg OM/(m3·d), respectively). The effectiveness of OM removal (EOMrem) was lowest with WMP only, at 46.6%. When the SS content of the mixtures was increased to 30%, 50%, and 70%, EOMrem also increased to 55.3%, 60.1%, and 64.9%, respectively. The relationship between maximal MP and the overall OM removed was such that both increased simultaneously. The higher values of EOMrem and, consequently, the lower final contents of OM with more effective MP indicate that the organics were degraded more efficiently. These results suggest that co-digestion may be a profitable solution for simultaneously utilizing both of these waste products, increasing the efficiency of biogas production to such an extent that it would be profitable to conduct AD on mushroom farms. This is a flexible approach that allows varying proportions of WMP and SS to be used, depending on the availability of both substrates and the energy needs of the mushroom farm. However, it should be borne in mind that a higher share of WMP results in lower gas productivity.
1. Introduction
Currently, fossil fuels are the main resources used to meet energy needs, and as such, they are being depleted due to high consumption and their non-renewable nature [1,2]. This situation, coupled with concerns for the environment due to greenhouse gas emissions causing climate change, have sparked interest in alternative, renewable energy sources.
One such energy source is biogas, which is a promising alternative energy source because it is produced from renewable organic resources in a cost-effective and environmentally friendly manner. Biogas is produced via anaerobic digestion (AD), which can be carried out under different conditions. Temperature is one of the most important determinants of AD, as it influences the kinetics, thermodynamics, and growth of microbes [3]. Temperature ranges for which AD can be established include mesophilic temperatures (around 35–40 °C) and thermophilic temperatures (55–60 °C). Conventional AD is carried out at mesophilic temperatures, i.e., 35–37 °C, as the mesophilic process is more robust and less sensitive to changes due to the greater diversity and abundance of bacteria coexisting in the reactor [4]. In addition, the lower energy and maintenance costs are an advantage that contributes to the acceptance of the mesophilic state by most biogas plants. In contrast, thermophilic processes are prone to inhibition and instability [5]. In addition to temperature, the total solids content of the feedstock (wet or dry AD) also influences methane production. Dry AD is carried out in reactors with smaller volumes, and it requires more energy to heat but leaves less digestate. Due to the low moisture content of the digestate, it is easier to handle compared to wet AD but still produces a higher volumetric methane yield [6,7].
One of the benefits is that AD is used to treat various organic wastes, which serve as the substrates for the process. Moreover, processing these feedstocks via AD produces digestate, which is a useful organic fertilizer that can replace chemical fertilizers in sustainable agriculture. Various substrates are used for AD, such as the organic fraction of municipal solid waste (OFMSW), agricultural residues, forestry residues, organic industrial waste, and animal manure [8,9,10]. The choice of an appropriate substrate is an important factor affecting the AD process. One potential substrate is waste from mushroom production (WMP), also known as spent mushroom substrate. Unlike other agricultural feedstocks, WMP is abundantly available throughout the year; thus, it can be considered a feedstock for the production of second-generation biofuels [11]. Moreover, as each kilogram of fresh mushrooms that is produced generates about 5 kg of WMP, disposal of the huge amount of biowaste generated by the mushroom agroindustry presents a significant challenge [12,13]. To give an idea of the scale of this problem, the Food and Agriculture Organization of the United Nations (FAOSTAT) reported that total worldwide mushroom and truffle production reached 48,335,996 tons in 2022. Mushroom producers face numerous issues related to the storage and handling of WMP. Temporary storage leads to nuisance odors and leachate runoff into water bodies, resulting in pollution, as well as the release of greenhouse gases through spontaneous AD, which make the treatment and disposal of WMP a major environmental issue. Additionally, given the huge amount of WMP, the choice of suitable sites for its treatment and the high cost of transporting it to treatment plants also present major challenges to mushroom producers. As WMP is a low-density material, its high moisture content brings additional difficulties. If it is dried to reduce its quantity, this entails high costs due to intensive energy consumption and also reduces the nutrient content in WMP. However, this method of disposing of biodegradable waste is banned in EU countries under the 1999 EU Directive. Therefore, an efficient method of managing and handling WMP is necessary to reduce its carbon footprint and lower treatment costs. Recently, WMP was used, for example, for activated carbon production via pyrolysis [14]. It was found that value-added products, e.g., enzymes for bioremediation, can be recovered from WMP. Moreover, it can be used as animal feed [15]. WMP also can be used as a potential substrate to produce bioenergy because it often comprises organic substrates such as animal manure, straw or sawdust, gypsum, and mineral salts [16,17]. For example, Luo et al. [17] showed that WMP, depending on the species of mushroom cultivated (Flammulina velutipes, Pleurotus erygii var. tuoliensis, Pleurotus eryngi), contained rice bran, corncob, bran, beet residue, CaCO3, quicklime (WMP from Flammulina velutipes); cottonseed hull, corncob, bran, corn flour, lime, gypsum (WMP from Pleurotus erygii var. tuoliensis); bagasse, sawdust, bran, corncob corn flour, cottonseed hull, bean pulp, CaCO3, lime powder (WMP from Pleurotus eryngi). Moreover, the production of biogas using WMP in mushroom farms to create a closed-loop energy generation method is sustainable and can help offset energy costs. This would also benefit the environment by reducing greenhouse gas emissions. Thus, it would be advantageous for the mushroom-producing industry to utilize WMP more effectively, contributing to environmental preservation and the long-term growth of the industry [18].
Currently, there have been few studies on the use of WMP as a substrate for methane production (MP), and the results of those studies have differed widely, ranging from very low productivity of almost 0 NL/kg OM [19] to relatively high productivity of 160 NL/kg OM [17,20]. These differences are due to, among other things, the fact that WMP is not standardized in terms of its composition. Instead, it is produced with different ingredients, which differ in terms of biodegradability. Thus, it is not possible to make general statements about the potential of this kind of substrate for biogas production. Instead, experimental tests must be carried out for each type of WMP. Thus, in the present study, real WMP from the mushroom industry was used to test its methane potential.
Additionally, co-digestion of WMP with other substrates is worth investigating because co-digestion offers great advantages over mono-digestion, especially in terms of higher nutritional content, better buffering capacity, greater process stability, and optimal C/N ratios [21]. Some studies have shown that co-digestion of WMP with various substrates, such as dairy manure [17], livestock manure [19], and wastepaper [20], may result in improved methane production compared to mono-digestion of WMP. For example, Luo et al. [17] showed that methane yield from mixtures of WMP and dairy manure was 6–61% higher than the yield from WMP or dairy manure alone, indicating a synergistic effect of co-digestion. Similarly, an increase in biogas production during co-digestion was shown by Gao et al. [19]. The authors digested yellow back fungus WMP with chicken, dairy, and pig manure. WMP combined with chicken manure yielded a slightly higher cumulative methane yield when compared with the combination of dairy manure and pig manure. For example, the cumulative methane yield of WMP with chicken manure was increased by 414% compared with that obtained using WMP or chicken manure, separately. Sethumadhavan et al. [20] showed that process efficiency depended on the degree of grinding of the co-substrate (wastepaper). They showed that when WMP was co-digested with wastepaper as powder, methane yield equaled 168 mL CH4/g VS. When WMP and wastepaper as briquettes were used, the highest methane yield was noted (250 mL CH4/g VS). According to the authors, size reduction in the briquetting process made the cellulose and other components of plant cell walls more accessible to the microorganisms.
Thus, the present study investigated methane production during co-digestion of WMP and sewage sludge (SS). This is because it is known that SS has a high biogas yield and it is successfully used as a substrate or co-substrate in AD [22,23]. This process is commonly used to treat SS but in large wastewater treatment plants (WWTPs). Unfortunately, the amount of SS generated in small rural WWTPs usually does not make AD economically justifiable. In this context, the co-digestion of WMP and SS seems to be worth investigating. Moreover, the co-digestion of WMP with SS has not been tested so far. The use of SS as a co-substrate for AD of WMP in mushroom farms could be a profitable way to simultaneously utilize both of these wastes, increasing the efficiency of biogas production to such an extent that it would be profitable to conduct AD in mushroom farms. The present study investigated not only the methane production during co-digestion of WMP and SS but also the kinetics and efficiency of AD in terms of both methane production and removal of organic matter (OM). The kinetic parameters of methane/biogas production are based on kinetic models [24] and are critical for anaerobic reactor design and evaluation [25]. However, the kinetics of OM degradation during anaerobic biodegradation in batch tests are rarely presented. The kinetics of biogas production, for example, provide information about the time at which biogas is produced most effectively. This also provides information on the biodegradability of substrates but only if the same substrate or group of substrates is used for anaerobic biodegradation but, for example, under different technological conditions.
2. Materials and Methods
2.1. Inoculum
The present study used an inoculum (I) in the form of anaerobically digested sewage sludge from the closed mesophilic (37 °C) chamber of the municipal wastewater treatment plant for a city of 200,000 inhabitants in the northeast of Poland. This plant was designed with a capacity of 60,000 m3/day. Table 1 provides the characteristics of the I.
2.2. Substrates
The first of the two substrates used in this study was sewage sludge (SS) from the secondary clarifier of a full-scale wastewater treatment plant (northeast Poland). This substrate was characterized by a high moisture content (94.47%) and a correspondingly low dry matter content (DM, 5.53%). Its organic matter (OM) content was ca. 76% of DM (Table 1).

Table 1.
The characteristics of fresh substrates and inoculum.
| Characteristics | Units | WMP | SS | Inoculum |
|---|---|---|---|---|
| Basic analyses | ||||
| Moisture content | % | 73.86 ± 1.75 | 94.47 ± 1.87 | 98.10 ± 0.96 |
| Dry mass (DM) | % | 26.14 ± 0.65 | 5.53 ± 0.35 | 1.90 ± 0.09 |
| Mineral mass (MM) | % DM | 35.21 ± 0.96 | 24.16 ± 0.87 | 30.47 ± 0.95 |
| Organic matter (OM) | % DM | 64.79 ± 1.37 | 75.84 ± 1.80 | 69.53 ± 1.42 |
| Water extract * | Supernatant | |||
| COD | mg/L | 798.00 ± 5.84 | 129.00 ± 2.05 | 1083.00 ± 7.09 |
| g/kg DM | 305.28 ± 2.92 | – | – | |
| N-NH4 | mg/L | 7.84 ± 0.56 | 19.60 ± 0.48 | 484.40 ± 3.01 |
| g/kg DM | 3.00 ± 0.15 | – | – | |
| VFA | mg/L | 44.57 ± 1.18 | 66.55 ± 1.39 | 582.86 ± 4.37 |
| g/kg DM | 17.05 ± 0.54 | – | – | |
| P-PO4 | mg/L | 4.48 ± 0.23 | 80.61 ± 1.81 | 220.40 ± 2.64 |
| g/kg DM | 1.71 ± 0.09 | – | – | |
| Alkalinity (TA) | mval/L | 0.80 ± 0.05 | 8.10 ± 0.68 | 48.10 ± 1.13 |
| pH | – | 6.88 ± 0.47 | 6.65 ± 0.45 | 7.04 ± 0.51 |
* Water extract—1 g of dry WMP in 100 mL water.
The second substrate was waste from mushroom production (WMP) obtained from the mushroom production industry (northeast Poland). The substrate for mushroom cultivation was composed of chicken manure, wheat straw, lime, and water.
After drying and grinding to obtain homogenous material, WMP had DM and OM of 26.14% and 64.79%, respectively (Table 1).
2.3. Experimental Methane Analyzer AMPTS and Experimental Variants
For anaerobic measurements of MP from the substrate(s), the automatic methane potential test system (AMPTS II, Bioprocess control, Lund Sweden) was applied. The system has automatic agitation; a speed of 80 rpm for 1 min every hour was used. The system consists of 15 bioreactors (500 mL) which were filled with substrate(s) and I. Then, they were placed in a water batch (the integrated part of the AMPTS) at 37 °C for 30 days. During measurements, the biogas produced by the substrate(s) in each bioreactor flows through the CO2-absorbing unit with a solution of 3 M NaOH and thymolphthalein. Each bioreactor has a connection to a flow cell (a multi-flow cell unit in the integrated part of AMPTS (15 cells)). The methane flows through the unit to measure the volume. Finally, the data are recorded by the joined computer. The initial organic loading rate (OLR) was 10 kg OM/m3, and the inoculum dosage was 300 mL (Table 2).
For the measurement of MP, the following experimental variants were used: SS only, WMP only, and mixtures of SS and WMP at OM ratios of 70:30, 50:50, and 30:70 (w/w OM). A system of abbreviations was used, in which, for example, WMP means that WMP was the only substrate used and WMP70:SS30 means that 70% of the OM came from WMP and 30% came from SS. Table 2 displays the doses of substrates that were administered to the AMPTS bioreactors.
In order to determine physicochemical characteristics during MP, additional bioreactors (7 bioreactors for each variant) were prepared in the same way as the AMPTS bioreactors. The doses of I and substrates added to these additional bioreactors are also shown in Table 2.
2.4. Calculations and Statistical Analyses—Determination of the Kinetics of MP and the Removal of OM Content
A pseudo-first-order kinetic model was used to describe MP according to Equation (1):
where:
- Ct,CH4 (L/kg OM) is the cumulative MP at time t (days) of anaerobic measurement;
- C0,CH4 (L/kg OM) is the maximal MP;
- kCH4 (d−1) is the kinetic coefficient of MP.
The rate of MP (rCH4 in L/(kg OM·d)) is the product of kCH4 and C0,CH4.
The removal of OM followed first-order kinetics according to Equation (2):
where:
- Ct,OM (kg OM/m3) is the OM content at measurement time t (days);
- C0,OM (kg OM/m3) is the OM removed during MP;
- C1,OM (kg OM/m3) is the final OM content;
- (d−1) is the kinetic coefficient of the OM removal.
The rate of OM removal ( in kg OM/(m3·d)) is the product of kOM and C0,OM.
Values of C0,CH4, C0,OM and kCH4, kOM were obtained by non-linear regression analysis with Statistica software, version 13.3 (StatSoft 13.3).
The effectiveness of the OM removal (EOMrem) during anaerobic biodegradation of substrates was calculated according to Formula (3):
where:
- MM1 (% DM) is the mineral mass content in substrates (WMP, SS, and their mixtures);
- MM2 (% DM) is mineral mass content in the material during anaerobic biodegradation.
On the basis of the elementary composition of the substrates (Table 3), the theoretical methane potential (TMP) that could be obtained was calculated using Buswell’s equation [26] (assuming complete conversion of organics into methane):
The theoretical molar compositions of the methane that could be obtained from one mole of the tested feedstocks (based on Equation (4)) were as follows:
WMP C15.9H22.2O8.5N + 6.81 H2O → 8.20 CH4 + 7.66 CO2 + NH3
WMP70:SS30 C10.3H15.7O5.7N + 4.37 H2O → 5.35 CH4 + 4.97 CO2 + NH3
WMP50:SS50 C8.4H13.5O4.6N + 3.54 H2O → 4.38 CH4 + 4.05 CO2 + NH3
WMP30:SS70 C7.2H12.0O3.9N + 2.97 H2O → 3.72 CH4 + 3.43 CO2 + NH3
SS C5.9H10.5O3.2N + 2.41 H2O → 3.07 CH4 + 2.81 CO2 + NH3
To calculate the mass of methane (MCH4theor) that could theoretically be obtained during digestion of the substrates, assuming complete conversion of organics into biogas, Equation (5) was used:
where:
- MCH4theor (g CH4/d) is the mass of methane;
- MCH4 (g/mol) is molar mass of methane;
- Msubstrates (g/mol) is molar mass of the substrates or their mixtures;
- Oload (g/d) is organics load fed into the AMPTS bioreactor.
To calculate TMP (Equation (5)), the density of CH4 was considered to be 0.717 g/L (at 0 °C, 101 kPa).
2.5. Analytical Methods
The fresh substrates and inoculum were characterized in terms of their contents of moisture, DM, and OM. The elemental composition of the substrates (in DM) was analyzed using the Flash 2000 Organic Elemental Analyzer (Thermo Scientific, Milan, Italy) according to the manufacturer’s instructions.
First, a water extract from WMP was prepared; then, the supernatants of (i) the water extract, (ii) SS, and (iii) the I were characterized in terms of pH (Titroline 6000, SI Analytics, Mainz, Germany) and total alkalinity (TA) (titration to pH 4.5 using a Titroline 6000, SI Analytics, Germany), as well as their concentrations of chemical oxygen demand (COD) (cuvette tests, Hach Lange), ammonium (N-NH4) (distillation method with titration, Büchi, Switzerland), volatile fatty acids (VFAs) (distillation method with titration, Büchi, Switzerland), and orthophosphate (P-PO4) (spectrophotometric method with use of ammonium molybdate). Every few days, the contents of the additional bioreactors were characterized in terms of their content of DM (after drying at 105 °C) and OM (loss on ignition at 550 °C); additionally, the supernatants were characterized in terms of pH, TA, and their concentrations of COD, N-NH4, VFA, and P-PO4.
These analyses were performed according to standard methods for the examination of water and wastewater [27].
3. Results and Discussion
3.1. Conditions during the Anaerobic Digestion of SS Only, WMP Only, and Their Mixtures
3.1.1. Changes in pH, Alkalinity, and in the Concentration of P-PO4 and N-NH4 during AD
In AD, the pH and TA values are key determinants of the stability of MP [28]. These characteristics influence the performance and growth of the various microorganisms involved in the different stages of the fermentation process. A pH value in an anaerobic medium that ranges from 7.0 to 8.0 indicates that the processes of anaerobic conversion are balanced, i.e., hydrolysis, acidogenesis, and methanogenesis [29]. In the present study, to conduct the measurement of MP continuously without any disruptions, additional bioreactors were used for measurements of physicochemical parameters. This means that the characteristics were measured in the supernatant of the I and substrate(s).
The use of I, which constitutes fermented sludge, or any other fermented material from the AD chamber, is necessary in the experiments as batch tests (e.g., in AMPTS). The I containing microorganisms, which initiate MP, should be used in excess in comparison to the substrate, whose MP is determined. This means that the conditions during anaerobic degradation of the substrate are strongly affected by the I (for example, pH or TA and other physicochemical parameters), which is the appropriate approach. In the present study the pH, the TA, and the concentrations of VFA, N-NH4, and P-PO4 after the addition of investigated substrates were similar to those in the I only.
The changes in pH and TA in the supernatants from SS, WMP, and their mixtures are shown in Figure 1. The results were compared with those from I only. In general, the pH and TA of all variants increased slightly during MP from a pH value of about 7.0 to about 7.8 and from 40.0 to 95.0 mval/L of TA. This indicates that the conditions of MP were stable. As mentioned in Table 1 (Section 2), the initial pH and TA in the supernatant of I had the highest values compared to fresh SS and WMP. In the case of TA, the addition of substrates into I did not cause significant differences in this parameter either at the beginning of the measurements or during the process. The pH values in the supernatant of raw SS and in the water extract of raw WMP were 6.65 and 6.88, respectively. Thus, the addition of SS caused the pH to decrease, and the higher the content of SS the larger the difference between the pH values in I and the mixture. The changes in pH in the supernatant of WMP during the experiment were similar to those in I, with the pH increasing from 7.2 to ca. 7.7 after 30 days of measurements. The lowest pH was noted when SS was the only substrate. In this case, the pH in the supernatant of SS at the beginning and end of the measuring period was 6.9 and 7.6, respectively.
The initial orthophosphate concentration in the supernatants from all experimental variants was ca. 220 P-PO4 mg/L, as was the value noted in the supernatant from I. The concentration of P-PO4 in the supernatant of I increased slightly to 230 mg/L by day 10 and then decreased to around 150 mg/L on the final day of measurements. Due to the low P-PO4 concentration in the water extract from fresh WMP (4.5 mg/L), the addition of WMP into I caused the concentration to decrease to ca. 100 mg/L after the first 3 days of measurements. Then, the P-PO4 concentration in the supernatant of WMP ranged from 100 to 120 mg/L, and at the end of measurements, it was the lowest of all the variants (70 mg/L).
The P-PO4 concentration in the supernatant of raw SS was 30 mg/L. Therefore, adding SS to WMP increased the P-PO4 concentrations. The P-PO4 concentrations in the supernatants of WMP70:SS30 and WMP50:SS50 were similar to those in I only. In the case of the WMP30:SS70 and SS, the orthophosphate concentrations in the supernatants were higher than in I only. In the supernatant of WMP30:SS70, the concentration peaked on the first day (296 mg/L) and then remained at 250–270 mg/L.
In the supernatant of SS, the P-PO4 concentration increased sharply in the first 3 days to almost 300 mg/L and reached a final value of 350 mg/L.
Because the ammonium concentration in the supernatant of I was many times higher than in the supernatant of SS and water extract from WMP, the N-NH4 concentrations strongly depended on concentration in I. The N-NH4 concentration in the supernatant of I sharply increased in 3 days from 484.4 mg/L to 616.0 mg/L, and then only a slight increase was noted up to 669.2 mg/L. Generally, the changes in N-NH4 concentration in the supernatants from all experimental variants were divided into two stages. The N-NH4 concentration gradually increased in the first 10 days, however, with the higher content of SS in the mixture, a more rapid increase was observed. In the case of WMP70:SS30 and SS the N-NH4 concentration after 10 days was 632.8 mg/L and 641.2 mg/L, respectively. Then, the N-NH4 concentration remained stable.
3.1.2. Change in Concentration of COD, VFA, and the DM Content during AD
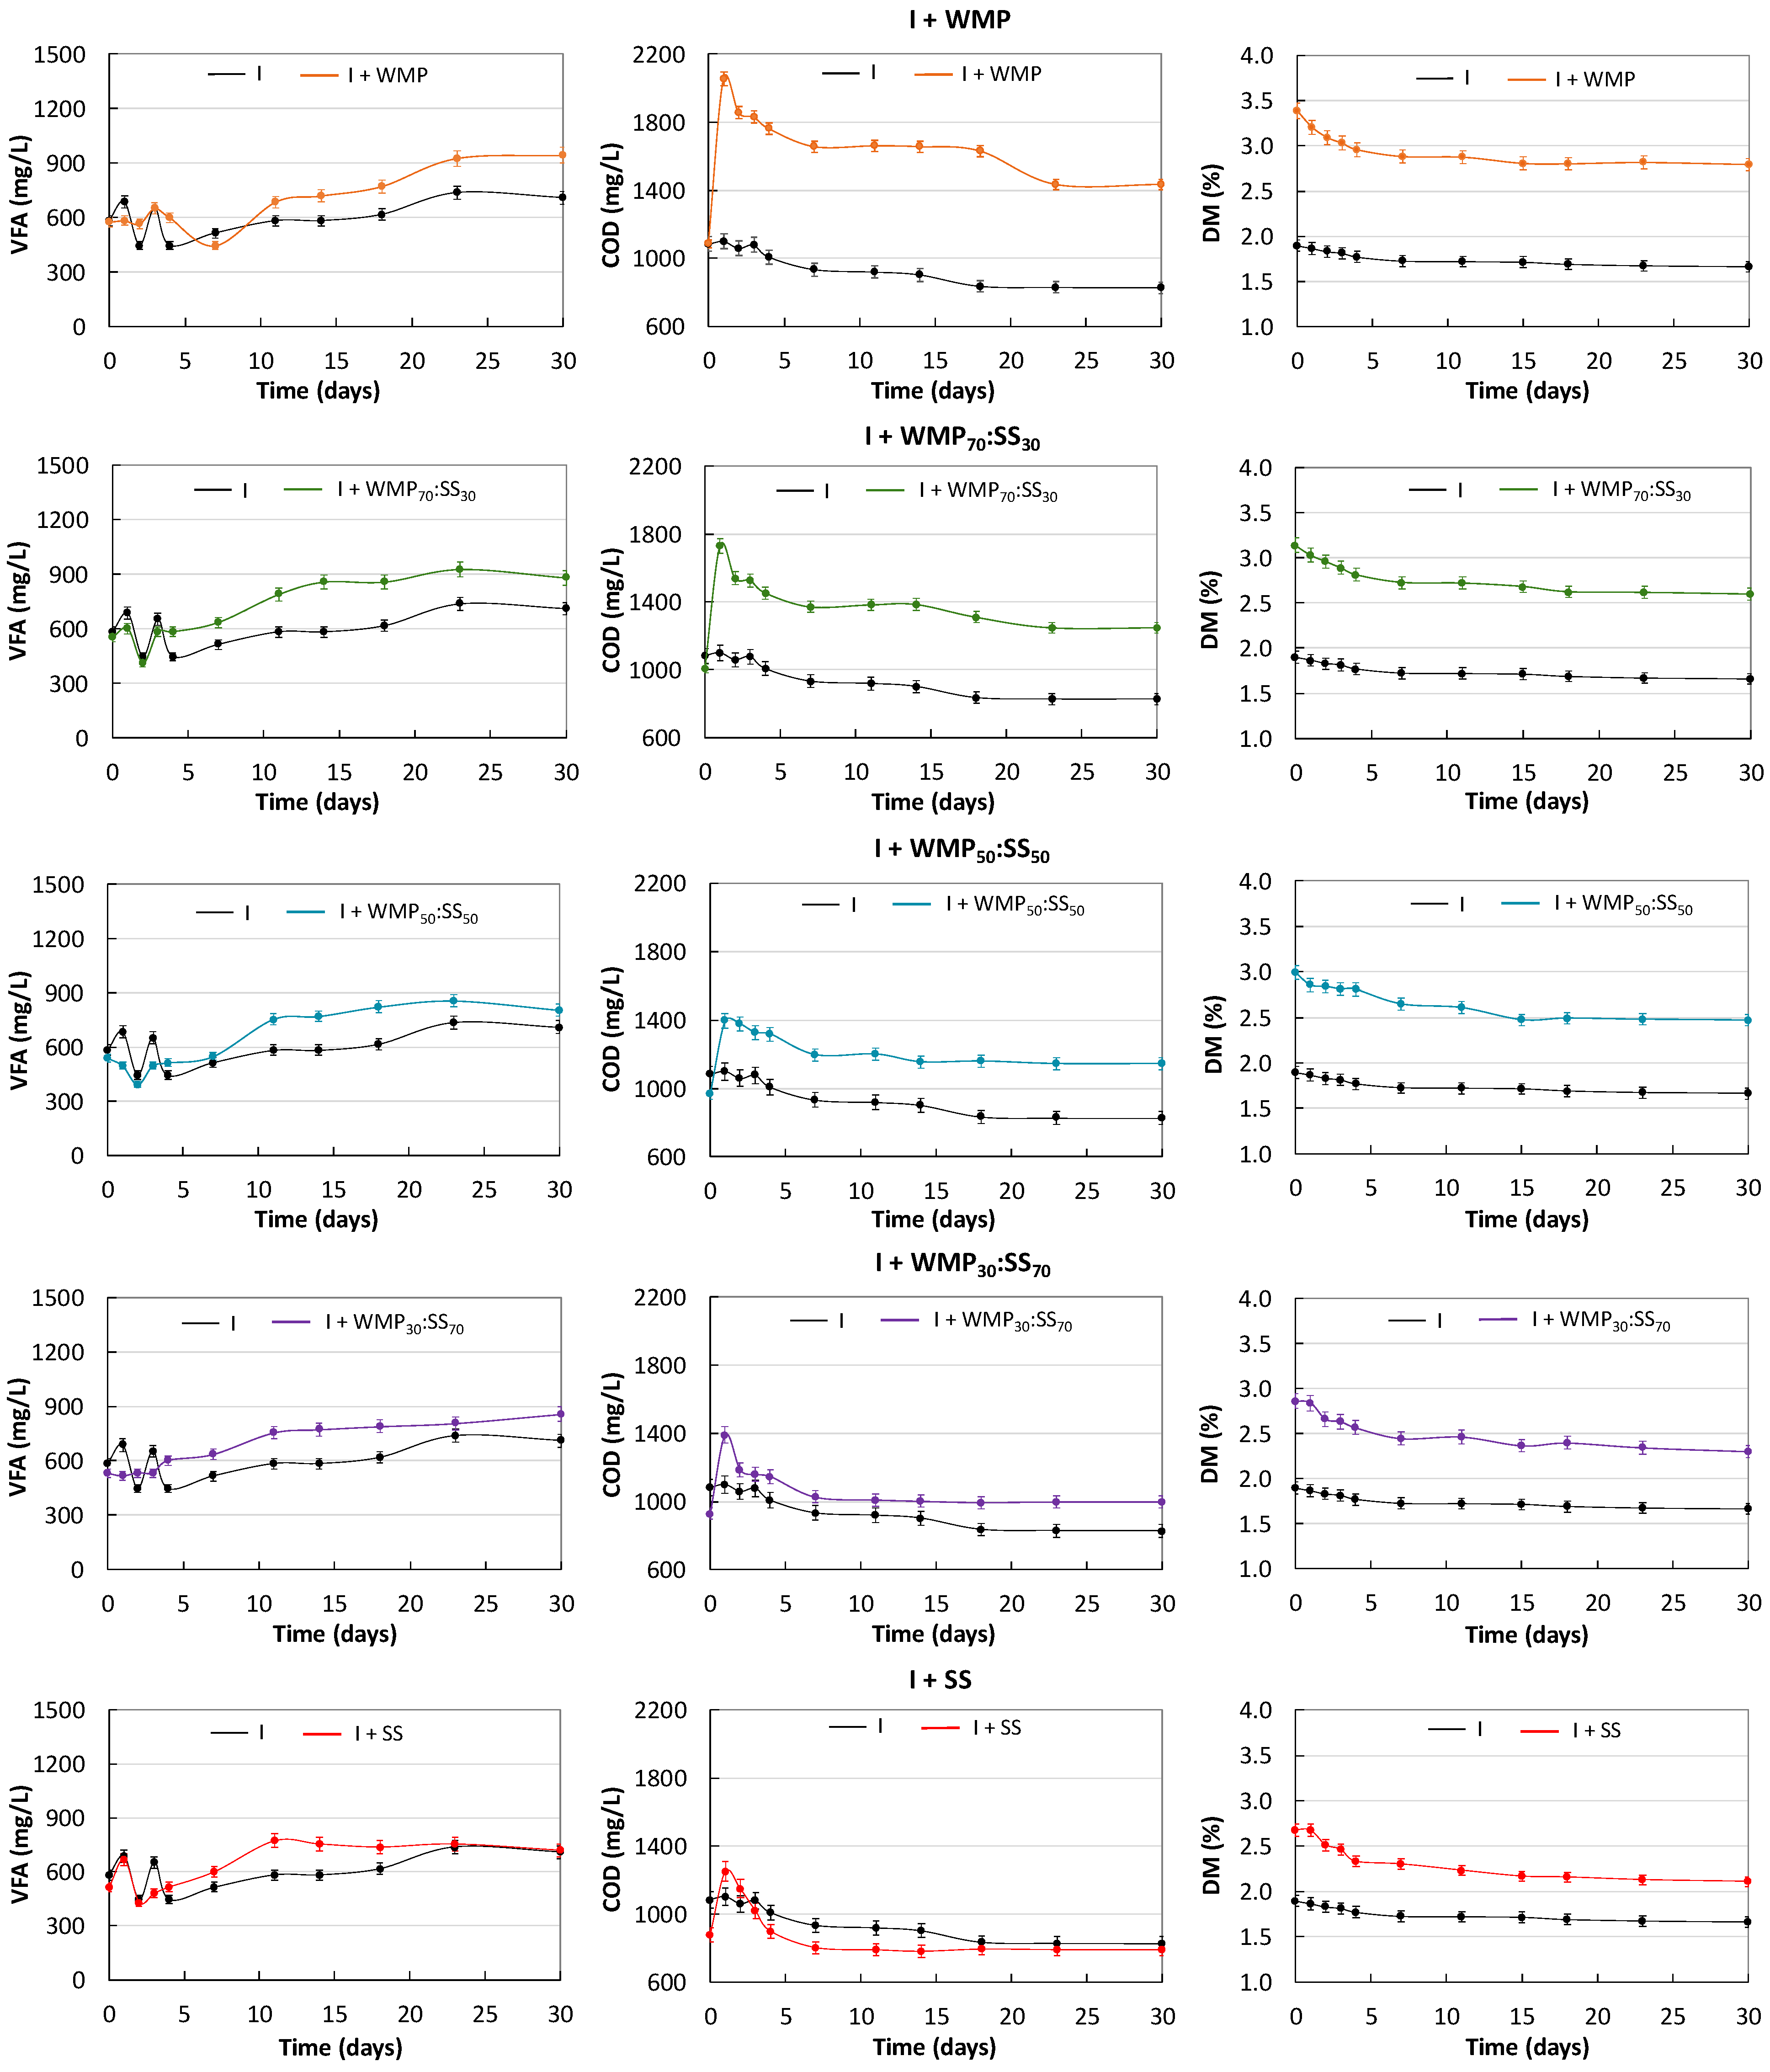
Figure 2 presents the changes in concentrations of COD, VFA, and the DM content during AD. The initial COD concentration in the supernatants of I and of WMP was similar at ca. 1100 mg/L. The addition of SS into the mixture with WMP caused this initial concentration to decrease, and its value was lowest in the supernatant of SS (approximately 878 mg COD/L). After 1 day, the COD concentration peaked in the supernatants of all variants, and it was highest in the supernatant of WMP, with a value of 2056 mg/L, followed by WMP70:SS30 (1730 mg COD/L) and WMP30:SS70 (1185 mg COD/L). After this, the COD concentration gradually decreased in all variants. After 30 days of MP, the COD concentration was highest in the supernatant of WMP (1433 mg COD/L) and lowest in the supernatant of SS (790 mg COD/L).
As shown in Table 1 (Section 2), the VFA concentrations in the supernatants of I, raw SS, and the water extract of raw WMP were 582.9, 66.6, and 44.6 mg VFA/L, respectively. The VFA concentration in the supernatant of I displayed some fluctuations, reaching a maximum of 737 mg VFA/L.
At the beginning of measurements, the VFA concentration in the supernatant of WMP was the lowest of all the variants and similar to that in the supernatant of I. During 30-day MP, the VFA concentration of WMP was higher than that of I, and it gradually increased up to 945 mg VFA/L on the last day. In the supernatants of the mixtures of SS and WMP and that of SS only, the VFA concentrations were also higher than that of I. However, the higher the content of SS was in a mixture with WMP, the lower the VFA concentration was in the supernatant.
The content of DM in all variants also decreased gradually during the measurements. Among the variants, WMP had the highest DM content at the beginning and on the last day, at 3.39% and 2.79%, respectively. Adding SS to WMP reduced the DM content, which was lowest in SS at 2.68% and 2.11% at the beginning and on the last day of measurements, respectively (Figure 2).
3.2. Methane Production and Changes in OM Content in the Substrates Subjected to Anerobic Digestion
3.2.1. Methane Production from WMP and SS
The results of MP in mL obtained by the AMPTS were used to determine MP in relation to the OM content of the investigated substrates. Figure 3 shows the changes in MP during 30 days of AD. The maximum cumulative MP of WMP was the lowest of all the experimental variants (approx. 60 NL/kg OM), and the methane content of the biogas was also the lowest (51%). In this variant, cumulative MP increased until day 15 and then remained stable for the rest of the digestion period. However, it took only 7 days to reach over 90% of total MP. As the SS dose was increased in the mixtures with WMP, it took longer to reach over 90% of total MP (9, 11, and 13 days with WMP70:SS30, WMP50:SS50, and WMP30:SS70, respectively) and maximum cumulative MP (16, 18, and 20 days, respectively). Moreover, MP and the content of methane in biogas increased as the proportion of SS was increased. With 30% SS, the methane content was 61%; with 50% SS, it was 62%; and with 70% SS, it was 64%. The maximum cumulative MP was highest with SS (253.2 NL/kg OM after 23 days). In this variant, it took 15 days to reach 90% of total MP, and the methane content in biogas was highest (67%).
Based on an analysis of elemental or organic composition, the theoretical methane production (TMP) of a material can be calculated, and then its biodegradability can be estimated, which is useful for designing an AD process and assessing its performance. The TMP is calculated based on the elemental composition of the substrates and their mixtures and is shown in Figure 3. The characteristics of the substrate (its elemental composition) strongly affect the TMP. In this study, the TMP of WMP was highest at 506 NL/kg OM; TMP values gradually decreased as the content of SS was increased, and the TMP of SS was lowest at 470 NL/kg OM. Thus, the MP achieved with the AMPTS constituted 12% (with WMP) and 54% (with SS) of TMP. This can be explained by the fact that the TMP value assumes complete conversion of organic matter into methane, without accounting for the actual biodegradability of the OM in anaerobic conditions. Instead, the hydraulic retention time (HRT) of the AD reactor is adjusted to the digestion conditions and the substrate to maximize biogas production. In practice, the HRT is usually 20–30 days, and during this time, OM is converted into biogas. At a technical scale, digesters are commonly operated with continuous feeding, which means that new portions of substrate with OM are constantly supplied. This means that OM decreases to a level that depends on the substrate being digested and the AD conditions. This specific OM level is adjusted to balance effective biogas production and OM content in the effluent from the AD reactor. But OM is never completely converted at a technological scale. In the present study, which was carried out with batch experiments, the substrate as supplied to the reactor at the beginning of the measurements. When MP plateaued, this meant that the biodegradable OM had already been converted into biogas. In this study, even though WMP had the lowest initial content of OM, after 30 days of measurements, its OM content was highest of all the substrates. Thus, OM removal was lowest during biodegradation of WMP (2.35 kg OM/m3 removed, with an initial content of 10 kg OM/m3). MP with WMP was the lowest of all the tested variants, and thus it had the largest difference between MP and TMP (60 NL/kg OM vs. 506 NL/kg OM). Raising the proportion of SS in the mixture increased both (i) MP and (ii) the effectiveness of OM removal. With larger amounts of SS, the final OM content was lower, which indicates that OM from SS was more susceptible to biodegradation. Moreover, the resulting difference between MP and TMP was smaller. Finally, with only SS, the MP and TMP values were 253 NL/kg OM and 470 NL/kg OM, respectively.
3.2.2. Changes in OM Content during Anaerobic Digestion of WMP and SS
During the 30-day experiment, the contents of DM (Figure 3) and OM were analyzed in the mixtures of substrate(s) and I and in I only. Based on these measurements, the changes in OM content in the substrate(s) were calculated. OM content for the substrate was expressed as % DM and then recalculated as kg OM/m3 (taking into account that the initial OLR was 10 kg OM/m3 (Section 2)).
The decreases in OM content (% DM) during AD are shown in Figure 3. The initial OM content in raw WMP was 64.8% DM, whereas in raw SS, it was 75.8% DM. When the content of SS increased in the mixture with WMP, the content of OM also increased; thus, the initial OM contents were 68.1% DM, 70.3% DM, and 72.5% DM in WMP70:SS30, WMP50:SS50, WMP30:SS70, respectively. Additionally, when the content of SS in the mixture with WMP was increased, the overall removal of OM content from the substrates also increased; i.e., even though the initial OM content was increased in the mixtures with SS, the final OM content was lower. The overall removal of OM content was lowest with WMP, at 15.21% DM, and highest with SS, at 29.60% DM.
As mentioned, the initial OLR was 10 kg OM/m3. Based on the OM content in terms of % DM, the decrease in OM content was calculated as kg OM/m3. The final OM content was highest in WMP at 7.7 kg OM/m3. In the mixtures of WMP and SS, the final OM content was reduced as the SS content was increased (7.2 kg OM/m3, 6.9 kg OM/m3, and 6.6 kg OM/m3 in WMP70:SS30, WMP50:SS50, and WMP30:SS70, respectively). In the variant with SS only, the final OM content was lowest at 6.1 kg OM/m3 (Figure 3).
Based on the changes in the contents of OM and MM in the substrates, the effectiveness of OM removal (EOMrem) was calculated (Figure 3). The EOMrem was lowest with WMP, at 46.6%. When the content of SS in the mixtures was increased, the EOMrem also increased to 55.3% with WMP70:SS30, 60.1% with WMP50:SS50, and 64.9% with WMP30:SS70. The EOMrem was highest, at more than 72%, with SS. The highest value of EOMrem and, consequently, the lowest final content of OM with more effective methane production indicate that the organics were degraded most efficiently in this variant.
In general, organic matter removal during fermentation indicates that biodegradable organic substances have been converted into biogas, so only compounds with low biodegradability remain. Thus, the OM in digestate becomes more stable than that in the feedstock. However, the assumption that a lower final content of OM always means more stable digestate is only true if the same substrate or group of substrates (with the same proportions) are used in anaerobic biodegradation in different technological variants. Thus, it was possible for Bernat et al. [30] to determine the effect of hydrothermal and enzymatic pre-treatment of separately collected real biowaste (B) on methane production and the efficiency of organics removal. The highest effectiveness of OM removal was obtained in biowaste after enzymatic pre-treatment. Consequently, in this biowaste, the lowest final OM content was found, which means that the organics were used most efficiently, and a more stable final product was obtained. The stability of digestate is extremely important from the point of view of its further utilization, e.g., in agriculture. During anaerobic digestion, retention times are optimized to maintain high methane production rates [31]. As a result, OM degradation may be low and the effluents may still contain easily degradable organic fermentation intermediates [32,33] which is undesirable when digestate is applied to soils.
It is known that MP is influenced by the composition of the substrates, including their contents of carbohydrates, proteins, lipids, and lignocellulosic substances. A substrate with a higher lipid content provides a higher methane yield [34]. According to Bhajani and Pal [35], the methane contents of biogas produced with carbohydrates, proteins, and lipids were 50%, 60%, and 72%, respectively. As was mentioned, the biodegradability of WMP can differ due to differences in the composition of the mushroom substrate. For example, Luo et al. [17] found large shares of lignocellulosic substances in three kinds of WMP of different compositions (various proportions of corncob, rice bran, and saw dust). Those authors reported that the contents of cellulose, hemicellulose, and lignin were 16.7–23.1%, 25.7–28.5%, and 7.9–11.6%, respectively. Thus, the three kinds of WMP consisted of more than 50% lignocellulosic substances. In contrast, the content of lignocellulosic materials in excess sewage sludge is much lower, and Bernat et al. [22] found that it did not exceed 20%, with ca. 3% lignin content. Whereas lignin, which is more resistant to biodegradation, predominates in WMP, proteins and lipids, which are easier to degrade, predominate in SS. Thus, the substrates that were used for co-digestion in the present study (WMP and SS) have markedly different characteristics: the SS had an initial OM content of 75.84% DM, whereas the WMP had a lower initial OM content of 64.79% DM. The WMP was composed mainly of wheat straw and chicken manure, which made it a lignocellulose-rich substrate and less degradable than the SS under anaerobic conditions. However, the WMP would most likely produce more stable digestate.
The MP results reported in this paper indicate that there is a possibility of joint management of WMP and SS generated in rural areas. Even though the maximum cumulative MP from WMP was relatively low (approx. 60 NL/kg OM), both MP and the content of methane in the biogas increased when it was co-digested with SS: with 30%, 50%, and 70% shares of SS, MP increased almost 2, 2.5, and 3.3 times, and the methane content increased to 61%, 62%, and 64%, respectively. These results show that AD can be considered as a method for WMP management when using SS as a co-substrate. This would allow for environmentally friendly management of biowaste generated by the mushroom agroindustry, while eliminating nuisances (e.g., the release of greenhouse gases from spontaneous anaerobic digestion) and reducing costs for WMP entrepreneurs (e.g., the cost of transportation to treatment plants and the costs of disposal). If SS is available, the shares of WMP and SS in the AD feedstock can be adjusted so that the biogas yield is as high as possible. However, if a large amount of WMP needs to be managed, a small share of SS could be applied. In this case, MP and methane content would be lower, but they could still be sufficient for the farm’s own needs.
To date, studies on MP from WMP have been limited. In one such study, Gao et al. [14] investigated MP (mesophilic conditions: 35 °C) from WMP alone (the authors called it spent mushroom substrate, SMS) and WMP co-digested with manure. The WMP was obtained from a yellow-back fungus planting and consisted of wood chips, corncobs, and other ingredients (such as corn flour and lime) and had DM and OM contents of 48.5% and 66.4% DM, respectively. The authors found that WMP alone produced almost no methane, likely due to its high lignin content and unfavorable C/N ratio. This suggested co-digestion with manure from different types of livestock (pig manure (PM), chicken manure (CM), and dairy manure (DM)). The authors then found that the use of mixtures of WMP/CM and WMP/PM increased MP by 140–400% and by 17–62.2%, respectively. They reported that CM was the most suitable manure for mixed fermentation with this kind of WMP, as MP was highest (111 L/kg VS) with a WMP to CM ratio of 1:9. The authors suggested that the use of CM improved the C/N ratio of the mixture for MP.
Sethumadhavan and Selvan [20] conducted research on increasing MP from WMP (after cultivating Pleurotus florida on rice straw) using a different co-substrate, wastepaper (WP). Powdered WP and WP in the form of briquettes were used, and both had 20.56% DM and a VS content of more than 90% DM. The experiment was carried out at 37 ± 1.0 °C for 50–60 days with an organic loading rate of 2 g VS. The authors reported that MP with the WMP that they used was 2.5 times higher than the value in the present study (148 mL/g VS). Surprisingly, MP was lower with WP (87 mL/g VS) than with WMP. However, MP with a mixture of WMP and WP in powder form was 168 mL/g VS and even higher with a mixture of WMP and WP in briquette form (250 mL/g VS).
3.2.3. Kinetics of MP and OM Removal (% DM) from the Substrates Subjected to AD
A first-order kinetics model accounted for nearly all of the variation in MP and OM removal during AD of the substrates and their mixtures (R2 > 0.97). The maximal MP, the overall OM removal content, and the kinetic parameters of MP and of OM removal (obtained from the kinetics model, the kinetic coefficient, and the initial rate) depended on the particular blend of substrates that were degraded. A summary of the kinetics model equations and the parameters of MP and OM removal kinetics (in kg OM/m3) are provided in Table 4.
There was a relationship between the parameters of MP kinetics (Figure 4). With WMP alone, the coefficient of MP kinetics (kCH4) was the highest of all the tested variants, at 0.211 d−1, and the initial rate of MP (rCH4) was the lowest, at 12.5 NL/(kg OM·d). With SS alone, in contrast, kCH4 was the lowest (0.146 d−1) and rCH4 was the highest (36.8 NL/(kg OM·d)). As the SS content in the mixtures was increased, rCH4 also increased, from 22.7 NL/(kg OM·d) with WMP70:SS30 to 33.8 NL/(kg OM·d) with WMP30:SS70. In contrast, kCH4 decreased from 0.201 d−1 with WMP70:SS30 to 0.174 d−1 with WMP30:SS70. A similar relationship between the parameters of OM removal kinetics was observed (Figure 4). The rate of OM removal increased from 0.51 kg OM/(m3·d) with WMP alone up to 0.59 kg OM/(m3·d) with SS alone, whereas the coefficient of OM removal decreased from 0.215 d−1 to 0.152 d−1. However, maximal MP and overall OM removal both increased simultaneously, i.e., greater production of biogas/methane corresponded to greater overall removal of OM content during degradation. This was mostly due to increases in the degradability of OM in the substrate for AD [36].
The kinetic coefficient of methane production depends on the kind of substrate. For example, Bernat et al. [30] showed that, during biowaste digestion, kCH4 was higher than that in this study and changed from 0.56 to 0.32 d−1. Additionally, the differences in kCH4 values resulted from biowaste pre-treatment. Hydrothermal pre-treatment biowaste give higher kCH4 than biowaste without pre-treatment and biowaste and enzymatic additive (0.56 ± 0.02 vs. 0.32 ± 0.02 and 0.34 ± 0.02 d−1). Furthermore, the initial methane production rate (rCH4) was highest for biowaste after hydrothermal pre-treatment (141.8 ± 1.2 NL/(kg OM·d)). The dependence of kCH4 values on the substrates (different vegetable crop residues) was also demonstrated by Li et al. [37]. The authors digested snap bean crop residues (SBRs), capsicum crop residues (CARs), cucumber crop residues (CURs), eggplant crop residues (EGRs), and tomato crop residues (TORs) and showed the highest kCH4 (0.167 d−1) for SBRs and the lowest for TORs (0.094 d−1).
4. Conclusions
Because WMP often comprises organic substrates, it could potentially be used as a substrate for producing bioenergy. Efficient AD for managing and handling WMP may be necessary to reduce its carbon footprint and lower treatment costs. In addition, the production of biogas using WMP in mushroom farms to create a closed-loop energy generation method is sustainable and would help offset energy costs. Thus, the present study investigated co-digestion of WMP with municipal sewage sludge (SS). The maximum cumulative MP from WMP was relatively low (approx. 60 NL/kg OM), and the EOMrem was lowest, at 46.6%. Co-digesting WMP with 30%, 50%, and 70% shares of SS increased MP as much as 2, 2.5, and 3.3 times and raised the methane content in biogas as high as 61%, 62%, and 64%, respectively. The EOMrem also increased to 55.3%, 60.1%, and 64.9%, respectively. Also, the initial rate of MP and of OM removal increased (from 12.5 to 36.8 NL/(kg OM·d) and from 0.51 kg OM/(m3·d) to 0.59 kg OM/(m3·d), respectively), whereas the kinetic coefficients of MP and OM removal decreased (from 0.211 to 0.146 d−1 and from 0.215 to 0.152 d−1, respectively). Thus, co-digestion may enable profitable utilization of both waste products on mushroom farms. Moreover, the flexibility of this approach means that varying shares of WMP and SS can be used, depending on their availability, although it should be remembered that higher shares of WMP reduce gas productivity.
Author Contributions
Conceptualization, K.B. and D.K.; methodology, K.B. and T.C.T.L.; formal analysis, K.B. and D.K.; validation, K.B. and T.C.T.L.; investigation, K.B., T.C.T.L. and R.T.; resources, K.B.; data curation, K.B. and T.C.T.L.; writing—original draft preparation, K.B., D.K., T.C.T.L. and R.T.; writing—review and editing, K.B., D.K. and T.C.T.L.; visualization, T.C.T.L. and K.B.; supervision, K.B. and D.K. All authors have read and agreed to the published version of the manuscript.
Funding
We are grateful for the financial support of the Ministry of Education and Science, Poland (statutory project No. 29.610.024-110).
Data Availability Statement
Data are contained within the article.
Conflicts of Interest
The authors declare no conflict of interest.
References
- Wang, J.; Azam, W. Natural resource scarcity, fossil fuel energy consumption, and total greenhouse gas emissions in top emitting countries. Geosci. Front. 2024, 15, 101757. [Google Scholar] [CrossRef]
- Martin, F.; Felgueiras, C.; Smitkova, M.; Caetano, N. Analysis of fossil fuel energy consumption and environmental impacts in European countries. Energies 2019, 12, 964. [Google Scholar] [CrossRef]
- Veeken, A.; Hamelers, B. The effect of temperature on hydrolysis rates of selected biowaste components. Bioresour. Technol. 1999, 69, 249–254. [Google Scholar] [CrossRef]
- Pohl, M.; Mumme, J.; Heeg, K.; Nettmann, E. Thermo- and mesophilic anaerobic digestion of wheat straw by the upflow anaerobic solid-state (UASS) process. Bioresour. Technol. 2012, 124, 321–327. [Google Scholar] [CrossRef] [PubMed]
- Labatut, R.A.; Angenent, L.T.; Scott, N.R. Conventional mesophilic vs. thermophilic anaerobic digestion: A trade-off between performance and stability? Water Res. 2014, 53, 249–258. [Google Scholar] [CrossRef] [PubMed]
- Yang, T.; Li, Y.; Gao, J.; Huang, C.; Chen, B.; Zhang, L.; Wang, X.; Zhao, Y.; Xi, B.; Li, X. Performance of dry anaerobic technology in the co-digestion of rural organic solid wastes in China. Energy 2015, 93, 2497–2502. [Google Scholar] [CrossRef]
- Wang, Z.; Jiang, Y.; Wang, S.; Zhang, Y.; Hu, Y.; Hu, Z.H. Impact of total solids content on anaerobic co-digestion of pig manure and food waste: Insights into shifting of the methanogenic pathway. Waste Manag. 2020, 114, 96–106. [Google Scholar] [CrossRef]
- Divya, D.; Gopinath, L.R.; Christy, P.M. A review on current aspects and diverse prospects for enhancing biogas production in sustainable means. Renew. Sustain. Energy Rev. 2015, 42, 690–699. [Google Scholar] [CrossRef]
- Martínez-Gutiérrez, E. Biogas production from different lignocellulosic biomass sources: Advances and perspectives. 3 Biotech 2018, 8, 233. [Google Scholar] [CrossRef]
- Shrestha, S.; Fonoll, X.; Khanal, S.K.; Raskin, L. Biological strategies for enhanced hydrolysis of lignocellulosic biomass during anaerobic digestion: Current status and future perspectives. Bioresour. Technol. 2017, 245, 1245–1257. [Google Scholar] [CrossRef]
- Liu, X.; Hiligsmann, S.; Gourdon, R.; Bayard, R. Anaerobic digestion of lignocellulosic biomasses pretreated with Ceriporiopsis subvermispora. J. Environ. Manag. 2017, 193, 154–162. [Google Scholar] [CrossRef] [PubMed]
- Mohd Hanafi, F.H.; Rezania, S.; Mat Taib, S.; Mohd Fadhil, M.D.; Yamauchi, M.; Sakamoto, M.; Shafiei Ebrahimi, S. Environmentally sustainable applications of agrobased spent mushroom substrate (SMS): An overview. J. Mater. Cycles Waste Manag. 2018, 14, 1383–1396. [Google Scholar] [CrossRef]
- Zisopoulos, F.K.; Becerra Ramírez, H.A.; van der Goot, A.J.; Boom, R.M. A resource efficiency assessment of the industrial mushroom production chain: The influence of data variability. J. Clean. Prod. 2016, 126, 394–408. [Google Scholar] [CrossRef]
- Ma, Y.; Wang, Q.; Sun, X.; Wang, X.; Su, W.; Song, N. A study on recycling of spent mushroom substrate to prepare chars and activated carbon. BioResources 2016, 9, 3939–3954. [Google Scholar] [CrossRef]
- Phan, C.; Sabaratnam, V. Potential uses of spent mushroom substrate and its associated lignocellulosic enzymes. Appl. Microbiol. Biotechnol. 2012, 96, 863–873. [Google Scholar] [CrossRef] [PubMed]
- Lau, K.L.; Tsang, Y.Y.; Chiu, S.W. Use of spent mushroom compost to bioremediate PAH-contaminated samples. Chemosphere 2003, 52, 1539–1546. [Google Scholar] [CrossRef]
- Luo, X.; Yuan, X.; Wang, S.; Sun, F.; Hou, Z.; Hu, Q.; Zhai, L.; Cui, Z.; Zou, Y. Methane production and characteristics of the microbial community in the co-digestion of spent mushroom substrate with dairy manure. Bioresour. Technol. 2018, 250, 611–620. [Google Scholar] [CrossRef]
- He, P.; Li, F.; Huang, L.; Xue, D.; Liu, W.; Xu, C. Chemical characterization and antioxidant activity of polysaccharide extract from spent mushroom substrate of Pleurotus eryngii. J. Taiwan Inst. Chem. Eng. 2016, 69, 48–53. [Google Scholar] [CrossRef]
- Gao, X.; Tang, X.; Zhao, K.; Balan, V.; Zhu, Q. Biogas production from anaerobic co-digestion of spent mushroom substrate with different livestock manure. Energies 2021, 14, 570. [Google Scholar] [CrossRef]
- Sethumadhavan, P.; Selvan, A.M.V. Effect of spent mushroom substrate and waste paper briquette on methane production from anaerobic digestion. J. Environ. Biol. 2018, 39, 269–276. [Google Scholar] [CrossRef]
- Mata-Alvarez, J.; Dosta, J.; Romero-Güiza, M.; Fonoll, X.; Peces, M.; Astals, S. A critical review on anaerobic co-digestion achievements between 2010 and 2013. Renew. Sustain. Energy Rev. 2014, 36, 412–427. [Google Scholar] [CrossRef]
- Bernat, K.; Cydzik-Kwiatkowska, A.; Wojnowska-Baryła, I.; Karczewska, M. Physicochemical properties and biogas productivity of aerobic granular sludge and activated sludge. Biochem. Eng. J. 2017, 117, 43–51. [Google Scholar] [CrossRef]
- Khawer, M.U.B.; Naqvi, S.R.; Ali, I.; Arshad, M.; Juchelková, D.; Anjum, M.W.; Naqvi, M. Anaerobic digestion of sewage sludge for biogas & biohydrogen production: State-of-the-art trends and prospects. Fuel 2022, 329, 125416. [Google Scholar] [CrossRef]
- Gunaseelan, V.N. Regression models of ultimate methane yields of fruits and vegetable solid wastes, sorghum and napiergrass on chemical composition. Bioresour. Technol. 2007, 98, 1270–1277. [Google Scholar] [CrossRef]
- Kafle, G.K.; Kim, S.H. Anaerobic treatment of apple waste with swine manure for biogas production: Batch and continuous operation. Appl. Energy 2013, 103, 61–72. [Google Scholar] [CrossRef]
- Buswell, A.M.; Mueller, H.F. The mechanism of methane fermentation. Ind. Eng. Chem. 1952, 44, 550–552. [Google Scholar] [CrossRef]
- Greenberg, A.E.; Clesceri, L.S.; Eaton, A.D. Standard Methods for the Examination of Water and Wastewater, 18th ed.; American Public Health Association (APHA): Washington, DC, USA, 1992. [Google Scholar]
- Srisowmeya, G.; Chakravarthy, M.; Nandhini Devi, G. Critical considerations in two-stage anaerobic digestion of food waste—A review. Renew. Sustain. Energy Rev. 2020, 119, 109587. [Google Scholar] [CrossRef]
- Wang, S.; Ma, F.; Ma, W.; Wang, P.; Zhao, G.; Lu, X. Influence of temperature on biogas production efficiency and microbial community in a two-phase anaerobic digestion system. Water 2019, 11, 133. [Google Scholar] [CrossRef]
- Bernat, K.; Le, T.C.T.; Zaborowska, M.; Kulikowska, D. Pre-treatment of separately collected biowaste as a way to increase methane production and digestate stability. Energies 2023, 16, 1264. [Google Scholar] [CrossRef]
- Wellinger, A.; Murphy, J.D.; Baxter, D. The Biogas Handbook: Science, Production and Applications; Elsevier: Amsterdam, The Netherlands, 2013. [Google Scholar] [CrossRef]
- Braun, R. Anaerobic digestion: A multi-faceted process for energy, environmental management and rural development. In Improvement of Crop Plants for Industrial End Uses; Springer: Berlin/Heidelberg, Germany, 2007; pp. 335–416. [Google Scholar] [CrossRef]
- Rosato, M.A. Managing Biogas Plants, 1st ed.; CRC Press: Boca Raton, FL, USA, 2017. [Google Scholar] [CrossRef]
- Singh, S.; Kaushik, K.S.; Prasanth, B.; Nayak, S.K. Factors affecting anaerobic digestion of organic waste. Int. J. Eng. Res. Mech. Civ. Eng. (IJERMCE) 2018, 3, 99–103. [Google Scholar]
- Bhajani, S.S.; Pal, S.L. Review: Factors affecting biogas production. Int. J. Res. Appl. Sci. Eng. Technol. (IJRASET) 2022, 10, 79–88. [Google Scholar] [CrossRef]
- Hallaji, S.M.; Kuroshkarim, M.; Moussavi, S.P. Enhancing methane production using anaerobic co-digestion of waste activated sludge with combined fruit waste and cheese whey. BMC Biotechnol. 2019, 19, 19. [Google Scholar] [CrossRef] [PubMed]
- Li, P.; Li, W.; Sun, M.; Xu, X.; Zhang, B.; Sun, Y. Evaluation of biochemical methane potential and kinetics on the anaerobic digestion of vegetable crop residues. Energies 2019, 12, 26. [Google Scholar] [CrossRef]
Figure 1.
pH, TA, N-NH4, and P-PO4 concentrations in supernatants in 5 experimental variants (substrate(s) and I) during the measurements of MP.
Figure 1.
pH, TA, N-NH4, and P-PO4 concentrations in supernatants in 5 experimental variants (substrate(s) and I) during the measurements of MP.

Figure 2.
The VFA and COD concentrations in supernatants and DM content of 5 experimental variants (substrate(s) and I) during the measurements of MP.
Figure 2.
The VFA and COD concentrations in supernatants and DM content of 5 experimental variants (substrate(s) and I) during the measurements of MP.

Figure 3.
MP from substrate and their mixtures and decrease in OM content during biodegradation of WMP, SS, and their mixtures; black lines present the kinetic models for MP and decrease in OM content.
Figure 3.
MP from substrate and their mixtures and decrease in OM content during biodegradation of WMP, SS, and their mixtures; black lines present the kinetic models for MP and decrease in OM content.

Figure 4.
Relationships between the kinetics parameters of MP (rCH4, kCH4) and OM removal in kg OM/m3 (rOMrem, kOMrem) from the substrates subjected to anaerobic digestion.
Figure 4.
Relationships between the kinetics parameters of MP (rCH4, kCH4) and OM removal in kg OM/m3 (rOMrem, kOMrem) from the substrates subjected to anaerobic digestion.

Table 2.
Doses of substrates (w/w OM) in AMPTS and additional bioreactors.
| Variant | AMPTS Bioreactors | Additional Bioreactors | ||
|---|---|---|---|---|
| WMP (g) | SS (g) | WMP (g) | SS (g) | |
| WMP | 4.63 | – | 3.09 | – |
| WMP70:SS30 | 3.24 | 24.67 | 2.16 | 16.45 |
| WMP50:SS50 | 2.32 | 41.12 | 1.54 | 27.41 |
| WMP30:SS70 | 1.39 | 57.57 | 0.93 | 38.38 |
| SS | – | 82.24 | – | 54.82 |
| I | 300 mL | 200 mL | ||
Table 3.
Characteristics of elementary compositions of substrates.
| Elemental Composition: | WMP | WMP70:SS30 | WMP50:SS50 | WMP30:SS70 | SS |
|---|---|---|---|---|---|
| Carbon, % | 33.99 ± 0.87 | 34.75 ± 0.88 | 35.26 ± 0.92 | 35.77 ± 0.98 | 36.54 ± 1.02 |
| Hydrogen, % | 3.96 ± 0.11 | 4.40 ± 0.13 | 4.69 ± 0.15 | 4.98 ± 0.19 | 5.42 ± 0.22 |
| Oxygen, % | 27.05 ± 0.65 | 27.22 ± 0.65 | 27.33 ± 0.67 | 27.44 ± 0.66 | 27.61 ± 0.59 |
| Nitrogen, % | 2.50 ± 0.10 | 3.93 ± 0.12 | 4.88 ± 0.15 | 5.84 ± 0.25 | 7.27 ± 0.31 |
| TMP (NL/kg OM) | 506.14 | 494.45 | 487.05 | 479.85 | 469.50 |
| Chemical composition | C15.9H22.2O8.5N | C10.3H15.7O5.7N | C8.4H13.5O4.6N | C7.2H12.0O3.9N | C5.9H10.5O3.2N |
Table 4.
Parameters of kinetics of MP and OM removal (kg OM/m3) from the substrates subjected to AD.
Table 4.
Parameters of kinetics of MP and OM removal (kg OM/m3) from the substrates subjected to AD.
| Variant | Kinetics Parameters | |
|---|---|---|
| CH4 Production | Decrease in OM Content | |
| WMP | d−1 L/(kg OM·d) | d−1 kg OM/(m3·d) |
| WMP70:SS30 | d−1 L/(kg OM·d) | d−1 kg OM/(m3·d) |
| WMP50:SS50 | d−1 L/(kg OM·d) | d−1 kg OM/(m3·d) |
| WMP30:SS70 | d−1 L/(kg OM·d) | d−1 kg OM/(m3·d) |
| SS | d−1 L/(kg OM·d) | d−1 kg OM/(m3·d) |
Disclaimer/Publisher’s Note: The statements, opinions and data contained in all publications are solely those of the individual author(s) and contributor(s) and not of MDPI and/or the editor(s). MDPI and/or the editor(s) disclaim responsibility for any injury to people or property resulting from any ideas, methods, instructions or products referred to in the content. |
© 2024 by the authors. Licensee MDPI, Basel, Switzerland. This article is an open access article distributed under the terms and conditions of the Creative Commons Attribution (CC BY) license (https://creativecommons.org/licenses/by/4.0/).
Share and Cite
MDPI and ACS Style
Bernat, K.; Le, T.C.T.; Kulikowska, D.; Thapa, R. Anaerobic Digestion as a Possible Method of Managing Waste from Mushroom Production with Sewage Sludge as Co-Substrate. Energies 2024, 17, 1938. https://doi.org/10.3390/en17081938
AMA Style
Bernat K, Le TCT, Kulikowska D, Thapa R. Anaerobic Digestion as a Possible Method of Managing Waste from Mushroom Production with Sewage Sludge as Co-Substrate. Energies. 2024; 17(8):1938. https://doi.org/10.3390/en17081938
Chicago/Turabian StyleBernat, Katarzyna, Thi Cam Tu Le, Dorota Kulikowska, and Ram Thapa. 2024. "Anaerobic Digestion as a Possible Method of Managing Waste from Mushroom Production with Sewage Sludge as Co-Substrate" Energies 17, no. 8: 1938. https://doi.org/10.3390/en17081938
Note that from the first issue of 2016, this journal uses article numbers instead of page numbers. See further details here.