Article

Towards a Net Zero-Emission Electricity Generation System by Optimizing Renewable Energy Sources and Nuclear Power Plant

by
Mujammil Asdhiyoga Rahmanta
1,
Rahmat Adiprasetya Al Hasibi
2,*,
Handrea Bernando Tambunan
1,
Ruly
1,
Agussalim Syamsuddin
1,
Indra Ardhanayudha Aditya
1 and
Benny Susanto
1,3
1
PT. PLN (Persero) Puslitbang Ketenagalistrikan (Research Institute), Jl. PLN Duren Tiga No. 102, Pancoran, Jakarta 12760, Indonesia
2
Department of Electrical Engineering, Universitas Muhammadiyah Yogyakarta, Jl. Brawijaya, Kasihan, Bantul, Yogyakarta 55183, Indonesia
3
Department of Mechanical Engineering, University of Indonesia, Kampus UI, Depok 16424, Indonesia
*
Author to whom correspondence should be addressed.
Energies 2024, 17(8), 1958; https://doi.org/10.3390/en17081958
Submission received: 16 February 2024 / Revised: 14 March 2024 / Accepted: 10 April 2024 / Published: 19 April 2024
(This article belongs to the Section F1: Electrical Power System)

Abstract

:
Greenhouse gas emissions, including CO2 emissions, are an issue in the energy sector that must be addressed urgently. The energy sector, including electricity, has been given a global aim of net zero emissions (NZE). This article examines three scenarios for reaching net-zero emissions in power supply. These scenarios are baseline, NZE1, and NZE2. The baseline scenario represents power plant capacity planning based on existing regulations in the base year. The net zero emissions consisting of the NZE1 and NZE2 scenarios aim to achieve net zero emissions by 2060. The NZE1 and NZE2 scenarios differ in the usage of nuclear power plant technology. The NZE1 scenario employs advanced costs for small modular reactors and large reactors technology, whilst the NZE2 scenario employs the low cost of small modular reactors and large reactors. The three scenarios were implemented and examined using the low emissions analysis platform software. The analytical results demonstrate that the NZE1 and NZE2 scenarios can meet the net zero emission objective by 2058. The baseline scenario results in power plant capacity planning with an average annual CO2 emission growth rate of 3.58%. On the other hand, the baseline scenario has the lowest investment expenses, at only 44 billion USD.

1. Introduction

Environmental problems such as rising earth temperature and sea levels and increasing the risk of natural disasters such as floods and landslides are caused by climate change [1,2,3,4]. The increase of greenhouse gasses (GHG) such as CO2, CH4, NOx, and fluoride gases in the earth’s atmosphere is a major factor of climate change. The greenhouse effect phenomenon occurs because GHG in the atmosphere absorbs some of the solar radiation reflected by the earth’s surface. The trapped solar radiation causes an increase in the earth’s temperature, as in greenhouse technology [3,5,6]. The main contributor to GHG in the atmosphere is CO2, which comes from burning fossil fuels (60%) [7,8]. The dominant producer of CO2 comes from power generation activities [8,9,10].
The CO2 emission from the energy sector rose by 0.9% to 36.8 Gt in 2022 [8]. Reducing CO2 emissions can be achieved by making renewable energy sources account for 83% of newly added capacity or 40% of total capacity by 2022 [11]. The global energy sector’s net zero emissions (NZE) scenario states that CO2 emissions must be lowered to 23 Gt by 2030 and zero by 2050 to achieve a 1.5 °C temperature increase [12]. This issue was addressed in the Paris Agreement or Conference of Parties (COP 21). Through Nationally Determined Contribution (NDC), countries that have ratified the Paris Agreement develop frameworks and targets for reducing GHG emissions [13,14]. In 2050, the electricity demand is expected to increase to 150% of the current demand, or 62 × 103 TWh, based on the NZE scenario [12]. This report’s NZE scenario also considers the transportation sector’s electrification. According to these projections, the electricity demand worldwide will rise significantly, and lowering CO2 emissions from electricity production will present new difficulties. The difficulties are caused by economic factors, such as environment-friendly technology like renewable energy, which has limited sources and is more expensive than fossil-based power generation. A massive utilization of renewable technology will increase the cost of production and affect the economy [15].
Studies on using renewable energy in electricity generation have been extensively conducted as an alternative policy for reducing CO2 emissions on a national scale [16]. On a regional scale, using renewable energy in electricity generation can help to create a sustainable electricity supply system [17]. It was found in a study of Multi-objective Analysis of Sustainable Generation Expansion Planning based on Renewable Energy Potential: A case study of Bali Province of Indonesia [17]. Renewable energy also can reduce reliance on energy imports [18]. Renewable energy plays an essential role in providing electricity for the commercial, industrial, and social while emitting low levels of CO2 [19,20,21,22].
The decarbonization of the electricity generation system results in an electric power system dominated by variable renewable energy (VRE) sources. Thus, low-carbon and dispatchable electricity generation, such as carbon capture and storage (CCS), or zero-carbon generation, such as nuclear power, is critical to the electric power system [23,24] Given the current state of carbon capture, utilization and storage (CCUS) technology, which is not yet capable of 100% CO2 absorption, the NZE scenario, in the electricity generation system, can only be achieved by optimizing renewable and nuclear power [25,26,27].
As a VRE, photovoltaic (PV) panel-based electricity generation with a high penetration level can be integrated into power systems via batteries to overcome intermittent properties [28]. Batteries can integrate PV-based electricity generation into a dispatchable system [29]. Another study found that concentrating solar power (CSP) can help support a power system powered entirely by renewable energy sources [30]. In addition to PV and CSP, other renewable energy sources show potential for reaching zero emissions goals. These include bioenergy, which can take the form of bio alcohol for use as vehicle fuel [31], and the strategic planting of hedgerows to mitigate CO2 emissions in the atmosphere [32].
In terms of levelized cost of electricity (LCOE), Nuclear power plants (NPPs) are economically more competitive than renewable energy sources. NPP is one option for achieving the NZE scenario. Large reactors NPP have lower LCOE than PV, wind, geothermal, and biomass [27,33]. When NPPs are included in the NZE scenario alongside renewable energy and CCS, there is a significant increase in investment in electricity generation infrastructure compared to the baseline scenario [34]. With an increase in investment value, NPP implementation in the NZE scenario can be carried out by developed countries and developing countries as a policy reference for achieving NZE [35,36]. The combination of NPPs, especially small modular reactors and renewable energy like wind and PV with thermal energy storage, can mitigate the risk of uncertainty of variable renewable energy production in the grids. This scenario can offer grid flexibility without costly battery energy storage [37]. Furthermore, decision-maker’s policies must be flexible enough to accommodate various low-carbon technology implementation scenarios to achieve decarbonization in the power sector [38].
This article examines alternative scenarios for NZE in electricity generation systems in developing countries, using a case study of power systems in Sumatra, Indonesia. Sumatra Island is an Indonesian region with numerous renewable energy sources with high potential, which will be discussed in greater detail in the data and data sources section. In addition, a study of NPP implementation locations on Sumatra Island was conducted, which covered all NPP development standards [39]. Regarding electricity demand, the Sumatra power system accounts for 23% of Indonesia’s total electricity demand in 2022 [40]. Thus, implementing the NZE scenario in the Sumatran power system will significantly contribute to Indonesia’s NZE and meet the Paris Agreement target of 2050 [41].
Even though Indonesia has made significant progress in the sustainable energy transition, with a 13% share of renewable energy and the addition of 475 MW of renewable energy generation capacity by 2021, the use of fossil fuels in electricity generation remains dominant [42]. Thus, Indonesia, like other countries committed to the NZE in the energy system, must make new advances in energy policy, including electricity generation planning. The previous power plant capacity planning study should have accounted for the evolution of power plant technology in terms of technical, economic, and environmental factors. This article aims to close the gap by incorporating year-over-year technological advancements, in terms of capital and operation cost, into the model.
The model developed by this study is critical, particularly for developing countries or regions seeking to meet NZE targets in the face of rising demand for electricity to support economic growth. The model developed from this study generates investment scenarios in the electric power sector to meet the NZE target by 2060. The model was created using the Low Emission Analysis Platform (LEAP) to examine various scenarios that are feasible to implement [43]. This article primarily focuses on two key contributions:
  • creating electricity supply models that lead to a zero-emission electricity system by optimizing renewable energy sources and nuclear power, and
  • conducting scenario analyses to achieve a zero-emission electrical power system by comparing various scenarios applicable to developing countries.
The scenarios presented in this article are the baseline and NZE scenarios. The NZE scenario incorporates low-carbon electricity generation technologies, renewable energy, and NPP. In this article, the NPPs analyzed are divided into two categories based on capital costs: higher-cost NPP (small modular reactors) and lower-cost NPP (light water reactors and advanced light water reactors). The NPP capital cost in question is the initial investment cost per kilowatt of capacity.

2. Methods

LEAP is used to generate energy models for Sumatra’s power system by analyzing various scenarios regarding reducing emissions, selecting power generation technology, and investment scenarios. The Next Energy Modeling for Optimization (NEMO) algorithm, which is a model used within LEAP, is used in optimization calculations to determine the optimal power system [43,44]. NEMO utilizes a mixed integer linear programming (MILP) formulation. The solver used in this context is CPLEX by IBM, a widely recognized solver for solving MILP problems. The Sumatra system’s electricity demand is projected using LEAP for each activity sector. The analysis of each scenario is based on the same electricity demand projection results, as the demand side scenario is not used in the model presented in this article. LEAP can calculate energy demand projections at the national and sectoral levels [45,46]. Energy demand projections can also be used to assess the impact of various policy options [47].
Regarding power system planning, LEAP and NEMO can be used to determine the development of power generation capacity based on demand-side scenarios, reducing power losses and emissions [48]. LEAP can also be used to analyze the integration of various renewable energy sources into the power system [49]. Aside from that, LEAP can be used to assess the role of one type of renewable energy in generating electricity [50]. LEAP can also model a power system that uses only renewable energy sources [51]. LEAP can be used to plan for electricity supply in the long term [52].

2.1. LEAP-NEMO Calculations

LEAP-NEMO’s optimization calculations are based on meeting electricity needs, with demand projected based on population growth and economic activity. Annual electricity demand over the projection period is expressed as:
E D t = E D t 1 + E D t 1 × g t
where E D t and E D t 1 are the electricity demand in years t and t 1 expressed in TWh. g t denotes the increase in electricity demand. Population growth is represented by g t in the household sector. Meanwhile, g t represents economic growth in the industrial, commercial, and public sectors.
The electricity generated by the electricity generation system equals the sum of the electricity demand and transmission line losses. The total electricity produced by the generation system is
E G t = E D t × 1 T L t 1
where E G t is the electricity generated by the generation system (in TWh), and T L t is the transmission line loss (in percent).
Power plant type and capacity are determined using least-cost optimization, which takes into account each type’s technical, economic, and environmental characteristics. LEAP-NEMO will determine the type and capacity of new power plants required each year. Based on LEAP documentation, NEMO aims to minimize planning costs, which include capital costs, fixed operational costs, variable operational costs, and fuel costs. The total planning cost is defined as
T C = t T C t c a p i t a l + C t f i x e d O M + C t v a r O M + C t f u e l
where C t c a p i t a l , C t f i x e d O M , C t v a r O M , and C t f u e l are capital, fixed operation, variable operation, and fuel cost, respectively. These costs are expressed in USD.
Capital cost, C t c a p i t a l , is determined by the amount of new generating capacity added. Capital cost is defined as
C t c a p i t a l = I C g × P g , t a d d e d
where I C g is investment cost for each type of power plant technology g (in USD/kW) and P g , t a d d e d is capacity addition of power plant technology g which is built in year t (in kW). Fixed operation cost, C t f i x e d O M , is defined as
C t f i x e d O M = O C g f i x e d × P g , t i n s t a l l e d
where O C g f i x e d is fixed operation cost for each type of power plant technology g (in USD/kW-year) and P g , t i n s t a l l e d is the installed capacity of power plant technology g (in kW), both for existing and newly built in year t . C t v a r O M , which is the variable operation cost, is defined as
C t v a r O M = ρ g , o × O C g v a r × P g , o , t
where O C g v a r is variable operation cost for each type of power plant technology g (in USD/kWh), ρ g , o is the operational hour of power plant technology g in each time slice o (in hour), and P g , o , t is the generating power of power plant (in kW).
Next, LEAP-NEMO calculates emissions based on the fuel used in each power plant technology. Annual emissions ( E t ) are defined as
E t = g f E F g , f × η g 1 × P g
where E F g , f is the emission factor of power plant technology g with fuel f , η g is the process efficiency of power plant technology g , and P g is the output power for each type of power plant technology g .

2.2. Scenario Development

This article discusses generation expansion planning (GEP) towards an electricity generation system with NZE, which is expected to be completed by 2060. This article presents several different planning scenarios. These scenarios are the baseline scenario, the NZE scenario with a more expensive NPP (NZE1), and the NZE scenario with a less expensive NPP (NZE2).

2.2.1. Baseline Scenario

The baseline scenario is a GEP scenario based on existing planning documents, precisely the national electricity supply document [53,54]. The baseline scenario serves as a reference for the remaining two scenarios. The assumptions made in the baseline scenario are:
  • GEP is restricted to conventional technologies (fossil fuels) used in the base year,
  • renewable energy use has yet to set a target because the capacity of electricity generated using renewable energy sources during the planning period is equal to what was installed in the base year and
  • there are no restrictions on using fossil fuels to generate electricity; therefore, there are no emission limits.

2.2.2. NZE1 Scenario

Unlike the baseline scenario, the NZE1 scenario includes an emissions limit, namely that the emissions produced by the electricity generation system in 2060 or earlier are zero. A constraint function in the NEMO model represents the emission target. The following assumptions are made in the NZE1 scenario:
  • CO2 emission in 2060 must be zero,
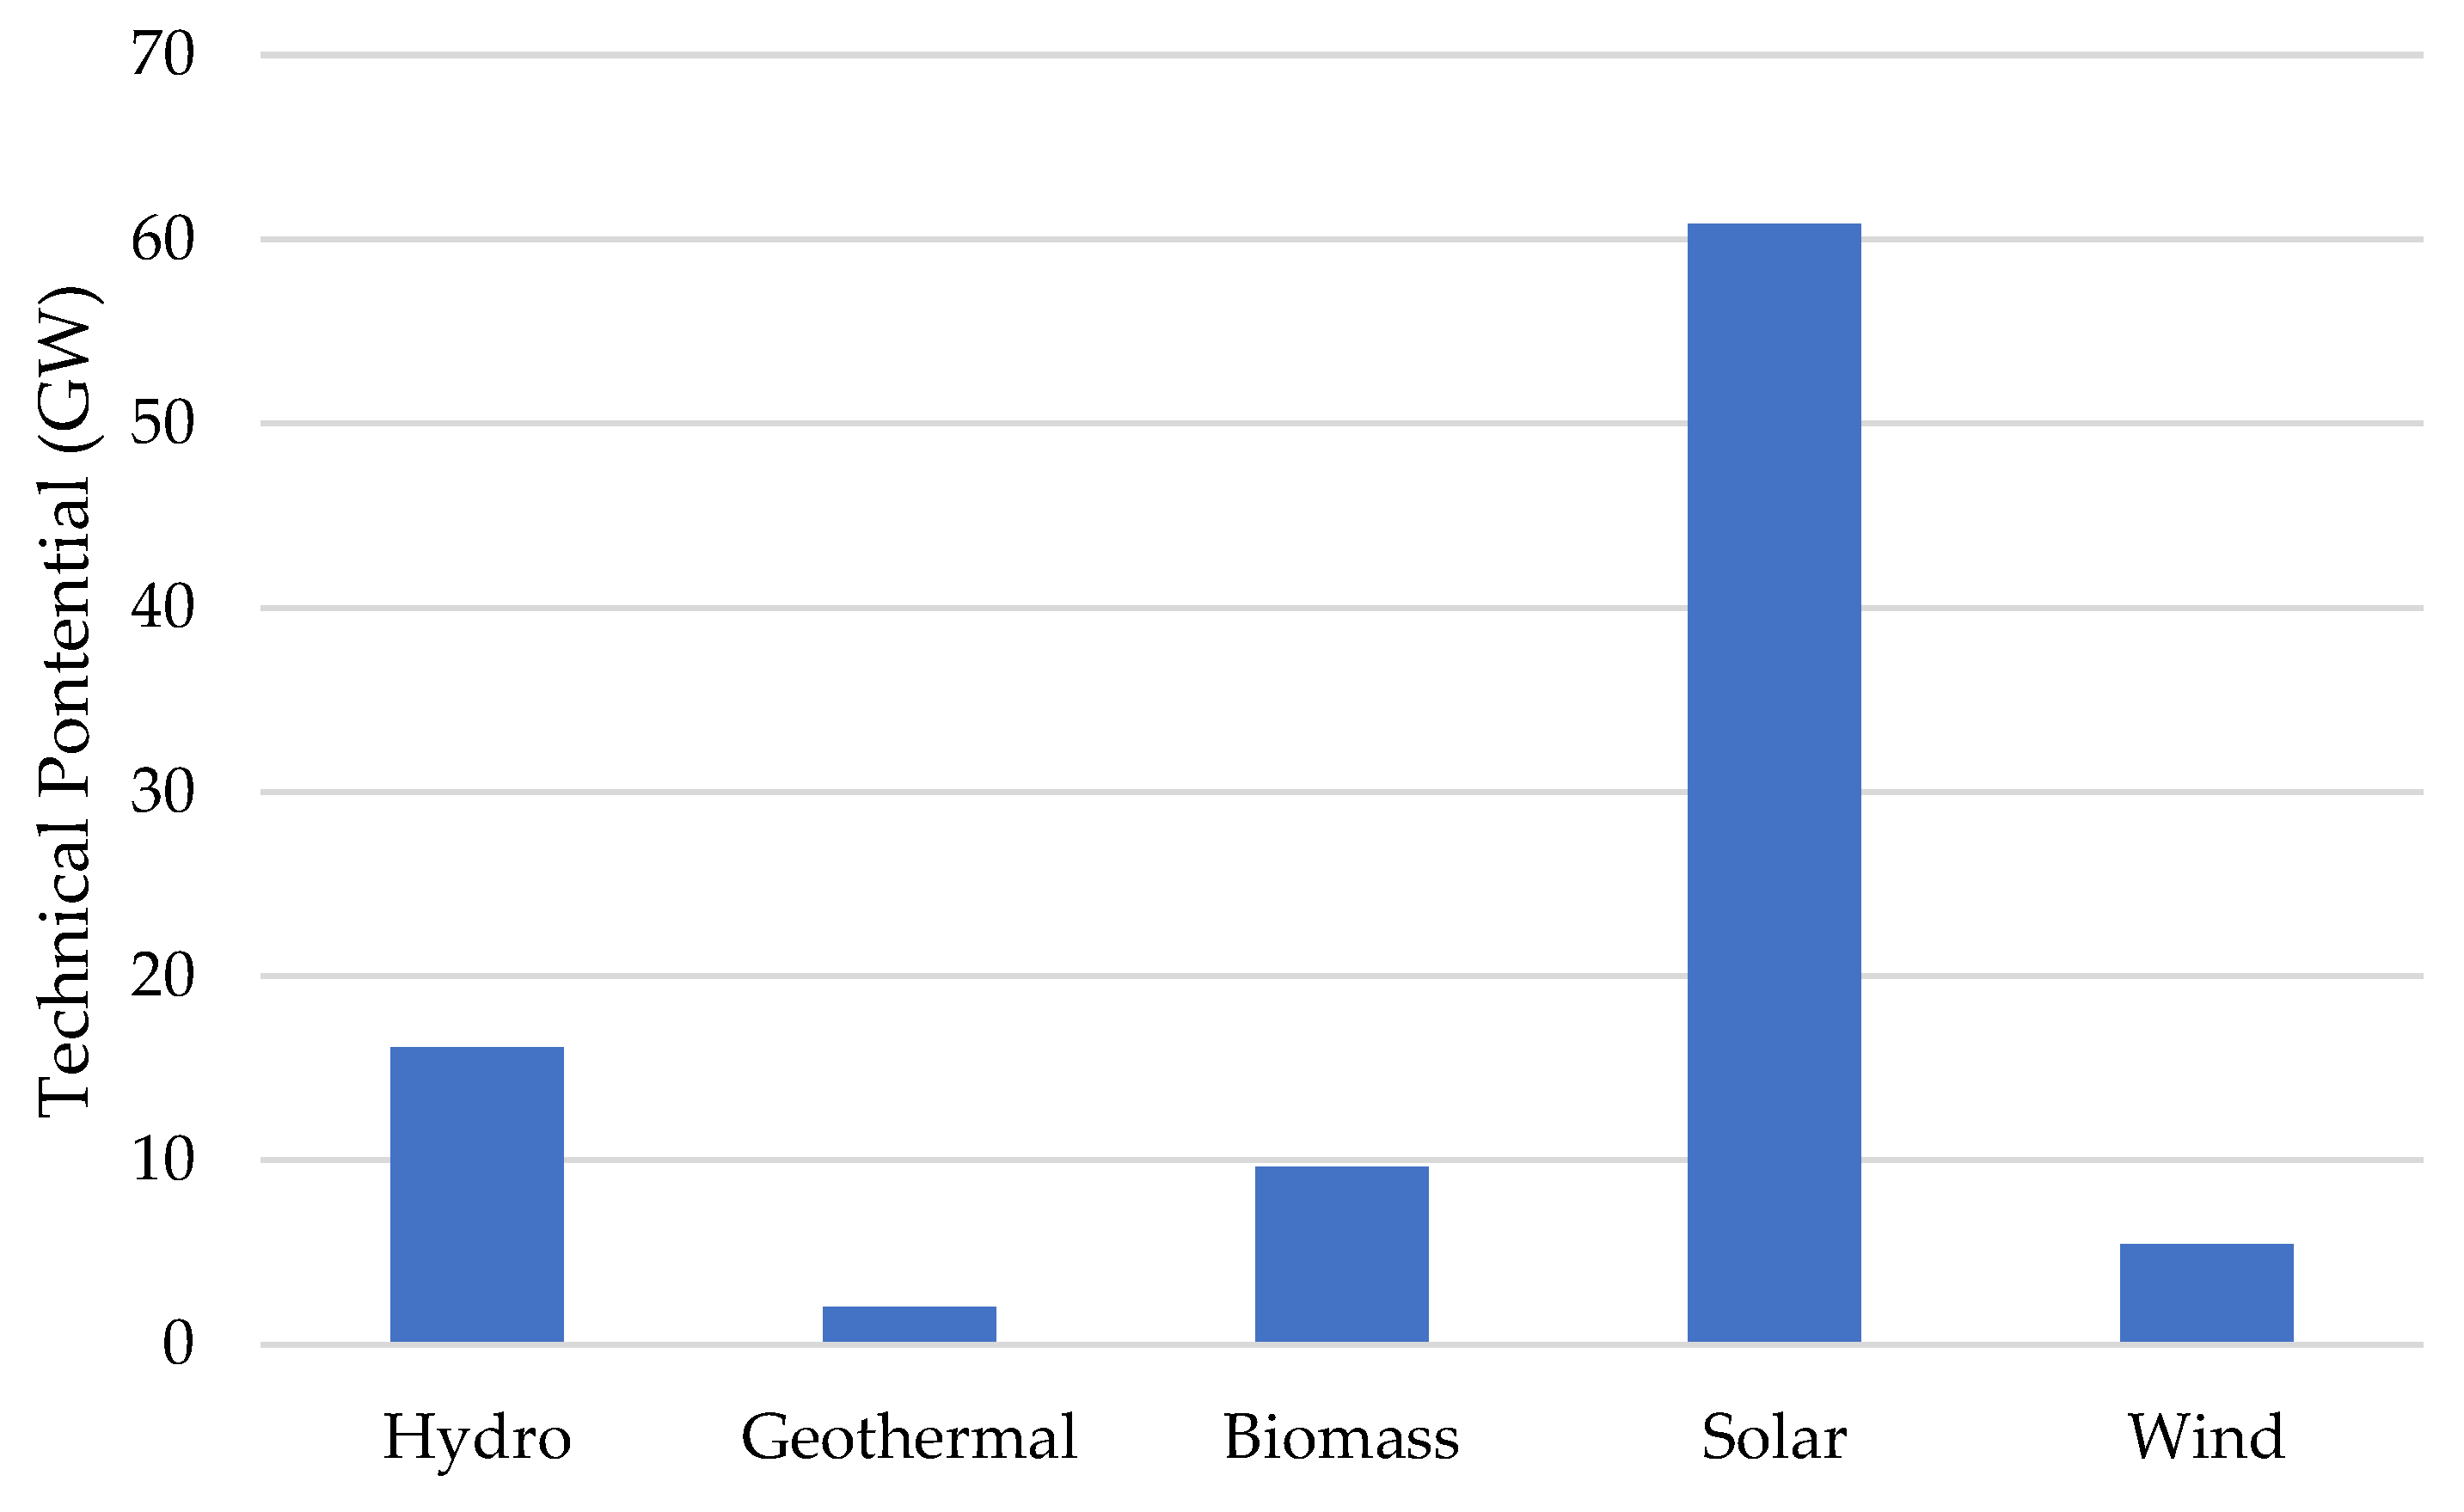
  • the addition of electricity generation capacity using renewable energy sources is limited by their technical potential,
  • all electricity generation technologies, namely electricity generation using conventional technology, renewable energy technology, and nuclear technology, are competed concurrently through optimization calculations, with a target of zero emissions by 2060,
  • power plants that use diesel fuel, whether with diesel engines or gas turbines, will no longer be used beginning in 2045 and
  • NPP technology is limited to the advanced cost of small modular reactors (SMRs) and large reactors (LRs) technology.

2.2.3. NZE2 Scenario

Except for the NPPs technology used, the NZE2 scenario’s assumptions are identical to those in the NZE1 scenario. In the NZE2 scenario, the NPP technology has lower initial investment costs per kW capacity. The NZE2 scenario simulates all NPP technologies: small modular reactors (SMRs), light water reactors (LWRs), and advanced light water reactors (ALWRs).

2.3. Data and Data Sources of Case Study

The power system in Sumatra, Indonesia, serves as the case study in this article. The data for the base year is from 2020. This base year was chosen based on data availability for electricity demand projections, specifically population and economic activity data. Data on electricity demand and installed power plants for the base year, specifically 2020, has also been adjusted.

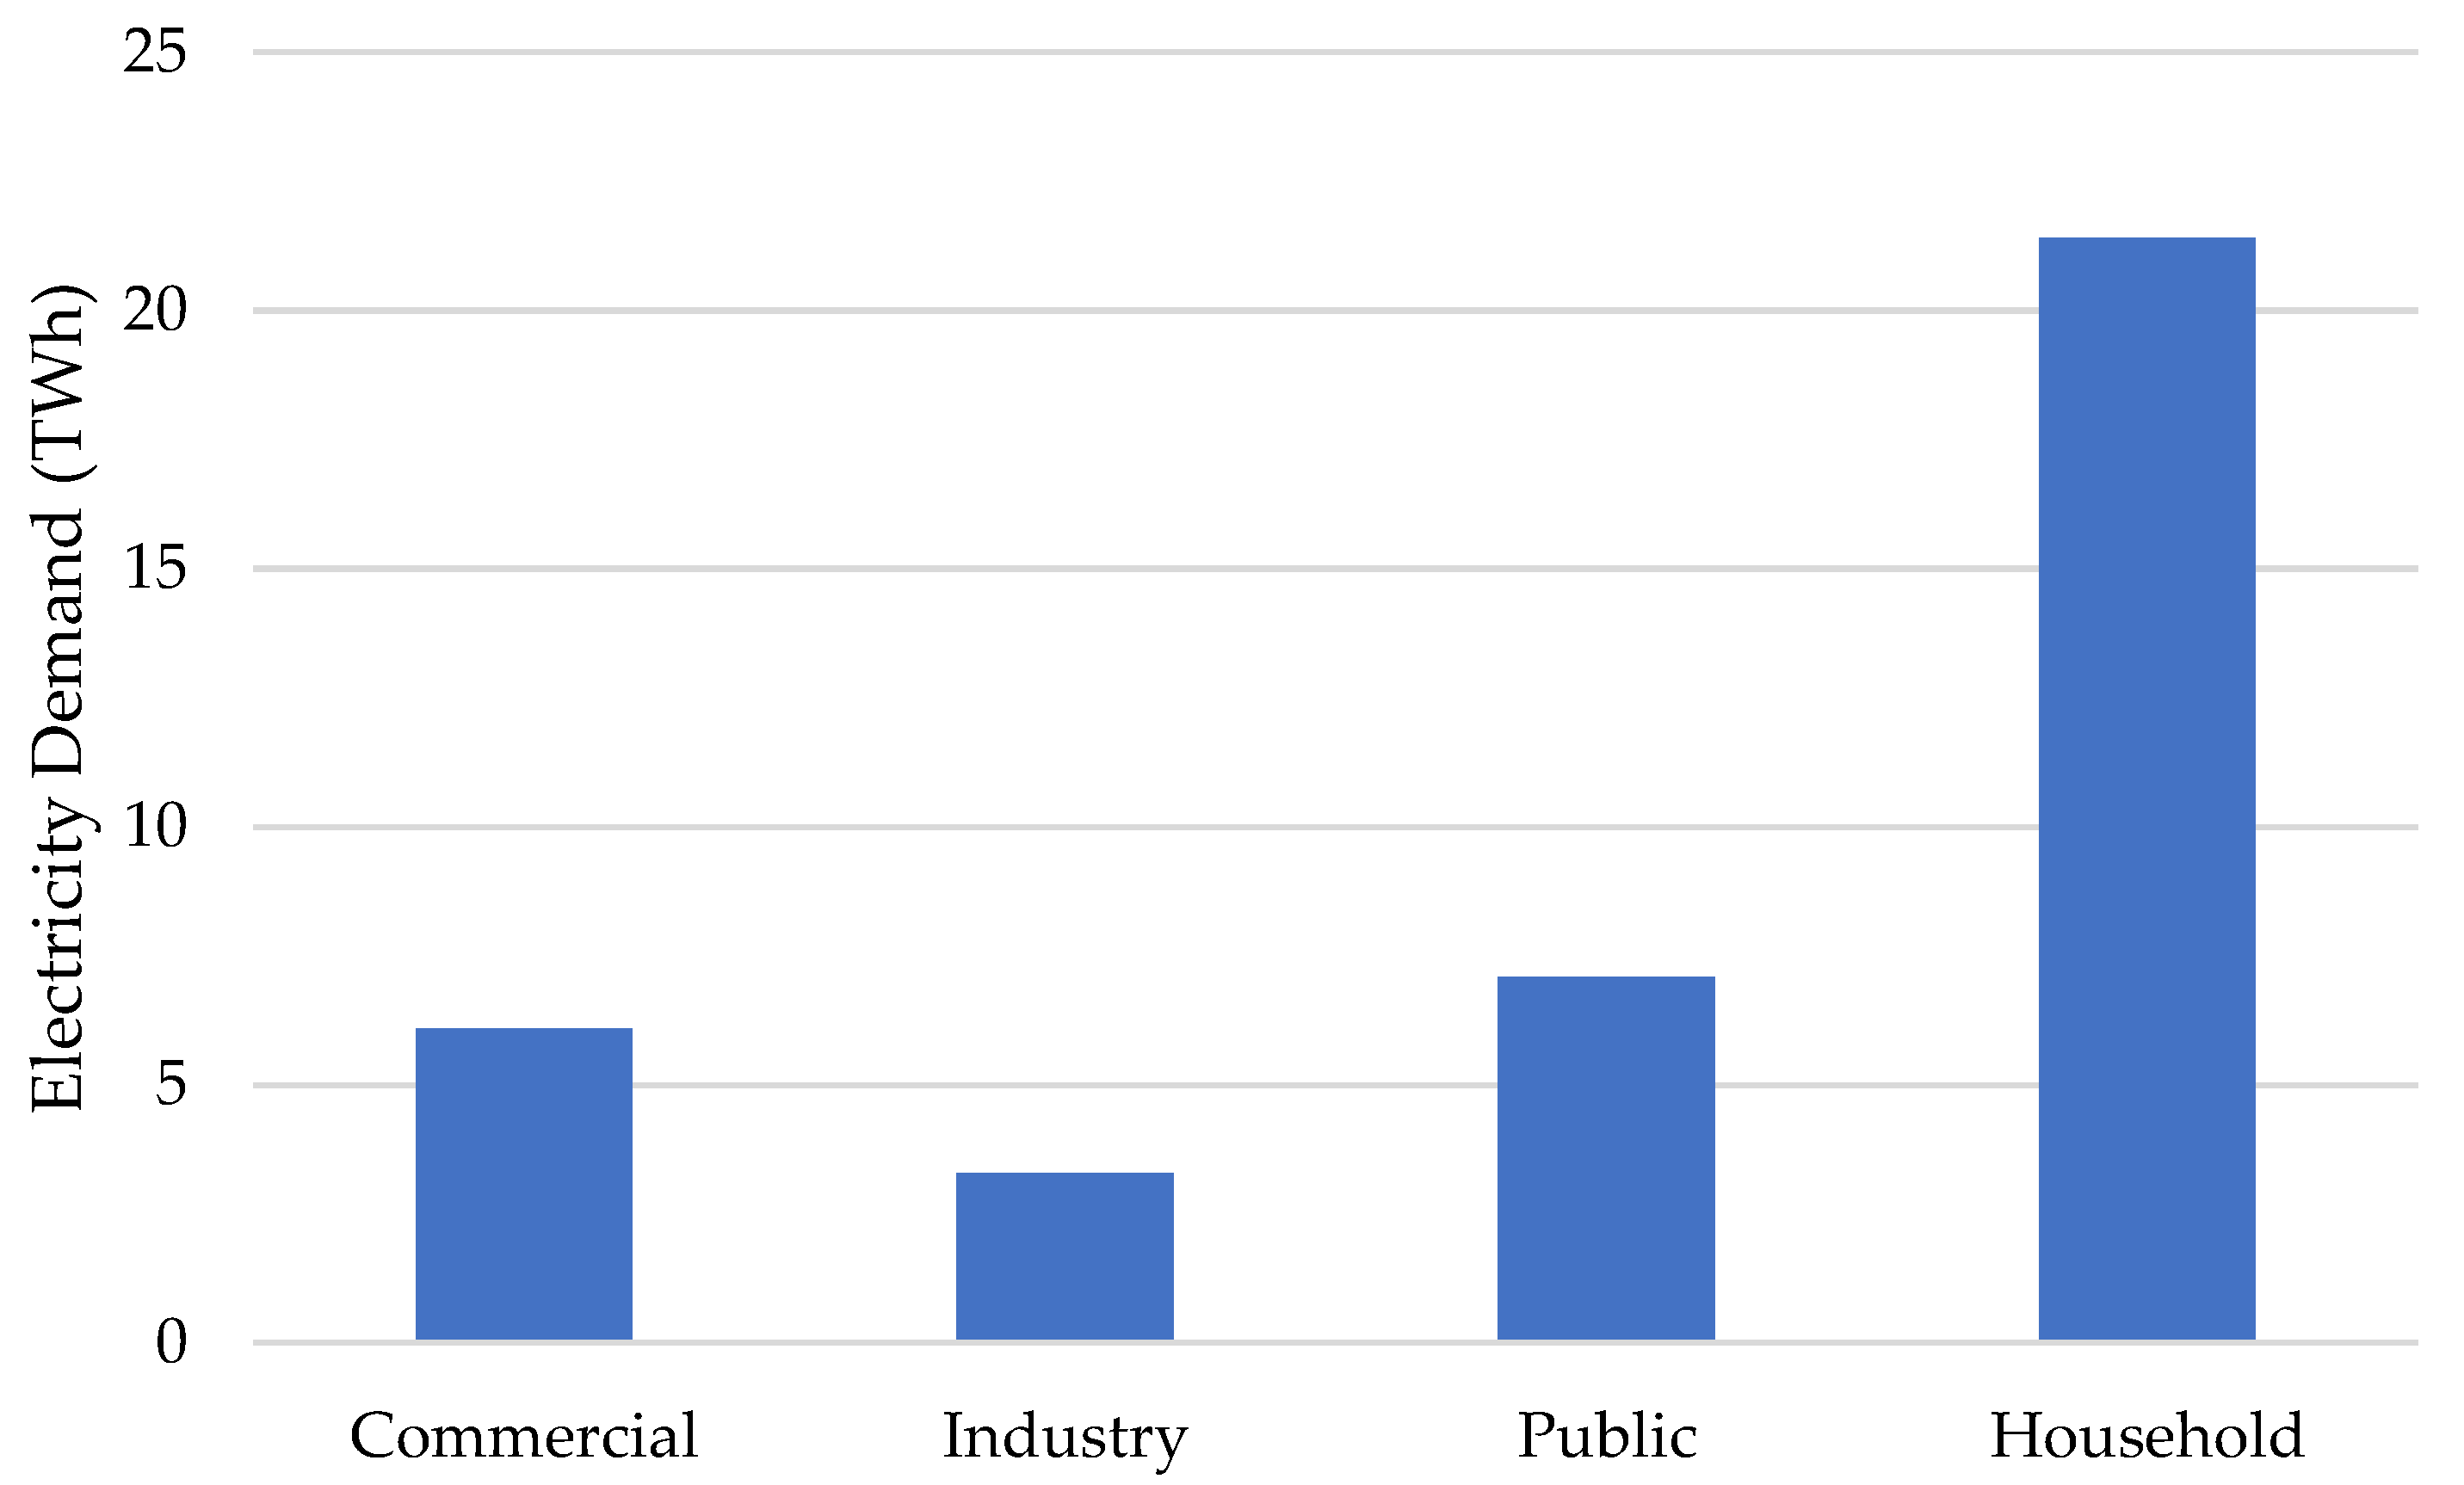
2.3.1. Existing Electricity System and Renewable Energy Potential of Sumatera

Figure 1 depicts the electricity demand for Sumatra Island in 2020 by sector [54]. Total electricity demand in 2020 was 37.9 TWh, with 56% coming from households. The industrial sector had the lowest electricity demand percentage in the base year, at 9% or 3.3 TWh. This electricity demand is met by a generation system distributed via an electric power transmission system connecting the entire island of Sumatra. This transmission system experiences 11% losses [40].
Figure 2 shows the installed power plant capacity [40]. Overall, the installed power plant capacity in 2020 was 8.5 GW, with the coal fire power plant (CFPP) having the highest capacity at 2.4 GW. Aside from coal, the Sumatran system relies heavily on diesel, fueling gas and diesel engines. These two types of power plants combined have a capacity of 2.4 GW. Furthermore, natural gas is the fossil fuel used in Sumatra to generate electricity through the gas turbine combined cycle (GT CC) and gas turbine. The two power plants have a combined capacity of 1.8 GW.
According to Figure 2, power plants using renewable energy sources such as hydro, geothermal, biomass, and solar were installed in 2020. Hydropower plants have a capacity of 1.3 GW, while geothermal power plants can generate 0.6 GW. Other renewable energy sources, such as biomass and diesel, have limited capacity of 35 MW and 1 MW, respectively. Overall, the capacity of power plants using renewable energy sources is 2.0 GW.
Sumatra Island, on the other hand, has a wide range of renewable energy potential, as illustrated in Figure 3 [55]. Solar power plants have enormous technical potential, reaching 70 GW, followed by a hydropower potential of 16 GW. Sumatra Island has a biomass potential of 9.7 GW, while the technical potential for wind power is 5.5 GW. Sumatra Island is located in the Ring of Fire, so it has a significant geothermal potential, specifically 2.0 GW. In total, Sumatra’s technical renewable energy potential is 94.0 GW. Renewable energy potential in Sumatra Island is used to select renewable energy technologies for optimization.

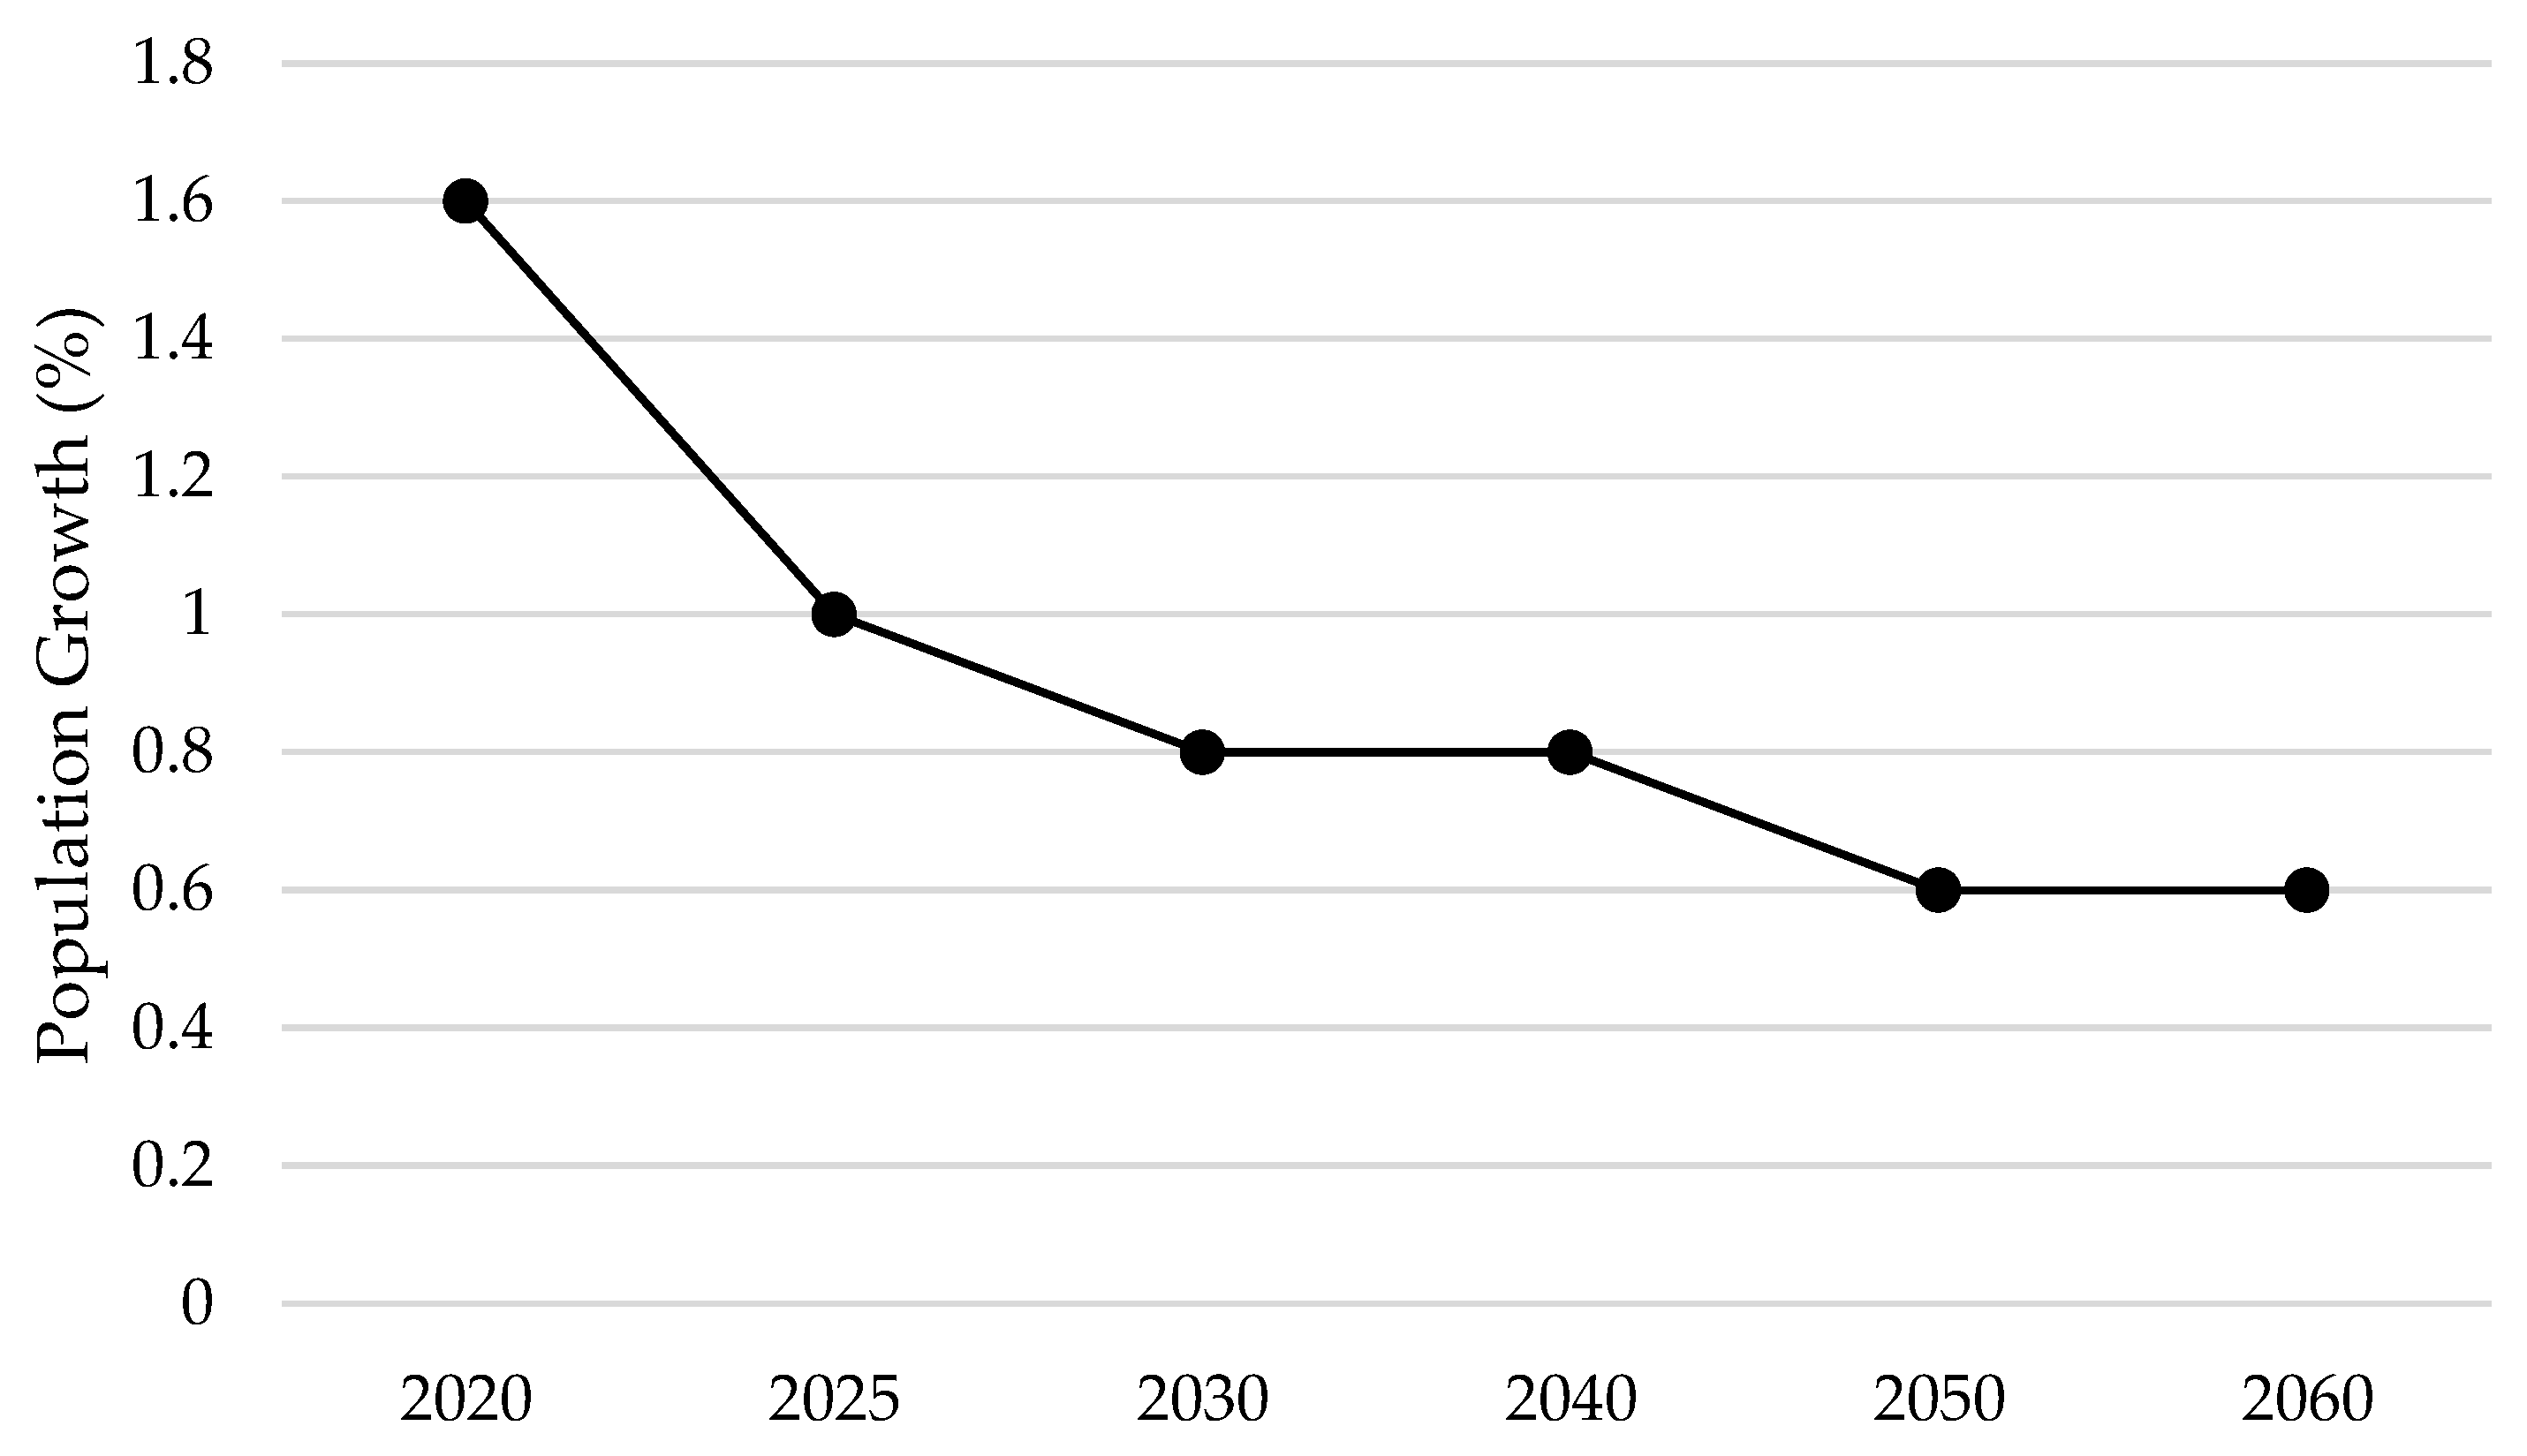
2.3.2. Demography and Economy

As stated in Equation (1), electricity demand is proportional to the growth of activity in each sector. Population growth represents increased activity in the household sector. In other sectors, such as the commercial, industrial, and public sectors, activity growth is measured in terms of GDP growth. Sumatra Island’s average population growth rate is 1.6% [56,57]. Figure 4 shows the projected population growth during the planning period [55].
Sumatra’s GDP growth in 2020 was negative due to the COVID-19 pandemic. GDP growth in 2020 was −1.2% [58]. To account for negative GDP growth values, GDP growth in the base year as input to the LEAP model is calculated using interpolation based on GDP growth in 2019 (4.55%) and provisional GDP growth figures for 2021 (3.18%). Using this method, GDP growth in the base year is 4.16%. Based on [55], GDP growth is projected throughout the planning period, as shown in Figure 5. Other economic parameters used in LEAP modeling include the discount and inflation rates, which are 6% and 3%, respectively [59].

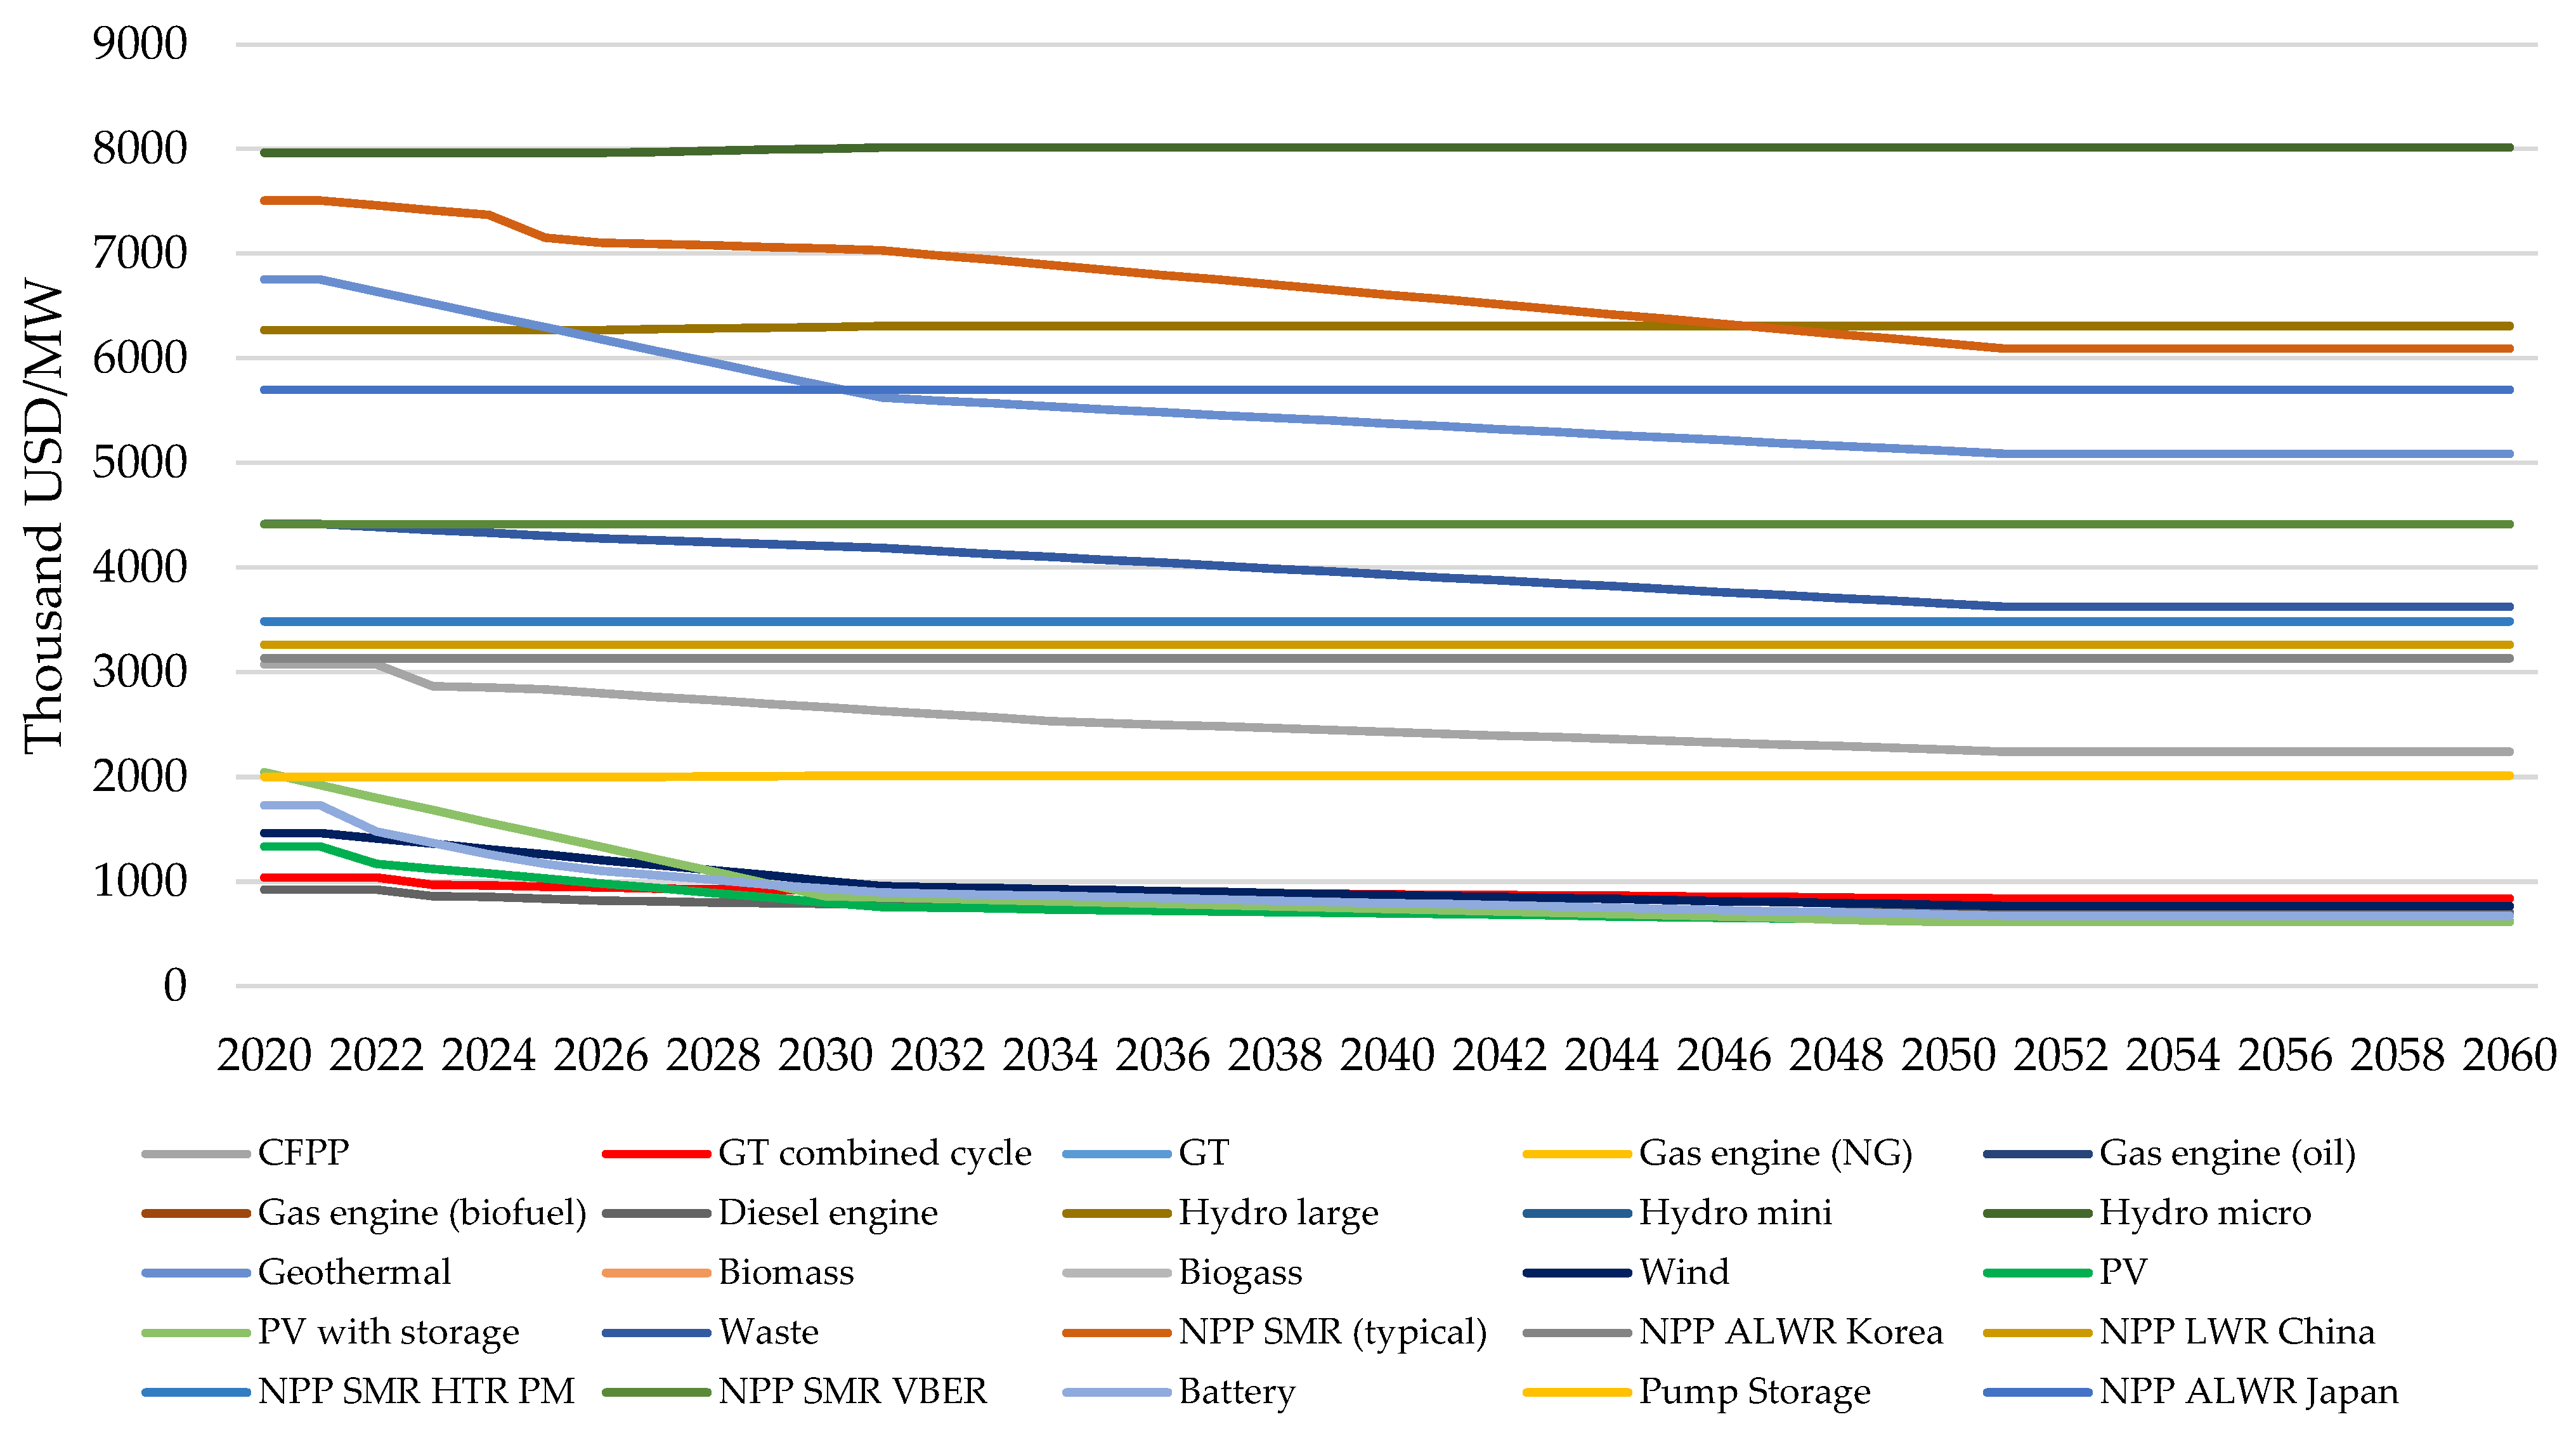
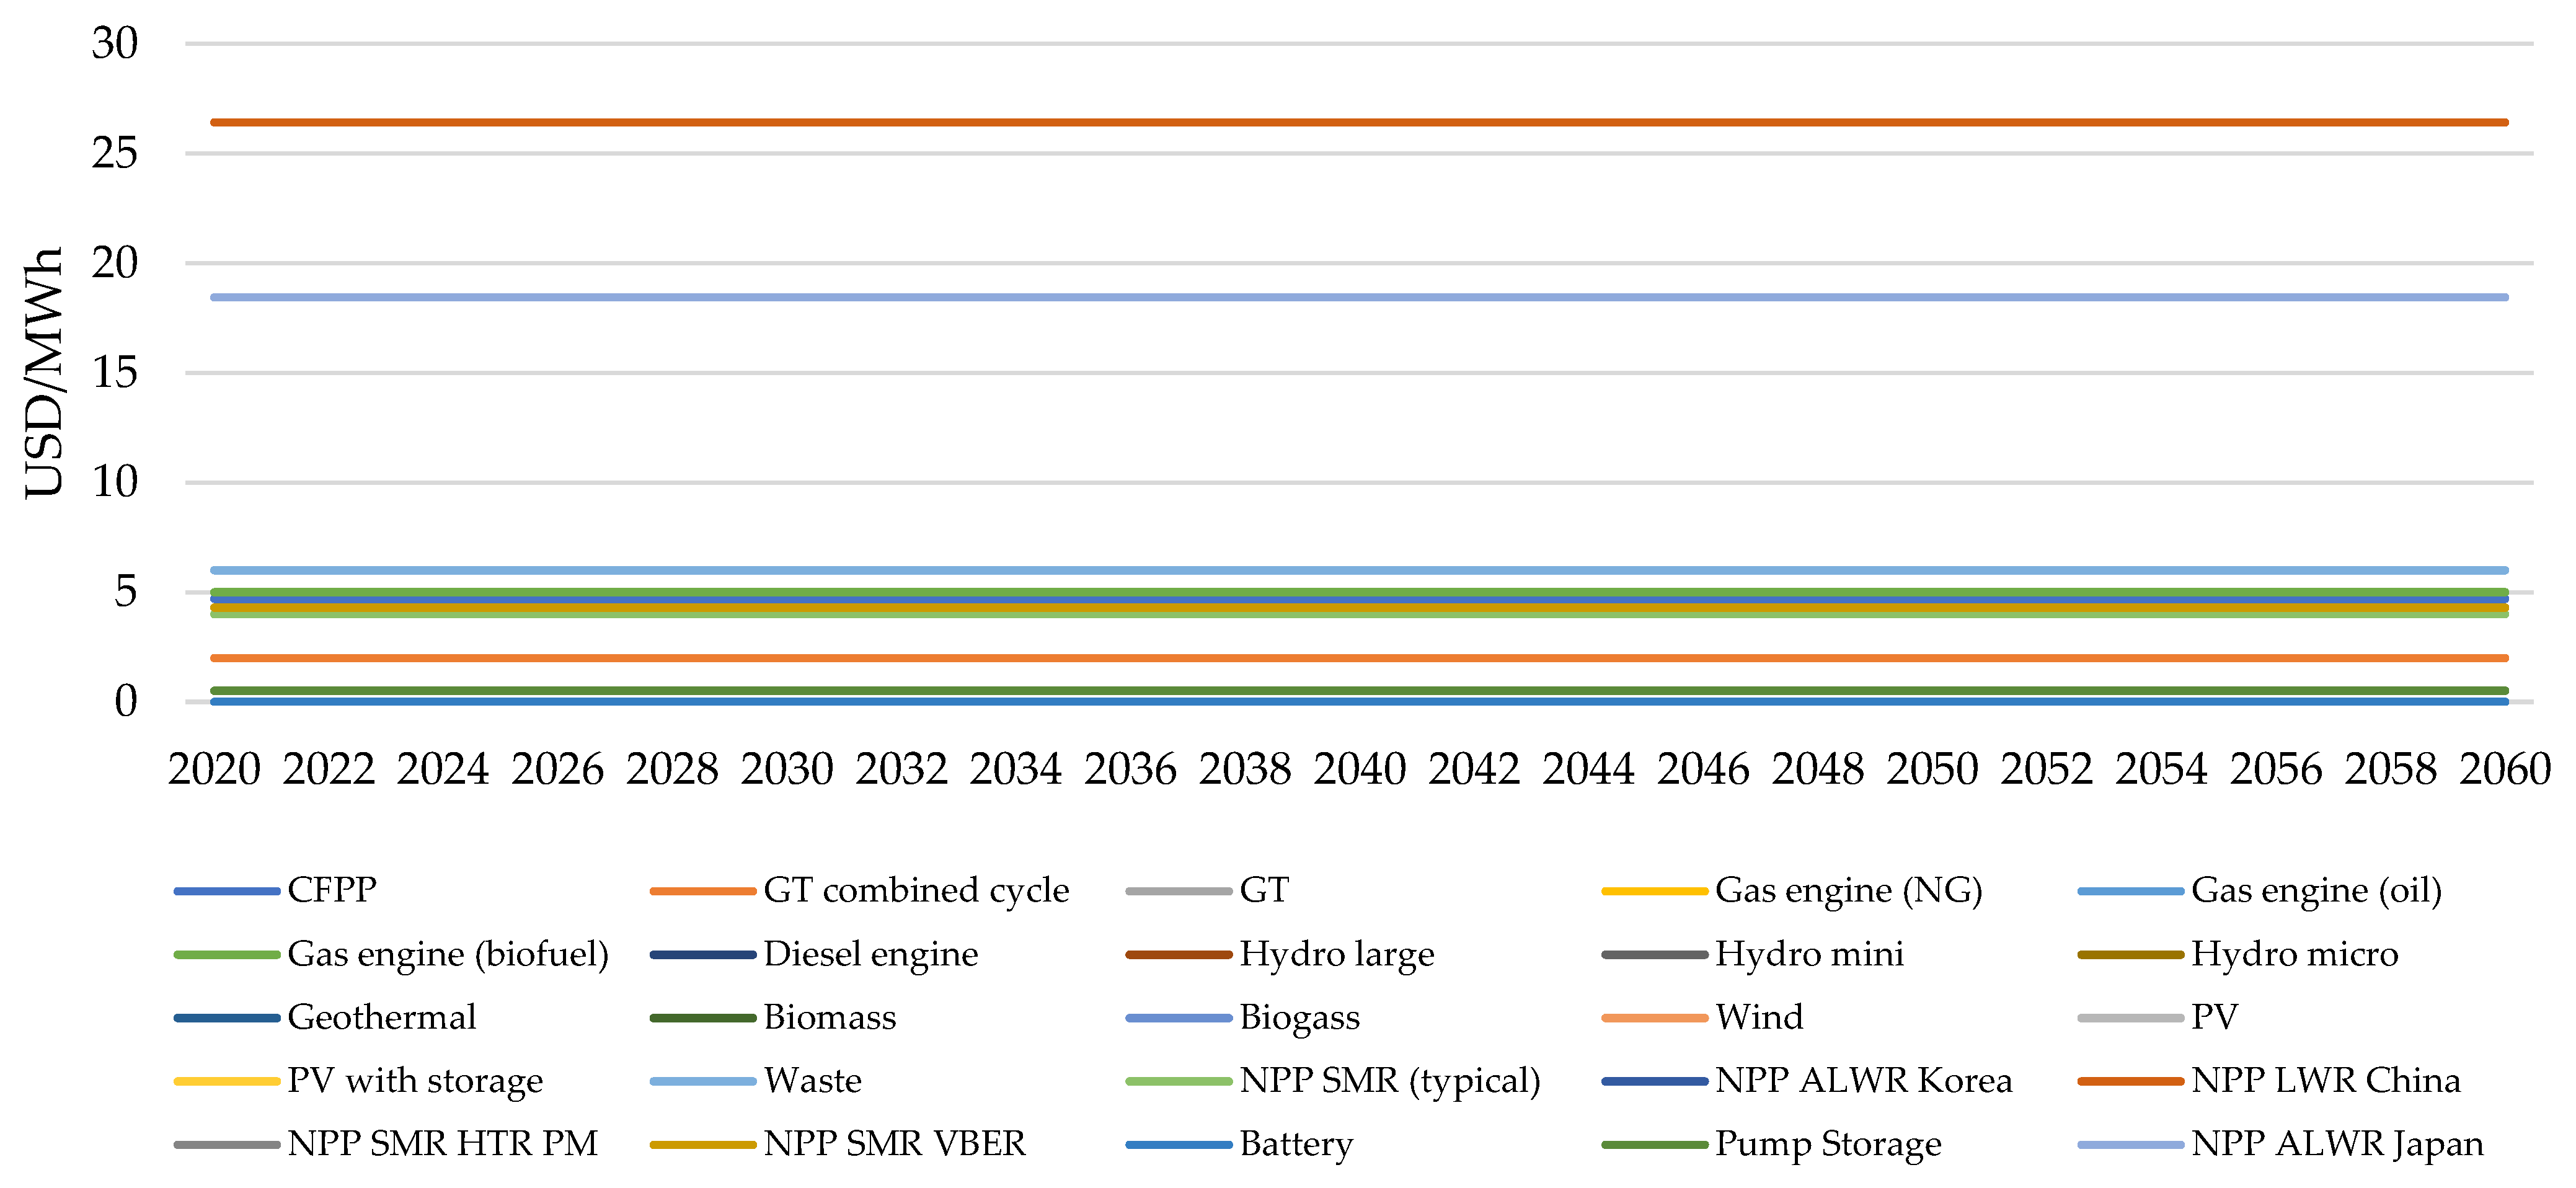
2.3.3. Power Plant Characteristics

Economic, technical, and environmental parameters define power plant characteristics. Economic characteristics include capital expenses (capex) and operation and maintenance expenses (opex), which are made up of fixed and variable operational costs. Because the generation expansion palling (GEP) discussed in this article is a long-term plan, the economic characteristics used change during the planning process. Figure 6, Figure 7 and Figure 8 show the economic characteristics of each type of power plant technology in terms of capex, fixed opex, and variable opex, respectively. These charts have been illustrated from the power generation technical and economical catalogs in reports issued by NREL and IEA. The techno-economic of typical Small Modular Rector NPPs is taken from published journals [33,39,60]. As illustrated in Figure 6, the capex value for each type of technology varies throughout the planning period. Meanwhile, some of the fixed opex values in Figure 7 change while others remain constant. The majority of variable opex values in Figure 8 remain constant throughout the planning period.
The current state of technology determines the technical and environmental aspects of each type of power generation technology. Table 1 shows that technical features such as additional size, efficiency, capacity credit, maximum availability, and lifetime are derived from various sources [61]. The maximum solar and wind availability is found by dividing 365 days into 24 h. Figure 9 and Figure 10 depict time slice data for solar and wind, respectively [62]. Meanwhile, the environmental features for each type of technology are based on the Intergovernmental Panel on Climate Change (IPCC) database, which is integrated into LEAP [63].

2.3.4. Nuclear Power Plants

Nuclear power plants are divided into several generations, namely Gen 1, Gen II, Gen III, Gen III+, and Gen IV [64,65]. In terms of capacity, there are several types of nuclear reactors, namely: large reactors (LRs) having medium to large capacity, small modular reactors (SMRs) having a capacity of less than 300 MWe, and small reactors with a capacity of less than 10 MWe [66,67,68]. Most of the NPPs use enriched Uranium as fuel. In the future, Thorium will be promising as fuel due to its abundant source compared to Uranium. However, economic factors are one of the obstacles [69]. In this simulation, some large reactors NPP are used, such as typical Chinese light water reactors and typical Korean and Japanese advanced light water reactors. For SMR technology, this simulation uses typical SMR (IEA database), HTR-PM, and VBER. VBER is a floating power plant operated on a ship in the ocean [70]. The majority of NPP’s costs are capital or overnight costs. The capital cost of large reactors is lower than SMRs. The China and Korea light water reactors have a range of capital costs from 3100 thousand USD/MW to 3300 thousand USD/MW. But, the SMRs have capital costs of more than 3500 thousand USD/MW. This NPP capital cost is shown in Figure 6. The economics of the scale of large reactors advance the cost compared to the SMRs. The cost of SMRs is expected to be lower in the future because of the modular design, ease of manufacture, and speedy construction factors [71,72]. This simulation uses two NZE scenarios: scenario NZE1 uses typical SMR technology (IEA database) and ALWR Japan. The capital cost of this SMR is 7508 thousand USD/MW. The ALWR Japan needs 5700 thousand USD/MW of capital cost. The NZE2 scenario uses both low-cost SMRs and LRs technologies such as SMR HTR-PM, SMR VBER, LWR China, and ALWR Korea.

2.3.5. Energy Storage Characteristics

The energy storage devices simulated in this paper include batteries and pumped storage hydropower (PSH). The economic aspects of energy storage technology are presented in Table 2. The battery technology employed is Li-Ion, which has a round-trip battery efficiency of 85% and a full load time of 10 h. PSH’s round-trip efficiency parameter is 80%. The battery and PSH addition sizes are 60 and 250 MW, respectively [60].
Finally, the GEP model’s mineral resources section must include data on fossil fuel prices. Fossil fuel prices include prices for both the baseline [61] and NZE [11] scenarios. Table 3 provides detailed fuel prices for all scenarios.

3. Results

The study of the GEP model’s results using LEAP is explained in this section. This section begins with the results of the electricity demand projections. The technical examination of the GEP outcomes, which include increased capacity to satisfy anticipated electricity demand and electricity production, comes next in the analysis. This section concludes with a discussion of the environmental and economic concerns.

3.1. Demand Projection

Electricity demand projections are derived from the electricity demand in the base year, as well as the growth in economic and household activities. The projected growth of commercial, industrial, and public sector electricity demand is expected to align with the growth of economic activity, specifically represented by GDP growth. The electricity demand of the household sector is forecasted by considering the increase in household activity, specifically indicated by the growth in population.
Figure 11 displays the outcomes of electricity demand projections. The average annual growth in electricity demand over the planning period is 2.8%. Based on the projected average growth rate, the electricity demand in 2060 is estimated to reach 115.1 TWh. In 2060, the household sector is projected to have an electricity demand value of 27.7 TWh, with an average annual growth rate of 0.6%. The electricity demand in 2060 for the commercial sector is 30.4 TWh, for the industrial sector is 16.8 TWh, and for the public sector is 40.2 TWh. The average annual electricity demand growth for these three sectors is 4.1%.

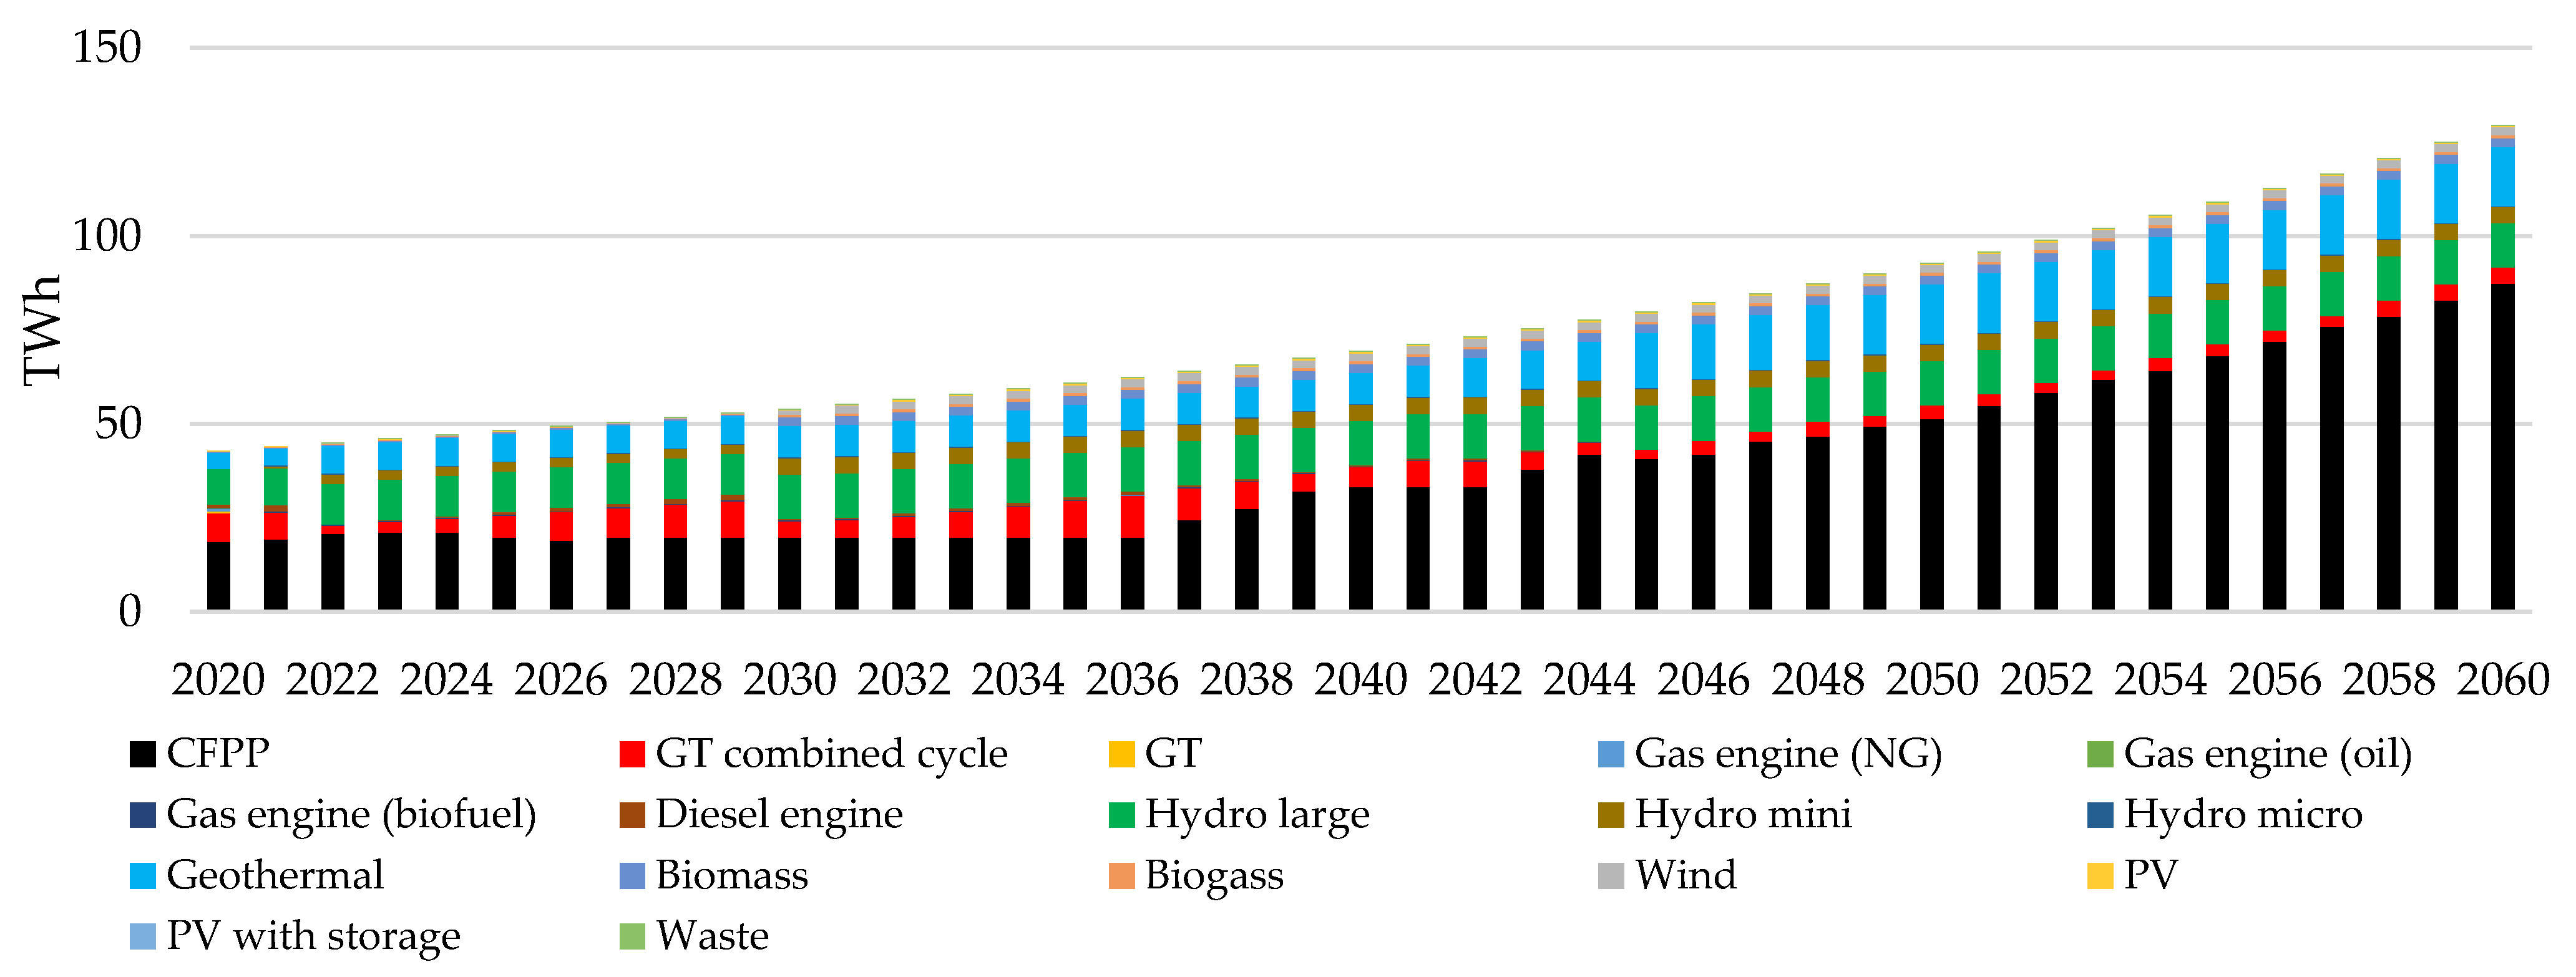
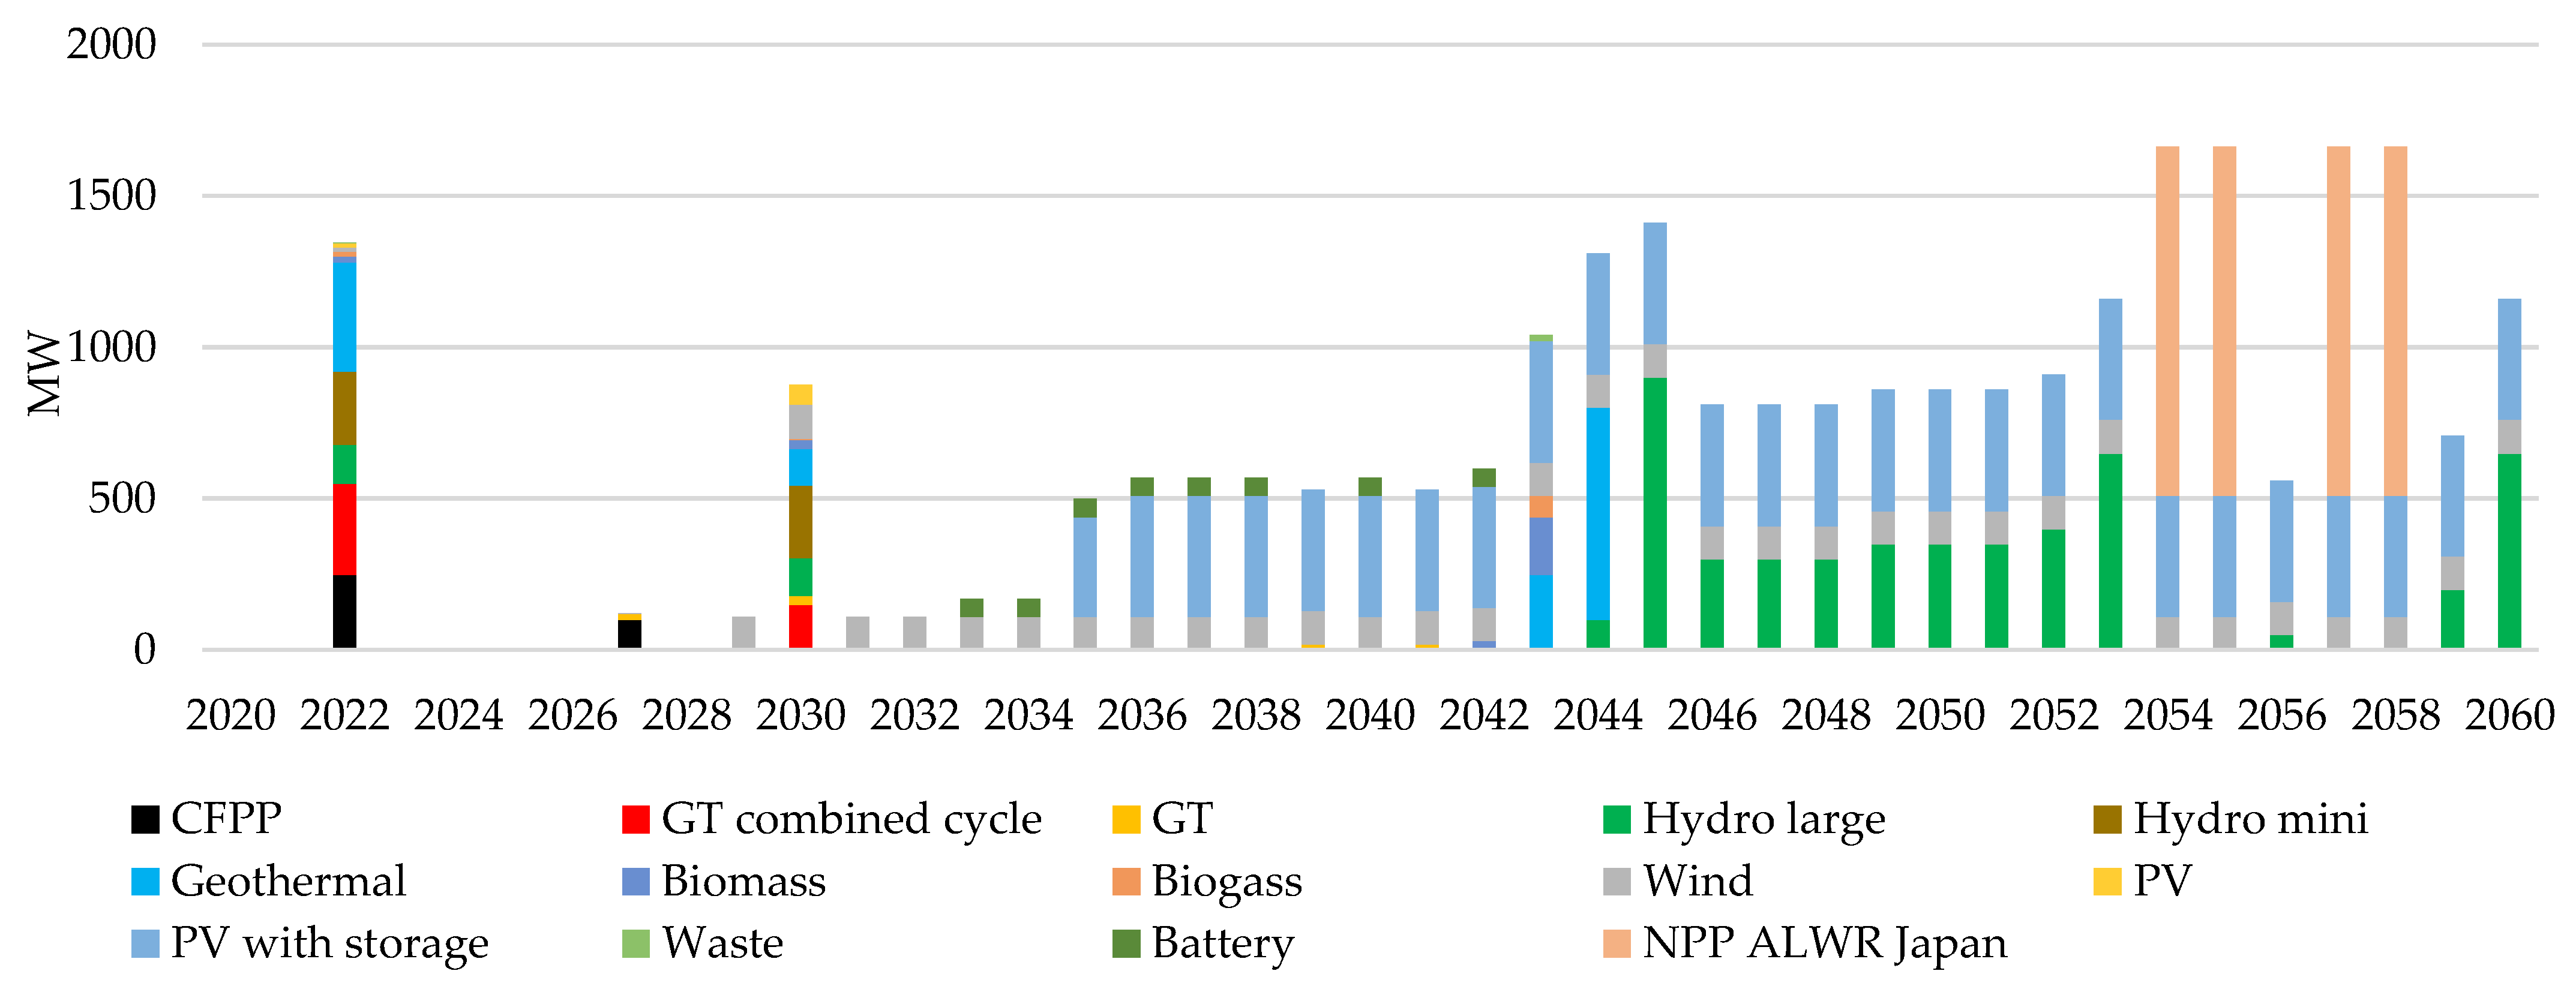
3.2. Electricity Supply

Figure 12, Figure 13 and Figure 14 show electricity production for the baseline, NZE1, and NZE2 scenarios to meet projected electricity demand. Figure 12 (baseline scenario) shows that coal-fired power plants (CFPPs) dominate electrical energy production until 2060. CFPPs have a role of 87.2 TWh (65%) in electrical energy production in 2060, reaching 129.5 TWh. Power plants using diesel fuel will no longer produce electrical energy starting in 2045. Types of power plants with renewable energy sources, as a whole, have a role of 27% in electrical energy production in 2060. Hydroelectric power plants (large, mini, and micro) have a role of 13%. Geothermal has a role of 12% in 2060.
Based on the NZE scenario, electrical energy production for each type of power generation technology is shown in Figure 13. In 2058, power plants powered by coal, natural gas, and diesel will no longer produce electrical energy. CFPP with coal fuel will start not producing electrical energy from 2043. GT combined cycle with natural gas fuel will start not producing electrical energy from 2055. Power plants with other natural gas fuel, namely GT and Gas Engine, will start not producing energy electricity respectively from 2053 and 2058. With the cessation of electrical energy production from power plants using fossil fuels, power plants using renewable energy sources and NPPs have an increasing role in providing electrical energy.
Electrical energy production in 2060 is 129.5 TWh. Based on the optimization results, hydropower is the dominant generator in electrical energy production based on the NZE scenario. In 2060, Hydropower produces electrical energy, amounting to 56% of all electrical energy produced, or 50 TWh (39%). PV (with energy storage modules) contributes to the provision of electrical energy by 18 TWh (14%) of electrical energy production in 2060. Geothermal energy produces 15.8 TWh (12%). A percentage of 22% is generated by Wind, with electrical energy production of 28.2 TWh. In 2060, NPP will produce electricity of 7 TWh or 5% of the total electricity generated by the electrical energy generation system.
Electrical energy production produced by each type of power plant based on the NZE2 scenario with low-cost NPP is shown in Figure 14. In 2060, total electrical energy production will reach 129.6 TWh. In 2060, hydropower produces 33 TWh of electricity (26%). Wind produces 28.2 TWh of electrical energy with a contribution of 22%. PV produces 15.8 TWh (12%) of electrical energy. Meanwhile, Geothermal produces 15.8 TWh (12%) of electrical energy. NPP’s contribution in providing electrical energy in 2060 is HTR-PM of 23.6 TWh (18%) and ALWR Korea of 5.4 TWh (4%).
The described electricity production is highly dependent on additional capacity in each scenario. The additional power plant capacity for each scenario is depicted in Figure 15, Figure 16 and Figure 17. Based on the baseline scenario (Figure 15), three types of power plant technology must be added: CFPP, GT CC, Geothermal, and gas turbine. Cumulatively, the total electricity generation capacity that must be added by 2060 is 18,590 GW. CFPP is the dominant technology type in the projected addition of electricity generating capacity, with a total of 9.1 GW until 2060. In the BaU scenario, NPP has no role in the energy mix until 2060.
The addition of power plant capacity based on the NZE1 scenario is depicted in Figure 16. The results of the NZE1 scenario optimization show that the addition of capacity in the types of power plants using fossil fuels, namely CFPP, GT, and GT combined cycle, will only occur until 2030. The addition of these types of power plants is not the result of optimization but is an addition made exogenously (by the planning in the electricity supply business plan or RUPTL). Starting from 2030 until the end of the planning period, capacity additions will only occur for generators with renewable energy sources and nuclear power plants.
Wind capacity additions occur every year from 2029 to 2060, with an additional capacity of 0.11 GW per year. In 2060, wind capacity will reach 3.3 GW. The addition of PV capacity will occur from 2035 until the end of the planning period, with an annual capacity increase of 0.4 GW. For more detail, the additional capacity per type of generator can be seen in Figure 16. The SMR NPP capacity added up to 2060 is 0.3 GW (added in 2056). Meanwhile, the total capacity of Japan’s NPP AWLR added in this scenario until 2060 is 4.6 GW.
The addition of power plant capacity based on the NZE2 scenario is depicted in Figure 17. Compared to the NZE1 scenario, the most notable difference is that the addition of NPPs with both SMRs and LRs technology dominates power plant capacity planning for the entire planning period. NPPs will begin to be added to the electrical energy generation system from 2042 until the end of the planning period. The additional NPP capacity that will occur in 2043, 2045, and 2048 is 1.3 GW (NPP ALWR Korea). The addition of HTR-PM will occur in 2042, 2047, and 2052 to 2060, amounting to 300 MW. Thus, the total NPP capacity in 2060 will reach 7.2 GW. Wind capacity will begin to be added to the system from 2029 until the end of the projected year. The addition of wind capacity each year is 0.11 GW, which reaches an overall wind capacity value in 2060 of 3.4 GW. PV is also a power plant with renewable energy sources whose capacity must be increased every year from 2037 to 2060. The additional PV capacity each year is 0.4 GW. Thus, PV will have a total capacity in 2060 of 9 GW.

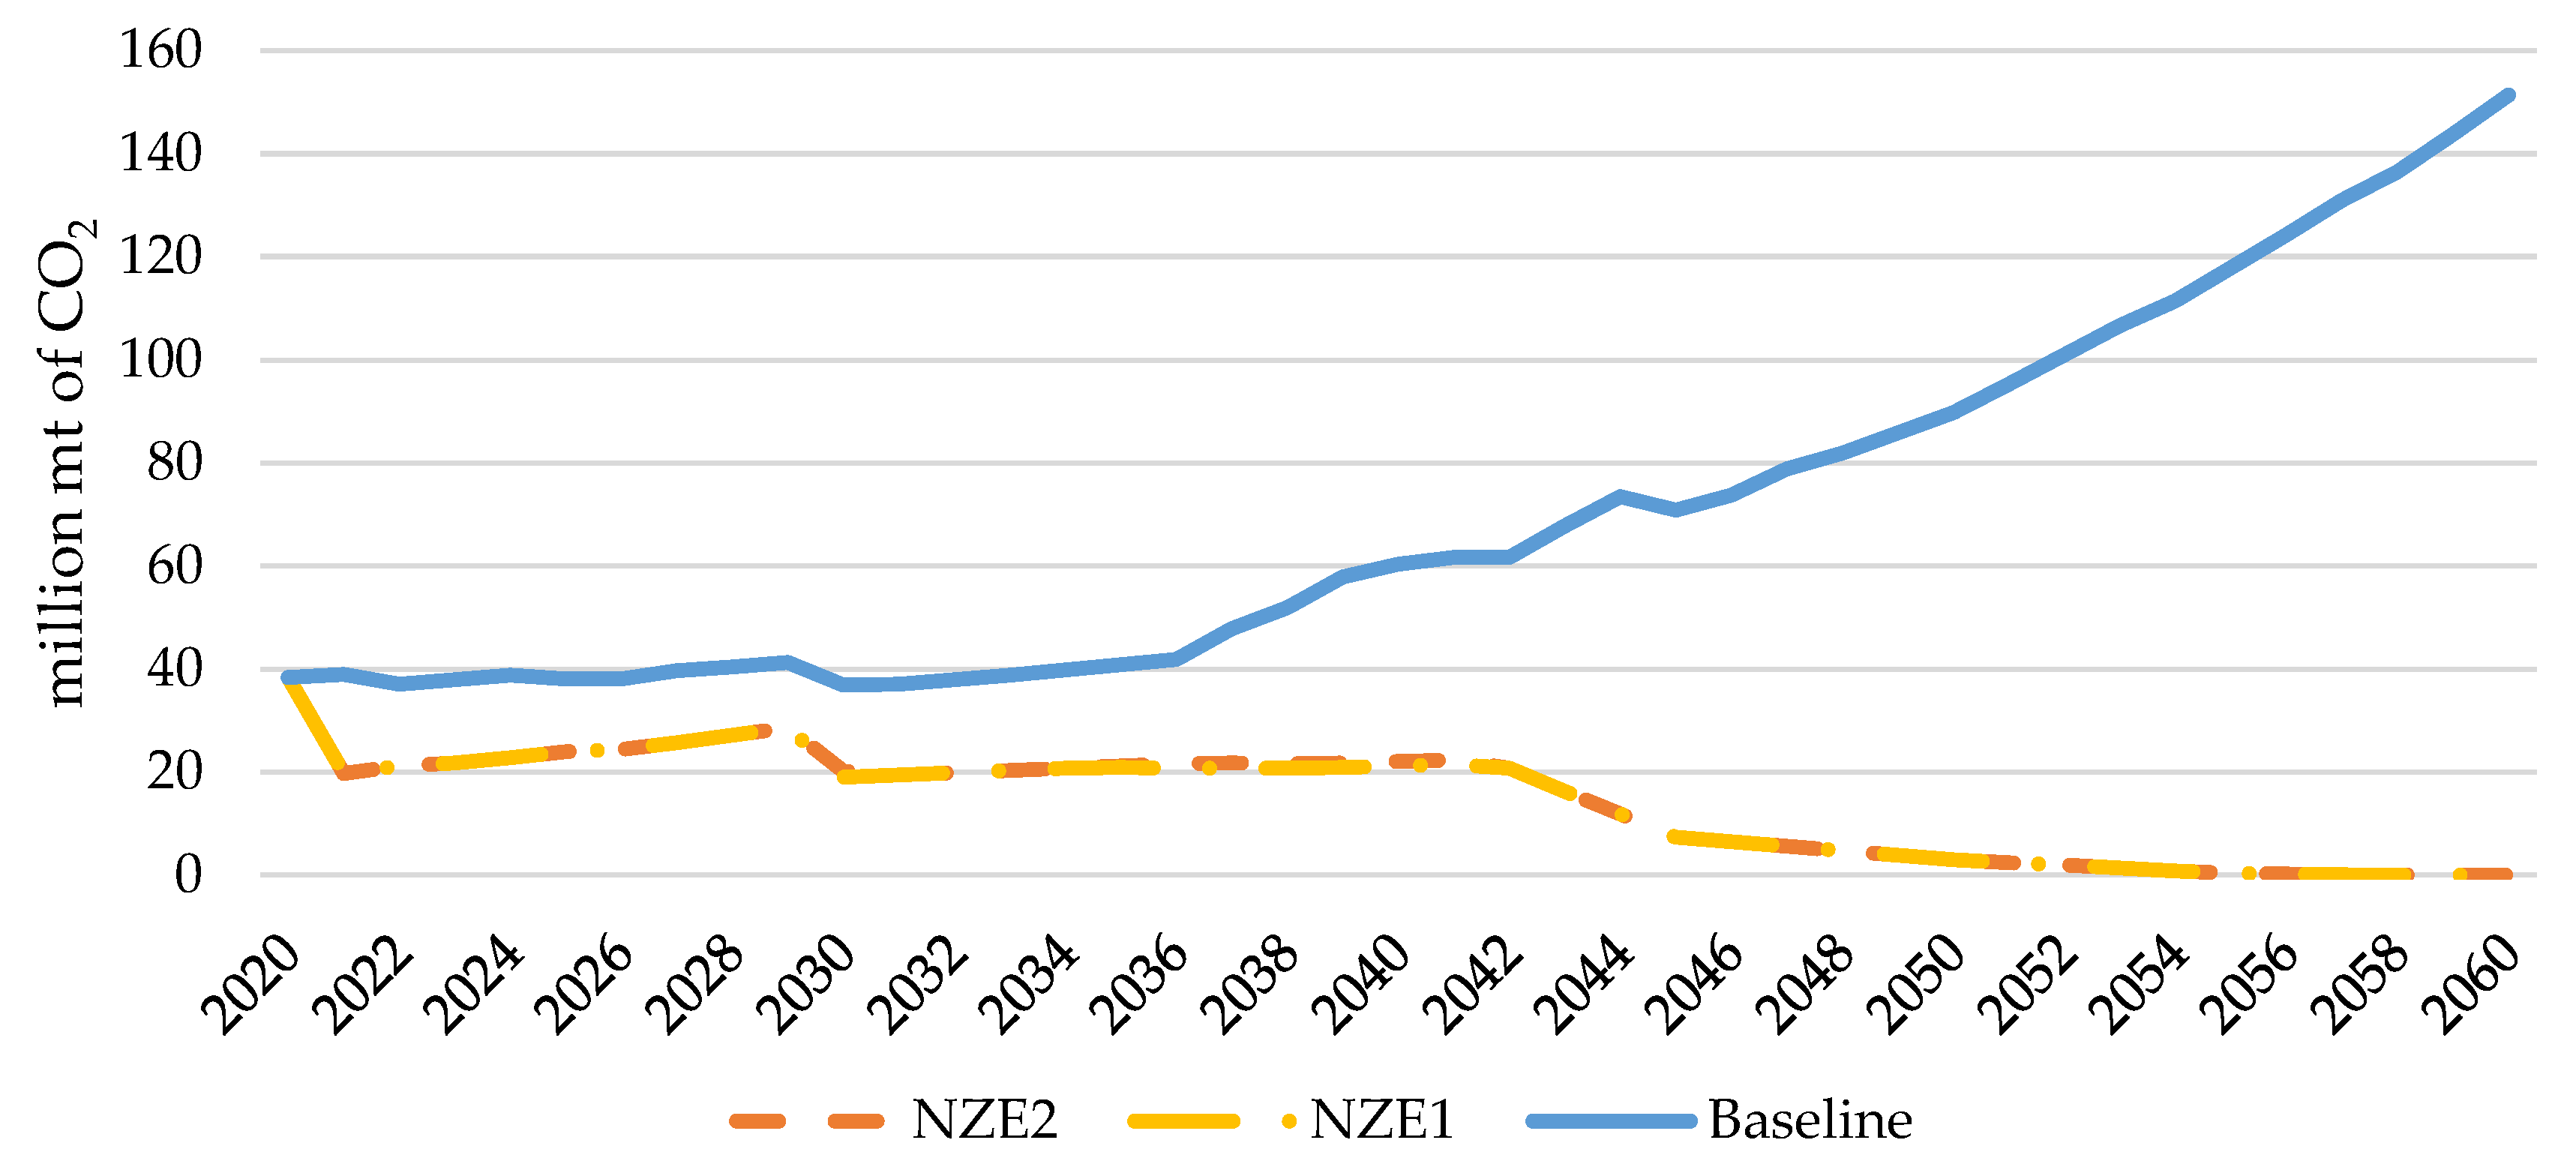
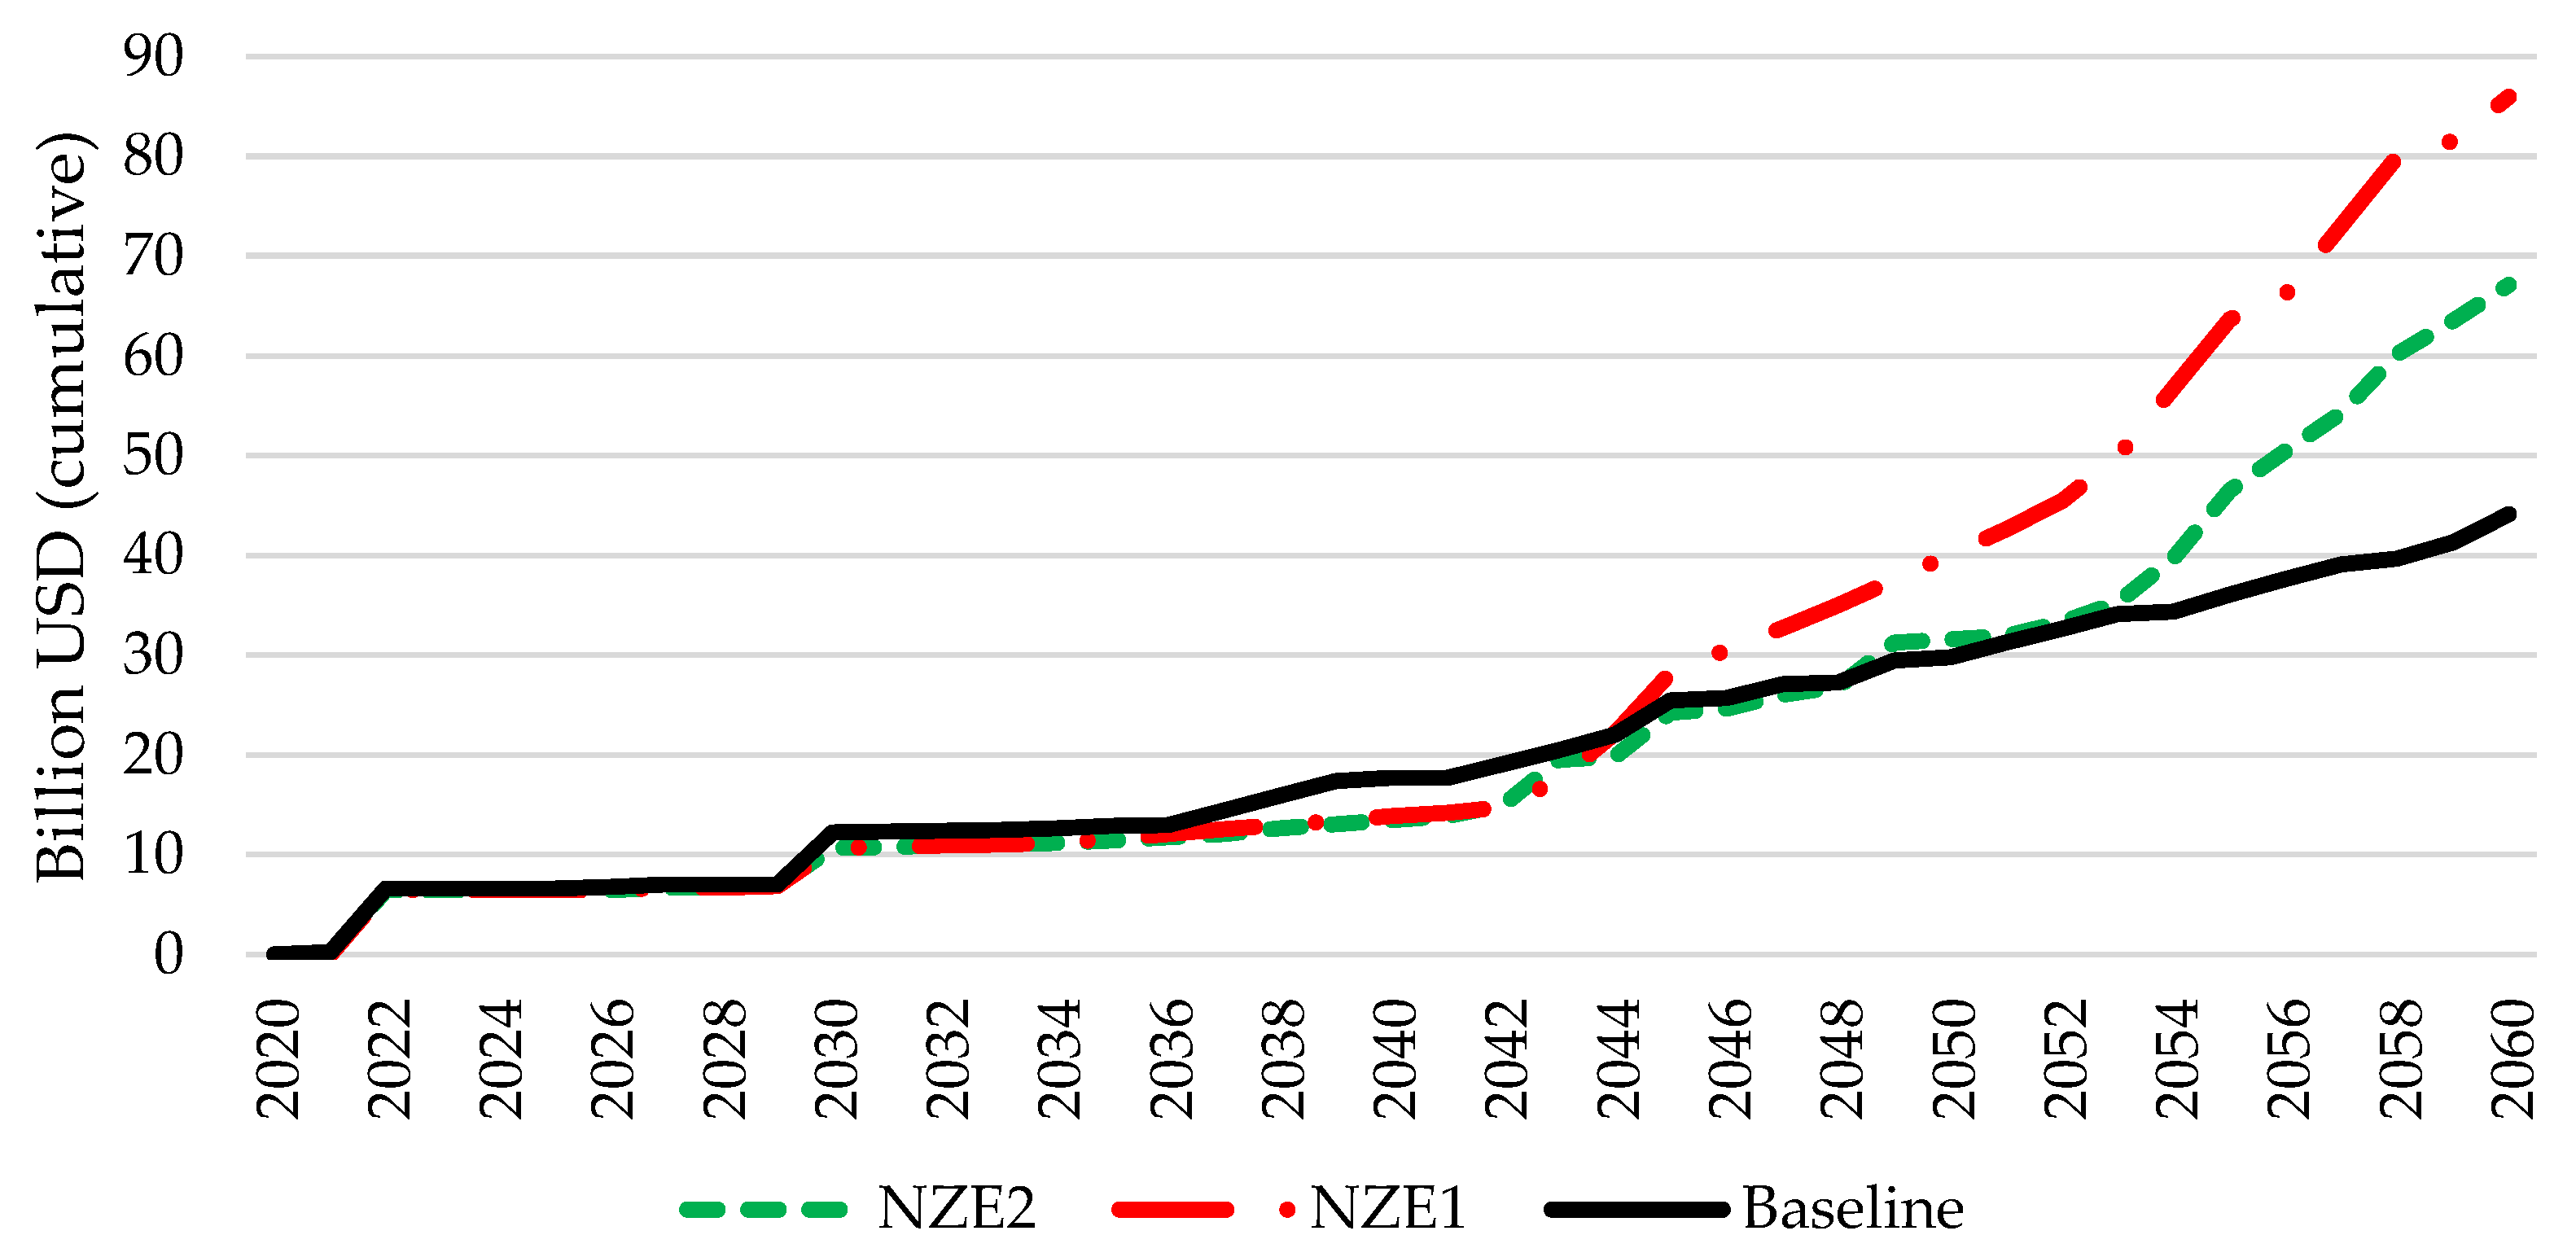
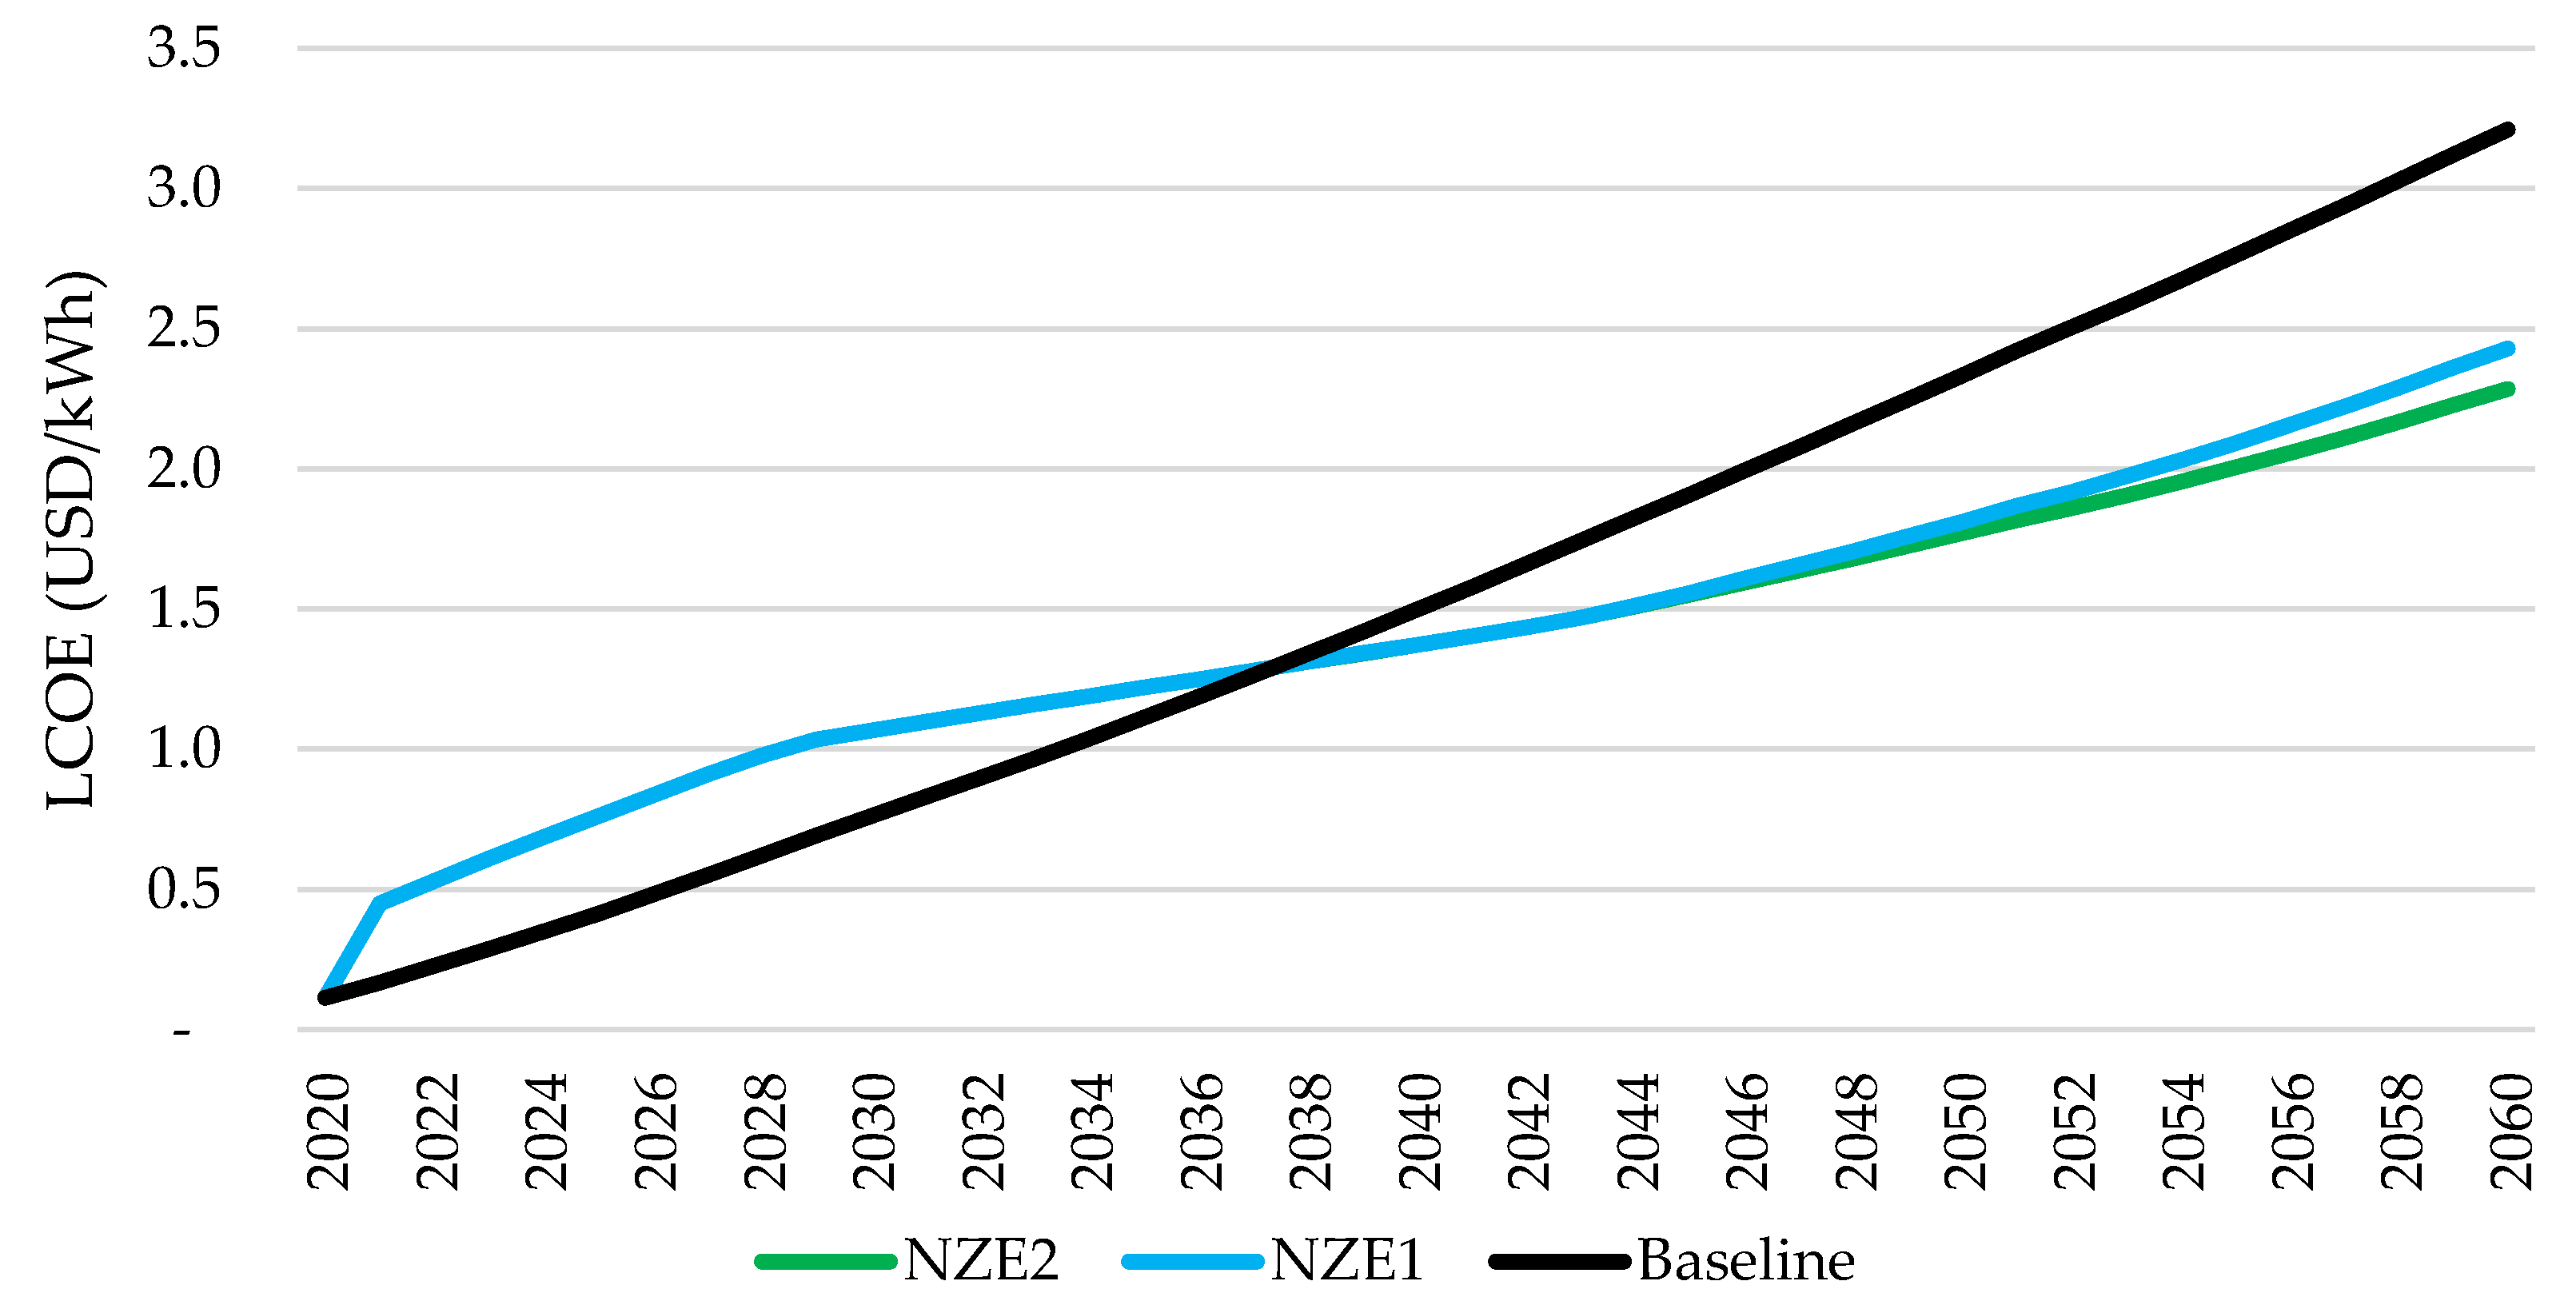
3.3. Environmental and Cost

Figure 18 and Figure 19 illustrate the environmental and investment cost implications of implementing the NZE scenario. Figure 18 displays the CO2 emissions resulting from each scenario. Figure 18 illustrates that the baseline scenario yields significantly higher annual CO2 emissions than the NZE1 and NZE2 scenarios. As per the baseline scenario, the mean annual increase in CO2 emissions is 3.58%. Based on the given average growth value, the baseline scenario yields CO2 emissions of 151.4 Mt in 2060. During the planning period, the NZE1 and NZE2 scenarios exhibit comparable levels of CO2 emissions, except for the period from 2035 to 2041, during which the NZE2 scenario demonstrates lower emissions. The achievement of the NZE target for the electricity generation system can be realized in 2058 through the implementation of the NZE1 and NZE2 scenarios.
Based on the investment cost analysis (Figure 19), the NZE1 scenario incurs the highest total investment costs compared to the other two scenarios. The NZE1 scenario incurs cumulative investment costs of 86 B USD by 2060, which is 1.95 times higher than the cumulative investment costs of the baseline scenario. In 2060, the NZE2 scenario incurs cumulative investment costs of 67.1 B USD, 52% higher than the baseline scenario. To reach Net Zero Emissions (NZE) by 2060, the NZE2 scenario requires significantly less cumulative investment costs than the NZE1 scenario, with a reduction of 28%.
Figure 20 depicts the levelized cost of energy (LCOE) (USD/kWh) for each scenario. From the start of the planning period to 2045, the baseline scenario has a lower LCOE than the other two scenarios. The high LCOE for the NZE1 and NZE2 scenarios at the start of the planning period was due to investments in power plants using renewable and nuclear energy sources, which have higher capital costs than conventional power plants. In 2037, all three scenarios have the same LCOE: 1.3 USD/kWh. From 2039 to 2060, the opposite occurs, with the baseline scenario having a higher LCOE than the other two. This is because the NZE1 and NZE2 scenarios have lower operational and fuel costs than the baseline scenario.
Economically, the baseline scenario is more profitable than the other two scenarios. This is demonstrated by the net present value (NPV) of the NZE1 and NZE scenarios, in which NZE1 has 119.4 B USD, and NZE2 has 118.8 B USD. Both NZE1 and NZE2 scenarios are lower than the baseline scenario of 188.2 B USD. On the other hand, scenarios NZE1 and NZE2 are more environmentally friendly. Overall, the NZE1 and NZE2 scenarios can reduce CO2 emissions by 2258 Mt and 2251 Mt, respectively (compared to the baseline scenario). However, scenarios NZE1 and NZE2 require 28.7 USD and 29 USD to reduce each ton of CO2.
In this article, nuclear power and renewable energy are used to achieve the goal of net zero emissions in the Sumatra island’s electric power sector. Reducing CO2 emissions and other pollutants is one of the environmental benefits of using nuclear power and renewable energy [73]. The quality of environmental health can be enhanced by lowering pollutants from the electricity generation industry [74]. The use of renewable energy to reach net zero emissions can benefit society in addition to the environment, particularly in terms of creating new job opportunities and raising the standard of living [75].
Based on the analysis and discussion outcomes, the strategic utilization of renewable energy sources and nuclear power can effectively lead to achieving the net zero emission goal by 2060. The optimization results reveal that electrical energy production in both the NZE1 and NZE2 scenarios adequately satisfies electricity demand until 2060, ensuring continued security of electricity supply. Furthermore, from the standpoint of electricity production costs, the NZE1 and NZE2 scenarios exhibit a lower levelized cost of electricity (LCOE) compared to the baseline scenario. Consequently, electricity prices remain affordable for residents on the island of Sumatra.
It is also feasible to apply the electricity supply planning model in regions with features comparable to those of Sumatra Island. Given Indonesia’s equatorial location, most Indonesian islands share characteristics similar to those of Sumatra. Additionally, Kalimantan Island exhibits comparable renewable energy potential. Furthermore, considering its lack of earthquake and tsunami risk, Kalimantan Island could be a suitable location for a nuclear power plant [76]. By expanding the study of zero-emission electric power systems in various regions, the national net-zero emission target can be achieved more comprehensively. Moreover, this can contribute to attaining the overall net zero emission goal for Indonesia’s energy sector.

4. Implication of the Study

4.1. Practical Implications

The net-zero emission target leads to changes in the electric power sector, replacing fossil fuels with renewable energy sources and nuclear power. However, this shift may result in decreased productivity and labor on the fossil energy supply side. Conversely, the manufacturing and construction sectors will benefit from increased demand for renewable energy technology, leading to an additional workforce.

4.2. Policy Implications

Based on research findings, policy implications can serve as a foundation for scholarly investigations aimed at formulating policies within the electric power sector to achieve zero-carbon emissions. Collaborative efforts among relevant parties, including academics, policymakers, and other organizations in the power industry, can drive policy development in this direction.

5. Conclusions

A study focused on Sumatra’s power system in Indonesia was conducted to model and analyze power plant capacity planning towards achieving Net Zero Emissions (NZE). The study optimized both renewable and nuclear energy resources. Three scenarios were examined to illustrate the impact of implementing the NZE target, which is set to be achieved by 2060. These scenarios include the baseline, NZE1, and NZE2.
The results of the analysis indicate that renewable and nuclear energy sources can be effectively optimized to achieve NZE by 2060 while still meeting electricity demand. From an environmental perspective, both the NZE1 and NZE2 scenarios significantly reduce emissions compared to the baseline scenario. Overall, the NZE2 scenario achieves a slightly greater reduction in emissions than NZE1. Additionally, the NZE2 scenario incurs lower costs per ton of CO2 reduction compared to NZE1. However, it’s important to note that both NZE1 and NZE2 scenarios involve higher investment costs than the baseline scenario. When considering electricity production costs, the baseline scenario’s Levelized Cost of Electricity (LCOE) at the end of the planning period is higher than that of the other two scenarios.
The model discussed in this article is the GEP model, which does not incorporate transmission network planning. However, it is possible to create an optimization model that integrates the GEP model with the transmission network capacity expansion model, as several renewable energy sources, such as hydro and geothermal, rely heavily on transmission network planning in future research. The small modular reactor can be implemented in the system with future cost reduction according to Nth-of-a-Kind (NOAK) Economic Analysis. The analysis can also be expanded by including social aspects of meeting the NZE target in the electricity supply sector. The deterministic model employed in this article does not explicitly account for uncertainty factors. However, the stochastic optimization model can be enhanced to incorporate uncertain variables such as fuel prices, technological advancements, and policy changes in the energy sector, which can be incorporated into the analysis via optimization models. Furthermore, once the potential for renewable energy has been fully realized and electricity demand continues to rise, additional research can be conducted by incorporating demand-side efficiency into the net zero emission model.

Author Contributions

Conceptualization, M.A.R. and R.A.A.H.; methodology, M.A.R. and R.A.A.H.; software, M.A.R. and R.A.A.H.; validation, M.A.R., R.A.A.H. and R.; formal analysis, M.A.R. and B.S.; investigation, R.A.A.H.; resources, H.B.T. and R.; data curation, I.A.A. and A.S.; writing—original draft preparation, M.A.R. and I.A.A.; writing—review and editing, M.A.R. and I.A.A.; visualization, M.A.R. and A.S.; supervision, H.B.T. and R.A.A.H.; project administration, R. and B.S.; funding acquisition, H.B.T. All authors have read and agreed to the published version of the manuscript.

Funding

This research received no external funding.

Data Availability Statement

The original contributions presented in the study are included in the article, further inquiries can be directed to the corresponding author.

Conflicts of Interest

The authors declare no conflicts of interest.

Abbreviations

ALWRAdvance light water reactor
CFPPCoal fired power plant
CAPEXCapital expenditure
GEPGeneration energy planning
GDPGross domestic product
IPCCIntergovernmental panel on climate change
LEAPLow-emission analysis platform
LRLarge reactor
LWRLight water reactor
NEMONext Energy Modeling for Optimization
NGCCNatural gas combined cycle
NPPNuclear power plant
NZENet zero emission
OPEXOperation and maintenance expenditure
PSHPumped storage hydropower
PVPhotovoltaic
SMRSmall modular reactor
VREVariable renewable energy

References

  1. United Nations Causes and Effects of Climate Change. Available online: https://www.un.org/en/climatechange/science/causes-effects-climate-change (accessed on 1 April 2023).
  2. EPA Global Greenhouse Gas Emissions Data. Available online: https://www.epa.gov/ghgemissions/global-greenhouse-gas-emissions-data (accessed on 12 May 2023).
  3. NAS. The Royal Society. In Climate Change, Evidence, & Causes; The National Academies Press: Washington, DC, USA, 2021. [Google Scholar]
  4. European Commission Consequences of Climate Change. Available online: https://climate.ec.europa.eu/climate-change/consequences-climate-change_en (accessed on 12 May 2023).
  5. Malhi, Y.; Franklin, J.; Seddon, N.; Solan, M.; Turner, M.G.; Field, C.B.; Knowlton, N. Climate Change and Ecosystems: Threats, Opportunities and Solutions. Philos. Trans. R. Soc. B Biol. Sci. 2020, 375, 20190104. [Google Scholar] [CrossRef] [PubMed]
  6. Abbass, K.; Qasim, M.Z.; Song, H.; Murshed, M.; Mahmood, H.; Younis, I. A Review of the Global Climate Change Impacts, Adaptation, and Sustainable Mitigation Measures. Environ. Sci. Pollut. Res. 2022, 29, 42539–42559. [Google Scholar] [CrossRef] [PubMed]
  7. IPCC. Summary for Policymakers. In Climate Change 2022: Mitigation of Climate Change. Contribution of Working Group III to the Sixth Assessment Report of the Intergovernmental Panel on Climate Change; Shukla, P.R., Skea, J., Slade, R., Al Khourdajie, A., van Diemen, R., McCollum, D., Pathak, M., Some, S., Vyas, P., Fradera, R., Eds.; Cambridge University Press: Cambridge, UK; New York, NY, USA, 2022. [Google Scholar] [CrossRef]
  8. IEA. CO2 Emissions in 2022; IEA: Paris, France, 2023. [Google Scholar]
  9. Hannah Ritchie, M.R.P.R. CO2 and Greenhouse Gas Emissions. Our World Data 2020. Available online: https://ourworldindata.org/co2-and-greenhouse-gas-emissions (accessed on 12 January 2024).
  10. IEA. CO2 Emissions from Electricity and Heat Production by Fuel, and Share by Fuel, 2000–2021. Available online: https://www.iea.org/data-and-statistics/charts/co2-emissions-from-electricity-and-heat-production-by-fuel-and-share-by-fuel-2000-2021 (accessed on 12 May 2023).
  11. IRENA. World Outlook 2023 Transitions Energy 1.5 °C Pathway; International Renewable Energy Agency: Abu Dhabi, United Arab Emirates, 2023. [Google Scholar]
  12. International Energy Agency International Energy Agency (IEA). World Energy Outlook 2022; International Energy Agency: Paris, France, 2022; p. 524. [Google Scholar]
  13. United Nations the Paris Agreement. Available online: https://unfccc.int/process-and-meetings/the-paris-agreement?gad_source=1&gclid=CjwKCAjw_e2wBhAEEiwAyFFFo8OO0Vvz9J9StFycDYqOODq79D2k2JWgkY8sJd000M_xek5AUESYqBoCWZIQAvD_BwE (accessed on 20 December 2023).
  14. Pramudianto, A. Dari Kyoto Protocol 1997 Ke Paris Agreement 2015: Dinamika Diplomasi Perubahan Iklim Global Dan Asean Menuju 2020. Glob. J. Polit. Int. 2020, 18, 76–94. [Google Scholar] [CrossRef]
  15. Renné, D.S. Progress, Opportunities and Challenges of Achieving Net-Zero Emissions and 100 % Renewables. Sol. Compass 2022, 1, 100007. [Google Scholar] [CrossRef]
  16. Peng, Q.; Liu, W.; Zhang, Y.; Zeng, S.; Graham, B. Generation Planning for Power Companies with Hybrid Production Technologies under Multiple Renewable Energy Policies. Renew. Sustain. Energy Rev. 2023, 176, 113209. [Google Scholar] [CrossRef]
  17. Hasibi, R.A. Al Multi-Objective Analysis of Sustainable Generation Expansion Planning Based on Renewable Energy Potential: A Case Study of Bali Province of Indonesia. Int. J. Sustain. Energy Plan. Manag. 2021, 31, 189–210. [Google Scholar]
  18. Hasibi, A.; Adiprasetya, R.; Bawan, E.K. An Analysis of the Impact of the Covid-19 Pandemic on the Implementation of Renewable Energy in the Supply of Electricity. Int. J. Sustain. Energy Plan. Manag. 2023, 39, 3–21. [Google Scholar] [CrossRef]
  19. Liu, J.; Zhou, Y.; Yang, H.; Wu, H. Net-Zero Energy Management and Optimization of Commercial Building Sectors with Hybrid Renewable Energy Systems Integrated with Energy Storage of Pumped Hydro and Hydrogen Taxis. Appl. Energy 2022, 321, 119312. [Google Scholar] [CrossRef]
  20. Heo, S.; Ko, J.; Kim, S.; Jeong, C.; Hwangbo, S.; Yoo, C. Explainable AI-Driven Net-Zero Carbon Roadmap for Petrochemical Industry Considering Stochastic Scenarios of Remotely Sensed Offshore Wind Energy. J. Clean. Prod. 2022, 379, 134793. [Google Scholar] [CrossRef]
  21. Adiprasetya, R.; Hasibi, A.; Haris, A. An Analysis of the Implementation of a Hybrid Renewable-Energy System in a Building by Considering the Reduction in Electricity Price Subsidies and the Reliability of the Grid. Clean Energy 2023, 7, 1125–1135. [Google Scholar]
  22. Mandel, T.; Kranzl, L.; Popovski, E.; Sensfuß, F.; Müller, A. Investigating Pathways to a Net - Zero Emissions Building Sector in the European Union: What Role for the Energy Efficiency First Principle? Energy Effic. 2023, 16, 22. [Google Scholar] [CrossRef]
  23. Hu, Y.; Wu, W. Can Fossil Energy Make a Soft Landing?—The Carbon-Neutral Pathway in China Accompanying CCS. Energy Policy 2023, 174, 113440. [Google Scholar] [CrossRef]
  24. Price, J.; Keppo, I.; Dodds, P.E. The Role of New Nuclear Power in the UK’ s Net-Zero Emissions Energy System Committee on Climate Change. Energy 2023, 262, 125450. [Google Scholar] [CrossRef]
  25. Andersson, K. Current Status of Carbon Capture, Utilization, and Storage Technologies in the Global Economy: A Survey of Technical Assessment. Fuel 2023, 342, 127776. [Google Scholar] [CrossRef]
  26. Sandberg, E.; Krook-riekkola, A. The Impact of Technology Availability on the Transition to Net-Zero Industry in Sweden. J. Clean. Prod. 2022, 363, 132594. [Google Scholar] [CrossRef]
  27. Nian, V.; Mignacca, B.; Locatelli, G. Policies toward Net-Zero: Benchmarking the Economic Competitiveness of Nuclear against Wind and Solar Energy. Appl. Energy 2022, 320, 119275. [Google Scholar] [CrossRef]
  28. Wei, X.; Liu, D.; Ye, S.; Chen, F.; Weng, J. ScienceDirect Optimal Sizing of Energy Storage in Generation Expansion Planning of New Power System with High Penetration of Renewable Energies. Energy Rep. 2023, 9, 1938–1947. [Google Scholar] [CrossRef]
  29. Liu, Z.; Du, Y. Evolution towards Dispatchable PV Using Forecasting, Storage, and Curtailment: A Review. Electr. Power Syst. Res. 2023, 223, 109554. [Google Scholar] [CrossRef]
  30. Yu, Y.; Du, E.; Chen, Z.; Su, Y.; Zhang, X.; Yang, H.; Wang, P.; Zhang, N. Optimal Portfolio of a 100 % Renewable Energy Generation Base Supported by Concentrating Solar Power. Renew. Sustain. Energy Rev. 2022, 170, 112937. [Google Scholar] [CrossRef]
  31. Tanwar, M.D.; Torres, F.A.; Alqahtani, A.M.; Tanwar, P.K.; Bhand, Y.; Doustdar, O. Promising Bioalcohols for Low-Emission Vehicles. Energies 2023, 16, 597. [Google Scholar] [CrossRef]
  32. Chapman, P.J.; Grayson, R.P.; Ziv, G. Science of the Total Environment Planting Hedgerows: Biomass Carbon Sequestration and Contribution towards Net-Zero Targets. Sci. Total Environ. 2023, 892, 164482. [Google Scholar] [CrossRef]
  33. IEA. Projected Costs of Generating Electricity 2020; International Energy Agency: Paris, France, 2020. [Google Scholar]
  34. Calikoglu, U.; Aydinalp, M. A Pathway to Achieve the Net Zero Emissions Target for the Public Electricity and Heat Production Sector: A Case Study for Türkiye. Energy Policy 2023, 179, 113653. [Google Scholar] [CrossRef]
  35. Millot, A.; Krook-riekkola, A.; Maïzi, N. Guiding the Future Energy Transition to Net-Zero Emissions: Lessons from Exploring the Differences between France and Sweden. Energy Policy 2020, 139, 111358. [Google Scholar] [CrossRef]
  36. Bhattacharya, S.; Banerjee, R.; Ramadesigan, V.; Liebman, A.; Dargaville, R. Bending the Emission Curve–The Role of Renewables and Nuclear Power in Achieving a Net-Zero Power System in India. Renew. Sustain. Energy Rev. 2024, 189, 113954. [Google Scholar] [CrossRef]
  37. Kim, J.H.; Alameri, S.A. Harmonizing Nuclear and Renewable Energy: Case Studies. Int. J. Energy Res. 2020, 44, 8053–8061. [Google Scholar] [CrossRef]
  38. Zhai, H.; Gu, B.; Zhu, K.; Huang, C. Feasibility Analysis of Achieving Net-Zero Emissions in China’ s Power Sector before 2050 Based on Ideal Available Pathways. Environ. Impact Assess. Rev. 2023, 98, 106948. [Google Scholar] [CrossRef]
  39. Rahmanta, M.A.; Harto, A.W.; Agung, A.; Ridwan, M.K. Nuclear Power Plant to Support Indonesia’s Net Zero Emissions: A Case Study of Small Modular Reactor Technology Selection Using Technology Readiness Level and Levelized Cost of Electricity Comparing Method. Energies 2023, 16, 3752. [Google Scholar] [CrossRef]
  40. PT PLN (Persero) Statistik PLN 2022. 2023. Available online: https://web.pln.co.id/stakeholder/laporan-statistik (accessed on 19 December 2023).
  41. Reyseliani, N.; Hidayatno, A.; Purwanto, W.W. Implication of the Paris Agreement Target on Indonesia Electricity Sector Transition to 2050 Using TIMES Model. Energy Policy 2022, 169, 113184. [Google Scholar] [CrossRef]
  42. PT PLN (Persero). Optimalisasi Strategi Mewujudkan Transisi Energi Berkelanjutan Optimizing Strategy in Realizing Sustainable Energy Transition; PT PLN (Persero): Jakarta, Indonesia, 2021. [Google Scholar]
  43. Heaps, C.G. LEAP: The Low Emissions Analysis Platform. Available online: https://leap.sei.org (accessed on 31 August 2023).
  44. Wambui, V.; Njoka, F.; Muguthu, J.; Ndwali, P. Scenario Analysis of Electricity Pathways in Kenya Using Low Emissions Analysis Platform and the Next Energy Modeling System for Optimization. Renew. Sustain. Energy Rev. 2022, 168, 112871. [Google Scholar] [CrossRef]
  45. Malka, L.; Bidaj, F.; Kuriqi, A.; Jaku, A.; Roçi, R. Energy System Analysis with a Focus on Future Energy Demand Projections: The Case of Norway. Energy 2023, 272, 127107. [Google Scholar] [CrossRef]
  46. Zivkovi, M.; Ivezi, D. Integrated Energy Planning Approach for Accelerating Energy Transition of Households. Energy Rep. 2023, 10, 4641–4650. [Google Scholar] [CrossRef]
  47. Zhai, J.; She, L.; Hao, S.; Liu, H. ScienceDirect Projection of Regional Carbon Emissions and Analysis of Emission Reduction Potential under Multiple Scenarios. Energy Rep. 2023, 9, 753–761. [Google Scholar] [CrossRef]
  48. Ayuketah, Y.; Gyamfi, S.; Amankwah, F.; Dagoumas, A.S. Power Generation Expansion Pathways: A Policy Analysis of the Cameroon Power System. Energy Strateg. Rev. 2022, 44, 101004. [Google Scholar] [CrossRef]
  49. Nyarko, E.; Mahama, M. Greenhouse Gas (GHG) Emissions Reduction in the Electricity Sector: Implications of Increasing Renewable Energy Penetration in Ghana’ s Electricity Generation Mix. Sci. Afr. 2023, 21, e01843. [Google Scholar] [CrossRef]
  50. Amo-aidoo, A.; Kumi, E.N.; Hensel, O.; Korese, J.K.; Sturm, B. Solar Energy Policy Implementation in Ghana: A LEAP Model Analysis. Sci. Afr. 2022, 16, e01162. [Google Scholar] [CrossRef]
  51. Handayani, K.; Overland, I.; Suryadi, B.; Vakulchuk, R. Integrating 100 % Renewable Energy into Electricity Systems: A Net-Zero Analysis for Cambodia, Laos, and Myanmar. Energy Rep. 2023, 10, 4849–4869. [Google Scholar] [CrossRef]
  52. Habtu, D.; Ahlgren, E.O.; Bekele, G. Long-Term Electricity Supply Modelling in the Context of Developing Countries: The OSeMOSYS-LEAP Soft-Linking Approach for Ethiopia. Energy Strateg. Rev. 2023, 45, 101045. [Google Scholar] [CrossRef]
  53. Kementerian Energi & Sumber Daya Mineral. Draft RUKN 2023-2060; Kementerian Energi & Sumber Daya Mineral: Jakarta, Indonesia, 2023. [Google Scholar]
  54. Kementerian Energi & Sumber Daya Mineral. Rencana Usaha Penyediaan Tenaga Listrik (RUPTL) PT. PLN (Persero) 2021–2030; Kementerian Energi & Sumber Daya Mineral: Jakarta, Indonesia, 2021. [Google Scholar]
  55. President of Republic Indonesia. Peraturan Presiden Republik Indonesia Nomor 22 Tahun 2017 Tentang Rencana Umum Energi Nasional; Kementerian Energi & Sumber Daya Mineral: Jakarta, Indonesia, 2017. [Google Scholar]
  56. Badan Pusat Statistik Republik Indonesia Jumlah Penduduk Pertengahan Tahun (Ribu Jiwa), 2021–2023. Available online: https://www.bps.go.id/indicator/12/1975/1/jumlah-penduduk-pertengahan-tahun.html (accessed on 30 August 2023).
  57. BPS. Proyeksi Penduduk Indonesia 2020–2050: Hasil Sensus Penduduk 2020; BPS: Jakarta, Indonesia, 2023; ISBN 9786024385217. [Google Scholar]
  58. BPS. Produk Domestik Regional Bruto Provinsi-Provinsi Di Indonesia Menurut Lapangan Usaha; BPS: Jakarta, Indonesia, 2023. [Google Scholar]
  59. Bank of Indonesia Inflation Data. Available online: https://www.bi.go.id/en/statistik/indikator/data-inflasi.aspx (accessed on 3 September 2023).
  60. NREL Annual Technology Baseline Approach and Methodology 2022. Available online: https://atb.nrel.gov/electricity/2022/approach_&_methodology (accessed on 4 January 2024).
  61. Rahmanta, M.A.; Adhi, A.C.; Tambunan, H.B.; Digwijaya, W.; Damanik, N.; Adiprasetya, R.; Hasibi, A. An Analysis of National Position, Opportunity, and Challenge of Indonesia ’ s Nuclear Program to Support Net Zero Emission. Energies 2023, 16, 8089. [Google Scholar] [CrossRef]
  62. NASA. POWER|Data Access Viewer. Available online: https://power.larc.nasa.gov/data-access-viewer/ (accessed on 17 January 2023).
  63. IPCC. Fifth Assessment Report. Available online: https://www.ipcc.ch/reports/?rp=ar5 (accessed on 18 January 2024).
  64. Goldberg, S.M.; Rosner, R. Nuclear Reactors: Generation to Generation; The American Academy of Arts and Sciences: Cambridge, MA, USA, 2011; ISBN 0877240906. [Google Scholar]
  65. Reinberger, D.; Ajanovic, A.; Haas, R. The Technological Development of Different Generations and Reactor Concepts. Energy Policy Clim. Prot. 2019, 243–258. [Google Scholar] [CrossRef]
  66. UNECE. Technology Brief Nuclear Power; UNECE: Geneva, Switzerland, 2020. [Google Scholar]
  67. Mignacca, B.; Locatelli, G. Economics and Finance of Small Modular Reactors: A Systematic Review and Research Agenda. Renew. Sustain. Energy Rev. 2020, 118, 109519. [Google Scholar] [CrossRef]
  68. IAEA. Status of Innovative Small and Medium Sized Reactor Designs 2005; IAEA: Vienna, Austria, 2006; ISBN 9201010060. [Google Scholar]
  69. Oettingen, M. Modelling of the Reactor Cycle Cost for Thorium-Fuelled PWR and Environmental Aspects of a Nuclear Fuel Cycle. Geol. Geophys. Environ. 2019, 45, 207. [Google Scholar] [CrossRef]
  70. Kim, J.H.; Song, M.M.; Alameri, S.A. Emerging Areas of Nuclear Power Applications. Nucl. Eng. Des. 2019, 354, 110183. [Google Scholar] [CrossRef]
  71. Schaffrath, A.; Wielenberg, A.; Kilger, R.; Seubert, A. SMRs—Overview, International Developments, Safety Features and the GRS Simulation Chain. Front. Energy 2021, 15, 793–809. [Google Scholar] [CrossRef]
  72. Lloyd, C.A.; Roulstone, T.; Lyons, R.E. Transport, Constructability, and Economic Advantages of SMR Modularization. Prog. Nucl. Energy 2021, 134, 103672. [Google Scholar] [CrossRef]
  73. Zhang, N.; Zheng, J.; Song, G.; Zhao, H. Regional Comprehensive Environmental Impact Assessment of Renewable Energy System in California. J. Clean. Prod. 2022, 376, 134349. [Google Scholar] [CrossRef]
  74. Kumar, K.; Roy, C.; Yadav, D.; Verma, R.; Dutta, S.; Smriti, K.; Selva, K.; Karuppasamy, K. Renewable and Sustainable Clean Energy Development and Impact on Social, Economic, and Environmental Health. Energy Nexus 2022, 7, 100118. [Google Scholar] [CrossRef]
  75. Terrapon-pfa, J.; Fink, T.; Viebahn, P.; Mostafa, E. Social Impacts of Large-Scale Solar Thermal Power Plants: Assessment Results for the NOOR O I Power Plant in Morocco. Renew. Sustain. Energy Rev. 2019, 113, 109259. [Google Scholar] [CrossRef]
  76. Santosa, J.; Kuncoro, A.H.; Dwijatmiko, A.; Hesty, N.W.; Darmawan, A. The Role of Nuclear Power Plants in Indonesia towards Net Zero Emissions (NZE) in 2060 with a Multi Regions Approach. Evergreen 2023, 10, 1660–1673. [Google Scholar] [CrossRef]
Figure 1. Electricity demand by sector in 2020.
Energies 17 01958 g001
Figure 2. The capacity of the installed power plant by type in 2020.
Energies 17 01958 g002
Figure 3. Technical potential of renewable energy resources in Sumatra.
Energies 17 01958 g003
Figure 4. The projection of population growth along the planning horizon.
Energies 17 01958 g004
Figure 5. The projection of GDP growth along the planning horizon.
Energies 17 01958 g005
Figure 6. Capex by power plant technology along projection period.
Energies 17 01958 g006
Figure 7. Fixed opex by power plant technology along the projection period.
Energies 17 01958 g007
Figure 8. Variable opex by power plant technology along the projection period.
Energies 17 01958 g008
Figure 9. Availability of solar resources.
Energies 17 01958 g009
Figure 10. Availability of wind resources.
Energies 17 01958 g010
Figure 11. Electricity demand projection along the planning horizon.
Energies 17 01958 g011
Figure 12. Electricity production by each generation technology based on baseline scenario.
Energies 17 01958 g012
Figure 13. Electricity production by each generation technology based on the NZE1 scenario.
Energies 17 01958 g013
Figure 14. Electricity production by each generation technology based on the NZE2 scenario.
Energies 17 01958 g014
Figure 15. Yearly capacity addition based on baseline scenario.
Energies 17 01958 g015
Figure 16. Yearly capacity addition based on NZE1 scenario.
Energies 17 01958 g016
Figure 17. Yearly capacity addition based on NZE2 scenario.
Energies 17 01958 g017
Figure 18. CO2 emissions based on scenario.
Energies 17 01958 g018
Figure 19. Cumulative investment cost based on scenarios.
Energies 17 01958 g019
Figure 20. LCOE based on scenarios.
Energies 17 01958 g020
Table 1. Technical characteristics of power plant technology.
Power GenerationsAddition Size (MW)Efficiency (%)Capacity Credit (%)Maximum Availability (%)Lifetime (Year)
CFPP600351009040
GT CC100561009530
Gas Turbine20331009730
Hydro50100514180
Geothermal50100809030
Biomass50351009040
PV1010022Figure 925
Wind1010035Figure 1025
NPP (SMR)300421008360
NPP (ALWR)1300361009560
NPP (LWR)950331009560
Table 2. Economic parameters of energy storage technology.
TypeCapex ($/kW)Fixed Opex ($/kW-yr)Variable Opex ($/kwh)
Battery394499-
PSH239517.800.51
Table 3. Fuel price for baseline and NZE scenarios.
FuelUnitPrice
202020302060
OilUSD/Barrel61.10110.00100.00
Coal subituminousUSD/Ton61.1360.0068.00
Natural GasUSD/MMBTU6.788.0011.00
U235USD/kg0.680.70.74
Disclaimer/Publisher’s Note: The statements, opinions and data contained in all publications are solely those of the individual author(s) and contributor(s) and not of MDPI and/or the editor(s). MDPI and/or the editor(s) disclaim responsibility for any injury to people or property resulting from any ideas, methods, instructions or products referred to in the content.

