
Integrated Study on Carbon Dioxide Geological Sequestration and Gas Injection Huff-n-Puff to Enhance Shale Oil Recovery

1
State Key Laboratory of Shale Oil and Gas Enrichment Mechanisms and Effective Development, SINOPEC, Beijing 100101, China
2
Sinopec Key Laboratory of Shale Oil/Gas Exploration and Production Technology, SINOPEC, Beijing 100083, China
3
School of Earth Resources, China University of Geosciences, Wuhan 430074, China
4
State Key Laboratory of Coal Mine Disaster Dynamics and Control, Chongqing University, Chongqing 400044, China
*
Author to whom correspondence should be addressed.
Energies 2024, 17(8), 1957; https://doi.org/10.3390/en17081957
Submission received: 4 February 2024
/
Revised: 1 April 2024
/
Accepted: 16 April 2024
/
Published: 19 April 2024
(This article belongs to the Special Issue Advances in the Development of Unconventional Oil and Gas Resources)
Abstract
:Multi-stage fractured horizontal well technology is an effective development method for unconventional reservoirs; however, shale oil reservoirs with ultra-low permeability and micro/nanopore sizes are still not ideal for production and development. Injecting CO2 into the reservoir, after hydraulic fracturing, gas injection flooding often produces a gas channeling phenomenon, which affects the production of shale oil. In comparison, CO2 huff-n-puff development has become a superior method in the development of multi-stage fractured horizontal wells in shale reservoirs. CO2 huff and injection can not only improve shale oil recovery but also store the CO2 generated in industrial production in shale reservoirs, which can reduce greenhouse gas emissions to a certain extent and achieve carbon capture, utilization, and storage (CCUS). In this paper, the critical temperature and critical parameters of fluid in shale reservoirs are corrected by the critical point correction method in this paper, and the influence of reservoir pore radius on fluid phase behavior and shale oil production is analyzed. According to the shale reservoir applied in isolation to the actual state of the reservoir and under the condition of a complex network structure, we described the seepage characteristics of shale oil and gas and CO2 in the reservoir by embedding a discrete fracture technology structure and fracture network, and we established the numerical model of the CO2 huff-n-huff development of multi-stage fractured horizontal wells for shale oil. We used the actual production data of the field for historical fitting to verify the validity of the model. On this basis, CO2 huff-n-puff development under different gas injection rates, huff-n-puff cycles, soaking times, and other factors was simulated; cumulative oil production and CO2 storage were compared; and the influence of each factor on development and storage was analyzed, which provided theoretical basis and specific ideas for the optimization of oilfield development modes and the study of CO2 storage.
1. Introduction
Shale oil reservoirs have very low permeability and fluid flow is difficult, which poses great challenges to oilfield production. At present, the multi-stage fracturing of horizontal wells is mostly used in shale reservoirs [1]. In addition, water injection and gas injection are often used to improve the recovery of shale oil and gas. Due to the problems of low injection capacity and water swelling of rock, the application of water injections to enhance oil recovery is not ideal at present [2]. Chengyao Song and Daoyong Yang performed a series of displacement experiments on core samples from the Bakken tight formation [3]. The results show that compared with water flooding, CO2 huff-n-puff can significantly improve recovery, and near miscible CO2 huff-n-puff can achieve better recovery than immiscible CO2 huff-n-puff [4,5,6]. Beyond that, in the process of CO2 injection, gas channeling seriously affects oil displacement efficiency. It is necessary to study the factors affecting finger channeling and prevent finger channeling [7]. Taking the CO2 injection displacement development in Changqing oilfield in 2013 as an example, CO2 easily formed gas channels along natural fractures, which greatly reduced the sweep efficiency and affected the final recovery factor [8]. Weiyu Tang and James J. Sheng conducted a core gas injection experiment, and the experimental results show that huff-n-puff gas injection is better than continuous gas injection in enhancing oil recovery when the permeability is lower than 0.001 mD [9]. The carbon dioxide injection technology serves as a promising approach for the development of oil and gas fields, enabling the achievement of CCUS while simultaneously enhancing oil recovery [10]. According to the forecast data from 2020 to 2040, the utilization of CO2 injection and other gas drive methods will exhibit a significant annual increase. The United States, along with several other countries, has successfully implemented large-scale field applications of CO2 injection. Similarly, China’s CO2 injection projects have achieved successful field pilot and extension tests in oilfields [11].
Therefore, a more stable and sustainable circular gas injection method—CO2 huff-n-puff—is now more widely recognized and favored [12,13,14]. As shown in Figure 1, as for shale, the process of CO2 huff-n-puff needs to be completed in a single well, which is mainly divided into three stages: the injection phase, well shut and soak phase, and the resuming production phase [15]. Well soaking is a critical step: as the soaking time increases, mass transfer and molecular diffusion dominate, leading to the penetration of carbon dioxide into the matrix. When carbon dioxide enters the matrix, the volume of crude oil in the matrix expands, the viscosity decreases, and the interfacial tension decreases. As the oil expands, the pressure in the matrix rises, creating a new pressure gradient that allows the oil in the matrix to be pumped out through microfractures [16].
In the development of CO2 huff-n-puff EOR, many scholars have proved the effectiveness of this method through a large number of experimental studies. Wan-fen Pu et al., using a true triaxial stress element core fracturing and displacement system combined with microseismic monitoring, verified the feasibility of CO2 stimulation in a fractured conglomerate system [17]. After stimulation, the oil recovery is improved, and the EOR is 29.2% of OOIP. Pedram Mahzari et al. developed a new experimental method that saturates shale cores by soaking them in live oil and then fracking them to simulate the reality of a reservoir [18]. Based on this, CO2 huff-n-puff experiments were carried out, and finally, for cores saturated with live oil, CO2 huff-n-puff increased recovery by 48%. Evgeny Shilov et al. established a 40 cm × 40 cm × 3 cm plate model using CO2 huff-n-puff model physical simulation experiments of multi-stage fractured horizontal wells in Ordos Basin, taking outcrop cores of the Chang 8 reservoir as the research object, to study the effect of CO2 huff-n-puff on enhancing oil recovery in fractured tight reservoirs [19]. The results showed that the recovery rate increased by 11.13% to 21.39% after three rounds of stimulation compared to depleted development. In the past decade, the numerical simulation of carbon dioxide stimulation in shale oil reservoirs and tight oil reservoirs has been widely studied. Scholars used Local Grid Refinement [20] and the embedded discrete fracture model (EDFM) [21] compositional simulation of CO2 huff-n-puff in Eagle Ford tight oil reservoirs with CO2 molecular diffusion, nanopore confinement, and complex natural fractures. The compositional simulation of the CO2 huff-n-puff process in Middle Bakken tight oil reservoirs was carried out with hydraulic fractures to build complex fracture networks [22], and reservoir parameters, engineering parameters, and injection parameters were adjusted to conduct a sensitivity analysis, so as to optimize the development method. Yuan Zhang et al. carried out a sensitivity analysis of reservoir physical properties by the numerical simulation method and found that permeability and the stress sensitivity effect had a great influence on productivity [23]. The higher the reservoir permeability, the higher the final recovery efficiency, the stronger the stress sensitivity effect, and the lower the final recovery efficiency. CO2 injection parameters have also been shown to be an important factor affecting the recovery efficiency. The injection parameters include CO2 injection rate, CO2 injection time, CO2 huff-n-puff rounds, etc. The numerical simulation of gas injection huff-n-puff in Bakken shale [22] shows that the CO2 injection rate is the injection parameter that has the greatest impact on recovery during CO2 injection.
In addition, for shale reservoirs, the influence of the pore throat on the phase state should be taken into account. Dew-point pressure, fluid density, viscosity, and other parameters are quite different from conventional reservoirs. The study of nanoconfined fluid in shale reservoirs has a short history. Miyahara M and Kanda H used molecular dynamics methods to study the phase change process of CH4 in nanopores, proposed a sublimation model of CH4 under the action of nanoconfinement, and successfully corrected the equation of state parameters during the phase transition process [24]. Dong X et al. studied the influence of changes in critical properties of confined fluids on gas phase transition in shale reservoirs. Critical parameters were modified using the Lennard-Jones dimension parameter to correct the critical parameters of the confined fluid [25].
Based on the above research, it is not difficult to see that the development of shale oil is of great significance. CO2 injection huff-n-puff to enhance shale oil recovery and CO2 sequestration technology can give consideration to both economic benefits and environmental protection. However, the complex seepage mechanism of shale oil reservoir fluid requires the coupling of the starting pressure gradient and stress-sensitive effect, and the adsorption and desorption effect of the reservoir gas should also be considered during gas injection. Moreover, the phase characteristics of confined fluid in the nanopores of shale reservoir are quite different from the ground conditions, and it is difficult to accurately understand and characterize the complex fracture network formed by hydraulic fractures in the reservoir. In current studies, it is difficult to fully characterize the above multi-component seepage mechanism, and the mathematical model of CO2 injection huff-n-puff of shale oil under a complex fracture network is not perfect. In addition, there are many factors affecting CO2 injection huff-n-puff, which will affect the final cumulative production and CO2 sequestration effect. Therefore, it is necessary to conduct multi-factor analysis to study the influence of each factor on the CO2 injection huff-n-puff development of shale oil. Therefore, it is necessary to establish a multi-component mathematical model of shale oil huff-n-puff under complex fracture networks in combination with various seepage mechanisms and the characteristics of restricted fluid phase states, analyze the influencing factors of CO2 huff-n-puff development on the basis of the model, and apply the conclusions to the target block of this study. In this study, we considered the nanoconfinement effect of reservoir fluids and coupled multiple flow mechanisms into the model. We utilized embedded representations of natural bedding fractures in the Gulong shale oil to more accurately simulate CO2 adsorption and desorption in shale oil.
2. Methodology
In this section, we briefly describe the correction method for studying the migration behavior of the hydrocarbon phase by nanopore restriction, the calculation method for seepage under the threshold pressure gradient, and the calculation method for the stress sensitivity effect.
2.1. Critical Property Shift in Nanopores
The critical temperature and pressure of reservoir fluid change under the action of capillary force, which leads to the corresponding change in the fluid dew point. The critical point correction method mainly considers the influence of capillary force on fluid critical point parameters. In 2004, Zarragoicoechea, G.J. et al. derived the critical parameter migration Equation (1) for confined fluids from the generalized van der Waals equation combined with the characterization of Lennard-Jones dimension parameters, and compared with the experimental results, the fitting effect was good [26]. The shift in the critical pressure and critical temperature at different pore radii can be characterized by using the critical parameter modification equation based on the thermodynamic method of Lennard-Jones correlation:
where Tcb and Tcp are the critical temperature of the bulk and the pore scale, respectively, K; Pcb and Pcp are the critical pressure of the bulk and pore scale, respectively, atm; σLJ is the Lennard-Jones dimension parameter, dimensionless; and re is the effective pore radius, nm.
2.2. Low-Velocity Non-Darcy Flow
As an unconventional reservoir, the seepage characteristic of oil and gas in shale reservoirs is quite different from that of conventional reservoir fluid. Studies have shown that the permeability of shale reservoirs is extremely low, and fluid flow in porous media with extremely low permeability belongs to nonlinear seepage with a minimum threshold pressure gradient [27]. Due to the existence of the threshold pressure gradient, the seepage law of shale oil in the reservoir deviates from Darcy’s law and has obvious nonlinear characteristics. As shown in Figure 2, in region ➀, the pressure gradient is not enough to drive fluid flow in the reservoir, and shale oil does not flow in this region. As the pressure gradient increases slowly beyond the minimum threshold pressure gradient, low-velocity non-Darcy flow occurs in the reservoir fluid. In region ➁, the relationship between the flow velocity and pressure gradient is a curve. When the pressure gradient increases to a certain extent, the relationship between seepage velocity and driving pressure becomes a straight line, but the line no longer passes through the origin. When the line is extended to intersect the pressure axis, the intercept on the pressure axis is called the pseudo threshold pressure gradient [28].
When there is a threshold pressure gradient, the seepage motion equation of the fluid will change. The seepage motion equation of the fluid considering the threshold pressure gradient is as follows [29]:
where v is the fluid seepage velocity m/s; K is permeability, mD; Kr is relative permeability, dimensionless; μ is the fluid viscosity, mPa·m; G is the threshold pressure gradient, MPa/m; and Δψ is the pressure gradient, MPa/m. Its values are determined by empirical formulas:
where refers to the maximum relative permeabilities for oil phases; Sw is the water saturation; Swr and Sor are the residual water and oil saturations, respectively; and n is the fitting parameter.
2.3. Stress-Sensitive Effect
Shale reservoir bedding is developed. When a weakly consolidated bedding plane is encountered in the fracturing process, fractures will expand along the bedding plane and form bedding fractures [30]. In the process of the continuous development of shale oil, the reservoir pressure gradually decreases, and the overlying pressure on the reservoir rock gradually increases, resulting in the closure of the middle layer fractures of the reservoir and the decrease in the permeability of the fractures. Studies have shown that the effect of stress sensitivity on the permeability of shale reservoirs is much greater than that on the permeability of general sandstone reservoirs [31]. The stress-sensitive formula in the form of an index is generally used to correct the permeability of cracks, and the corresponding relationship is as follows:
where K0 is the initial permeability, mD; β is the stress sensitivity coefficient, dimensionless; and p0 is the original pressure, MPa.
Considering the stress sensitivity effect of fractures in reservoirs, the stress sensitivity rule is given by the stress sensitivity curve. The relationship between formation pressure and the permeability multiplier can be calculated according to the stress-sensitive formula summarized by the core experiment. The stress-sensitive curve of cracks is different from that of bases. Figure 3 shows the stress-sensitive curve of the shale reservoir in this study.
This section introduces the construction method of the CO2 huff-n-puff model of shale oil and conducts a sensitivity analysis based on reservoir numerical simulation results, so as to study the influence of various factors on shale oil production and CO2 storage.
2.4. Fluid Model
According to the gas chromatographic analysis results of degassed crude oil and total hydrocarbon of natural gas in well HF1, the content of each component of gas-bearing crude oil in formation is calculated by referring to the data of the high-pressure physical property test of crude oil. The high-pressure physical properties of the formation crude oil were simulated and calculated, then the 40 components were combined into 7 components (including 4 pseudo-components), and the relevant parameters of the combined components were fitted according to the experimental data of the HF1 well, which made the viscosity of the fluid model close to the experimental value. The content of gas-bearing crude oil components in well HF1 after splitting and grouping is shown in Table 1.
The P–T phase diagram after component division is shown in Figure 4.
In this study, the EOS (Equation of State) selected the PR (Peng–Robinson) equation:
where R is the gas constant; a is the attraction constant; b is the repulsion constant; and the numerical values of a and b are both related to the critical parameters of the components.
where Tc and Pc are the critical temperature and pressure of the component, respectively; Tr is the reduced temperature, its value is the ratio of the current temperature T to the critical temperature Tc; ω is the acentric factor, its magnitude can reflect the molecular shape and polarity of the substance, and the acentric factor of the substance can be obtained from a table; and ac and α can be calculated from Equations (6) and (7), respectively.
The EOS can calculate key parameters of fluids such as density, volume, compressibility factor, etc. In this model, for viscosity, we utilize the viscosity model proposed by Lee and Kesler based on the PR equation [32]:
where μ is viscosity, mPa·s; and μ0 is the reference viscosity at a reference temperature, mPa·s.
In this study, the saturation pressure, fluid density, fluid viscosity, and constant expansion of the reservoir fluid were fitted to modify the EOS parameters to better match the real fluid conditions of the Gulong shale oil reservoir. Firstly, the saturation pressure (also known as bubble point pressure) is fitted. Saturation pressure is an important parameter that affects the phase characteristics of the fluid and is related to the gas–liquid phase balance of the reservoir fluid. Then, the oil density and oil viscosity were fitted under the formation condition (32 MPa, 115 °C). The fitting results are shown in Table 2.
In addition, the constant mass expansion experiment is also carried out to measure the relationship between the volume and pressure. In this study, the calculated value of the relative volume under different pressures is fitted with the experimental value of the relative volume obtained from the constant mass expansion experiment. Figure 5 shows the fitting result.
It can be seen from the figure above that the fitting effect of the constant mass expansion experiment is better, and the error of the relative volume experiment value and the calculated value is small. Based on the fitting results of saturated pressure, fluid viscosity, fluid density, and relative volume, it can be seen that the splitting and merging of components and the setting of pseudo-components are reasonable, which is consistent with the actual situation of oilfield. The fitting component PVT data are output to provide EOS parameters for the establishment of the subsequent component model. In addition, in order to meet the real phase behavior characteristics of the confined fluid in the nanopores of shale reservoirs, the critical temperature and critical pressure after modification are calculated by the critical parameter modification method. The correction method for critical parameters is mentioned in Equation (1). It is worth noting that, according to Equations (5) and (10), changes in the critical parameters of the fluid will inevitably affect the variations in density and viscosity. This factor has also been considered in this study. However, the main output parameters of this paper are the phase diagrams, which provide a more intuitive representation. The critical parameter pairs before and after modification are shown in Table 3.
The calculated results show that the critical temperature and pressure change obviously, and the critical temperature and pressure decrease from 50 nm to 5 nm aperture. In this calculation, the unit of critical temperature is atm. For convenience of subsequent calculations, the unit of critical temperature is converted to bar, and then the phase equilibrium calculation is carried out according to the critical parameters of components, so that the phase diagram is drawn and compared with the initial components without considering the special phase state characteristics of the confined fluid. The phase diagram is shown in Figure 6.
It can be seen from the phase diagram comparison that the aperture radius has a certain effect on the phase envelope. The bubble point is the highest and the dew point is the lowest without considering the influence of nanopores in shale reservoirs. When considering the influence of nanopores in shale reservoirs, with the pore size decreasing from 50 nm to 5 nm, the bubble point of components becomes lower and lower, the bubble point line drops obviously, the dew point of components becomes higher and higher, the dew point line rises obviously, and the overall phase envelope shrinks inward. Therefore, the confined fluid effect cannot be ignored in shale reservoirs. In order to better conform to the real PVT characteristics of the fluid inside the reservoir, the subsequent calculations of this study took into account the influence of the special phase characteristics of the confined fluid. In particular, the phase characteristics of the fluid became more complex when the component content changed after CO2 injection in the later stage.
2.5. Fracture Model
The embedded discrete fracture model (EDFM) is used to characterize and calculate hydraulic and natural fractures in reservoirs. The embedded discrete fracture model mainly uses three kinds of non-adjacent connections (NNCSs) for material exchange. The flow of mass exchange can be expressed as the product of the conductance between each unit and the pressure difference:
where q represents the flow rate (m3/s).
In the embedded discrete fracture model, there exist three types of non-neighboring material exchange modes, each with different conductivities. When multiple fractures intersect multiple matrix grids, it is necessary to identify the types of NNCSs first.
The three different types of NNC modes are material exchange between fractures and matrix within the same matrix grid (Type I), material exchange between two different fractures within the same matrix grid (Type II), and material exchange when the same fracture penetrates two different matrix grids (Type III). Figure 7 illustrates the schematic diagrams of the three different types of NNC modes.
The calculation method of the conductivity Tnnc corresponding to the above three NNC modes is shown in Table 4.
According to the embedded discrete fracture calculation method and basic seepage mechanics theory, the general equation of fluid seepage in shale oil reservoirs in NNC fractures can be written as follows:
where qnnc is NNC seepage flow velocity (kg/s); is the harmonic average of all NNC permeabilities in the matrix, mD; kri is the relative permeability of component i; is the contact area of NNC in the matrix, m3; μi is the viscosity of component i, cp; ρi is the density of component i, kg/m3; xi is the mole fraction of component i; (p − γD) is the pressure at a certain point in the matrix, MPa; and (p − γD)m is the pressure of each NNC in the matrix, MPa.
2.6. Governing Equation
➀ Permeation equation for the matrix system
According to the mass balance equation, flow term added to the source/sink term = accumulation term, the permeation equation for component i in the oil phase within the matrix can be written as the following:
where subscript “o” represents the oil phase; “i” represents component i; “xi” represents the molar fraction of component i in the oil phase; ρo is the density of the oil phase, kg/m3; μo is the viscosity of the oil phase, cp; is the relative permeability of the oil phase in the matrix; and km is the permeability of the matrix, which has been corrected for stress sensitivity using the following formula:
represents the fluid flow exchange of the oil phase between the matrix and fractures and can be expressed as the following:
Similarly, the gas phase seepage equation for component i in the shale matrix can be expressed as the following:
where subscript g denotes the gas phase; i denotes component i; yi represents the molar fraction of component i in the gas phase; ρg is the gas phase density in kg/m3; μg is the gas phase viscosity in cp; and is the relative permeability of gas in the matrix. Due to the need to consider the adsorption and desorption effects of gas in shale reservoirs in this CO2 injection and sequestration model, compared to the seepage equation for the oil phase, the seepage equation for the gas phase adds an additional adsorption term mg. mg represents the mass of other desorbed substances in the matrix, expressed as the following:
where ρR is the density of the hydrocarbon source rock in kg/m3; ρg is the density of the adsorbed gas in kg/m3; Sk is the volume ratio of the hydrocarbon source rock; and VE is the volume of adsorbed gas.
As a separate component, without considering any substance exchange with oil and gas, the seepage equation for the aqueous phase in the shale matrix is the following:
where w denotes the water phase; ρw is the density of the water phase in kg/m3; μw is the viscosity of the water phase in cp; and krw is the relative permeability of water in the matrix.
➁ Permeation equation for the fracture system
Similar to the flow equations in the matrix, the flow equations for the oil phase and gas phase in the fractures are as follows:
where and represent the source/sink terms for mass exchange between the fracture and wellbore. The mechanism was synthesized within the framework of COMPASS compositional numerical simulation software.
3. Results
3.1. Reservoir Model
The geological model consists of 100 × 40 × 8 grids, with a total number of 32,000 grids and a horizontal area of 1.6 km2. The top depth of the reservoir is 2300 m, the bottom depth is 2460 m. The model porosity is 8.40%, and the matrix permeability is 0.0082 mD. The initial water saturation of the matrix grid is 46%, and the reservoir temperature is 115 °C. The target well is a horizontal HF1 well with a 1720 m horizontal section and 32 perforation stages. The reservoir parameters of the mechanism model are shown in Table 5, and the schematic diagram of the model is shown in Figure 8. The simulation process is implemented through the COMPASS compositional numerical simulation software, which can perform three-dimensional display and interactive operations, and has strong numerical simulation capabilities.
According to the field data of multi-stage fractured horizontal wells in Gulong shale oil, hydraulic fractures are generated in corresponding perforating stages. The HF1 well has 32 perforating stages, each with seven clusters of fractures. In addition, natural bedding fractures developed inside the Gulong shale oil reservoir. According to the field data, 8000 natural bedding fractures were generated, all of which were parallel to the formation plane with a dip angle of 180°. The parameters of the fracture network are shown in Table 6, and the schematic diagram of the fracture model is shown in Figure 9, in which the gray fracture sheet is a natural bedding fracture and the blue fracture sheet is a hydraulic fracture.
3.2. History Matching
HF1 is a multi-stage fractured horizontal well with a fracturing fluid flowback stage in the initial well opening. Considering the impact of fracturing fluid flowback on oil and gas production, the state at the end of flowback is set as the initial state of the model in this historical fitting, and the daily oil production data after the end of flowback are fitted. The fitting results of the HF1 single well are shown in Figure 10. After historical fitting, the production data calculated by the numerical model fit well with the actual production data, which proves that the model is reliable and can be used for the numerical simulation of CO2 huff-n-puff in a single well of Gulong shale oil.
3.3. Numerical Case
After the numerical model was established, the above model was used for numerical simulation of CO2 huff-n-puff, and the preliminary debugging of the model was completed. After 1800 days of simulated depletion development and two years after depletion development, CO2 was injected for one cycle of huff-n-puff, and the development state went through three stages of gas injection, soaking, and recovery. Figure 11 is the comparison diagram of oil production and accumulative oil production between well HF1 depletion development after 1800 days and huff-n-puff development; Figure 12 shows the pressure variation field during depletion development and CO2 huff-n-puff development.
It can be seen from the production curve that the cumulative oil production after CO2 huff-n-puff development is 161.41 m3 higher than that in depletion development, and huff-n-puff development has a certain effect of increasing production. It can be seen from the pressure variation field diagram that during the CO2 injection huff-n-puff development, the CO2 injected into the formation supplemented the formation energy after the huff-n-puff, resulting in a slight rise in the formation pressure. The discrete fracture sheet in the figure is the natural fracture in the model. By observing the pressure change in the natural fracture in the pressure change field diagram of the model, it can be seen that the natural fracture plays a small role in the diffusion of pressure waves, and only hydraulic fractures and a few natural fractures around the horizontal well are affected by pressure waves. Subsequent sensitivity analysis will be based on this model.
3.4. Threshold Pressure Gradient
The threshold pressure gradient measured in the Gulong shale oil target reservoir experiment is 0.2 MPa/m. Assuming 1800 days of production and a huff-n-puff on day 720, the cumulative production and CO2 storage of shale oil with and without the threshold pressure gradient are compared.
Figure 13 is a comparison diagram of the results with or without the threshold pressure gradient. It can be seen that with the consideration of the threshold pressure gradient, shale oil production decreases by about 2% and CO2 storage increases by 0.6%, which is because the presence of the threshold pressure gradient limits the conduction rate of pressure waves and reduces the fluid flow rate of the shale oil reservoir. As a result, shale oil production decreases and CO2 storage increases. It can be seen that the numerical simulation results may deviate from the real situation if the threshold pressure gradient is not taken into account.
3.5. Stress-Sensitive Effect
The relationship between formation pressure and permeability can be analyzed according to the stress-sensitive curve in Figure 3. After 1800 days of production with and without stress sensitivity, a round of CO2 injection was started on the 720th day. The final cumulative production and CO2 storage results of shale oil were compared.
Figure 14 is a comparison diagram of the results with or without the stress-sensitive effect. It can be seen that with the stress-sensitive effect taken into account, shale oil production decreases by about 2% and CO2 storage increases by 1%, because the stress-sensitive effect will cause the deformation of reservoir pores and fractures in the process of shale oil development. This reduces the permeability of the matrix and fracture systems, resulting in lower reservoir fluid production.
3.6. Nanopore Effect
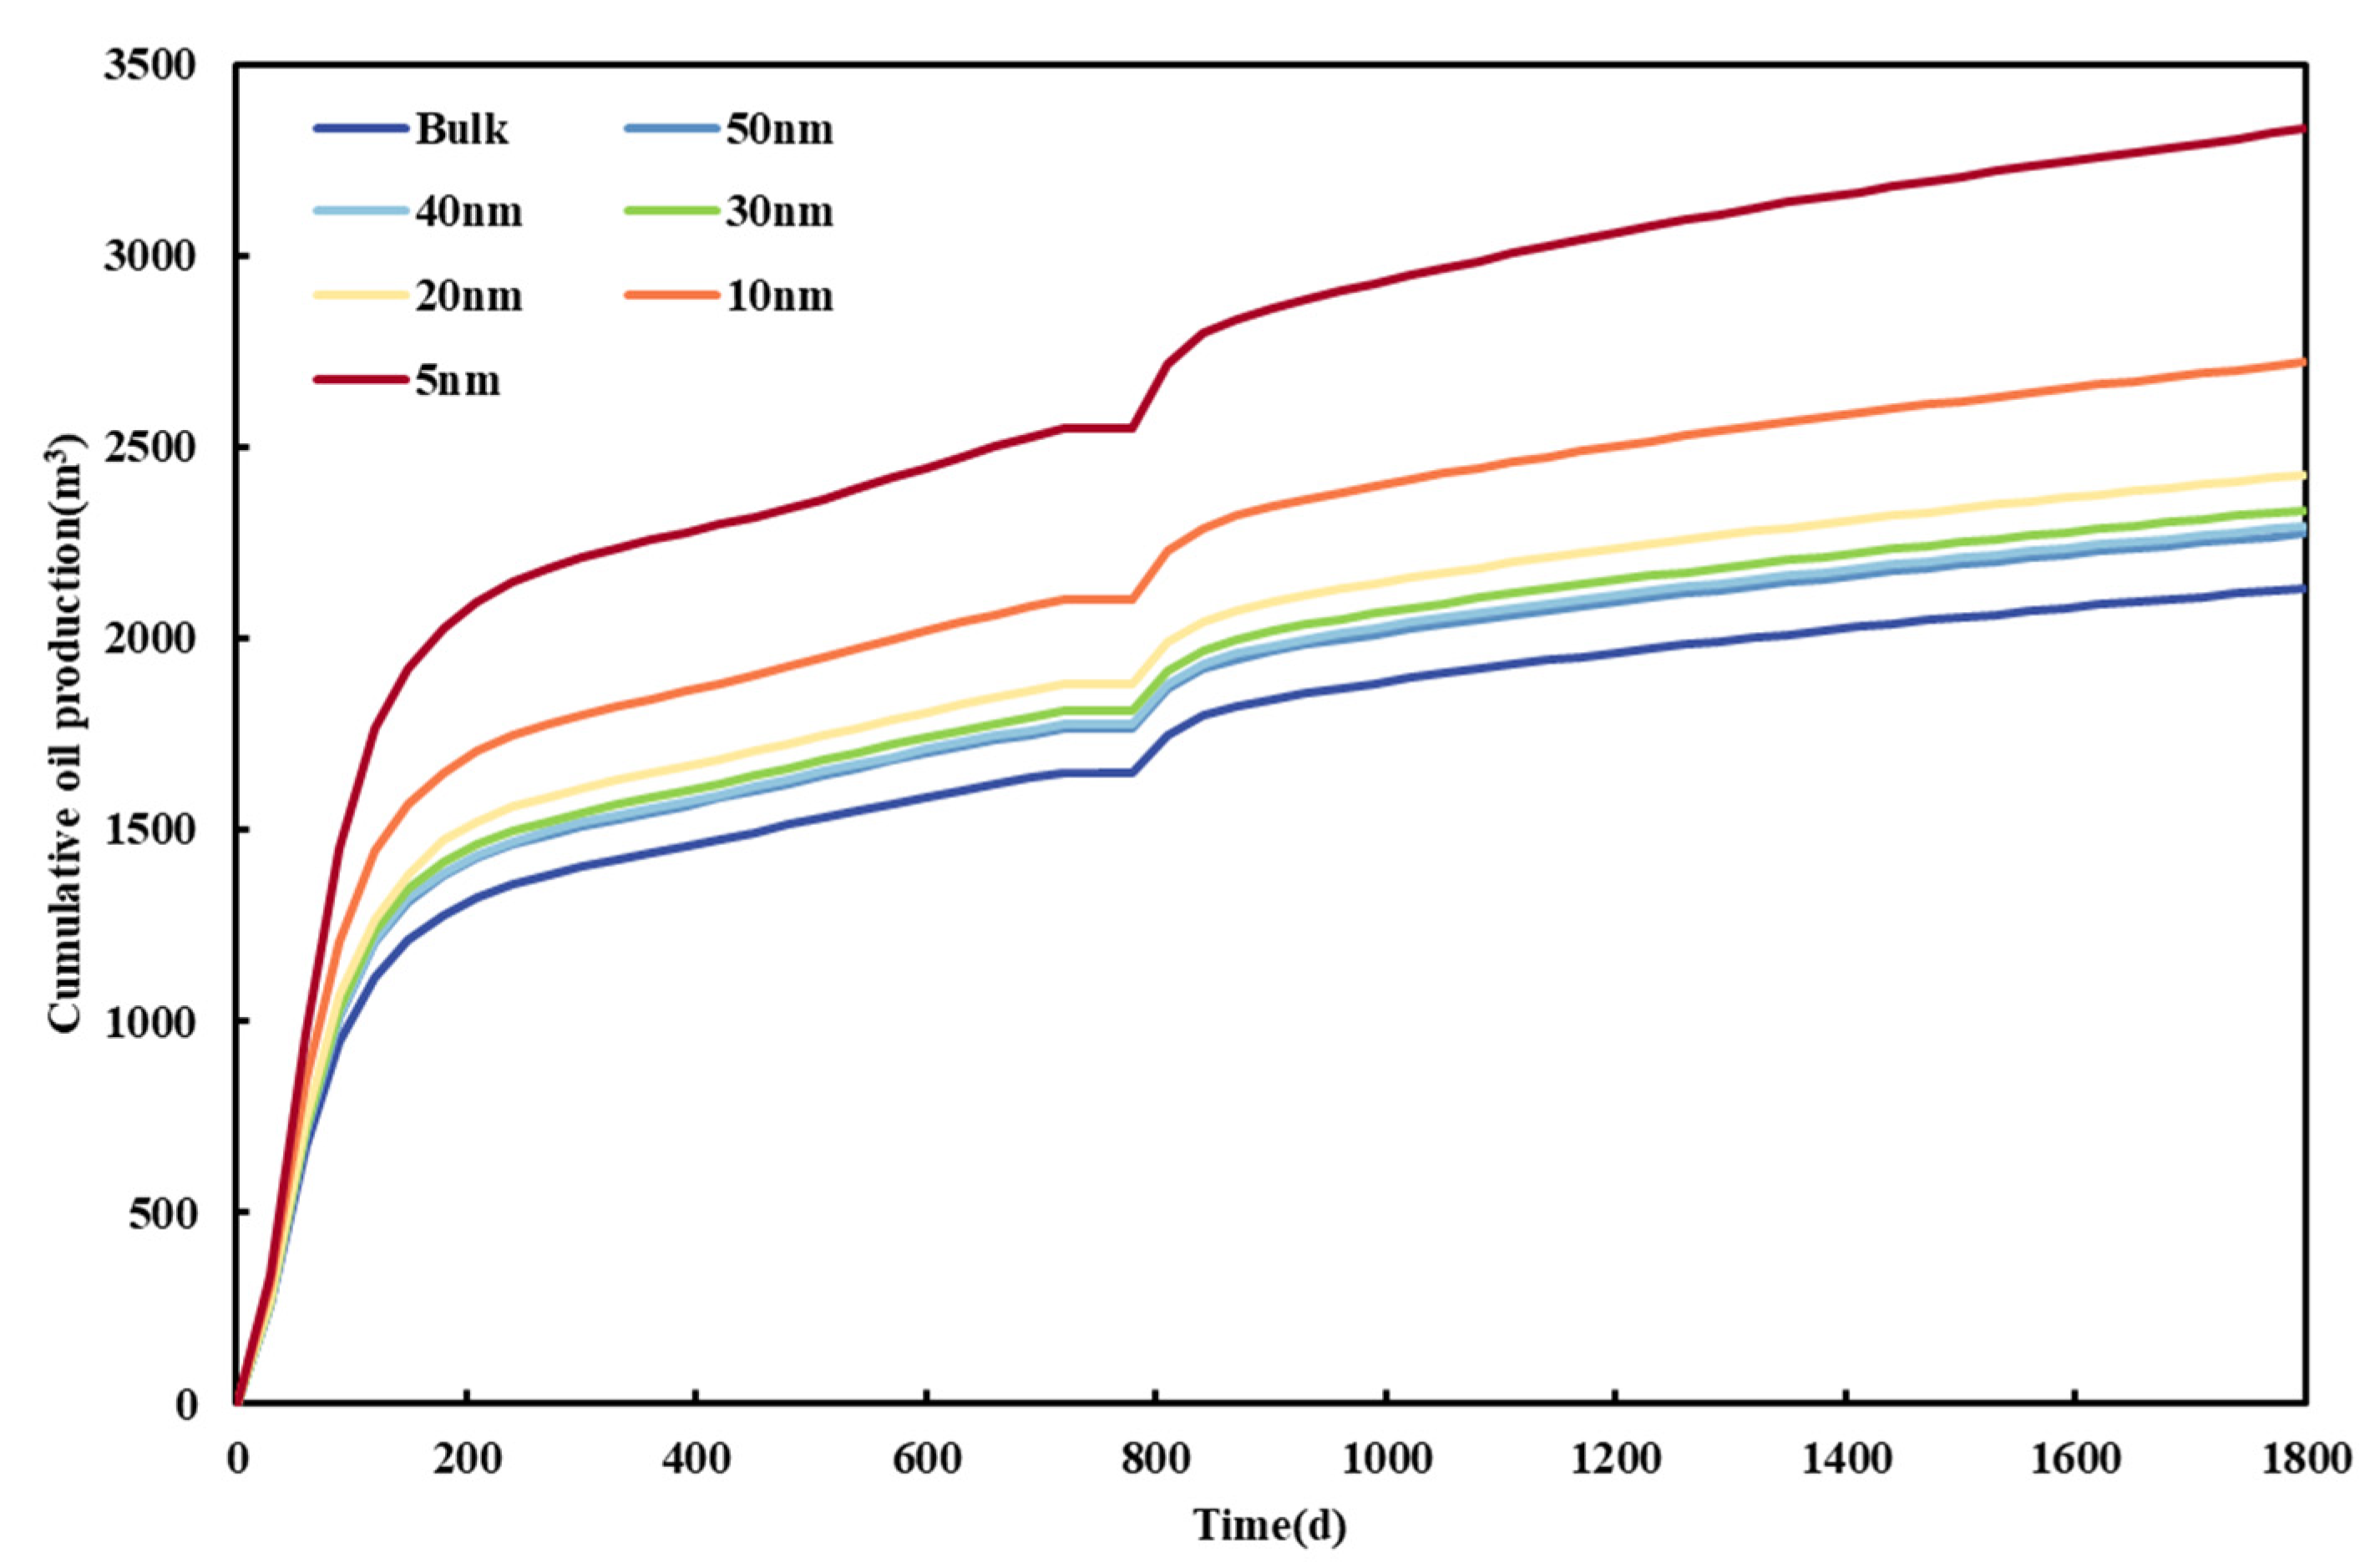
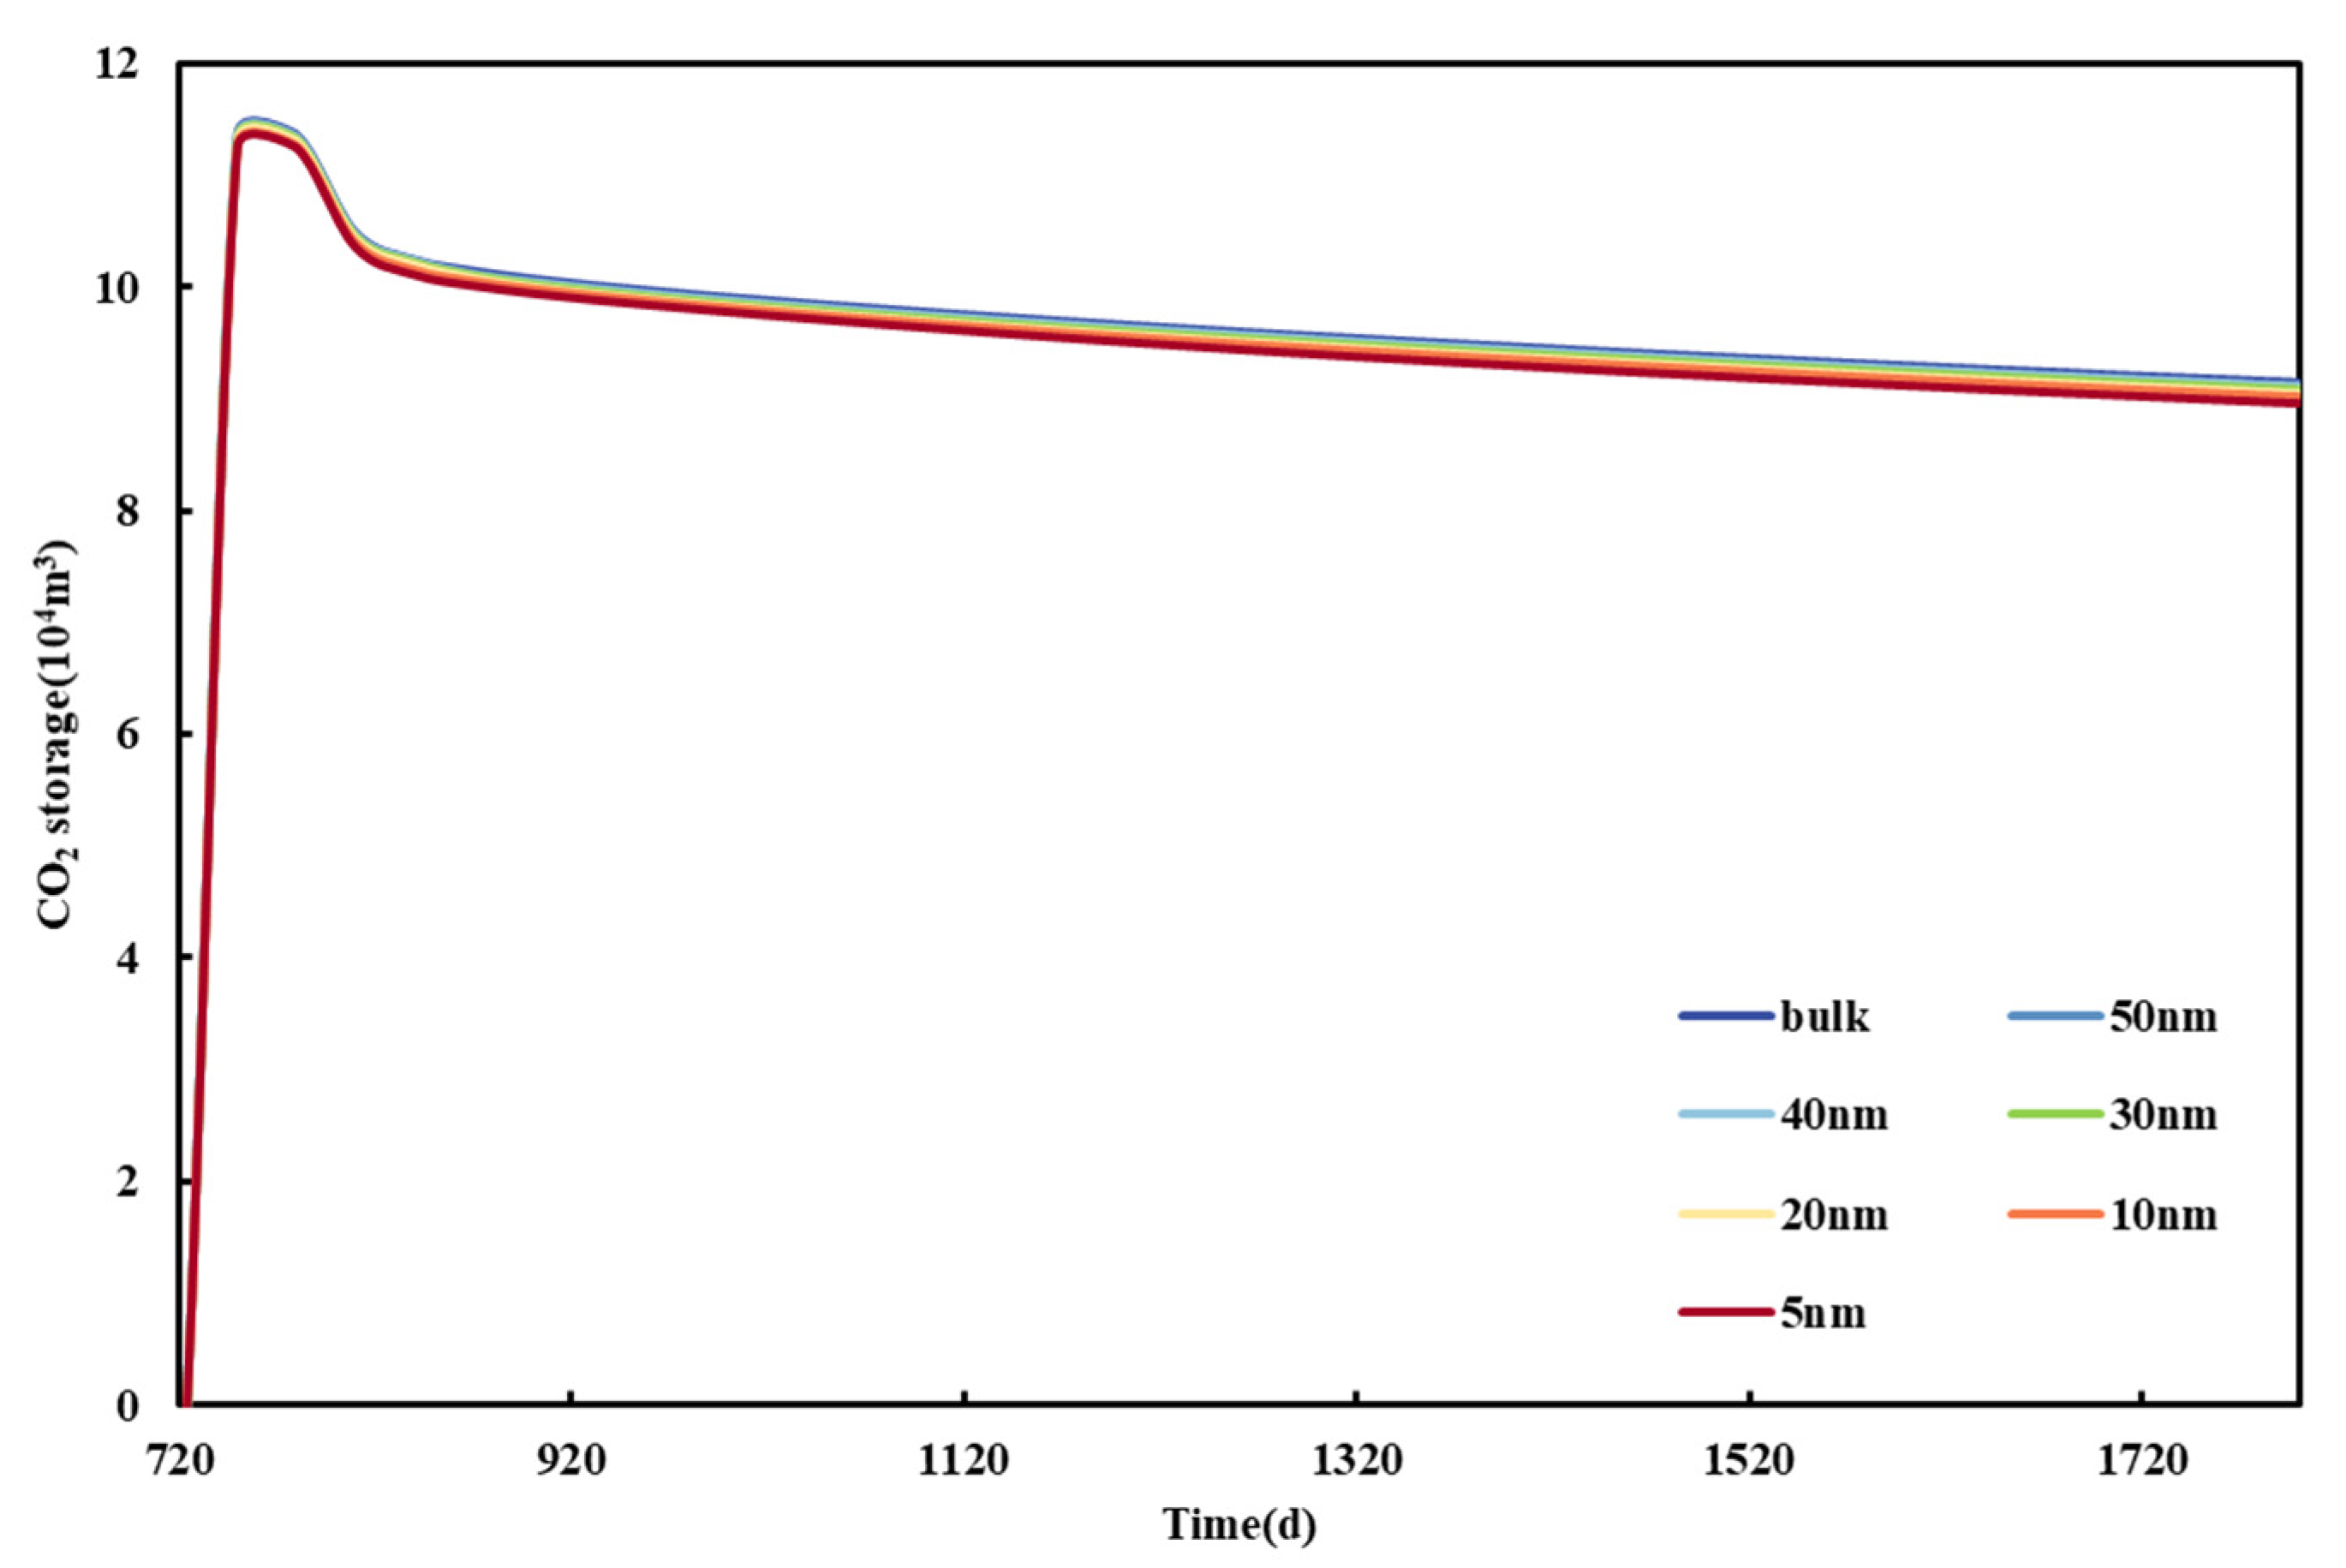
Five control groups with pore radii of 50 nm, 40 nm, 30 nm, 20 nm, 10 nm, and 5 nm were set. A round of CO2 injection huff-n-puff production was simulated for the above models, and the cumulative yield and CO2 storage results were compared. Figure 15 shows the cumulative production curve of shale oil under different pore radii. It can be seen from the figure that, as the pore radius decreases, the cumulative oil production increases, and the smaller the pore radius, the more obvious the increment of oil production. The comparison does not take into account the special phase characteristics of the confined fluid in the nanopores and the pore radius of 5 nm, and the accumulated production difference in 1800 days is 1198.08 m3. Figure 16 shows the cumulative storage curve of CO2 under different pore radii. It can be seen from the figure that CO2 storage decreases with the decrease in pore radii. Without considering the special phase characteristics of the confined fluid in the nanopores, the CO2 storage capacity is the largest, and the CO2 storage capacity increases by 1836.83 m3 when the pore radius is 5 nm.
The variation in shale oil production and CO2 storage with different pore radii is related to the bubble point of restricted fluid under different pore radii. Under the condition of reservoir temperature (388.15 K), the fluid in the Gulong shale oil reservoir is liquid. As is shown in Figure 17 with the continuous production of reservoir fluid, the formation pressure keeps decreasing, resulting in the state of reservoir fluid components below the bubble point line (oil–gas two-phase area). Under the influence of nanopores, the smaller the pore radius, the lower the bubble point of the confined fluid in the reservoir, that is, the higher the liquid content in the component. Therefore, in the case of a small pore radius, the content of liquid fluid in the reservoir is more, and more shale oil is produced. Similarly, when the pore radius is smaller, the gas content in the reservoir is smaller, and the gas stored in the reservoir is correspondingly reduced.
3.7. CO2 Injection Rate
There are many influencing factors in the CO2 injection development of shale oil. Among them, gas injection parameters are important factors affecting shale oil recovery. The gas injection parameters are adjustable parameters, and the gas injection system of each round can be adjusted according to the set scheme in the production process. In the study of gas injection parameters, the oil change rate is introduced as an evaluation index. The oil change rate is one of the important indicators for evaluating CO2 huff-n-puff development, which can be defined as the ratio of increased production to CO2 injection. The calculation formula is as follows:
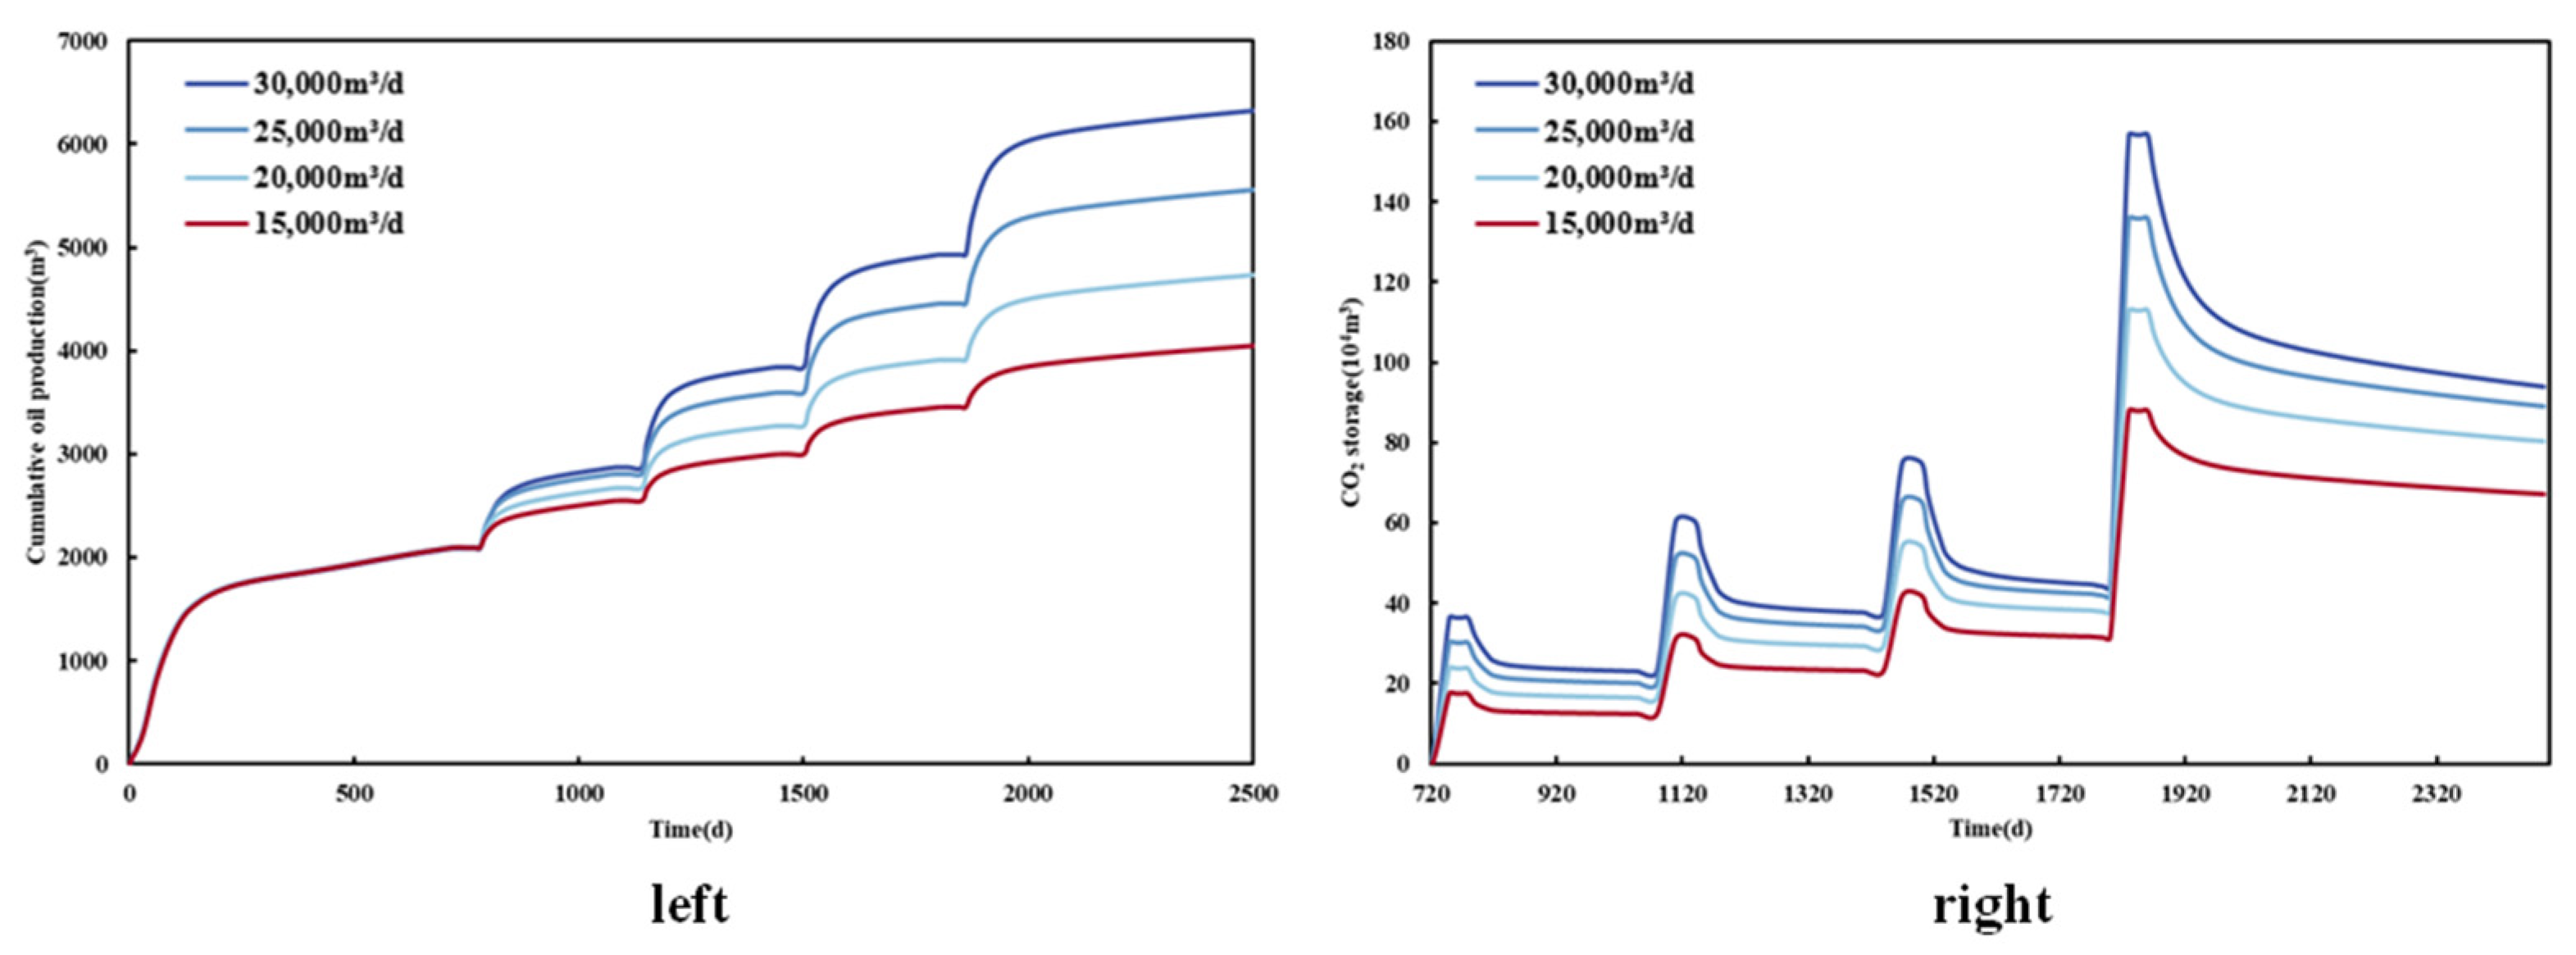
The gas injection rate has the most direct influence on the huff-n-puff effect, and the simulated output results are different with different daily gas injections. The simulated production lasted for 2500 days, assuming four cycles of throughput, and the first cycle of throughput started on the 720th day. The CO2 injection rates were set at 15,000 m3/d, 20,000 m3/d, 25,000 m3/d, and 30,000 m3/d in different control groups. The effects of the gas injection rate on shale oil production and CO2 sealing stock were analyzed by comparing the cumulative oil production and CO2 sealing stock in 2500 days under different CO2 injection rates.
Figure 18 shows the comparison curve of cumulative shale oil production and CO2 storage under different injection rates. It can be seen from the figure that with the increase in the injection rate, cumulative shale oil production increases greatly. Compared with the injection speed of 25,000 m3 and 20,000 m3, the output is increased by 821.95 m3. It can be seen that when the injection rate reaches 30,000 m3, the increase in the stimulation effect begins to decrease, and the higher the gas injection rate, the higher the economic cost of investment required. Shale oil production cannot be taken as the only indicator of a development plan. However, Figure 19 shows that when the injection rate is 30,000 m3/d, the oil change rate is still the highest. In addition, Figure 18 shows that with the increase in the injection rate, CO2 storage also increases to a certain extent.
3.8. Soak Time
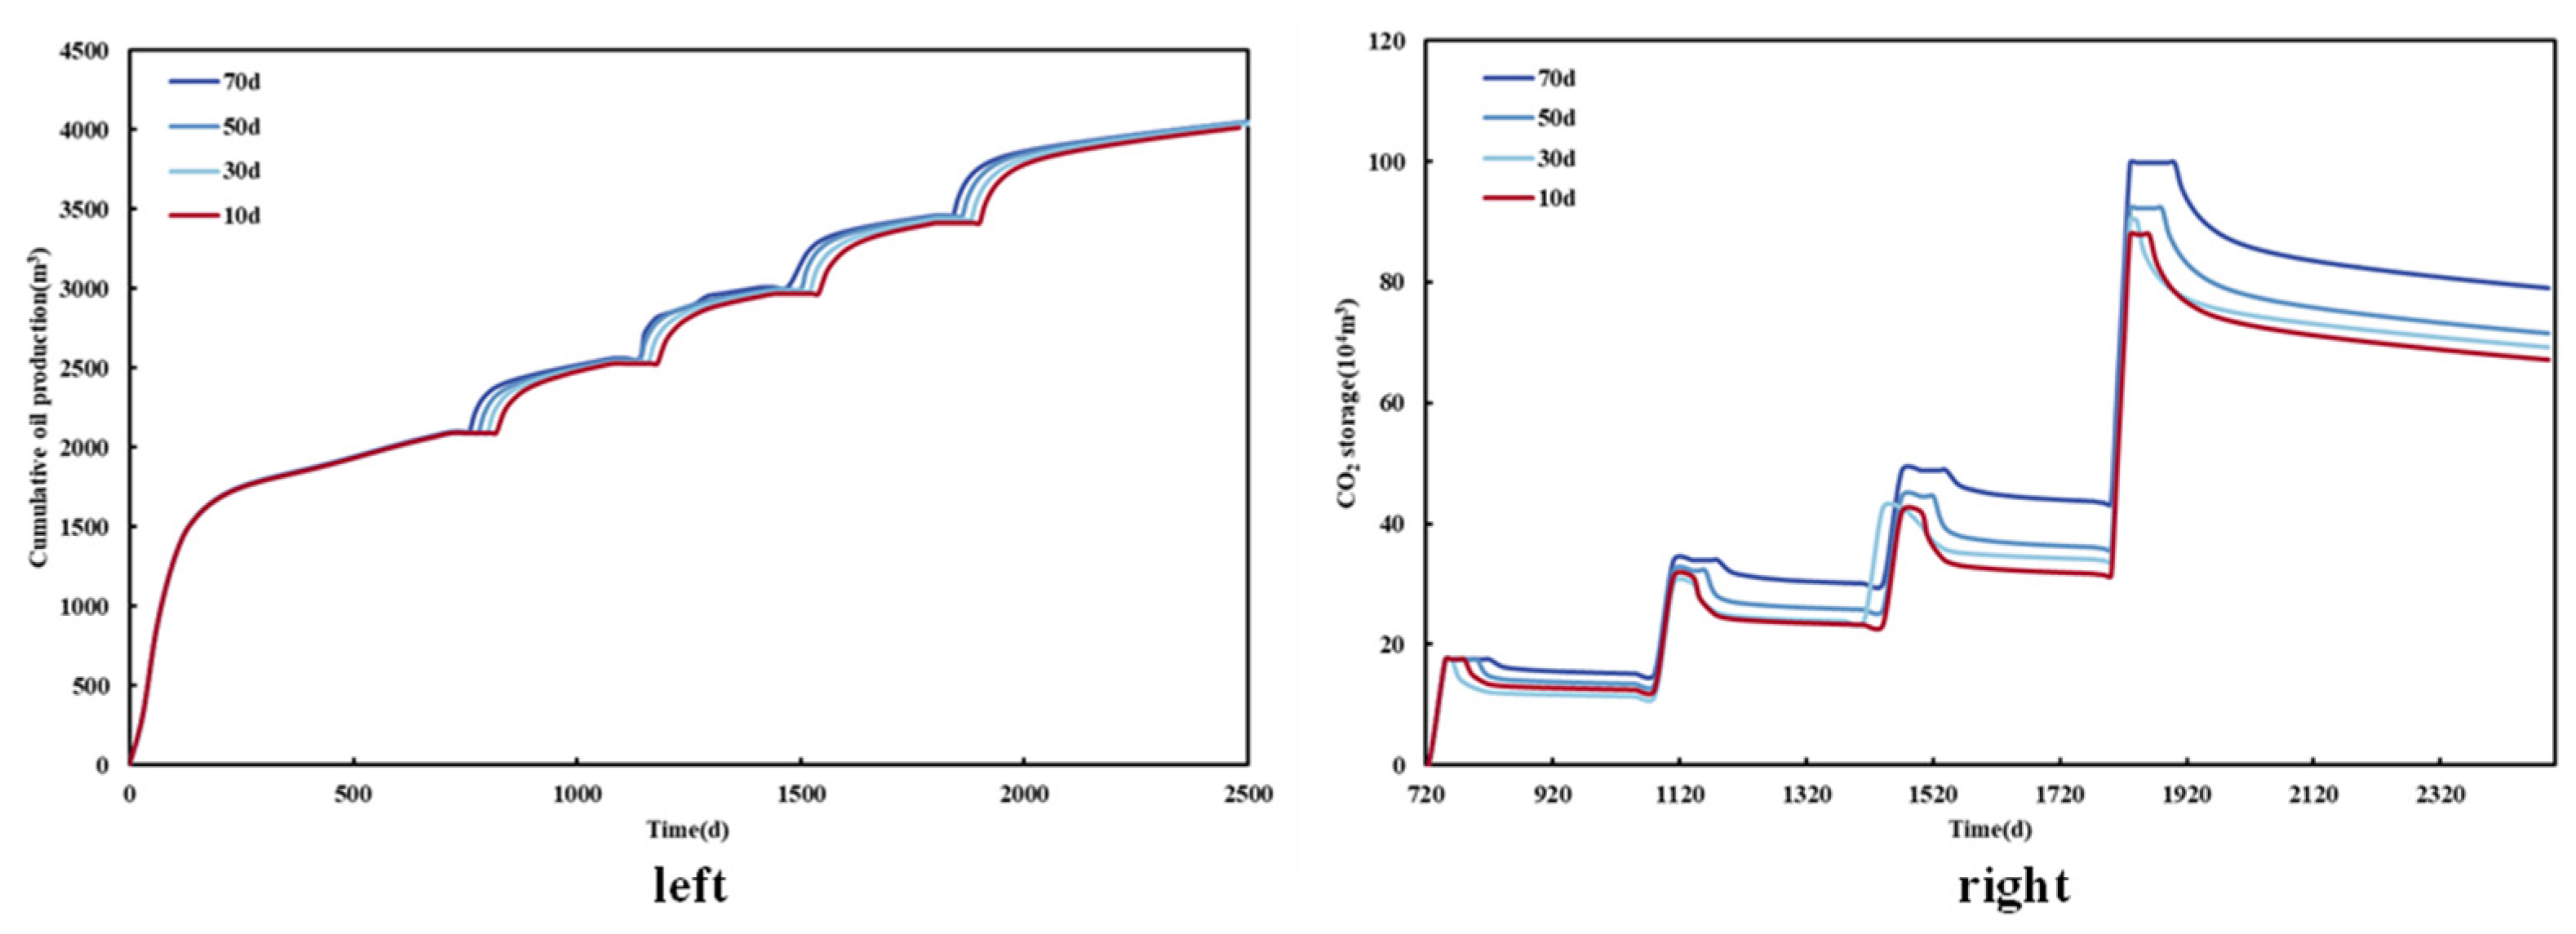
In this study, the simulated production lasted for 2500 days, the gas injection began at the 720th day, and the injection time was 30 days. The soak time was set as 10 days, 30 days, 50 days, and 70 days to compare the accumulated production of shale oil and the CO2 sealing stock under different braising times within 2500 days.
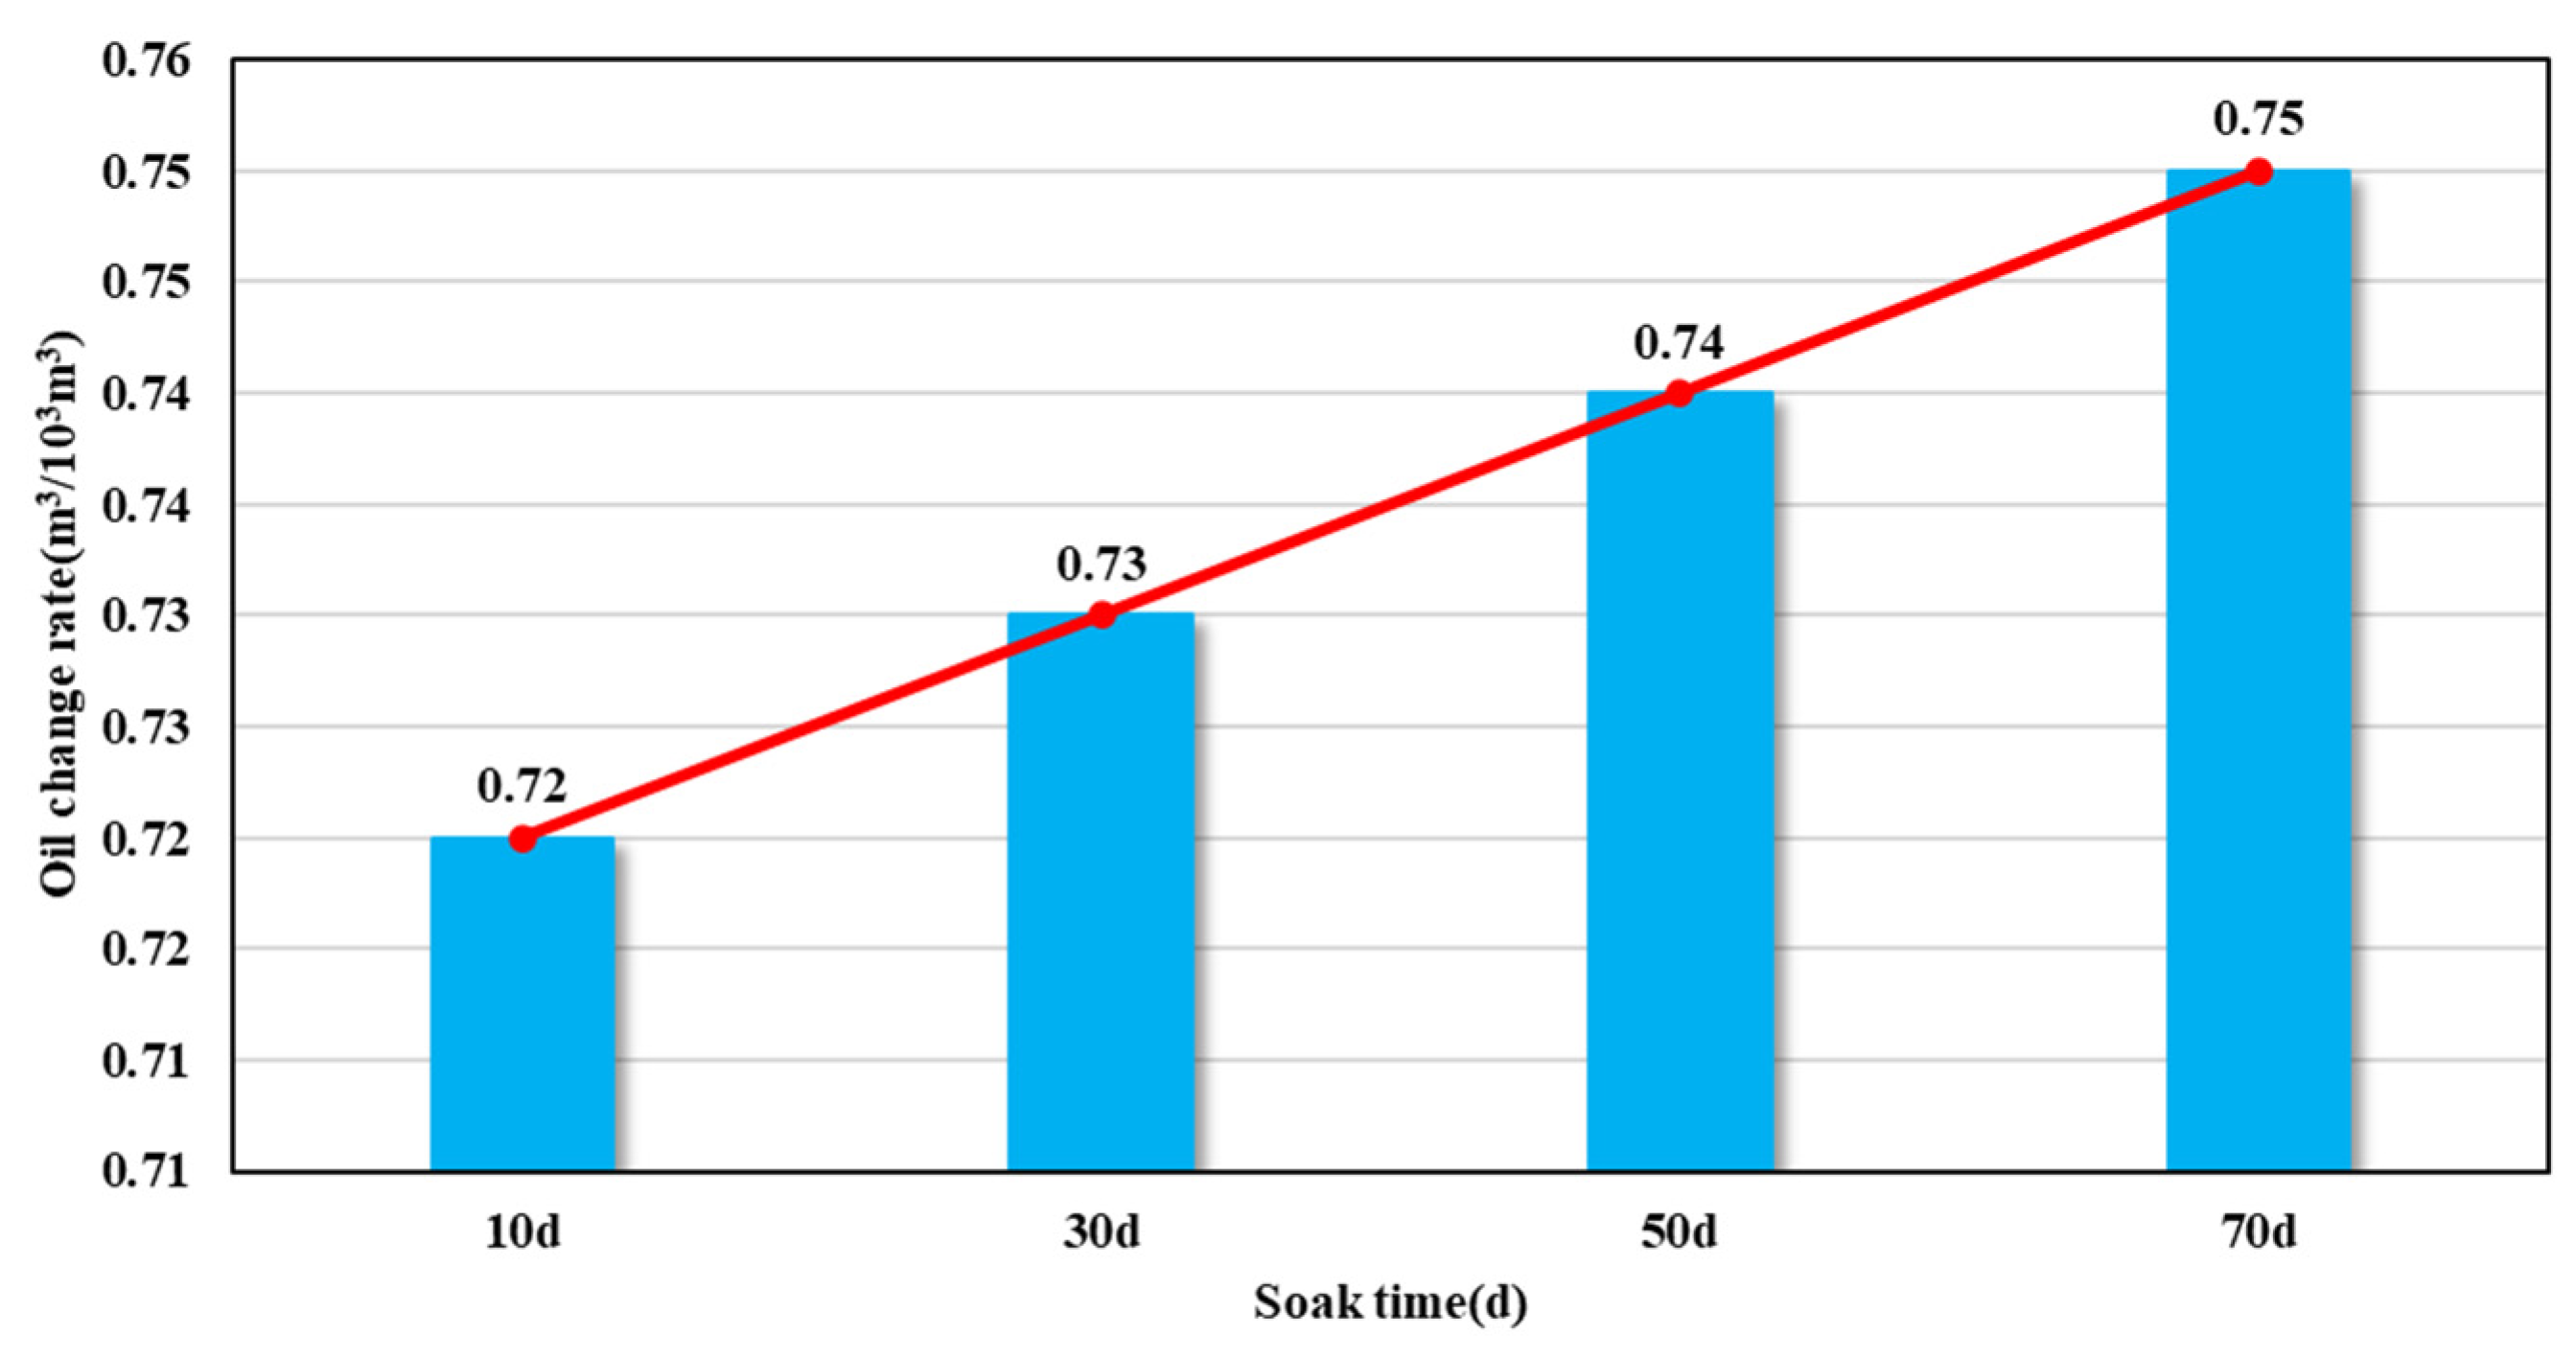
Figure 20 shows cumulative shale oil production and CO2 storage under different soak time conditions, and Figure 21 shows the comparison of oil change rates under different soak time conditions. It can be seen from the graph that the cumulative output of shale oil is higher when the braised well is 70 days, and the impact of the soak time on the output of shale oil is slight. Compared with that of the soak time for 70 days, the output of shale oil decreases by only 33.78 m3. In addition, during the simulation period, the cumulative output of shale oil decreases with the increase in the soak time, which may be because increasing soak time reduces production time and reduces production in the same period of time, thus making the increase in shale oil production less noticeable. In addition, with the increase in the soak time, the CO2 storage increases, because sufficient braising time will make the CO2 injected into the reservoir fully contact with the reservoir fluid, and the amount of CO2 dissolution and adsorption will also increase, so the CO2 storage is improved. Figure 21 shows the oil change rate under different braising times. It can be seen that the oil change rate also increases slightly with the increase in the braising time.
3.9. The Cycles of CO2 Huff-n-Puff
The yield increase effect of a single cycle of CO2 injection is limited, and multiple cycles will be designed in the process of CO2 injection development. In order to study the effect of huff-n-puff cycles on the improvement in shale oil recovery efficiency by CO2, the simulated production lasted for 2500 days, and the gas injection began on the 720th day. With other conditions unchanged, four conditions of huff-n-puff cycles (1, 2, 3, and 4) were simulated to compare the effects of different huff-n-puff cycles on the cumulative production and CO2 storage of shale oil.
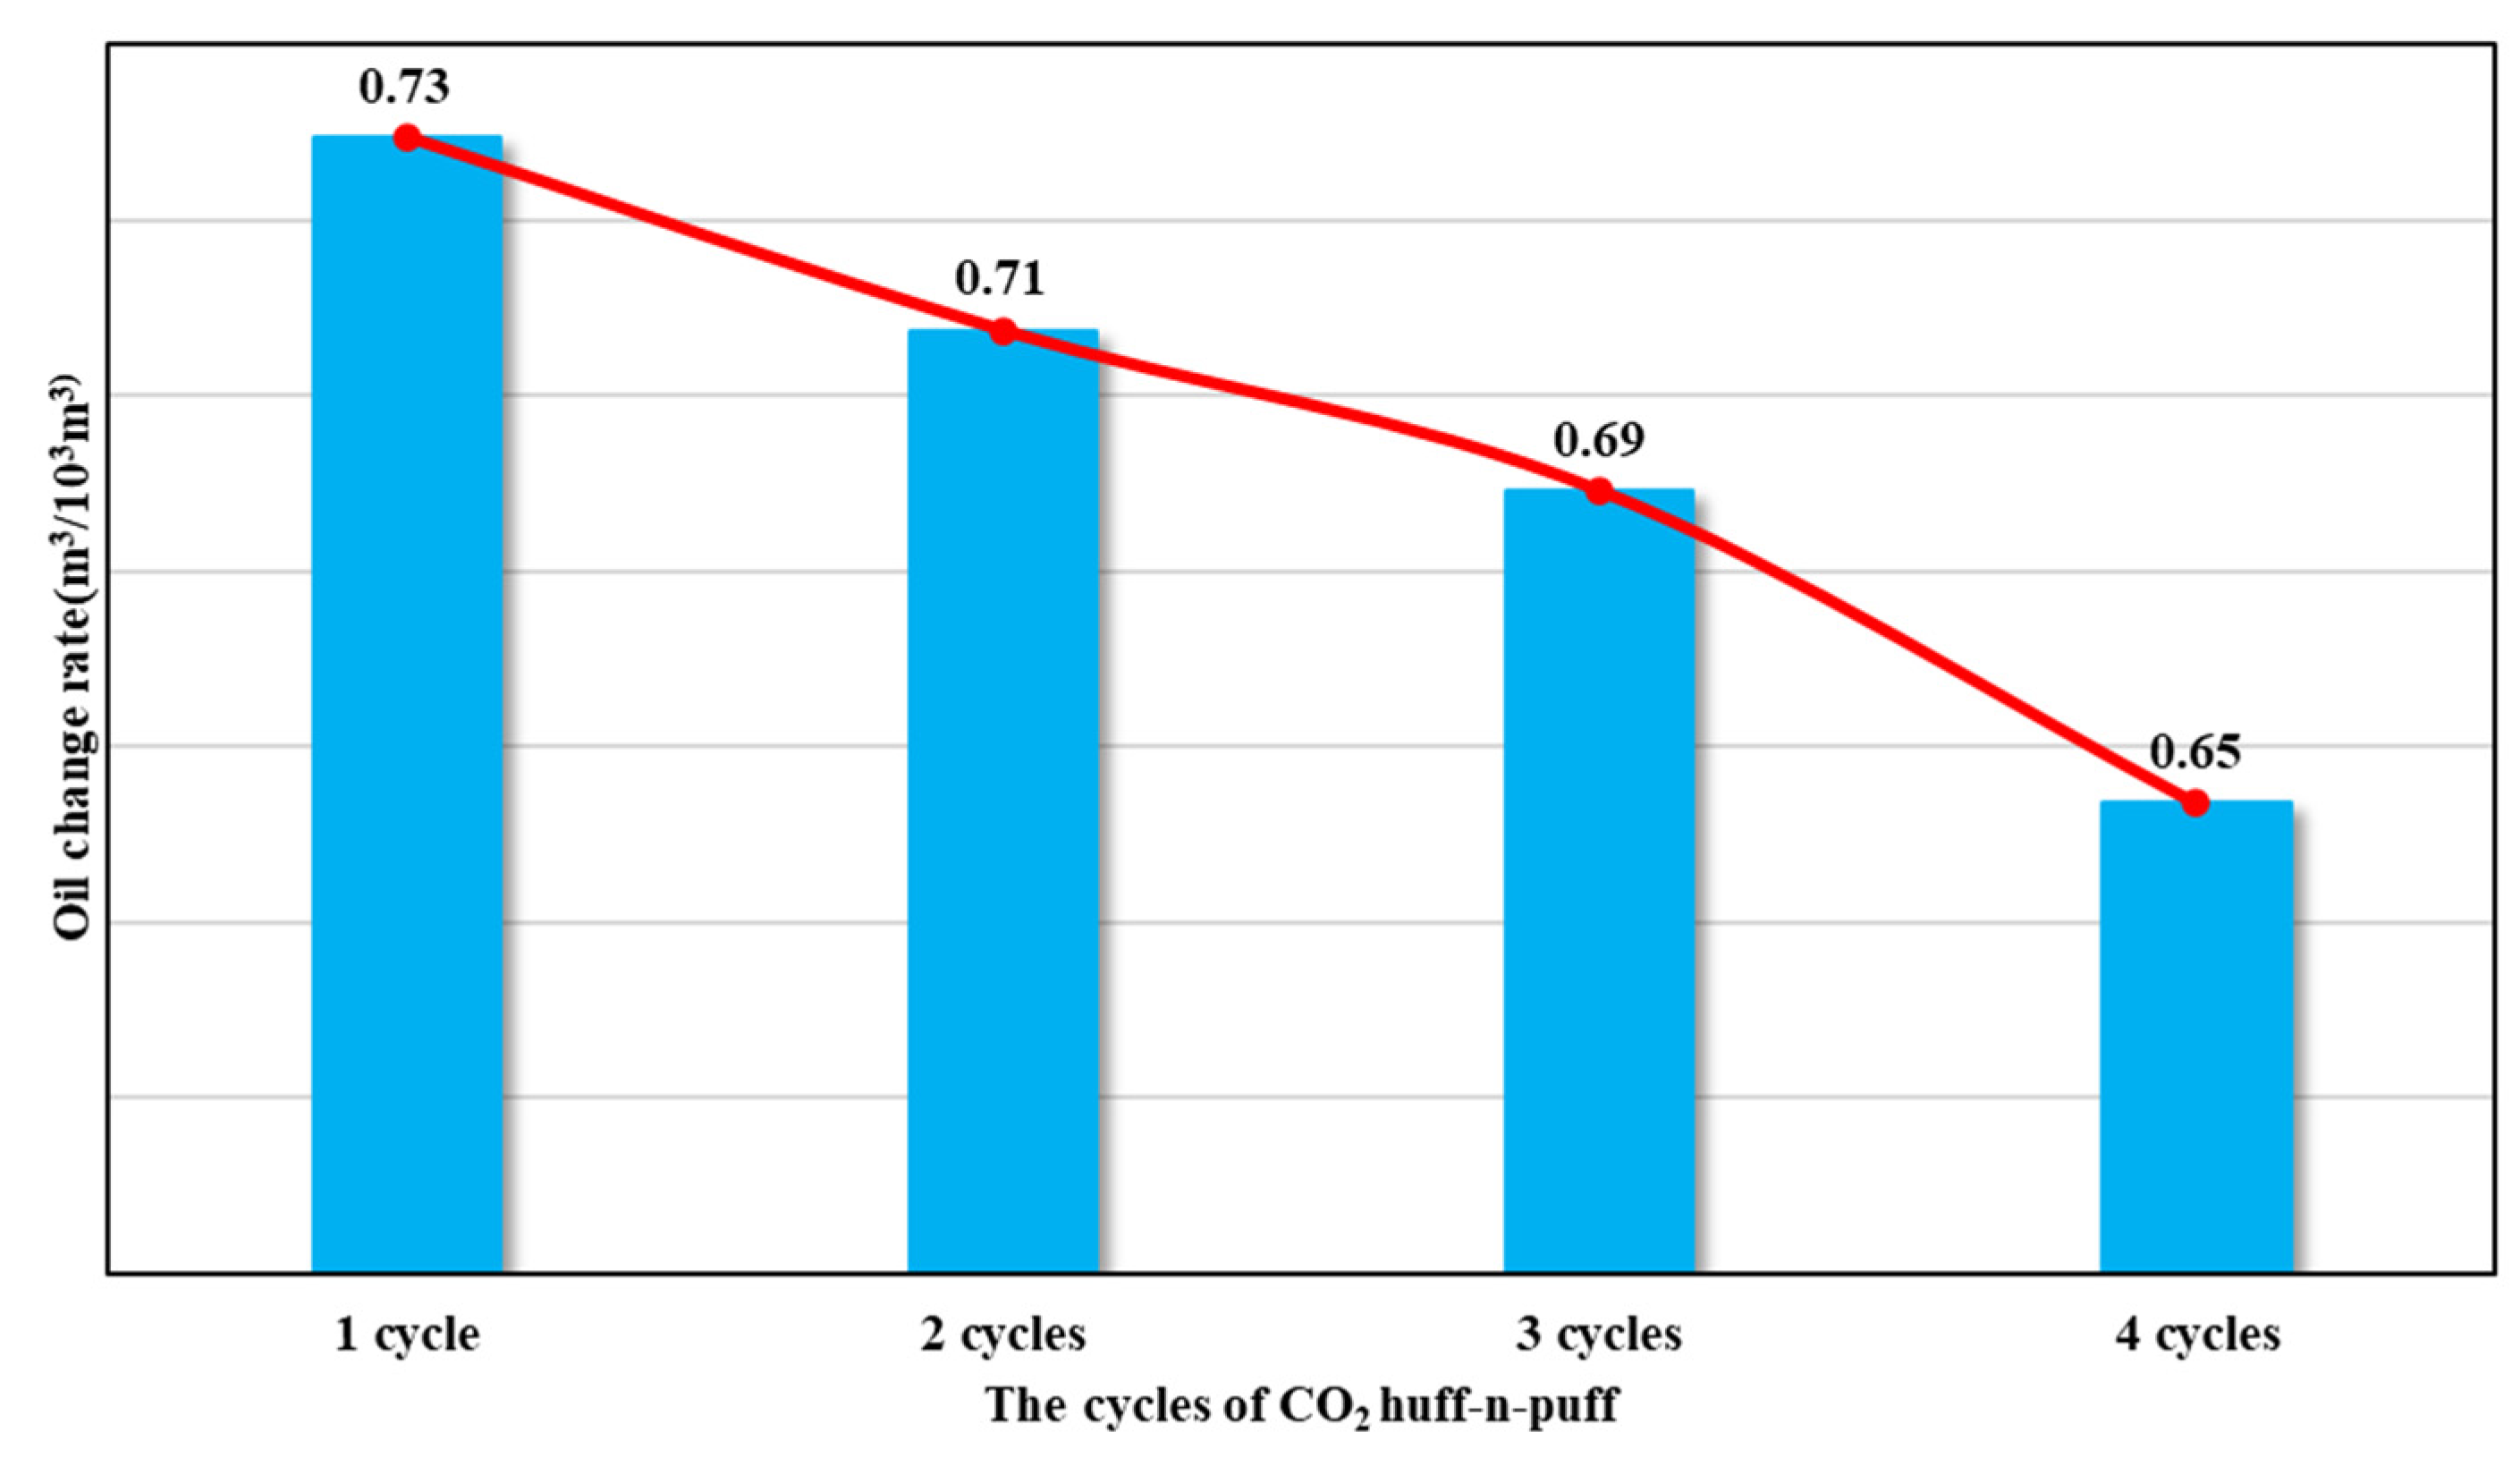
Figure 22 shows the cumulative production and CO2 storage curves of shale oil under different throughput cycles. As can be seen from the figure, the accumulative production of shale oil increases significantly with the increase in throughput cycles. Compared with the throughput round, round shale oil yield increased by 1018.95 m3, and throughput round CO2 sequestration rose obviously; the reason for this may be associated with the late production formation energy deficit, and the injection of CO2 will create more storage within the reservoir. However, as shown in Figure 23, with the increase in CO2 huff-n-puff rounds, the oil change rate will decrease and the economic benefits will become worse.
4. Conclusions
Based on reservoir parameters and fracture-related data of the target block, taking into account the threshold pressure gradient, stress-sensitive effect, and special phase behavior characteristics of restricted fluid in nanopores, this paper uses the embedded discrete fractures model to characterize natural stratigraphical fractures and hydraulic fractures in the reservoir and establishes a CO2 huff-n-huff development model of a multi-stage fractured horizontal well in shale oil reservoirs. The validity of the model is proved by historical fitting. Based on the established model, CO2 huff-n-puff production was simulated, and the effects of the threshold pressure gradient, stress-sensitive effect, and special phase behavior characteristics of confined fluid in nanopores on shale oil production and CO2 sequestration were proved. Finally, the numerical simulation method was used to carry out single-factor analysis to determine the effects of the CO2 injection rate, braising time, CO2 huffing and puffing cycles on shale oil production, CO2 storage, and the oil change rate. Through this study, the following conclusions can be drawn:
1. In the Gulong shale oil reservoir, considering the start-up pressure gradient, shale oil production decreases by about 2% and CO2 storage increases by 0.6%; considering the stress-sensitive effect, shale oil production decreases by about 2% and CO2 storage increases by 1%.
2. The critical point correction method can be used to correct the special phase behavior of confined fluids in shale reservoirs to a certain extent. The modified component phase diagram is significantly different from that before correction, and the smaller the pore size, the more obvious the migration. If the special phase behavior characteristics of the confined fluid are taken into account, the amount of CO2 trapped decreases with the decrease in the pore radius. Without considering the special phase characteristics of the confined fluid in the nanopores, the CO2 storage capacity is the largest.
3. Through the optimization analysis of CO2 parameters through numerical simulation, it can be concluded that CO2 injection speed has the greatest impact on shale oil output at 2500 days of production. Huff-n-puff rounds had the greatest effect on CO2 sealing stock. However, braising time has little effect on shale oil production, CO2 sealing capacity, and the oil change rate.
Author Contributions
Conceptualization, L.W.; methodology, S.C.; validation, W.C.; formal analysis, L.W.; investigation, L.W. and S.C.; data curation, W.C.; writing—original draft preparation, L.W. and S.C.; writing—review and editing, L.W. and S.C.; visualization, L.W.; supervision, G.L.; project administration, L.W. and G.L. All authors have read and agreed to the published version of the manuscript.
Funding
This work is supported by the Open Fund Project “Study on Multiphase Flow Semi-Analytical Method for Horizontal Wells of Continental Shale Condensate Gas” of Sinopec Key Laboratory of Shale Oil/Gas Exploration and Production Technology (Grant No. 33550000-22-ZC0613-0208).
Data Availability Statement
Data are contained within the article.
Acknowledgments
The authors appreciate the support of the COMPASS compositional numerical simulation software provided by Sinopec Exploration and Development Research Institute.
Conflicts of Interest
Authors Lei Wang, Wenli Chen and Gang Lei were employed by the company State Key Laboratory of Shale Oil and Gas Enrichment Mechanisms and Effective Development, SINOPEC, and the company Sinopec Key Laboratory of Shale Oil/Gas Exploration and Production Technology, SINOPEC. The remaining authors declare that the research was conducted in the absence of any commercial or financial relationships that could be construed as a potential conflict of interest.
References
- Peng, F.; Huang, Z. Numerical Simulation for the Flow Characteristics of Shale Oil in Fractured Shale Reservoirs. IOP Conf. Ser. Earth Environ. Sci. 2021, 692, 042003. [Google Scholar] [CrossRef]
- Wang, L.; Tian, Y.; Yu, X.; Wang, C.; Yao, B.; Wang, S.; Winterfeld, P.H.; Wang, X.; Yang, Z.; Wang, Y.; et al. Advances in improved/enhanced oil recovery technologies for tight and shale reservoirs. Fuel 2017, 210, 425–445. [Google Scholar] [CrossRef]
- Song, C.; Yang, D. Experimental and numerical evaluation of CO2 huff-n-puff processes in Bakken formation. Fuel 2017, 190, 145–162. [Google Scholar] [CrossRef]
- Su, Z.; Tang, Y.; Ruan, H.; Wang, Y.; Wei, X. Experimental and modeling study of CO2—Improved gas recovery in gas condensate reservoir. Petroleum 2017, 3, 87–95. [Google Scholar] [CrossRef]
- Zhao, H.; Liao, X. Sensitivity Analysis and Evaluation for Carbon Dioxide Storage Coefficient in the Process of Oil Displacement. In Proceedings of the 2011 Asia-Pacific Power and Energy Engineering Conference, Wuhan, China, 25–28 March 2011; pp. 1–6. [Google Scholar] [CrossRef]
- Zhao, X.; Yao, Y.; Ye, H. The CO2 storage and EOR evaluation in Daqing Oilfield: Modeling and Analysis: The CO2 storage and EOR evaluation in Daqing Oilfield. Greenh. Gases Sci. Technol. 2016, 6, 251–259. [Google Scholar] [CrossRef]
- Chen, Z.; Su, Y.-L.; Li, L.; Meng, F.-K.; Zhou, X.-M. Characteristics and mechanisms of supercritical CO2 flooding under different factors in low-permeability reservoirs. Pet. Sci. 2022, 19, 1174–1184. [Google Scholar] [CrossRef]
- Liu, X.; Ma, L.; Tan, J.; Yang, T.; Li, X.; Hou, J.; Wei, Q.; Hao, H.; Song, Z.; Wang, S.; et al. CO2-EOR in Fractured Ultra-Low Permeability Reservoirs: Problems and Remedial Measures. In Proceedings of the Carbon Management Technology Conference, Houston, TX, USA, 17–20 July 2017. CMTC-486671-MS. [Google Scholar] [CrossRef]
- Tang, W.; Sheng, J.J. Huff-n-puff gas injection or gas flooding in tight oil reservoirs? J. Pet. Sci. Eng. 2022, 208, 109725. [Google Scholar] [CrossRef]
- Yan, J. A review of developments in carbon dioxide storage. Appl. Energy 2015, 148, A1–A6. [Google Scholar] [CrossRef]
- Liu, Z.; Gao, M.; Zhang, X.; Liang, Y.; Guo, Y.; Liu, W.; Bao, J. CCUS and CO2 Injection Field Application in Abroad and China: Status and Progress. Geoenergy Sci. Eng. 2023, 229, 212011. [Google Scholar] [CrossRef]
- Hao, H.; Hou, J.; Zhao, F.; Wang, Z.; Fu, Z.; Li, W.; Wang, P.; Zhang, M.; Lu, G.; Zhou, J. Synergetic CO2 Huff-n-Puff for Edge-Water Fault-Block Reservoir: Laboratory Experiment and Numerical Simulation. In Proceedings of the Carbon Management Technology Conference, Houston, TX, USA, 17–20 July 2017. [Google Scholar]
- Li, L.; Su, Y.; Hao, Y.; Zhan, S.; Lv, Y.; Zhao, Q.; Wang, H. A comparative study of CO2 and N2 huff-n-puff EOR performance in shale oil production. J. Pet. Sci. Eng. 2019, 181, 106174. [Google Scholar] [CrossRef]
- Yu, W.; Lashgari, H.R.; Wu, K.; Sepehrnoori, K. CO2 injection for enhanced oil recovery in Bakken tight oil reservoirs. Fuel 2015, 159, 354–363. [Google Scholar] [CrossRef]
- Pankaj, P.; Mukisa, H.; Solovyeva, I.; Xue, H. Boosting Oil Recovery in Naturally Fractured Shale Using CO2 Huff-n-Puff. In Proceedings of the SPE Argentina Exploration and Production of Unconventional Resources Symposium, Neuquen, Argentina, 14–16 August 2018. D033S012R001. [Google Scholar] [CrossRef]
- Sw, N.M. Simulation Study of CO2 Injection in Tight Oil Reservoirs. Pet. Petrochem. Eng. J. 2019, 3, 209. [Google Scholar] [CrossRef]
- Pu, W.F.; Du, D.J.; Wang, S.; Zeng, L.; Feng, R.; Memon, S.; Sarout, J.; Varfolomeev, M.A.; Sarmadivaleh, M.; Xie, Q. Experimental study of CO2 huff-n-puff in a tight conglomerate reservoir using true triaxial stress cell core fracturing and displacement system: A case study. J. Pet. Sci. Eng. 2021, 199, 108298. [Google Scholar] [CrossRef]
- Mahzari, P.; Mitchell, T.M.; Jones, A.P.; Oelkers, E.H.; Striolo, A.; Iacoviello, F.; Shearing, P.R.; Juri, J.E. Novel laboratory investigation of huff-n-puff gas injection for shale oils under realistic reservoir conditions. Fuel 2021, 284, 118950. [Google Scholar] [CrossRef]
- Shilov, E.; Dorhjie, D.B.; Mukhina, E.; Zvada, M.; Kasyanenko, A.; Cheremisin, A. Experimental and numerical studies of rich gas Huff-n-Puff injection in tight formation. J. Pet. Sci. Eng. 2022, 208, 109420. [Google Scholar] [CrossRef]
- Sanchez-Rivera, D.; Mohanty, K.; Balhoff, M. Reservoir simulation and optimization of Huff-and-Puff operations in the Bakken Shale. Fuel 2015, 147, 82–94. [Google Scholar] [CrossRef]
- Yu, W.; Zhang, Y.; Varavei, A.; Sepehrnoori, K.; Zhang, T.; Wu, K.; Miao, J. Compositional Simulation of CO2 Huff-n-Puff in Eagle Ford Tight Oil Reservoirs with CO2 Molecular Diffusion, Nanopore Confinement and Complex Natural Fractures. SPE 2018, 22, 492–508. [Google Scholar] [CrossRef]
- Sun, R.; Yu, W.; Xu, F.; Pu, H.; Miao, J. Compositional simulation of CO2 Huff-n-Puff process in Middle Bakken tight oil reservoirs with hydraulic fractures. Fuel 2019, 236, 1446–1457. [Google Scholar] [CrossRef]
- Zhang, Y.; Yu, W.; Li, Z.; Sepehrnoori, K. Simulation study of factors affecting CO2 Huff-n-Puff process in tight oil reservoirs. J. Pet. Sci. Eng. 2018, 163, 264–269. [Google Scholar] [CrossRef]
- Kanda, H.; Miyahara, M. Triple Point of a Lennard-Jones Fluid in Nanopores with Zero Excess Pore Wall Energy. Adsorpt. Sci. Technol. 2009, 27, 735–743. [Google Scholar] [CrossRef]
- Dong, X.; Liu, H.; Hou, J.; Wu, K.; Chen, Z. Phase Equilibria of Confined Fluids in Nanopores of Tight and Shale Rocks Considering the Effect of Capillary Pressure and Adsorption Film. Ind. Eng. Chem. Res. 2016, 55, 798–811. [Google Scholar] [CrossRef]
- Zarragoicoechea, G.J.; Kuz, V.A. Critical shift of a confined fluid in a nanopore. Fluid. Phase Equilibria 2004, 220, 7–9. [Google Scholar] [CrossRef]
- Wu, Y.-S.; Wang, C. Gas flow behavior in extremely low permeability rock. AIP Conf. Proc. 2012, 1453, 251–256. [Google Scholar] [CrossRef]
- Hao, F.; Cheng, L.S.; Hassan, O.; Hou, J.; Liu, C.Z.; Feng, J.D. Threshold Pressure Gradient in Ultra-low Permeability Reservoirs. Pet. Sci. Technol. 2008, 26, 1024–1035. [Google Scholar] [CrossRef]
- Chen, X.; Dai, C.; Fu, H.; Tian, Y. A new numerical simulation method of hydrogen and carbon compounds in shale reservoir. Int. J. Hydrog. Energy 2023, 48, 6986–6994. [Google Scholar] [CrossRef]
- Tang, J.; Wu, K.; Zuo, L.; Xiao, L.; Sun, S.; Ehlig-Economides, C. Investigation of Rupture and Slip Mechanisms of Hydraulic Fractures in Multiple-Layered Formations. SPE J. 2019, 24, 2292–2307. [Google Scholar] [CrossRef]
- Zhang, H.Y.; He, S.L.; Luan, G.H.; Mo, S.Y.; Lv, Z.K.; Lei, G. Experimental Study on Stress Sensitivity of Ultra-Low Permeability Sandstones. Appl. Mech. Mater. 2013, 318, 279–283. [Google Scholar] [CrossRef]
- Lee, B.I.; Kesler, M.G. A generalized thermodynamic correlation based on three-parameter corresponding states. AIChE J. 1975, 21, 510–527. [Google Scholar] [CrossRef]
Figure 1.
CO2 huff-n-puff in multi-stage fractured horizontal well.

Figure 2.
The nonlinear flow of shale oil under the threshold pressure gradient is considered.

Figure 3.
Stress-sensitive curves of fracture and shale matrix.

Figure 4.
Shale oil composition P–T phase diagram.

Figure 5.
Comparison of the fluid relative volume between that observed and calculated.

Figure 6.
Comparison of phase envelope of components in nanopores at different scales.

Figure 7.
Three types of NNC diagrams.

Figure 8.
Reservoir model diagram (The red area is the wellbore).

Figure 9.
Complex fracture network model (The red area is the wellbore, the blue area is the hydraulic fracture, and the gray area is the natural fracture).
Figure 9.
Complex fracture network model (The red area is the wellbore, the blue area is the hydraulic fracture, and the gray area is the natural fracture).

Figure 10.
HF1 historical matching curve of oil production.

Figure 11.
Oil production curve and cumulative oil production curve of well HF1.

Figure 12.
The pressure variation field during depletion development (a) and CO2 huff-n-puff development (b).
Figure 12.
The pressure variation field during depletion development (a) and CO2 huff-n-puff development (b).

Figure 13.
Cumulative oil production curve (left) and CO2 storage curve (right) considering and not considering the starting pressure gradient.
Figure 13.
Cumulative oil production curve (left) and CO2 storage curve (right) considering and not considering the starting pressure gradient.

Figure 14.
Cumulative oil production curve (left) and CO2 storage curve (right) considering and not considering the stress-sensitive effect.
Figure 14.
Cumulative oil production curve (left) and CO2 storage curve (right) considering and not considering the stress-sensitive effect.

Figure 15.
Cumulative oil production curve with different pore radii.

Figure 16.
CO2 storage curve with different pore radii.

Figure 17.
Bubble point curve with different pore radii.

Figure 18.
Cumulative oil production (left) and CO2 storage (right) of shale oil with different CO2 injection rates.
Figure 18.
Cumulative oil production (left) and CO2 storage (right) of shale oil with different CO2 injection rates.

Figure 19.
Oil change rate with different CO2 injection rates.

Figure 20.
Cumulative shale oil production (left) and CO2 storage (right) with different soak times.
Figure 20.
Cumulative shale oil production (left) and CO2 storage (right) with different soak times.

Figure 21.
Oil change rate with different soak times.

Figure 22.
Cumulative production of shale oil (left) and CO2 storage (right) under different CO2 huff-n-puff cycles.
Figure 22.
Cumulative production of shale oil (left) and CO2 storage (right) under different CO2 huff-n-puff cycles.

Figure 23.
Oil change rate with different huff-n-puff cycles.


Table 1.
Composition content of oil in formation after composition consolidation.
| Component | Molar Fraction, % | Component | Molar Fraction, % |
|---|---|---|---|
| CO2 | 1.17 | C3-C6 | 13.87 |
| N2 | 1.62 | C7-C15 | 12.57 |
| C1 | 49.85 | C16+ | 7.06 |
| C2 | 13.86 | Total | 100 |
Table 2.
PVT property fitting of formation crude oil.
| Parameter | Calculated | Observed |
|---|---|---|
| Saturation pressure, MPa | 26.9 | 23.5 |
| Formation oil viscosity, mPa·s (32 MPa, 115 °C) | 0.2 | 0.2 |
| Formation oil density, kg/m3 (32 MPa, 115 °C) | 640.4 | 696.2 |
Table 3.
Comparison of critical parameters of each component before and after modification.
| Component | Tc (K) | pc (atm) | 50 nm Tcp (K) | 50 nm pcp (atm) | 40 nm Tcp (K) | 40 nm pcp (atm) | 30 nm Tcp (K) | 30 nm pcp (atm) |
|---|---|---|---|---|---|---|---|---|
| CO2 | 304.70 | 72.90 | 302.45 | 72.36 | 301.89 | 72.23 | 300.96 | 72.00 |
| N2 | 126.20 | 33.50 | 125.27 | 33.25 | 125.04 | 33.19 | 124.65 | 33.09 |
| C1 | 190.60 | 45.44 | 189.19 | 45.10 | 188.84 | 45.02 | 188.26 | 44.88 |
| C2 | 305.43 | 48.20 | 303.18 | 47.84 | 302.61 | 47.76 | 301.68 | 47.61 |
| C3-C6 | 411.05 | 38.06 | 408.01 | 37.78 | 407.26 | 37.71 | 406.00 | 37.60 |
| C7-C15 | 635.67 | 23.28 | 630.98 | 23.10 | 629.80 | 23.06 | 627.86 | 22.99 |
| C16+ | 793.83 | 14.09 | 787.97 | 13.99 | 786.51 | 13.96 | 784.08 | 13.92 |
| Component | Tc (K) | pc (atm) | 50 nm Tcp (K) | 50 nm pcp (atm) | 40 nm Tcp (K) | 40 nm pcp (atm) | 30 nm Tcp (K) | 30 nm pcp (atm) |
| CO2 | 304.70 | 72.90 | 299.09 | 71.56 | 293.55 | 70.23 | 282.62 | 67.62 |
| N2 | 126.20 | 33.50 | 123.88 | 32.88 | 121.58 | 32.27 | 117.05 | 31.07 |
| C1 | 190.60 | 45.44 | 187.09 | 44.60 | 183.62 | 43.78 | 176.79 | 42.15 |
| C2 | 305.43 | 48.20 | 299.81 | 47.31 | 294.25 | 46.44 | 283.30 | 44.71 |
| C3-C6 | 411.05 | 38.06 | 403.48 | 37.36 | 396.00 | 36.67 | 381.26 | 35.31 |
| C7-C15 | 635.67 | 23.28 | 623.97 | 22.85 | 612.40 | 22.42 | 589.60 | 21.59 |
| C16+ | 793.83 | 14.09 | 779.23 | 13.83 | 764.77 | 13.58 | 736.30 | 13.07 |
Table 4.
NNC formulation of EDFM model.
| NNC Type | Tnnc | Ti | Annc | dnnc | knnc |
|---|---|---|---|---|---|
| Ⅰ | - | - | |||
| Ⅱ | kf | ||||
| Ⅲ | kf |
Table 5.
Model geological parameters.
| Geological Parameters | |||
|---|---|---|---|
| Model area size (km2) | 1.6 | Reservoir thickness (m) | 160 |
| Number of grids | 32,000 | Matrix porosity (%) | 3.40 |
| Matrix permeability (mD) | 0.0082 | Reservoir temperature (°C) | 115 |
| Top depth (m) | 2300 | Matrix water saturation (%) | 46 |
| Rock density (kg/m3) | 2550 | Rock compressibility (MPa−1) | 1.45 × 10⁻⁵ |
Table 6.
Fracture system parameters.
| Fracture Parameters | |||
|---|---|---|---|
| Hydraulic fracture half length (m) | 120 | Hydraulic fracture aperture (m) | 0.005 |
| Hydraulic fracture width (m) | 50 | Natural fracture aperture (m) | 0.001 |
| Hydraulic fracture permeability (mD) | 10,000 | Hydraulic fracture porosity (%) | 5 |
| Natural fracture permeability (mD) | 100 | Natural fracture porosity (%) | 5 |
Disclaimer/Publisher’s Note: The statements, opinions and data contained in all publications are solely those of the individual author(s) and contributor(s) and not of MDPI and/or the editor(s). MDPI and/or the editor(s) disclaim responsibility for any injury to people or property resulting from any ideas, methods, instructions or products referred to in the content. |
© 2024 by the authors. Licensee MDPI, Basel, Switzerland. This article is an open access article distributed under the terms and conditions of the Creative Commons Attribution (CC BY) license (https://creativecommons.org/licenses/by/4.0/).
Share and Cite
MDPI and ACS Style
Wang, L.; Cai, S.; Chen, W.; Lei, G. Integrated Study on Carbon Dioxide Geological Sequestration and Gas Injection Huff-n-Puff to Enhance Shale Oil Recovery. Energies 2024, 17, 1957. https://doi.org/10.3390/en17081957
AMA Style
Wang L, Cai S, Chen W, Lei G. Integrated Study on Carbon Dioxide Geological Sequestration and Gas Injection Huff-n-Puff to Enhance Shale Oil Recovery. Energies. 2024; 17(8):1957. https://doi.org/10.3390/en17081957
Chicago/Turabian StyleWang, Lei, Shengyao Cai, Wenli Chen, and Gang Lei. 2024. "Integrated Study on Carbon Dioxide Geological Sequestration and Gas Injection Huff-n-Puff to Enhance Shale Oil Recovery" Energies 17, no. 8: 1957. https://doi.org/10.3390/en17081957
Note that from the first issue of 2016, this journal uses article numbers instead of page numbers. See further details here.