
Optimization of Electrical and Thermal Storage in a High School Building in Central Greece


Mechanical Engineering Department, University of Thessaly, 38334 Volos, Greece
*
Author to whom correspondence should be addressed.
Energies 2024, 17(8), 1966; https://doi.org/10.3390/en17081966
Submission received: 1 April 2024
/
Revised: 15 April 2024
/
Accepted: 19 April 2024
/
Published: 20 April 2024
(This article belongs to the Special Issue Smart Grid Integration of Zero Energy Buildings: Challenges and Perspectives)
Abstract
:Nearly zero-emission buildings (nZEBs) are increasingly being constructed in Europe. There are also incentives to refurbish older buildings and transform them into nZEBs. However, permission is not always granted for their connection to the grid to infuse surplus photovoltaic electricity due to the grid being overloaded with a large number of renewables. In this study, the case of a refurbished school building in Central Greece is examined. After refurbishing it, a significant amount of photovoltaic electricity surplus is observed during the summer and neutral months, which cannot be exported to the grid. The absence of an adequate battery storage capacity resulted in the rejection of an application for exporting the school’s surplus to the network and the photovoltaic installation staying idle. An alternative approach is proposed in this work, involving a shift in the export of the photovoltaic electricity surplus to the evening hours, in order for the school to be granted permission to export it to the network. To this end, an optimal battery storage size is sought by employing a building energy system simulation. The mode of operation of the battery designed for this application is set to discharge daily, in order to export the electricity surplus in the afternoon hours to the evening hours, when it is favorable for the network. Additionally, the optimal size of the thermal energy storage of the heating system is studied to further improve its energy efficiency. Our battery and storage tank size optimization study shows that a significant battery capacity is required, with 12 kWh/kWp photovoltaic panels being recommended for installation. The ever-decreasing cost of battery installations results in the net present value (NPV) of the additional investment for the battery installation becoming positive. The solution proposed forms an alternative path to further increase the penetration of renewables in saturated networks in Greece by optimizing battery storage capacity.
1. Introduction
Global efforts to face climate change by reducing greenhouse gas (GHG) emissions involve the further penetration of renewables. In Europe, climate policies regarding the energy mixture aim for net-zero emissions by 2050. In Greece, specific objectives have been put into legislation to cut GHG emissions by 55% by 2030 and by 80% by 2040, as well as to phase out lignite-fueled electricity generation by 2028 [1]. The Greek transport sector was accountable for 38% of the amount of energy consumed in 2018, followed by the residential sector with 27% and the industrial, service and agricultural sectors with 18%, 16% and 3%, respectively [2]. The expansion of renewables in Greece has been remarkable over the last twenty years. Yet, nowadays, the electricity grid is overloaded by renewables’ penetration, retarding the further expansion of renewables, especially of rooftop photovoltaic installations. This problem especially affects and involves the interaction of microgrids, energy storage and energy communities. Energy communities in Greece can participate in net-metering or virtual net-metering applications, either in neighboring buildings or in buildings in the same municipality. They may consist of companies, municipalities and individuals.
A net-zero energy community (NZEC) is a group of neighboring buildings with renewable energy sources. Their self-production covers their aggregate energy demand [3]. Examples of these are large complexes of residential houses or offices, education buildings, shopping centers, small villages or island communities. Microgrids are vital in addressing the problem of grid saturation. A microgrid comprises specific loads, energy storage, self-generation and communication systems for real-time management. They are able to operate autonomously or interact with the external grid after balancing the power supply with the demand to a certain extent [4,5]. To this end, a strategy to increase the self-consumption ratio (SCR) involves the installation of various kinds of short- and long-term storage systems [6]. The operation of photovoltaic (PV) systems in combination with electrical and heat storage is a known means of reducing the total energy expenditure. The minimization of annual costs and increase in the self-consumption ratio are influenced by prices, local insolation conditions and policy measures for PV prosumers [7]. Policy support is critical for economic viability. Kumar et al. presented a battery storage system within a PV system in India comparing a zero-export system with a net-metering scheme. The optimal size of a commercially viable system with zero feed-in is smaller than that of the respective net-metering scheme [8].
Energy storage helps to resolve the mismatch of renewable energy supply and demand profiles. Although thermal storage, pumped hydro storage, batteries, super-capacitors and hydrogen storage have financial and technical limitations, [9], their involvement remains critical to face the peak in energy demand [10]. Thermal energy storage (TES) is affected by heating or cooling media. This allows us to use stored amounts later for heating or cooling [11]. This includes sensible energy storage in buffer tanks, boreholes, aquifers, caverns or pits. It also includes phase-change materials (PCMs) and storage via chemical reactions [12]. The main characteristics of TES are its capacity, power, efficiency, storage, charge, discharge and cost [13]. PCMs can also be profitably incorporated in buildings’ shells to increase their heat capacity [14]. Common PCMs include plaster, gypsum boards, bricks, concrete, etc. [15].
Heat pumps are the main engine behind building electrification. The substitution of combustion boilers by heat pumps significantly increases the electricity self-consumption ratio in buildings. The efficiency of air source heat pumps is continuously improving. They can operate at outdoor temperatures reaching −15 °C with backup electrical resistances, implying, however, a severe coefficient of performance (COP) penalty [16,17]. Coelho et al. assessed the effectiveness of phase-change materials installed on an nZEB residential building in Austria [18]. Aneli et al. analyzed a system comprising a heat pump and a PV installation with thermal and electrical storage for residential buildings. The use of storage resulted in a significant increase in self-consumption and self-sufficiency [19]. Nicoletti et al. studied a system consisting of a boiler, a PV with battery storage and an air source heat pump using EnergyPlus. Simulations were performed for five Italian locations with different climatic typologies. The optimal size of the PV installation was proven to depend on the heat pump’s size. On the other hand, the optimal size of the batteries is affected by the location and the size of the PV installation [20]. Meriläinen et al. studied the renovation of an oil-heated home into a carbon-neutral one by shifting to a heat pump, an on-grid PV system and a battery energy storage system (BESS). The system was simulated in Matlab. The ground-coupled heat pump with the PV achieved the lowest life cycle cost [21]. Research has also focused on the simulation and sizing of hybrid systems with electrical, thermal or hydrogen storage [22].
Hybrid systems are the usual choice to reduce emissions and improve overall system energy efficiency [23]. Mancò et al. examined the use of traditional and green technologies in the renovation of an old building. Cost reductions of 27–29% were achieved with the size optimization of Li-ion batteries, thermal storage and a biogas facility, carried out by non-linear programming [24]. Energy management is crucial for hybrid systems, especially in systems with different types of storage. Bigdeli et al. studied a hybrid system that consisted of PV panels, a fuel cell and batteries as storage, using a fuzzy controller. The combination of the fuzzy logic controller with quantum-behaved particle swarm optimization performed best [25]. Möller et al. employed Matlab v.9.11 to analyze annual energy flows. They used loads, weather data and heating energy profiles as their input data. The hybrid energy storage system comprised lithium-ion batteries (short-term) and hydrogen storage (long-term). The rejected heat from the electrolyzer and fuel cell were modelled. The remaining heating loads were covered by a heat pump [26]. Stamatellos et al. examined the interactions between short-term electric car battery storage and long-term green hydrogen storage in a building [27]. Liu et al. proposed a method for sizing the PV BESS system. They took into account the impact of uncertainties. This was expressed by means of climatic effects and battery degradation from irregular cycling. Their approach included optimal sizing, a component output analysis, state prediction and parameter tuning. Energy management strategies were examined by updating the components’ output to maximize energy savings [28]. Wu et al. proposed a reinforcement learning model approach for the performance optimization of existing zero-energy houses. Taking into account the PV output, consumption and energy costs, it was found that a deterministic policy gradient algorithm achieves a 49.4% PV self-consumption ratio and a 36.7% self-sufficiency ratio [29].
Micro-grids in nZEBs [30] are designed for self-sufficiency. Grid transactions can be optimally controlled to keep the grid stable. European standards limit the net primary energy import from the grid to 20–30 kWh/m2y [31]. These buildings are well insulated and characterized by smart control features. Space heating and cooling are supplied by efficient heat pumps. Electricity comes from rooftop PV installations. The Energy Performance of Buildings Directive 2010/31/EU [32] mandates nZEBs from 2021 onwards. In parallel, most European countries incentivize the refurbishment of older public buildings to approach nZEBs. The most popular strategies involve adding insulation and shading measures, efficient lighting and the replacement of oil or gas boilers by heat pumps [33]. In Greece, many public school buildings are renovated with this philosophy, which results in a significant amount of PV electricity surplus for export, after the coverage of in-house loads. This happens especially during weekends and extended holidays. The optimal sizing of self-production installations and storage facilities is critical in such cases.
The current study is based on the case of a high school in the small municipality of Gonnoi, near Larissa, Thessaly, which was constructed in 1990. The original building lacked adequate insulation and was heated by an oil-fueled boiler. A refurbishing project was carried out in the period of 2018–2019. Moving towards electrification, the boiler was replaced by an array of air-to-water heat pumps. Heat storage was provided by two buffer tanks, each with a 1000 lit capacity. The old lighting system with fluorescent lamps was replaced by LED lights with a total of 14 kW of peak power installed. A rooftop PV system was installed, consisting of 95 PV panels rated at 535 Wp, in order to profit from a net-metering program. The system was initially aimed to operate with a significant amount of energy injected into the grid, without providing for electricity storage due to budget limitations and the very high cost of batteries. However, the Hellenic Energy Distribution Network rejected the electricity’s injection into the external grid. Thus, the PV installation is not yet operative. Greek legislation supports the addition of battery energy storage systems aimed at increasing the self-consumption of prosumers. Yet, the operation of the BESS is limited to increasing self-consumption by shifting the PV electricity to be consumed during the evening hours to avoid its export to the grid, which is saturated by the high PV capacity installed in most regions (with a zero feed-in requirement). The high school building produces significant quantities of electricity, especially during the spring, summer and autumn, which are characterized by a large percentage of sunny days. Only during the winter does the building’s consumption match its PV production on average. The initially suggested scheme was rejected to safeguard the grid’s stability because the grid was overloaded at this location. Choosing an optimal electrical and thermal storage system is a challenging task. The right choice should maximize the school’s self-consumption ratio, increase its energy efficiency and decrease imports from the grid. It should allow for injections into the grid during specific hours of the day that are favorable to the grid’s stability.
In this study, an alternative approach is proposed that supports the further penetration of renewables in already congested networks. To this end, a significant amount of storage capacity will need to be installed to shift the dispatch of PV electricity to the evening hours. The battery size must be optimized. This task requires the use of a building energy simulation for the entire year, in order to address the variability in solar radiation on the PV panels and the building’s electricity consumption profiles. Additionally, the optimal size of the buffer tanks of the heating installation is studied, aimed at further improving the energy efficiency. The decreasing cost of battery installations is proven to result in the net present value of battery investments breaking even. The proposed approach is based on the observed downward trend in battery prices and creates an alternative path towards increasing renewable installations in saturated networks in Greece. This would further reduce the significant quantities of natural gas consumed during the evening ramp of the Greek electricity system and reduce electricity prices that suffer from instabilities in the natural gas markets. Based on the findings of this work, a modification of the terms and conditions of the Greek network operator is proposed so that it might accept the infusion of PV electricity from buildings with a significant surplus, provided that an adequate battery capacity is installed to shift electricity exports to the evening hours.
The remaining paper has the following structure: Section 2 presents the building’s architecture and its energy system’s design and simulation. The input data and the battery and storage tanks’ capacity optimization procedure are included. Section 3 discusses the simulation results on an hourly and seasonal basis and grid interactions. The initial (reference) system’s performance is compared to that of the optimized system. Our conclusions are discussed in Section 4.
2. Materials and Methods
The building’s energy simulation was carried out in TRNSYS v.16. This software is capable of modeling the transient performance of a large variety of energy systems [34]. A system of linear equations results from the component models’ interactions. The reliable performance of TRNSYS in building simulation has been confirmed in an extensive number of studies [35]. The model structure in TRNSYS and the building’s details are briefly presented below.
2.1. Building Description
The 9-zone high school building of Figure 1 has a ground trace of 857 m2. It consists of three levels: the basement, with classrooms that are partly above ground towards the southeast; the ground level with classrooms, gymnasium and auditorium; and the first floor with classrooms and offices. The building was renovated in 2019. External insulation was added to the walls, resulting in a thermal transmittance of U = 0.35 W/m2K, and the roof was insulated up to U = 0.29 W/m2K. The windows were not changed. They are double glazed with standard aluminum frames, and their thermal transmittance is 3.27 W/m2K. No insulation was added to the basement floor (slab on ground), resulting in U = 3.24 W/m2K.
More building data are presented in Appendix A. A maximum number of 200 students is assumed on workdays. The total heated zones’ area is 2180 m2. Ceiling height is 3 m (ground and first floor). The consumption profiles of the school building are peculiar, because of the existence of two-week holidays at Christmas and Easter, as well as due to the long summer holidays (more than two and a half months long). During these periods, the school is a significant electricity exporter to the grid and the battery is designed exactly with this situation in mind to be acceptable and favorable to the grid.
The structure of the system’s model is presented in Figure 2. Type 56 multi-zone building model is the central component in this simulation. A typical meteorological year (TMY) was compiled based on available meteorological data for Gonnoi, Thessaly, Greece. This is a necessary input for the TRNSYS model. It contains hourly time series of ambient temperature, humidity, wind direction and speed. The total/direct solar horizontal radiation for the full year is included. Space heating is supplied by four 30.1 kW nominal capacity air-to-water heat pumps. Their rated heating output is 120.3 kW at 7 °C DB ambient temperature. The heat pumps’ leaving water feeds two storage tanks with total volume of 2 m3. The tanks feed a hydronic network with radiators inside offices, corridors, classrooms and other spaces. The gym and auditorium theater are heated by fan heaters. LED lighting and A+ efficiency office equipment are employed. The air source heat pump model is a modified version of Type 668 [36].
2.2. Photovoltaic Installation
A total of 95 photovoltaic panels are arranged to fill the southwest-facing (50) and the southeast-facing (45) parts of the tilted roof of the building (panels’ total area is 245.5 m2). The PV panels’ tilt angle is 17.9 degrees, following the slope of the tilted roof (Figure 1). The panels have a 535 Wp nominal output [37] (data in Appendix A). A total of 50.825 kWp is attained in this way. The photovoltaic panels’ performance is modeled by a standard model in TRNSYS [38]. A reconstruction of the current–voltage curve is made by fitting data from the manufacturer’s technical datasheet. Each cell is modeled by an equivalent one-diode circuit with five parameters: IL (the light current); I0 (the reverse diode current); RS (the module series resistance); RSH (the shunt resistance); and a (a modified ideality factor). The modified ideality factor depends on the cell temperature TC, the number of cells in series NS, the usual ideality factor , the Boltzmann constant k and electron charge q.
2.3. Electricity Storage Batteries
A generic lithium-ion battery model is employed. It shows the battery voltage, current and state of charge (SOC). The model employs the modified Shepherd equations (Hyman’s model). The specific TRNSYS routine requires power as input [39]. Charging efficiency is assumed to be constant. The main battery categories are lead–acid, lithium-ion, sodium–sulfur and flow batteries [40]. BESSs require accurate modelling to enable accurate SOC and health level estimations [41]. Optimization of BESSs based on capacity, SOC and output power may extend their lifespans [42]. Some indicative battery types are presented in Table 1.
In the initial building simulations, a lithium-ion battery aggregate with total capacity of 500 kWh is assumed. The study of the system’s performance on a daily basis for the different seasons will indicate directions for battery capacity optimization.
2.4. Air-to-Water Heat Pumps
Space heating is provided by four identical heat pumps (in heating-only mode) which are connected to two buffer tanks. The total heating capacity in kW of each one is presented in Figure 3 as function of the source temperature (ambient air temperature) and the leaving water temperature (load). The charts are based on the manufacturer’s data (Appendix A). As can be seen in the graph, their performance severely deteriorates at source temperatures below about −7 °C, at which point the COP is reduced to 1.
The associated electric power consumption as function of source and load temperature of the heat pump is additionally presented in Figure 4.
The electricity consumption below −7 °C is almost exclusively electricity dissipation in a backup electrical resistance, which reduces the heat pump’s operation to that of a simple electric heater. More data on the heat pumps’ performance are included in Appendix A.
2.5. Dispatch Logic for the Electricity Sources
The usual control strategies for battery dispatch in hybrid systems are load following and cycle charging [53]. The low limit is introduced along with a charge to discharge limit at the inverter’s control unit. For low battery Soc battery recharging is of the highest priority. Second highest priority is satisfying the building’s loads. The available battery charge power () and discharge power () depends on its instantaneous state of charge (). This is defined as the ratio of the remaining capacity () to its maximum capacity () [54]. The battery discharge power level is expressed by the C-rate. This rate refers to the power that can be discharged hourly, relative to the battery’s capacity. This reference value is defined as 1-C. In addition to the Soc and C-rate, the maximum discharge power depends on the allowed for the battery as follows:
Here, and are percentages. is in kWh, and and are in kW. Power is supplied by the PV installation, the batteries and the positive or negative power flow to/from the external grid. A sequential dispatch is assumed, aimed at zeroing any unmet load. First priority is PV energy dispatch. The net required load (kW) is computed as follows:
where is the load to be met (kW) and denotes the PV generation (kW). is the PV inverter’ s efficiency (%), and is the DC power (kW). The net required load could be zero, negative or positive. If is negative, excess power is produced by the PV. This excess power charges the battery if Soc < 1. Otherwise, it is exported to the grid. If the net load is positive, additional load has to be met. This can be accomplished either by discharging the battery, provided that SOC > , or by importing electricity from the grid. Thus, the battery’s power exchange in is computed as follows:
where and are the battery’s inverter and rectifier’s efficiency, respectively. is negative when battery is discharging. It is positive when it is charged.
In the optimized system, the above dispatch logic is modified in its last steps, in order to avoid electricity being exported in the hours around noon. This would happen with the above-described dispatch logic whenever the battery is loaded up to its 100% capacity. To avoid this non-permissible export to the grid, the inverter is programmed to export battery electricity only during the hours from 17:00 to 01:00 for the period from April to October. During these months, the heat pump consumption is negligible, and a significant surplus of electric power becomes available. The power levels of electricity export to the grid should be modulated according to the season and maximized during the summer. They are also varied in proportion to the battery state of charge.
2.6. Storage Tank Capacity and Battery Capacity Optimization
The optimal sizing of the battery and the control of battery discharge limit are critical to the system’s performance and lifespan (Table 2).
Then, the system’s parameter values listed in Table 2 are optimally determined.
The following constraints are set for the energy management system of the building.
Electricity may be exported to the grid according to the seasons of the year as follows:
- Winter period (01.11–30.03): Zero feed-in (export not permitted);
- Summer period (01.04–31.10): Export to grid scheduled from 17:00 to 01:00, based on the dispatch logic presented above.
The optimal values for battery size and storage tank volume are determined following a statistical analysis of the building’s energy system’s performance. This will be presented in the next section. However, it is also important to check the financial viability of the additional installation and maintenance costs induced, mainly for the batteries but also for the storage tanks.
For the economic analysis, one must keep in mind that the starting point is the high-school building with rooftop PVs installed but without batteries installed. In this situation, all electricity is purchased from the electric power company. When the batteries are installed, the building’s electricity demand is mainly covered in-house. Positive cash flows are introduced, equal to the cost of purchasing the self-consumed electricity demand. Further, there is a positive cash flow from selling the exported quantities to the grid, minus a negative cash flow for the annual purchase of the electricity imported from the grid.
The net present value for the battery investment is expressed as follows:
where:
N is the lifetime of the batteries, assumed to be 10 years;
i is a specific year in the lifetime of the battery;
d is the discount rate, assumed at 2%.
Cash Flow for year 0 subtracts the battery package cost, currently around 150 USD/kWh for this category of battery size [55]. The additional storage tanks’ investments can be neglected in this approximation. For years i = 1 through 10, positive cash flows are the savings and profits from exploitation of the PV electricity, as explained above. Negative cash flows are the cost of electricity imported and the operation and maintenance costs (0.75 USD/kWh). No investment tax credit is applied for year 0, because this investment will be eligible for government funding.
For economic viability, the NPV of Equation (7) for N = 10 years should be a positive value. The Sankey diagram in Figure 5 is provided to better understand the system’s operation.
Thus, for economic viability of the additional investment, the cost of the battery installation, which leads to negative cash flow for the first annual period, must be offset by the added present values of the net annual gains from self-consumption and export of PV electricity, minus the costs of purchasing the import quantities and the annual battery maintenance costs for the period of ten years, which is assumed to be the lifetime of the battery.
3. Results and Analysis
Our starting point is the transient simulation of a reference system, which includes, in addition to the system that was actually installed, a battery pack with a capacity of 500 kWh that is allowed to discharge above = 0.36. The results are presented in the form of hourly time series and monthly energy balances.
3.1. Transient Performance of the Initial System
A TRNSYS simulation of a full year with a 0.1 h time step was performed to assess the initial system’s performance. The following variables were recorded: the ambient temperature, typical zone temperature, heat pump consumption, PV electricity production, battery SoC, power imported from the grid and power exported to the grid. As our first example, Figure 6 presents the variation in these variables for the second week of January. Significant electricity import from the grid is noted especially from Wednesday to Friday, due to the low battery SOC and cloudy days. As soon as the SOC exceeds , the battery is allowed to discharge to cover the additional building load.
As our next step, we compare the behavior of the external grid during a similar period. To this end, the system’s load curve in a week in January 2024 is presented in Figure 7.
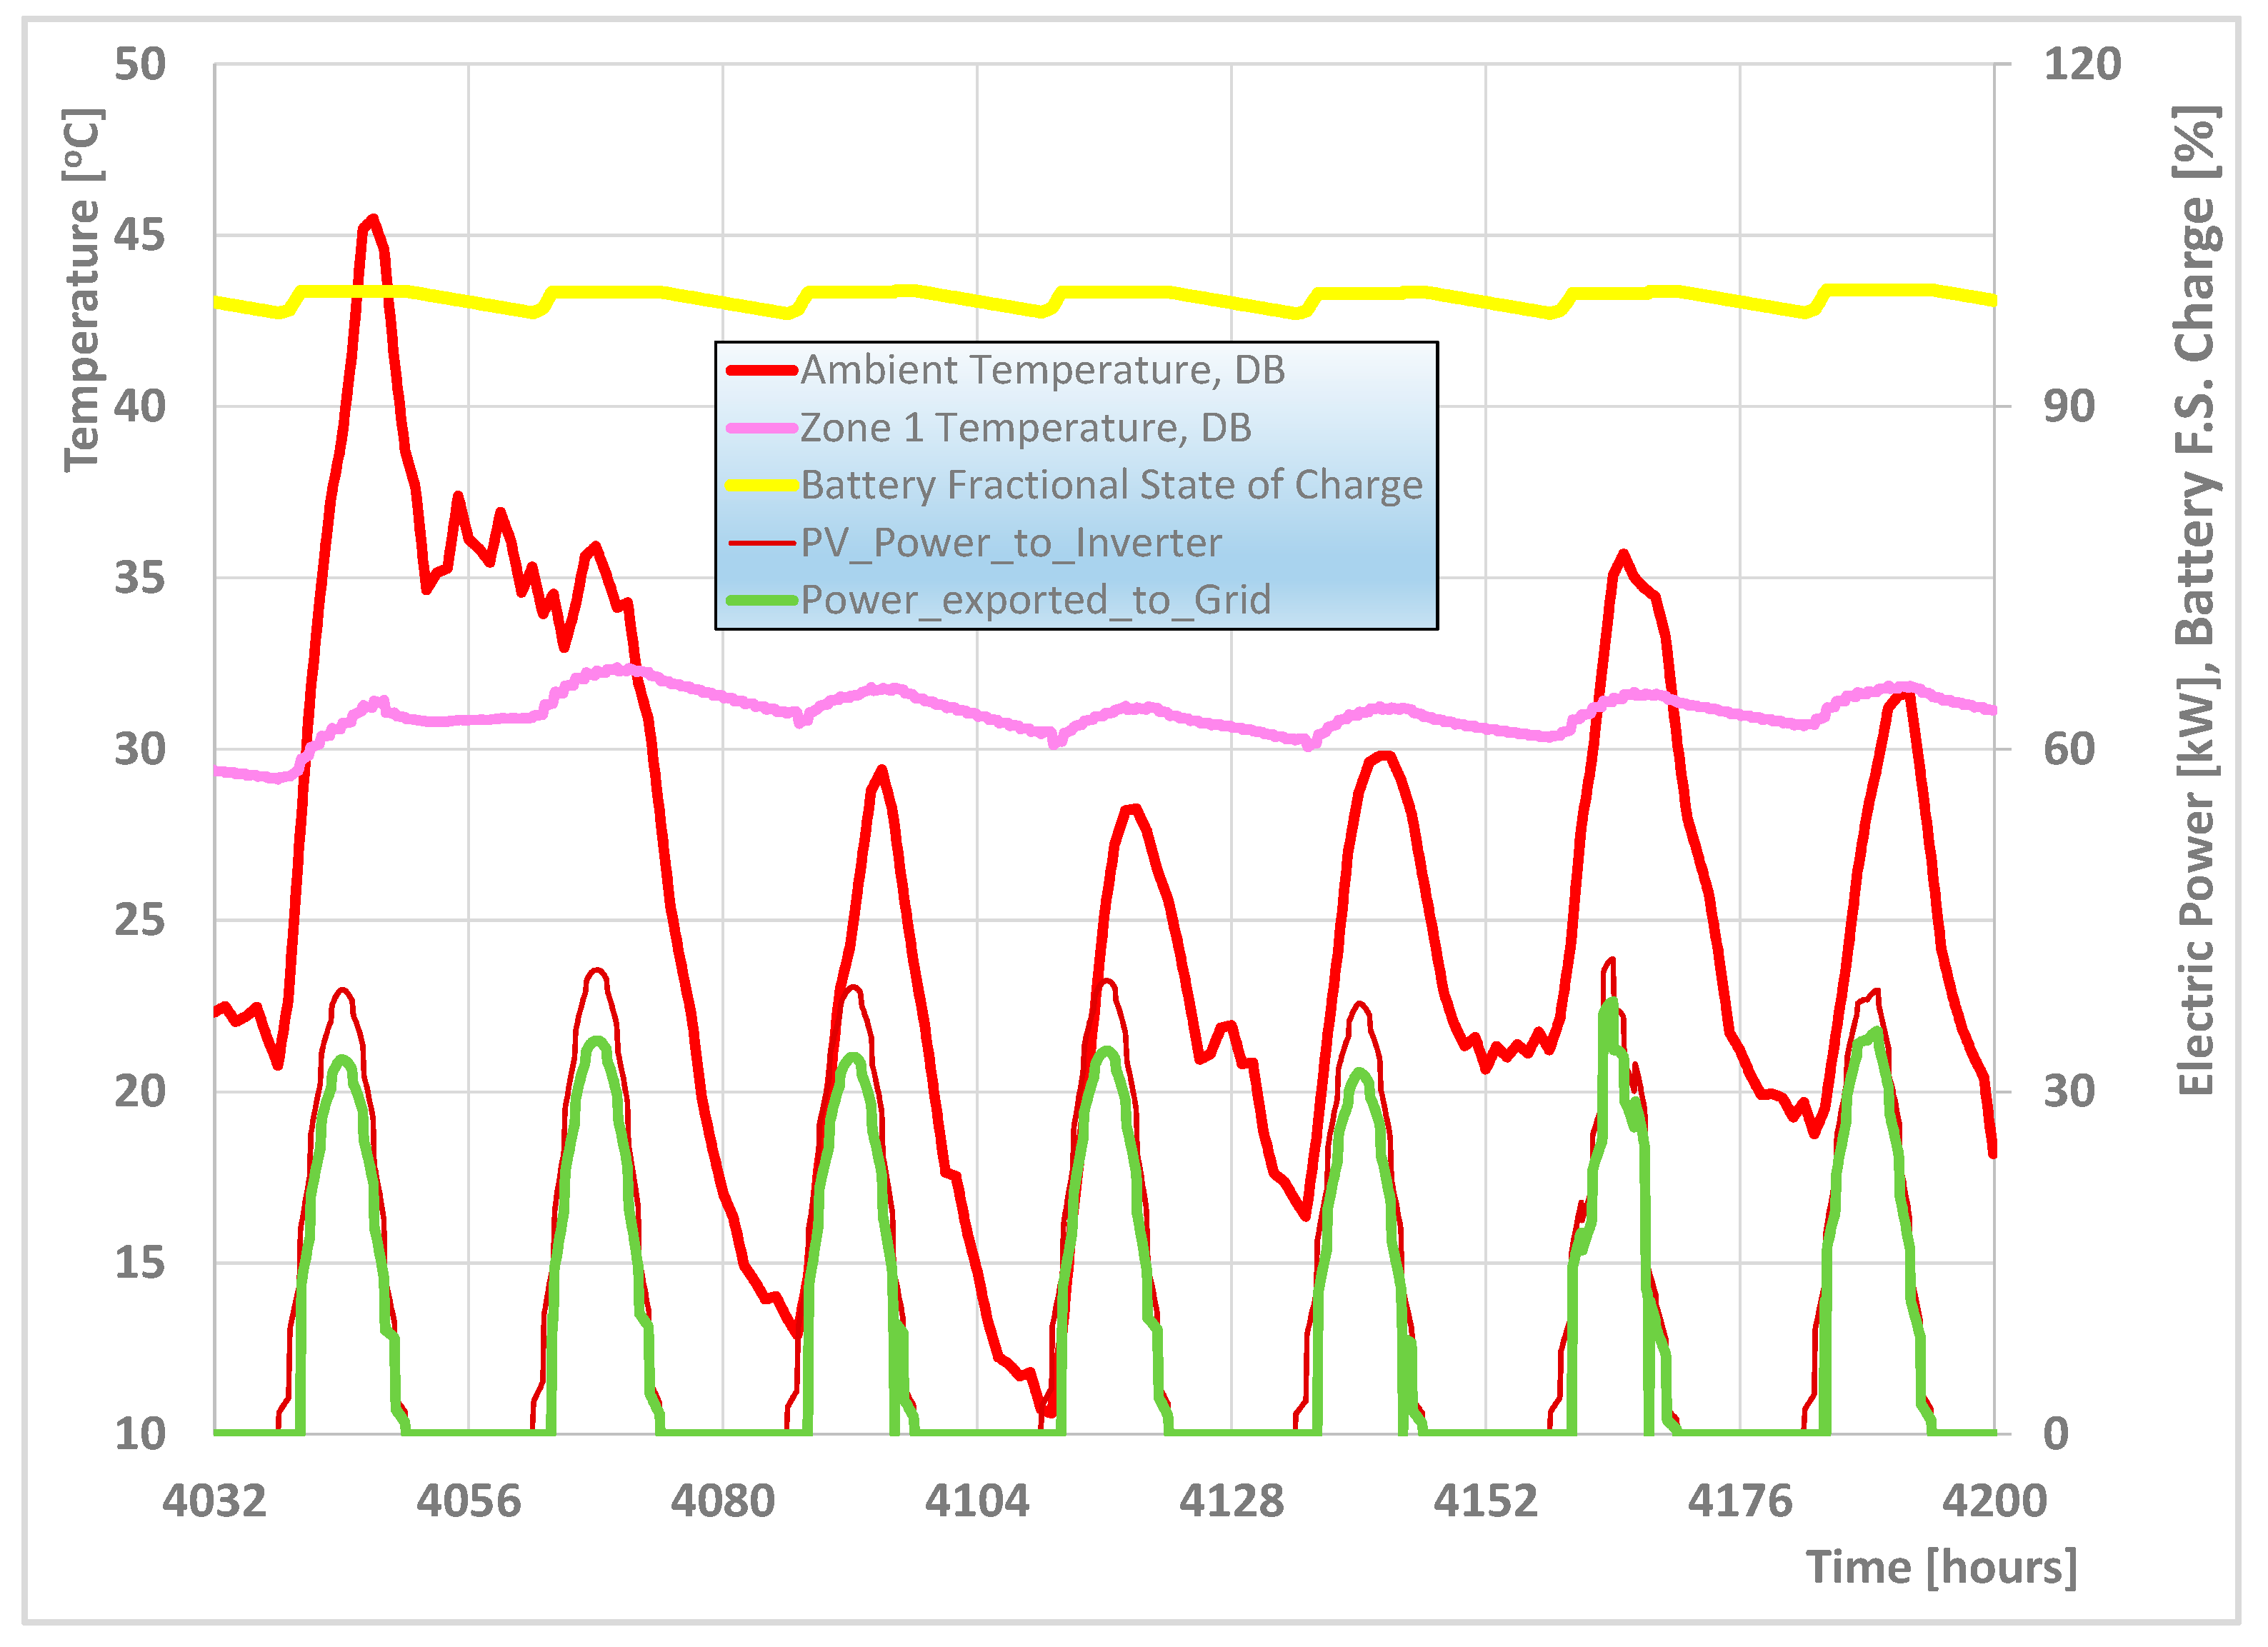
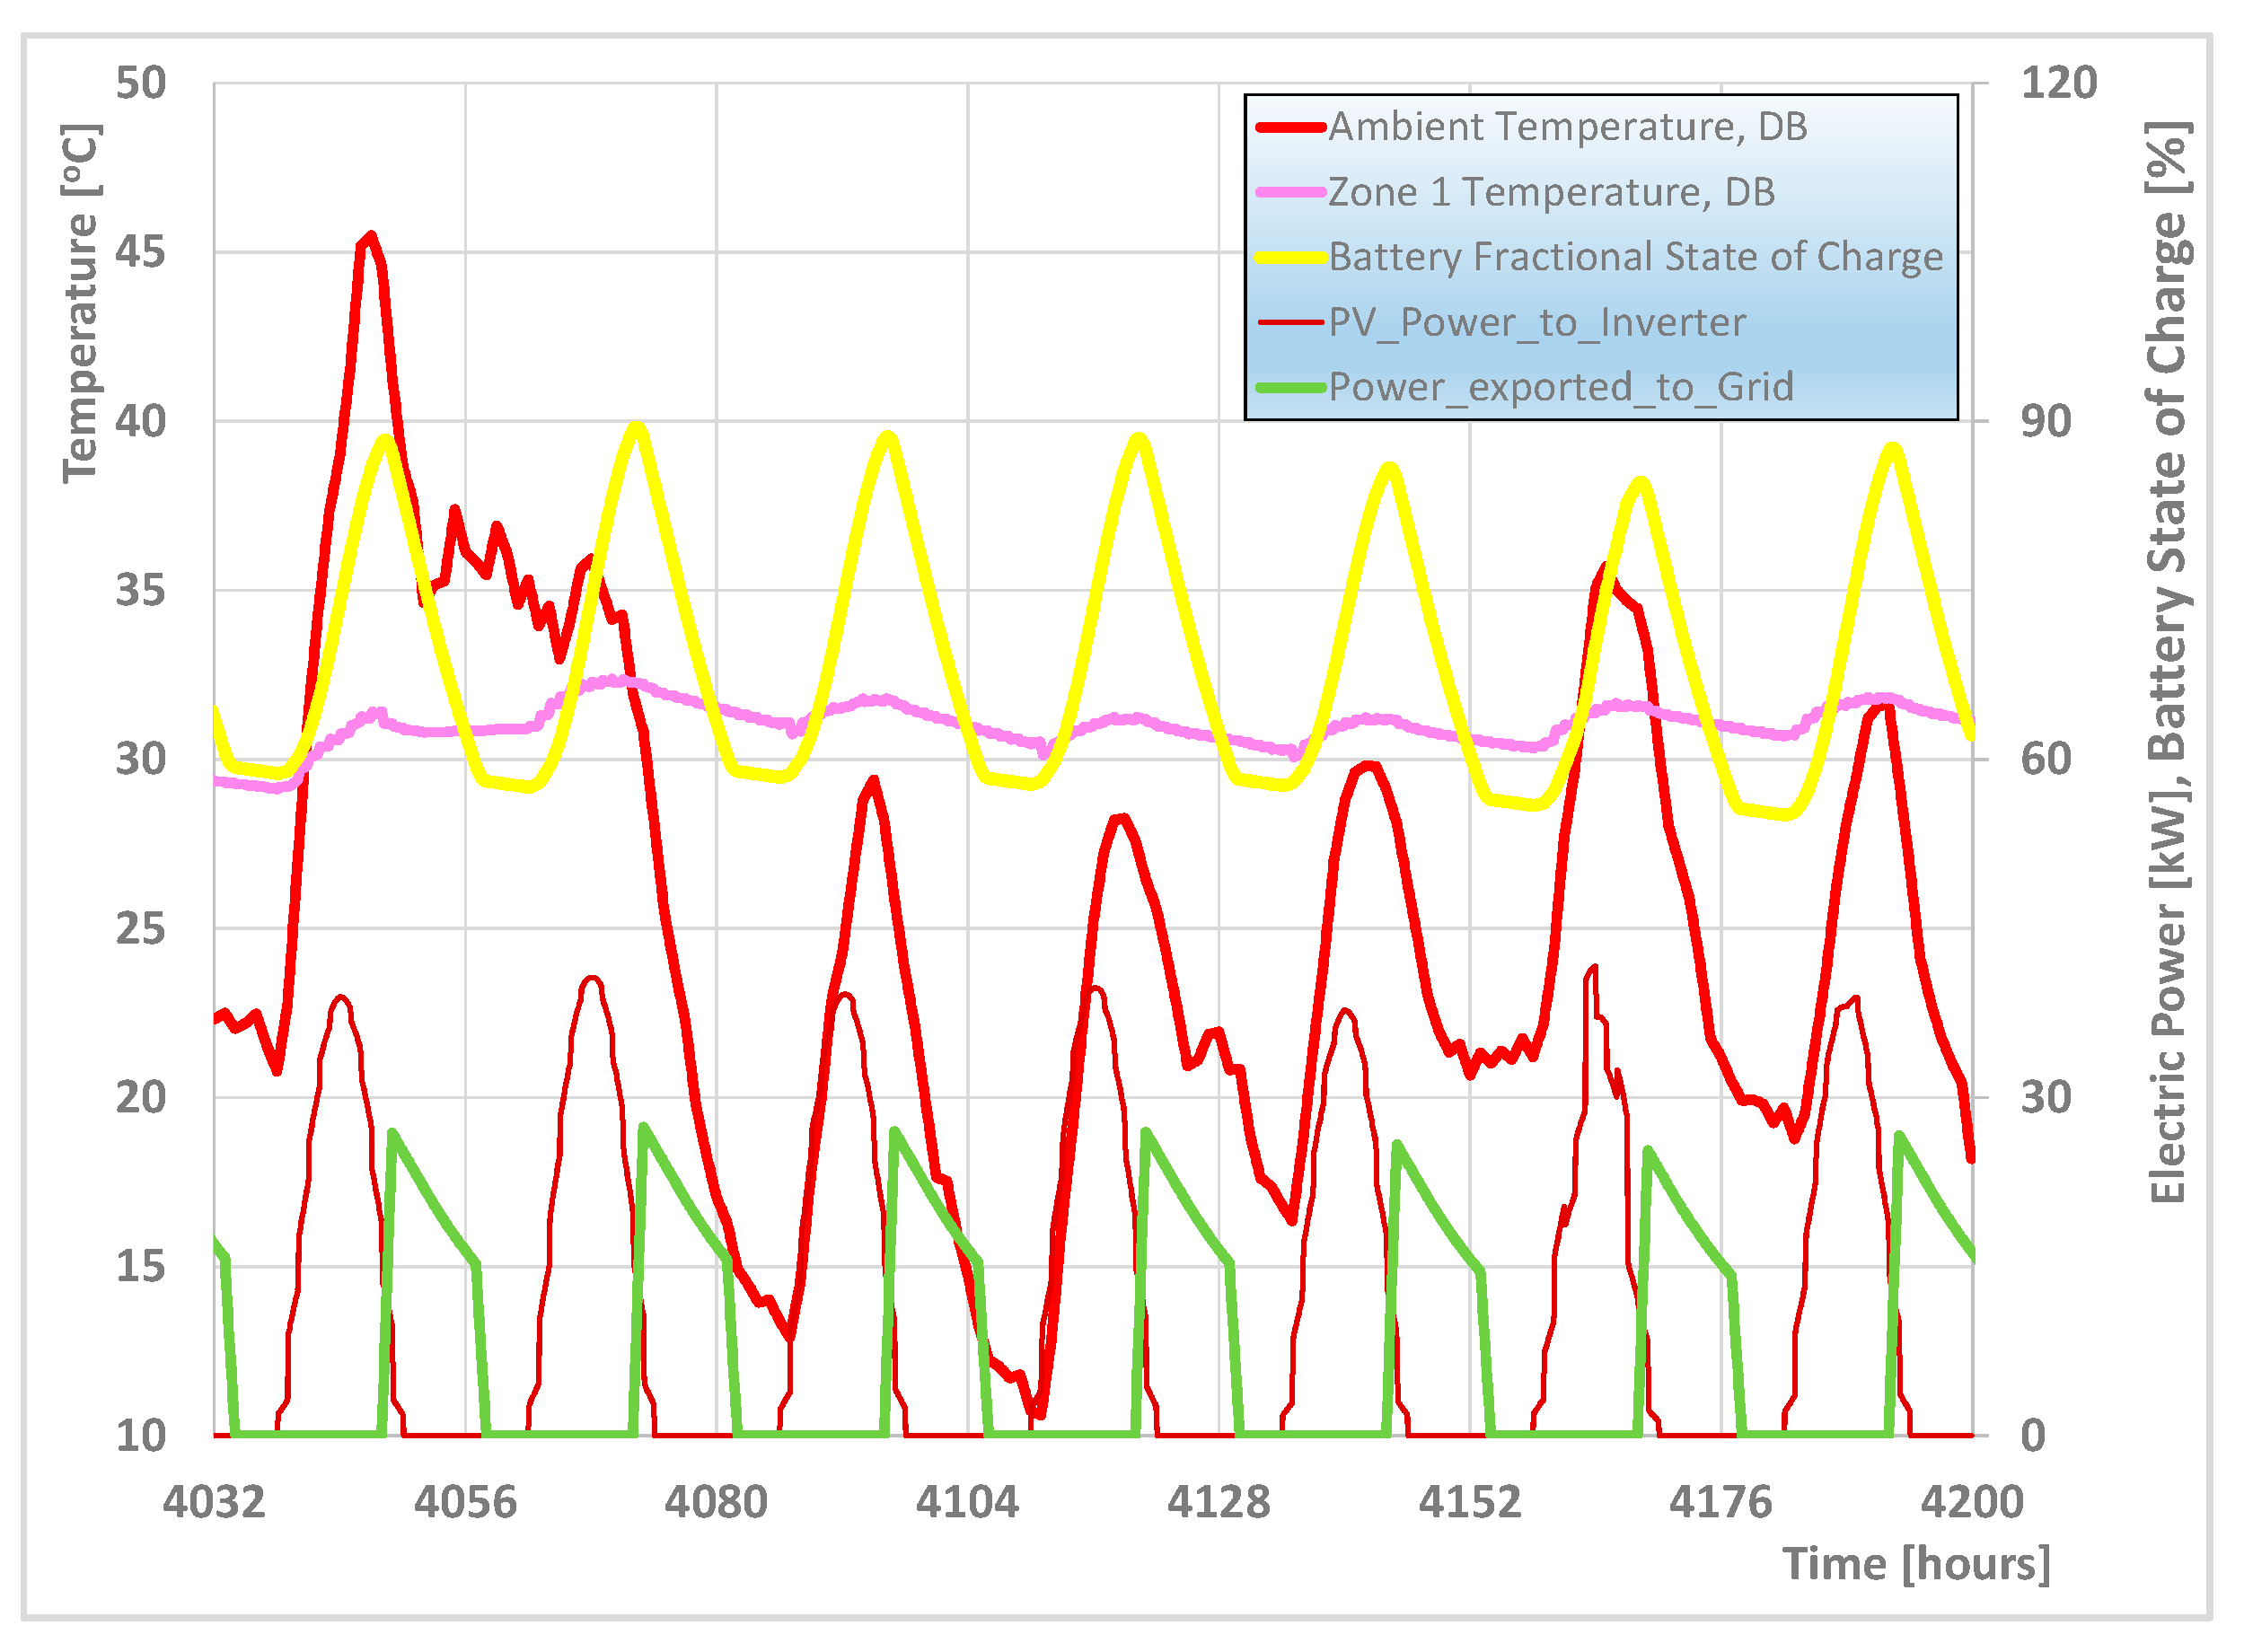
In addition to the Greek system’s demand curve, the part of the load met by traditional power sources, whenever the PV contribution is subtracted, can also be seen. The school’s energy systems’ performance will be significantly different during the heating-neutral and the summer months. To understand these different situations, the hourly variation in the main system’s variables during a week in July is presented in Figure 8. This week is characterized by a heat wave with a duration of two days (Monday and Tuesday).
During the summer, PV production is maximized due to clear skies and the low tilt angle (17.9 degrees) of the PV panels. As a result, the battery SOC is close to 100% most of the time. Thus, power must be exported to the grid at noon almost daily. Since no space cooling exists in the building, the indoor temperatures stay above 30 °C over the whole week. In order to understand the needs of the external grid, the Greek system’s load curve during a week in July 2023 can be seen in Figure 9. The morning peaks of the load curve are quite impressive in this period, reaching up to 10.5 GW. The high PV production of the Greek system during the morning hours and hours around noon save the firing of conventional power sources in order to address the steep morning ramp. Additionally, the building’s internal grid is predicted in Figure 8 to export electricity during the hours around noon. These export quantities are not generally welcome, as explained above, due to grid saturation.
On the other hand, the electricity demand covered by conventional sources remains very high during the late afternoon and evening hours, when a steep load curve must be met. Thus, if the smart grid is able to export electricity from its batteries to the external network during these hours, it would save natural gas, help increase green energy usage and suppress electricity prices.
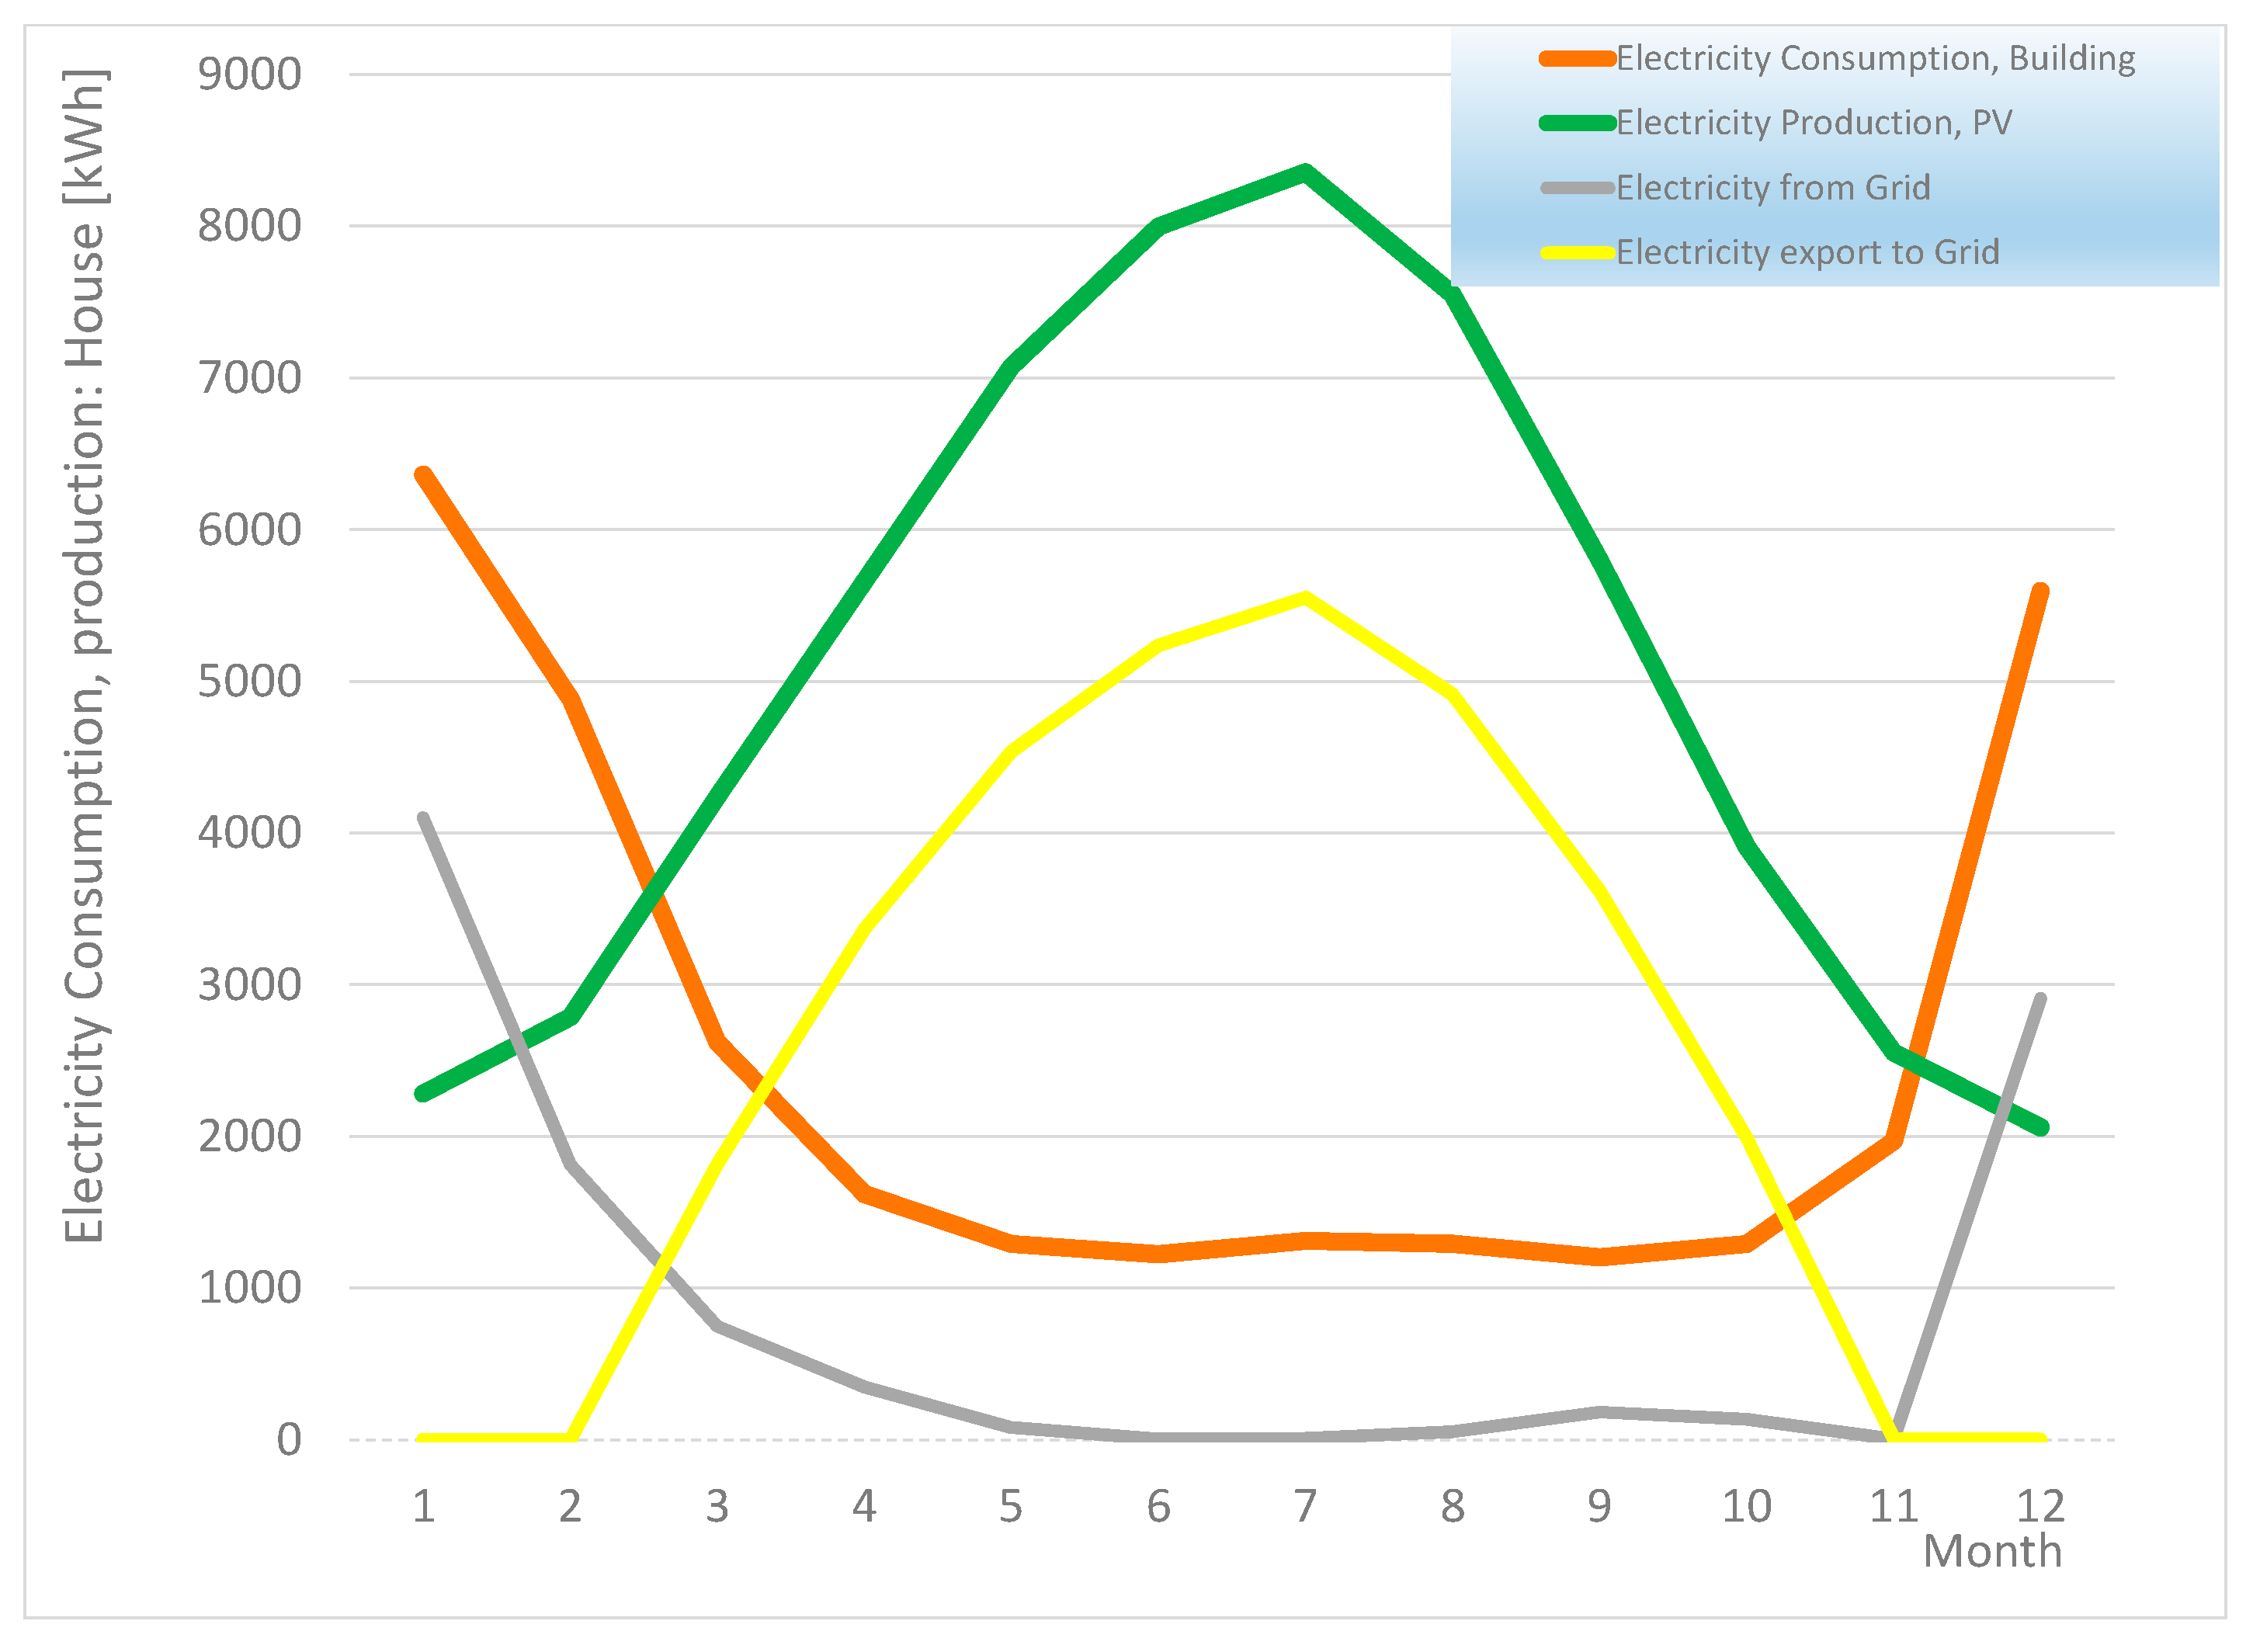
Following an inspection of the transient behavior during the cold and hot seasons of the year, the monthly energy balances of the school building are presented in Figure 10. The PV electricity production is seen to be maximized in July with 8340 kWh. The lowest photovoltaic output is in December with 2050 kWh.
Heat pump consumption (heating-mode only) significantly varies with weather conditions. The heat pump’s total consumption reaches 18,900 kWh. No heat pump consumption is predicted for the six-month period from May to October. The detailed performance of the heat pump is presented in Figure 11. This includes the electrical energy consumption; the heating energy supplied to the buffer tanks and the associated school’s heating system; and the heat pumped from the ambient air.
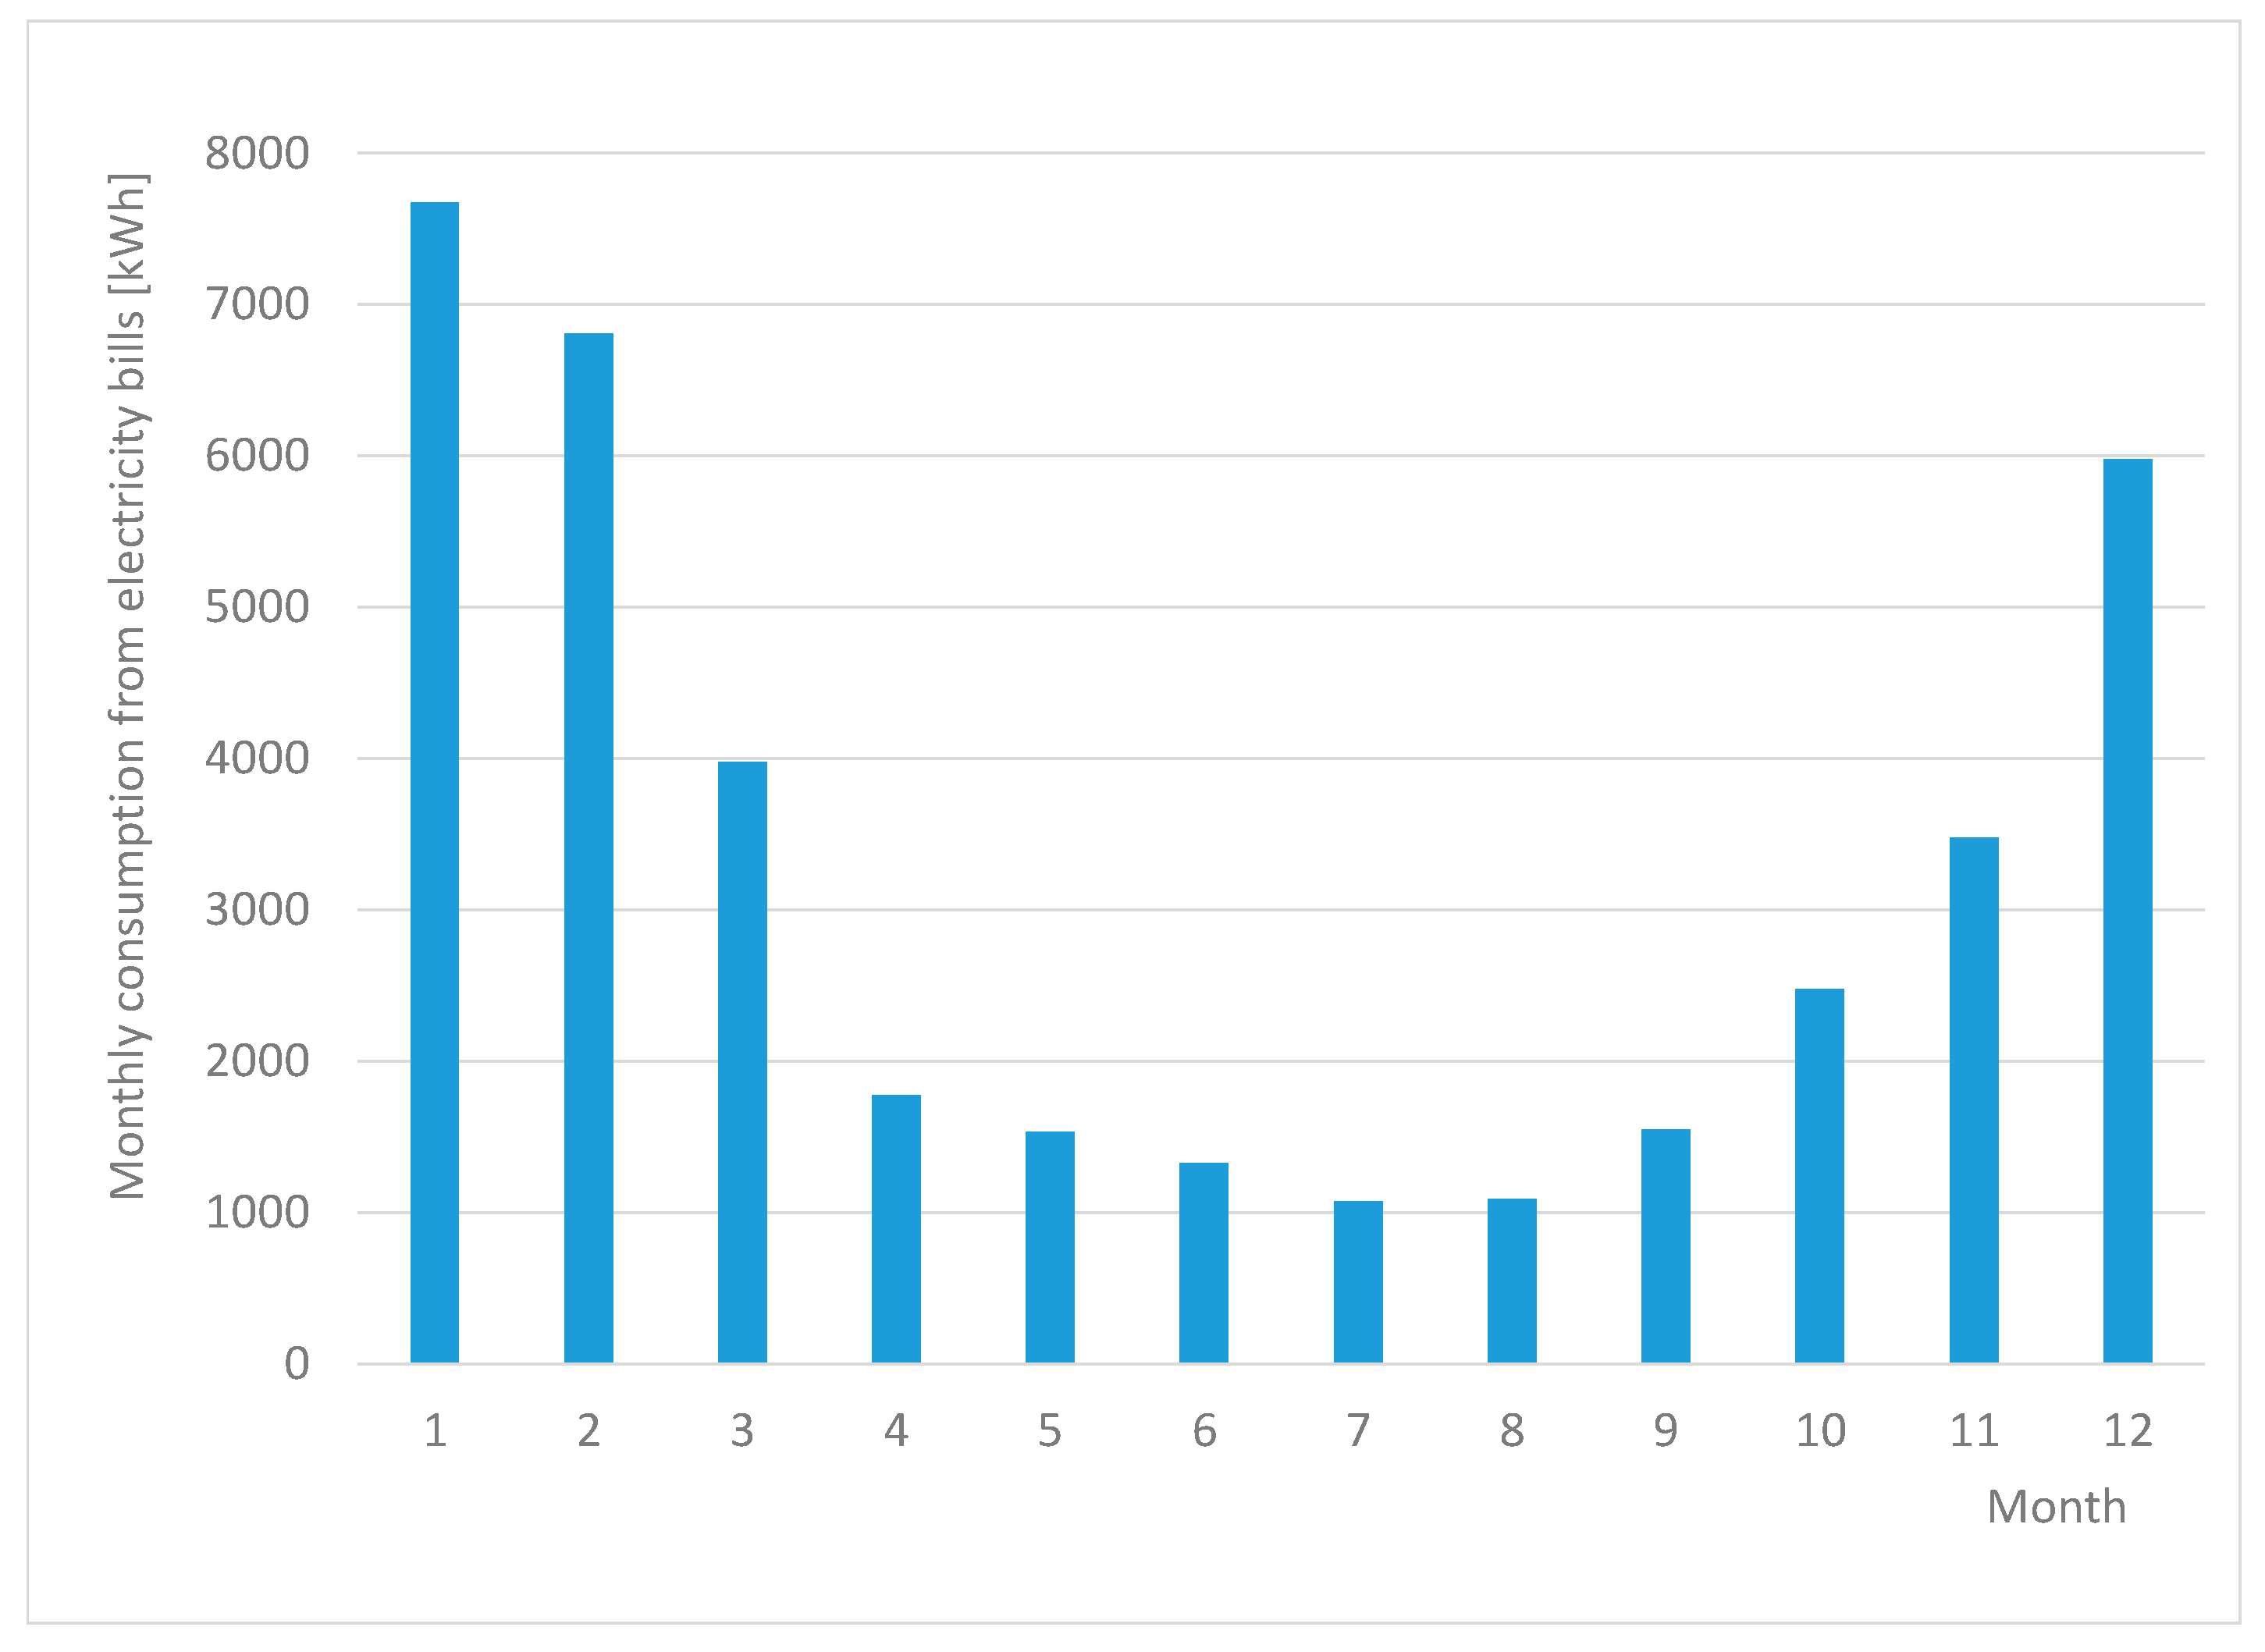
The building’s electricity consumption apart from the heat pump averages to about 1200 kWh per month (Figure 10). The school’s annual consumption is predicted to be 33,900 kWh. For comparison, the respective actual consumption of the school in 2023, as extracted from its monthly electricity bills, is presented in Figure 12. It totals 38,700 kWh. As already mentioned, the high school in its current state of operation is not equipped with any battery storage systems.
The above-mentioned annual electricity consumption corresponds to 45.1 kWh/m2y of primary energy consumption. European legislation specifies 80–90 kWh/m2y of total primary energy consumption for buildings to be designated as nZEBs [31]. The electrical energy output of the PV installation is computed at 60,300 kWh. The building’s annual imports from the grid are 11,800 kWh and its exports are 32,200 kWh. The annual electricity self-production of the high school significantly exceeds its annual consumption. However, the specific periods of power exports will need special attention and will need to be identified in consideration of the respective needs of the external grid.
This situation is presented in Figure 13. Electric power imports frequently occur in late December, January and February. The maximum rate observed reaches 58 kW. The remaining nine months are associated with frequent exports to the grid, at a maximum rate of 42 kW.
Next, it is important to understand the hourly performance of the energy system over one full year. The variation in the batteries’ SoC is critical to optimize the battery size. This situation is presented in Figure 14. At the beginning, the batteries are completely discharged. After recharging rapidly during the first week of January, the battery aggregate is seen to fluctuate with an SOC range of 0.4–0.5 until the end of February. Next, the batteries are charged during March and reach their highest state of charge due to the reduced need of the heat pump for space heating. From April to September, the batteries remain steadily close to their fully charged state due to the high performance of the PV panels and the lack of electricity consumption for the heat pump, since there is no space cooling.
The daily timing of grid imports should be studied in detail as a function of the hour of day. As observed in Figure 15, a significant amount of electrical energy is imported from the grid during December, January and February during the operating hours of the school. As already reported, the maximum power levels reach 55 kW during a few cold, cloudy days.
Next, the daily electricity exports to the grid are mapped in Figure 16 as a function of the hour of day. During January, February and half of March, no electricity would be exported to the grid due to the dispatch logic, because all of the surplus cannot fully charge the batteries. From mid-March onwards, exports are increasingly frequent during the hours around noon on sunny days. From June to September, significant export power levels to the grid are seen nearly every day. The maximum power levels occur in the middle of the day, reaching 40–45 kW. Electricity exports are reduced from October and are negligible from mid-November to the end of the year. The significant electricity quantities exported to the network need to be managed in an optimal way. These remarks will be expanded upon further by studying the optimized system’s performance.
3.2. Battery Storage Capacity and Tank Volume Optimization
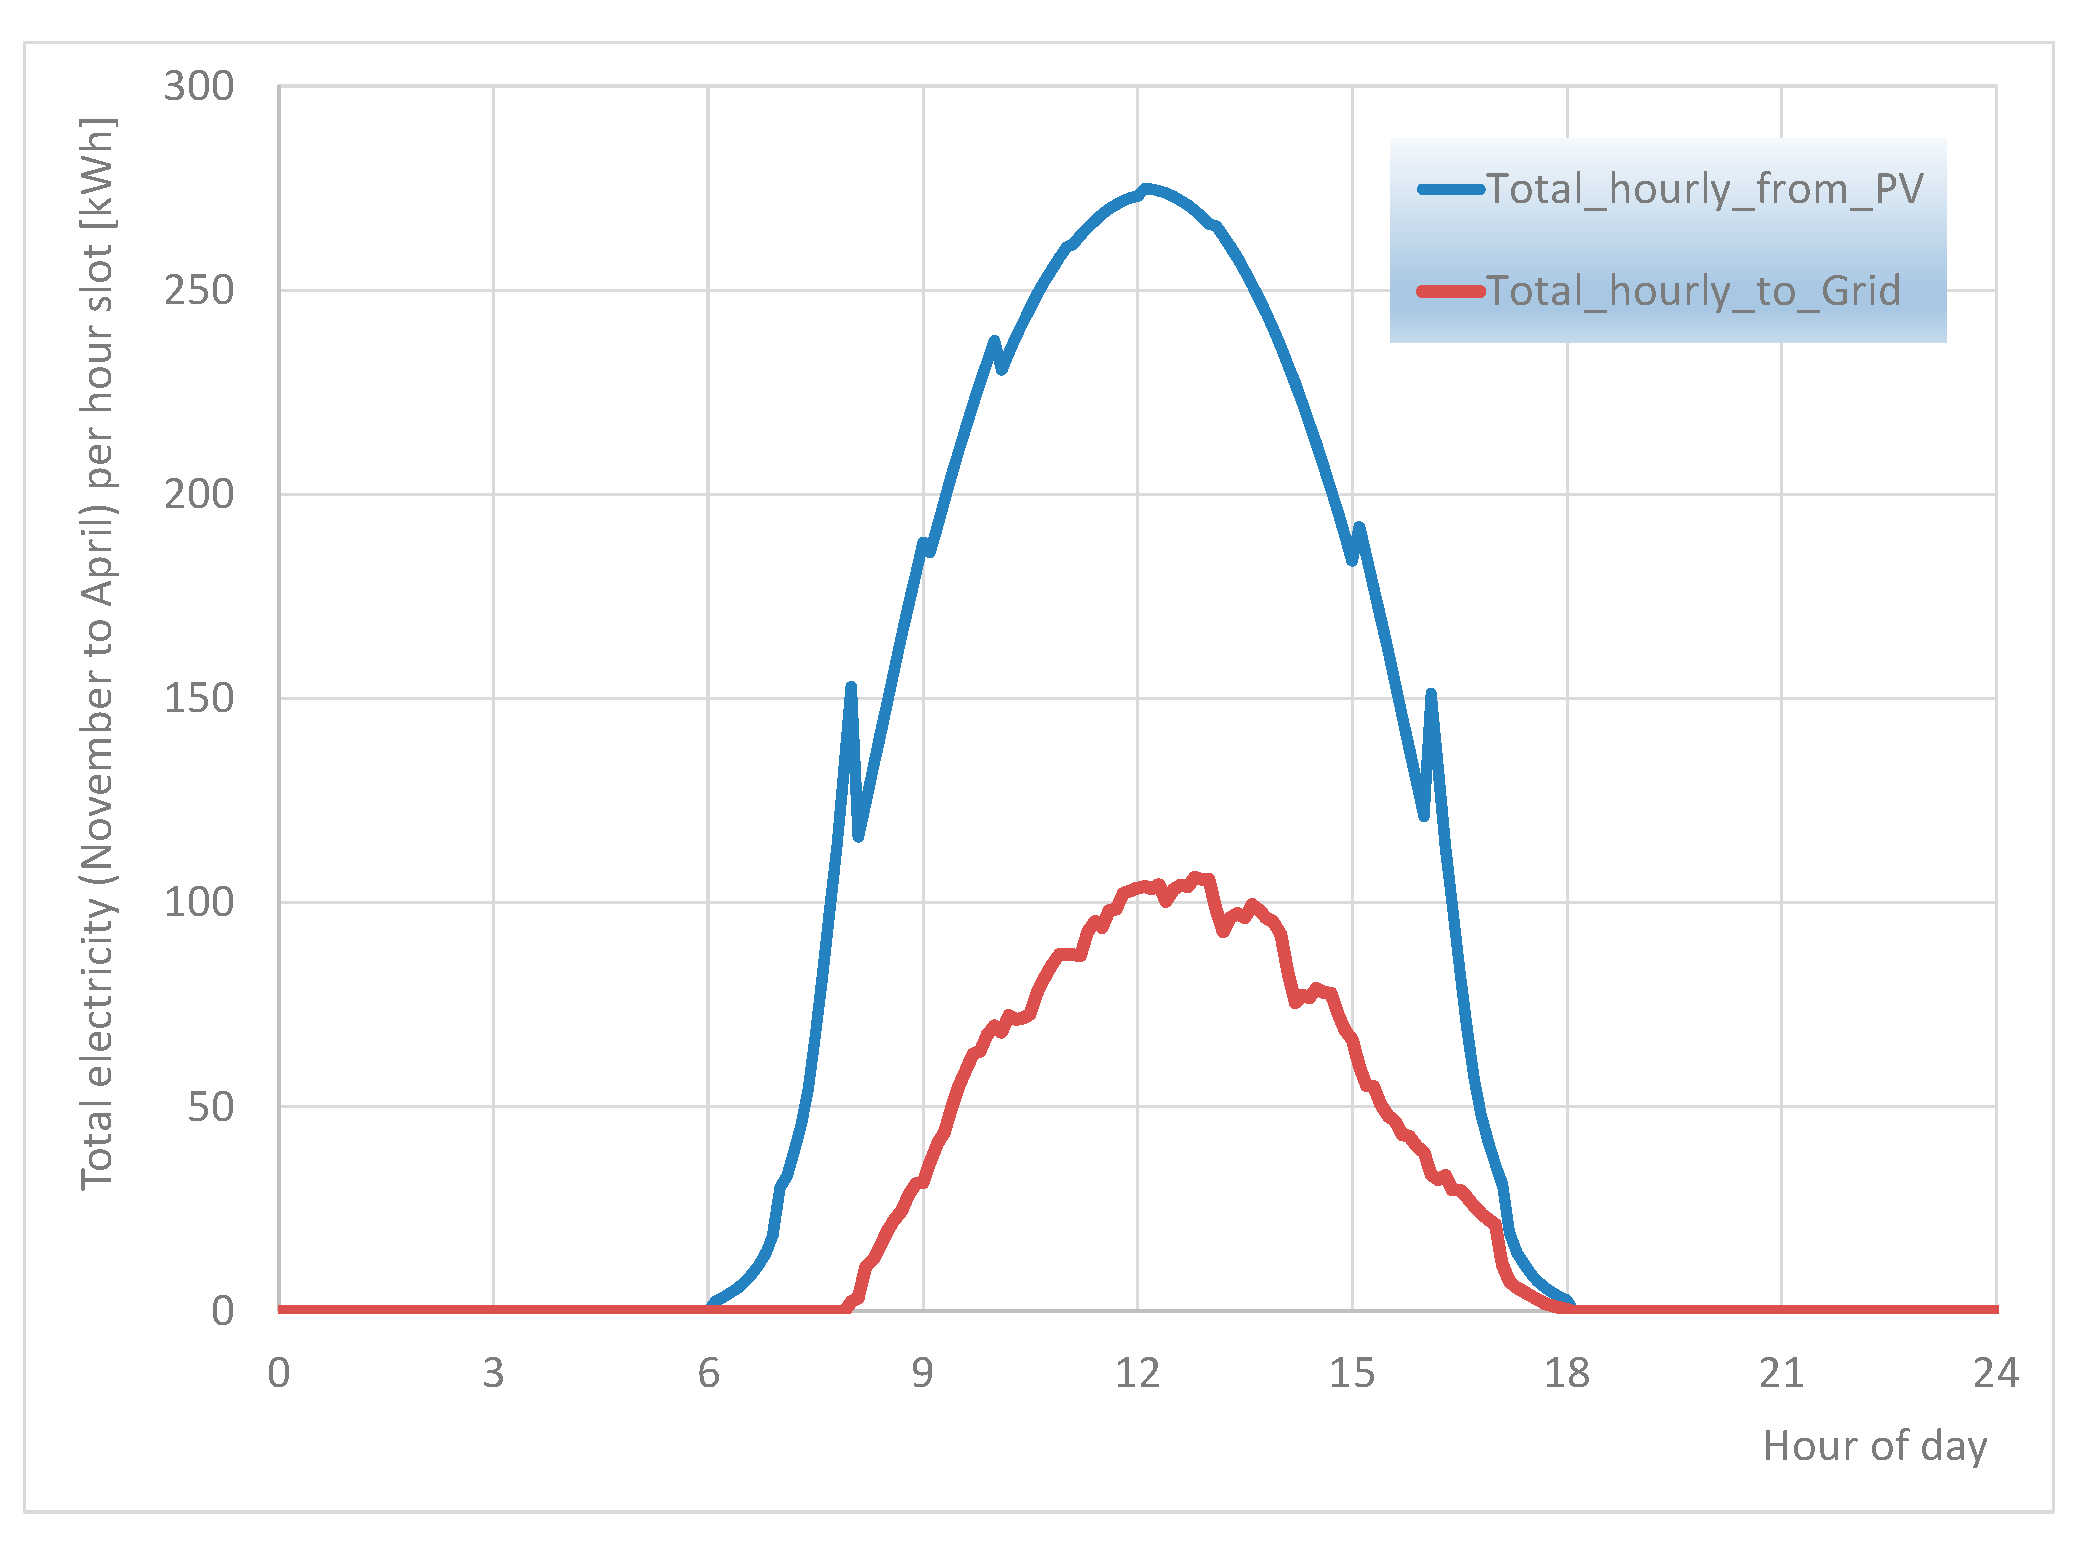
Based on the results of the reference system’s simulation, a statistical distribution of the daily PV production is presented in Figure 17 and Figure 18 for the heating season (November to April) and the heating-free season (May to October), respectively.
During the heating season, the PV production averages 108 kWh/day according to Figure 17. The heating season operation is characterized by a significant number of cloudy days. During these days, the battery capacity must be capable of fulfilling the building’s electricity needs, the majority of which is caused by the operation of the heat pump. On the other hand, a certain quantity of electricity is exported to the grid during sunny days with high temperatures in November, March and April.
During the heating-free season, PV production is high, averaging 221 kWh/day (Figure 18), due to the mostly clear days, the longer duration of sunlight and the very low tilt angle of the PV panels. Moreover, the level of electricity self-consumption is low due to the holiday season and the heat pump not being in operation. Significant quantities are available for export, averaging 165 kWh/day.
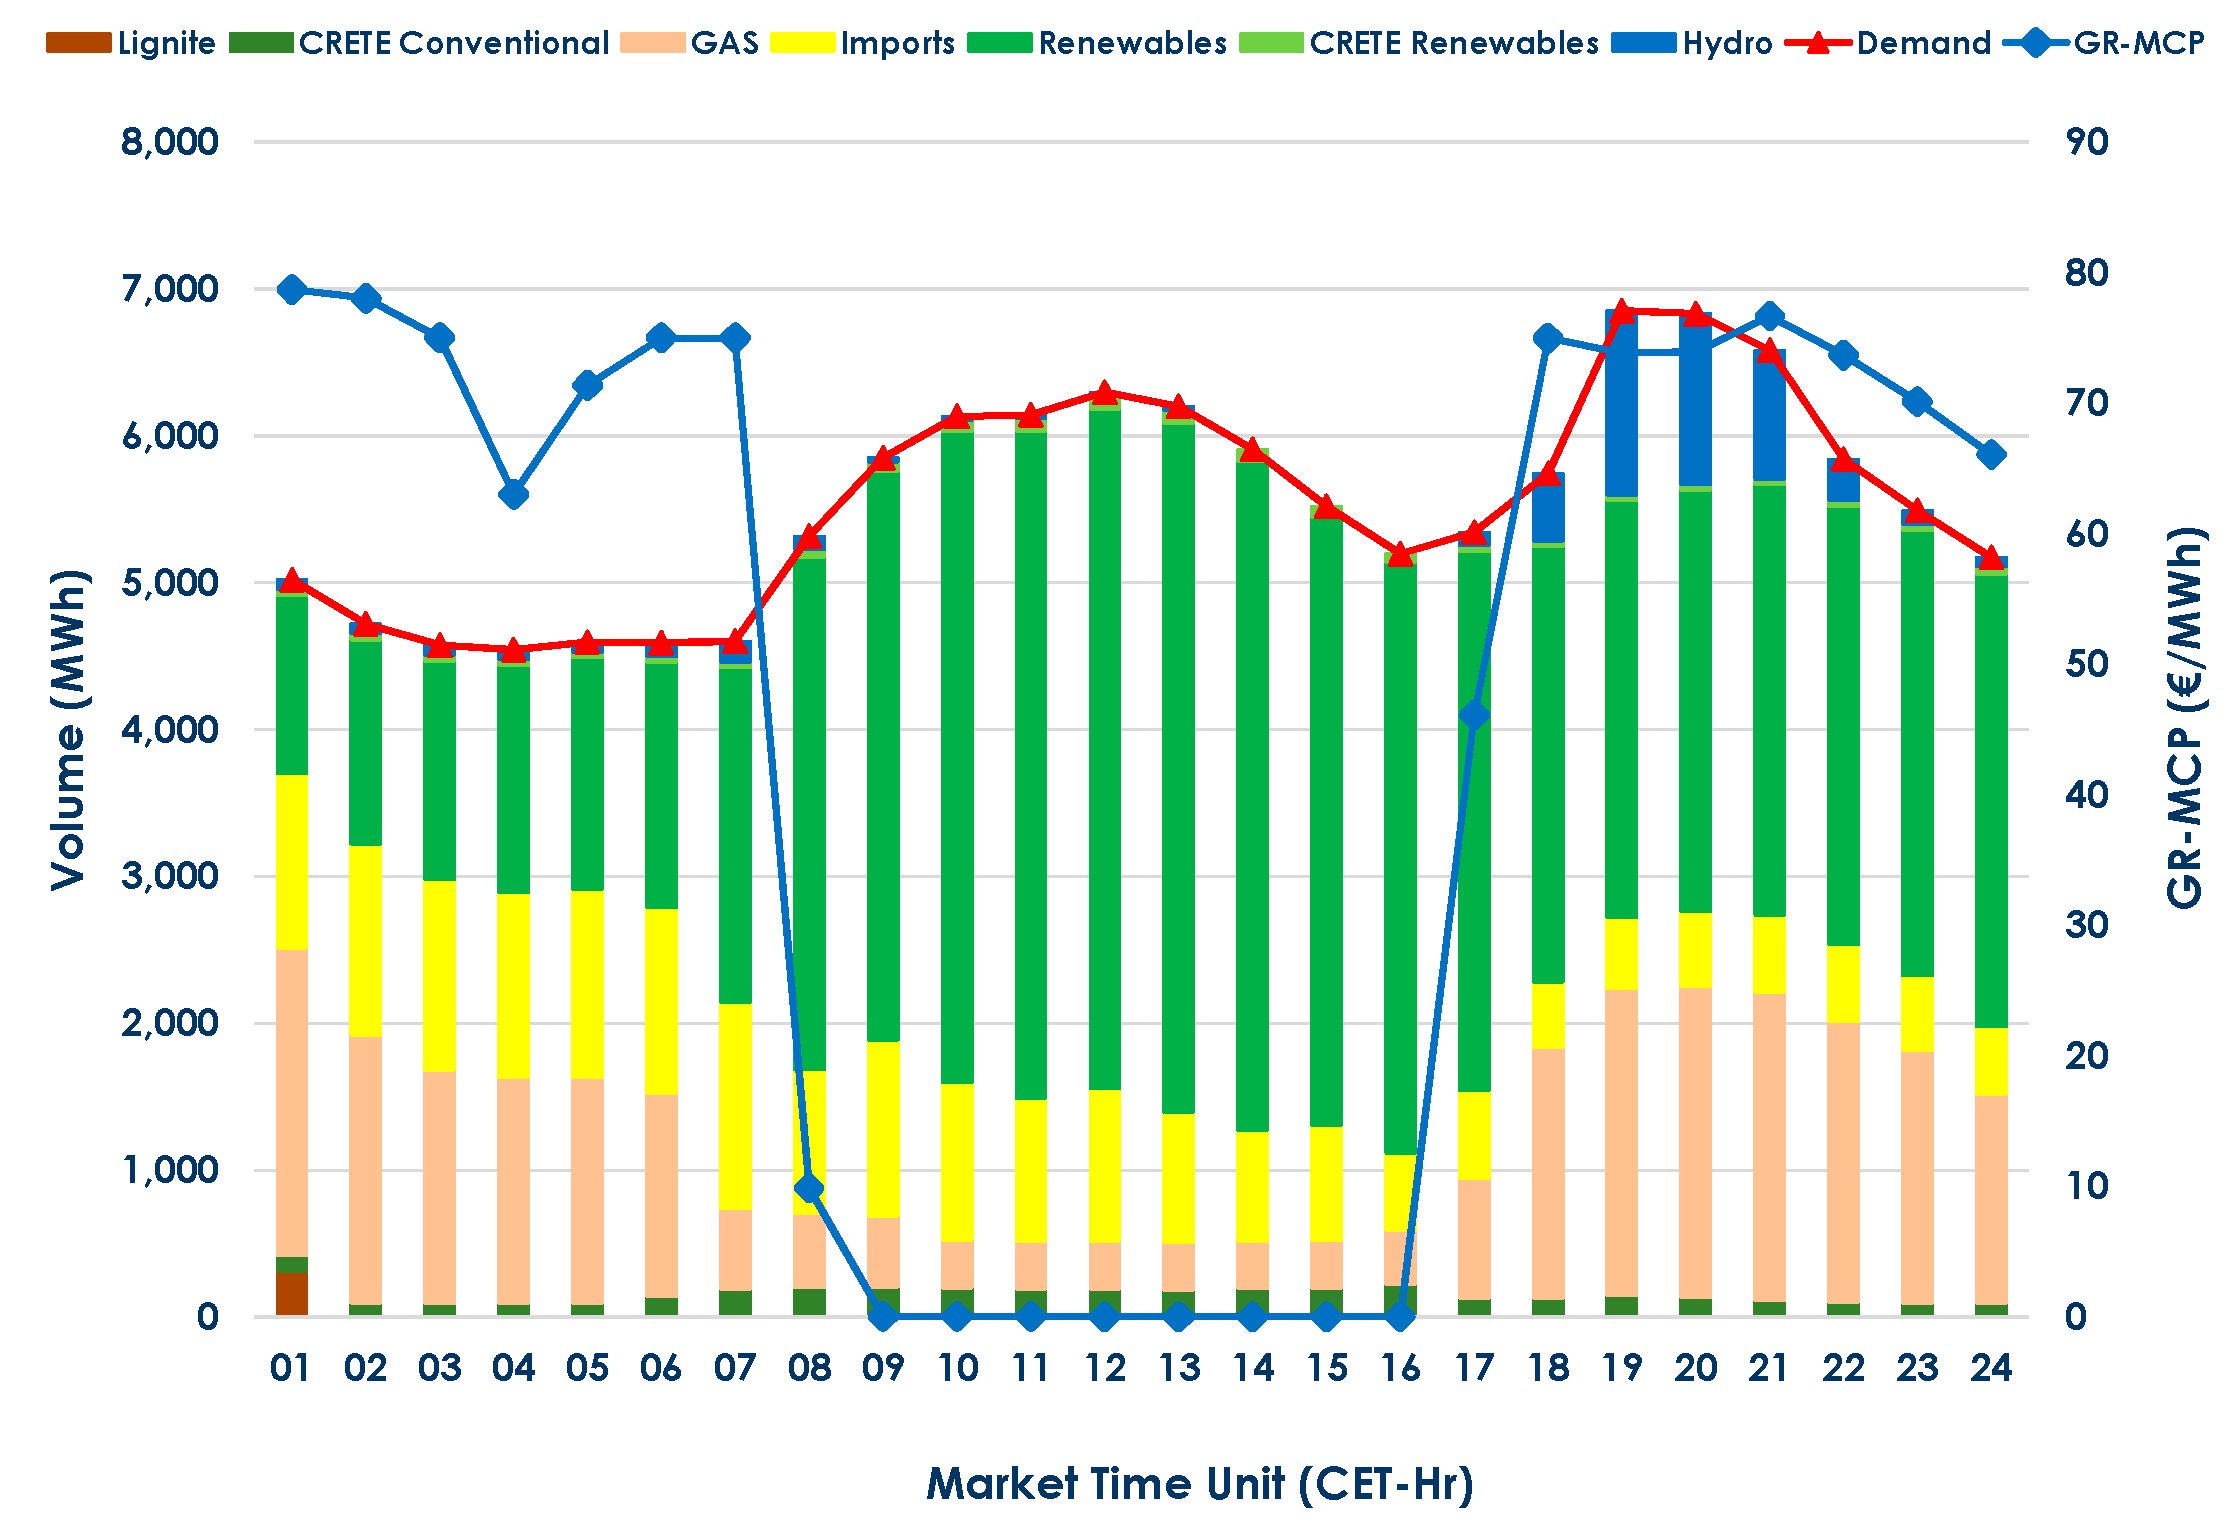
However, as already explained, the specific time interval when large quantities of electricity are available for export is not suitable for the system’s operator. The reason is that there is usually plenty of electricity being offered during this period of the day, especially from renewables. This is mirrored in the very low prices on specific days in day-ahead electricity auctions. An example is presented in Figure 19, in which the day-ahead auction for a specific day resulted in zero wholesale electricity prices between the hours of 09:00 and 16:00. On the other hand, there exists another time slot when exports to the grid are mostly favorable to the network. Electricity exports to the grid during this time slot, which is between 17:00 and 01:00, need to be significantly delayed against the time slot of maximum PV electricity production, which is centered around noon, as seen in Figure 18. Thus, it is a critical requirement for the battery capacity to be capable of time shifting this slot for about 8 h during the summer. Under these circumstances, the electricity might be permitted to be exported to the grid. With a safe margin for a battery that is 100% full and an Socmin of 30%, a total battery capacity of about three times the above-mentioned average photovoltaic production of 221 kWh would be necessary. On the other hand, the battery capacity should be large enough in order to not be filled to a capacity over 90% on days with very high insolation during the summer. This is because the electricity surplus must be dumped in these cases, since exporting to the grid is not permitted during the hours around noon. Based on these remarks and according to our reasoning, the battery capacity needs to be increased to the order of 600 kWh.
Shifting our attention now to the optimal sizing of the storage tanks, Figure 20 presents the statistical distribution of the daily heat pumps’ loads during the heating season. In order to avoid the heat pumps being operated on days with very low outdoor temperatures, the storage tanks must have the capacity to supply the maximum heating load for at least 12 h without the heat pumps needing to switch on.
Since the 95% maximum daily heating load is of the order of 604 kWh, a storage tank volume of 13 m3, initially at 60 °C, would drop to 40 °C by supplying half the above maximum daily heating energy, , to the hydronic network of the building as shown below:
This storage tank capacity level would allow the heat pump to limit its operation over several hours with temperatures below zero. This results in an increase in the average COP and a subsequent reduction in annual electricity consumption.
Based on the above reasoning, the optimization of the battery capacity and the storage tanks’ capacity was based on a significant number of building simulations and resulted in the following optimal values for the optimization parameters presented in Table 2:
- Battery capacity: 600 kWh.
- Storage tanks’ capacity = 13 m3
The interaction between the electricity and thermal storage variables is implicitly taken into account in the manual optimization process. This is seen, for example, by the fact that the optimal value of thermal storage in Table 3 results in a reduced level of annual heat pump electricity consumption. This, in turn, affects (increases) the optimal value for electricity storage. Further, SOC cycling can decrease further to a minimum value of 0.30, which is the lowest permissible in regards to limiting the battery’s degradation, based on vast studies of electric vehicle Li-ion batteries tested for degradation performing vehicle-to-grid services [57]. A new building is now designed, after modifying the above system’s parameters to their optimized values. The results of the most important performance indices are compared in Table 3.
The optimized building’s annual electricity consumption is now reduced to 30,700 kWh (Table 3), due to the improved performance of the heat pump. The total annual PV output is predicted to be 60,300 kWh. The building with the optimized energy system would import 10,100 kWh and export 31,000 kWh annually. The monthly energy balances of the optimized system are shown in Figure 21.
Overall, Figure 21 shows the significant exports to the grid taking place from March to October. They are maximized from June to September, matching the maximum demand of the Greek network.
Exports to the grid occur in the revised system during the evening hours, as required by the external grid operator. This can be clearly observed in Figure 22 for all the days of the week. The battery SOC fluctuates daily between a maximum of 90% and a minimum of 50% during the week. This is due to the large amount of sunshine, the favourable PV panel tilt angle and the reduced electricity consumption of the school due to the summer holidays. As explained above, the large storage tank volume of 13 m3 results in quite a significant reduction in cycling for the heat pumps. This is clearly observable during the heating system’s operation in the second week of January (Figure 23). The heat pump operated with significantly less frequent cycling during the same week than the initial system with the 2 m3 storage tanks, as can be seen in Figure 7.
Further, it is useful to explore the hourly evolution of energy exports during the full year and compare this with that of the Greek system during the evening ramp.
3.3. Cumulative Distributions of Grid Interaction
The hourly distribution of the power levels imported and exported to the grid are examined next in Figure 24. These are presented as a function of the day for the cold season. The integration of the annual electricity imported and exported to the grid for each time slot during the six months from November to April can be seen in Figure 24. The total amount of energy exported to the grid per hour for this six-month period reaches a maximum of 63 kWh in the 17:00–18:00 time slot. On the other hand, the total hourly electricity imports are maximized to 150 kWh in the 08:00–09:00 time interval.
The annual behavior of the optimized system is better understood by looking at the graph in Figure 25. As already reported, no imports from the grid are observed during this period.
A comparison of the results in Figure 25 with the respective results of the initial system in Figure 16 clearly shows the complete shift in the electricity export hour slot to the evening zone, as required by the system’s operator. An alternative view of the behavior of the optimized system’s batteries can be seen in the comparison of the battery SOC variation over the course of one full year (Figure 26). As already reported, at the beginning, the batteries are completely discharged in both cases.
After rapidly recharging during the first week of January, the battery aggregate is seen to fluctuate with an Soc range of 0.4–0.5 until the end of February. Next, the batteries are charged during March and reach their highest state of charge, due to the reduced consumption of the heat pump for space heating. From April to October, the batteries remain close to their fully charged state due to the high performance of the PV panels and the lack of electricity consumption for the heat pump, since there is no space cooling. Last but not least, the NPV of the additional investment for the battery pack (Equation (7)) is close to zero, if one considers a cost of about 90,000 USD for the battery and a positive cash flow of about 0.2 USD per kWh produced by the rooftop PV installation. Thus, this battery size begins to become economically viable in this special case. The results of similar studies confirm that a battery capacity setting of 12 kWh/kWp is reasonable for the operation of this type of system with a delayed export to the grid. Regarding the 0.11 m3 total storage tank volume per kW nominal heating rate of the heat pumps, this is judged to be reasonable for air source heat pump installations, based on the experience of other researchers. According to the electricity bills and the simulation results, the high school building, without PV panels and batteries, must purchase 35,000–40,000 kWh of electricity annually. The situation does not change considering the current state of the building with the PV panels but without the battery storage. That is, the PV installation is left open-circuit and produces no electricity; an investment worth 200,000 USD stays disconnected. As explained above, this situation would be radically changed with the installation of the battery, since the school would negate its electricity bill and additionally gain money from selling an annual surplus of almost 20,000 kWh to the external grid operator.
The proposed solution forms an alternative path to further increase the penetration of renewables in saturated networks in Greece. This would further reduce the significant quantities of natural gas consumed during the evening ramp of the Greek electricity system and reduce electricity prices, which suffer from instabilities in the natural gas markets. However, it should be noted that design guidelines for storage should be particular to buildings’ typologies (e.g., multi-story office buildings, traditional low-rise school buildings, etc), year-round electricity demand profiles (the use of compressor cooling, etc.) and rooftop PV installation capacities. That is, optimal electricity storage depends on the seasonal evolution of the electricity surplus of the specific building in question. In addition, optimal thermal storage is affected by a building’s specific climatic conditions, as seen in the context of Figure 20. Thus, any expansions or potential applications of the results of this study to different building and use typologies must take into account the combined effect of load profiles against electricity self-production and prevailing climatic conditions.
4. Conclusions
An electricity and heat storage optimization study was carried out for a renovated high school building with a 50 kWp rooftop PV installation. Initially, the system lacked a battery storage system, which resulted in the rejection of its license to export its electricity surplus to the network. First, the system’s performance was simulated by TRNSYS, with a battery storage capacity initially assumed to be supplied by Li-ion batteries. Its thermal storage capacity is furnished by thermal storage tanks, initially sized at 2 m3. A favorable timing of the optimized system’s exports is sought for the months from March to October, when an electricity surplus exists. This is determined by studying the demand curves of the Greek system during specific seasons. The proposed approach involves a shift to the export of its photovoltaic electricity surplus to the evening hours. To this end, the optimal battery size was selected by employing a building energy simulation. Additionally, the optimal sizing of the thermal energy storage of the heating system is studied to further improve its energy efficiency. Our battery and storage tank size optimization study showed an adequate battery capacity could be obtained with the installation of 12 kWh/kWp photovoltaic panels. The ever-decreasing cost of battery installations results in the net present value of the additional investment for the battery installation to approach zero. Currently, the high school’s administration is obliged to purchase 35,000–40,000 kWh of electricity annually. No profit is incurred by the significant investment of 200,000 USD for the installation of the rooftop PV panels. This is because the PV installation is left open-circuit and produces no electricity. As suggested by the simulation results, this situation would significantly improve with the installation of a battery. In this case, the high school’s administration is expected to negate its electricity bill and additionally gain money from selling an annual surplus of almost 20,000 kWh to the external grid. The solution proposed forms an alternative path to further increase the penetration of renewables in saturated networks in Greece. The proposed change in policy measures allowing for the expansion of rooftop PV installations in public buildings would further reduce the significant quantities of natural gas consumed during the evening ramp of the Greek electricity system and reduce electricity prices, which suffer from instabilities in the natural gas markets.
Author Contributions
Conceptualization, E.R. and A.-M.S.; methodology, E.R. and A.-M.S.; software, O.Z.; validation, O.Z and E.R.; writing—original draft preparation, O.Z.; writing—review and editing, A.-M.S.; project administration, O.Z. and E.R. All authors have read and agreed to the published version of the manuscript.
Funding
This research received no external funding.
Data Availability Statement
Data are contained within the article.
Acknowledgments
The authors would like to thank George Karavides (Karavides and Associates Company, Larissa) and the Technical Works Department of the Municipality of Tempi, Larissa, Greece for providing access to the building and project data, as well as for their useful discussions of the project.
Conflicts of Interest
The authors declare no conflicts of interest.
Appendix A
The following data on the location, climate and building envelope characteristics are cited: Gonnoi is a small town in the southern exit of the Tempi valley (latitude 39.86270°, longitude 22.46975°, 111 m height). It has a temperate climate, with average temperatures ranging between 7 and 8 °C in winter months and 28 and 29 °C in mid-summer. Annual precipitation stays close to 500 mm. Available data cover the period of March 2019—today, recorded from an in situ meteorological station. The typical meteorological year for the specific location was constructed based on the specific data set, using the algorithms included in TRNSYS (Type 54a).

Table A1.
Building shell insulation data (U-values).
| Shell Type | Layers | U (W/m2K) |
|---|---|---|
| Roof insulation | Reinforced concrete slab, extruded polystyrene | 0.289 |
| Concrete column | Reinforced concrete, extruded polystyrene | 0.324 |
| Outside wall | Ceramic brick, extruded polystyrene, ceramic brick | 0.349 |
| Floor (slab on ground) | Reinforced concrete slab | 3.27 |
The building shell insulation data are summarized in Table A1. It has double-glazed windows with U = 3.27–3.50 W/m2K and g = 0.702 (solar heat gain coefficient). The average window/wall ratio is 0.25. Shading is applied to the vertical openings. Adequate ventilation is afforded by manually opening the windows at prescribed intervals. The employee’s working hours are 8:00–17:00 on weekdays and 09:00–14:00 on Saturdays for specific activities. It has high-efficiency LED lighting with a peak electric power consumption of 5 W/m2.
Table A2.
MHC-V30W/D2RN8 Air-to-water heat pump: Heating capacity as function of the outdoor temperature (ODT) and the leaving water temperature (LWT) for heating-only mode.
Table A2.
MHC-V30W/D2RN8 Air-to-water heat pump: Heating capacity as function of the outdoor temperature (ODT) and the leaving water temperature (LWT) for heating-only mode.
| ODT\LWT (C) | 30 | 35 | 40 | 45 | 50 | 55 | 60 |
|---|---|---|---|---|---|---|---|
| −15 | 19,103 | 17,595 | 14,915 | 12,050 | 11,845 | ||
| −7 | 23,940 | 23,261 | 22,977 | 22,659 | 21,508 | 16,540 | 12,228 |
| −2 | 25,011 | 24,851 | 25,138 | 25,427 | 23,246 | 19,934 | 17,952 |
| 2 | 24,994 | 26,021 | 25,959 | 28,191 | 26,388 | 24,651 | 23,085 |
| 7 | 31,177 | 31,754 | 30,825 | 30,992 | 31,077 | 30,563 | 27,332 |
| 15 | 31,835 | 32,695 | 34,334 | 36,014 | 34,020 | 32,585 | 27,197 |
Table A3.
MHC-V30W/D2RN8 Air-to-water heat pumps: Power input as function of the outdoor temperature and the leaving water temperature for heating-only mode.
Table A3.
MHC-V30W/D2RN8 Air-to-water heat pumps: Power input as function of the outdoor temperature and the leaving water temperature for heating-only mode.
| ODT\LWT (C) | 30 | 35 | 40 | 45 | 50 | 55 | 60 |
|---|---|---|---|---|---|---|---|
| −15 | 8078 | 8523 | 9884 | 11,295 | 11,459 | ||
| −7 | 9425 | 9927 | 10,735 | 11,561 | 11,943 | 13,786 | 11,043 |
| −2 | 9301 | 9795 | 10,846 | 11,928 | 12,272 | 12,793 | 12,818 |
| 2 | 8075 | 9085 | 10,220 | 12,317 | 11,998 | 12,493 | 11,821 |
| 7 | 8100 | 9509 | 9810 | 11,268 | 12,097 | 13,819 | 12,943 |
| 15 | 7396 | 8637 | 10,108 | 11,636 | 11,332 | 11,237 | 9762 |
Figure A1.
Map of the MHC-V30W/D2RN8 Air-to-water heat pump’s COP as function of the ambient temperature and the leaving water temperature.
Figure A1.
Map of the MHC-V30W/D2RN8 Air-to-water heat pump’s COP as function of the ambient temperature and the leaving water temperature.

The most important technical specifications of the PV panels employed in this study are listed in Table A4 (from the manufacturer’s datasheet). These data are used to tune the model of PV panel operation, which is based on the reconstruction of the photovoltaic panel’s voltage–current curves.
Table A4.
Technical data of the 535 Wp mono-crystalline silicon, 144 half-cell PV panels (JA Solar, JAM72S30-535) [37] as used in TRNSYS type 194.
Table A4.
Technical data of the 535 Wp mono-crystalline silicon, 144 half-cell PV panels (JA Solar, JAM72S30-535) [37] as used in TRNSYS type 194.
| PV Module Parameter | Value | Comments |
|---|---|---|
| ISC at STC | 13.79 A | Short circuit current |
| VOC at STC | 49.45 V | Open circuit voltage |
| IMPP at STC | 12.90 A | Current at max power point |
| VMPP at STC | 41.47 V | Voltage at max power point |
| Temp. coefficient of ISC (STC) | +0.045%/K | αISC |
| Temp. coefficient of VOC (STC) | −0.275%/K | βVOC |
| Number of cells wired in series | 6 strings × 24 mod. | |
| Module temperature at NOCT | 318 K | |
| Ambient temperature at NOCT | 293 K | |
| Module area | 2.58 m2 | |
| Module efficiency | 20.7% |
References
- IEA. Greece 2023. Energy Policy Review; IEA: Paris, France, 2023. Available online: https://www.iea.org/reports/greece-2023 (accessed on 10 March 2024).
- ODYSSEE-MURE Project Databases: Greece|Energy Profile, March 2021, in Energy Efficiency Trends and Policies. European Union. 2021. Available online: https://www.odyssee-mure.eu/publications/efficiency-trends-policies-profiles/greece.html (accessed on 10 March 2024).
- Alaifan, B.; Azar, E. Potential for Net-Zero Energy Communities in Kuwait: An Empirical Techno-Economic Modeling and Optimization Approach. Buildings 2023, 13, 2096. [Google Scholar] [CrossRef]
- García Vera, Y.E.; Dufo-López, R.; Bernal-Agustín, J.L. Energy Management in Microgrids with Renewable Energy Sources: A Literature Review. Appl. Sci. 2019, 9, 3854. [Google Scholar] [CrossRef]
- Simonazzi, M.; Delmonte, N.; Cova, P.; Menozzi, R. Models for MATLAB Simulation of a University Campus Micro-Grid. Energies 2023, 16, 5884. [Google Scholar] [CrossRef]
- Stamatellos, G.; Stamatellou, A.-M. Stamatellou The Interaction between Short- and Long-Term Energy Storage in an nZEB Office Building. Energies 2024, 17, 1441. [Google Scholar] [CrossRef]
- Keiner, D.; Ram, M.; Barbosa, L.D.S.N.S.; Bogdanov, D.; Breyer, C. Cost optimal self-consumption of PV prosumers with stationary batteries, heat pumps, thermal energy storage and electric vehicles across the world up to 2050. Sol. Energy 2019, 185, 406–423. [Google Scholar] [CrossRef]
- Kumar, P.; Malik, N.; Garg, A. Comparative analysis of Solar—Battery storage sizing in net metering and zero export systems. Energy Sustain. Dev. 2022, 69, 41–50. [Google Scholar] [CrossRef]
- Abdolmaleki, L.; Berardi, U. Dynamic simulation of a hydrogen-fueled system for zero-energy buildings using TRNSYS software. E3S Web Conf. 2023, 396, 04005. [Google Scholar] [CrossRef]
- Subramani, G.; Ramachandaramurthy, V.K.; Padmanaban, S.; Mihet-Popa, L.; Blaabjerg, F.; Guerrero, J.M. Grid-Tied Photovoltaic and Battery Storage Systems with Malaysian Electricity Tariff—A Review on Maximum Demand Shaving. Energies 2017, 10, 1884. [Google Scholar] [CrossRef]
- Sarbu, I.; Sebarchievici, C. A Comprehensive Review of Thermal Energy Storage. Sustainability 2018, 10, 191. [Google Scholar] [CrossRef]
- Hauer, A. Storage Technology Issues and Opportunities, International Low-Carbon Energy Technology Platform. In Proceedings of the Strategic and Cross-Cutting Workshop “Energy Storage—Issues and Opportunities”, Paris, France, 15 February 2011. [Google Scholar]
- Chavan, S.; Rudrapati, R.; Manickam, S. A comprehensive review on current advances of thermal enegy storage and its applications. Alex. Eng. J. 2022, 61, 5455. [Google Scholar] [CrossRef]
- Mazzeo, D.; Oliveti, G.; Arcuri, N. A Method for Thermal Dimensioning and for Energy Behavior Evaluation of a Building Envelope PCM Layer by Using the Characteristic Days. Energies 2017, 10, 659. [Google Scholar] [CrossRef]
- Bland, A.; Khzouz, M.; Statheros, T.; Gkanas, E.I. PCMs for Residential Building Applications: A Short Review Focused on Disadvantages and Proposals for Future Development. Buildings 2017, 7, 78. [Google Scholar] [CrossRef]
- Valancius, R.; Singh, R.M.; Jurelionis, A.; Vaiciunas, J. A Review of Heat Pump Systems and Applications in Cold Climates: Evidence from Lithuania. Energies 2019, 12, 4331. [Google Scholar] [CrossRef]
- Liu, X. Optimal design and operation of PV-battery systems considering the interdependency of heat pumps. J. Energy Storage 2019, 23, 526–536. [Google Scholar] [CrossRef]
- Coelho, L.; Koukou, M.K.; Konstantaras, J.; Vrachopoulos, M.G.; Rebola, A.; Benou, A.; Karytsas, C.; Tourou, P.; Sourkounis, C.; Gaich, H.; et al. Assessing the Effectiveness of an Innovative Thermal Energy Storage System Installed in a Building in a Moderate Continental Climatic Zone. Energies 2024, 17, 763. [Google Scholar] [CrossRef]
- Aneli, S.; Arena, R.; Tina, G.M.; Gagliano, A. Improvement of energy self-sufficiency in residential buildings by using solar-assisted heat pumps and thermal and electrical storage. Sustain. Energy Technol. Assess. 2023, 60, 103446. [Google Scholar] [CrossRef]
- Nicoletti, F.; Cucumo, M.A.; Arcuri, N. Cost optimal sizing of photovoltaic-battery system and air–water heat pump in the Mediterranean area. Energy Convers. Manag. 2022, 270, 116274. [Google Scholar] [CrossRef]
- Meriläinen, A.; Montonen, J.-H.; Kosonen, A.; Lindh, T.; Ahola, J. Cost-optimal dimensioning and operation of a solar PV–BESS–heat pump-based on-grid energy system for a Nordic climate townhouse. Energy Build. 2023, 295, 113328. [Google Scholar] [CrossRef]
- Radosavljević, J.; Ktena, A.; Gajić, M.; Milovanović, M.; Živić, J. Dynamic Optimal Power Dispatch in Unbalanced Distribution Networks with Single-Phase Solar PV Units and BESS. Energies 2023, 16, 4356. [Google Scholar] [CrossRef]
- Rehman, O.A.; Palomba, V.; Frazzica, A.; Charalampidis, A.; Karellas, S.; Cabeza, L.F. Numerical and Experimental Analysis of a Low-GWP Heat Pump Coupled to Electrical and Thermal Energy Storage to Increase the Share of Renewables across Europe. Sustainability 2023, 15, 4973. [Google Scholar] [CrossRef]
- Mancò, G.; Guelpa, E.; Verda, V. Optimal Integration of Renewable Sources and Latent Heat Storages for Residential Application. Energies 2021, 14, 5528. [Google Scholar] [CrossRef]
- Bigdeli, N. Optimal management of hybrid PV/fuel cell/battery power system: A comparison of optimal hybrid approaches. Renew. Sustain. Energy Rev. 2015, 42, 377–393. [Google Scholar] [CrossRef]
- Möller, M.C.; Krauter, S. Hybrid Energy System Model in Matlab/Simulink Based on Solar Energy, Lithium-Ion Battery and Hydrogen. Energies 2022, 15, 2201. [Google Scholar] [CrossRef]
- Stamatellos, G.; Stamatelos, T. Short-Term Load Forecasting of the Greek Electricity System. Appl. Sci. 2023, 13, 2719. [Google Scholar] [CrossRef]
- Liu, Y.; Zhong, Y.; Tang, C. Optimal Sizing of Photovoltaic/Energy Storage Hybrid Power Systems: Considering Output Characteristics and Uncertainty Factors. Energies 2023, 16, 5549. [Google Scholar] [CrossRef]
- Xu, W.; Li, Y.; He, G.; Xu, Y.; Gao, W. Performance Assessment and Comparative Analysis of Photovoltaic-Battery System Scheduling in an Existing Zero-Energy House Based on Reinforcement Learning Control. Energies 2023, 16, 4844. [Google Scholar] [CrossRef]
- European Commission. Nearly Zero-Energy Buildings. 2022. Available online: https://energy.ec.europa.eu/topics/energy-efficiency/energy-efficient-buildings/nearly-zero-energy-buildings_en (accessed on 10 March 2024).
- Eropean Commission. Commission Recommendation (EU) 2016/1318 of 29 July 2016 on Guidelines for the Promotion of Nearly Zero-Energy Buildings and Best Practices to Ensure That, by 2020, All New Buildings Are Nearly Zero-Energy Buildings. Off. J. Eur. Union 2016, 208, 46–57. [Google Scholar]
- EU. Directive 2010/31/EU of the European Parliament and of the Council of 19 May 2010 on the Energy Performance of Buildings; Official Journal of the European Union: Brussels, Belgium, 2010.
- Stamatellos, G.; Zogou, O.; Stamatelos, A. Energy Analysis of a NZEB Office Building with Rooftop PV Installation: Exploitation of the Employees’ Electric Vehicles Battery Storage. Energies 2022, 15, 6206. [Google Scholar] [CrossRef]
- NN. TRNSYS 16 Manual; Solar Energy Laboratory, University of Wisconsin-Madison: Madison, WI, USA, 2005. [Google Scholar]
- Neymark, J.; Judkoff, R.; Knabe, G.; Le, H.-T.; Dürig, M.; Glass, A.; Zweifel, G. Applying the building energy simulation test (BESTEST) diagnostic method to verification of space conditioning equipment models used in whole-building energy simulation programs. Energy Build. 2002, 34, 917–931. [Google Scholar] [CrossRef]
- Thermal Energy Systems Specialists. Component Libraries for TRNSYS, Version 2.0. User’s Manual. Madison WI, USA. 2004. Available online: http://www.tess-inc.com/services/software.html (accessed on 10 March 2024).
- JA_Solar. 535W MBB Monocrystalline HALF-CELL Module JAM72S30 Datasheet. 2022. Available online: https://www.jasolar.com/uploadfile/2022/0224/20220224052158249.pdf (accessed on 10 March 2024).
- De Soto, W.; Klein, S.; Beckman, W. Improvement and validation of a model for photovoltaic array performance. Sol. Energy 2006, 80, 78–88. [Google Scholar] [CrossRef]
- Hussein, A.A.; Batarseh, I. An overview of generic battery models. In Proceedings of the 2011 IEEE Power and Energy Society General Meeting, Detroit, MI, USA, 24–28 July 2011. [Google Scholar]
- Thango, B.A.; Bokoro, P.N. Battery Energy Storage for Photovoltaic Application in South Africa: A Review. Energies 2022, 15, 5962. [Google Scholar] [CrossRef]
- Talluri, G.; Lozito, G.M.; Grasso, F.; Garcia, C.I.; Luchetta, A. Optimal Battery Energy Storage System Scheduling within Renewable Energy Communities. Energies 2021, 14, 8480. [Google Scholar] [CrossRef]
- Hannan, M.; Wali, S.; Ker, P.; Rahman, M.A.; Mansor, M.; Ramachandaramurthy, V.; Muttaqi, K.; Mahlia, T.; Dong, Z. Battery energy-storage system: A review of technologies, optimization objectives, constraints, approaches, and outstanding issues. J. Energy Storage 2021, 42, 103023. [Google Scholar] [CrossRef]
- ABB. REACT2-BATT 4 kWh Lithium-Ion Battery. 2024. Available online: https://new.abb.com/products/el/6AGC069531/3p729900000a (accessed on 10 March 2024).
- BYD. Battery-Box Premium HVS/HVM Cobalt Free Lithium Iron Phosphate. 2024. Available online: https://www.europe-solarstore.com/byd/byd-battery-box-premium-hvm/byd-battery-box-premium-hvm-8-3.html (accessed on 10 March 2024).
- Goodwe. Lynx Home U Series Low Voltage Battery I 5.4–32.4 kWh. 2024. Available online: https://emea.goodwe.com/lynx-home-u-series-low-voltage-lithium-battery (accessed on 10 March 2024).
- Huawei. LUNA2000-5/10/15-S0 Lithium Iron Phosphate Battery. 2024. Available online: https://solar.huawei.com/en-GB/download?p=%2F-%2Fmedia%2FSolar%2Fattachment%2Fpdf%2Feu%2Fdatasheet%2FLUNA2000-5-15-S0.pdf (accessed on 10 March 2024).
- LG. RESU Flex Lithium Ion Battery. 2024. Available online: https://lghomebatteryblog.eu/en/flex/ (accessed on 10 March 2024).
- SMA. SMA Home Storage LiFePO4 Battery. 2024. Available online: https://www.sma.de/en/products/solar-batteries/sma-home-storage (accessed on 10 March 2024).
- SolarEdge. SolarEdge Home Battery (LFP). 2024. Available online: https://www.solaredge.com/en/products/residential/storage-and-backup (accessed on 10 March 2024).
- SunGrow. SBR096/128/160/192/224/256 LiFePO4 Batteries. 2024. Available online: https://en.sungrowpower.com/productDetail/2255/battery-sbr096-128-160-192-224-256 (accessed on 10 March 2024).
- Sunlight. Lioness Li-Ion Battery: Intelligent and Sustainable Energy Storage Solution. 2024. Available online: https://www.the-sunlight-group.com/en/global/products/li-on-ess/ (accessed on 10 March 2024).
- ZCSAzzurro. ZCS WECO 4K5 SLIM, Lithium Iron Phosphate Batteries. 2024. Available online: https://www.zcsazzurro.com/inverters/lv-batteries (accessed on 10 March 2024).
- Jufri, F.H.; Aryani, D.R.; Garniwa, I.; Sudiarto, B. Optimal Battery Energy Storage Dispatch Strategy for Small-Scale Isolated Hybrid Renewable Energy System with Different Load Profile Patterns. Energies 2021, 14, 3139. [Google Scholar] [CrossRef]
- Sundén, B. Chapter 6—Thermal Management of Batteries. In Hydrogen, Batteries and Fuel Cells; Sundén, B., Ed.; Academic Press: Cambridge, MA, USA, 2019; pp. 93–110. [Google Scholar]
- RETSCREEN. Available online: http://www.retscreen.net (accessed on 10 March 2024).
- Enex_Group. Markets Publications—Day Ahead Market Report—24 March 2024. Available online: https://www.enexgroup.gr/markets-publications-el-day-ahead-market (accessed on 10 March 2024).
- Wei, Y.; Yao, Y.; Pang, K.; Xu, C.; Han, X.; Lu, L.; Li, Y.; Qin, Y.; Zheng, Y.; Wang, H.; et al. A Comprehensive Study of Degradation Characteristics and Mechanisms of Commercial Li(NiMnCo)O2 EV Batteries under Vehicle-To-Grid (V2G) Services. Batteries 2022, 8, 188. [Google Scholar] [CrossRef]
Figure 1.
Southwest view of the high school building showing the SW-facing wing of the rooftop PV installation (a), plan of the ground floor level (b), and typical section (c).
Figure 1.
Southwest view of the high school building showing the SW-facing wing of the rooftop PV installation (a), plan of the ground floor level (b), and typical section (c).

Figure 2.
The energy system’s diagram in the modeling studio.

Figure 3.
Total heating capacity (W) of the heat pump.

Figure 4.
Total electric power input (W) of the heat pump.

Figure 5.
Annual energy balance of the school building in the form of a Sankey diagram.

Figure 6.
Hourly variation in the main system’s variables in a week in January. Low limit for batteries’ SOCmin = 0.36. Temperature set at 20 °C.
Figure 6.
Hourly variation in the main system’s variables in a week in January. Low limit for batteries’ SOCmin = 0.36. Temperature set at 20 °C.

Figure 7.
Demand curve of the Greek system during a week in January 2024 with low ambient temperatures.
Figure 7.
Demand curve of the Greek system during a week in January 2024 with low ambient temperatures.

Figure 8.
Hourly variation in the main system’s variables in a week in July. Batteries’ capacity is kWh. SOCmin = 0.36.
Figure 8.
Hourly variation in the main system’s variables in a week in July. Batteries’ capacity is kWh. SOCmin = 0.36.

Figure 9.
Electricity demand curve of the Greek system in July 2023 during a heat wave episode. The total demand is the blue curve and the part covered by non-photovoltaic power is in red.
Figure 9.
Electricity demand curve of the Greek system in July 2023 during a heat wave episode. The total demand is the blue curve and the part covered by non-photovoltaic power is in red.

Figure 10.
Monthly energy balances of annual PV production, building energy use and export to the grid (17.9° panel tilt angle, 500 kWh battery capacity, 2 m3 storage tank capacity).
Figure 10.
Monthly energy balances of annual PV production, building energy use and export to the grid (17.9° panel tilt angle, 500 kWh battery capacity, 2 m3 storage tank capacity).

Figure 11.
Monthly heat pump consumption, energy from source and heating energy supplied to the load on a monthly basis.
Figure 11.
Monthly heat pump consumption, energy from source and heating energy supplied to the load on a monthly basis.

Figure 12.
Actual electricity consumption from monthly school electricity bills in 2023.

Figure 13.
Computed evolution of instantaneous electric power imports and exports in one full year.

Figure 14.
Battery state of charge for each hour of the day (vertical axis) and the day of the year (horizontal axis). The battery is assumed to start at zero state of charge.
Figure 14.
Battery state of charge for each hour of the day (vertical axis) and the day of the year (horizontal axis). The battery is assumed to start at zero state of charge.

Figure 15.
Electricity imports of the reference system per day (horizontal axis) and the hour of day (vertical axis). Imports from the grid are mainly observed during the winter months, due to the low battery state of charge.
Figure 15.
Electricity imports of the reference system per day (horizontal axis) and the hour of day (vertical axis). Imports from the grid are mainly observed during the winter months, due to the low battery state of charge.

Figure 16.
Daily exported power to grid (kW) of the reference system. It is presented as function of the hour of day (vertical axis). Battery capacity is 500 kWh, and storage tank volume is 2 m3.
Figure 16.
Daily exported power to grid (kW) of the reference system. It is presented as function of the hour of day (vertical axis). Battery capacity is 500 kWh, and storage tank volume is 2 m3.

Figure 17.
Hourly variation in photovoltaic production and electricity exported to the grid, integrated for the 181 days of the heating season (November to April).
Figure 17.
Hourly variation in photovoltaic production and electricity exported to the grid, integrated for the 181 days of the heating season (November to April).

Figure 18.
Hourly distribution of the total PV output and power exported to the grid, integrated for the 184 days of the heating-free season (May to October).
Figure 18.
Hourly distribution of the total PV output and power exported to the grid, integrated for the 184 days of the heating-free season (May to October).

Figure 19.
Greek day-ahead market, showing an electricity auction on 24 March 2024. The variation in wholesale electricity prices (blue curve) resulted in the price per MWh being zero between 09:00 and 16:00 on this specific day [56].
Figure 19.
Greek day-ahead market, showing an electricity auction on 24 March 2024. The variation in wholesale electricity prices (blue curve) resulted in the price per MWh being zero between 09:00 and 16:00 on this specific day [56].

Figure 20.
Annual distribution of the daily heating loads (kWh) of the high school building.

Figure 21.
Monthly electricity imported and exported to the grid, gained from the rooftop PV panels and consumed by the school (13 m3 buffer storage tank, 600 kWh batteries and = 0.30).
Figure 21.
Monthly electricity imported and exported to the grid, gained from the rooftop PV panels and consumed by the school (13 m3 buffer storage tank, 600 kWh batteries and = 0.30).

Figure 22.
Hourly performance of the optimized system in a week in July. The lowest limit for batteries is Socmin = 0.30. Battery capacity is 600 kWh. The electricity exports are shifted to the favorable evening zone, as can be seen by comparing this figure with Figure 8.
Figure 22.
Hourly performance of the optimized system in a week in July. The lowest limit for batteries is Socmin = 0.30. Battery capacity is 600 kWh. The electricity exports are shifted to the favorable evening zone, as can be seen by comparing this figure with Figure 8.

Figure 23.
Operation of the optimized system in January. Storage tank volume increased to 13 m3. Lowest threshold for batteries’ Socmin = 0.30. Indoor temperature set to 20 °C.
Figure 23.
Operation of the optimized system in January. Storage tank volume increased to 13 m3. Lowest threshold for batteries’ Socmin = 0.30. Indoor temperature set to 20 °C.

Figure 24.
Optimized system: computed hourly distribution of the total annual electricity imported from the grid and exported to the grid during the months from November to April.
Figure 24.
Optimized system: computed hourly distribution of the total annual electricity imported from the grid and exported to the grid during the months from November to April.

Figure 25.
Optimized system: Electric power exported to the grid (kW) as function of the day and the hour of day. Battery capacity of 600 kWh, Socmin = 0.30, and storage tank volume of 13 m3.
Figure 25.
Optimized system: Electric power exported to the grid (kW) as function of the day and the hour of day. Battery capacity of 600 kWh, Socmin = 0.30, and storage tank volume of 13 m3.

Figure 26.
Hourly values of battery fractional state of charge over a full year, starting with an empty battery. Initial system’s behavior (500 kWh capacity, Socmin = 0.36) compared to the optimized system’s behavior (600 kWh capacity, Socmin = 0.30).
Figure 26.
Hourly values of battery fractional state of charge over a full year, starting with an empty battery. Initial system’s behavior (500 kWh capacity, Socmin = 0.36) compared to the optimized system’s behavior (600 kWh capacity, Socmin = 0.30).

Table 1.
Different types of battery storage for building applications.
| Manufacturer | Model | Type of Battery | Battery Capacity (kWh) | Ref. |
|---|---|---|---|---|
| ABB | REACT 2 | Lithium ion | 4.00–12 | [43] |
| BYD | Battery-Box Premium HVS/HVM | Cobalt-free lithium iron phosphate | 5.12–22.10 | [44] |
| Goodwe | Lynx Home U Series | LFP (LiFePO4) | 6.40–32.40 | [45] |
| Huawei | LUNA2000 | Lithium iron phosphate (LiFe battery) | 5.00–15.00 | [46] |
| LG | RESU Flex | Lithium ion | 8.60–17.2 | [47] |
| SMA | SMA Home Storage | LiFePO4 | 3.28–16.40 | [48] |
| Solaredge | SolarEdge Home Battery | Lithium-ion battery (LFP) | 4.60 | [49] |
| Sungrow | SBR096/128/160/192/224/256 | LiFePO4 | 9.60–25.6 | [50] |
| Sunlight | Lioness | Lithium ion | 5.12–35.84 | [51] |
| ZCS Weco | ZCS WECO 4K5 SLIM ((ZZT-BAT-5KWH-4K5SL) | Lithium iron phosphate | 4.50–40.50 | [52] |
Table 2.
System’s storage parameters and their optimization limits.
| Optimization Variable | MIN | MAX | Units |
|---|---|---|---|
| Battery capacity | 200 | 1000 | kWh |
| Volume of storage tank | 1 | 20 | m3 |
Table 3.
Comparison of performance indices of the initial and optimized energy system (annually).
| Optimization/Performance Variable | Initial Value | Optimized | Units |
|---|---|---|---|
| Battery capacity | 500 | 600 | kWh |
| Battery | 0.36 | 0.30 | - |
| Storage tanks capacity | 2 | 13 | m3 |
| Annual electricity consumption | 33,900 | 30,700 | kWh |
| Annual heat pump consumption | 18,900 | 15,700 | kWh |
| Annual primary energy consumption | 45.1 | 40.8 | kWh/m2y |
| Annual PV electricity production | 60,300 | 60,300 | kWh |
| Electricity imported from grid | 11,800 | 10,100 | kWh |
| Electricity exported to grid | 32,200 | 31,000 | kWh |
Disclaimer/Publisher’s Note: The statements, opinions and data contained in all publications are solely those of the individual author(s) and contributor(s) and not of MDPI and/or the editor(s). MDPI and/or the editor(s) disclaim responsibility for any injury to people or property resulting from any ideas, methods, instructions or products referred to in the content. |
© 2024 by the authors. Licensee MDPI, Basel, Switzerland. This article is an open access article distributed under the terms and conditions of the Creative Commons Attribution (CC BY) license (https://creativecommons.org/licenses/by/4.0/).
Share and Cite
MDPI and ACS Style
Roumpakias, E.; Zogou, O.; Stamatellou, A.-M. Optimization of Electrical and Thermal Storage in a High School Building in Central Greece. Energies 2024, 17, 1966. https://doi.org/10.3390/en17081966
AMA Style
Roumpakias E, Zogou O, Stamatellou A-M. Optimization of Electrical and Thermal Storage in a High School Building in Central Greece. Energies. 2024; 17(8):1966. https://doi.org/10.3390/en17081966
Chicago/Turabian StyleRoumpakias, Elias, Olympia Zogou, and Antiopi-Malvina Stamatellou. 2024. "Optimization of Electrical and Thermal Storage in a High School Building in Central Greece" Energies 17, no. 8: 1966. https://doi.org/10.3390/en17081966
Note that from the first issue of 2016, this journal uses article numbers instead of page numbers. See further details here.