Article

Multi-Stakeholder Decision Support Based on Multicriteria Assessment: Application to Industrial Waste Heat Recovery for a District Heating Network in Grenoble, France

Laboratoire Procédés Energie Bâtiment (LOCIE), CNRS UMR 5271—Université Savoie Mont Blanc, Polytech Annecy-Chambéry, Campus Scientifique, Savoie Technolac, 73376 Le Bourget-Du-Lac CEDEX, France
*
Author to whom correspondence should be addressed.
Energies 2024, 17(9), 2009; https://doi.org/10.3390/en17092009
Submission received: 14 March 2024 / Revised: 12 April 2024 / Accepted: 19 April 2024 / Published: 24 April 2024

Abstract

:
The decarbonization and decentralization of district heating networks lead to the shared use of on-site resources by multiple stakeholders. The optimal design of prospective equipment in such contexts should take into account the preferences and objectives of each stakeholder. This article focuses on the adaptation of a 4E multicriteria model (the criteria being energy, exergy, economic, and exergoeconomic) to include and compare the stakeholders’ performance criteria around the technical design. In addition, two graphical supports are proposed that represent and cross-analyze the different stakeholders’ preferred optima. A preliminary implementation of the methodology is illustrated through a study case in France, which features waste heat recovery for district heating utilization. After presenting the results, a discussion is offered on how to complete the methodology with an iterative negotiation procedure to determine the most suitable design. It was concluded, among other considerations, that the relaxation of the stakeholders’ optimality requirements can greatly enable the project’s feasibility. Such a relaxation could be implemented in the form of a joint consortium. In addition, the results showed that stakeholder relaxations of requirements can lead to new solutions that may outperform the best solutions pre-relaxation. Lastly, perspectives are suggested toward verifying whether relaxed requirements from upstream stakeholders might be more impactful than those of downstream stakeholders.

1. Introduction

District heating networks are evolving toward renewable energies, low temperatures, decentralized production [1], and on-site exploitation of energy sources [2]. The potential of recovering industrial excess heat is large, as identified in the studied Swedish case, for example [3]. In the past, renewable energy-driven projects have been extensively studied through separate multi-objective [4], multi-agent [5], and multi-stakeholder [6] approaches.
The multi-objective approach has assisted in different parts of the energy chain, for example, with the optimal integration of solar resources on the production side [7], or for energy efficiency renovation measures on the demand side [8]. A classic example of multiple conflicting objectives is that of the economic and the environmental criteria as one seeks the best configuration that minimizes pollutant emissions while remaining cost-effective [9]. For district energy networks, such problems are usually approached through mixed-integer linear programming (MILP) [10], sometimes with a rolling horizon [9]. Multi-objective optimization is often used during the development of decision-making frameworks, as demonstrated by numerous case studies internationally, for example, in China [11] or Germany [12], just to name a few.
Most of the time, the diversity of energy sources and demands implies a variety of stakeholders and decision criteria. The natural consequence of that variety is the arrival of new types of decentralized agents and/or markets [13] and of prosumers, with a notable impact on the structure of energy systems and the modeling approaches [14]. One stakeholder’s choices have consequences, sometimes unintended, for other stakeholders [15]. For instance, industrial actors tend to be reluctant to share data about their waste streams [16]. This is understandable, for the sake of public image, and defendable by confidentiality laws. And yet, keeping those data a secret makes it difficult to model new recovery processes accurately. In other instances, new environmentally friendly systems may be socially rejected [17].
An active search for engagement by the stakeholders is identified as a key point for policy changes in order to accelerate the approval of renewable energy projects [18]. Traditionally, studies on the development of energy communities have focused on citizens as the main stakeholders, but some studies have analyzed the motivations of other stakeholders in joining an energy community [19]. In addition, past studies have found that institutional cooperation at different levels has different effects on the efficiency of multi-stakeholder partnerships for the deployment of renewable energies [20].
Socio-technical considerations are more and more frequently included in energy projects from the initial design stage, such as social or urban factors [21,22]. Some approaches, such as the assembly theory [23], model the consequences of one stakeholder’s choices on the other stakeholders. In the particular case of industrial heat recovery, this (and the concept of synergies) has also been illustrated [24]. Elsewhere, the concept of a socio-technical optimality gap has been suggested [15], which quantifies the distance between a calculated optimum and the actually desired socio-technical optimal solution.
Decentralized renewable energy projects need to involve the different stakeholders in the planning [25], implementation, and management stages, in order to avoid critical issues in governance [26]. A multi-stakeholder approach can also solve socio-technical barriers in the reconfiguration of district heating towards low-carbon configurations, and the perception that the different stakeholders have on those barriers [27]. Besides, technical models adapted to multi-stakeholder problematics can assist in encouraging investment in more environmentally friendly technologies. For example, the evolutionary multi-objective optimization algorithm proposed by Simeoni et al. [28] considered multiple types of stakeholders (investors, consumers, citizenship, etc.) and indicators (energy, economic, and environmental) to identify Pareto-optimal configurations for an industrial waste heat-driven smart energy system in Italy. Multi-stakeholder approaches could unlock the potential of large-scale heat pumps for district heating in some countries (e.g., Denmark, with an estimated potential of 100 M EUR/y within 2025 [29]).
Several models have been proposed that take into account the variety of criteria, decision-makers, and disciplines. For example, Taylor et al. [30] proposed an interdisciplinary methodology for the planning and operation of future multi-vector energy networks, taking many aspects into account: new technologies, innovative business models, policy and societal changes, and cyber security. Höfer and Madlener [31] proposed a multi-criteria group decision model combining value-focused thinking with multi-attribute utility theory, which evaluates different energy transition scenarios through holistic approaches and involves stakeholders at every step of the decision-making process. Turcksin et al. [32] built a multi-actor multi-criteria (MAMCA) framework to support the implementation of biofuels in Belgium, taking into account all stakeholders of the biofuel supply chain. Hettinga et al. [33] proposed a multi-stakeholder decision support system for energy planning at the local level, identifying boundary conditions that could have been missed at wider scales.
As demonstrated by the above studies, the current state of the art proposes several tools for multi-stakeholder analysis of energy projects. Some of those tools can consider multiple scenarios with varying interactions between stakeholders: ownership over shared equipment, selling/buying prices of boundary resources, etc. Oftentimes, different optimal solutions will be identified depending on the scenario, the stakeholder, and the performance indicators. In such cases, the discussion is up to the stakeholders. However, such a discussion can be very difficult, especially for real energy projects where multiple criteria are involved. Decision support tools are, thus, needed to evaluate the distances between the different optimal solutions and the possibilities for an agreement. Those tools should also support the negotiation process by providing updated results while taking into account the stakeholders’ choices.
With the abovementioned research gap in mind, the authors of this article propose a set of decision support tools to facilitate the technical design of on-site energy projects involving multiple stakeholders, through iterative negotiations over quantified solutions [34]. The methodology applies the notion of a “socio-energetic node” proposed by Tabourdeau and Debizet [35]. Socio-energetic nodes represent parts of a complex energy system, defined as “a set of elements that harvest, convert, or distribute energy and are managed by a decision-maker interacting with other agents” [35].
The methodology relies on the evaluation of multiple quantitative decision criteria for the considered scenarios that are related to the stakeholders’ share of the equipment. Then, the stakeholders are asked to convey the weight (or importance) that they give to every decision criterion. In the end, two visual tools cross-evaluate the optimal solution preferred by each stakeholder with the decision criteria of the other stakeholders. The possibility that stakeholders might relax their objectives and be more tolerant of suboptimal solutions is also considered. For each decision by a stakeholder, the visual tools are updated.
Therefore, the methodology is sensitive, responsive, and adaptive to the stakeholders’ decisions. It can guide them through iterative negotiations by contrasting the different socio-energetic nodes, and answering questions like: Which design is the most promising among the feasible ones? Which scenario is the most favorable one for all stakeholders? Which are the most constraining and the most conciliating criteria? Can relaxation of the stakeholders’ constraints yield solutions that are more promising? Thus, negotiations are guided toward an agreement when possible.
The first part of the methodology is demonstrated in this article through a case study on a district heating system driven by industrial waste heat. The case study involves a multicriteria 4E model (energy, exergy, economic, and exergoeconomic), four possible stakeholders, and the relative scenarios based on the possible ownership of the prospective equipment by stakeholders. An added value of this case study is the exergy criterion and its exergo-economic variant. Despite not yet being included in decision support tools, exergy is slowly but surely gaining its place in energy decision-making and in the planning of low-temperature urban heat networks [34].
Section 2 of this manuscript presents the case study, the prospective energy system, the negotiation support algorithm, the simulation and optimization tools, and the criteria considered (energy, exergy, economic, exergoeconomic, and multi-stakeholder). Section 3 presents and analyzes the main results. Section 4 presents the specific conclusions of this case study, along with more general conclusions concerning multi-stakeholder technical projects.

2. Materials and Method

The case study focuses on the on-site valorization of waste heat from a French laboratory of high-intensity magnetic fields (LNCMI), working in order to cover the heating demand of the Presqu’Île district in Grenoble [36].

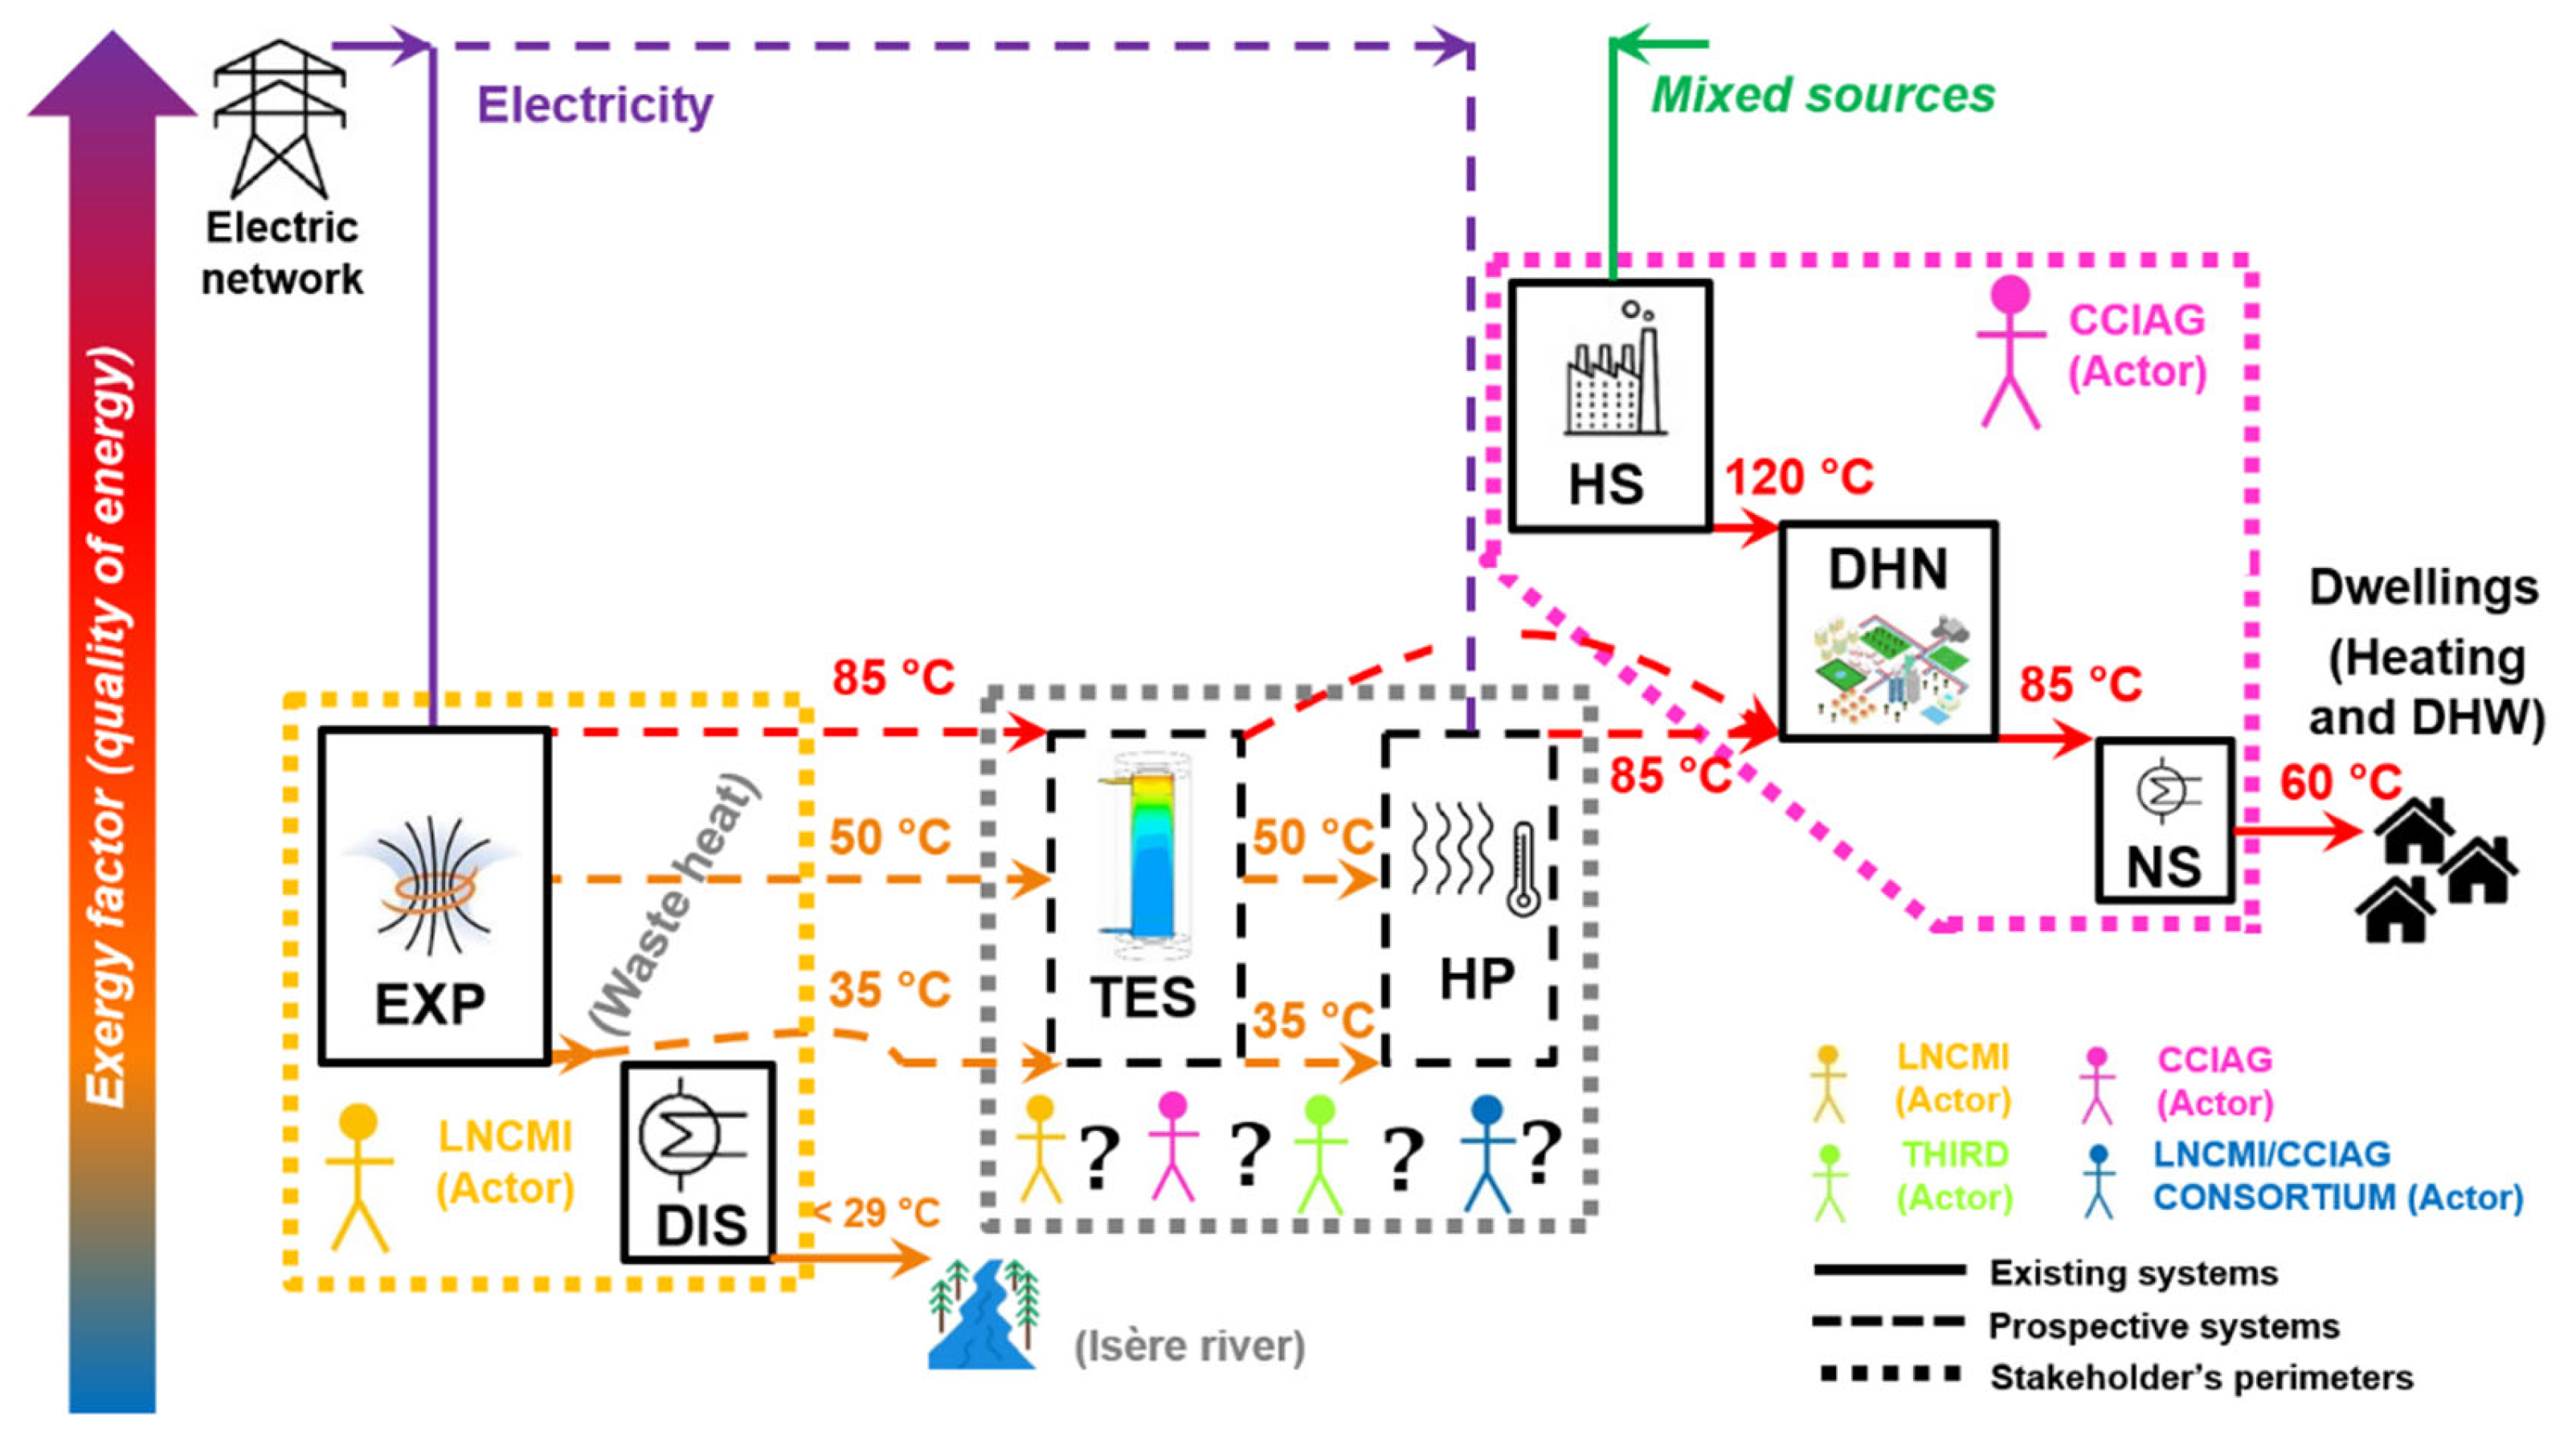
2.1. System Description and Ownership Scenarios

Figure 1 presents the case study and the socio-energetic nodes considered for modeling. The LNCMI’s electro-intensive processes reject considerable amounts of waste heat that is currently dissipated within the Isère River. Thus, the LNCMI’s socio-energetic node is made up of their laboratory experiences (noted as “EXP” in the diagram) and heat dissipation (noted as “DISS”). A nearby district heating network (“DHN”) has thermal needs of the same order of magnitude. That network and its substations (“NS”) are managed by the CCIAG, an aggregator that also manages a heat supply plant (“HS”). The LNCMI wants to valorize its waste heat, and the CCIAG wants a higher share of renewables in its energy mix. Both decision-makers are interested in a project that connects their needs.
The project consists of implementing a waste heat recovery system capable of upgrading the LNCMI’s waste heat, i.e., increasing its temperature and injecting it into the CCIAG’s network. The recovery system is made up of a thermal energy storage unit (“TES”) to compensate for temporal mismatch and a heat pumping unit (“HP”) to increase the waste heat’s temperature. The technical pre-design of this system requires the user to determine the optimal waste heat temperature and storage capacity of the system. The potential owners of the prospective system are [37]: (1) the LNCMI; (2) the CCIAG; (3) an unidentified third party (named THIRD); (4) an LNCMI/CCIAG joint consortium.
Three choices exist for the input temperature, namely: 35 °C, which is the current rejection temperature by the LNCMI’s electro-magnetic processes; 50 °C, which is theoretically possible with the current cooling loop of the LNCMI’s magnets; and 85 °C, granted by a prospective technology for cooling the magnets (nucleate boiling [38]). In terms of storage capacity, five choices are investigated, namely, from 0 MWh (i.e., no storage) to 40 MWh in increments of 10 MWh. This leads to a total of 15 possible pre-designs for this system. The reference case involves heat rejection at 35 °C and complete dissipation to the Isère River.
In addition to the technical layer, this project also has a multi-stakeholder layer, through the notion of the “socio-energetic node” proposed by [35]. The perimeter of a socio-energetic node is defined by material and energy flows, as well as the socio-juridical governance models attached to them. The perimeter and borders of each socio-energetic node depend on the investments made by that stakeholder. The assembly of all socio-energetic nodes forms the overall system. Identifying socio-energetic nodes allows us to understand better the decision-making capacity of each stakeholder. Table 1 presents the socio-energetic nodes of this study for the four ownership scenarios considered. In this study, most of the stakeholders have an existing socio-energetic node that could be enlarged by acquiring a heat recovery system.
Thus, the heat recovery system (TES + HP) may become the property of the LNCMI (already the owner of EXP + DISS)—Scenario 1, or the property of the CCIAG (already owner/manager of HS + NTW + SST)—Scenario 2. It may also belong to an unidentified stakeholder (THIRD) that does not own any unit as yet—Scenario 3, or to an LNCMI/CCIAG alliance (CONSORTIUM) that would join their respective units into one unique node—Scenario 4. It was assumed that THIRD and CONSORTIUM may only be modeled as owners because acquiring the prospective equipment is the only reason for these actors to exist in this study.
Each stakeholder has their own optimization criteria, which suggest the design that would be most interesting for their socio-energetic node (i.e., their perimeter of responsibility [35,39]). Those designs will be interpreted as the stakeholder’s preferences in the negotiations. When confronted with other stakeholders’ preferences, each stakeholder can accept a degree of tolerance, which is understood as a maximal deviation from the optimal solution that they would prefer. Should tolerance not suffice to find a satisfying solution, a stakeholder can relax their constraints. These aspects of the study are further detailed in Section 2.3.2 (multi-stakeholder model).

2.2. Calculation Procedure and Simulation/Optimization Tools

The study presented in this article implements a portion of a larger method envisaged by the authors (Figure 2). The method consists of an algorithmic procedure for facilitating the technical design of a prospective energy unit that is of common interest to two or more stakeholders [40]. This subsection presents the specific work conducted in this article, which corresponds to Steps 1 and 2 and, partially, to Steps 0 and 4 (with a few assumptions) of the algorithm in Figure 2. Refer to Section 3.4 for a complete and generalized description of the whole algorithm.
The work in this article was conducted to:
  • Optimize the technical system’s yearly management. This was performed with an open-source tool called OMEGAlpes (v.0.4.0), which stands for “Optimization Model Generation as Linear Programming for Energy Systems” ([41,42]). This tool applies mixed-integer linear programming (MILP) to find the optimal management of energy flows in a study case. This optimization was applied to the 15 possible designs of the waste heat recovery system.
  • Apply multi-stakeholder and multi-criteria analysis. This was performed with the multi-stakeholder energy, exergy, economic, and exergoeconomic models presented in the next subsections. These models were applied to the results yielded by OMEGAlpes in the previous step. The analysis gives the system’s performance in terms of 4 indicators for each stakeholder, for each possible design.
  • Relax stakeholders’ constraints and repeat step 2. Some of the stakeholders may relax some of their constraints in order to facilitate the project’s feasibility. Those relaxations are detailed in Section 2.3.2. Only decisional or economic relaxations were considered. Thus, it was not necessary to repeat step 1, since OMEGAlpes accounts for technical or operational constraints that were not modified.
  • Generate the matrices and the radar chart. This was performed to identify the feasible designs without relaxations, along with the most promising designs after the relaxations were applied. The results presented in this article were selected for the sake of illustrating the method.
  • Analyze the negotiation possibilities. Reflections based on the matrices and radar chart inspired an iterative procedure for the conception of these kinds of projects, through cooperation between the stakeholders. That procedure is presented in Section 3.4.

2.3. Models

2.3.1. Energy, Exergy, Economic, and Exergoeconomic Models

A novel multi-stakeholder formulation model was applied to the energy, exergy, economic, and exergoeconomic (4E) sub-models used in previous articles for this case study. The 4E sub-models are only presented succinctly in this sub-section, for the sake of brevity. A slightly more developed description is available in the Supplementary Materials, and a detailed description is available in previous articles by the authors on this case study [36,43].
The energy model is the fundamental one, as the rest of the models were built on it. The general energy balance (Equation (1)) at a certain time step (Δt) was applied unit by unit, considering all heat inlets ( Q ˙ i n ), heat outlets ( Q ˙ o u t ), power inlets ( W ˙ i n ), power outlets ( W ˙ o u t ), and energy accumulations (ΔU). The term of accumulation was relevant for the thermal storage unit only.
t · Q ˙ i n + W ˙ i n = t · Q ˙ o u t + W ˙ o u t + U
The input energy data and the concretized formulation of the energy balances for each unit are presented, respectively, in Tables S1 and S2 (Supplementary Materials).
This energy model was built on the following hypotheses:
  • Potential and kinetic energy are neglected.
  • Temperature levels of the units remain constant throughout the year.
  • Pressure, temperature, and heat losses across the pipelines are neglected.
  • Perfect stratification is assumed in the thermal storage unit.
  • The initial and final states of charge of the thermal energy storage are the same.
  • Heat losses across the different components of the heat pump are neglected.
  • The heat production process by the heat supplier has a constant exergy efficiency.
The exergy model was built on the energy model. Thus, it encompasses all the equations, hypotheses, and input parameters mentioned previously and adds additional ones. Its most fundamental equation is for exergy balance (Equation (2)). It allows us to evaluate exergy destruction within a unit by knowing its inputs/outputs of exergy, as well as exergy accumulations within the unit (the latter was only relevant for storage units). It was assumed that all streams exchanging heat remain at a constant temperature. This allowed us to use Equation (2a) in order to evaluate the exergy associated with the heat stream. In order to keep thermodynamic consistency in the study, the dead-state temperature (T0) was kept at a constant value [44]. The exergy associated with work equals work, as its exergy factor is 1 (2b).
t · E ˙ i n = t · E ˙ o u t + E ˙ D + E u
With   E ˙ q = Q ˙ · 1 T 0 T q
E ˙ W ˙ = W ˙
The input parameters and unit-by-unit exergy balances are summarized in Tables S3 and S4 (Supplementary Materials), respectively. The exergy model was built on the following hypotheses:
  • Potential and kinetic exergy are neglected.
  • The heat production process by the heat supplier has a constant exergetic efficiency.
The economic and exergoeconomic models were built on cost flow balances (Equation (3)). These balances establish that the revenue from selling a unit’s product ( C ˙ P ) must cover the unit’s fuel costs ( C ˙ F ), investment amortization ( Z ˙ C I ), and operation and maintenance costs ( Z ˙ O M ). The costs of investment amortization were annualized by means of the capital recovery factor, or CRF (Equation (3a)). Operation and maintenance costs are typically assumed as a fraction of the investment amortization costs (Equation (3b)). The CRF (Equation (3c)) allows us to determine the equivalent yearly cash flows that a project should generate in order to compensate for present investments at a certain return rate (i) and throughout the project’s economic life (n).
C ˙ F + Z ˙ C I + Z ˙ O M = C ˙ P
Z ˙ C I = Z C I · C R F
Z ˙ O M = Z ˙ C I · c k O M
C R F = i   ·   1 + i n 1 + i n 1
The input data for the economic and exergoeconomic models, along with unit-by-unit cost flow balances, are provided in Tables S5 and S6 (Supplementary Materials), respectively.

2.3.2. Multi-Stakeholder Model

The multi-stakeholder model accomplishes two main functions. The first is defining the performance indicators for each of the actors, as a function of their perimeter of responsibility (considering possible ownership of the new equipment). These perimeter-dependent definitions concern the criteria presented above, i.e., energy, exergy, economic, and exergoeconomic. The second function of this model is to establish the stakeholders’ tolerance to sub-optimal solutions (for them) in order to facilitate the feasibility of the overall project. This tolerance was defined as a percentage deviation from each mono-criterion and mono-stakeholder optimal solution. In addition, NO-GO thresholds were considered for some criteria of some stakeholders, including relaxation possibilities on those thresholds for the sake of the project’s feasibility.

Perimeter-Dependent Performance Indicators

The preceding sub-section introduces a series of unit-by-unit balances that stay the same in each assessment. However, the decisional indicators change depending on who is the owner of the heat recovery system.
The energy criterion was assessed in all instances as a heat coverage rate but used a different reference point for each stakeholder. The exergy indicator refers to the overall exergy destruction, but its contributions depend on the frontiers of the socio-energetic node under study and, thus, on the units within it (see Table 1). The same consideration is applicable to the exergoeconomic indicator based on overall exergy destruction costs. The economic assessment used the net present value (NPV) as an indicator, but the investments and the economic frontiers differ for each stakeholder as a function of the scenario considered.
Table 2 shows how each indicator is defined for each stakeholder and if it is the owner of the WHRS or not. By definition, the stakeholders named THIRD and CONSORTIUM may only exist as owners of the equipment. The energy indicator for both the LNCMI and the CCIAG is the same, independent of whether they are owners or not. Further details on the chosen indicators are given in the following paragraphs.
For the LNCMI, recovering as much waste heat as possible is a priority energy-wise. The indicator named Recovery Factor (RF) quantifies that objective. Exergy-wise, their objective is to minimize overall exergy destruction within their perimeter of responsibility. That perimeter comprises their laboratory and the waste heat dissipation, plus the WHRS if they are the owner of it. The same applies exergoeconomic-wise but involves the costs of exergy destruction instead. Economy-wise, the non-owner LNCMI would sell waste heat to the WHRS’s owner, thus aiming at making some profit ( C W H R S Q , i n ). If the LNCMI is the owner, they would sell upgraded heat to the CCIAG. Revenues should compensate for the investment, operation and maintenance, and electricity consumption, plus the price that the LNCMI estimates for their waste heat.
The CCIAG’s objectives are similar to those of the LNCMI, but their socio-energetic node is different. The Coverage Factor (CF) assesses the WHRS’s coverage of the network’s heat needs. Exergy destruction and exergy destruction costs are assessed on the heat production plant, the network, and its substations, plus the WHRS if it is the CCIAG’s property. Economy-wise, the CCIAG’s profits from this project come from fuel savings with respect to the reference scenario. From these profits, they must subtract the cost of acquiring upgraded heat at 85 °C. If they are not the owner, these costs are simply the purchase price fixed by the owner. If they are the owner, the costs include investment, operation, maintenance, electricity to run the WHRS, and the purchase price of LNCMI’s waste heat.
The stakeholder named THIRD represents an external party that is interested in owning the WHRS. Accordingly, this stakeholder was only modeled as an owner, since otherwise they would not be involved in the project. Energy-wise, an important thought for the THIRD stakeholder is that electricity is always available, while waste heat is intermittent. Accordingly, the Valorization Factor (VF) quantifies the ratio of output heat to input heat, and it should be maximized. Exergy-wise and exergoeconomic-wise, their objectives are the same as those of other stakeholders, but the perimeter reduces to just the WHRS. Economy-wise, this stakeholder buys waste heat from the LNCMI and sells upgraded heat to the CCIAG in order to recover the investment in the WHRS. This imposes a double constraint on this stakeholder, who must negotiate the costs of both input and output heat.
The CONSORTIUM represents an agreement between the LNCMI and the CCIAG. Accordingly, its indicators account for the objectives and perimeters of both stakeholders. Energy-wise, the Recovery and Coverage Factor (RACF) is the product of the RF and CF presented in the previous paragraphs. The objectives of minimizing exergy destruction and exergy destruction costs comprise all the LNCMI’s and CCIAG’s units, plus the WHRS. Economy-wise, the project’s benefits correspond to the CCIAG’s savings on primary fuel. The CCIAG shares those benefits with the consortium. Additionally, the LNCMI does not claim a cost for their waste heat since they are part of the consortium. By definition, this consortium may only exist as an owner, since the sole purpose to form it would be to acquire the new equipment as shared value.
The results for all criteria in each scenario are shown in Table A1 (in Appendix A).

Stakeholder’s Tolerance and Relaxation Possibilities

The performance indicators described in the previous subsection will most likely suggest divergent optimal designs. During negotiations, it is improbable that any stakeholder will manage to convince the others in favor of their own optimal design. A compromise will be necessary. This subsection introduces parameters for assisting negotiations. The purpose is not to delve into multi-stakeholder dynamics, which would require expertise in the social sciences. Rather, the objective is to render the mathematical model sensitive to such dynamics. The stakeholders’ capacity to search for a compromise was modeled here by means of two concepts:
  • Tolerance, understood as a stakeholder’s capacity to accept a design that is inferior to the optimal design that they would prefer, from the standpoint of a specific criterion.
  • Relaxation, understood as a stakeholder’s capacity to decrease or eventually drop a constraint of theirs, potentially increasing the project’s feasibility for themselves and for other stakeholders.
It was assumed that a stakeholder’s tolerance and relaxation capacity are independent of who is the owner of the prospective system. It was also assumed that the stakeholders’ decisions would be based on the rational, quantifiable indicators presented in the previous subsection. Table 3 shows the tolerance limits, NO-GO criteria, and relaxation possibilities per stakeholder and optimization criterion. A NO-GO is a threshold that, if violated, forces a solution to be discarded. Detailed explanations follow in the next paragraphs.
The LNCMI engages in this project to reduce their waste heat emissions. This can be understood as an energy-focused motivation, with underlying ecological notions. Accordingly, the tightest tolerance of this stakeholder was supposed to be on the energy indicator (ENER). More than 10% of underperformance with respect to their energy-optimal design was understood as heavy tolerance. The exergy (EXER) and exergoeconomic (EXEC) criteria are less widely known by industrial partners, but in waste heat recovery, they can be correlated to ecological advantage. Therefore, the heavy tolerance threshold was assumed as 25%. The economic criterion (ECON) was assumed as the least important for this stakeholder since: (1) the LNCMI is a scientific organization, and its waste heat is a by-product; (2) they currently dissipate that waste heat at zero profit. Thus, the heavy tolerance threshold was set at 50%.
Since the CCIAG is a commercial organization, its economic criterion was given the tightest tolerance (a heavy threshold of 10%). The other criteria were assumed to be less important. Still, an operator of a district energy network is sensitive to energy efficiency, renewable sources, and, in the case of district heating, the quality (temperature) of heat and, thus, its exergy. Therefore, the ENER, EXER, and EXEC criteria were given a heavy tolerance threshold of 25%.
The THIRD was modeled as an external party that seeks profit, with an accordingly tight tolerance on the economic criterion (a heavy threshold of 10%). The rest of the criteria were given a large tolerance (a heavy threshold of 50%).
The CONSORTIUM combines the priorities of both the LNCMI and the CCIAG. Accordingly, for each criterion, the most constraining tolerance was selected among both actors. The result is tight tolerance (heavy threshold of 10%) for the energy and economic criteria, and medium tolerance (heavy threshold of 25%) for the exergy and exergoeconomic criteria.
Some NO-GO thresholds were also considered. Economy-wise, for all stakeholders, if the NPV is negative, then the project is a NO-GO. Exergy-wise, if the new system causes an increase in total exergy destruction within a stakeholder’s perimeter with respect to the reference scenario, then that design is a NO-GO. The same consideration was applied in the exergoeconomic criterion, although for exergy destruction costs. These considerations were not applied to the THIRD, as it has no exergy destruction in the reference scenario.
It was assumed that the LNCMI would accept relaxing (dropping) the price of their waste heat by 50%. Since the LNCMI’s waste heat is currently dissipated, with zero revenue, it should not be an issue for them to be flexible on its price, as long as they make some profit from it.
It was assumed that the CCIAG would accept relaxing (disregarding) the amortization requirements on their existing facilities by 50%. In the current, real negotiations for this project, the CCIAG marked a maximum buying price for the valorized heat. That maximum corresponds to the price of the heat produced by their own production plants and is, of course, lower than the selling price to end-users. This means that the CCIAG demands that the project respect its current amortizations on the district network. Should that constraint be relaxed, the CCIAG would be able to buy the heat at a higher price, thus facilitating the project’s feasibility for the system’s owner (be it another stakeholder or themselves).
One general relaxation was assumed for all stakeholders: that exergy- and exergoeconomic-related NO-GOs may be disregarded. In the current world situation, exergy analysis is a useful tool for comparing the thermodynamic performance of different systems. This allows us to select the most promising ones on a relative basis. However, defining E x D 0 or C E x D 0 as feasibility requirements for a project is a strong condition, like the N P V 0 requirement. This application of exergy would be somewhat of an innovation, and it stems from a research question: How might exergy re-shape energy projects if it was just as precisely defined as economy? The above are not only reasons for modeling such NO-GOs but also for countering them with relaxation possibilities.

3. Results and Discussion

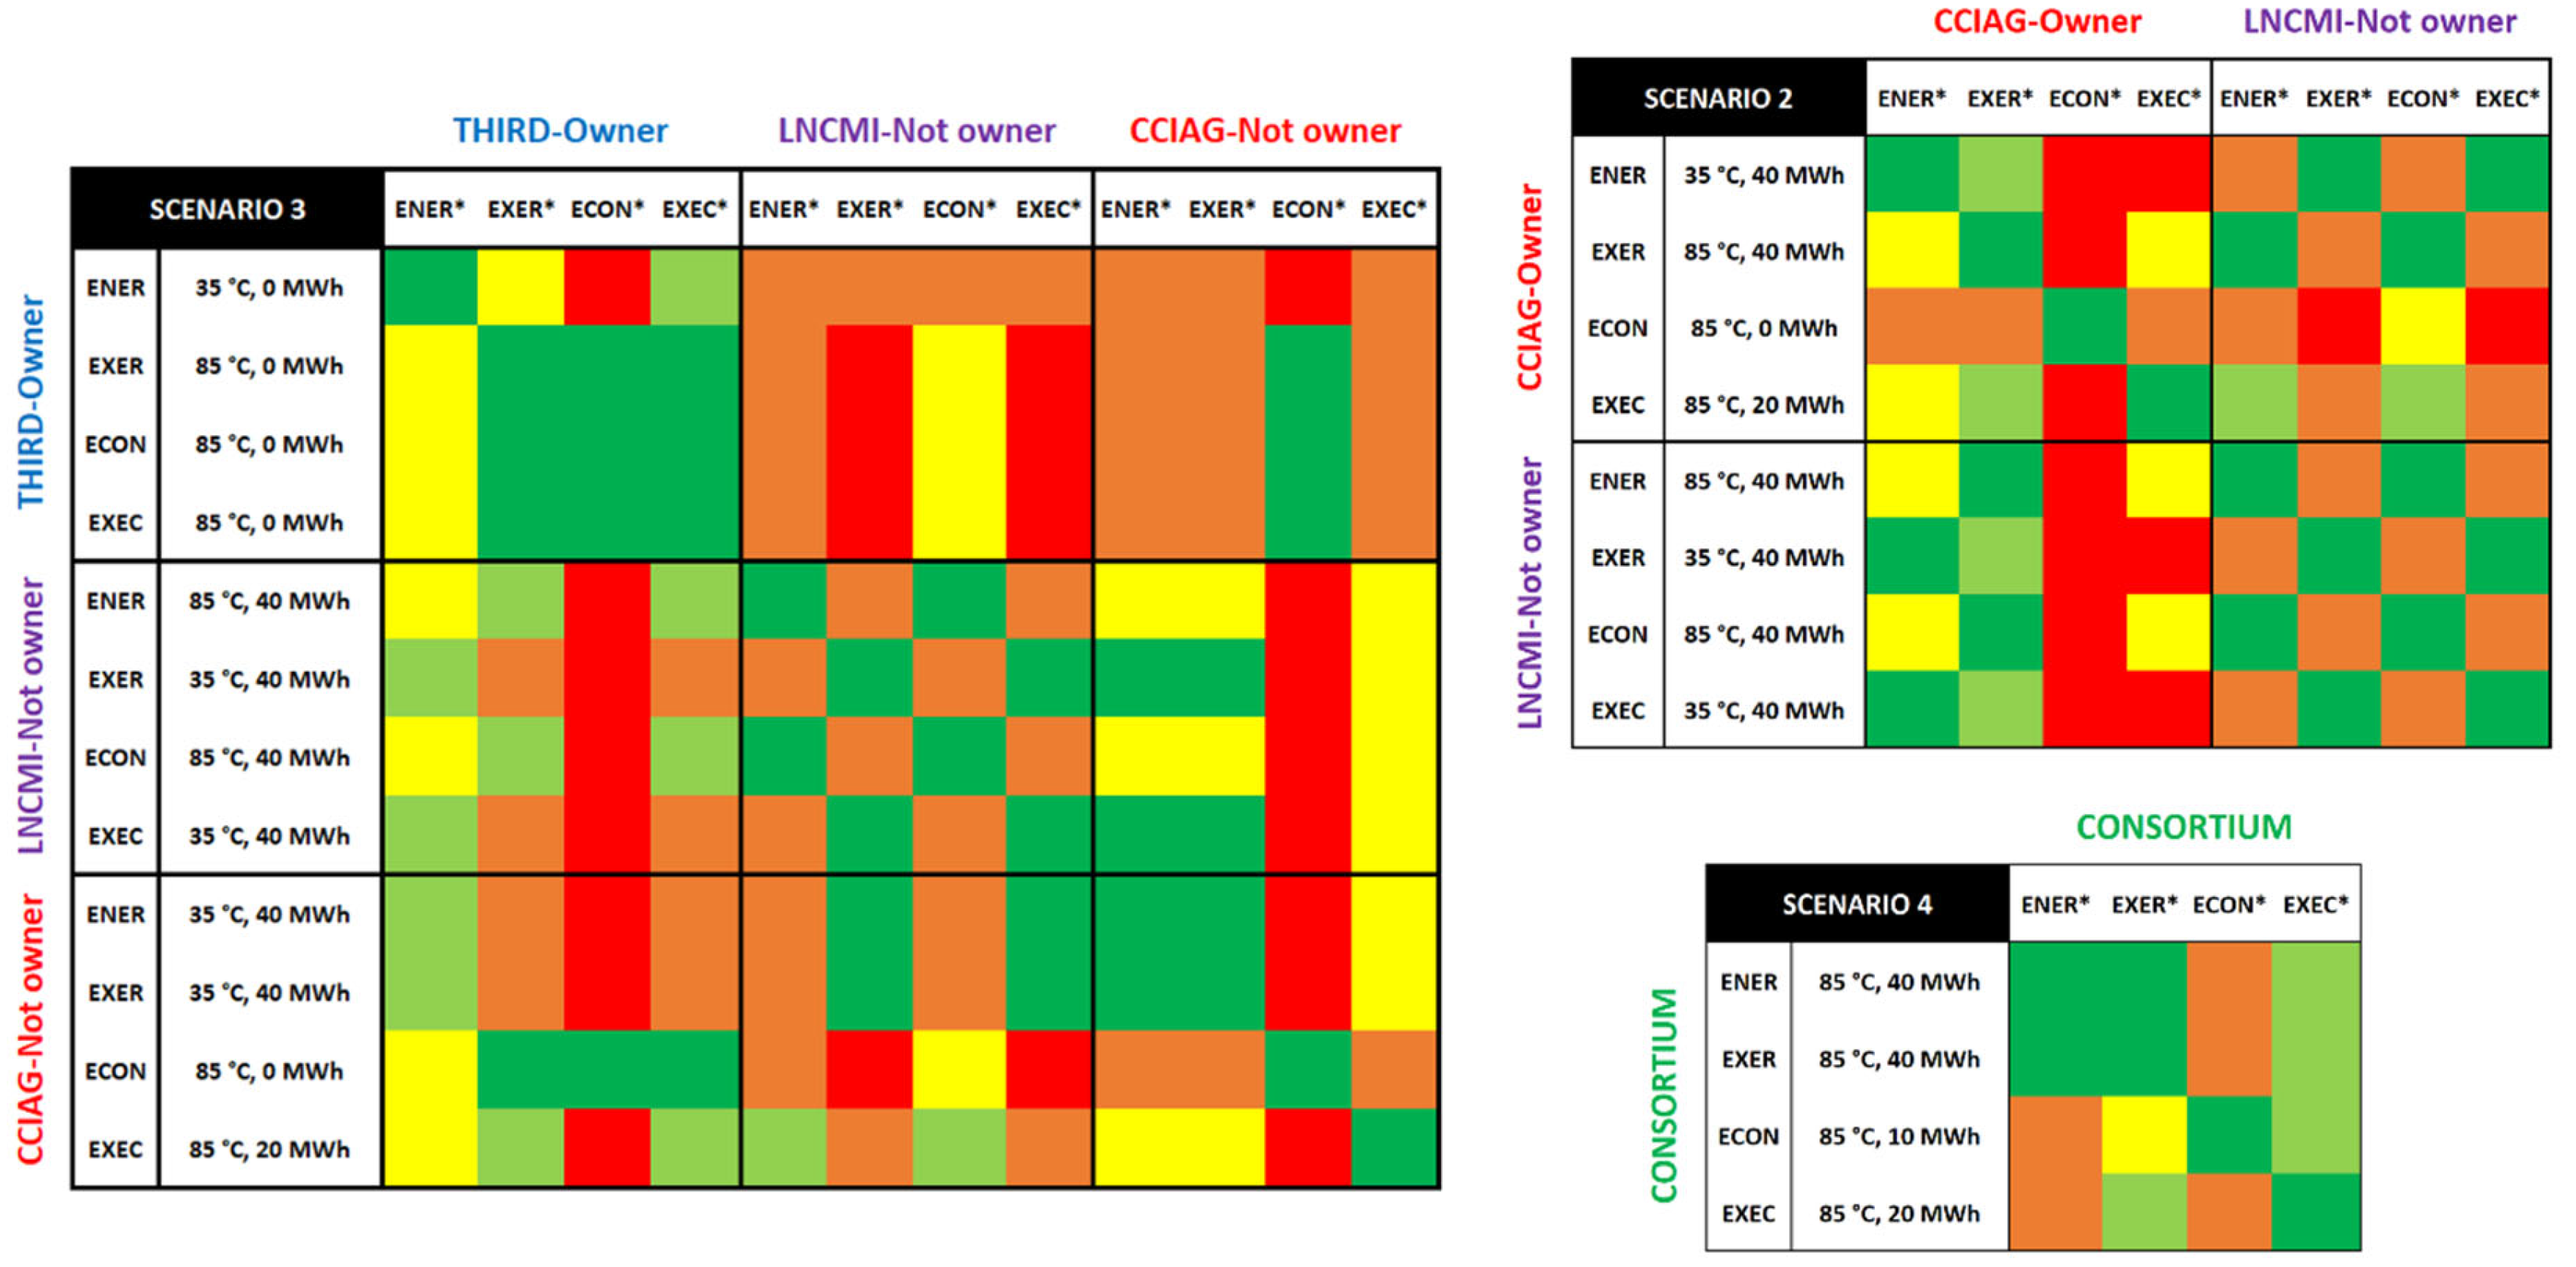
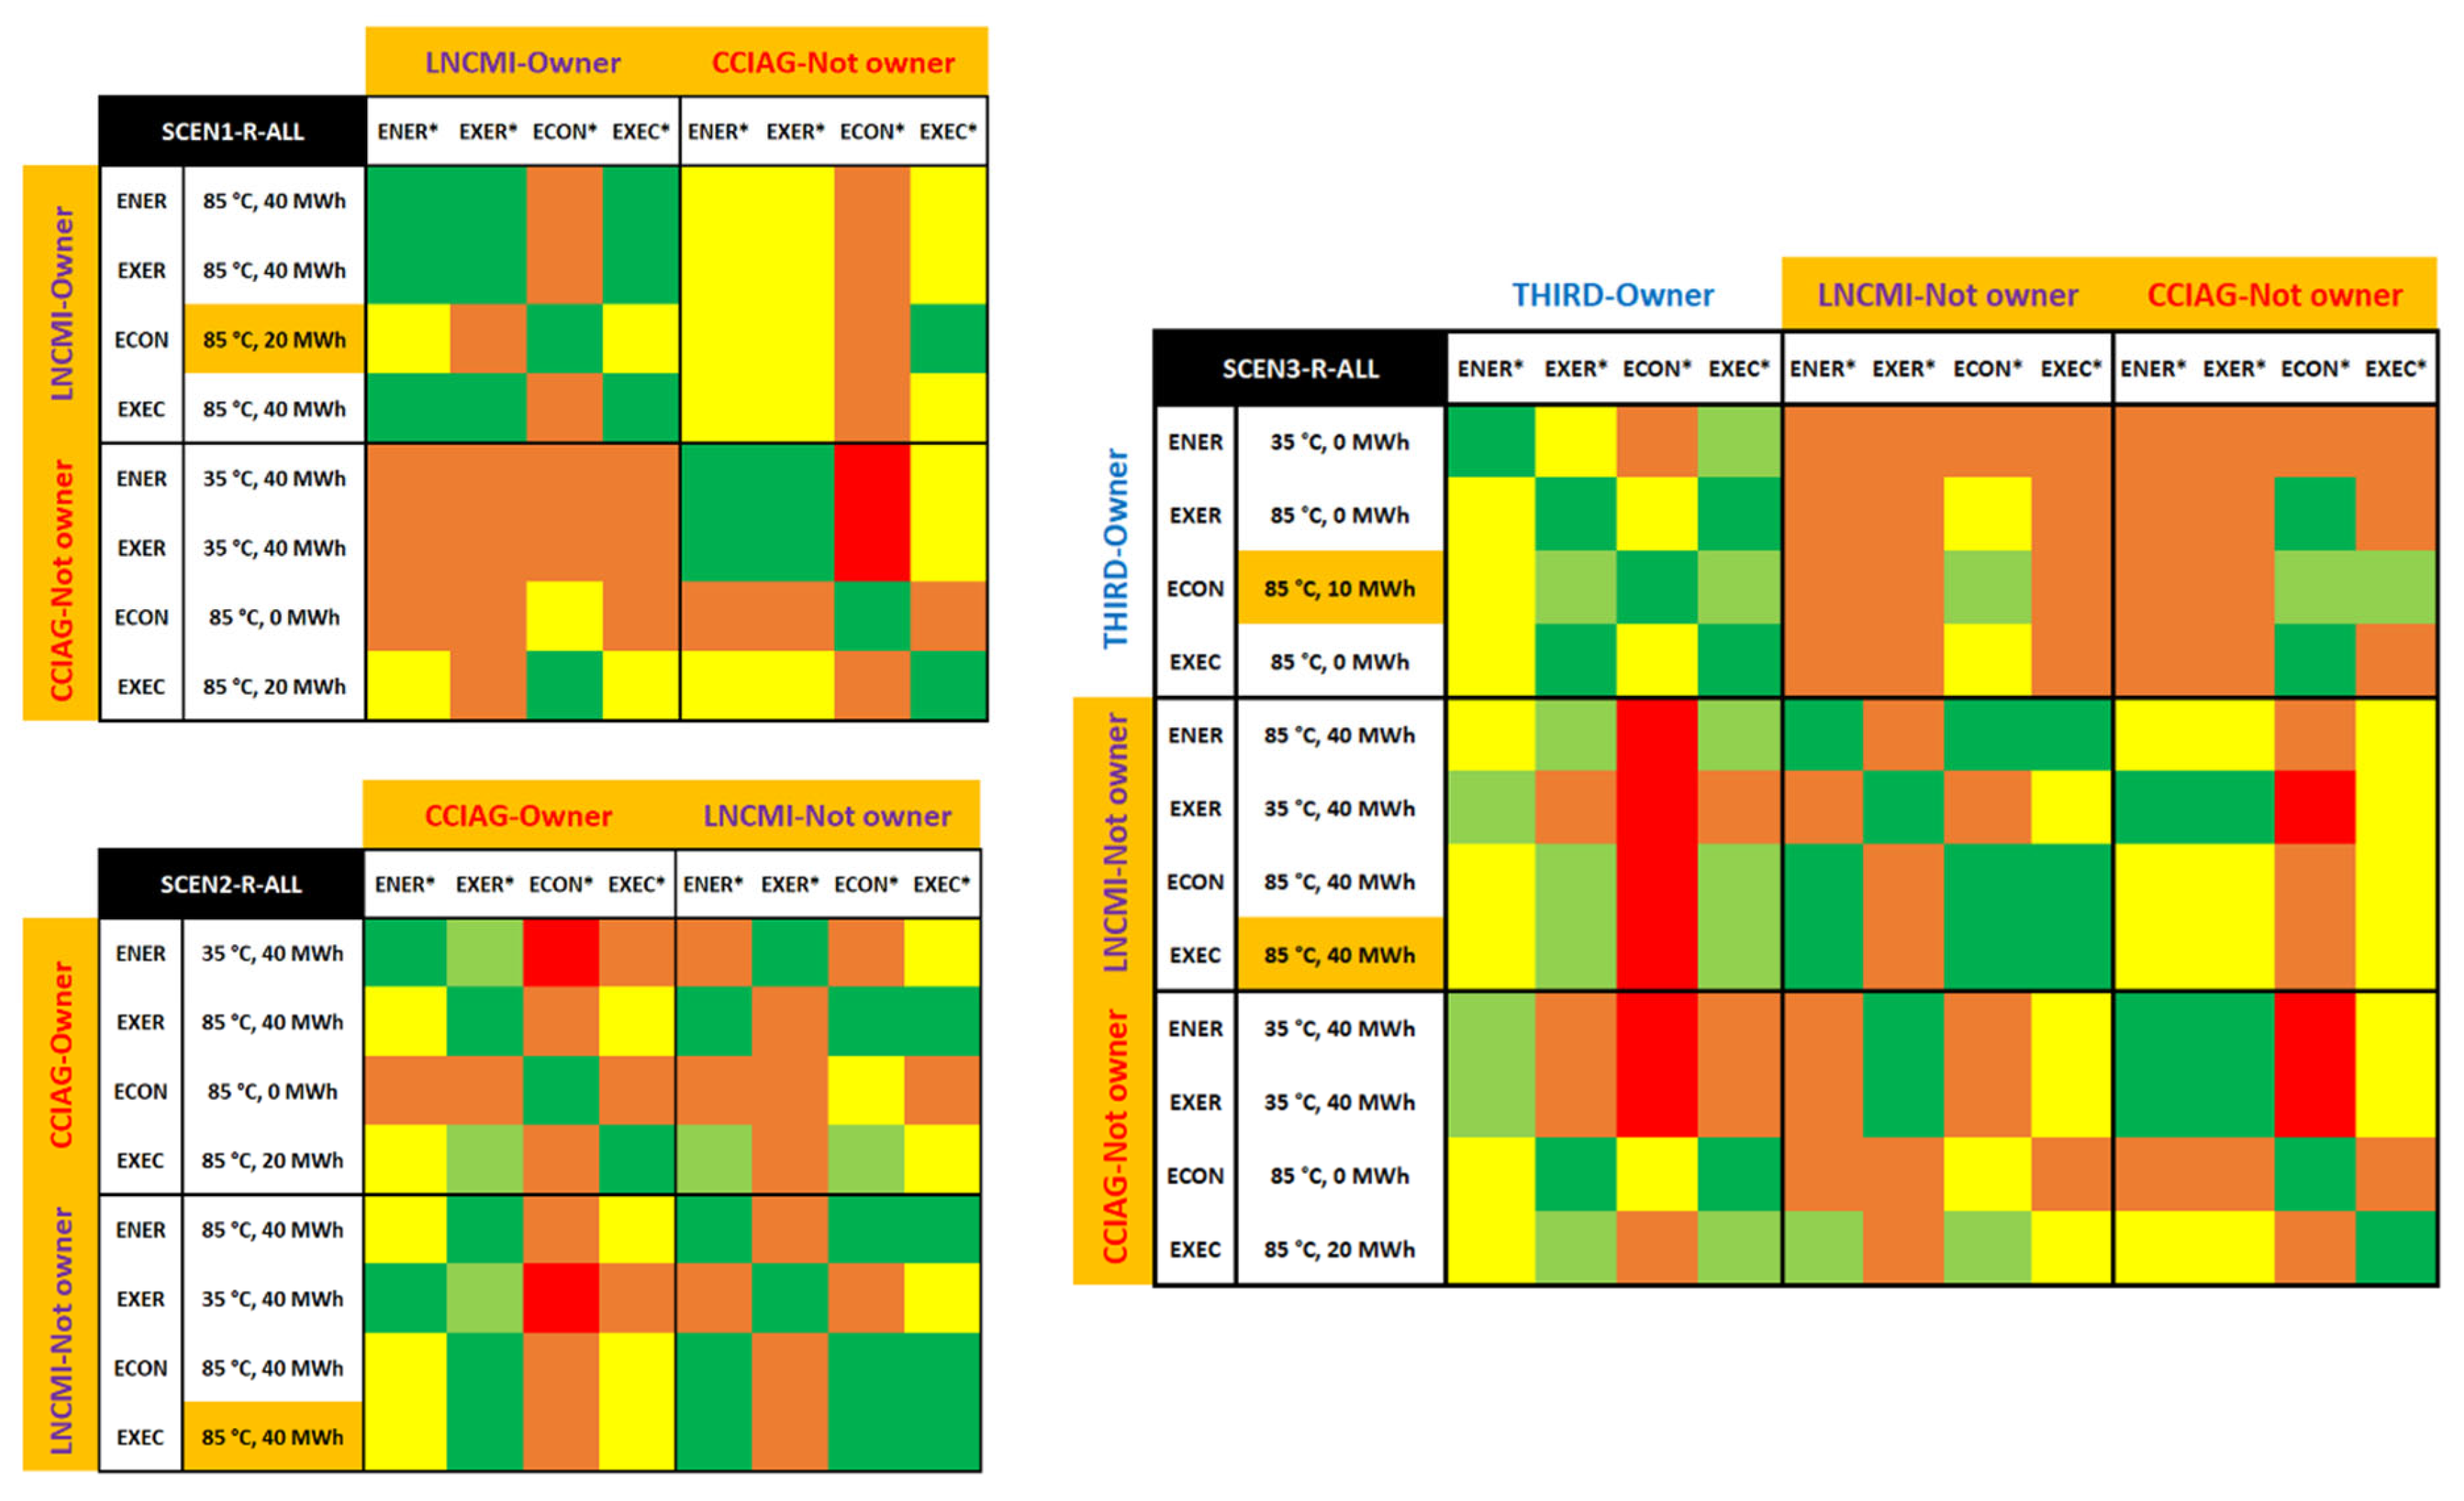
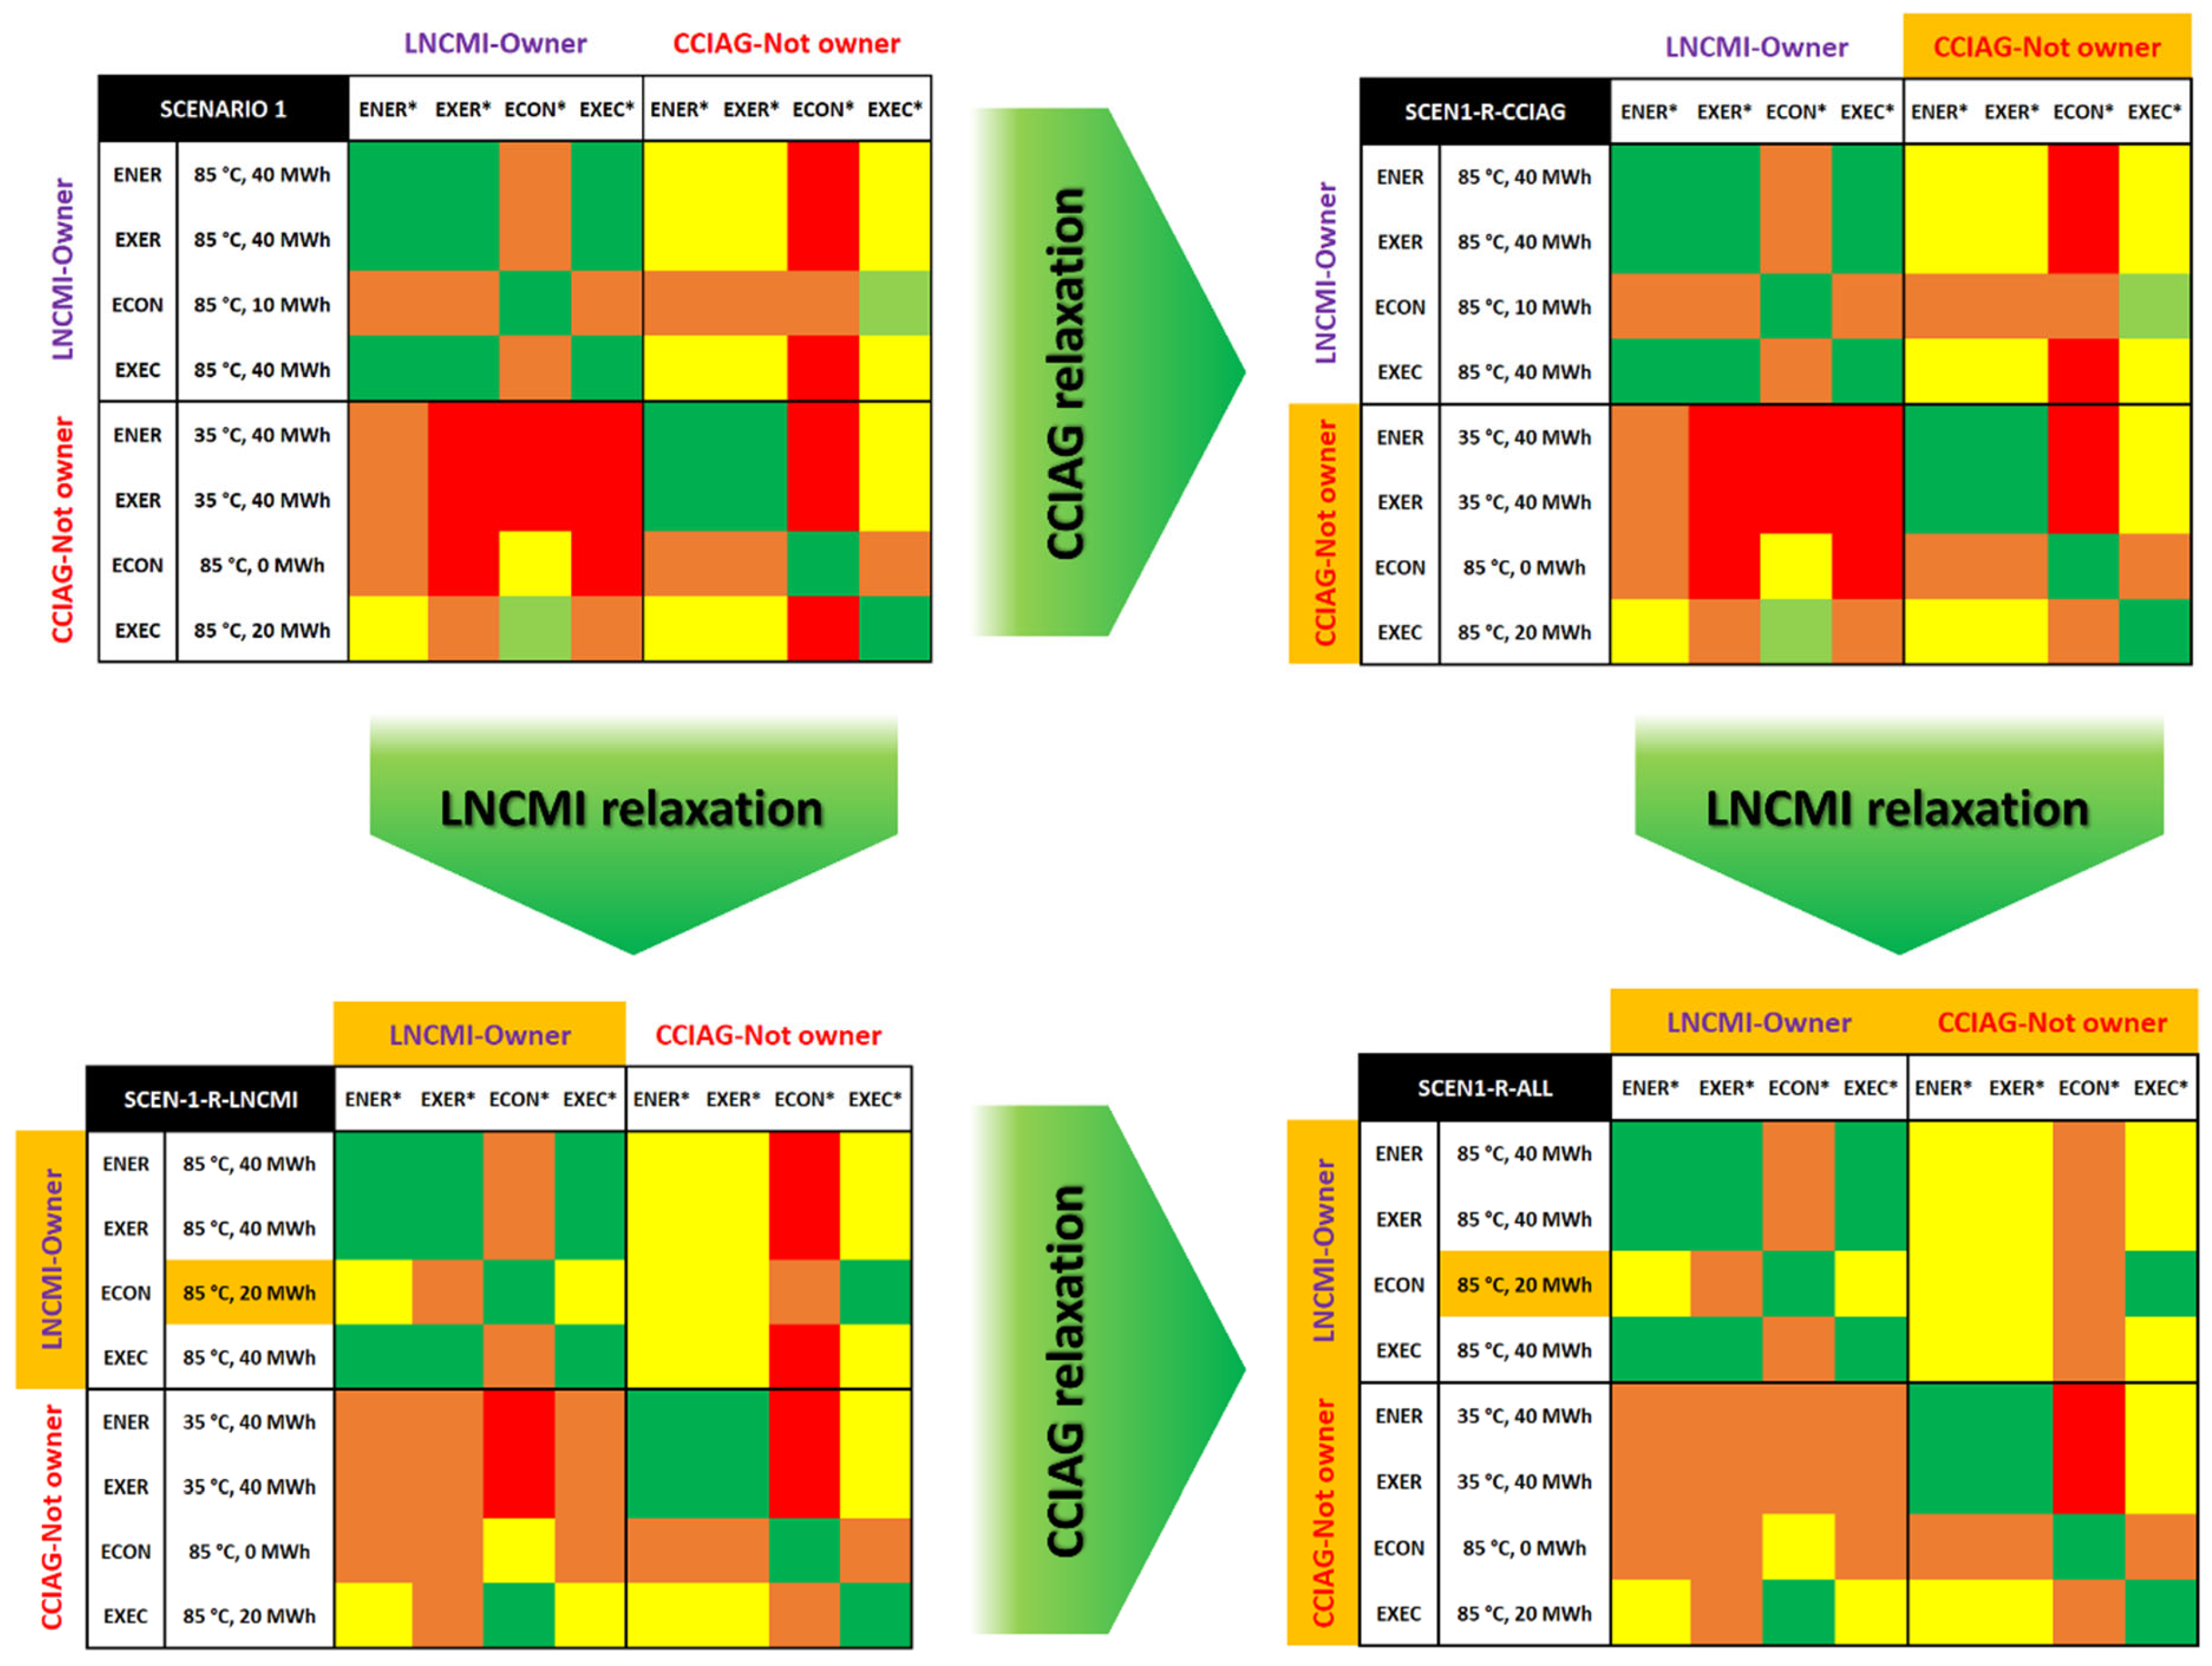
3.1. Stakeholder–Stakeholder Interactions (Cross-Analysis Matrix)

This subsection aims to identify the NO-GO thresholds infringed by otherwise optimal designs in order to facilitate agreements and relaxations. To that end, a cross-analysis matrix is proposed for clear visualization of the information.
Figure 3 presents the “cross-analysis matrix” for Scenario 1. It shows each optimal mono-criterion solution in a scenario and evaluates them from the viewpoint of other stakeholders and their decision criteria. The main purpose of this matrix is to spot which criteria render a mono-criterion optimum non-feasible. Its secondary purpose is to display the level of agreement between stakeholders.
Each row represents an optimal design that is preferred by a stakeholder according to a certain criterion. Each column displays the evaluation of the mono-criterion and stakeholder-optimal designs, from the viewpoint of each stakeholder, shown criterion by criterion. In each intersection between a row and a column, a colored cell indicates the possibilities for agreement (refer to the legend), according to the rules presented in Table 3. If a design does not encounter any red cells, that design is feasible. Note that with this layout, the matrix’s downward diagonal is always green, but the matrix’s content is not symmetrical with respect to that diagonal. Each colored cell has its own unique meaning.
Intersections between stakeholders define the quadrants within the matrix. The sizes of those quadrants are proportional to the number of criteria per stakeholder. Quadrants that confront two different stakeholders may be seen as “negotiation quadrants”. Those are the most important quadrants in the matrix since they will support negotiations. Quadrants that confront a stakeholder with I, i.e., quadrants on the downward diagonal, are rather informative. They give an idea of how complex it may be for stakeholders to decide on a multicriteria optimum for themselves. In general, the greener the matrix, the more favorable the scenario.
The matrix for Scenario 1 (Figure 3) indicates that the optimal designs preferred by the CCIAG encounter very difficult negotiations (see the lower-left quadrant). Most of the designs infringe NO-Gos or require heavy tolerance from the LNCMI. The {85 °C, 20 MWh} design is feasible, but it represents an economic NO-GO for the CCIAG itself. A specific conclusion would be that the CCIAG’s aspirations are difficult to meet in this scenario.
Conversely, the optimal designs preferred by the LNCMI require slightly easier negotiations (upper-right quadrant). They require a generally lesser tolerance from the CCIAG, although most encounter an economic NO-GO. In addition, in this scenario, the LNCMI is meant to be the system’s owner; therefore, their preferences should be prioritized. Without relaxations by the stakeholders, the {85 °C, 10 MWh} design is the only feasible solution.
The conclusions for Scenario 1 (without relaxations) would be as follows. First, only the {85 °C, 10 MWh} design is feasible. Second, the LNCMI’s preferences have better chances of prevailing after negotiations. Third, the biggest limitations are exergy- and exergoeconomic-related for the LNCMI and are economy-related for the CCIAG. Relaxations are needed to facilitate a technical compromise. Fourth, the LNCMI prefers designs at 85 °C if they are the owner of the WHRS.
Figure 4 presents the cross-analysis matrices for the other scenarios. The most evident conclusion is that Scenario 4 (i.e., a consortium) is the most feasible scenario. It does not encounter any NO-GO. Another conclusion is that in Scenarios 2 and 3, none of the mono-criterion preferences are feasible. The {85 °C, 10 MWh} solution is feasible, but it is not mono-criterion optimal and, thus, is not displayed in the matrix. It can also be observed that none of the solutions at 50 °C are represented in either of the matrices, which means that they are not very promising.
The following subsection displays the matrices after relaxations and analyzes the influence of each type of relaxation.

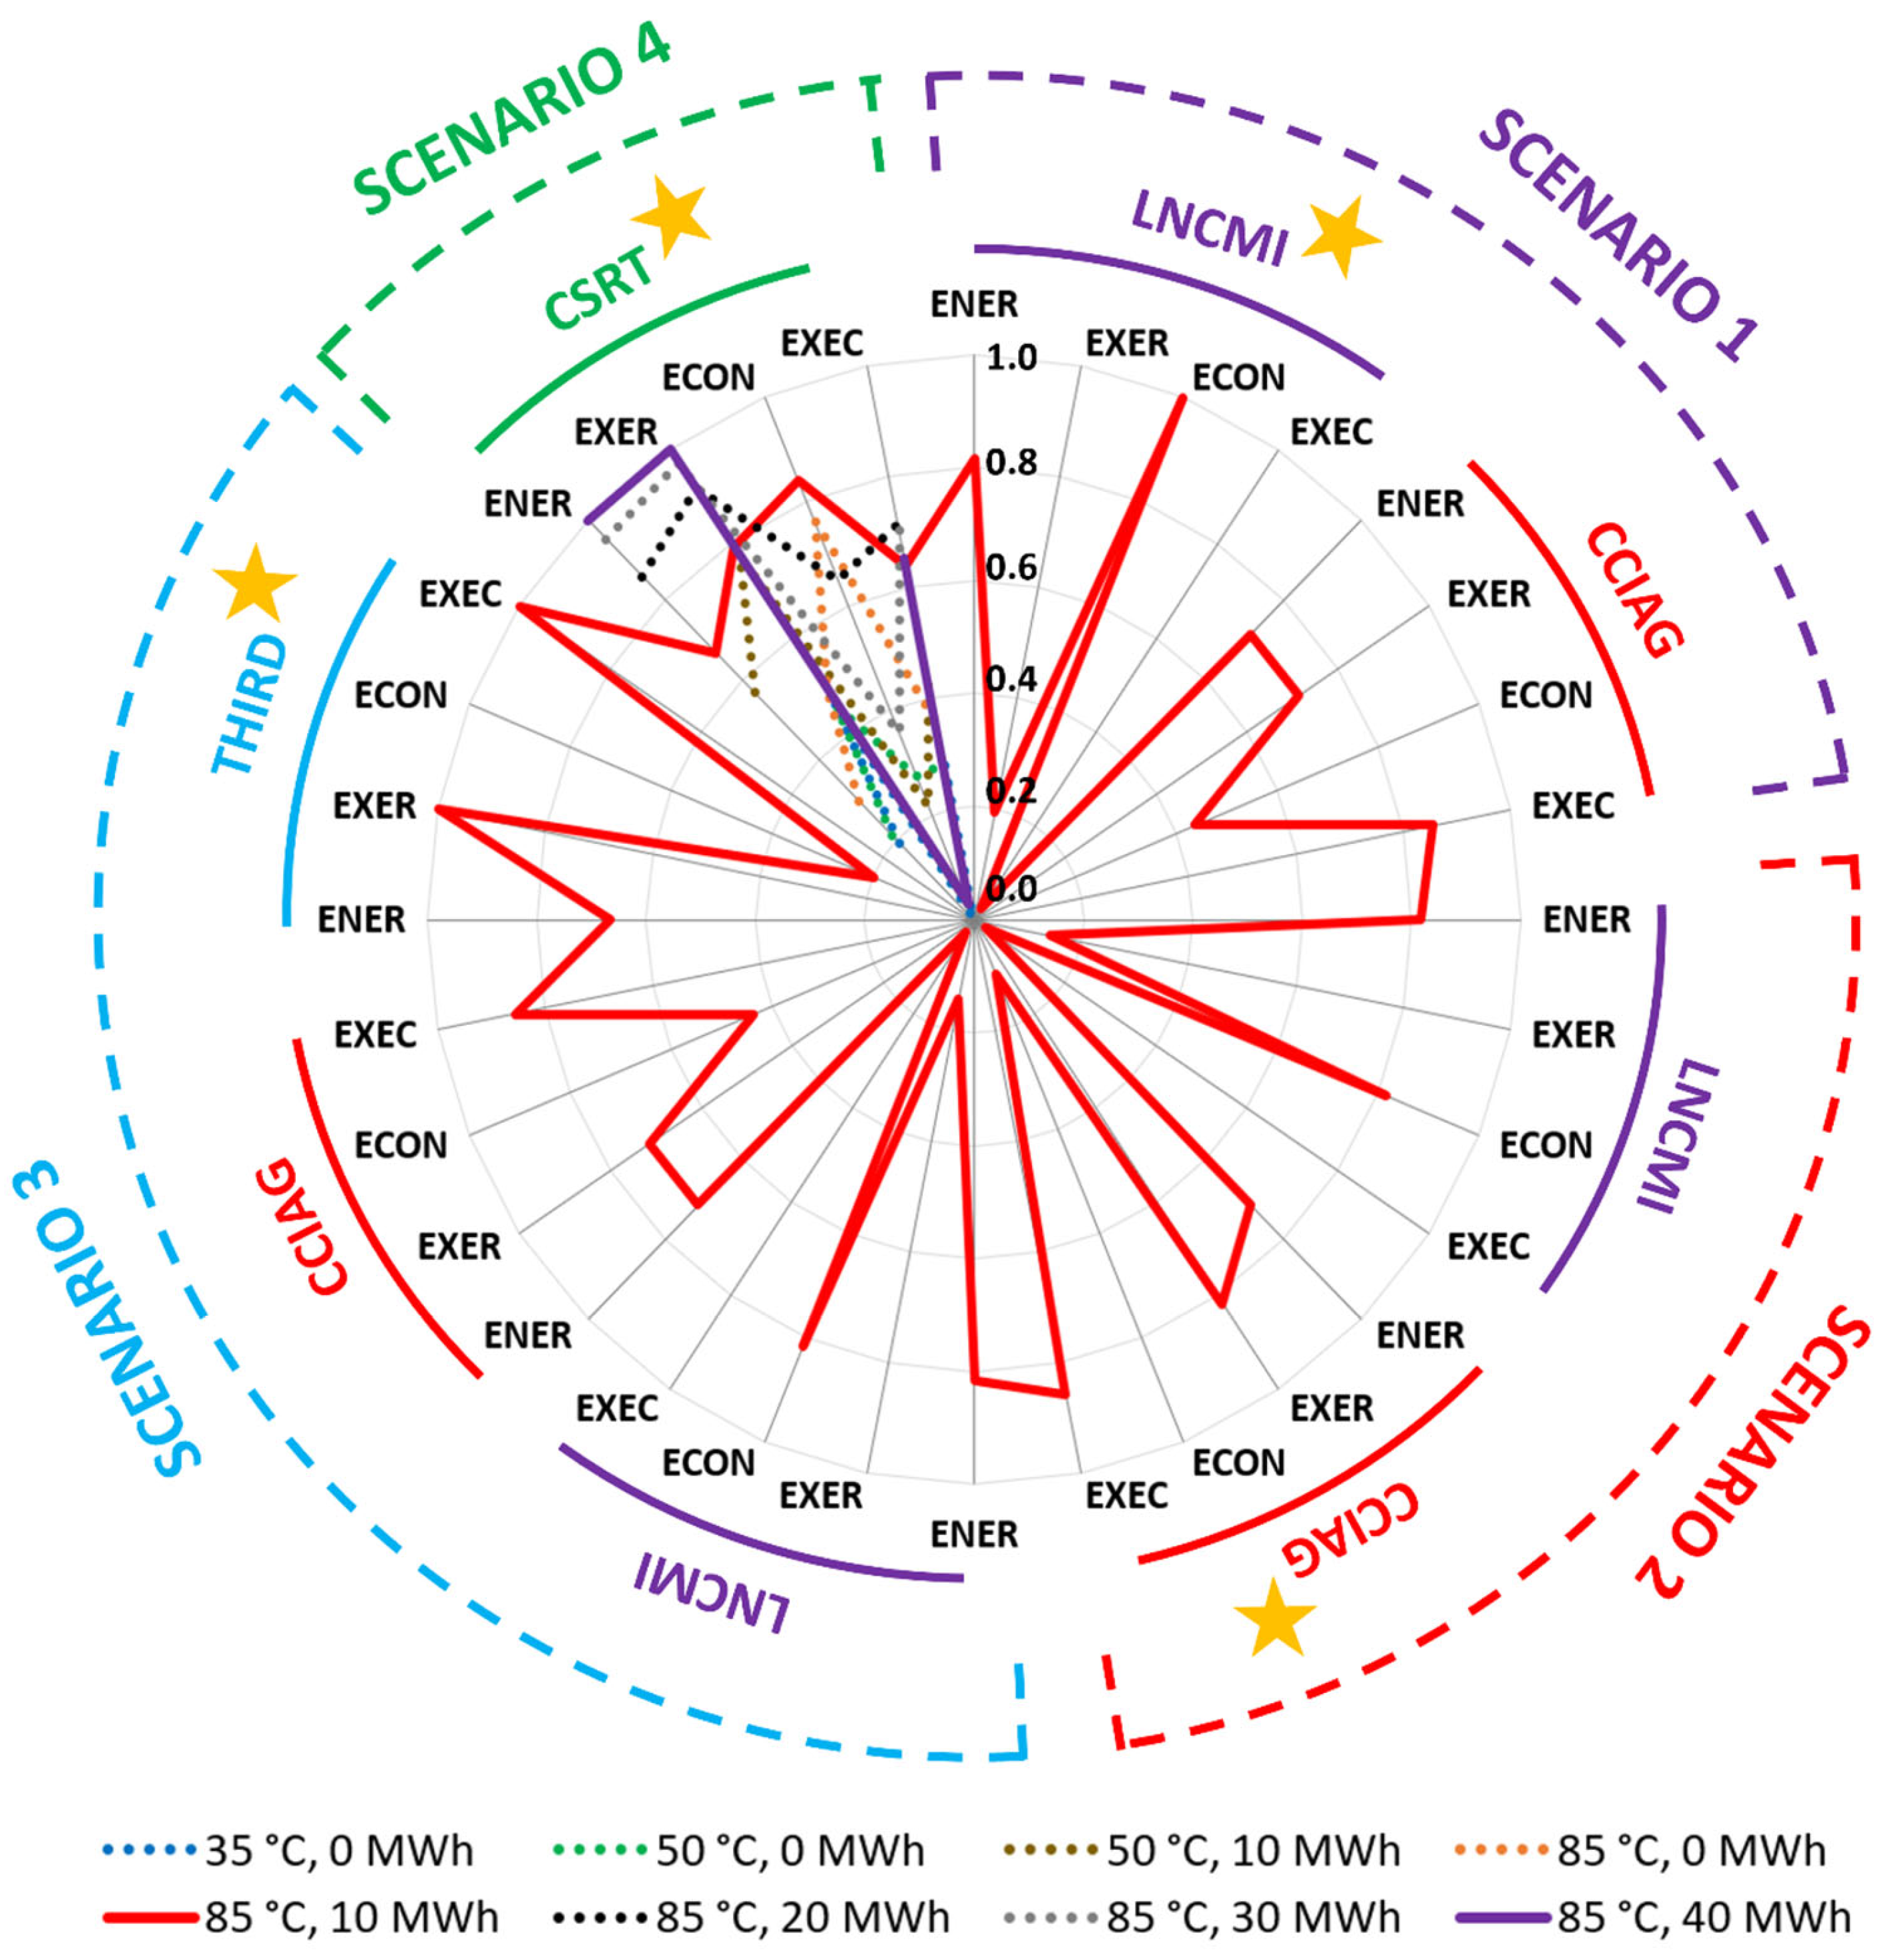
3.2. Relative Optimality (Multicriteria Radar)

Figure 5 presents the multicriteria evaluation (energy, exergy, economy, and exergoeconomics) of the different technical designs in each ownership scenario. The data are represented in the form of a radar chart.
Each angular position within the chart represents one performance criterion for one stakeholder in one scenario. In each scenario, the owner of the technical system is highlighted with a yellow star. The radial axis represents relative optimality, wherein the values of 1 and 0 correspond to the most and least efficient designs, respectively. Relative optimality is assessed for each criterion and amongst all available designs, before and after relaxations. Only feasible designs are represented, i.e., those that do not violate any NO-GO from the stakeholders. Designs represented with continuous lines are optimal for at least one criterion. Those represented with dotted lines are not; therefore, they are dominated by other designs. For every criterion, there exists at least one optimal design (value = 1). Mono-criterion optimums not displayed in Figure 5 are unfeasible, due to NO-GO violation on another criterion (see Table A1 in Appendix A). Some of those unfeasible optimums are accessible through relaxations, as Section 3.3 will later prove.
Out of 15 designs analyzed, just 8 are feasible. Of those 8 designs, 7 are feasible if, and only if, a multi-stakeholder consortium is built (the “CSRT” scenario). This approach enables more designs because it enlarges the socio-energetic node. For example, a design may be locally non-feasible for the LNCMI or the CCIAG but may be feasible for the consortium as a whole. It is concluded that a joint consortium is the approach that most contributes to the project’s feasibility prior to relaxations. It should be noted, however, that agreeing to form a consortium is, in itself, a sort of relaxation.
Only the {85 °C, 10 MWh} design is feasible without a consortium. In fact, this design is feasible in any scenario. It may be concluded that it is the most versatile design. Nevertheless, its overall performance may be insufficient for agreement. In all scenarios other than “CSRT”, this design has serious shortcomings. Those are exergy-related for the LNCMI and are economy-related for the other stakeholders. The feasibility of the project will depend on the weight (importance) that each stakeholder gives to each criterion.
All designs that involve a waste heat temperature of 85 °C are feasible in at least one scenario. Furthermore, all mono-criterion optimums that are feasible are granted by a design at 85 °C. It is, thus, concluded that 85 °C is the most promising design temperature prior to relaxations. In addition, the radar chart allows us to check the influence of storage capacity at 85 °C in Scenario 4, since all designs are feasible in this scenario at this temperature. Increasing storage capacity from 0 MWh to 10 MWh improves performance in all criteria. After that, the energy and exergy indicators improve consistently with storage capacity, while the economic indicator drops consistently. The exergoeconomic indicator reaches its optimum at 20 MWh and decreases past that point.
As expected, no design meets all mono-criterion optimums. This is due to the large variety of scenarios involved, which justifies the need for this type of diagram. The definitive solution would depend on the weight attributed to each criterion. The search for a definitive solution is not covered in this article, but Section 3.4 discusses it theoretically. Assuming the same weight for all criteria, the radar chart suggests {85 °C, 10 MWh} and {85 °C, 20 MWh} as the most balanced designs.
The paragraphs above have illustrated how to build, read, and interpret the radar charts. The authors think that this tool may help project leaders and policymakers in deciding on technical designs when non-technical specialists are involved.

3.3. Effects of Stakeholders’ Flexibility

Figure 6 presents the matrices for Scenarios 1, 2, and 3 after applying the relaxations described in Table 3. In each matrix, the new mono-criteria optimums are highlighted in ochre. Scenario 4 is not displayed because its matrix stayed the same as in Figure 4.
After the relaxations, many more solutions become feasible. The exergy-related NO-GOs have disappeared. The economy-related NO-GOs persist, but their effects have been mitigated. In fact, all designs that infringe the economic NO-GO imply maximal storage capacity (40 MWh). It is also noticeable that solutions at 50 °C are still not promising regarding mono-criteria, even after the relaxations.
For a more detailed analysis, Figure 7 presents the separate effects of the LNCMI’s and CCIAG’s relaxations on Scenario 1. As a reminder, the relaxations include: dropping the price of LNCMI’s waste heat by 50%; ignoring CCIAG’s amortization needs on the existing network by 50%; and disregarding the exergy- and exergoeconomic-related NO-GO thresholds for both stakeholders.
The LNCMI’s relaxations seem more impactful. They unlock all exergy-related NO-GOs and one economic NO-GO. Moreover, they mitigate some economy-related tolerance requirements for both them and the CCIAG. Meanwhile, the CCIAG’s relaxations do not seem very impactful. They only unlock a NO-GO with the {85 °C, 20 MWh} solution, which is also unlocked by relaxation by the LNCMI. That seems to suggest that relaxations from upstream stakeholders might have a greater impact than those of downstream stakeholders. However, there are insufficient results to assert, let alone generalize such a claim. Since further investigation is needed, the authors are planning on prospective works on the upstream/downstream effects of actors and their choices. Still, some economic NO-GOs can only be unlocked through both relaxations. That suggests that the feasibility of multi-stakeholder projects should be a collective effort. Synergies between stakeholders and their decisions should be maximized. In general, the stakeholders’ tolerance can unlock more and better solutions.
This study considered stakeholders’ flexibility in terms of relaxation on criteria and certain prices. However, other types of flexibility can be investigated. For instance, the LNCMI has a flexible energy profile, i.e., they can adapt their yearly schedule of experiments [45,46]. This way, they can match their heat rejection more closely with the district’s heat needs [37]. The LNCMI’s energy flexibility is currently a subject under investigation by the authors, along with some of their peers.
Figure 8 presents the radar chart after relaxations by the stakeholders. The scenarios, stakeholders, criteria, and axes are the same as those in Figure 5, but the relaxations described in Table 3 have also been applied. This discussion focuses on the effects of relaxations.
Overall, relaxations increased the number of promising designs and the possibilities for agreement compared to the base case (Figure 5). The most remarkable example is the {85 °C, 20 MWh} design. It went from the suboptimal and only feasible choice in Scenario 4 (Figure 5) to pluri-criterion optimal and feasible in any scenario (Figure 8). Moreover, if the whole radar chart is scouted, this design is now the most efficient one in 17 out of 32 instances, 6 of which are mono-criterion optimums. Thanks to relaxations, this design has now become the most promising choice.
Meanwhile, the {85 °C, 10 MWh} design was relegated to the second-most promising choice. It went from being the most efficient and, often, the only feasible design (Figure 5) to only standing out in 4 out of 32 instances. It showed mixed effects from relaxations: although most of its performances rose, it was outperformed by newly feasible designs. Its economic indicators dropped for the LNCMI due to waste heat price reduction but rose for the rest of the actors, thanks to this relaxation. This design can still outperform the {85 °C, 20 MWh} design if economic criteria are given more weight than other criteria.
Relaxations unlocked feasibility for four more designs: {35 °C, 10 MWh}, {35 °C, 20 MWh}, {50 °C, 20 MWh}, and {50 °C, 30 MWh}. They also extended the feasibility of the already identified designs to new scenarios. However, most of the newly feasible solutions were dominated by the two favorites: ({85 °C, 10 MWh} and {85 °C, 20 MWh}).
In light of the discussion above, the following ranking of solutions is proposed. Assuming equal weights for all criteria, the most promising approach is Scenario 4 with the {85 °C, 20 MWh} design. Besides this, the {85 °C, 20 MWh} design is the most promising multicriteria candidate in all scenarios. The {85 °C, 10 MWh} design is a promising alternative, especially if the economic criterion is given more weight than the others. These two designs give a decent range of options for agreement between stakeholders, and the feasibility of the project is more likely to be secured than before relaxations were made. In Scenario 4, the {85 °C, 40 MWh} design might be the favorite if the energy and exergy indicators are given more weight than the others.
Besides the absolute and relative performances, the radar chart yields three important pieces of information. First, the density of the solutions points out the most favorable scenarios for reaching an agreement. In this case, these are Scenarios 2 and 4, as they admit 12 and 9 solutions, respectively, out of 15 possible solutions. Second, the flexibility of the different solutions can also be assessed. In this case, the {85 °C, 0 MWh}, {85 °C, 10 MWh}, {85 °C, 20 MWh}, and {50 °C, 0 MWh} solutions are the most flexible, as they are feasible in any scenario. Third, the distances from the outermost radius tell us that there is room available for further improvement. In this case, 14 monocriterion optimums have been unlocked out of 32 possible optimums.

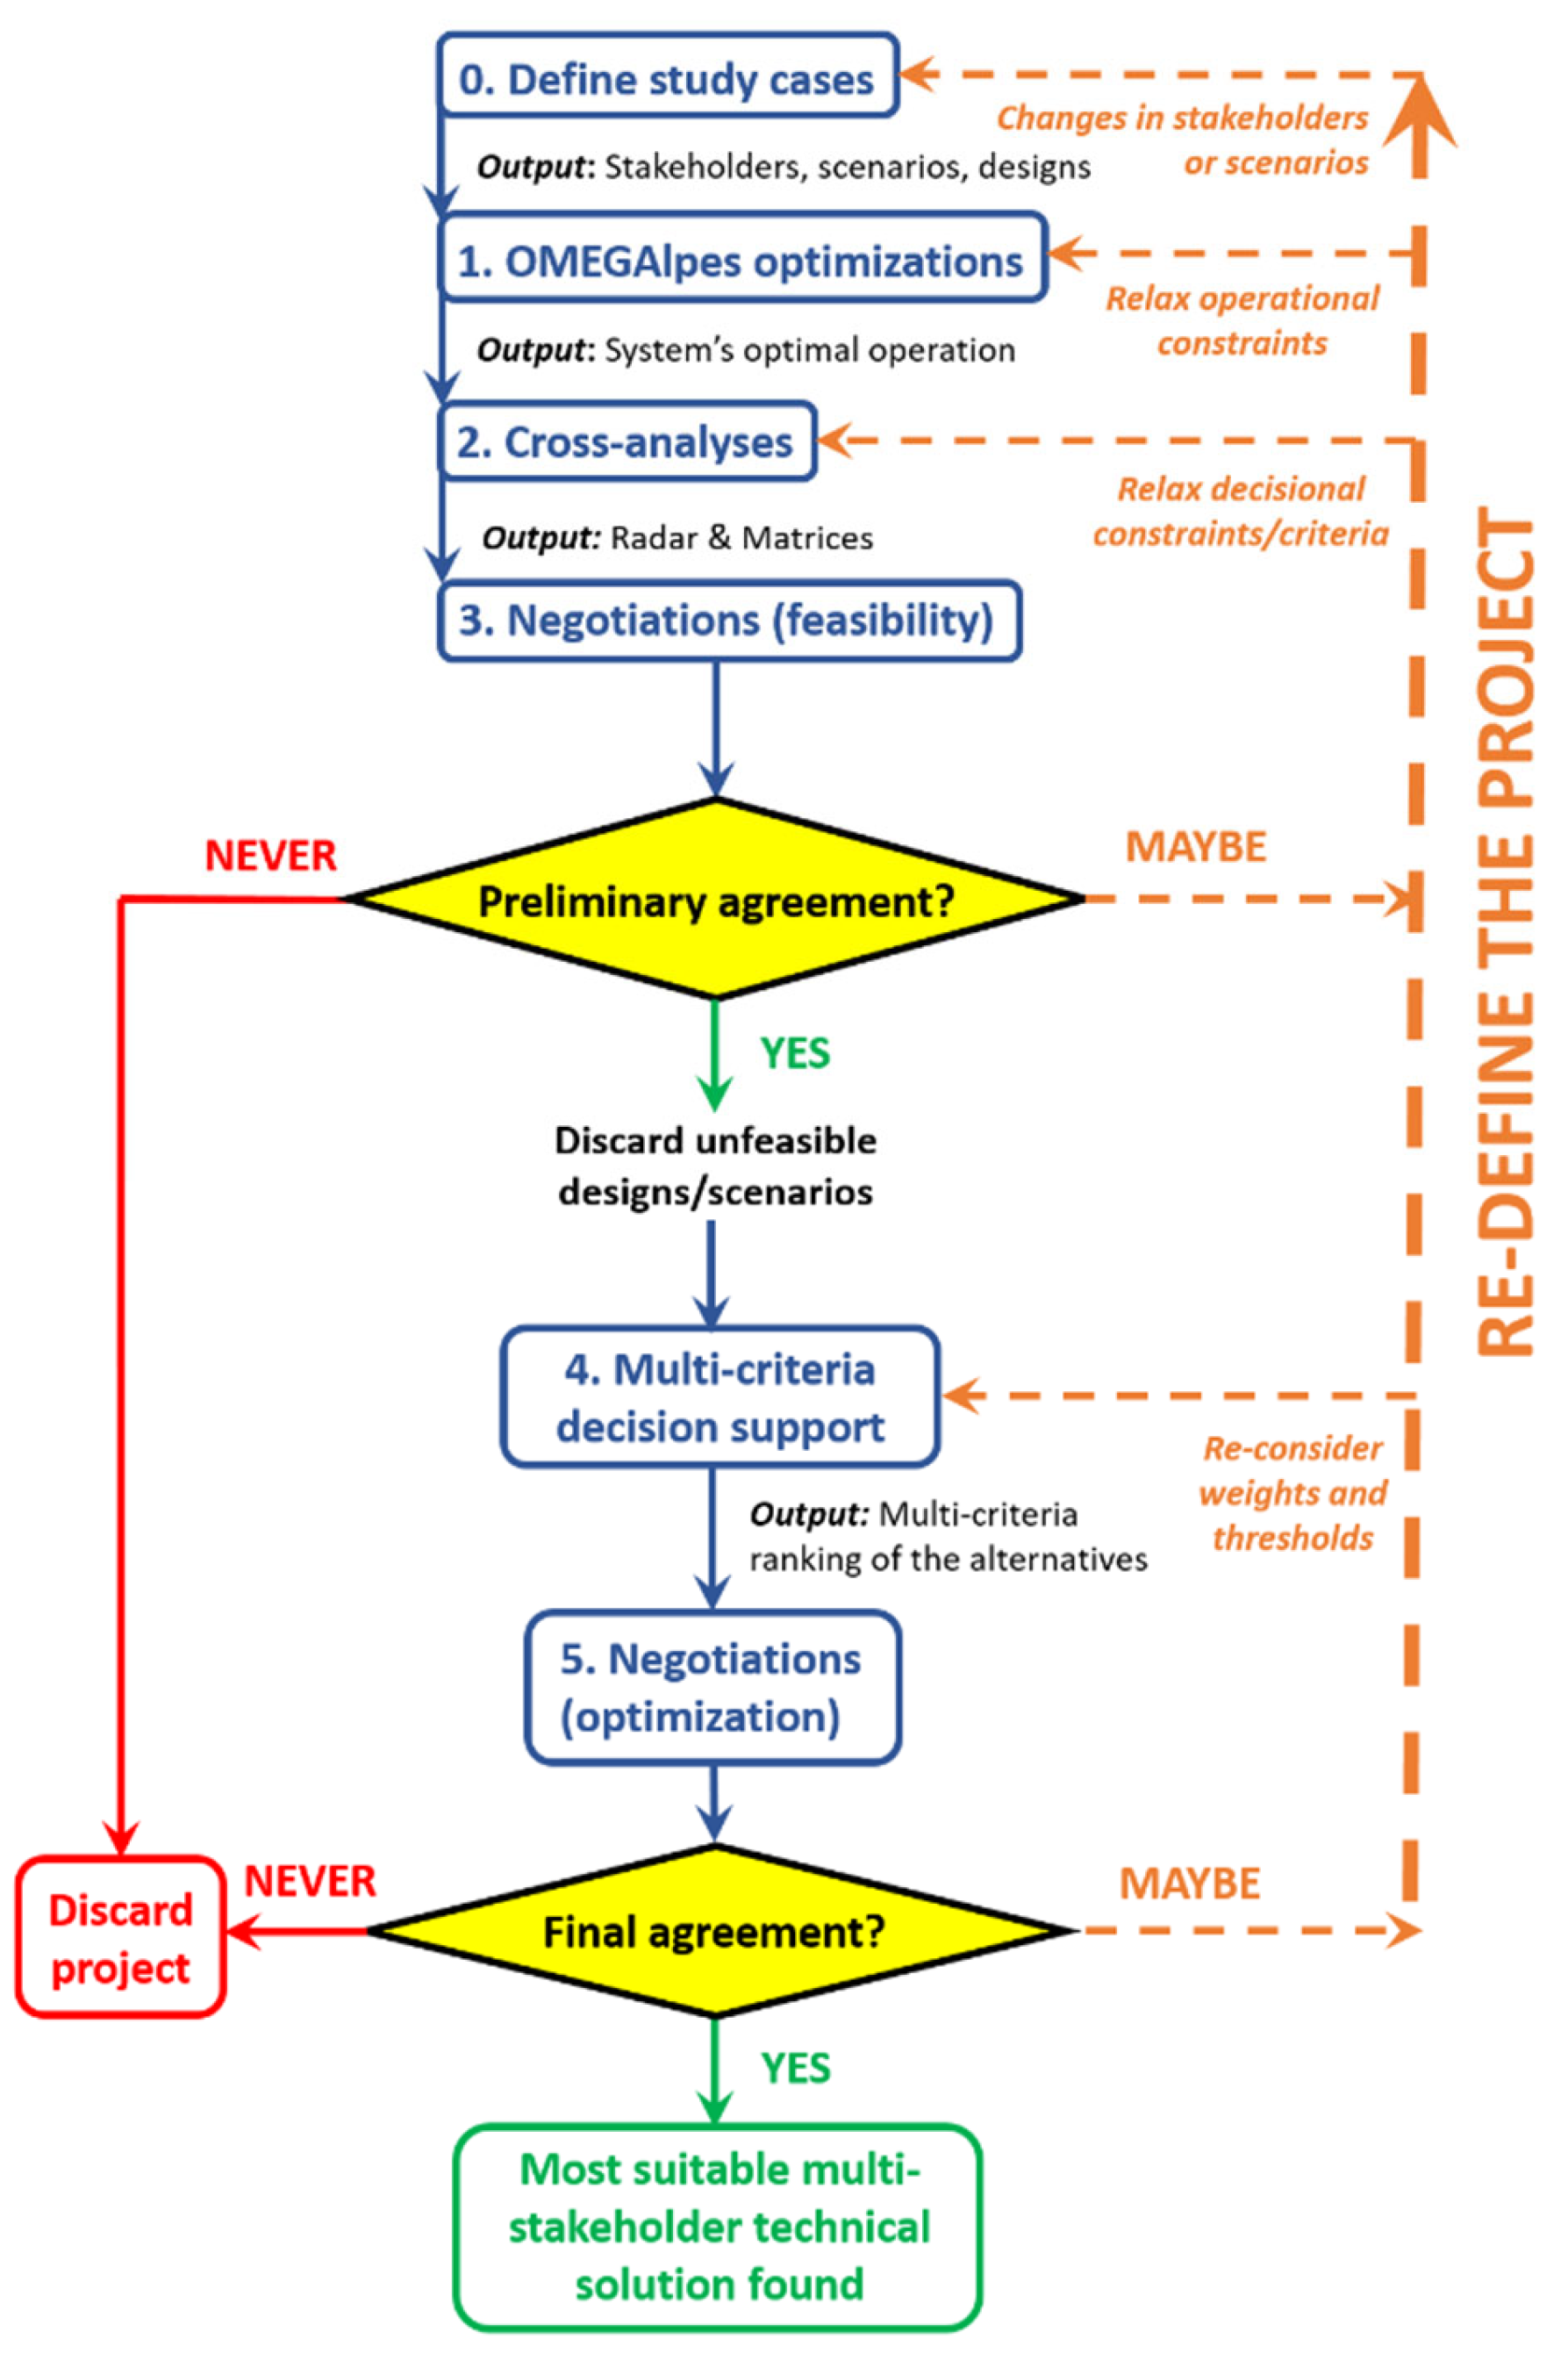
3.4. Toward an Iterative Decision Procedure

The tools and methods presented in this article belong with the negotiation support algorithm presented in Figure 2. The algorithm starts by identifying the stakeholders involved in the project, the possible designs for the energy system, and the possible scenarios of ownership (Step 0). Then, the system’s operating performance is optimized for each design (Step 1). In this study, this step was performed by means of OMEGAlpes, an open-source MILP tool (mixed-integer linear programming).
The choice of an energy dispatch optimizer for Step 1 is open. While OMEGAlpes was used here, any other dispatch optimizer could have been used: non-linear (NLP, MINLP), energy management systems (EMS), etc. The only conditions are: (1) that it be state of the art and verified (through peer review); (2) that it considers all the optimization variables, objective functions, and performance indicators necessary to make decisions. Moreover, the robustness of this multi-stakeholder methodology depends on the underlying hypotheses and limitations of the energy dispatch optimizer. For that reason, prospective studies are planned by the authors to analyze the sensitivity of this multi-stakeholder method to other dispatch optimizers.
With the results given by OMEGAlpes, the analysis presented in this article is applied (Step 2). With the radar chart and the matrices, the project enters preliminary negotiations (Step 3) to verify whether at least one scenario and design respects all of the NO-GO criteria. The radar chart indicates whether more interesting solutions can be unlocked through relaxations, and the matrices point out the kinds of relaxations that would be necessary.
The assumption of stakeholders’ tolerance and relaxation capacities is a simplification with respect to real-world negotiation complexities. A stakeholder’s capacity to accommodate sub-optimal solutions (in terms of their interests) can be a very dynamic and volatile variable. It will depend on quantitative and qualitative factors, as well as on interactions with other stakeholders. The method described in this article is just a preliminary effort to bridge the gap between technical modeling and human decision-making. The goal, rather than governing negotiations through technical modeling, is to make technical models sensitive, adaptive, and responsive to human decisions. The authors’ perspectives include field validation of the methodology. This field validation will rely on interviews for an accurate representation of every stakeholder’s criteria, objectives, and tolerance.
Past Step 3, if more than one feasible design/scenario does exist, the decision support stage begins (Step 4). At this point, stakeholders must decide on the weight and tolerance thresholds that they will allocate to each criterion. A multicriteria decision analysis (MCDA) is then possible with any state-of-the-art method (for instance, ELECTRE [47]). These methods may be computationally costly if many alternatives are available, hence the importance of discarding non-feasible designs upon preliminary negotiations (at the end of Step 2). The results from the MCDA support the final negotiation stage (Step 5). At this point, stakeholders must select one design that suits their aspirations, oftentimes through a compromise.
Both preliminary and final negotiations are opportunities for redefining the project, if necessary. This auxiliary procedure may include changes in the ownership scenarios (Step 0), the relaxation of operational constraints (Step 1), the relaxation of NO-GO criteria (Step 2), or changes in criteria weights and thresholds (Step 4). If, despite all redefinitions, relaxations, and negotiations, the stakeholders do not agree on the project’s feasibility (Step 3) or optimality (Step 5), then the project will eventually be discarded.
This decision algorithm has two main innovations: (1) it accounts for the system’s operating life already in the design phase; (2) it is sensitive and adaptive to the stakeholders’ decisions.

4. Conclusions

This article investigated the preliminary implementation of a methodology to support the multicriteria technical conception of an energy project in a multi-stakeholder context. The methodology can consider various decision criteria with different weights, depending on the stakeholder. Then, the project’s operation is simulated over a set time period and a multicriteria and multi-scenario analysis is performed. The main innovations are: the multi-stakeholder definition of performance indicators, including the possible relaxations and tolerances; a multi-scenario analysis depending on equipment ownership; and the disposition of visual tools to facilitate negotiations between decision-makers. Thus, the methodology is sensitive, adaptive, and responsive to stakeholders’ choices.
This article illustrates the application of this methodology to a real case study, with a special focus on how relaxations of stakeholders’ preferences can facilitate the success of a project. The study relied on the use of a MILP optimization tool called OMEGAlpes to optimize yearly management of the energy flows, but any other optimizer could have been used as long as it is verified and state of the art. On top of the optimizer’s results, this methodology applies two visual tools to assist negotiations between stakeholders. The first one is a multi-criteria, multi-stakeholder, and multi-scenario radar chart that points out the most promising solutions, the non-acceptable ones, and the most flexible scenarios. The second tool is a multi-criteria and multi-stakeholder matrix that cross-analyzes the optimal technical solutions preferred by the different stakeholders and points out the most impactful relaxations.
For the study case presented in this article, it was found that relaxations by the stakeholders are highly recommendable and almost necessary. Before relaxations, in most of the scenarios, just 1 out of 15 technical designs was feasible. After relaxations, at least three designs were feasible in every scenario, including one that challenged the most suitable design pre-relaxations. It was found that relaxations on economy- and exergy-related indicators were the most impactful. The results of this article showed that the variety of stakeholders can shift the project toward different designs that, even if not ideal for some stakeholders, may be more beneficial in the bigger picture. Such designs may never be identified if some of the stakeholders or some of the criteria were excluded from the analysis.
This methodology can be extended to many types of stakeholders, as long as their involvement has consequences for the technical conception of the project. It can also be enriched with additional criteria, as long as they can be quantified in some way. The work planned by the authors after this article is to adapt existing multi-criteria decision analysis (MDCA) procedures in order to apply them to multiple-stakeholder scenarios. After that work is conducted, all tools will be ready for the iterative algorithm described in the last subsection of this article.
The decision support tools proposed (a multi-criteria radar chart and cross-analysis matrices) provide visual negotiation aids, but their effectiveness in real-world decision-making processes needs to be empirically tested. Furthermore, the conditions and extent of relaxations by the stakeholders need careful consideration, as they significantly changed project feasibility and design preferences in this case study. They could also affect project sustainability and stakeholder buy-in. For these reasons, a prospective study is envisaged where the criteria, weights, tolerances, and relaxation capacities will be determined through direct interviews with the stakeholders. Then, the matrices and radar charts will be presented to the stakeholders for their feedback.

Supplementary Materials

The following supporting information can be downloaded at: https://www.mdpi.com/article/10.3390/en17092009/s1, Table S1: Input data for the energy model; Table S2: Formulation of the energy balance for every unit in the study case; Table S3: Input data for the exergy model (to be aggregated to that in the energy model); Table S4: Formulation of the exergy balance for every unit in the study case; Table S5: Input data for the economic and exergoeconomic models (to be aggregated to the energy and exergy models); Table S6: Formulation of the cost flow balance for every unit in the study case. Figure S1. Depiction of the socio-energetic nodes in Scenario 1, where LNCMI is the owner of the prospective energy system. Figure S2. Depiction of the socio-energetic nodes in Scenario 2, where CCIAG is the owner of the prospective energy system. Figure S3. Depiction of the socio-energetic nodes in Scenario 3, where THIRD is the owner of the prospective energy system. Figure S4. Depiction of the socio-energetic nodes in Scenario 4, where a LNCMI/CCIAG consortium is the owner of the prospective energy system.

Author Contributions

Conceptualization, J.F. and J.R.; methodology, J.F. and J.R.; software, J.F.; validation, J.R.; formal analysis, J.F. and J.R.; investigation, J.F. and J.R.; resources, J.R.; data curation, J.F.; writing—original draft preparation, J.F. and J.R.; writing—review and editing, J.F. and J.R.; visualization, J.F. and J.R.; supervision, J.R.; project administration, J.R.; funding acquisition, J.R. All authors have read and agreed to the published version of the manuscript.

Funding

The authors are grateful to the ADEME (i.e., the French Agency for Ecological Transition) for their financial support through the RETHINE project (Réseaux Electriques et Thermiques Interconnectés, grant number 1805C0001).

Data Availability Statement

Data are contained within the article (and Supplementary Materials).

Acknowledgments

The authors thank the team involved in the implementation of the optimization tool used in this study, i.e., OMEGAlpes. The authors thank the corresponding representatives and decision-makers from the CCIAG for sharing real operational data from their facilities. The authors thank the corresponding representatives and decision-makers from the French National Laboratory of High Magnetic Fields (LNCMI) for facilitating real operational data to construct the model hourly energy profile of electricity consumption used in this study; allowing us to display that hourly profile in the several published works that this case study has yielded; and for allowing us to make the data available in the OMEGAlpes documentation [34] for public use under license (ODC-By v1.0).

Conflicts of Interest

The authors declare no conflicts of interest.

Abbreviations

The following abbreviations are used in this manuscript:
chChemicalinInlet
chrgHeat charge of the thermal storage unitiniInitial
CICapital investmentLLosses
coolingMagnet’s cooling processmagnetsLNCMI’s high-intensity magnets
CFCoverage factormaxMaximal
COMCosts of operation and maintenanceminMinimal
COPCoefficient of performancemonoMono-criterion
DDestructionmultiMulti-criterion
dchgHeat discharge of the thermal storage unitNPVNet present value
DHNDistrict heating networkOMOperation and maintenance
DISSDissipationoutOutlet
ECONEconomic criterionPProduct
ENEREnergetic criterionPECPurchased equipment cost
EXERExergetic criterionpipingOverall pipeline layout
EXECExergo-economic criterionRACFRecovery and coverage factor
elecElectricalREFReference scenario
exExergeticRFRecovery factor
exoExogenousSSTNetwork sub-stations
FFuelTESThermal energy storage
fFinalTCITotal capital investment
GLOBGlobaluseUseful exergy destruction
HPHeat pumpwhWaste heat
HSHeat supplierWHRSWaste heat recovery system

Appendix A. Detailed Results for Each Technical Solution per Criteria and Scenario

Table A1 presents the results before relaxations.
Table A1. Results before relaxations, shown by scenario, stakeholder, and criterion for every possible system design.
ScenarioStakeholderCriterion35 °C—Reference35 °C—0 MWh35 °C—10 MWh35 °C—20 MWh35 °C—30 MWh35 °C—40 MWh50 °C—0 MWh50 °C—10 MWh50 °C—20 MWh50 °C—30 MWh50 °C—40 MWh85 °C—0 MWh85 °C—10 MWh85 °C—20 MWh85 °C—30 MWh85 °C—40 MWh
SCENARIO 1LNCMI
[OWNER]
ENER0.000.200.330.380.410.420.220.360.420.450.460.300.450.510.540.55
EXER7.598.238.688.848.928.968.248.308.328.348.348.097.507.267.157.10
ECON0.000.02−0.61−1.91−3.40−4.981.120.99−0.14−1.56−3.102.813.532.951.630.13
EXEC0.991.051.171.251.331.401.081.131.181.231.281.080.980.950.930.92
CCIAG
[NOT OWNER]
ENER0.000.230.390.450.480.490.230.370.430.450.470.230.350.400.420.43
EXER29.823.218.717.116.215.823.419.217.716.916.523.119.818.517.917.6
ECON0.000.000.000.000.000.000.130.000.000.000.000.650.290.000.000.00
EXEC1.861.571.381.351.371.401.541.371.341.361.401.481.351.331.361.41
SCENARIO 2LNCMI
[NOT OWNER]
ENER0.000.200.330.380.410.420.220.360.420.450.460.300.450.510.540.55
EXER7.597.287.066.986.946.917.617.277.147.087.048.097.507.267.157.10
ECON0.000.601.021.171.251.290.991.631.882.002.072.163.243.683.873.97
EXEC0.990.930.900.880.880.870.990.940.920.910.901.080.980.950.930.92
CCIAG
[OWNER]
ENER0.000.230.390.450.480.490.230.370.430.450.470.230.350.400.420.43
EXER29.824.220.318.918.217.924.020.318.818.217.823.119.818.517.917.6
ECON0.00−0.58−1.63−3.08−4.65−6.280.26−0.63−2.01−3.56−5.161.300.57−0.73−2.24−3.84
EXEC1.861.691.651.721.821.931.621.561.601.691.781.481.351.341.361.41
SCENARIO 3LNCMI
[NOT OWNER]
ENER0.000.200.330.380.410.420.220.360.420.450.460.300.450.510.540.55
EXER7.597.287.066.986.946.917.617.277.147.087.048.097.507.267.157.10
ECON0.000.601.021.171.251.290.991.631.882.002.072.163.243.683.873.97
EXEC0.990.930.900.880.880.870.990.940.920.910.901.080.980.950.930.92
CCIAG
[NOT OWNER]
ENER0.000.230.390.450.480.490.230.370.430.450.470.230.350.400.420.43
EXER29.823.218.717.116.215.823.419.217.716.916.523.119.818.517.917.6
ECON0.000.000.000.000.000.000.130.000.000.000.000.650.290.000.000.00
EXEC1.861.571.381.351.371.401.541.371.341.361.401.481.351.331.361.41
THIRD
[OWNER]
ENER0.001.501.501.491.491.491.301.301.301.301.301.001.001.001.001.00
EXER2.050.961.621.861.982.050.621.031.181.261.300.000.000.000.000.01
ECON0.00−0.58−1.63−3.08−4.65−6.280.13−0.63−2.01−3.56−5.160.650.29−0.73−2.24−3.84
EXEC52512227236945052583.11892613243810.000.200.440.710.98
SCENARIO 4CONSORTIUM
[OWNER]
ENER0.000.050.130.170.190.210.050.130.180.200.220.070.160.200.230.24
EXER37.431.527.425.925.224.831.627.626.025.224.831.227.325.725.024.7
ECON0.000.02−0.61−1.91−3.40−4.981.250.99−0.14−1.56−3.103.473.822.951.630.13
EXEC2.842.622.552.602.692.802.622.502.522.592.682.562.342.282.292.33
Table A2 presents the results after relaxations.
Table A2. Results after relaxations, by scenario, stakeholder, and criterion for every possible system design.
ScenarioStakeholderCriterion35 °C—Reference35 °C—0 MWh35 °C—10 MWh35 °C—20 MWh35 °C—30 MWh35 °C—40 MWh50 °C—0 MWh50 °C—10 MWh50 °C—20 MWh50 °C—30 MWh50 °C—40 MWh85 °C—0 MWh85 °C—10 MWh85 °C—20 MWh85 °C—30 MWh85 °C—40 MWh
SCENARIO 1LNCMI
[OWNER]
ENER0.000.200.330.380.410.420.220.360.420.450.460.300.450.510.540.55
EXER7.598.238.688.848.928.968.248.308.328.348.348.097.507.267.157.10
ECON0.000.400.20−0.98−2.42−3.971.111.290.74−0.62−2.132.523.082.812.221.02
EXEC0.850.931.061.151.221.290.910.981.041.091.140.860.810.790.780.78
CCIAG
[NOT OWNER]
ENER0.000.230.390.450.480.490.230.370.430.450.470.230.350.400.420.43
EXER29.823.218.717.116.215.823.419.217.716.916.523.119.818.517.917.6
ECON0.00−0.38−0.81−0.92−0.98−1.020.14−0.29−0.88−0.94−0.970.950.730.14−0.59−0.89
EXEC1.861.551.361.331.341.381.521.341.311.321.361.441.291.261.291.33
SCENARIO 2LNCMI
[NOT OWNER]
ENER0.000.200.330.380.410.420.220.360.420.450.460.300.450.510.540.55
EXER7.597.287.066.986.946.917.617.277.147.087.048.097.507.267.157.10
ECON0.000.300.510.590.630.650.500.810.941.001.031.081.621.841.941.99
EXEC0.850.830.810.800.800.790.840.810.800.800.800.860.810.790.780.78
CCIAG
[OWNER]
ENER0.000.230.390.450.480.490.230.370.430.450.470.230.350.400.420.43
EXER29.824.220.318.918.217.924.020.318.818.217.823.119.818.517.917.6
ECON0.002.821.980.60−0.93−2.533.853.282.020.54−1.035.485.304.212.801.24
EXEC1.861.661.611.681.771.881.591.501.541.621.711.441.291.261.291.33
SCENARIO 3LNCMI
[NOT OWNER]
ENER0.000.200.330.380.410.420.220.360.420.450.460.300.450.510.540.55
EXER7.597.287.066.986.946.917.617.277.147.087.048.097.507.267.157.10
ECON0.000.300.510.590.630.650.500.810.941.001.031.081.621.841.941.99
EXEC0.850.830.810.800.800.790.840.810.800.800.800.860.810.790.780.78
CCIAG
[NOT OWNER]
ENER0.000.230.390.450.480.490.230.370.430.450.470.230.350.400.420.43
EXER29.823.218.717.116.215.823.419.217.716.916.523.119.818.517.917.6
ECON0.00−0.38−0.81−0.92−0.98−1.020.14−0.29−0.88−0.94−0.970.950.730.14−0.59−0.89
EXEC1.861.551.361.331.341.381.521.341.311.321.361.441.291.261.291.33
THIRD
[OWNER]
ENER0.001.501.501.491.491.491.301.301.301.301.301.001.001.001.001.00
EXER2.050.961.621.861.982.050.621.031.181.261.300.000.000.000.000.01
ECON0.000.10−0.31−1.57−3.04−4.610.610.47−0.19−1.62−3.161.431.460.970.28−0.97
EXEC49911025134542549967.81632322923490.000.100.220.350.49
SCENARIO 4CONSORTIUM
[OWNER]
ENER0.000.050.130.170.190.210.050.130.180.200.220.070.160.200.230.24
EXER37.431.527.425.925.224.831.627.626.025.224.831.227.325.725.024.7
ECON0.000.500.20−0.98−2.42−3.971.721.760.74−0.62−2.133.954.543.782.501.02
EXEC2.712.492.422.482.572.672.432.322.342.422.512.302.102.062.072.11

References

  1. Lichtenegger, K.; Leitner, A.; Märzinger, T.; Mair, C.; Moser, A.; Wöss, D.; Schmidl, C.; Pröll, T. Decentralized heating grid operation: A comparison of centralized and agent-based optimization. Sustain. Energy Grids Netw. 2020, 21, 100300. [Google Scholar] [CrossRef]
  2. Lund, H.; Werner, S.; Wiltshire, R.; Svendsen, S.; Thorsen, J.E.; Hvelplund, F.; Vad Mathiesen, B.; Mathiesen, B.V. 4th Generation District Heating (4GDH). Energy 2014, 68, 1–11. [Google Scholar] [CrossRef]
  3. Broberg, S.; Backlund, S.; Karlsson, M.; Thollander, P. Industrial excess heat deliveries to Swedish district heating networks: Drop it like it’s hot. Energy Policy 2012, 51, 332–339. [Google Scholar] [CrossRef]
  4. Haas, J.; Nowak, W.; Palma-Behnke, R. Multi-objective planning of energy storage technologies for a fully renewable system: Implications for the main stakeholders in Chile. Energy Policy 2018, 126, 494–506. [Google Scholar] [CrossRef]
  5. Yao, R.; Hu, Y.; Varga, L. Applications of Agent-Based Methods in Multi-Energy Systems—A Systematic Literature Review. Energies 2023, 16, 2456. [Google Scholar] [CrossRef]
  6. Gährs, S.; Knoefel, J. Stakeholder demands and regulatory framework for community energy storage with a focus on Germany. Energy Policy 2020, 144, 111678. [Google Scholar] [CrossRef]
  7. Wang, G.; Blondeau, J. Multi-Objective Optimal Integration of Solar Heating and Heat Storage into Existing Fossil Fuel-Based Heat and Power Production Systems. Energies 2022, 15, 1942. [Google Scholar] [CrossRef]
  8. Battini, F.; Pernigotto, G.; Morandi, F.; Gasparella, A.; Kämpf, J.H. Assessment of Subsidization Strategies for Multi-Objective Optimization of Energy Efficiency Measures for Building Renovation at District Scale. Energies 2023, 16, 5780. [Google Scholar] [CrossRef]
  9. Alavijeh, N.M.; Steen, D.; Norwood, Z.; Tuan, L.A.; Agathokleous, C. Cost-Effectiveness of Carbon Emission Abatement Strategies for a Local Multi-Energy System—A Case Study of Chalmers University of Technology Campus. Energies 2020, 13, 1626. [Google Scholar] [CrossRef]
  10. Li, M.; Feng, Y.; Zhou, M.; Mu, H.; Li, L.; Wang, Y. Economic and Environmental Optimization for Distributed Energy System Integrated with District Energy Network. Energies 2019, 12, 1844. [Google Scholar] [CrossRef]
  11. Ye, B.; Zhou, M.; Yan, D.; Li, Y. Multi-Objective Decision-Making for Hybrid Renewable Energy Systems for Cities: A Case Study of Xiongan New District in China. Energies 2020, 13, 6223. [Google Scholar] [CrossRef]
  12. Schmeling, L.; Schönfeldt, P.; Klement, P.; Wehkamp, S.; Hanke, B.; Agert, C. Development of a Decision-Making Framework for Distributed Energy Systems in a German District. Energies 2020, 13, 552. [Google Scholar] [CrossRef]
  13. Thomsen, J.; Saad Hussein, N.; Senkpiel, C.; Hartmann, N.; Schlegl, T. An optimized energy system planning and operation on distribution grid level—The Decentralized Market Agent as a novel approach. Sustain. Energy Grids Netw. 2017, 12, 40–56. [Google Scholar] [CrossRef]
  14. Lichtenegger, K.; Wöss, D.; Halmdienst, C.; Höftberger, E.; Schmidl, C.; Pröll, T. Intelligent heat networks: First results of an energy-information-cost-model. Sustain. Energy Grids Netw. 2017, 11, 1–12. [Google Scholar] [CrossRef]
  15. Hinker, J.; Hemkendreis, C.; Drewing, E.; März, S.; Hidalgo Rodríguez, D.I.; Myrzik, J.M.A. A novel conceptual model facilitating the derivation of agent-based models for analyzing socio-technical optimality gaps in the energy domain. Energy 2017, 137, 1219–1230. [Google Scholar] [CrossRef]
  16. Miró, L.; Brueckner, S.; McKenna, R.; Cabeza, L.F. Methodologies to estimate industrial waste heat potential by transferring key figures: A case study for Spain. Appl. Energy 2016, 169, 866–873. [Google Scholar] [CrossRef]
  17. Bolwig, S.; Bolkesjø, T.F.; Klitkou, A.; Lund, P.D.; Bergaentzlé, C.; Borch, K.; Olsen, O.J.; Kirkerud, J.G.; Chen, Y.K.; Gunkel, P.A.; et al. Climate-friendly but socially rejected energy-transition pathways: The integration of techno-economic and socio-technical approaches in the Nordic-Baltic region. Energy Res. Soc. Sci. 2020, 67, 101559. [Google Scholar] [CrossRef]
  18. Martin, N.; Rice, J. Improving Australia’s renewable energy project policy and planning: A multiple stakeholder analysis. Energy Policy 2015, 84, 128–141. [Google Scholar] [CrossRef]
  19. Heuninckx, S.; Boveldt, G.T.; Macharis, C.; Coosemans, T. Stakeholder objectives for joining an energy community: Flemish case studies. Energy Policy 2022, 162, 112808. [Google Scholar] [CrossRef]
  20. Sanderink, L.; Nasiritousi, N. How institutional interactions can strengthen effectiveness: The case of multi-stakeholder partnerships for renewable energy. Energy Policy 2020, 141, 111447. [Google Scholar] [CrossRef]
  21. Dashti, R.; Yousefi, S.; Parsa Moghaddam, M. Comprehensive efficiency evaluation model for electrical distribution system considering social and urban factors. Energy 2013, 60, 53–61. [Google Scholar] [CrossRef]
  22. Jano-Ito, M.A.; Crawford-Brown, D. Investment decisions considering economic, environmental and social factors: An actors’ perspective for the electricity sector of Mexico. Energy 2017, 121, 92–106. [Google Scholar] [CrossRef]
  23. Farías, I.; Bender, T. Urban Assemblages: How Actor-Network Theory Changes Urban Studies; Routledge: London, UK; New York, NY, USA, 2010; ISBN 978-0-415-48662-0. [Google Scholar] [CrossRef]
  24. Hampikian, Z. De la Distribution Aux Synergies? Circulations Locales d’énergie et Transformations des Processus de Mise en Réseau de la Ville; Université Paris-Est: Créteil, France, 2017. [Google Scholar]
  25. Wehkamp, S.; Schmeling, L.; Vorspel, L.; Roelcke, F.; Windmeier, K.-L. District Energy Systems: Challenges and New Tools for Planning and Evaluation. Energies 2020, 13, 2967. [Google Scholar] [CrossRef]
  26. Ha, Y.H.; Kumar, S.S. Investigating decentralized renewable energy systems under different governance approaches in Nepal and Indonesia: How does governance fail? Energy Res. Soc. Sci. 2021, 80, 102214. [Google Scholar] [CrossRef]
  27. Reda, F.; Ruggiero, S.; Auvinen, K.; Temmes, A. Towards low-carbon district heating: Investigating the socio-technical challenges of the urban energy transition. Smart Energy 2021, 4, 100054. [Google Scholar] [CrossRef]
  28. Simeoni, P.; Ciotti, G.; Cottes, M.; Meneghetti, A. Integrating industrial waste heat recovery into sustainable smart energy systems. Energy 2019, 175, 941–951. [Google Scholar] [CrossRef]
  29. Lund, R.; Ilic, D.D.; Trygg, L. Socioeconomic potential for introducing large-scale heat pumps in district heating in Denmark. J. Clean. Prod. 2016, 139, 219–229. [Google Scholar] [CrossRef]
  30. Taylor, P.C.; Abeysekera, M.; Bian, Y.; Ćetenović, D.; Deakin, M.; Ehsan, A.; Levi, V.; Li, F.; Oduro, R.; Preece, R.; et al. An interdisciplinary research perspective on the future of multi-vector energy networks. Int. J. Electr. Power Energy Syst. 2021, 135, 107492. [Google Scholar] [CrossRef]
  31. Höfer, T.; Madlener, R. A participatory stakeholder process for evaluating sustainable energy transition scenarios. Energy Policy 2020, 139, 111277. [Google Scholar] [CrossRef]
  32. Turcksin, L.; Macharis, C.; Lebeau, K.; Boureima, F.; Van Mierlo, J.; Bram, S.; De Ruyck, J.; Mertens, L.; Jossart, J.M.; Gorissen, L.; et al. A multi-actor multi-criteria framework to assess the stakeholder support for different biofuel options: The case of Belgium. Energy Policy 2011, 39, 200–214. [Google Scholar] [CrossRef]
  33. Hettinga, S.; Nijkamp, P.; Scholten, H. A multi-stakeholder decision support system for local neighbourhood energy planning. Energy Policy 2018, 116, 277–288. [Google Scholar] [CrossRef]
  34. Fitó, J.; Ramousse, J.; Hodencq, S.; Morriet, L.; Wurtz, F.; Debizet, G. Analyse technico-économique multi-acteurs de la conception d’un système de valorisation de chaleur fatale sur réseau de chaleur. In Proceedings of the Communautés Énergétiques, Autoproduction, Autoconsommation: Cadrages, Pratiques et Outils, Paris, France, 15–16 June 2020. [Google Scholar]
  35. Tabourdeau, A.; Debizet, G. Concilier ressources in situ et grands réseaux: Une lecture des proximités par la notion de nœud socio-énergétique. Flux 2017, 109–110, 87–101. [Google Scholar] [CrossRef]
  36. Fitó, J.; Hodencq, S.; Ramousse, J.; Wurtz, F.; Stutz, B.; Debray, F.; Vincent, B. Energy- and exergy-based optimal designs of a low-temperature industrial waste heat recovery system in district heating. Energy Convers. Manag. 2020, 211, 112753. [Google Scholar] [CrossRef]
  37. Morriet, L.; Pajot, C.; Delinchant, B.; Marechal, Y.; Wurtz, F.; Debray, F.; Vincent, B. Optimisation multi-acteurs appliquée à la valorisation de chaleur fatale d’un acteur industriel flexible. In Proceedings of the Conférence Francophone de l’International Building Performance Simulation Association (IBPSA), Bordeaux, France, 15–16 May 2018. [Google Scholar]
  38. Hodencq, S.; Debray, F.; Trophime, C.; Vincent, B.; Stutz, B.; Delinchant, B.; Wurtz, F.; Pajot, C.; Morriet, L.; Bentivoglio, F.; et al. Thermohydraulics of High Field Magnets: From microns to urban community scale. In Proceedings of the 24ème Congrès Français de Mécanique, Brest, France, 26–30 August 2019. [Google Scholar]
  39. Morriet, L.; Debizet, G.; Wurtz, F. Multi-actor modelling for MILP energy systems optimisation: Application to collective self-consumption. In Building Simulation; 2015; Available online: https://hal.science/hal-02285965/ (accessed on 11 February 2022).
  40. Debizet, G.; Pappalardo, M.; Wurtz, F. Local Energy Communities: Emergence, Places, Organizations, Decision Tools, 1st ed.; Routledge: London, UK, 2022; ISBN 9781003257547. [Google Scholar] [CrossRef]
  41. Pajot, C.; Morriet, L.; Hodencq, S.; Delinchant, B.; Maréchal, Y.; Wurtz, F.; Reinbold, V. An Optimization Modeler as an Efficient Tool for Design and Operation for City Energy Stakeholders and Decision Makers. (HAL Id: Hal-02285954). In Proceedings of the 16th IBPSA International Conference, Rome, Italy, 2–4 September 2019. [Google Scholar]
  42. Pajot, C. OMEGAlpes: Outil D’aide à la Décision Pour Une Planification Energétique Multi-Fluides Optimale à L’échelle Des Quartiers. Doctoral Thesis, Université de Grenoble, Saint-Martin-d’Hères, France, 2019. [Google Scholar]
  43. Fitó, J.; Ramousse, J.; Hodencq, S.; Wurtz, F. Energy, exergy, economic and exergoeconomic (4E) multicriteria analysis of an industrial waste heat valorization system through district heating. Sustain. Energy Technol. Assess. 2020, 42, 100894. [Google Scholar] [CrossRef]
  44. Pons, M. On the reference state for exergy when ambient temperature fluctuates. Int. J. Thermodyn. 2009, 12, 113–121. [Google Scholar]
  45. Pajot, C.; Delinchant, B.; Marechal, Y.; Wurtz, F.; Debray, F.; Vincent, B. Valorisation optimale de chaleur fatale d’un site à forte consommation électrique. In Proceedings of the Conférence des Jeunes Chercheurs en Génie Electrique (JCGE), Oléron, France, 30 May–1 June 2017. [Google Scholar]
  46. Pajot, C.; Delinchant, B.; Maréchal, Y.; Wurtz, F.; Robin, S.; Vincent, B.; Debray, F.; Nguyen, Q. Data-Driven Modeling of Building Consumption Profile for Optimal Flexibility: Application to Energy Intensive Industry. In Proceedings of the Building Simulation Conference, Rome, Italy, 2–4 September 2019; Available online: https://hal.science/hal-02364669/ (accessed on 14 April 2022).
  47. Greco, S.; Ehrgott, M.; Figueira, J. Multiple Criteria Decision Analysis; Springer: Catania, Italy, 2016. [Google Scholar]
Figure 1. Diagram of the case study, showing the stakeholder’s perimeters.
Energies 17 02009 g001
Figure 2. Decision support algorithm with the tools used in this study, plus any prospective ones.
Energies 17 02009 g002
Figure 3. Cross-analysis matrix for Scenario 1 (where LNCMI is the owner of the waste heat recovery system).
Energies 17 02009 g003
Figure 4. Cross-analysis matrix for Scenarios 2, 3, and 4. The legend is the same as that for Figure 3.
Energies 17 02009 g004
Figure 5. Multi-scenario, multi-stakeholder, and multi-criteria radar chart displaying the relative optimality of different designs. Only feasible designs are displayed. Optimal mono-criterion designs are plotted with continuous lines, the rest are shown with dotted lines. The yellow star indicates the owner of the equipment in each scenario.
Energies 17 02009 g005
Figure 6. Cross-analysis matrices for Scenarios 1 to 3, after relaxations by the stakeholders. The legend is the same as that in Figure 3. Scenario 4 is not displayed because its matrix remains the same as it was before the relaxations (see Figure 4).
Energies 17 02009 g006
Figure 7. Detailed effects of stakeholders’ relaxations on Scenario 1. The legend is the same as that in Figure 3.
Energies 17 02009 g007
Figure 8. Multi-scenario, multi-stakeholder, and multi-criteria radar chart after relaxations by the stakeholders. Only feasible designs are displayed. Designs plotted with continuous lines are mono-criterion-optimal (value = 1) in at least one instance. Designs plotted with dotted lines are never mono-criterion-optimal, and are, therefore, dominated by other solutions. The yellow star indicates the owner of the equipment in each scenario.
Energies 17 02009 g008
Table 1. Configuration of the socio-energetic nodes as a function of the scenario.
ScenarioStakeholderSocio-Energetic Node
1LNCMI (Owner)EXP + DISS + TES + HP
CCIAG (Not owner)CDCH + RES + SST
2CCIAG (Owner)HS + NTW + SST + TES + HP
LNCMI (Not owner)EXP + DISS
3THIRD (Owner)TES + HP
LNCMI (Not owner)EXP + DISS
CCIAG (Not owner)HS + NTW + SST
4CONSORTIUM (Owner)EXP + DISS + TES + HP + HS + NTW + SST
Table 2. Definition of the optimization criteria as a function of the system’s ownership.
StakeholderCriterionIndicator (Owner)Indicator (Not Owner)
LNCMIENER R F = Q W H R S i n Q W H
EXER E x L N C M I D ,   T O T = E x L A B D + E x T E S D + E x H P D + E x D I S S D E x L N C M I D ,   T O T = E x L A B D + E x D I S S D
EXEC C L N C M I D ,   T O T = C E X P D + C T E S D + C H P D + C D I S S D C L N C M I D ,   T O T = C L A B D + C D I S S D
ECON N P V L N C M I = C W H R S Q , o u t C W H R S e l e c , i n C W H R S Q , i n Z ˙ O M Z ˙ C I C R F N P V L N C M I = C W H R S Q , i n C R F
CCIAGENER T D C = Q W H R S o u t Q D H N i n ,   t o t
EXER E x C C I A G D ,   T O T = E x T E S D + E x H P D + E x H S D + E x D H N D + E x S S T D E x C C I A G D ,   T O T = E x H S D + E x D H N D + E x S S T D
EXEC C C C I A G D ,   T O T = C T E S D + C H P D + C H S D + C D H N D + C S S T D C C C I A G D ,   T O T = C H S D + C D H N D + C S S T D
ECON N P V C C I A G = C H S , R E F E n , i n C H S E n , i n C W H R S e l e c , i n C W H R S Q , i n Z ˙ O M Z ˙ C I C R F N P V C C I A G = C H S , R E F E n , i n C H S E n , i n C W H R S Q , o u t C R F
THIRDENER V F = Q W H R S o u t Q W H R S i n N/A
EXER E x T H I R D D ,   T O T = E x T E S D + E x H P D N/A
EXEC C T H I R D D ,   T O T = C T E S D + C H P D N/A
ECON N P V T H I R D = C W H R S Q , o u t C W H R S Q , i n C W H R S e l e c , i n Z ˙ O M Z ˙ C I C R F N/A
CONSORTIUMENER R A C F = R F · C F N/A
EXER E x C S R T D ,   T O T = E x L N C M I D ,   T O T + E x C C I A G D ,   T O T + E x T E S D + E x H P D N/A
EXEC C C S R T D ,   T O T = C L N C M I D ,   T O T + C C C I A G D ,   T O T + C T E S D + C H P D N/A
ECON N P V C S R T = C H S , R E F E n , i n C H S E n , i n C W H R S e l e c , i n Z ˙ O M Z ˙ C I C R F N/A
Table 3. Stakeholders’ tolerance and relaxation possibilities, shown criterion per criterion.
StakeholderCriterionToleranceNO-GORelaxation
LightModerateHeavy
LNCMIENER<5%<10%>10%N/AN/A
EXER<10%<25%>25%if Δ(ExD) > 0Disregard NO-GO
ECON<25%<50%>50%if NPV < 0Cut C_WH by 50%
EXEC<10%<25%>25%if Δ(CD) > 0Disregard NO-GO
CCIAGENER<10%<25%>25%N/AN/A
EXER<10%<25%>25%if Δ(ExD) > 0Disregard NO-GO
ECON<5%<10%>10%if NPV < 0Disregard Z_NETW by 50%
EXEC<10%<25%>25%if Δ(CD) > 0Disregard NO-GO
THIRDENER<25%<50%>50%N/AN/A
EXER<25%<50%>50%N/AN/A
ECON<5%<10%>10%if NPV < 0N/A
EXEC<25%<50%>50%N/AN/A
CONSORTIUMENER<5%<10%>10%N/AN/A
EXER<10%<25%>25%if Δ(ExD) > 0Disregard NO-GO
ECON<5%<10%>10%if NPV < 0N/A
EXEC<10%<25%>25%if Δ(CD) > 0Disregard NO-GO
Disclaimer/Publisher’s Note: The statements, opinions and data contained in all publications are solely those of the individual author(s) and contributor(s) and not of MDPI and/or the editor(s). MDPI and/or the editor(s) disclaim responsibility for any injury to people or property resulting from any ideas, methods, instructions or products referred to in the content.

