
Estimation of Fuel Properties for the Heavy Fraction of Biomass Pyrolysis Oil Consisting of Proposed Structures for Pyrolytic Lignin and Humins

U.S. Department of Agriculture, Agricultural Research Service, Southern Regional Research Center, New Orleans, LA 70124, USA
Energies 2024, 17(9), 2011; https://doi.org/10.3390/en17092011
Submission received: 29 February 2024
/
Revised: 8 April 2024
/
Accepted: 22 April 2024
/
Published: 24 April 2024
(This article belongs to the Section A4: Bio-Energy)
Abstract
:The organic component of biomass pyrolysis oils is composed of a light fraction (C2–C4 volatiles, sugar- and lignin-derived monomers) and a less polar heavy fraction (pyrolytic lignin/humins, greater than approximately 200 g/mol). Importantly, this heavy fraction can account for roughly one-third to one-half of the total pyrolysis oil. While the composition and characteristics of the light fraction are generally well understood, research is still needed for the characterization of the heavy fraction. Some important thermodynamic fuel properties of this fraction are the heat of combustion, normal boiling point, heat of vaporization, and flash point, which are (computationally) estimated in this work with regularized regression and empirical correlations. The quantification of these properties has implications on downstream utilization, particularly in the context of co-processing bio-oils with plastic and coal liquefaction products and/or crude petroleum. Finally, challenges and opportunities for (experimental) work are discussed for the advancement of sustainable valorization of biomass pyrolysis oils.
1. Introduction
A changing energy landscape, environment, and climate has resulted in greater emphasis in the global economy on renewable natural resource utilization over fossil fuels [1,2]. In addition to cleaner modes of energy production, there is an ever-present need for the development of carbon-neutral industrial chemicals and materials [2,3]. As a promising alternative to petroleum and petrochemicals, biomass pyrolysis is a technology that produces carbon-rich bio-oil and bio-char that can be upgraded into various high-value final products [4,5]. Biomass pyrolysis is the thermal deconstruction of lignocellulosic feedstocks (woody biomass, grasses, and agriculture residues) in the absence of oxygen at temperatures of roughly 300–600 °C, which produces either more liquid (fast pyrolysis) or more char (slow pyrolysis), depending on the heating rate. Further reading on biomass pyrolysis can be found in several recent reviews [6,7,8,9,10,11,12,13,14,15,16,17]. A proposed, simplified concept for a biomass pyrolysis refinery is detailed in Figure 1, in juxtaposition with a refinery schematic for petroleum and coal conversion to tars and industrial carbon products [3,18].
The composition of biomass fast pyrolysis oil (by weight) is roughly 20–30% water, 10–20% C2–C4 light volatile organics, 10–20% anhydrosugars, 1–5% mono-phenols and furans, 15–30% pyrolytic lignin, and 15–30% humins and hybrid oligomers [5]. Light volatile organics include acetol, hydroxyacetaldehyde, acetic acid, and formic acid; anhydrosugars include levoglucosan and cellobiosan; and mono-phenols and furans include phenol, guaiacol, cresol, syringol, eugenol, furfural, and furanone [5]. This low molecular weight organic fraction (<200 g/mol) is generally well-characterized, with opportunities for separation and commercialization being more well-understood. However, the high molecular weight fraction (>200 g/mol) made up of pyrolytic lignin, humins, and hybrid oligomers is generally more recalcitrant and difficult for both characterization and upgrading [5,19,20]. Pyrolytic lignins herein are the heavy oligomers resulting from lignin pyrolysis reactions and/or repolymerization, and humins are the more-polar heavy fraction from holocellulose; hybrid oligomers contain both lignin and holocellulose structural features [21]. Pyrolysis reaction parameters, like reactor temperature, pressure, and residence time, can have significant influences on the formation of heavy products, as highlighted in previously published work on the nature of different bio-oil fractions and properties [22,23,24].
Although bio-oil light volatile organics are more easily separable and can potentially be commercialized as pure compounds, the remaining fractions have a greater barrier for valorization [5,25]. Sugars, anhydrosugars, and (anhydro)oligosaccharides derived from pyrolysis can be upgraded through fermentations or other biochemical conversions; however, in comparison, this option is not technically feasible for aromatic and/or recalcitrant pyrolytic lignins and humins. Hydrotreatment has been reported as one option for upgrading the bio-oil heavy fraction [18,20,26,27,28]. Other valorization routes include bio-oil (co)combustion and (co)processing with fossil fuels, particularly heavy oil fuel blends [19,20,29,30,31]. In this framework, pyrolytic lignin from a bio-oil refinery, as shown in Figure 1, could be utilized as a co-feedstock with vacuum gas oil or coal tar in a fossil fuel refinery stream shown in Figure 1.
With the consideration of the bio-oil heavy fraction to be further processed as an intermediate product on its own, a greater understanding of its properties as a fuel/commodity is warranted. The goal of this study is to computationally estimate the fuel properties of this heavy fraction. Specifically, these properties include the heat of combustion, normal boiling point, heat of vaporization, and flash point. The heating values and flash points are important properties for understanding the performance of liquids in fuel applications [32,33]. The normal boiling point and heat of vaporization are important properties and/or engineering design parameters for understanding vapor-liquid equilibrium phenomena, like separations via distillation [34,35]. A correlation derived from regularized regression machine learning is proposed for normal boiling point estimation from adaptable group contribution, and the remaining properties are estimated based on published empirical correlations. The novelty in using regularized regression in this way is that it allows for potential flexibility, modeling over any reasonable set of user-defined group contribution inputs. Ultimately, this can result in simpler models with good thermophysical/chemical property estimation performance.
2. Materials and Methods
2.1. High Molecular Weight Biomass Pyrolysis Oil Molecules
The bio-oil heavy fraction molecules analyzed in this study are based on inferred/proposed structures for biomass pyrolysis-derived oligomers from previously published work [36,37,38]. The determination of these structures is based on the analysis of biomass pyrolysis oil with mass spectrometry and other analytical chemistry techniques, where further information is available in the original publications [36,37,38]. This dataset is made up of hexose-derived oligomers (Hexose), pentose-derived oligomers (Pentose), hexose/pentose-derived oligomers (Hex/Pent), lignin-carbohydrate complex-derived oligomers (LCC), and lignin-derived oligomers (Lignin). Further details are given in Table 1 and more fully in the Supplementary Material. Table 2 provides details to define abbreviations used throughout the text.
2.2. Elemental Analysis and Heat of Combustion Estimation
Elemental analysis of the molecules analyzed in this study is based on the chemical formula associated with each structure. From the elemental analysis data, the heat of combustion is estimated. Specifically, two empirical correlations are used for estimating the lower heating value (LHV, MJ/kg), and two empirical correlations are used for estimating the higher heating value (HHV, MJ/kg) [32,39,40,41,42]. These correlations are given in Equations (1)–(4), where XC, XH, and XO are the mass fractions of carbon, hydrogen, and oxygen, respectively.
2.3. Group Contribution Regularized Regression for Normal Boiling Point Estimation
Each studied structure’s normal boiling point (TB, K) was estimated using coupled group contribution and regularized regression. This type of adaptable group contribution has been previously applied to estimate Hansen solubility parameters for biomass conversion molecules [43]. Training data for the boiling point model is made up of 182 compounds for which TB values have been published [44,45,46,47,48,49,50,51]. The classes of compounds included are naphthalene derivatives (n = 16), polyring compounds (n = 15), benzene derivatives (n = 15), other 2-ring compounds (n = 8), naphthenic compounds (n = 12), 1-alkanols (n = 10), monocarboxylic acids (n = 9), n-alkybenzenes (n = 20), terpenes (n = 4), complex ketones and alkanols (n = 8), phenols (n = 13), alkanoic methyl esters (n = 17), alkanediols (n = 5), alkyl lactates (n = 5), and other oxygenates (n = 25). More complete details of the training data set are given in the Supplementary Material.
Each of the compounds in the training data set was parameterized according to the following fragment groups: CH3, CH2, CH, C*, OH (cyclic), OH (noncyclic), -O- (ether), =O (carbonyl), where C* is a carbon atom bonded to no hydrogen atoms. Additional parameters included are the nominal mass and atomic percent values of C, H, and O in the formula, giving 12 features in total for each compound. The 12 features for each compound were then subjected to min-max normalization (relative to the whole data set) to rescale all values between 0 and 1 [52]. Finally, these 12 features are then used as inputs for a boiling point estimation from regularized regression with Ridge and LASSO models using the Scikit learn Linear Models library for Python [53]. Further reading on regularized regression techniques can be found in previously published work [54,55,56,57].
The normal boiling point for each heavy biomass pyrolysis oil structure (Table 1) is estimated using results from regularized regression based on parameterization of the same 12 features used for the training set. A correction proposed by Stein and Brown was applied to calculated boiling points, based on the observation by these authors that group contribution can significantly over-predict estimated boiling points above approximately 500 K [58]. These corrections are given in Equations (5) and (6). More complete details for calculated values are given in the Supplementary Material.
2.4. Heat of Vaporization Estimation
The heat of vaporization (HVAP, kJ/mol) for each studied structure was estimated using correlations recently proposed by Krimizis-Tsastsoulis [59]. These correlations are derived from Trouton’s Rule, a classical thermodynamics observation that suggests that the entropy of vaporization (SVAP, J/mol-K) for any (non-polar) compound is approximately equal to 88 J/mol-K [59,60]. Krimizis-Tsatsoulis provides three correlations (that are used herein) for SVAP in terms of TB for non-polar, protic polar, and aprotic polar compounds, which are given in Equations (7)–(9). The value for HVAP is estimated from the product of TB and SVAP, as in equation 10. A factor of 1000 is included to account for SVAP units of J/mol-K and HVAP units of kJ/mol, with TB units of K.
2.5. Flash Point Estimation
The flash point (TFL, K) for each studied structure was estimated using correlations available in previously published work, which utilizes thermodynamic properties to calculate a value for TFL [61,62,63]. The four correlations utilized herein are given in Equations (11)–(14). For these calculations, the corrected value from the LASSO model for TB is used, and nC represents the carbon number for a given formula/structure. In Equation (11), the average value of protic and aprotic polar HVAP is used (from Equations (8) and (9)). For a liquid mixture in practice, the flash point is defined as the lowest temperature at which the application of an ignition source causes vapor ignition for a given sample [64,65]. From a process safety perspective, the flash point for a mixture will be most conservatively represented by the lowest estimated flash point among any of its constituent compounds.
3. Results
3.1. Elemental Analysis and Heat of Combustion
Results from elemental analysis of structure formulas and their associated LHV and HHV values are given in Table 3. The reported ranges for LHV and HHV are taken from the minimum and maximum values calculated with Equations (1) and (2) and Equations (3) and (4) for LHV and HHV, respectively. In general, the set of less-oxygenated lignin-derived structures tends to have the largest estimated heating values, while the more-oxygenated holocellulose-derived structures tend to have smaller estimated heating values. High LHV and HHV values estimated for the Hexose class can be attributed to more highly dehydrated and/or modified pyrolytic humin structures. These values are broadly consistent with previously reported experimental results for elemental analyses and heat of combustion for comparable samples [66,67,68,69].
3.2. Normal Boiling Point
Ridge and LASSO regression models were applied to yield normal boiling point correlations from the parameterization of the training data and their associated reported boiling points. The results of these models are given in Table 4, with initial min-max scaling removed from the coefficients. Intercepts and coefficients are given for the nominal mass (MW), elemental atomic percents (C%, H%, O%), and number of parameterizing groups in a given structure (CH3, CH2, CH, C*, OHcyclic, OHnoncyc., Oether, Ocarbonyl) to calculate TB (with units of K). The models were evaluated in scikit learn using four-fold cross-validation, giving computed scores in terms of root-mean-squared-error (RMSE) and coefficient of determination (R2) [70]. The Ridge model had an average (across four folds) RMSE value of 39 K and an average R2 of 0.72; the LASSO model had an average RMSE of 35 K and an average R2 of 0.76. These cross-validation metrics (RMSE and R2) serve as one surrogate for validation against experimental data and uncertainty quantification for the models. While Ridge regression models yield coefficients for all features/parameters, the LASSO model reduced coefficients for 6 of the 12 parameters to zero. For this reason, LASSO is utilized for further analysis due to greater model simplicity from fewer features, with comparable cross-validation scores relative to Ridge model performance over the training data set.
The heavy biomass pyrolysis oil structures were parameterized according to the same model features for the application of the LASSO regression results to estimate TB. As described previously in Section 2.3, resulting TB calculations were corrected according to Equations (5) and (6). The estimated TB values for heavy bio-oil structures were compared to two external boiling point correlations in Equations (15) and (16). Equation (15) is from work by Twu, providing an empirical correlation for TB (units of Rankine) in terms of molecular weight, where θ is the natural logarithm of the molecular weight, based on analysis of petroleum and coal-tar liquids [71]. Equation (16) is from work by Boduszynski and Altgelt, providing an empirical correlation for TB (atmospheric equivalent boiling point, units of °F) in terms of molecular weight (MW) and hydrogen to carbon atomic ratio (H/C) based on analysis of heavy petroleum fractions [72]. All calculated TB units are converted to K for data visualization.
Plots of estimated boiling points (both uncorrected and corrected) against molecular weight are given in Figure 2 for the heavy bio-oil molecules. This figure also shows training data and estimates from Equations (15) and (16) applied to heavy bio-oil molecule structures. The effect of correction with Equations (5) and (6) is evident for estimated TB, where uncorrected values are significantly higher than corrected values at higher molecular weights and boiling points. The two correlations from the literature also diverge for molecular weights greater than approximately 300 g/mol. The Boduszynski correlation (Equation (16)) provides a systematically larger estimate for TB than the Twu correlation (Equation (15)). This discrepancy among boiling point estimations necessitates further experimental work to better understand TB’s nature for heavy molecules, especially for more polar structures with greater oxygen and/or other heteroatomic content. Because the corrected LASSO TB estimation is qualitatively closer to the Twu and Boduszynski estimations, particularly for molecular weights greater than 500 g/mol, these values are used in further analysis for heat of vaporization (HVAP) and flash point (TFL).
3.3. Heat of Vaporization
The heat of vaporization (HVAP, at TB) is estimated based on correlations detailed in Equations (7)–(10). To assess their validity, values were calculated and compared to reported data for HVAP. Results of this analysis are given in the Supplementary Material for heavy oil fractions, polycyclic aromatic hydrocarbons, and coal liquid fractions [73,74,75]. These results (Table S4) also compare predicted and experimental data for model validation. While these families of compounds tend to be better described as non-polar, the heavy bio-oil molecule structures have significant oxygen content, suggesting at least appreciable polarity. HVAP values using polar correlations (protic polar, Equation (8); aprotic polar, Equation (9)) are presented fully in the Supplementary Material. Figure 3 (molar basis) and Figure 4 (mass basis) have plots of protic and aprotic values for each structure. These data can be taken as estimates for upper and lower bounds for calculated HVAP, as the protic values are systematically higher than the aprotic values. In the work from Krimizis-Tsatsoulis, which develops the applied HVAP correlations, criteria for the determination of protic vs. aprotic is described [59]. These criteria suggest that for bio-oil structure molecular weight less than roughly 300 g/mol, the protic HVAP expression (Equation (8)) is more appropriate, while the aprotic expression (Equation (9)) may be more appropriate for heavier structures.
In recent work from Fonts et al., the heats of vaporization (at TB) are successfully estimated for a pyrolytic lignin structure and a humin structure using two different methods (from Joback and from Riedel) [18,76,77]. Estimates for pyrolytic lignin are 190 (Joback) and 52 (Riedel) kJ/mol, and estimates for the humin structure are 264 (Joback) and 33 (Riedel) kJ/mol. While values from the two methods differ appreciably, Fonts et al. suggest that the smaller estimation for the humin structure (with the Riedel method, 33 kJ/mol) is likely more accurate than that from Joback. These authors also report HVAP estimations for light bio-oil molecules (e.g., glycolaldehyde, acetic acid, furfural, vanillin) in the range of roughly 35–65 kJ/mol. The magnitude of these estimates is generally consistent with the trend shown in Figure 3 if extrapolated to lower molecular weights. It is also important to consider that estimations of TB (and subsequent correlations relying on TB, like Equations (7)–(10) for HVAP) may lack physical meaning for TB values in excess of pyrolysis temperature because these compounds will thermally decompose prior to reaching their boiling temperature [18].
3.4. Flash Point
Results from flash point estimation (TFL) of heavy bio-oil molecule structures are given in Table 5. As previously mentioned in Section 2.5, the flash point for a mixture will be most conservatively represented by the lowest estimated flash point among any of its constituent compounds. In this case, the hexose class provides the lowest minimum value (375 K or 102 °C) among the four flash point correlations (Equations (11)–(14)). This value is consistent with other relevant, previously reported data on bio-oil flash points. Sipila et al. report a flash point value of 106 °C for high-viscosity hardwood oil, which they describe as containing low amounts of easily vaporized volatile compounds [78]. Zhang and Wang similarly report flash points of 94 and 108 °C for biomass corncob tar oils [79]. At the higher end, Al-Soufi et al. report a flash point of 199 °C for heavy (petroleum) oil residue with TB greater than 350 °C [80].
4. Discussion
Estimates for fuel properties provided herein are based on empirical correlations from structural features of molecules and/or subsequent indirect correlations estimating the value of one property based on the value of others. In general, results from regularized regression presented here correspond well with computational structure analyses and property estimation work recently published by Garcia-Perez and associates [18,81,82,83]. However, as in prior work on solubility parameters [43], the advantage of regularized regression for property estimation is the ability to use unified, simpler models rather than relying on several (potentially disparate) group contribution methods. In similar but perhaps more sophisticated work, Sanchez Lengeling et al. utilized a Bayesian approach to predict solubility parameters, which directly yielded model predictions and their uncertainties as a result of Gaussian process regression computations [84]. This highlights the capabilities of machine-learning models to estimate both predicted property values and their associated uncertainties simultaneously.
By using regularized regression and/or machine-learning approaches, a practitioner can develop flexible models that can be tailored to any given data set. A major constraint in using published group contribution methods for property estimation is the limitation to the utilization of only those groups contained within a given model. If those parameters are not suitable for a given dataset, then model performance may be poor. Many published group contribution methods may also rely on first-, second-, and third-order groups with a large absolute number of parameters, which can be cumbersome in practice for property estimation. Three recent works that used group contribution for thermochemical/physical property estimation for bio-oils can be found from Garcia-Perez and associates [18,82,83]. In these studies, property estimation relied on published correlations for the computation of critical properties, boiling point, and heat of vaporization. The work presented herein similarly computed thermophysical/chemical parameters but instead relied on a regularized regression approach to generate overall simpler models for normal boiling point, with comparable performance across estimated properties.
Although there is still no replacement for experimentally determined measurements, significant utility exists in the presented approach to estimate values for (heavy) molecules that are difficult to characterize, isolate, or purify. Even if all properties cannot be practically measured in a laboratory setting, rigorous determination of one property (e.g., normal boiling point) can increase the confidence in empirical estimation of other properties based on the initial measurement. Among all others, the heat of vaporization may be the most difficult to measure experimentally. Examples of high-quality experimental work to measure HVAP using Knudsen effusion cells can be found in Gourdin for squalane and Suuberg and Oja for primary coal tars [85,86]. However, the correlations given in Equations (7)–(10) may provide reliable empirical estimates if there is a high degree of confidence in TB and some level of chemical intuition about the polarity/non-polarity of the molecule. A sample of standard methods for measurement of some fuel properties is given in Table 6, along with associated applications of those methods [73,87,88,89,90,91,92,93].
In addition to the properties studied herein, other chemical and/or physical properties are important for (heavy) pyrolysis oil applications as a fuel/liquid commodity. Some of these include the pH, total acid number, density, viscosity, and pour point. Further reading and experimental work measuring these properties and discussing broad considerations for industrial application of biomass pyrolysis oils can be found in several previously published works from Oasmaa and coworkers [94,95,96,97,98,99]. In a historical review of fast pyrolysis bio-oil production and upgrading, Oasmaa et al. highlight past and ongoing work for norms and standards related to bio-oil applications and emphasize that further work is still needed in this regard [100].

Table 6.
Standard methods for the measurement of selected fuel properties.
| Property | Standard Method | Example Application | Reference |
|---|---|---|---|
| Elemental analysis | ASTM D5291 | Carbon, hydrogen, and nitrogen content is measured for vacuum gas oil, dry bio-oil, catalytic pyrolysis oil, and hydrotreated bio-oil. Oxygen content is calculated by difference. | [101] |
| Heat of combustion | ASTM D5865, ASTM D4809 | HHV measurement for biomass feedstocks and pyrolysis liquids in a study comparing accelerated aging procedures to assess bio-oil stability. | [102] |
| Boiling point a | ASTM D86, ASTM D2892; NIST ADC method(s) | Fast pyrolysis bio-oil from sawmill residues is analyzed with ADC methods to measure and simulate distillation curves (temperature vs. distillate volume fraction). Limitations of the ASTM methods (designed for petroleum) when utilized for bio-oils are discussed. | [103,104,105,106,107,108] |
| Heat of vaporization | ASTM E1782 | Vapor pressure measurements were carried out using differential scanning calorimetry for phenolic compounds, with heat of vaporization being calculated by the Clausius-Clapeyron equation. An alternative method using thermogravimetic analysis for (petroleum) oils is presented in work by Rannaveski and Oja. | [73,109] |
| Flash point | ASTM D93 | Flash point measurement using Pensky–Martens closed cup method for bio-oil produced from pyrolysis of bay laurel biomass. | [110] |
a: The work from Krutof and Hawboldt recommends against these ASTM methods for fast pyrolysis bio-oil and utilizes the advanced distillation curve methods (ADC) developed by the National Institute of Standards and Technology (NIST).
Experimental investigation can also provide insight into other thermophysical behaviors, like pyrolysis versus boiling at elevated temperatures. For example, it was previously stated that estimations of TB may lack physical meaning for TB values exceeding pyrolysis temperature (viz., ~400–600 °C) because these compounds will pyrolyze prior to vaporization. This type of phenomenon could be observable in an analytical pyrolysis experiment monitoring for evidence of endothermic phase change behavior during vaporization. This has been carried out successfully by Shoji et al. for experimental measurement of TB for levoglucosan and Pecha et al. for levoglucosan and cellobiosan [111,112]. Distillation techniques are an alternative method to yield narrow-boiling fractions, which can be further analyzed for thermophysical property measurement (as by Gray et al. for coal liquids) associated with a known TB range [75]. Additionally, preparative gel permeation chromatography can segregate samples by molecular weight ranges. This is the approach utilized by Suuberg and Oja in vapor pressure measurement of primary coal tars, with values given for specific apparent molecular weight fractions from the whole tar sample [86]. Further discussion of the nature of molecular weight metrics for bio-oils specifically can be found in a recent review from Harman-Ware and Ferrell [113]. Finally, many existing empirical correlations for fuel properties of liquids are based on analysis of fossil fuels—petroleum, coal tars, and their associated fractions. Biomass pyrolysis oils differ most significantly from fossil fuel liquids in the quantity of oxygen present in the liquid samples. Any empirical correlation or group contribution method developed using data primarily consisting of hydrocarbons must be assessed critically when applied to biomass-derived liquids. If renewable natural resources are to play a larger role in the carbonaceous chemical and fuels industry, then it follows that there is a need for greater experimental characterization of the properties of oxygenated biomass-derived liquids.
5. Conclusions
This study estimated thermodynamic fuel properties for the heavy fraction (>200 g/mol) of biomass pyrolysis oil based on analysis of some inferred molecular structures making up this fraction. These fuel properties are elemental analysis, heat of combustion (HHV and LHV), normal boiling point, heat of vaporization, and flash point. The normal boiling point was estimated based on an adaptable group contribution method, which utilized LASSO regression as a feature selection tool. Other properties were calculated based on available published empirical correlations. The models presented herein are flexible and non-specific, and they can be applied to any representative pyrolysis oil sample (or other thermochemical conversion product), provided sufficient characterization data is available for model inputs. Estimated normal boiling points ranged from roughly 500–900 K, and heats of vaporization from 50 to 120 kJ/mol, depending largely on the molecular weight of the analyzed structure. The flash point was estimated to be roughly 375 K, with LHV and HHV both falling between 15 and 30 MJ/kg. Opportunities for future experimental work to quantify these properties are identified, underscoring the need for continued laboratory analysis to support more complete valorization of bio-oils.
Supplementary Materials
The following supporting information can be downloaded at: https://www.mdpi.com/article/10.3390/en17092011/s1, Table S1: Summary of heavy biomass pyrolysis oil structures for analysis; Table S2: SMILES for heavy biomass pyrolysis oil structures; Table S3: Summary of compounds used for training set of regularized regression Ridge and LASSO models for normal boiling point estimation; Table S4: Reported heats of vaporization for heavy oil fractions, polycyclic aromatic hydrocarbons, and coal liquids, in comparison with non-polar, polar-protic, and polar-aprotic values estimated from Equations (7)–(10) (main text); Table S5: Heat of combustion estimations for heavy biomass pyrolysis oil structures estimated by the specified equations from the main text; Table S6: Normal boiling point estimations for heavy biomass pyrolysis oil structures estimated by Ridge and LASSO regression models, with a corrected LASSO value given based on Equations (5) and (6) (main text); Table S7: Heat of vaporization estimations for heavy biomass pyrolysis oil structures estimated by the specified equations from the main text; Table S8: Flash point estimations for heavy biomass pyrolysis oil structures estimated by the specified equations from the main text.
Funding
This work was supported by the U.S. Department of Agriculture (USDA), Agricultural Research Service, under project number 6054-41000-114-000-D.
Data Availability Statement
Data is available in the Supplementary Materials and additional data can be made available upon reasonable request.
Acknowledgments
The author thanks colleagues at USDA-ARS and Washington State University for assisting with technical questions and manuscript preparation. The mention of trade names or commercial products in this publication is solely for the purpose of providing specific information and does not imply recommendation or endorsement by USDA. USDA is an equal opportunity provider and employer.
Conflicts of Interest
The author declares no conflicts of interest. The author is employed by the funding organization (USDA). However, the funders had no role in the design of the study, in the collection, analyses, or interpretation of the data or in the writing of the manuscript, but approved the decision to publish the results.
References
- Gernaat, D.E.H.J.; de Boer, H.S.; Daioglou, V.; Yalew, S.G.; Müller, C.; van Vuuren, D.P. Climate change impacts on renewable energy supply. Nat. Clim. Chang. 2021, 11, 119–125. [Google Scholar] [CrossRef]
- Kim, J.Y.; Lee, H.W.; Lee, S.M.; Jae, J.; Park, Y.K. Overview of the recent advances in lignocellulose liquefaction for producing biofuels, bio-based materials and chemicals. Bioresour. Technol. 2019, 279, 373–384. [Google Scholar] [CrossRef] [PubMed]
- Elkasabi, Y.; Mullen, C.A. Progress on Biobased Industrial Carbons as Thermochemical Biorefinery Coproducts. Energy Fuels 2021, 35, 5627–5642. [Google Scholar] [CrossRef]
- Kan, T.; Strezov, V.; Evans, T.J. Lignocellulosic biomass pyrolysis: A review of product properties and effects of pyrolysis parameters. Renew. Sustain. Energy Rev. 2016, 57, 1126–1140. [Google Scholar] [CrossRef]
- Pinheiro Pires, A.P.; Arauzo, J.; Fonts, I.; Domine, M.E.; Fernández Arroyo, A.; Garcia-Perez, M.E.; Montoya, J.; Chejne, F.; Pfromm, P.; Garcia-Perez, M. Challenges and Opportunities for Bio-oil Refining: A Review. Energy Fuels 2019, 33, 4683–4720. [Google Scholar] [CrossRef]
- Vikram, S.; Rosha, P.; Kumar, S. Recent Modeling Approaches to Biomass Pyrolysis: A Review. Energy Fuels 2021, 35, 7406–7433. [Google Scholar] [CrossRef]
- Kostetskyy, P.; Broadbelt, L.J. Progress in Modeling of Biomass Fast Pyrolysis: A Review. Energy Fuels 2020, 34, 15195–15216. [Google Scholar] [CrossRef]
- Wang, S.; Dai, G.; Yang, H.; Luo, Z. Lignocellulosic biomass pyrolysis mechanism: A state-of-the-art review. Prog. Energy Combust. Sci. 2017, 62, 33–86. [Google Scholar] [CrossRef]
- Hu, X.; Gholizadeh, M. Biomass pyrolysis: A review of the process development and challenges from initial researches up to the commercialisation stage. J. Energy Chem. 2019, 39, 109–143. [Google Scholar] [CrossRef]
- Guedes, R.E.; Luna, A.S.; Torres, A.R. Operating parameters for bio-oil production in biomass pyrolysis: A review. J. Anal. Appl. Pyrolysis 2018, 129, 134–149. [Google Scholar] [CrossRef]
- Wang, G.; Dai, Y.; Yang, H.; Xiong, Q.; Wang, K.; Zhou, J.; Li, Y.; Wang, S. A Review of Recent Advances in Biomass Pyrolysis. Energy Fuels 2020, 34, 15557–15578. [Google Scholar] [CrossRef]
- Huang, Y.; Li, B.; Liu, D.; Xie, X.; Zhang, H.; Sun, H.; Hu, X.; Zhang, S. Fundamental Advances in Biomass Autothermal/Oxidative Pyrolysis: A Review. ACS Sustain. Chem. Eng. 2020, 8, 11888–11905. [Google Scholar] [CrossRef]
- Jiang, S.-F.; Sheng, G.-P.; Jiang, H. Advances in the Characterization Methods of Biomass Pyrolysis Products. ACS Sustain. Chem. Eng. 2019, 7, 12639–12655. [Google Scholar] [CrossRef]
- Kumar, R.; Strezov, V.; Weldekidan, H.; He, J.; Singh, S.; Kan, T.; Dastjerdi, B. Lignocellulose biomass pyrolysis for bio-oil production: A review of biomass pre-treatment methods for production of drop-in fuels. Renew. Sustain. Energy Rev. 2020, 123, 109763. [Google Scholar] [CrossRef]
- Pecha, M.B.; Arbelaez, J.I.M.; Garcia-Perez, M.; Chejne, F.; Ciesielski, P.N. Progress in understanding the four dominant intra-particle phenomena of lignocellulose pyrolysis: Chemical reactions, heat transfer, mass transfer, and phase change. Green. Chem. 2019, 21, 2868–2898. [Google Scholar] [CrossRef]
- Donaldson, B.; Hughes, B.; Coker, E.N.; Yilmaz, N. Pyrolysis of Oils from Unconventional Resources. Energies 2023, 16, 3455. [Google Scholar] [CrossRef]
- Pahnila, M.; Koskela, A.; Sulasalmi, P.; Fabritius, T. A Review of Pyrolysis Technologies and the Effect of Process Parameters on Biocarbon Properties. Energies 2023, 16, 6936. [Google Scholar] [CrossRef]
- Fonts, I.; Atienza-Martínez, M.; Carstensen, H.-H.; Benés, M.; Pinheiro Pires, A.P.; Garcia-Perez, M.; Bilbao, R. Thermodynamic and Physical Property Estimation of Compounds Derived from the Fast Pyrolysis of Lignocellulosic Materials. Energy Fuels 2021, 35, 17114–17137. [Google Scholar] [CrossRef]
- Hu, X.; Gholizadeh, M. Progress of the applications of bio-oil. Renew. Sustain. Energy Rev. 2020, 134, 110124. [Google Scholar] [CrossRef]
- Zhang, L.; Zhang, S.; Hu, X.; Gholizadeh, M. Progress in application of the pyrolytic lignin from pyrolysis of biomass. Chem. Eng. J. 2021, 419, 129560. [Google Scholar] [CrossRef]
- Stankovikj, F.; McDonald, A.G.; Helms, G.L.; Garcia-Perez, M. Quantification of Bio-Oil Functional Groups and Evidences of the Presence of Pyrolytic Humins. Energy Fuels 2016, 30, 6505–6524. [Google Scholar] [CrossRef]
- Rover, M.R.; Johnston, P.A.; Whitmer, L.E.; Smith, R.G.; Brown, R.C. The effect of pyrolysis temperature on recovery of bio-oil as distinctive stage fractions. J. Anal. Appl. Pyrolysis 2014, 105, 262–268. [Google Scholar] [CrossRef]
- Marathe, P.S.; Westerhof, R.J.M.; Kersten, S.R.A. Effect of Pressure and Hot Vapor Residence Time on the Fast Pyrolysis of Biomass: Experiments and Modeling. Energy Fuels 2020, 34, 1773–1780. [Google Scholar] [CrossRef]
- Marathe, P.S.; Westerhof, R.J.M.; Kersten, S.R.A. Fast pyrolysis of lignins with different molecular weight: Experiments and modelling. Appl. Energy 2019, 236, 1125–1137. [Google Scholar] [CrossRef]
- Pinheiro Pires, A.P.; Martinez-Valencia, L.; Tanzil, A.H.; Garcia-Perez, M.; García-Ojeda, J.C.; Bertok, B.; Heckl, I.; Argoti, A.; Friedler, F. Synthesis and Techno-Economic Analysis of Pyrolysis-Oil-Based Biorefineries Using P-Graph. Energy Fuels 2021, 35, 13159–13169. [Google Scholar] [CrossRef]
- Han, Y.; Gholizadeh, M.; Tran, C.-C.; Kaliaguine, S.; Li, C.-Z.; Olarte, M.; Garcia-Perez, M. Hydrotreatment of pyrolysis bio-oil: A review. Fuel Process. Technol. 2019, 195, 106140. [Google Scholar] [CrossRef]
- Kloekhorst, A.; Wildschut, J.; Heeres, H.J. Catalytic hydrotreatment of pyrolytic lignins to give alkylphenolics and aromatics using a supported Ru catalyst. Catal. Sci. Technol. 2014, 4, 2367–2377. [Google Scholar] [CrossRef]
- Figueirêdo, M.B.; Jotic, Z.; Deuss, P.J.; Venderbosch, R.H.; Heeres, H.J. Hydrotreatment of pyrolytic lignins to aromatics and phenolics using heterogeneous catalysts. Fuel Process. Technol. 2019, 189, 28–38. [Google Scholar] [CrossRef]
- Lange, J.P. Lignocellulose Liquefaction to Biocrude: A Tutorial Review. ChemSusChem 2018, 11, 997–1014. [Google Scholar] [CrossRef]
- Buffi, M.; Cappelletti, A.; Rizzo, A.M.; Martelli, F.; Chiaramonti, D. Combustion of fast pyrolysis bio-oil and blends in a micro gas turbine. Biomass Bioenergy 2018, 115, 174–185. [Google Scholar] [CrossRef]
- Kass, M.D.; Armstrong, B.L.; Kaul, B.C.; Connatser, R.M.; Lewis, S.; Keiser, J.R.; Jun, J.; Warrington, G.; Sulejmanovic, D. Stability, Combustion, and Compatibility of High-Viscosity Heavy Fuel Oil Blends with a Fast Pyrolysis Bio-Oil. Energy Fuels 2020, 34, 8403–8413. [Google Scholar] [CrossRef]
- Erdoğan, S. LHV and HHV prediction model using regression analysis with the help of bond energies for biodiesel. Fuel 2021, 301, 121065. [Google Scholar] [CrossRef]
- Santos, S.M.; Nascimento, D.C.; Costa, M.C.; Neto, A.M.B.; Fregolente, L.V. Flash point prediction: Reviewing empirical models for hydrocarbons, petroleum fraction, biodiesel, and blends. Fuel 2020, 263, 116375. [Google Scholar] [CrossRef]
- Jia, Q.; Wang, Q.; Ma, P. Prediction of the Enthalpy of Vaporization of Organic Compounds at Their Normal Boiling Point with the Positional Distributive Contribution Method. J. Chem. Eng. Data 2010, 55, 5614–5620. [Google Scholar] [CrossRef]
- Abdi, S.; Movagharnejad, K.; Ghasemitabar, H. Estimation of the enthalpy of vaporization at normal boiling temperature of organic compounds by a new group contribution method. Fluid. Phase Equilibria 2018, 473, 166–174. [Google Scholar] [CrossRef]
- Terrell, E.; Garcia-Perez, M. Novel Strategy to Analyze Fourier Transform Ion Cyclotron Resonance Mass Spectrometry Data of Biomass Pyrolysis Oil for Oligomeric Structure Assignment. Energy Fuels 2020, 34, 8466–8481. [Google Scholar] [CrossRef]
- Fu, X.; Li, Q.; Hu, C. Identification and structural characterization of oligomers formed from the pyrolysis of biomass. J. Anal. Appl. Pyrolysis 2019, 144, 104696. [Google Scholar] [CrossRef]
- Terrell, E.; Garcia-Perez, M. Vacuum Pyrolysis of Hybrid Poplar Milled Wood Lignin with Fourier Transform-Ion Cyclotron Resonance Mass Spectrometry Analysis of Feedstock and Products for the Elucidation of Reaction Mechanisms. Energy Fuels 2020, 34, 14249–14263. [Google Scholar] [CrossRef]
- Hosokai, S.; Matsuoka, K.; Kuramoto, K.; Suzuki, Y. Modification of Dulong’s formula to estimate heating value of gas, liquid and solid fuels. Fuel Process. Technol. 2016, 152, 399–405. [Google Scholar] [CrossRef]
- Lopes, S.M.; Furey, R.; Geng, P. Calculation of Heating Value for Diesel Fuels Containing Biodiesel. SAE Int. J. Fuels Lubr. 2013, 6, 407–418. [Google Scholar] [CrossRef]
- Friedl, A.; Padouvas, E.; Rotter, H.; Varmuza, K. Prediction of heating values of biomass fuel from elemental composition. Anal. Chim. Acta 2005, 544, 191–198. [Google Scholar] [CrossRef]
- Huang, Y.-F.; Lo, S.-L. Predicting heating value of lignocellulosic biomass based on elemental analysis. Energy 2020, 191, 116501. [Google Scholar] [CrossRef]
- Terrell, E. Estimation of Hansen solubility parameters with regularized regression for biomass conversion products: An application of adaptable group contribution. Chem. Eng. Sci. 2022, 248, 117184. [Google Scholar] [CrossRef]
- Tsibanogiannis, I.N.; Kalospiros, N.S.; Tassios, D.P. Prediction of Normal Boiling Point Temperature of Medium/High Molecular Weight Compounds. Ind. Eng. Chem. Res. 1995, 34, 997–1002. [Google Scholar] [CrossRef]
- Askonas, C.F.; Daubert, T.E. Vapor pressure determination of eight oxygenated compounds. J. Chem. Eng. Data 1988, 33, 225–229. [Google Scholar] [CrossRef]
- Ambrose, D. Critical temperatures of some phenols and other organic compounds. Trans. Faraday Soc. 1963, 59, 1988–1993. [Google Scholar] [CrossRef]
- Taft, R.; Stareck, J. Relationship between Melting-Points, Normal Boiling-Points and Critical Temperatures. J. Phys. Chem. 2002, 34, 2307–2317. [Google Scholar] [CrossRef]
- Nikitin, E.D.; Popov, A.P. Vapour–liquid critical properties of components of biodiesel. 1. Methyl esters of n-alkanoic acids. Fuel 2015, 153, 634–639. [Google Scholar] [CrossRef]
- Astra, H.-L.; Oja, V. Vapour pressure data for 2-n-propylresorcinol, 4-ethylresorcinol and 4-hexylresorcinol near their normal boiling points measured by differential scanning calorimetry. J. Chem. Thermodyn. 2019, 134, 119–126. [Google Scholar] [CrossRef]
- Verevkin, S.P. Determination of vapor pressures and enthalpies of vaporization of 1,2-alkanediols. Fluid. Phase Equilibria 2004, 224, 23–29. [Google Scholar] [CrossRef]
- Emel’yanenko, V.N.; Yermalayeu, A.V.; Portnova, S.V.; Pimerzin, A.A.; Verevkin, S.P. Renewable platform chemicals: Evaluation of thermochemical data of alkyl lactates with complementary experimental and computational methods. J. Chem. Thermodyn. 2019, 128, 55–67. [Google Scholar] [CrossRef]
- Preprocessing Data. Available online: https://scikit-learn.org/stable/modules/preprocessing.html (accessed on 12 January 2022).
- Linear Models. Available online: https://scikit-learn.org/stable/modules/linear_model.html (accessed on 12 January 2022).
- Melkumova, L.E.; Shatskikh, S.Y. Comparing Ridge and LASSO estimators for data analysis. Procedia Eng. 2017, 201, 746–755. [Google Scholar] [CrossRef]
- Ogutu, J.; Schultz-Streeck, T.; Piepho, H.-P. Genomic selection using regularized linear regression models: Ridge regression, lasso, elastic net and their extensions. BMC Proc. 2012, 6, S10. [Google Scholar] [CrossRef] [PubMed]
- Tibshirani, R. Regression Shrinkage and Selection Via the Lasso. J. R. Stat. Soc. Ser. B (Methodol.) 1996, 58, 267–288. [Google Scholar] [CrossRef]
- Yamaguchi, S.; Nishimura, T.; Hibe, Y.; Nagai, M.; Sato, H.; Johnston, I. Regularized regression analysis of digitized molecular structures in organic reactions for quantification of steric effects. J. Comput. Chem. 2017, 38, 1825–1833. [Google Scholar] [CrossRef] [PubMed]
- Stein, S.E.; Brown, R.L. Estimation of normal boiling points from group contributions. J. Chem. Inf. Comput. Sci. 2002, 34, 581–587. [Google Scholar] [CrossRef]
- Krimizis-Tsatsoulis, C. Trouton’s rule mysteries: An attempt to a better understanding. J. Chem. Thermodyn. 2021, 152, 106256. [Google Scholar] [CrossRef]
- Nash, L.K. Trouton and T-H-E rule. J. Chem. Educ. 1984, 61, 981. [Google Scholar] [CrossRef]
- Catoire, L.; Naudet, V. A Unique Equation to Estimate Flash Points of Selected Pure Liquids Application to the Correction of Probably Erroneous Flash Point Values. J. Phys. Chem. Ref. Data 2004, 33, 1083–1111. [Google Scholar] [CrossRef]
- Gharagheizi, F.; Eslamimanesh, A.; Mohammadi, A.H.; Richon, D. Empirical Method for Representing the Flash-Point Temperature of Pure Compounds. Ind. Eng. Chem. Res. 2011, 50, 5877–5880. [Google Scholar] [CrossRef]
- Patil, G.S. Estimation of flash point. Fire Mater. 1988, 12, 127–131. [Google Scholar] [CrossRef]
- Liu, X.; Liu, Z. Research Progress on Flash Point Prediction. J. Chem. Eng. Data 2010, 55, 2943–2950. [Google Scholar] [CrossRef]
- Phoon, L.Y.; Mustaffa, A.A.; Hashim, H.; Mat, R. A Review of Flash Point Prediction Models for Flammable Liquid Mixtures. Ind. Eng. Chem. Res. 2014, 53, 12553–12565. [Google Scholar] [CrossRef]
- Zhao, C.; Jiang, E.; Chen, A. Volatile production from pyrolysis of cellulose, hemicellulose and lignin. J. Energy Inst. 2017, 90, 902–913. [Google Scholar] [CrossRef]
- Yin, R.; Liu, R.; Mei, Y.; Fei, W.; Sun, X. Characterization of bio-oil and bio-char obtained from sweet sorghum bagasse fast pyrolysis with fractional condensers. Fuel 2013, 112, 96–104. [Google Scholar] [CrossRef]
- Trinh, T.N.; Jensen, P.A.; Sárossy, Z.; Dam-Johansen, K.; Knudsen, N.O.; Sørensen, H.R.; Egsgaard, H. Fast Pyrolysis of Lignin Using a Pyrolysis Centrifuge Reactor. Energy Fuels 2013, 27, 3802–3810. [Google Scholar] [CrossRef]
- Cao, J.P.; Xiao, X.B.; Zhang, S.Y.; Zhao, X.Y.; Sato, K.; Ogawa, Y.; Wei, X.Y.; Takarada, T. Preparation and characterization of bio-oils from internally circulating fluidized-bed pyrolyses of municipal, livestock, and wood waste. Bioresour. Technol. 2011, 102, 2009–2015. [Google Scholar] [CrossRef] [PubMed]
- Cross-validation: Evaluating Estimator Performance. Available online: https://scikit-learn.org/stable/modules/cross_validation.html (accessed on 13 January 2022).
- Twu, C.H. An internally consistent correlation for predicting the critical properties and molecular weights of petroleum and coal-tar liquids. Fluid. Phase Equilibria 1984, 16, 137–150. [Google Scholar] [CrossRef]
- Boduszynski, M.M.; Altgelt, K.H. Composition of heavy petroleums. 4. Significance of the extended atmospheric equivalent boiling point (AEBP) scale. Energy Fuels 1992, 6, 72–76. [Google Scholar] [CrossRef]
- Rannaveski, R.; Oja, V. A new thermogravimetric application for determination of vapour pressure curve corresponding to average boiling points of oil fractions with narrow boiling ranges. Thermochim. Acta 2020, 683, 178468. [Google Scholar] [CrossRef]
- White, C.M. Prediction of the boiling point, heat of vaporization, and vapor pressure at various temperatures for polycyclic aromatic hydrocarbons. J. Chem. Eng. Data 1986, 31, 198–203. [Google Scholar] [CrossRef]
- Gray, J.A.; Holder, G.D.; Brady, C.J.; Cunningham, J.R.; Freeman, J.R.; Wilson, G.M. Thermophysical properties of coal liquids. 3. Vapor pressure and heat of vaporization of narrow boiling coal liquid fractions. Ind. Eng. Chem. Process Des. Dev. 1985, 24, 97–107. [Google Scholar] [CrossRef]
- Joback, K.G. A Unified Approach to Physical Property Estimation Using Multivariate Statistical Techniques. Master’s Thesis, Massachusetts Institute of Technology, Cambridge, MA, USA, 1982. [Google Scholar]
- Riedel, L. Kritischer Koeffizient, Dichte des gesättigten Dampfes und Verdampfungswärme. Untersuchungen über eine Erweiterung des Theorems der übereinstimmenden Zustände Teil III. Chem. Ing. Tech. 1954, 26, 679–683. [Google Scholar] [CrossRef]
- Sipilä, K.; Kuoppala, E.; Fagernäs, L.; Oasmaa, A. Characterization of biomass-based flash pyrolysis oils. Biomass Bioenergy 1998, 14, 103–113. [Google Scholar] [CrossRef]
- Zhang, H.; Wang, J. Oil from biomass corncob tar as a fuel. Energy Convers. Manag. 2007, 48, 1751–1757. [Google Scholar] [CrossRef]
- Al-Soufi, H.H.; Savaya, Z.F.; Mohammed, H.K.; Al-Azawi, I.A. Thermal conversion (visbreaking) of heavy Iraqi residue. Fuel 1988, 67, 1714–1715. [Google Scholar] [CrossRef]
- Denson, M.D.; Terell, E.; Kostetskyy, P.; Broadbelt, L.; Olarte, M.; Garcia-Perez, M. Theoretical Insights on the Fragmentation of Cellulosic Oligomers to Form Hydroxyacetone and Hydroxyacetaldehyde. Energy Fuels 2023, 37, 13997–14005. [Google Scholar] [CrossRef]
- Denson, M.D.; Terrell, E.; Kostetskyy, P.; Olarte, M.; Broadbelt, L.; Garcia-Perez, M. Elucidation of Structure and Physical Properties of Pyrolytic Sugar Oligomers Derived from Cellulose Depolymerization/Dehydration Reactions: A Density Functional Theory Study. Energy Fuels 2023, 37, 7834–7847. [Google Scholar] [CrossRef]
- Manrique, R.; Terrell, E.; Kostetskyy, P.; Chejne, F.; Olarte, M.; Broadbelt, L.; García-Pérez, M. Elucidating Biomass-Derived Pyrolytic Lignin Structures from Demethylation Reactions through Density Functional Theory Calculations. Energy Fuels 2023, 37, 5189–5205. [Google Scholar] [CrossRef]
- Sanchez-Lengeling, B.; Roch, L.M.; Perea, J.D.; Langner, S.; Brabec, C.J.; Aspuru-Guzik, A. A Bayesian Approach to Predict Solubility Parameters. Adv. Theory Simul. 2018, 2, 1800069. [Google Scholar] [CrossRef]
- Gourdin, W.H. Estimate of the Vapor Pressure of Squalane at Approximately 293 K Using a Knudsen Cell Method. J. Chem. Eng. Data 2021, 66, 1630–1639. [Google Scholar] [CrossRef]
- Suuberg, E.M.; Oja, V. Vapor Pressures and Heats of Vaporization of Primary Coal Tars; U.S. Department of Energy: Washington, DC, USA, 1997. [Google Scholar]
- ASTM D5291-21; Standard Test Methods for Instrumental Determination of Carbon, Hydrogen, and Nitrogen in Petroleum Products and Lubricants. ASTM International: West Conshohocken, PA, USA, 2021.
- ASTM D5865/D5865M-19; Standard Test Method for Gross Calorific Value of Coal and Coke. ASTM International: West Conshohocken, PA, USA, 2019.
- ASTM D4809-18; Standard Test Method for Heat of Combustion of Liquid Hydrocarbon Fuels by Bomb Calorimeter (Precision Method). ASTM International: West Conshohocken, PA, USA, 2018.
- ASTM D86-20b; Standard Test Method for Distillation of Petroleum Products and Liquid Fuels at Atmospheric Pressure. ASTM International: West Conshohocken, PA, USA, 2020.
- ASTM D2892-20; Standard Test Method for Distillation of Crude Petroleum (15-Theoretical Plate Column). ASTM International: West Conshohocken, PA, USA, 2020.
- ASTM E1782-14; Standard Test Method for Determining Vapor Pressure by Thermal Analysis. ASTM International: West Conshohocken, PA, USA, 2016.
- ASTM D93-20; Standard Test Methods for Flash Point by Pensky-Martens Closed Cup Tester. ASTM International: West Conshohocken, PA, USA, 2020.
- Oasmaa, A.; Källi, A.; Lindfors, C.; Elliott, D.C.; Springer, D.; Peacocke, C.; Chiaramonti, D. Guidelines for Transportation, Handling, and Use of Fast Pyrolysis Bio-Oil. 1. Flammability and Toxicity. Energy Fuels 2012, 26, 3864–3873. [Google Scholar] [CrossRef]
- Lehto, J.; Oasmaa, A.; Solantausta, Y.; Kytö, M.; Chiaramonti, D. Review of fuel oil quality and combustion of fast pyrolysis bio-oils from lignocellulosic biomass. Appl. Energy 2014, 116, 178–190. [Google Scholar] [CrossRef]
- Lindfors, C.; Kuoppala, E.; Oasmaa, A.; Solantausta, Y.; Arpiainen, V. Fractionation of Bio-Oil. Energy Fuels 2014, 28, 5785–5791. [Google Scholar] [CrossRef]
- Oasmaa, A.; van de Beld, B.; Saari, P.; Elliott, D.C.; Solantausta, Y. Norms, Standards, and Legislation for Fast Pyrolysis Bio-oils from Lignocellulosic Biomass. Energy Fuels 2015, 29, 2471–2484. [Google Scholar] [CrossRef]
- Oasmaa, A.; Fonts, I.; Pelaez-Samaniego, M.R.; Garcia-Perez, M.E.; Garcia-Perez, M. Pyrolysis Oil Multiphase Behavior and Phase Stability: A Review. Energy Fuels 2016, 30, 6179–6200. [Google Scholar] [CrossRef]
- Elliott, D.C.; Meier, D.; Oasmaa, A.; van de Beld, B.; Bridgwater, A.V.; Marklund, M. Results of the International Energy Agency Round Robin on Fast Pyrolysis Bio-oil Production. Energy Fuels 2017, 31, 5111–5119. [Google Scholar] [CrossRef]
- Oasmaa, A.; Lehto, J.; Solantausta, Y.; Kallio, S. Historical Review on VTT Fast Pyrolysis Bio-oil Production and Upgrading. Energy Fuels 2021, 35, 5683–5695. [Google Scholar] [CrossRef]
- Lindfors, C.; Paasikallio, V.; Kuoppala, E.; Reinikainen, M.; Oasmaa, A.; Solantausta, Y. Co-processing of Dry Bio-oil, Catalytic Pyrolysis Oil, and Hydrotreated Bio-oil in a Micro Activity Test Unit. Energy Fuels 2015, 29, 3707–3714. [Google Scholar] [CrossRef]
- Hilten, R.N.; Das, K.C. Comparison of three accelerated aging procedures to assess bio-oil stability. Fuel 2010, 89, 2741–2749. [Google Scholar] [CrossRef]
- Krutof, A.; Hawboldt, K.A. Thermodynamic model of fast pyrolysis bio-oil advanced distillation curves. Fuel 2020, 261, 116446. [Google Scholar] [CrossRef]
- Bruno, T.J. Improvements in the Measurement of Distillation Curves. 1. A Composition-Explicit Approach. Ind. Eng. Chem. Res. 2006, 45, 4371–4380. [Google Scholar] [CrossRef]
- Bruno, T.J.; Smith, B.L. Improvements in the Measurement of Distillation Curves. 2. Application to Aerospace/Aviation Fuels RP-1 and S-8. Ind. Eng. Chem. Res. 2006, 45, 4381–4388. [Google Scholar] [CrossRef]
- Smith, B.L.; Bruno, T.J. Improvements in the Measurement of Distillation Curves. 4. Application to the Aviation Turbine Fuel Jet-A. Ind. Eng. Chem. Res. 2006, 46, 310–320. [Google Scholar] [CrossRef]
- Smith, B.L.; Bruno, T.J. Improvements in the Measurement of Distillation Curves. 3. Application to Gasoline and Gasoline + Methanol Mixtures. Ind. Eng. Chem. Res. 2006, 46, 297–309. [Google Scholar] [CrossRef]
- Windom, B.C.; Bruno, T.J. Improvements in the Measurement of Distillation Curves. 5. Reduced Pressure Advanced Distillation Curve Method. Ind. Eng. Chem. Res. 2011, 50, 1115–1126. [Google Scholar] [CrossRef]
- Mozaffari, P.; Järvik, O.; Baird, Z.S. Vapor Pressures of Phenolic Compounds Found in Pyrolysis Oil. J. Chem. Eng. Data 2020, 65, 5559–5566. [Google Scholar] [CrossRef]
- Ertaş, M.; Hakkı Alma, M. Pyrolysis of laurel (Laurus nobilis L.) extraction residues in a fixed-bed reactor: Characterization of bio-oil and bio-char. J. Anal. Appl. Pyrolysis 2010, 88, 22–29. [Google Scholar] [CrossRef]
- Shoji, T.; Kawamoto, H.; Saka, S. Boiling point of levoglucosan and devolatilization temperatures in cellulose pyrolysis measured at different heating area temperatures. J. Anal. Appl. Pyrolysis 2014, 109, 185–195. [Google Scholar] [CrossRef]
- Pecha, M.B.; Montoya, J.I.; Chejne, F.; Garcia-Perez, M. Effect of a Vacuum on the Fast Pyrolysis of Cellulose: Nature of Secondary Reactions in a Liquid Intermediate. Ind. Eng. Chem. Res. 2017, 56, 4288–4301. [Google Scholar] [CrossRef]
- Harman-Ware, A.E.; Ferrell, J.R. Methods and Challenges in the Determination of Molecular Weight Metrics of Bio-oils. Energy Fuels 2018, 32, 8905–8920. [Google Scholar] [CrossRef]
Figure 1.
Simplified process flow diagrams for (top) biomass (lignocellulose) pyrolysis refinery showing pathways to sugars/anhydrosugars and pyrolytic lignin from liquid-liquid extraction, liquid for aqueous phase reforming, gas for combustion, and other commodity/fine chemicals; and (bottom) petroleum and coal refinery showing pathways to heavy oils/tars and industrial carbon products (not showing light hydrocarbon fractions). Adapted from previously published work by (top) Fonts et al. (2021) and (bottom) Elkasabi and Mullen (2021) [3,18].
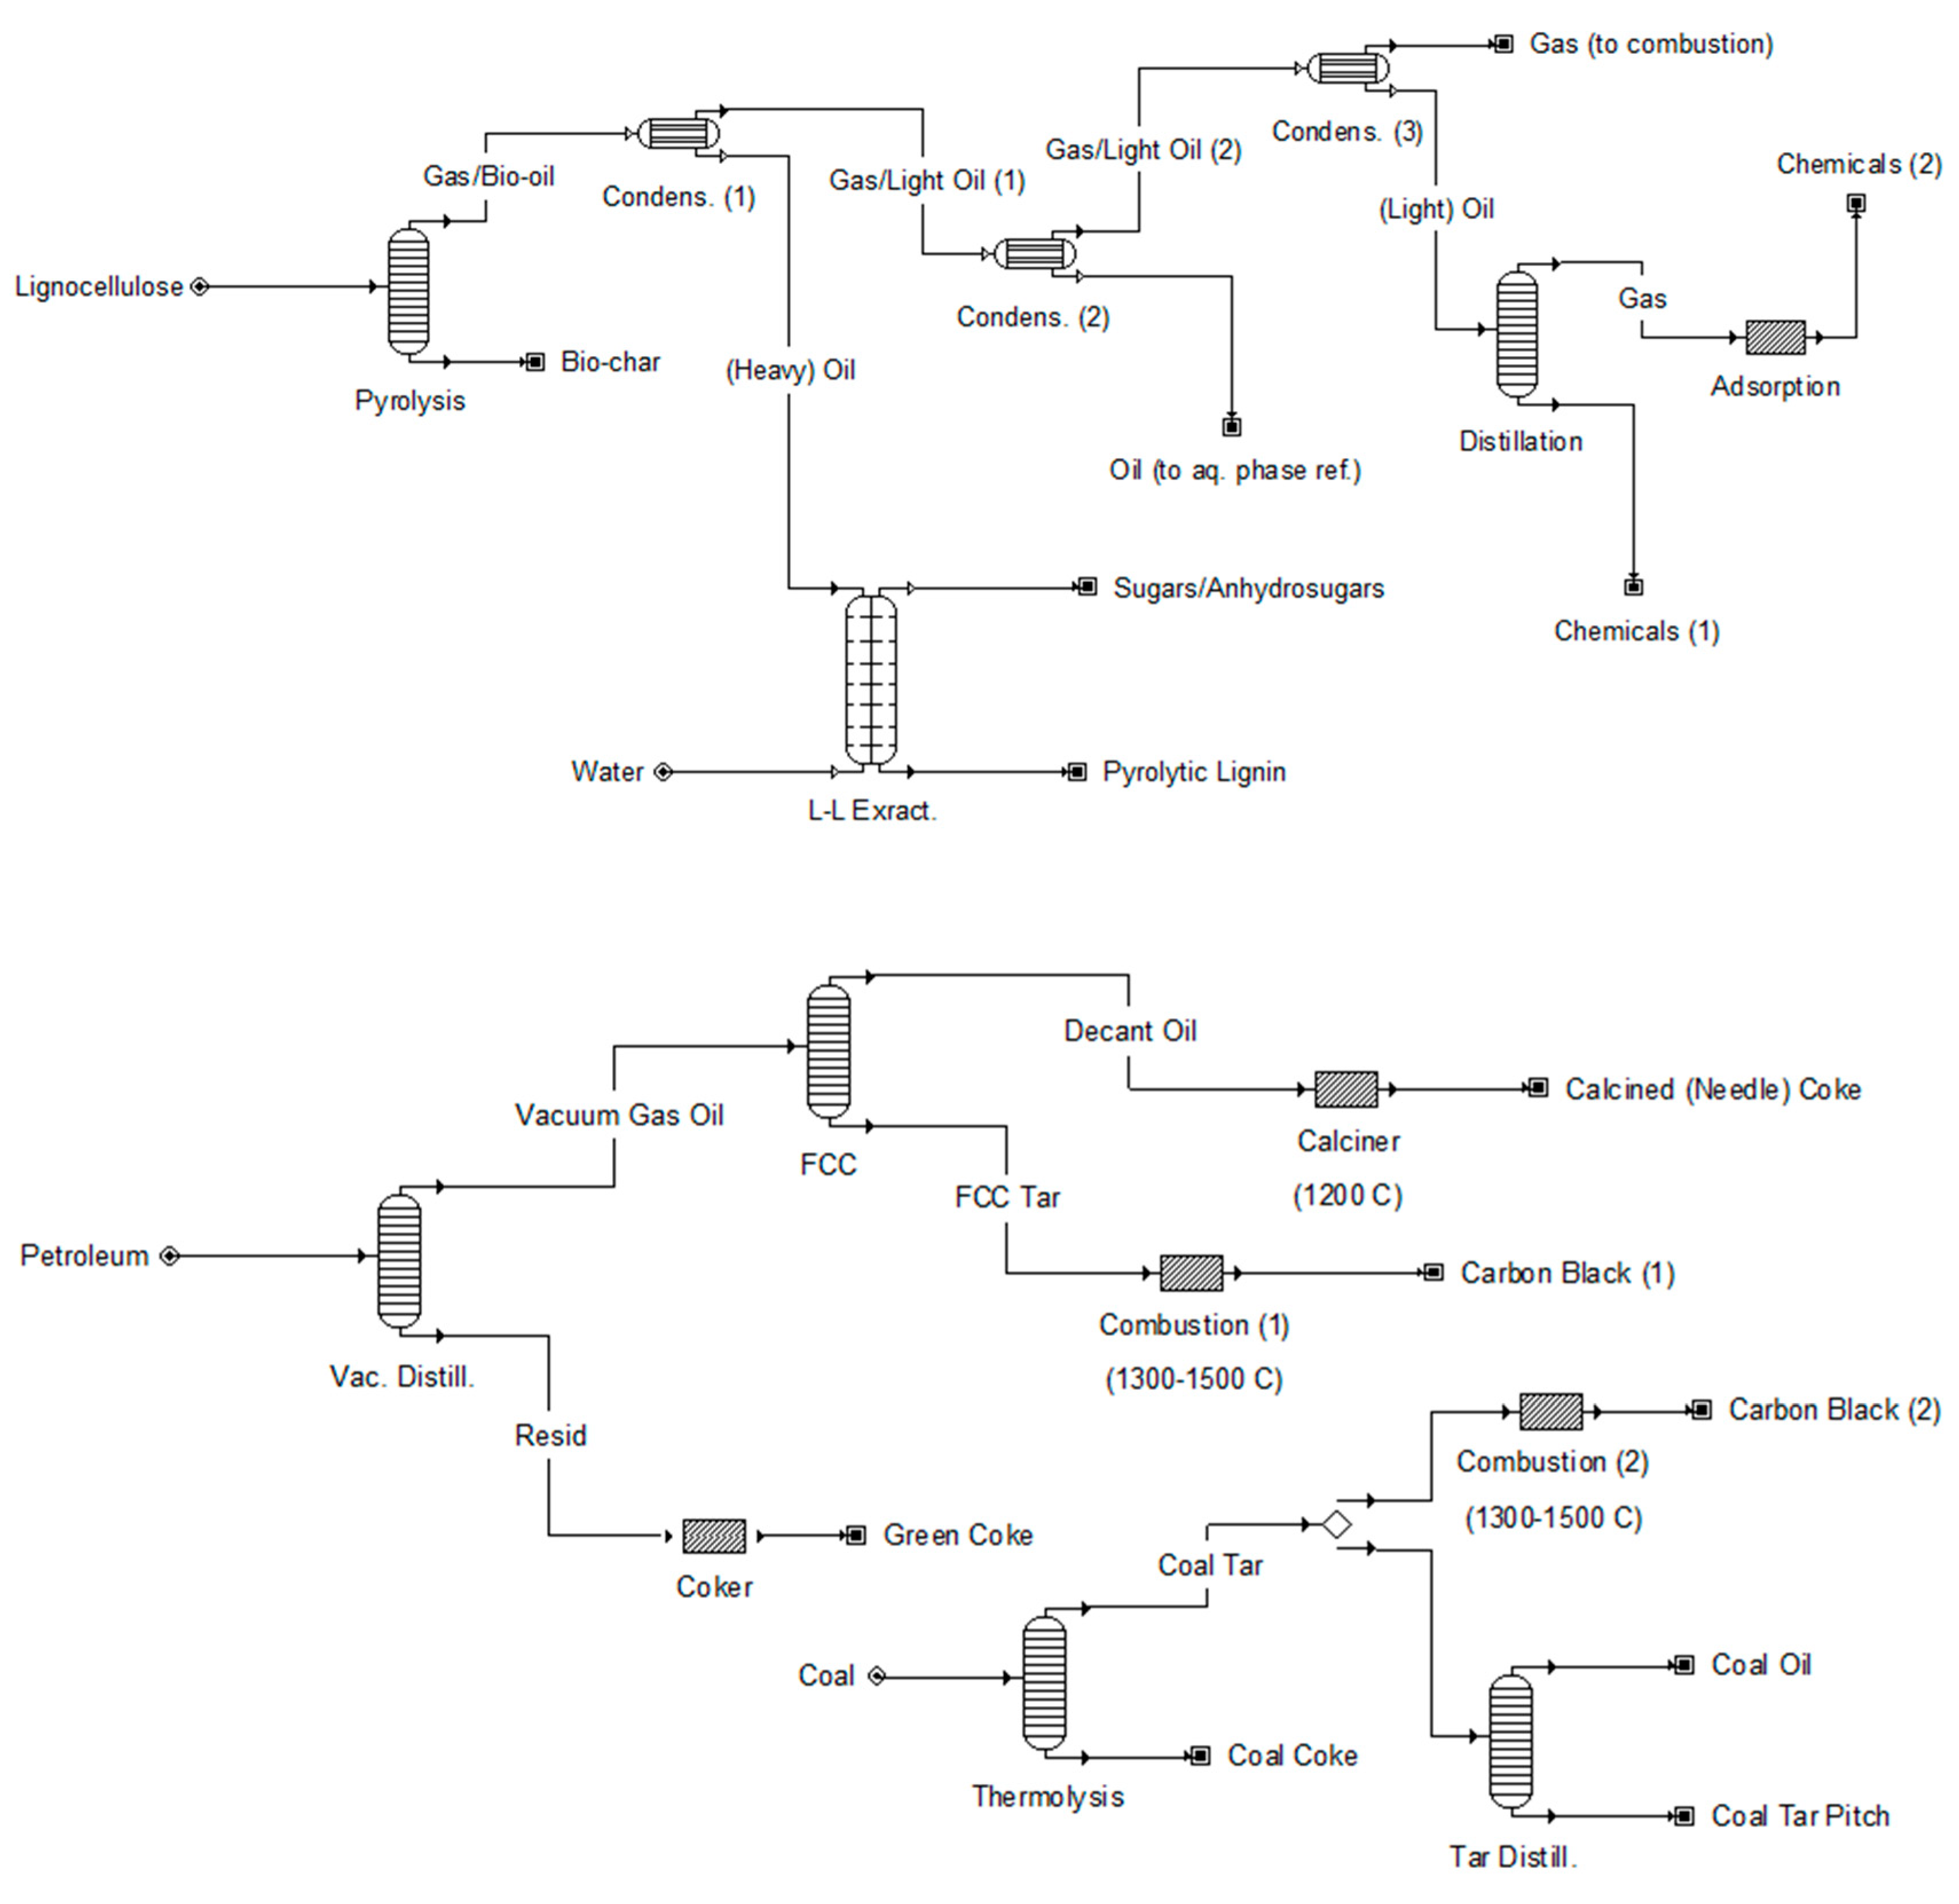
Figure 2.
Normal boiling point estimations plotted against molecular weight for bio-oil heavy molecule structures with comparison to empirical correlations given in Equations (15) and (16).
Figure 2.
Normal boiling point estimations plotted against molecular weight for bio-oil heavy molecule structures with comparison to empirical correlations given in Equations (15) and (16).
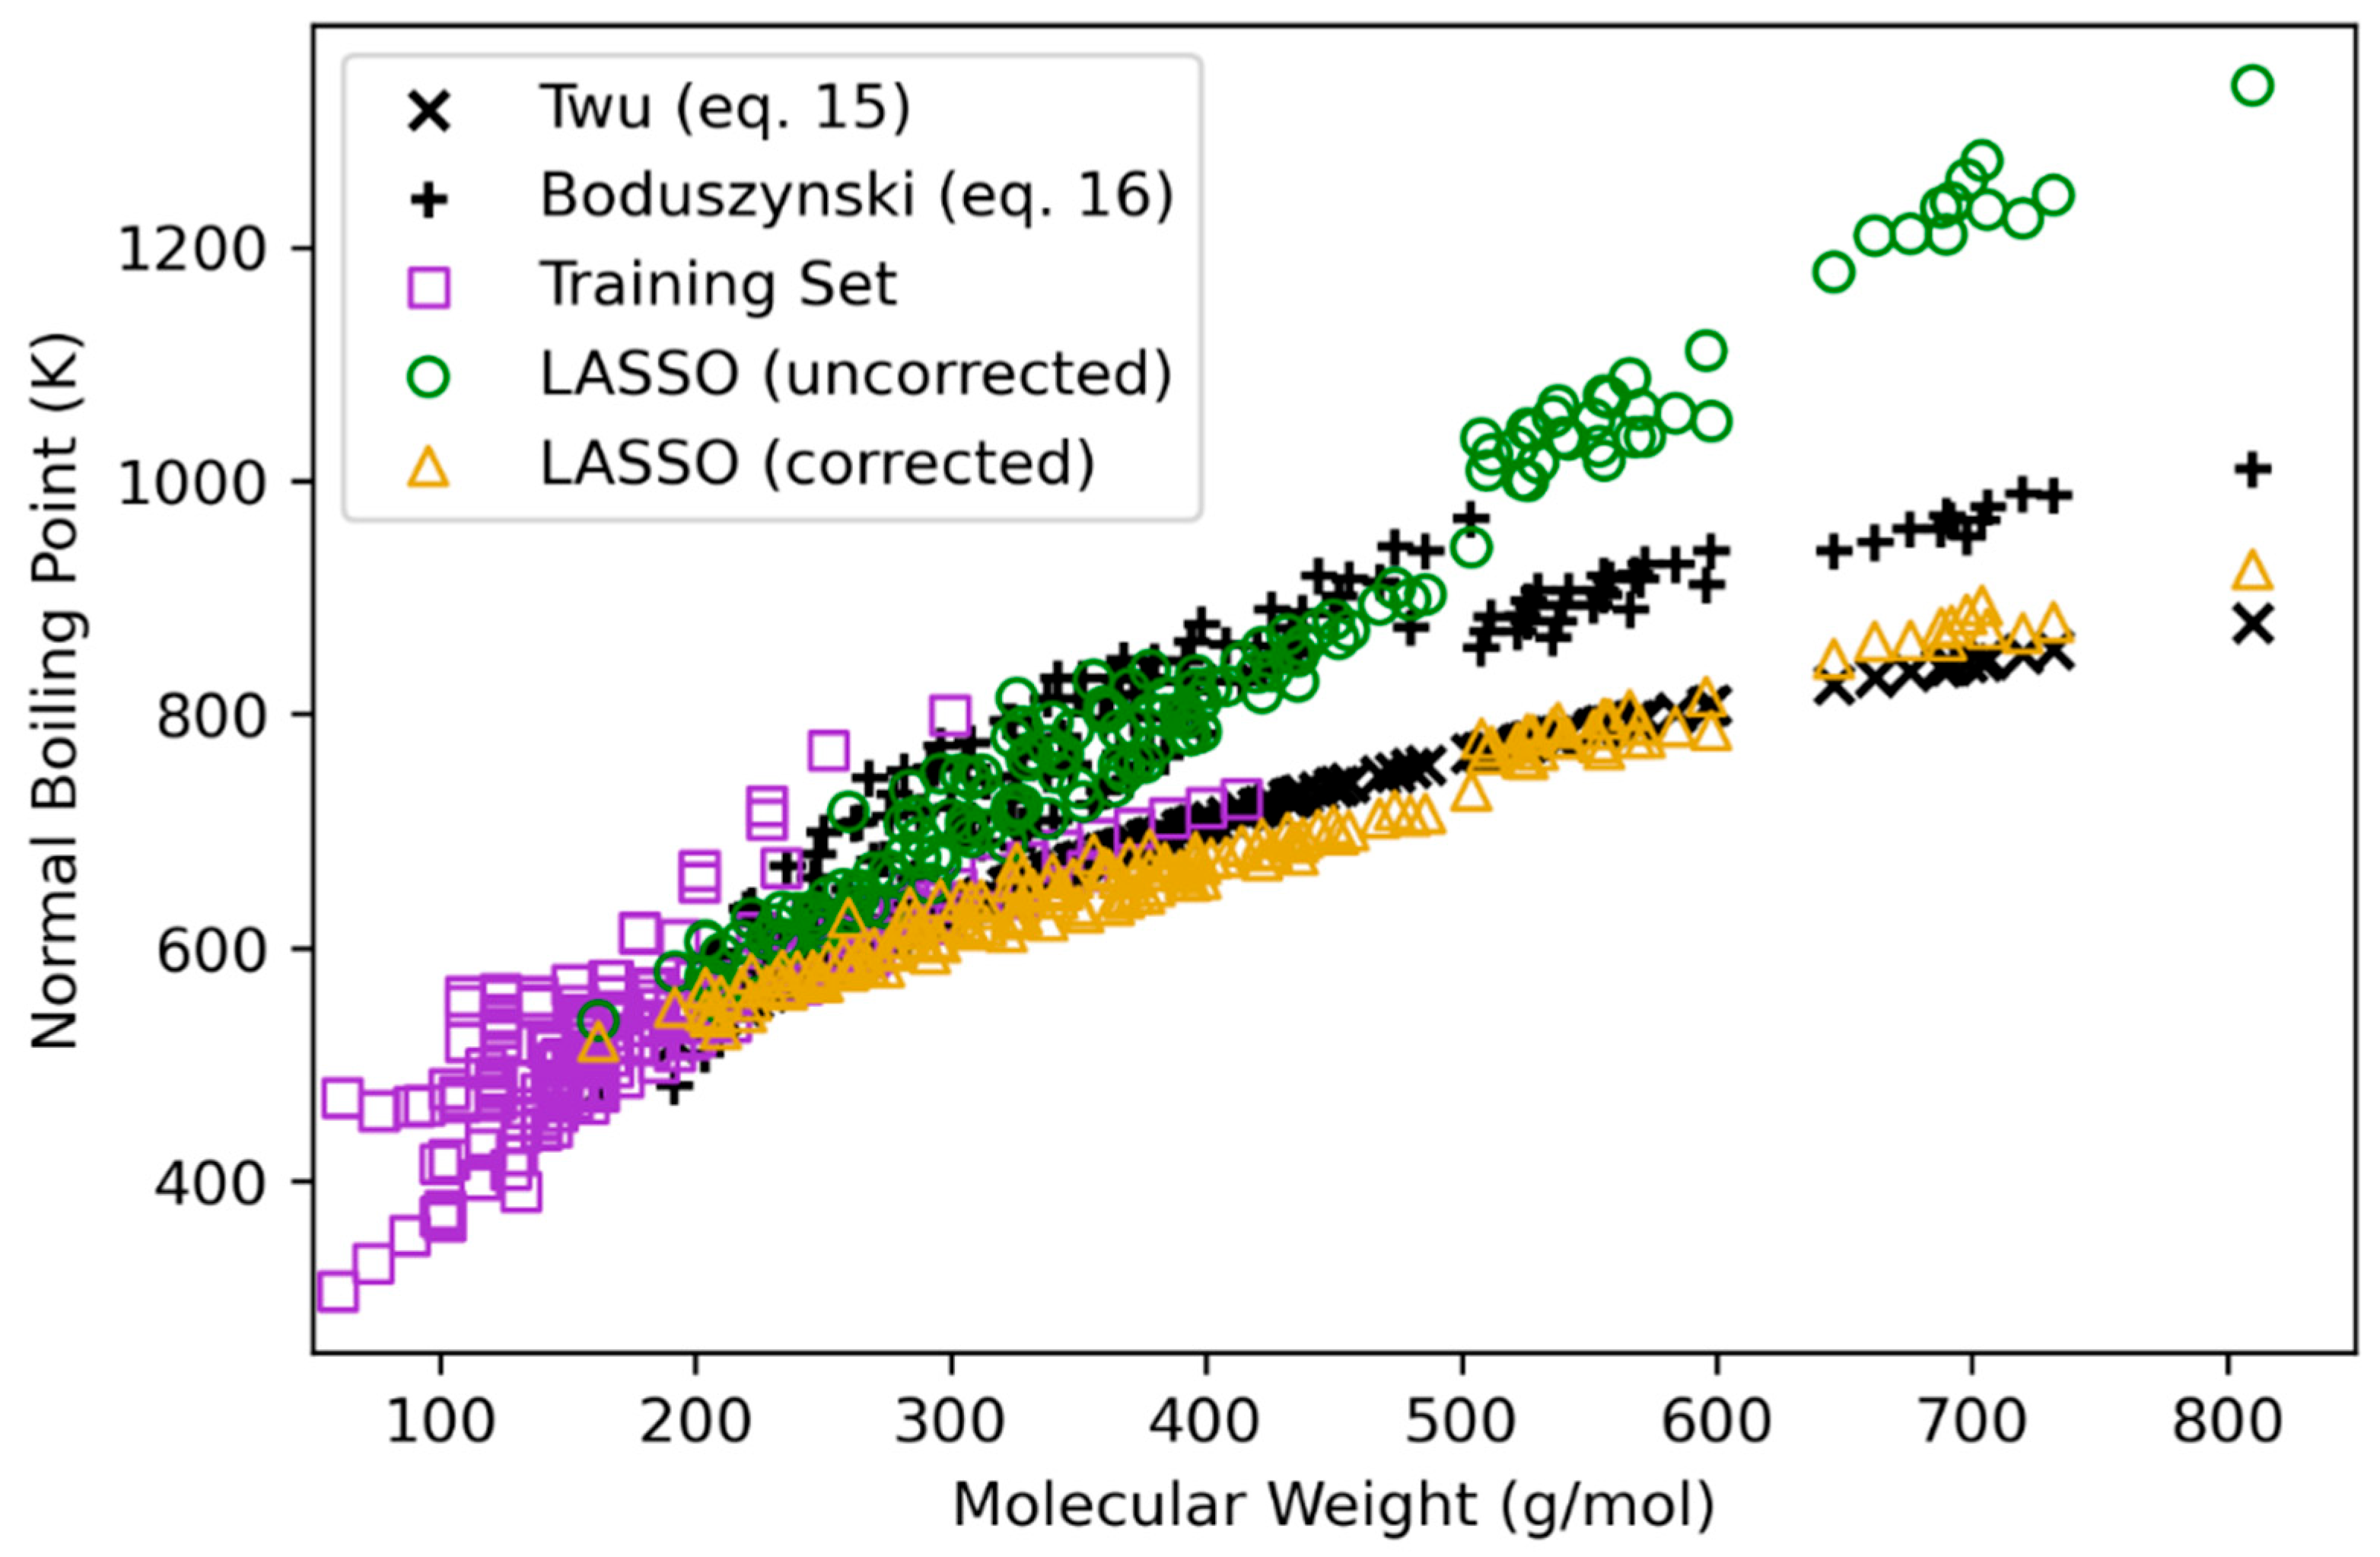
Figure 3.
Heat (enthalpy) of vaporization estimations (at TB) plotted against molecular weight for bio-oil heavy molecule structures (molar basis, kJ/mol) for protic and aprotic correlations.
Figure 3.
Heat (enthalpy) of vaporization estimations (at TB) plotted against molecular weight for bio-oil heavy molecule structures (molar basis, kJ/mol) for protic and aprotic correlations.

Figure 4.
Heat (enthalpy) of vaporization estimations (at TB) plotted against molecular weight for bio-oil heavy molecule structures (mass basis, kJ/kg) for protic and aprotic correlations.
Figure 4.
Heat (enthalpy) of vaporization estimations (at TB) plotted against molecular weight for bio-oil heavy molecule structures (mass basis, kJ/kg) for protic and aprotic correlations.
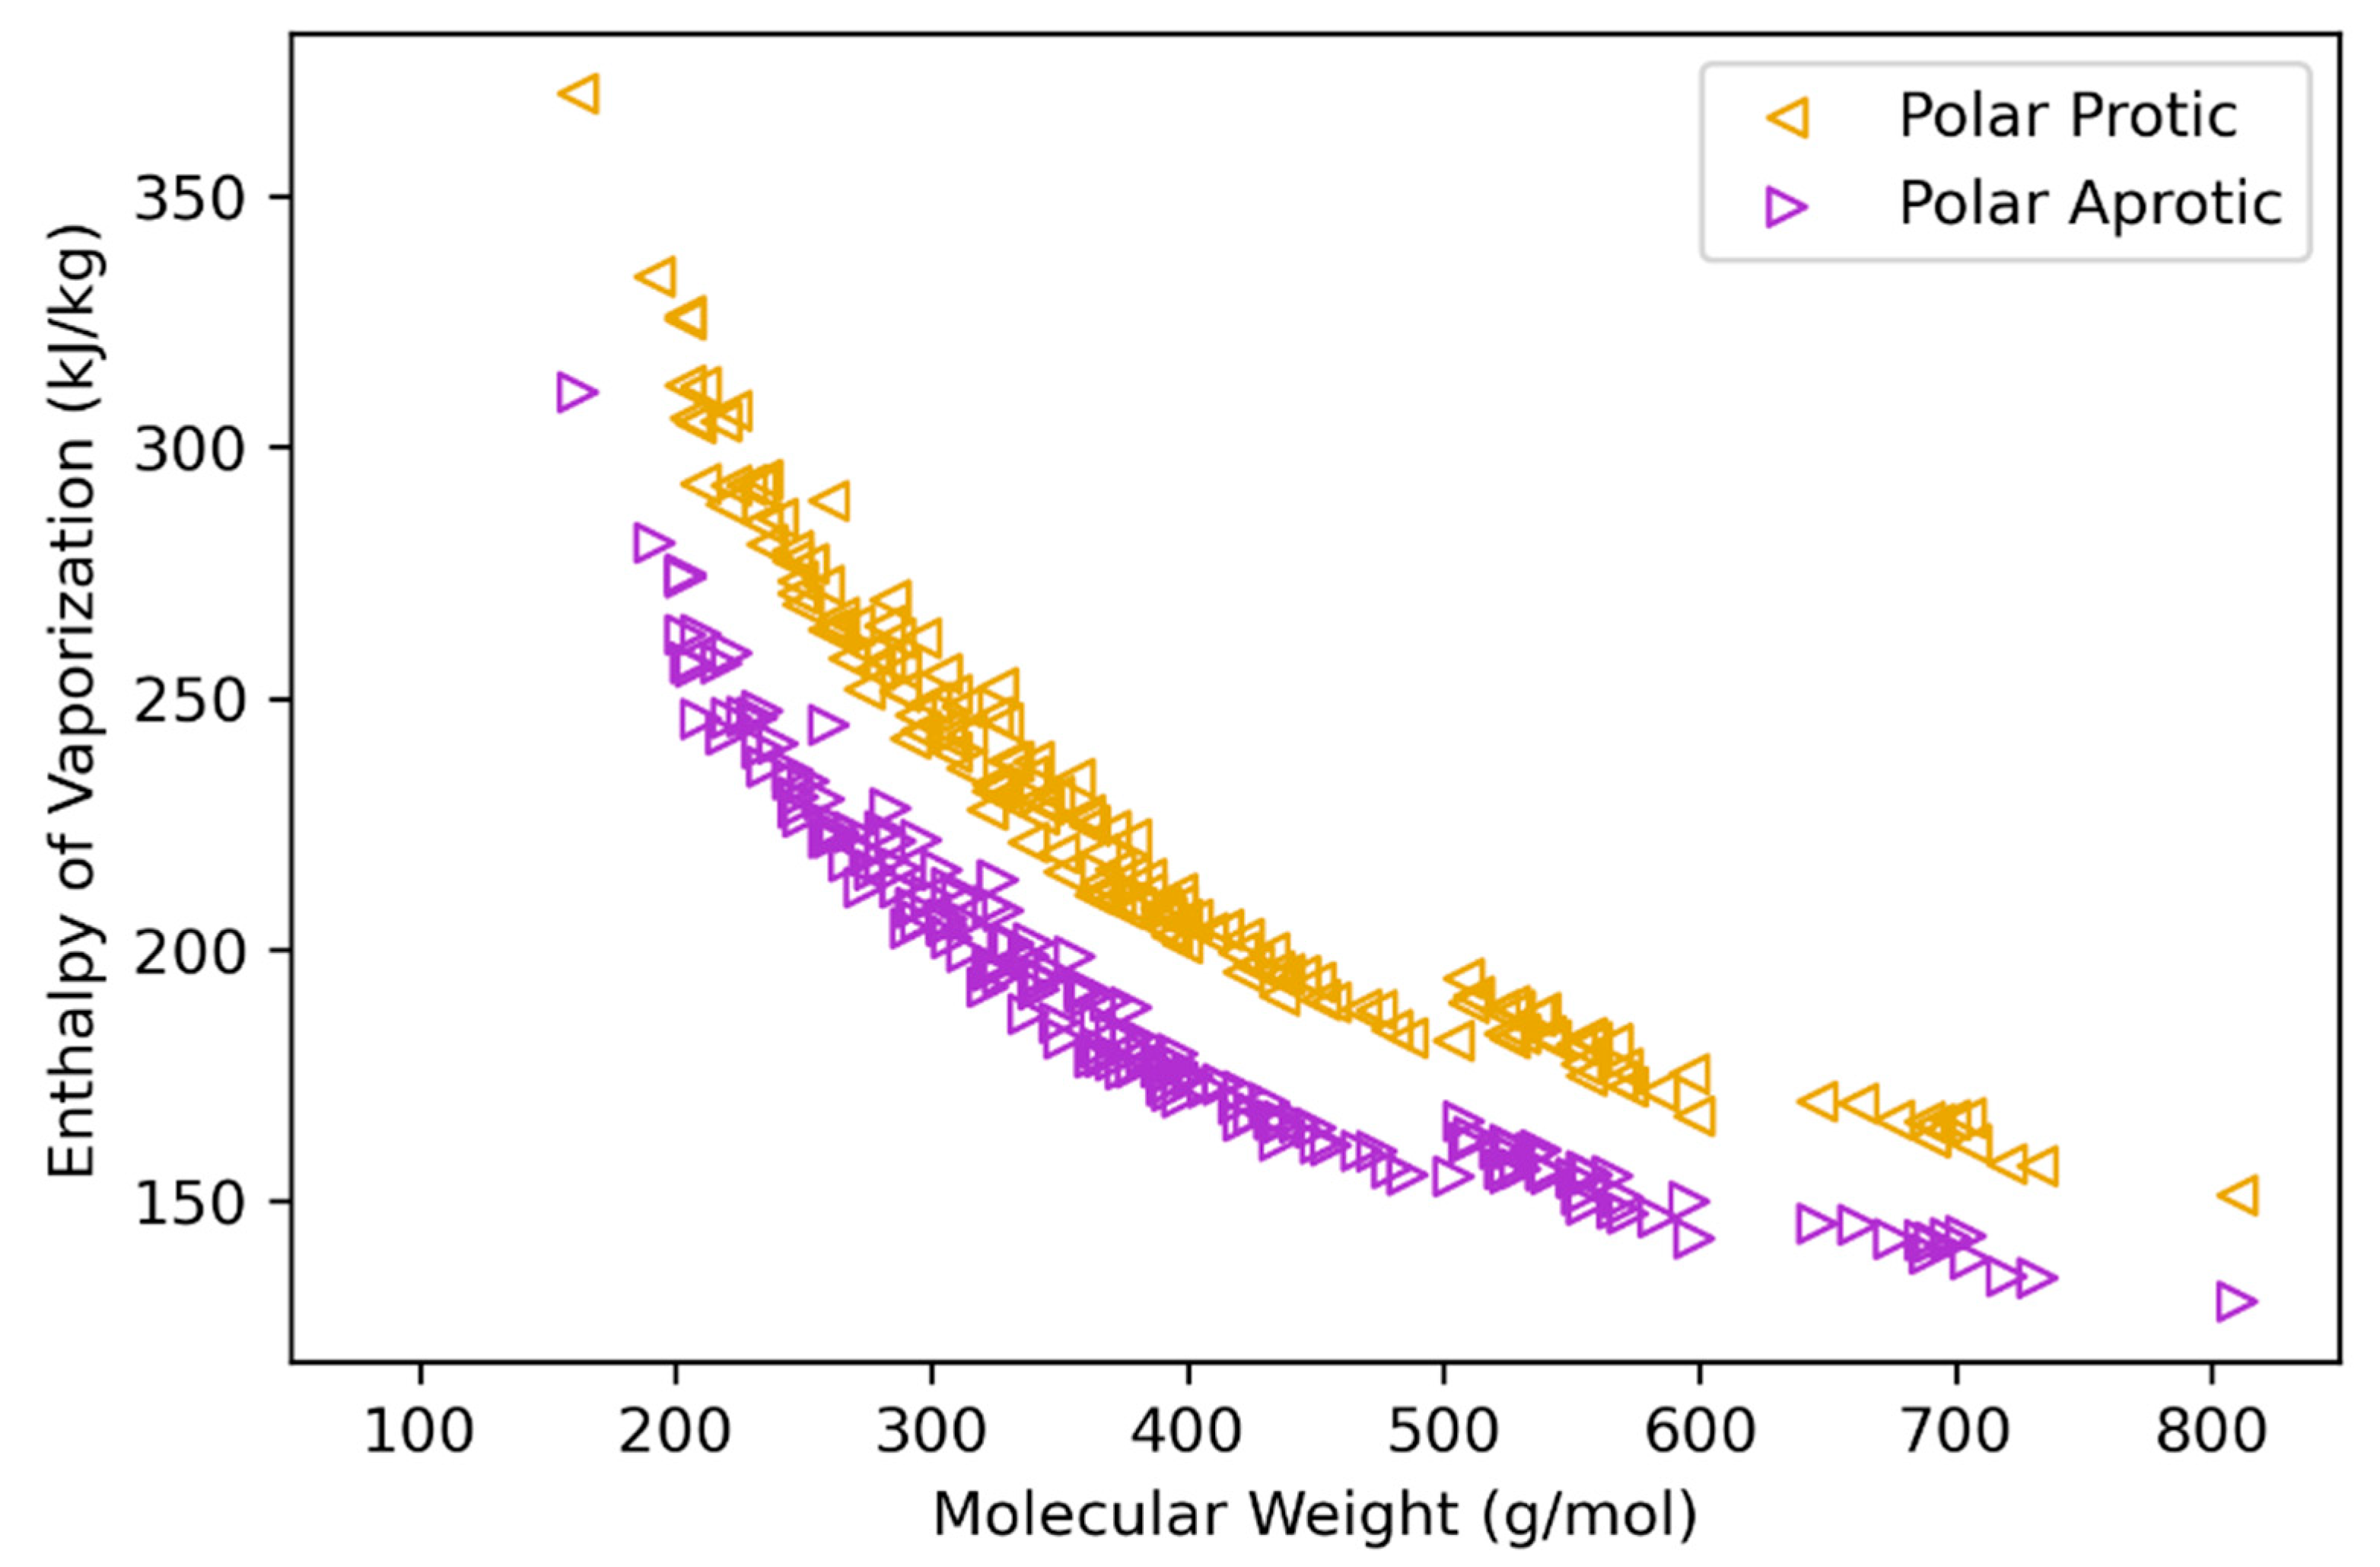
Table 1.
Details of heavy biomass pyrolysis oil structures analyzed in this study.
| Class | n a | MW Range b | C Range | H Range | O Range | Reference |
|---|---|---|---|---|---|---|
| Hexose | 66 | 162–504 g/mol | 6–22 | 10–32 | 4–16 | [36,37] |
| Pentose | 6 | 192–282 g/mol | 10 | 8–18 | 4–9 | [37] |
| Hex/Pent | 24 | 204–407 g/mol | 11–18 | 8–30 | 4–15 | [37] |
| LCC | 10 | 308–378 g/mol | 14–16 | 16–22 | 7–11 | [37] |
| Lignin | 57 | 260–810 g/mol | 14–40 | 12–44 | 4–18 | [37,38] |
| Total | 163 | 162–810 g/mol | 6–40 | 8–44 | 4–18 | -- |
a: number (n) of compounds in given class; b: range of molecular weight (MW) in given class.
Table 2.
Descriptions of abbreviations for main terms in the study.
| Abbreviation | Description | Abbreviation | Description |
|---|---|---|---|
| Hexose | Hexose-derived oligomers | LHV and HHV | Lower heating value and higher heating value, respectively (MJ/kg) |
| Pentose | Pentose-derived oligomers | TB | Normal boiling point (K); temperature of vapor-liquid equilibrium at atmospheric pressure |
| Hex/Pent | Hexose/pentose-derived oligomers | SVAP | Entropy of vaporization (J/mol-K) at the normal boiling point |
| LCC | Lignin carbohydrate complex compounds | HVAP | Enthalpy of vaporization (kJ/mol) at the normal boiling point |
| Lignin | Lignin-derived oligomers | TFL | Flash point (K); lowest temperature at which combustion can occur with an ignition source |
Table 3.
Calculated ranges of elemental analysis, LHV, and HHC values for heavy biomass pyrolysis oil structures.
Table 3.
Calculated ranges of elemental analysis, LHV, and HHC values for heavy biomass pyrolysis oil structures.
| Class | C Range (wt.%) | H Range (wt.%) | O Range (wt.%) | LHV Range (MJ/kg) | HHV Range (MJ/kg) |
|---|---|---|---|---|---|
| Hexose | 40.4–70.1 | 4.3–7.5 | 23.4–53.8 | 13.1–29.4 | 14.7–30.7 |
| Pentose | 42.6–62.5 | 4.2–6.4 | 33.3–51.1 | 14.8–23.4 | 16.5–24.0 |
| Hex/Pent | 42.1–64.7 | 3.9–6.4 | 31.4–51.5 | 14.7–24.2 | 16.3–24.7 |
| LCC | 47.6–58.4 | 4.9–6.1 | 36.4–46.6 | 16.5–22.4 | 18.1–23.1 |
| Lignin | 57.5–72.3 | 4.1–6.5 | 22.7–36.7 | 20.4–28.9 | 21.8–29.7 |
| Total | 40.4–72.3 | 3.9–7.5 | 22.7–53.8 | 13.1–29.4 | 14.7–30.7 |
Table 4.
Coefficients and intercepts of the Ridge and LASSO regression models for estimating TB (K).
Table 4.
Coefficients and intercepts of the Ridge and LASSO regression models for estimating TB (K).
| Ridge Coeff. | Ridge Coeff. | Ridge Coeff. | LASSO Coeff. | LASSO Coeff. | LASSO Coeff. |
|---|---|---|---|---|---|
| MW: 1.15 | CH3: −1.52 | OHcyclic: 0.90 | MW: 1.16 | CH3: −12.79 | OHcyclic: 4.53 |
| C%: 1.38 | CH2: −1.69 | OFnoncyc.: 0.51 | C%: 0 | CH2: −1.89 | OFnoncyc.: 0 |
| H%: −2.33 | CH: 1.48 | Oether: −0.68 | H%: 0 | CH: 0 | Oether: −6.44 |
| O%: 0.94 | C*: 2.00 | Ocarbonyl: −0.52 | O%: 0 | C*: 12.61 | Ocarbonyl: 0 |
| Ridge intercept: 234.14 | LASSO intercept: 331.62 | ||||
Table 5.
Calculated minimum, median, and maximum values for the estimated flash point values of heavy biomass pyrolysis oil structures.
Table 5.
Calculated minimum, median, and maximum values for the estimated flash point values of heavy biomass pyrolysis oil structures.
| Class | Minimum (K) | Median (K) | Maximum (K) | Minimum (°C) | Median (°C) | Maximum (°C) |
|---|---|---|---|---|---|---|
| Hexose | 375 | 447 | 550 | 102 | 173 | 277 |
| Pentose | 390 | 420 | 464 | 117 | 147 | 191 |
| Hex/Pent | 399 | 469 | 538 | 126 | 196 | 265 |
| LCC | 441 | 471 | 514 | 168 | 198 | 241 |
| Lignin | 428 | 524 | 674 | 155 | 251 | 400 |
| Total | 375 | 469 | 674 | 102 | 195 | 400 |
Disclaimer/Publisher’s Note: The statements, opinions and data contained in all publications are solely those of the individual author(s) and contributor(s) and not of MDPI and/or the editor(s). MDPI and/or the editor(s) disclaim responsibility for any injury to people or property resulting from any ideas, methods, instructions or products referred to in the content. |
© 2024 by the author. Licensee MDPI, Basel, Switzerland. This article is an open access article distributed under the terms and conditions of the Creative Commons Attribution (CC BY) license (https://creativecommons.org/licenses/by/4.0/).
Share and Cite
MDPI and ACS Style
Terrell, E. Estimation of Fuel Properties for the Heavy Fraction of Biomass Pyrolysis Oil Consisting of Proposed Structures for Pyrolytic Lignin and Humins. Energies 2024, 17, 2011. https://doi.org/10.3390/en17092011
AMA Style
Terrell E. Estimation of Fuel Properties for the Heavy Fraction of Biomass Pyrolysis Oil Consisting of Proposed Structures for Pyrolytic Lignin and Humins. Energies. 2024; 17(9):2011. https://doi.org/10.3390/en17092011
Chicago/Turabian StyleTerrell, Evan. 2024. "Estimation of Fuel Properties for the Heavy Fraction of Biomass Pyrolysis Oil Consisting of Proposed Structures for Pyrolytic Lignin and Humins" Energies 17, no. 9: 2011. https://doi.org/10.3390/en17092011
Note that from the first issue of 2016, this journal uses article numbers instead of page numbers. See further details here.