
Investigating Advanced Building Envelopes for Energy Efficiency in Prefab Temporary Post-Disaster Housing
by
 , and
, and
Lorenzo Rapone
1,
Afaq A. Butt
2,
Roel C. G. M. Loonen
2,
Giacomo Salvadori
3,* and
and
Francesco Leccese
3
1
Department of Energy, Politecnico di Torino, 10129 Torino, Italy
2
Department of Building Physics and Services, Eindhoven University of Technology, De Zaale, 5600 MB Eindhoven, The Netherlands
3
Department of Energy, Systems, Territory and Constructions Engineering, University of Pisa, Largo Lucio Lazzarino, 56122 Pisa, Italy
*
Author to whom correspondence should be addressed.
Energies 2024, 17(9), 2008; https://doi.org/10.3390/en17092008
Submission received: 19 March 2024
/
Revised: 9 April 2024
/
Accepted: 18 April 2024
/
Published: 24 April 2024
(This article belongs to the Special Issue Efficient Low Carbon Buildings and Districts)
Abstract
:Prefabricated temporary buildings are a promising solution for post-disaster scenarios for their modularity, sustainability and transportation advantages. However, their low thermal mass building envelope shows a fast response to heat flux excitations. This leads to the risk of not meeting the occupant comfort and HVAC energy-saving requirements. The literature shows different measures implementable in opaque surfaces, like vacuum insulation panels (VIPs), phase change materials (PCMs) and switchable coatings, and in transparent surfaces (switchable glazing) to mitigate thermal issues, like overheating, while preserving the limited available internal space. This paper investigates the energy and overheating performance of the mentioned interventions by using building performance simulation tools to assess their effectiveness. The optimization also looks at the transportation flexibility of each intervention to better support the decision maker for manufacturing innovative temporary units. The most energy-efficient measures turn to be VIPs as a better energy solution for winter and PCMs as a better thermal comfort solution for summer.
1. Introduction
1.1. Research Background
Demanding legislation concerning reduction of the energy consumption of buildings has been challenging for both the construction sector and the research community. The focus is to develop new high-efficiency products and construction techniques, set up new methodologies for assessing the energy demand of buildings during each stage of their life cycle and develop new technologies [1]. A relevant role is played by the very beginning phase of the life cycle, which includes the processing of materials, transport and the site operating phases. When accounting for the overall energy spent for construction and demolition, its share has increased to up to 50% of the total energy consumption [1]. As a result, over the last few years, alternatives to the traditional heavyweight construction methods have been emerging and proliferating. A significant example is the development of prefabricated buildings that have obtained success for their many advantages in sustainable building industrialization. Unlike traditional construction methods, adopting factory-made components or units leads to easier transport and assembly on-site to form the complete structure [2].
Privileging this solution through building prefabrication leads to certain economic aspects, such as saving construction time, improving building quality, reducing material waste, alleviating environmental loads and reducing cost [3]. Prefabricated buildings represent a lightweight construction solution that have become an important research topic in sustainable architecture [4], registering wide use in the USA, Australia and Japan and now gaining a market share in Europe as well [5].
The prefab lightweight building concept is most frequently related to temporary accommodations. Therefore, the focus of this research is categorized as prefab post-disaster temporary housing, playing a crucial role in disaster response and recovery by providing a temporary home for displaced people before they return to their permanent residence [6]. A common example of such applications is the need for temporary housing for post-earthquake scenarios in Italy, for which thermal analyses were conducted in the literature [7,8]. When a disaster strikes, the impending population displacement requires post-disaster housing accommodations while conducting the necessary reconstruction of their permanent residence. The post-disaster housing phases studied in the literature are emergency sheltering, where for a series of nights the displaced reside in a safe, dry location until they can safely navigate the devastated region; temporary Sheltering, made up of public mass shelters or designated camps with a duration of 2–3 weeks or until a temporary accommodation is available; and temporary housing. This research focuses on temporary housing, which is the longest and last segment before returning to a pre-disaster residence. This can last approximately between 6 months and 3 years, depending on the severity of the devastation [6]. This substantial length of time is spent in a variety of different places, including rental houses, vacant hotel rooms, prefabricated kit units and manufactured temporary housing units. Once reconstruction is concluded, the displaced population will return to permanent housing. Several studies also focused on the development of these temporary houses for sustainable urban regeneration [9].
Sadly, the need for prefab lightweight buildings has been drastically increasing over the past few years to provide temporary housing in emergency situations, such as with Hurricane Katrina (2005) or the Haitian earthquake (2011). Aside from natural disasters, a recent dramatic event was Russia’s invasion of Ukraine in late February 2022. Since millions of Ukrainian internally displaced people (IDPs) have been forced to flee their homes, especially in the south and east of the country, a series of prefab housing villages have been constructed in Lviv [10].
1.2. Lightweight Envelope Challenges
All temporary housing programs prioritize rapid construction design, low-cost and lightweight technologies. But more recently, together with the sociocultural characteristics, indoor thermal comfort has been treated as another primary aspect [11]. Although targeting the EPBD goals toward a more sustainable built environment with energy savings during the construction phase, prefab temporary housing presents some drawbacks regarding consumption during their useful life. Currently, they have difficulties responding to occupants’ requirements for comfort, flexibility and energy-saving throughout the building’s life cycle [1,12].
From a thermophysical perspective, the main difference between lightweight (LW) and heavyweight (HW) constructions is the effective thermal mass, which is the thermal energy storage capacity of the building materials. In general, the thermal mass in LW envelopes, consisting predominantly of insulation, is lower and influences building performance and thermal comfort by not absorbing temperature fluctuations properly. Since buildings with low effective thermal mass show a fast response to temperature and heat flux excitations, they can be sensitive to thermal issues, such as summer overheating [1,13]. As a reference benchmark for the Italian case, the thermal mass of the building envelope can be indirectly assessed by parameters like the time shifting and attenuation. The first one represents the time difference between the instants of the maximum outside surface temperature and the maximum inside surface temperature, while the attenuation is the ratio between the outdoor temperature variation and the necessary heat flux for keeping a constant indoor temperature. According to the Italian standard, the design of HW envelope-based constructions (with a superficial mass higher than 230 kg/m2) has no need to consider the attenuation factor for dynamic energy calculation, while for LW envelope-based constructions (with a superficial mass lower than 230 kg/m2), the dynamic thermal transmittance, as defined in the standard EN ISO 13786 [14], needs to be lower than 0.10 W/m2 K [15].
The thermal sensitivity of LW envelopes can be partially reduced through increasing the insulation in the façades, whose heat exchanges are the major contributor to space cooling loads. In the literature, the impacts of variations in the insulation thickness distribution and placement become increasingly important as the weight of the wall is reduced [15,16]. On the other hand, when it comes to LW buildings, there is a need to guarantee modularity and conserve the limited internal space such that any intervention made in the building envelope has to be as thin as possible to save space and allow for quick installation.
1.3. Research Aim
As a consequence of such a challenge, there is a need to develop proper LW building designs particularly suitable for post-disaster situations [17] by investigating innovative building envelope materials [18]. Compared with traditional buildings, lightweight systems are more prone to innovation in the design stage, prefabrication, the use of new and smart materials, high-end efficiency building systems and sustainable architectural practices. This statement is supported by the investment in many European projects under the topics of advanced materials and nanotechnology, prefabricated construction systems and energy-efficient envelopes [3,19].
Among the wide range of technology options for building envelopes studied in the literature [16,17], this research focuses on those which are considered more promising for prefab post-disaster buildings by the authors. By means of building performance simulation (BPS) tools, energy performance optimizations were made to rank the most suitable measures for the mentioned LW building challenges. The interventions that were analyzed as alternative energy solutions can be classified as static and dynamic, depending on whether the material properties are constant or some of them change because of specific external conditions, respectively.
Thanks to its high insulation performance and its potential in keeping the envelope thin, the unique static intervention analyzed in this research is the implementation of vacuum insulation panels (VIPs). While among the most promising and emerging dynamic building envelopes, the authors decided to focus on phase change materials (PCMs) for their intrinsic ability to increase thermal heat storage and switchable coatings, subdivided into thermochromic coatings (TCCs) and electrochromic coatings (ECCs). These last two interventions, based on switching the solar absorptance of opaque surfaces according to external stimuli, are analyzed for transparent surfaces too but by switching the solar reflectance of glass. These are called thermochromic windows (TCWs) and electrochromic windows (ECWs).
Since the scientific literature currently does not include an overview comparison of the mentioned building envelope technologies, the research objective is to compare their effectiveness in saving energy and in achieving thermal comfort, especially for summer overheating protection both in active and in passive ways.
2. Materials and Methods
2.1. Case Study Model
By means of an investigation of the literature and market state-of-the-art prefab temporary housing, the rectangular shape of the case study for this research was chosen based on the average standardized dimensions, taking into account transportability. It was assumed that the box’s internal layout consisted of only one multi-functional thermal zone (bedroom, kitchen or living room), where the thermal control setpoints were maintained at 20 °C from 20 September to 21 June for heating and at 26 °C from 21 March to 20 September for cooling from 6:00 a.m. to 9:00 p.m. in both cases. The prefabricated wallboards placed within the steel-framed structure were mainly composed of insulation material. The modeled base case reference had 40 mm of EPS insulation and two 10 mm gypsum plasterboards on the sides to provide consistency to the building envelope. Such stratigraphy guaranteed a reference thermal transmittance of 0.73 W/m2 K.
To investigate potential different optimal designs, two different Koppen climate scenarios were considered: Amsterdam (with Oceanic Climate, Cfb) and Florence (with a humid sub-tropical climate (Cfa) trending to the Mediterranean). The reference building was equipped with both heating and cooling systems. However, since most of these particular housing units have no cooling system for the summer season, especially in heating-dominated climates, a reference case in free running mode during summer was also investigated.
All the relevant building information of the reference case is summarized in Table 1, with the relative schedules implemented in BPS tools.
2.2. Software Workflow
The model development phase of the framework started by the building geometry of the base case with the software Sketchup 17.1 (the orange box in Figure 1). The primary thermo-physical inputs were assigned by the Euclid plug-in to define the unique investigated thermal zone and create the input data file (IDF) for the simulations. Euclid is a free and open-source extension for SketchUp that makes it easy to create and modify the geometry inputs for building energy models.
The energy performances of the measures were investigated using computational BPS (the blue box in Figure 1). In this research, the chosen BPS tool was EnergyPlus [20], developed by the Lawrence Berkeley National Laboratory and the U.S Department of Energy. It is a piece of dynamic energy simulation software which permits reading the created IDF files. In the IDF editor of EnergyPlus, the thermal properties (size, materials, plants and thermal loads) can be assigned to the model, but the energy consumptions for heating, cooling, ventilation, lighting and other energy flows can mostly be modeled for simulations. All simulations in this research were performed for a full year (8760 h) with a simulation timestep of 60 min. PCMs and switchable façade solutions require additional tools that are explained in more detail in Section 2.3.
To visualize the simulation results from EnergyPlus, the “spreadsheet” export option was used (the green box in Figure 1). Such an option permits creating a comma-separated values (CSV) file with the specific variable results chosen in the Output: Variable section of the IDF editor. The CSV extension is readable and editable in Excel. The energy performances of each measure were grouped in the same spreadsheet for multi-objective optimization, whose performance indicators are explained in Section 2.4. In conclusion, the optimization was completed with other objectives (the violet box in Figure 1) specifically relevant for the case study.
2.3. Advanced Building Envelope Systems
This section briefly presents each intervention analyzed for the energy performance comparison of the research. Every advanced building envelope system is introduced with its main characteristics and the corresponding simulation approach. All investigated design parameters of each type of building envelope technology are depicted in Table 2.
To numerically solve the appropriate heat transfer equations in EnergyPlus, the fully implicit first-order conduction finite difference (CondFD) method was used for the PCMs and also for switchable solution (TCCs, TCWs, ECCs and ECWs) modeling. Furthermore, BPS tools lack built-in models, consisting of sensors, processors and actuators, to simulate adaptive building envelope technologies [21]. The energy management system (EMS) in EnergyPlus (Figure 1) was therefore used in the research to adjust different building envelope states [20] to switchable solutions. The EMS program is based on if-else logics, and the switching between the high and low values is assumed to be automatic and instantaneous.
Regarding opaque coatings, the control algorithm actuated the “Surface Construction State” with a high or low value of solar absorptance αD for each building envelope element depending on whether the sensor value TSENSOR was lower or higher than the switching temperature TS. The actuating switching states for the coatings were modeled exactly like the base case reference envelope components but with the selected high and low solar absorptance values. The opaque surfaces involved in thermochromic or electrochromic interventions were all the ones for the base case, except for the north façade and the floor.
In contrast, when simulating switchable glazing, the glass states differ in their “Solar Transmittance at Normal Incidence” values gD. Optimization of both the thermochromic and electrochromic controls involved two parameters: the solar absorptance and the switching temperatures. For each selected solar absorptance range, with 0 or 0.25 as the low value and 1 or 0.75 as the high value, different switching temperatures were investigated (Table 2). The thermochromic and electrochromic interventions for glazing were applied to all three windows of the base case.
Aside from the building envelope interventions, enhancements in ventilation strategies were also considered as further alternative energy solutions. Different design flow rates (2, 3 and 4 ACH) and schedule controls (from 10:00 a.m. to 8:00 p.m. during winter and from 3:00 p.m. to 6:00 a.m. during summer) were investigated for better energy performance. The results for these ventilation improvements are illustrated in Section 3.1.1.
2.3.1. Vacuum Insulation Panels (VIPs)
For the purpose of the building simulation, the VIPs were assumed to be modeled as massless layers, referring to constructions with no or a quite low thermal capacity, which only affected the thermal resistance and did not influence the storage term in the heat balance equations [21]. Such a massless layer was applied to all the side walls and the roof of the base case reference building. To make an accurate performance comparison with the reference case, the VIP layer was modeled while keeping the same thickness as the base case EPS insulation (40 mm) but with a thermal conductivity of 0.008 W/(m K) (Table 2) instead of the reference EPS one of 0.035 W/(m K). Such a thermal conductivity value for the VIPs was selected for the simulations as it is the maximum value in the IEA range [22], and it would balance the fact that constructive thermal bridges are neglected in BPS tools.
2.3.2. Phase Change Materials (PCMs)
One dynamic adaptive solution that has become well established over the years is phase change materials (PCMs), which can be integrated into a wall to increase the building’s thermal energy storage capacity. This changes the thermophysical behavior of the building to that of a high thermal mass building because these materials have high phase change enthalpy in a wide variety of phase change temperatures, taking advantage of latent heat storage (LHS) [13]. As the temperature increases, the material changes phase from solid to liquid, absorbing heat (endothermic reaction). Similarly, when the temperature decreases, the material changes phase from liquid to solid, desorbing heat (exothermic reaction).
In EnergyPlus, the macro-encapsulated PCM layer within the envelope is placed between the inner gypsum board and the insulation because it was found that the cooling load reductions exponentially increase when PCMs are placed as close to the interior of the building as possible [23]. As with VIPs, the PCM layer was placed in all side walls and roof surfaces. When adopting the CondFD method for simulating PCMs, a 1 min timestep was used. Three different melting points (23 °C, 25 °C and 27 °C; Table 2) were investigated to find the optimal case for each climate scenario. The enthalpy-versus-temperature data for each of the three investigated cases were given by the DesignBuilder V7 software library (Figure 1) in reference to BioPCM® data sheets [24].

Table 2.
Design parameters for each investigated measure. In the cases of switchable coatings and glazing, the parameters were optimized according to performance assessment.
Table 2.
Design parameters for each investigated measure. In the cases of switchable coatings and glazing, the parameters were optimized according to performance assessment.
| Building Envelope Technology | Design Parameters | Unit | Values | Reference |
|---|---|---|---|---|
| VIP | λ | W/(m K) | 0.008 | [22] |
| PCM | Tm | °C | 23–25–27 | [24] |
| TCC; ECC | Ts | °C | 10–15–20–25–30–35 | [25] |
| αlow | - | 0–0.25 | [25] | |
| αhigh | - | 0.75–1 | [25] | |
| TCW; ECW | Ts | °C | 10–15–20–25–30–35 | - |
| glow | - | 0 | - | |
| ghigh | - | 1 | - |
For the sake of investigating the correct functioning of the PCM modeling, Appendix A shows the weekly results of the latent heat effect with a timestep of 1 min.
2.3.3. Thermochromic Coatings (TCCs) and Windows (TCWs)
Among the dynamic solar control coatings, thermochromic coatings (TCCs) are the temperature-based ones which temporally switch from high solar absorptance at low temperatures to low solar absorptance at high temperatures. The research suggests that such coatings further increase energy savings by working effectively during periods with fluctuating heating and cooling demands [25].
Also, thermochromic windows (TCWs) have been widely developed in the last few years thanks to their passive and temperature-driven solar modulation [26]. As already seen for TCCs, these devices can modulate their transmittance parameters in accordance with their temperature in a self-adapting mechanism that dynamically responds to the external environment.
The outside surface temperature TOUT,FACE was used as a parameter for the EMS sensors for the thermochromic controls. As the switching temperature of VO2-based TCCs and TCWs can be varied through cation doping, determining the optimum switching temperatures is a critical metric for the material developer. Therefore, the switching temperature was varied between 15 and 35 °C to select the optimal temperature. Furthermore, both the optimal α and g switching ranges investigated in the research were quite extreme (αD from 0 to 1 for the coatings and gD from 0 to 1 for the windows) compared with the ones in commerce. Despite this, the main purpose of the optimization is to give a critical metric to the material developers.
2.3.4. Electrochromic Coatings (ECCs) and Windows (ECWs)
Previous research [27] highlighted that the surface temperature-based switching control led to heating penalties and therefore was not an optimal control strategy for the heating-dominated climates, such as in the Netherlands. Therefore, electrochromic coatings (ECC) were also analyzed in this research to assess their effectiveness in prefab post-disaster buildings. Electrochromic control consists of a closed-loop control which changes thermophysical properties (external solar absorptance in this case) as a response to a variation in an electric field.
Similar to ECCs, the main advantage of electrochromic windows (ECWs) lies in the capability to change their transmittance properties between bleached and colored states, allowing reversible oxidation or reduction reactions in response to an external electrical stimulus [28,29]. The process is exactly the same as the one seen for opaque ECCs, but in the case of ECWs, a five-layer coating is applied to the glass panes on the side of the air cavity (Figure 2). The outdoor air temperature TOUT,AIR was used as a parameter for the EMS sensors for the electrochromic controls.
It is worth noting that regarding electrochromic controls, for both the ECC and ECW, the already explained control is a rule-based control specifically based on the outdoor air temperature. Such a control chosen for this research was modeled with the awareness of more conservative results for heating periods but less conservative ones for cooling periods, where the MPC would be more efficient.
2.4. Energy Performance Assessment
Including different HVAC system scenarios for the analyzed building is considered of relevant importance to have a wide view of the possible realistic cases. For this reason, both climate scenarios (Netherlands and Italy) were investigated in cases where HVAC was equipped with both heating and cooling systems, and in these cases, there was no active cooling. This decision was due to the fact that, especially in the heating-dominated Dutch climate, most of the houses have no cooling systems for the summer season.
In terms of energy performance, these two different HVAC cases had to be studied separately. The building envelope measures were mainly optimized to improve energy efficiency while considering the primary total annual energy demand Ep,TOT (kWh/year), including both the heating Ep,H (kWh/year) and cooling contributions, Ep,C (kWh/year). Meanwhile, in the case where the building was in free-running mode during summer, the absence of active cooling implies that the indoor environmental comfort of building occupants needs to be enhanced [30]. As a consequence, the performance indicators for this second case are Ep, H for the winter and cooling degree hours and CDH [31] for summer to assess the thermal discomfort due to the overheating effect. CDH (°C h) is calculated as follows:
where, and represent the indoor operative temperature and its allowed limit at time, respectively. In particular, the maximum operative temperature was assumed to be constant. A thermal comfort study which considers the thermal adaptation of occupants verified that a temperature limit of 26 °C is acceptable for bedrooms in the case of no elevated air speed, while in bathrooms, the environment conditions can admit up to 30 °C at a 90% acceptability level [32]. Due to the multifunctioning nature of the study case, the most stringent limit of 26 °C was considered in the research. Furthermore, the investigated period P for overheating assessment was not considered to be only the summer season, but it was extended to a typical non-heating season. In particular, P was considered to be from 1 May to 30 September to include the potential high temperature peaks during May and September, especially for the Italian case. As shown in Table 1, the building was occupied all day long by at least one person, and thus all the daily hours were considered for overheating assessment (3648 h for the whole period).
To sum up, the design optimization in Section 3 was different for the cooled and non-cooled cases. In the first one, the results were presented in clustered columns to see the heating and cooling influences in the primary total annual energy demand. Meanwhile, for the non-cooled scenario, the performance assessment methodology consisted of scatter plots with the two mentioned performance indicators on the axes. Depending on the values of the performance indicators, distinct design solutions could be found for the best comfort solution, best energy solution and trade-off solution. The solutions that are closest to the lower left ends of the graphs can be considered Pareto optimal [13].
2.5. Transportation Aspects
It is worth noting that every intervention needs to be investigated not only in terms of energy efficiency but also in terms of transport relations as an important prerogative. It is essential that each prefab temporary building application is easily transportable from one place to another. Since these envelope strategies are expected to be preassembled in the structure before arriving to the site, they need transportation requirements too. The most critical point for the installation of these envelope solutions is their risk of exposure to damage.
Regarding VIP intervention, this research was conducted with the awareness of the many drawbacks of this high-insulation system, such as higher investment costs than EPS, uncertainty about its useful lifetime, a high thermal bridging effect and above all, particularly for transportable applications, fragility and being easy to damage during installation and transportation. VIPs cannot be cut and reshaped on site, and thus it is important that installation and transportation be carried out by qualified personnel only, with particular attention paid to the point loads (e.g., impacts by sand grains, bricks or stone fragments). Once properly installed, failure risks were observed to be lower. In any case, VIPs must be well protected from mechanical impacts because their sensitivity to damage emerges in the usage phase as well [22].
On the other hand, PCMs are more suitable for transportation, which explains their use in logistics applications. Aside from building envelope applications, PCMs are also widely used in logistics and cold chains for their LHS properties. For example, over the last few years, PCM technology has been applied to refrigerated transport and packaging for better product temperature stabilization during the transport phase [33]. Moreover, PCM layers are generally placed on the inner side of the building envelope, as previously mentioned. These statements can support that such materials are most prone to be used in transportable applications, such as prefab temporary buildings.
Finally, regarding switchable solutions, both TC and EC coatings or glazing cannot fall back on many years of experience with proven technology since they involve innovative technologies, resulting in challenging projects with relatively high risks. Only little information is given by some producers about ECWs. Smart glass can get damaged during transportation and installation, but this is extremely rare. To ensure the proper operation of an ECW, it must be installed by a qualified electrician and should be delivered, handled, installed and protected in compliance with all local legislation, regulations and codes of practice. Furthermore, in cases where a TCC is based on thermochromic paints or dyes, these materials would be easy to transport in the authors’ opinion if the specific regulations are met.
3. Results
3.1. Case without Active Cooling
3.1.1. VIP, PCM and Ventilation Strategies
Figure 3 shows the scatter plots with the performance results of the base case reference and VIP and PCM interventions. All three cases are displayed with potential changes in ventilation modeling because a good natural ventilation strategy can tremendously reduce the overheating period, as found by Rakotonjanahary et al. regarding lightweight modular building units in Luxembourg [34]. In this research, the changes in ventilation strategy were based on the design flow rate and schedule control. As in Table 1, the reference design flow rate was 0.5 L/m2 s, corresponding to 0.70 ACH for the case study. According to the literature and producer recommendations [35], the investigated increases in the ventilation rate were 2, 3 and 4 ACH, represented in Figure 3 with blue-shaded scatters. Thanks to the adjustments in ventilation strategies, both Ep,H and CDH consequently decreased to make the interventions more effective, as explained later in more detail.
The peculiarity of VIPs is that in both climate scenarios, they had a considerable impact on the reduction in annual heating consumption (57% in the Netherlands and more than 60% in Italy). On the other hand, a highly insulated envelope had thermal issues in summer period; the overheating effect increased because the heat that came in during the day remained inside the prefabricated box. For this reason, when replacing EPS with VIPs, the CDH value was 20% and 10% higher than the base case in the Dutch and Italian scenarios, respectively. The fact that the magnitude of the overheating effect in the Netherlands was higher can be explained by the relatively low initial CDH value of the Dutch base case compared with the Italian one. Thus, the impact of the heat trapped in the box by the VIP-based envelope was higher. To minimize this effect, a combination of VIPs with the different investigated ventilation flow rates was also modeled to increase the negative heat fluxes. Especially in the Netherlands, where the effect of ventilation was higher, the CDH value consequently decreased to make the VIP scatter enter the gray rectangle range of the effective solutions in Figure 3.
Regarding PCM solutions, a Pareto design optimization in the same scatter plot of Figure 3 was created to investigate the effectiveness of different melting point temperatures. In both the (a) and (b) cases, the distribution was V-shaped, where the CDH value was lower for the PCMs with 25 °C as melting point. This was due to Tlimit being equal to 26 °C, as considered in Section 2.4 for overheating assessment. In particular, the Dutch case presented a solution with 23 °C as the melting point, which was closer to the middle solution (25 °C), while the Italian case had the opposite trend, which implies that the optimal PCMs are different for different climates. This finding about PCM optimization is supported by the scientific literature [36]. To properly benefit from the LHS gain, lower melting points are more suitable for colder climates (a), while higher melting points are more suitable for warmer climates (b). According to the Pareto front, the optimal PCM melting points for the modeled prefabricated box were 23 °C and 25 °C for the Netherlands and Italy, respectively. Compared with the VIP measure, the PCMs had significantly lower heating savings during winter. But the strength of PCM intervention was summer, because it was observed that the CDH value was reduced by up to 77.6% in the Netherlands and 56.8% in Italy.
Similar to what was performed with the VIPs, implementation of a different natural ventilation strategy was also carried out for the PCM solution. Especially under the Mediterranean conditions of the Italian case, a ventilation purge at nighttime is necessary to enable a full discharge of the PCMs on a daily basis in lightweight buildings [37]. Indeed, when combining different ventilation strategies with PCM solutions, better thermal performances both for the winter and summer seasons could be observed (Figure 3).
Regardless of the climate scenario and the adopted ventilation strategy, the VIPs and PCMs had two different measures with opposite performances in the Pareto scatter plot, because the first one turned out to be a better energy solution for winter, while the second one worked better for thermal comfort in summer.
3.1.2. Switchable and Static Solutions
Moving on to adaptive envelope solutions, both the switchable coatings and glazing were benchmarked against their corresponding static solutions to assess their energy-saving and comfort-enhancing potential. The application of static solar absorptance for coatings (e.g., wall paint) or static solar reflectance for glazing were taken into account because they represent a much lower price intervention than dynamic solutions. On the other hand, the static nature of these measures has no control over solar heat gains. Considering coatings as an example, a high solar absorptance (αSTATIC = 1) coating captures more solar energy, which in turn increases the heat flow through conduction and proportionally decreases the amount of heating required in winters but increases the cooling requirement in summers. A low solar absorptance (αSTATIC = 0) coating reflects all incoming solar irradiance and thus has lower thermal conduction in the building, which therefore reduces the CDH value during summers but increases the heating demand during winters. The increase in heating demand caused by low solar absorptance coatings is commonly referred to as heating penalties [25]. In the scatter plot of Figure 4, these static measures are grouped in a light gray curve with the base case reference, whose solar absorptance was assumed to be 0.60.
When showing the TCC case as a leading example for the other investigated switchable solutions, its EP values are included in Figure 4 to assess its effectiveness against static coatings. During winters, the TCC switches to high solar absorptance, reducing the conductive heat losses of the building, which leads to a decrease in Ep,H. In summers, the TCC switches to a low solar absorptance state, reflecting incoming solar irradiance and reducing conduction in the building, which consequently reduces the CDH value. The four different investigated α ranges (αD from αLOW to αHIGH) mentioned in Table 2 were optimized in the scatter plot, and they all represent a good trade-off case for both annual heating savings and overheating reduction compared with the static measures, which were the dominant solutions. In particular, the full α range (αD from 0 to 1) turned out to be the local Pareto frontier because of its better performance for all of the investigated switching temperatures.
A similar trend was found for the ECC, TCW and ECW solutions, and Figure 5 shows an overall comparison for both climate scenarios between the four investigated switchable coatings and glazing. Concerning switchable glazing in particular, Favoino et al. [37] already found out that the most effective modulation ranges and values (including the optical ones) of the optimal adaptive glazing appear to be independent of the climate and orientation. For this reason, common features can be identified at a technological level for an optimal adaptive glazing, showing that the same technology can be used in different climates, orientations and buildings with different thermal masses. The optimizations (as shown in Figure 4) of the remaining switchable solutions are illustrated in Figure 5. The optimal α range cases for every solution (αD from 0 to 1 for the coatings and gD from 0 to 1 for the windows) are shown in this research, giving reasonable benchmarking.
In the scatter plot of Figure 5, the thermochromic controls are represented by continuous lines, while the electrochromic controls, referring to the outdoor air temperature as a sensor trigger, are represented by dotted lines. To better understand the trends for some solutions, the switching temperature of 10 °C was added. In both the (a) and (b) cases, all the switchable solutions relatively tended to have better summer comfort conditions for low switching temperatures and higher heating savings for high switching temperatures. In particular, the switchable coatings, represented in green, had better performance in Italy, while the switchable glazing, represented in blue, had better performance in the Netherlands. Based on these findings, the inverted trend means that the impact on both energy efficiency and thermal comfort from a switchable intervention can be higher for opaque surfaces for warmer climates and higher for transparent surfaces for colder climates. One reason for this can be that modeled glass quickly warms up during hot summer days, and in warmer climates like those in Italy, an intervention can be less effective than for colder climates like those in the Netherlands. Figure 5 shows that the thermochromic windows were slightly more efficient than the electrochromic windows because an outside surface temperature-based control switched state before the outdoor air temperature-based one. For this reason, for the overall design optimization, TCW intervention was further combined with both VIPs and PCMs in order to illustrate complete optimized technological retrofits for both opaque and transparent surfaces. The results of this combination are showed in the next section while just referring to the cooled HVAC scenario.
Regarding control strategies for coatings, the electrochromic one can be observed to be better than the thermochromic one in terms of thermal comfort and heating savings. Previous research conducted by Butt et al. [25] on the energy-saving potential of thermochromic coatings also highlighted that the surface temperature-based switching control is not an optimal control strategy, especially for the heating-dominated Dutch climate.
3.2. Case with Active Cooling
As already introduced in Section 2.4, the same design optimization of the non-cooled scenario was made for the case equipped with a cooling system but assessing the performance with just the total annual energy demand as the indicator. Every intervention was first individually optimized and then compared to each other for the proper analysis. Regarding VIPs, there was no optimization process, because only one case with a VIP-based envelope was studied. The results of the comparison are summarized in Figure 6.
Regarding the heating contribution (Figure 6 in red), the yearly values remained the same as the ones in the case without a cooling system (Section 3.1) because the modeled heating season had not undergone changes. Unlike the previous section, the summer cooling demand (Figure 6 in blue) was considered in place of the CDH value, and it was therefore the only factor that changed the performance of the previous results. For instance, when combining the technological measures with the improved ventilation strategy, not only the heating savings but also the cooling savings were observed. All the optimized characteristics of each investigated intervention remained relatively the same as the ones found in the previous section. For example, the most energy-efficient PCM product was still the one with a melting point temperature of 23 °C in Amsterdam and 25 °C in Florence. All the investigated combinations with and without improved ventilation strategies had similar performance trends to the ones found for the non-cooled case in Section 3.1.
With respect to the annual basis of each climate scenario, all the optimal switchable solutions had annual savings similar to each other. There were rather minimal differences in the results between the coatings and windows or electrochromic and thermochromic controls. In the Netherlands, savings were to the order of 10–14%, while in Italy, they were approximately 20–21%. This difference was due to the fact that, as shown in Figure 6, these measures had more of an impact on cooling loads rather than heating loads, working better in summer rather than in the winter season. Because the relative annual savings were higher in Italy than in the Netherlands, switchable solutions were less effective in the heating-dominated climates, as previously found, for example, in [25] for TCCs and in [37] for ECWs. However, for the overall comparison’s sake, all the investigated switchable measures (TCCs, ECCs, TCWs and ECWs) were dominant solutions in both climate and HVAC scenarios.
A further combination with the optimal TCWs was modeled for both the VIP and PCM solutions to benchmark a complete intervention in both opaque and transparent surfaces. The maximal effectiveness of this combination was obtained when the ventilation rate and strategies were also improved, and it reduced the total annual energy demand in the Netherlands by 68.7% and in Italy by 71.4% for VIPs.
4. Discussion
This research analyzed the potential of promising measures to solve the lightweight envelope challenges of prefab post-disaster temporary buildings. The first aim was to overcome the conflict between the need to conserve the internal spaces of such buildings while saving embodied carbon and the requirements of thermal resilience. To keep the envelope thin and lightweight, different technological solutions were selected for opaque (VIPs, PCMs, TCCs and ECCs) and transparent surfaces (TCWs and ECWs) to mitigate thermal issues like summer overheating. By using BPS tools to model and identify the optimal properties of each measure, overall performance comparisons were made. The whole study was conducted for two cities in different climate regions (Amsterdam and Florence) and for two different HVAC concepts (with and without active cooling).
Regarding the energy performance comparison, a clear overview of the investigated envelope solutions can be observed in Table 3 and Table 4 for the Amsterdam and Florence scenarios, respectively. The two main conflicting candidate solutions were VIPs and PCMs, since all the investigated switchable measures (TCCs, ECCs, TCWs and ECWs) were the dominant solutions for the total annual primary energy comparison. Furthermore, these switchable solutions were the optimal ones and were already modeled without any limitations in the modulation range to find the maximum potential for product developments, as mentioned in Section 2.3.3 and Section 2.3.4. Even though they are optimal switchable solutions, they can be neglected by the decision-making process because they have less of an annual performance impact than the VIP and PCM solutions.
For the heating season, VIPs turned out to be the best winter solution among the investigated envelope solutions for their high insulation values. By keeping the same layer thickness, replacing EPS with VIPs led to a reduction of 1701.5 kWh/year (57% of the base case) in Amsterdam and 1210.4 kWh/year (61.6% of the base case) in Florence. Despite its high annual energy savings, the VIP solution have many drawbacks regarding the fragility of the material, as discussed in Section 2.5. On the contrary, all the prefab temporary housing fields of application generally require flexible and fast transport. This necessity conflicts with the energy performance, and its magnitude can depend on the quality of the transportation. For example, the VIP-based envelope of prefab post-disaster temporary buildings needs careful handling during transport and mounting. Unless well protected, VIPs are also vulnerable after installation.
When analyzing the cooling season, the research was divided into two different HVAC concepts. In the case where the system was in free-running mode during summer, PCMs were a good overheating protection measure, as they enhanced the indoor thermal comfort by reducing the indoor operative temperature. The optimized melting point solution for the Amsterdam case led to a 77.6% CDH reduction compared with the base case. Meanwhile, in Florence, the CDH could be reduced by up to 56.8% because of the warmer climate (Figure 3). Even the ECC solution had a similar CDH reduction in the Italian case (Figure 5b), but if also considering Ep,H,, the optimized PCM case dominated the ECC in the Pareto front. Aside from their energy performance in summer, PCMs turned out to be a good trade-off because they have good transport flexibility too, as mentioned in Section 2.5.
5. Limitations
Since Florence and Amsterdam climates were investigated, as stated in paragraph Section 2.1, the heating and cooling periods would be different between one climate zone and the other. However, the authors decided to assume the same subdivision of heating and cooling periods for both climate zones to compare them better equally. Furthermore, both of the chosen cooling and heating periods were wider than the actual ones in Italian and Dutch standards to also include the potential of mid-season cooling and heating loads.
The principal limitation of the present work is that it is mainly simulation-based, not including the experimental characterization of each type of building envelope technology. However, the different simulation workflows for each investigated technology were validated in the previous literature. For instance, the fully implicit first-order CondFD method has been used for PCM modeling because its default implementation in the software was validated in the literature with acceptable monthly and annual results [38]. An interesting next step for this work is the implementation of experimental campaigns in outdoor test cell facilities with façade prototypes to compare the simulation results.
6. Conclusions
Taking prefab post-disaster buildings as a case study, this research compared the thermal performance impacts of the different investigated envelope solutions. Since the lightweight envelope of this building type presents thermal issues, especially during summer, it is essential to understand the relative performance of different ways to prevent these issues.
Particularly concerning the analysis of switchable solutions, it was found that the impact on both energy efficiency and thermal comfort of a switchable intervention can be higher in the opaque surfaces (TCCs and ECCs) for warmer climates and higher in transparent surfaces (TCWs and ECWs) for colder climates. All of these switchable solutions were optimized in BPS tools while not considering limitations in the design values. This decision is supported by the scientific literature, and thus the relative energy performance outcomes can help material developments.
However, when comparing the energy performance with the other technological solutions, all the investigated switchable measures (TCCs, ECCs, TCWs and ECWs) were dominant solutions on the Pareto front in both climate and HVAC scenarios. As a consequence, VIPs and PCMs are the non-dominant solutions of the research. Regardless of the climate scenario and the adopted ventilation strategy, VIPs and PCMs had opposite performance values in the Pareto scatter plot because the first turned out to be a better energy solution for winter, while the second worked better for thermal comfort in summer. This finding may encourage the research community to conduct further studies about potential combinations of the two above-mentioned building envelope solutions.
The outcomes of this research are significant for the development of prefab post-disaster temporary buildings. An interesting next step to enhance the present work would be the implementation of experimental campaigns in outdoor test cell facilities with façade prototypes to compare the simulation results. In this way, a sensitivity analysis would lead to better-informed development of such building technologies. Adopting target advanced envelope systems would lead to reducing the annual primary energy consumption by mitigating thermal issues which are distinctive for such a building type. In the design stage, it is therefore essential to consider different technologies according to climate and HVAC scenarios but also according to the period of the year when the disaster strikes. For example, if there is a need for temporary housing during winter, VIPs would be a good insulation solution, provided that there is careful handling during transportation and mounting. On the other hand, PCMs are the best overheating protection in the case of temporary housing being needed in warm seasons. This research gives awareness of the different impacts on energy performance to the decision maker. It is essential to manufacture specific advanced building envelopes completely off-site which are ready to be mounted in different target scenarios for lower energy consumption and environmental impact.
Author Contributions
Conceptualization, R.C.G.M.L. and A.A.B.; methodology, R.C.G.M.L., F.L. and G.S.; software, L.R. and A.A.B.; validation, R.C.G.M.L., G.S. and F.L.; formal analysis, R.C.G.M.L., G.S. and F.L.; investigation, L.R.; resources, R.C.G.M.L. and A.A.B.; data curation, L.R. and R.C.G.M.L.; writing—original draft preparation, L.R.; writing—review and editing, R.C.G.M.L., G.S. and F.L.; visualization, L.R.; supervision, R.C.G.M.L., G.S. and F.L.; funding acquisition, G.S and F.L. All authors have read and agreed to the published version of the manuscript.
Funding
This research was partially funded by the University of Pisa, which covered the article processing charges through the financial support “Fondi Rating di Ateneo 2022”, and individual financial support attributed to Professors Leccese and Salvadori, following the outcome of the evaluation of their indexed publications by a scientific committee.
Data Availability Statement
The original contributions presented in the study are included in the article, further inquiries can be directed to the corresponding author.
Acknowledgments
This research was developed in the context of the Erasmus+ traineeship mobility program. Lorenzo Rapone conducted his activity partially at the University of Pisa (sending institution) and partially at the Eindhoven University of Technology (receiving institution).
Conflicts of Interest
The authors declare no conflicts of interest.
Appendix A
To investigate the correct functioning of the PCM modeling in the present paper, a typical summer week scenario with average warm temperatures in Amsterdam (first week of July) was selected. Figure A1 illustrates an analysis of the inside south façade temperature, cooling demand and heat flux per hour in cases with and without PCMs applied.
Considering that the upper blue line refers to the inside surface temperature in the PCM case, for the first two days (2 and 3 July), the material reached its melting point (23 °C in the analyzed case) at noon. At this time of day, the inside temperature held a bit, plateauing and phase changing correctly. Then, at night, the PCM layer released the heat within by solidifying. However, the next two central days (4 and 5 July) were warmer than the previous ones, and the material melted sooner in the morning and could not discharge easily. Only in the following days did it finally manage to release the high amount of heat stored before. In the same upper plots of Figure A1, the secondary vertical axis at the right depicts the cooling demand reduction from adopting the PCM solution compared with the red area. Higher cooling savings per hour can be observed in the side days when the PCM layer managed to work correctly, as mentioned before. Consequently, with respect to the highly fluctuating red line (the inside surface temperature in the base case), the PCM blue line is flatter, especially for the side days. Another important change is the shifting of the temperature peak to colder hours (toward the right in the graph). In Figure A1, the highest peak shifting happens on 3 July for the south façade. The temperature peak in base case was at 12:00 p.m., while in the PCM case, it was at 7:00 p.m., providing 7 h of shifting.
The lower plots of Figure A1 show the hourly changes in heat flux. Positive values represent heat gains, while negative values represent heat losses with respect to the thermal zone. The red line represents the heat transfer through the gypsum inside surface of the base case, while the dotted and continuous blue lines represent the heat transfer through the outer and inner sides of the PCM layer, respectively. When comparing the peaks, the base case’s south façade could reach an average surface heat gain of 6 W/m2 per hour, while with the PCMs, it decreased to around 3 W/m2 per hour (continuous blue line). This is because the outer node (dot blue line) was first subject to a heat wave, reaching even higher peaks (around 12 W/m2 per hour), and then released the stored heat more slowly.
The different hatches in Figure A1 illustrate the different phases: the solid filled hatched space represents the ideal solid phase when heat was released inside, while the empty hatched space represents the ideal liquid phase when heat was absorbed from outside.
Figure A1.
PCM charging and discharging process compared with base case in south façade. The upper plot illustrates the analysis of inside surface temperatures (lines) and cooling demand (areas) per hour in case with PCMs applied (blue) and without PCMs applied (red). Both analyzed properties were reduced in the case with PCMs. Since the PCM results referred to 23 °C as the melting point, the horizontal dotted line represents the threshold at which there was the ideal change in phase. Therefore, different hatched areas illustrate the different phases if the change was instantaneous; solid filled hatched area represents the ideal solid phase when heat was released inside, while the empty hatched area represents the ideal liquid phase when heat was absorbed from outside. The lower plot illustrates the corresponding surface heat fluxes per hour to observe the offset effect of PCMs, which causes the delay in heat gains inside the zone.

References
- Soares, N.; Santos, P.; Gervásio, H.; Costa, J.J.; Simões da Silva, L. Energy efficiency and thermal performance of lightweight steel-framed (LSF) construction: A review. Renew. Sustain. Energy Rev. 2017, 78, 194–209. [Google Scholar] [CrossRef]
- Tsikaloudaki, K.; Theodosiou, T.; Giarma, C.; Kontoleon, K.; Aravantinos, D.; Tsoka, S.; Tsirigoti, D.; Chastas, P.; Karaoulis, A. Advancing sustainability in prefabricated buildings. IOP Conf. Ser. Earth Environ. Sci. 2020, 588, 052067. [Google Scholar] [CrossRef]
- Roque, E.; Oliveira, R.; Almeida, R.; Vicente, R.; Figueiredo, A. Lightweight and prefabricated construction as a path to energy efficient buildings: Thermal design and execution challenges. Int. J. Environ. Sustain. Dev. 2020, 19, 1–32. [Google Scholar] [CrossRef]
- Maffei, L.; Ciervo, A.; Perrotta, A.; Masullo, M.; Rosato, A. Innovative Energy-Efficient Prefabricated Movable Buildings for Smart/Co-Working: Performance Assessment upon Varying Building Configurations. Sustainability 2023, 15, 9581. [Google Scholar] [CrossRef]
- Teng, Y.; Li, K.; Pan, W.; Ng, T. Reducing building life cycle carbon emissions through prefabbrication: Evidence form and gaps in empirical studies. Build. Environ. 2018, 132, 125–136. [Google Scholar] [CrossRef]
- Perrucci, D.; Baroud, H. A Review of Temporary Housing Management Modeling: Trends in Design Strategies, Optimization Models, and Decision-Making Methods. Sustainability 2020, 12, 10388. [Google Scholar] [CrossRef]
- Fantozzi, F.; Galbiati, P.; Leccese, F.; Salvadori, G.; Rocca, M. Thermal analysis of the building envelope of lightweight temporary housing. J. Phys. Conf. Ser. 2014, 547, 012011. [Google Scholar] [CrossRef]
- De Masi, R.F.; de Rossi, F.; Gigante, A.; Ruggiero, S.; Vanoli, G.P. Design of new energy-efficient temporary facilities for emergency housing: An Italian case. J. Build. Eng. 2023, 80, 107945. [Google Scholar] [CrossRef]
- Yang, S.; Wi, S.; Cho, H.M.; Park, J.H.; Yun, B.Y.; Kim, S. Developing energy-efficient temporary houses for sustainable urban regeneration: Manufacturing homes with loess, pearlite, and vermiculite. Sustain. Cities Soc. 2020, 61, 102287. [Google Scholar] [CrossRef]
- Brovko, A. Prefab Homes Built in Western Ukraine for People Fleeing War. Radio Free Europe/Radio Liberty. 11 April 2022.
- Sukhwani, V.; Napitupulu, H.; Jingnan, D.; Yamaji, M.; Shaw, R. Enhancing cultural adequacy in post-disaster temporary housing. Prog. Disaster Sci. 2021, 11, 100186. [Google Scholar] [CrossRef]
- D’Orazio, M.; Maracchini, G. An experimental investigation on the indoor hygrothermal environment of a reinforced-EPS based temporary housing solution. Energy Build. 2019, 204, 109500. [Google Scholar] [CrossRef]
- Hoes, P.; Hensen, J. The potential of lightweight low-energy houses with hybrid adaptable thermal storage: Comparing the performance of promising concepts. Energy Build. 2016, 110, 79–93. [Google Scholar] [CrossRef]
- EN ISO 13786; Thermal Performance of Building Components—Dynamic Thermal Characteristics—Calculation Methods. CEN European Committee for Standardization: Brusselles, Belgium, 2017.
- Leccese, F.; Salvadori, G.; Asdrubali, F.; Gori, P. Passive thermal behaviour of buildings: Performance of external multi-layered walls and influence of internal walls. Appl. Energy 2018, 225, 1078–1089. [Google Scholar] [CrossRef]
- Li, T.; Liu, Q.; Mao, Q.; Chen, M.; Ma, C.; Wang, D.; Liu, Y. Optimization design research of insulation thickness of exterior wall based on the orientation difference of solar radiation intensity. Appl. Therm. Eng. 2023, 223, 119977. [Google Scholar] [CrossRef]
- Tirella, V.; Fabbricatore, C.; Carpino, C.; Arcuri, N.; Barreca, F. Configuration Optimization for Sustainable Temporary Houses Employing BIM Procedure. Buildings 2023, 13, 2728. [Google Scholar] [CrossRef]
- Cao, X.; Dai, X.; Liu, J. Building energy-consumption status worldwide and the state-of-the-art technologies for zero-energy buildings during the past decade. Energy Build. 2016, 128, 198–213. [Google Scholar] [CrossRef]
- Llorach-Massana, P.; Cirrincione, L.; Sierra-Perez, J.; Scaccianoce, G.; La Gennusa, M.; Peña, J.; Rieradevall, J. Environmental assessment of a new building envelope material derived from urban agriculture wastes: The case of the tomato plants stems. Int. J. Life Cycle Assess. 2023, 28, 813–827. [Google Scholar] [CrossRef]
- DOE. Input/Output Reference: The Encyclopedic Reference to Energy Plus Input; US Department of Energy: Washington, DC, USA, 2021.
- Loonen, R.C.G.M.; Favoino, F.; Hensen, J.L.M.; Overend, M. Review of current status, requirements and opportunities for building performance simulation of adaptive facades. J. Build. Perform. Simul. 2016, 10, 205–223. [Google Scholar] [CrossRef]
- IEA. Annex 39 (Project Summary Report): Vacuum Insulation Panel Properties and Building Applications; IEA: Birmingham, UK, 2010; Available online: https://www.iea-ebc.org/Data/publications/EBC_Annex_39_PSR.pdf (accessed on 9 June 2022).
- Tsoka, S.; Theodosiou, T.; Papadopoulou, K.; Tsikaloudaki, K. Assessing the Energy Performance of Prefabricated Buildings Considering Different Wall Configurations and the Use of PCMs in Greece. Energies 2020, 13, 5026. [Google Scholar] [CrossRef]
- PHASE CHANGE Solutions. BioPCM®. 2020. Available online: https://phasechange.com/biopcm/ (accessed on 9 June 2022).
- Butt, A.A.; de Vries, S.B.; Loonen, R.C.; Hensen, J.L.; Stuiver, A.; van den Ham, J.E.; Erich, B.S. Investigating the energy saving potential of thermochromic coatings on building envelopes. Appl. Energy 2021, 291, 116788. [Google Scholar] [CrossRef]
- Yeung, C.P.; Habets, R.; Leufkens, L.; Colberts, F.; Stout, K.; Verheijen, M.; Vroon, Z.; Mann, D.; Buskens, P. Phase separation of VO2 and SiO2 on SiO2-Coated float glass yields robust thermochromic coating with unrivalled optical properties. Sol. Energy Mater. Sol. Cells 2021, 230, 111238. [Google Scholar] [CrossRef]
- Tällberg, R.; Jelle, B.P.; Loonen, R.; Gao, T.; Hamdy, M. Comparison of the energy saving potential of adaptive and controllable smart windows: A state-of-the-art review and simulation studies of thermochromic, photochromic and electrochromic technologies. Sol. Energy Mater. Sol. Cells 2019, 200, 109828. [Google Scholar] [CrossRef]
- Carlucci, F. A Review of Smart and Responsive Building Technologies and their Classifications. Futur. Cities Environ. 2021, 7, 10. [Google Scholar] [CrossRef]
- Granqvist, C.; Arvizu, M.; Pehlivan, I.B.; Qu, H.-Y.; Wen, R.-T.; Niklasson, G. Electrochromic materials and devices for energy efficiency and human comfort in buildings: A critical review. Electrochim. Acta 2018, 259, 1170–1182. [Google Scholar] [CrossRef]
- Cirrincione, L.; Rizzo, G.; La Gennusa, M.; Scaccianoce, G.; Peri, G. Considerations about an indicator aimed at describing the energy efficiency of buildings with innovative envelope components at different climatic conditions. In Proceedings of the 2020 IEEE International Conference on Environment and Electrical Engineering and 2020 IEEE Industrial and Commercial Power Systems Europe (EEEIC/I&CPS Europe), Madrid, Spain, 9–12 June 2020; pp. 1541–1546. [Google Scholar]
- EN 15251; Indoor Environmental Input Parameters for Design and Assessment of Energy Performance of Buildings. Technical Committee CEN/TC 156: Brusselles, Belgium, 2006.
- Peeters, L.; de Dear, R.; Hensen, J.; D’haeseleer, W. Thermal comfort in residential buildings: Comfort values and scales for building energy simulation. Appl. Energy 2009, 86, 772–780. [Google Scholar] [CrossRef]
- Selvnes, H.; Allouche, Y.; Manescu, R.I.; Hafner, A. Review on cold thermal energy storage applied to refrigeration systems using phase change materials. Therm. Sci. Eng. Prog. 2020, 22, 100807. [Google Scholar] [CrossRef]
- Rakotonjanahary, M.; Scholzen, F.; Waldmann, D. Summertime Overheating Risk Assessment of a Flexible Plug-In Modular Unit in Luxembourg. Sustainability 2020, 12, 8474. [Google Scholar] [CrossRef]
- The Engineering ToolBox. Air Change Rates in typical Rooms and Buildings. 2005. Available online: https://www.engineeringtoolbox.com/air-change-rate-room-d_867.html (accessed on 9 June 2022).
- Costanzo, V.; Evola, G.; Marletta, L.; Nocera, F. The effectiveness of phase change materials in relation to summer thermal comfort in air-conditioned office buildings. Build. Simul. 2018, 11, 1145–1161. [Google Scholar] [CrossRef]
- Favoino, F.; Overend, M.; Jin, Q. The optimal thermo-optical properties and energy saving potential of adaptive glazing technologies. Appl. Energy 2015, 156, 1–15. [Google Scholar] [CrossRef]
- Tabares-Velasco, P.C.; Christensen, C.; Bianchi, M.; Booten, C. Verification and validation of EnergyPlus conduction finite difference and phase change material models for opaque wall assemblies. Build. Environ. 2012, 54, 186–196. [Google Scholar] [CrossRef]
Figure 1.
Overall workflow of the research. The different operative phases are highlighted with different colors. The small gray boxes represent the file extensions (the following software versions were used: SketchUp 17.1, Euclide 0.9.4.3, EnergyPlus 22.1, Design Builder V7, Excell 18.0).
Figure 1.
Overall workflow of the research. The different operative phases are highlighted with different colors. The small gray boxes represent the file extensions (the following software versions were used: SketchUp 17.1, Euclide 0.9.4.3, EnergyPlus 22.1, Design Builder V7, Excell 18.0).
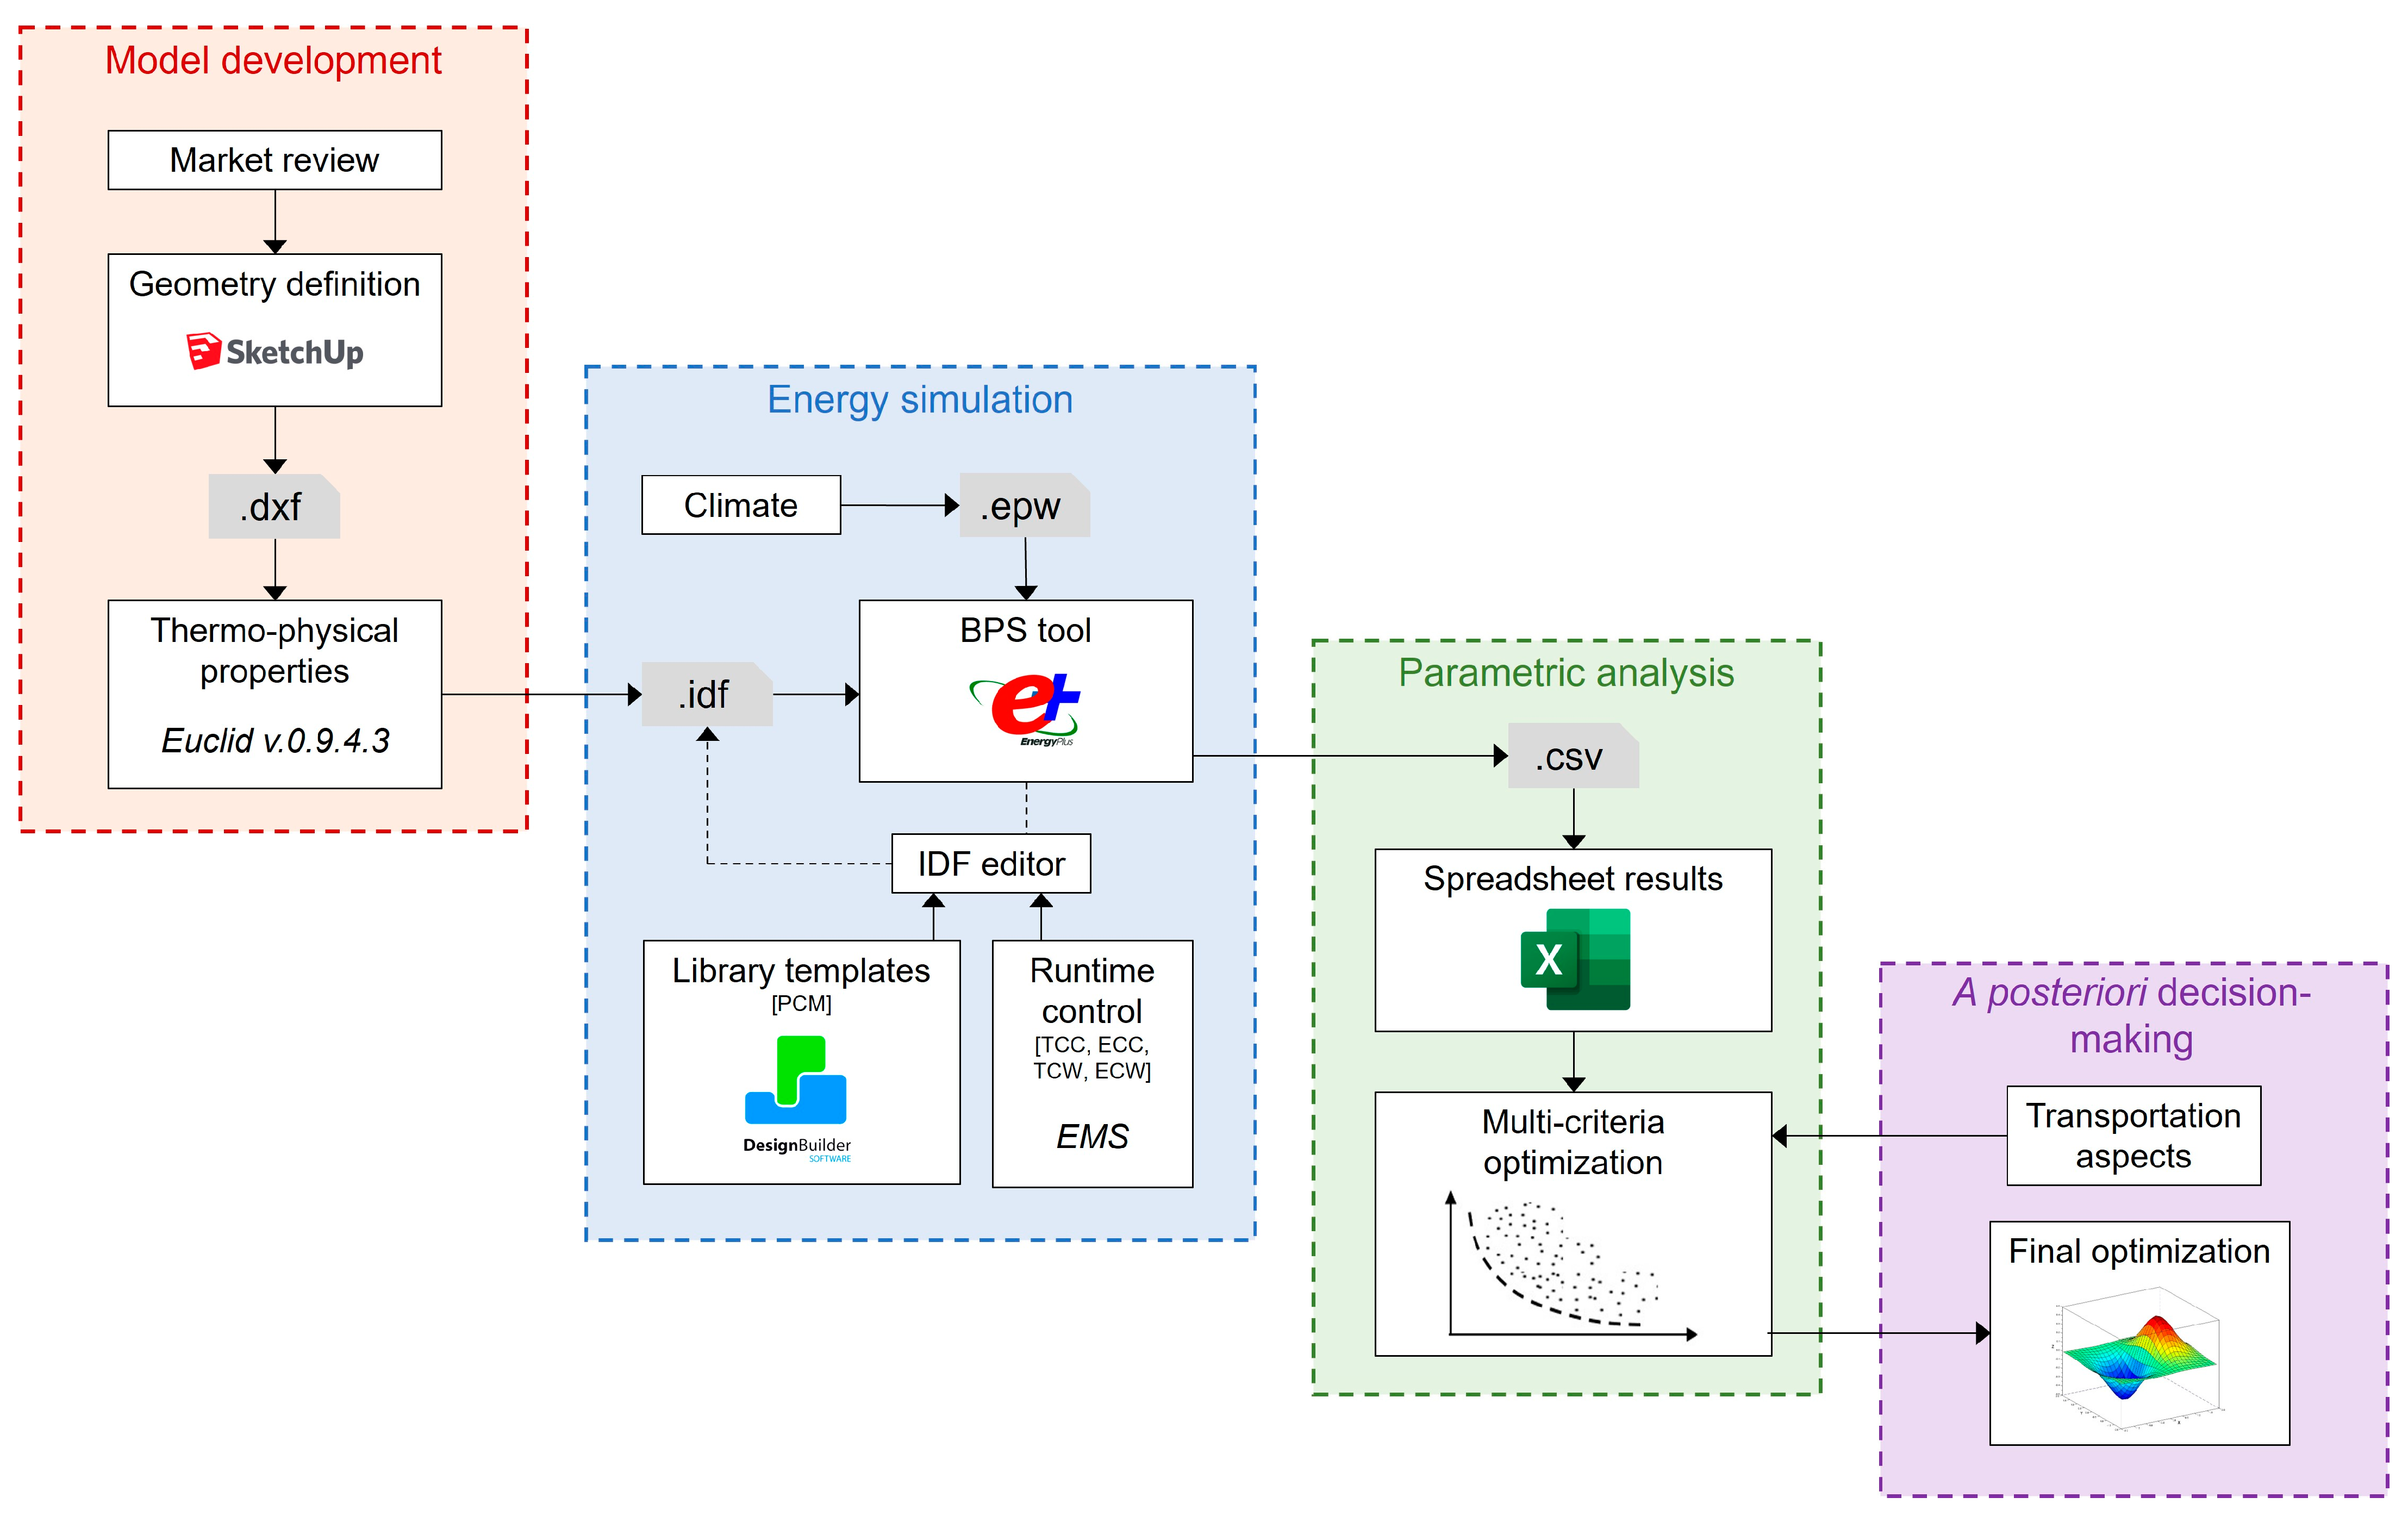
Figure 2.
Layer sequence of VIP (a), PCM (b), TCC (c), TCW (d), ECC(e) and ECW (f) wallboards. Schematic view; not to scale.
Figure 2.
Layer sequence of VIP (a), PCM (b), TCC (c), TCW (d), ECC(e) and ECW (f) wallboards. Schematic view; not to scale.
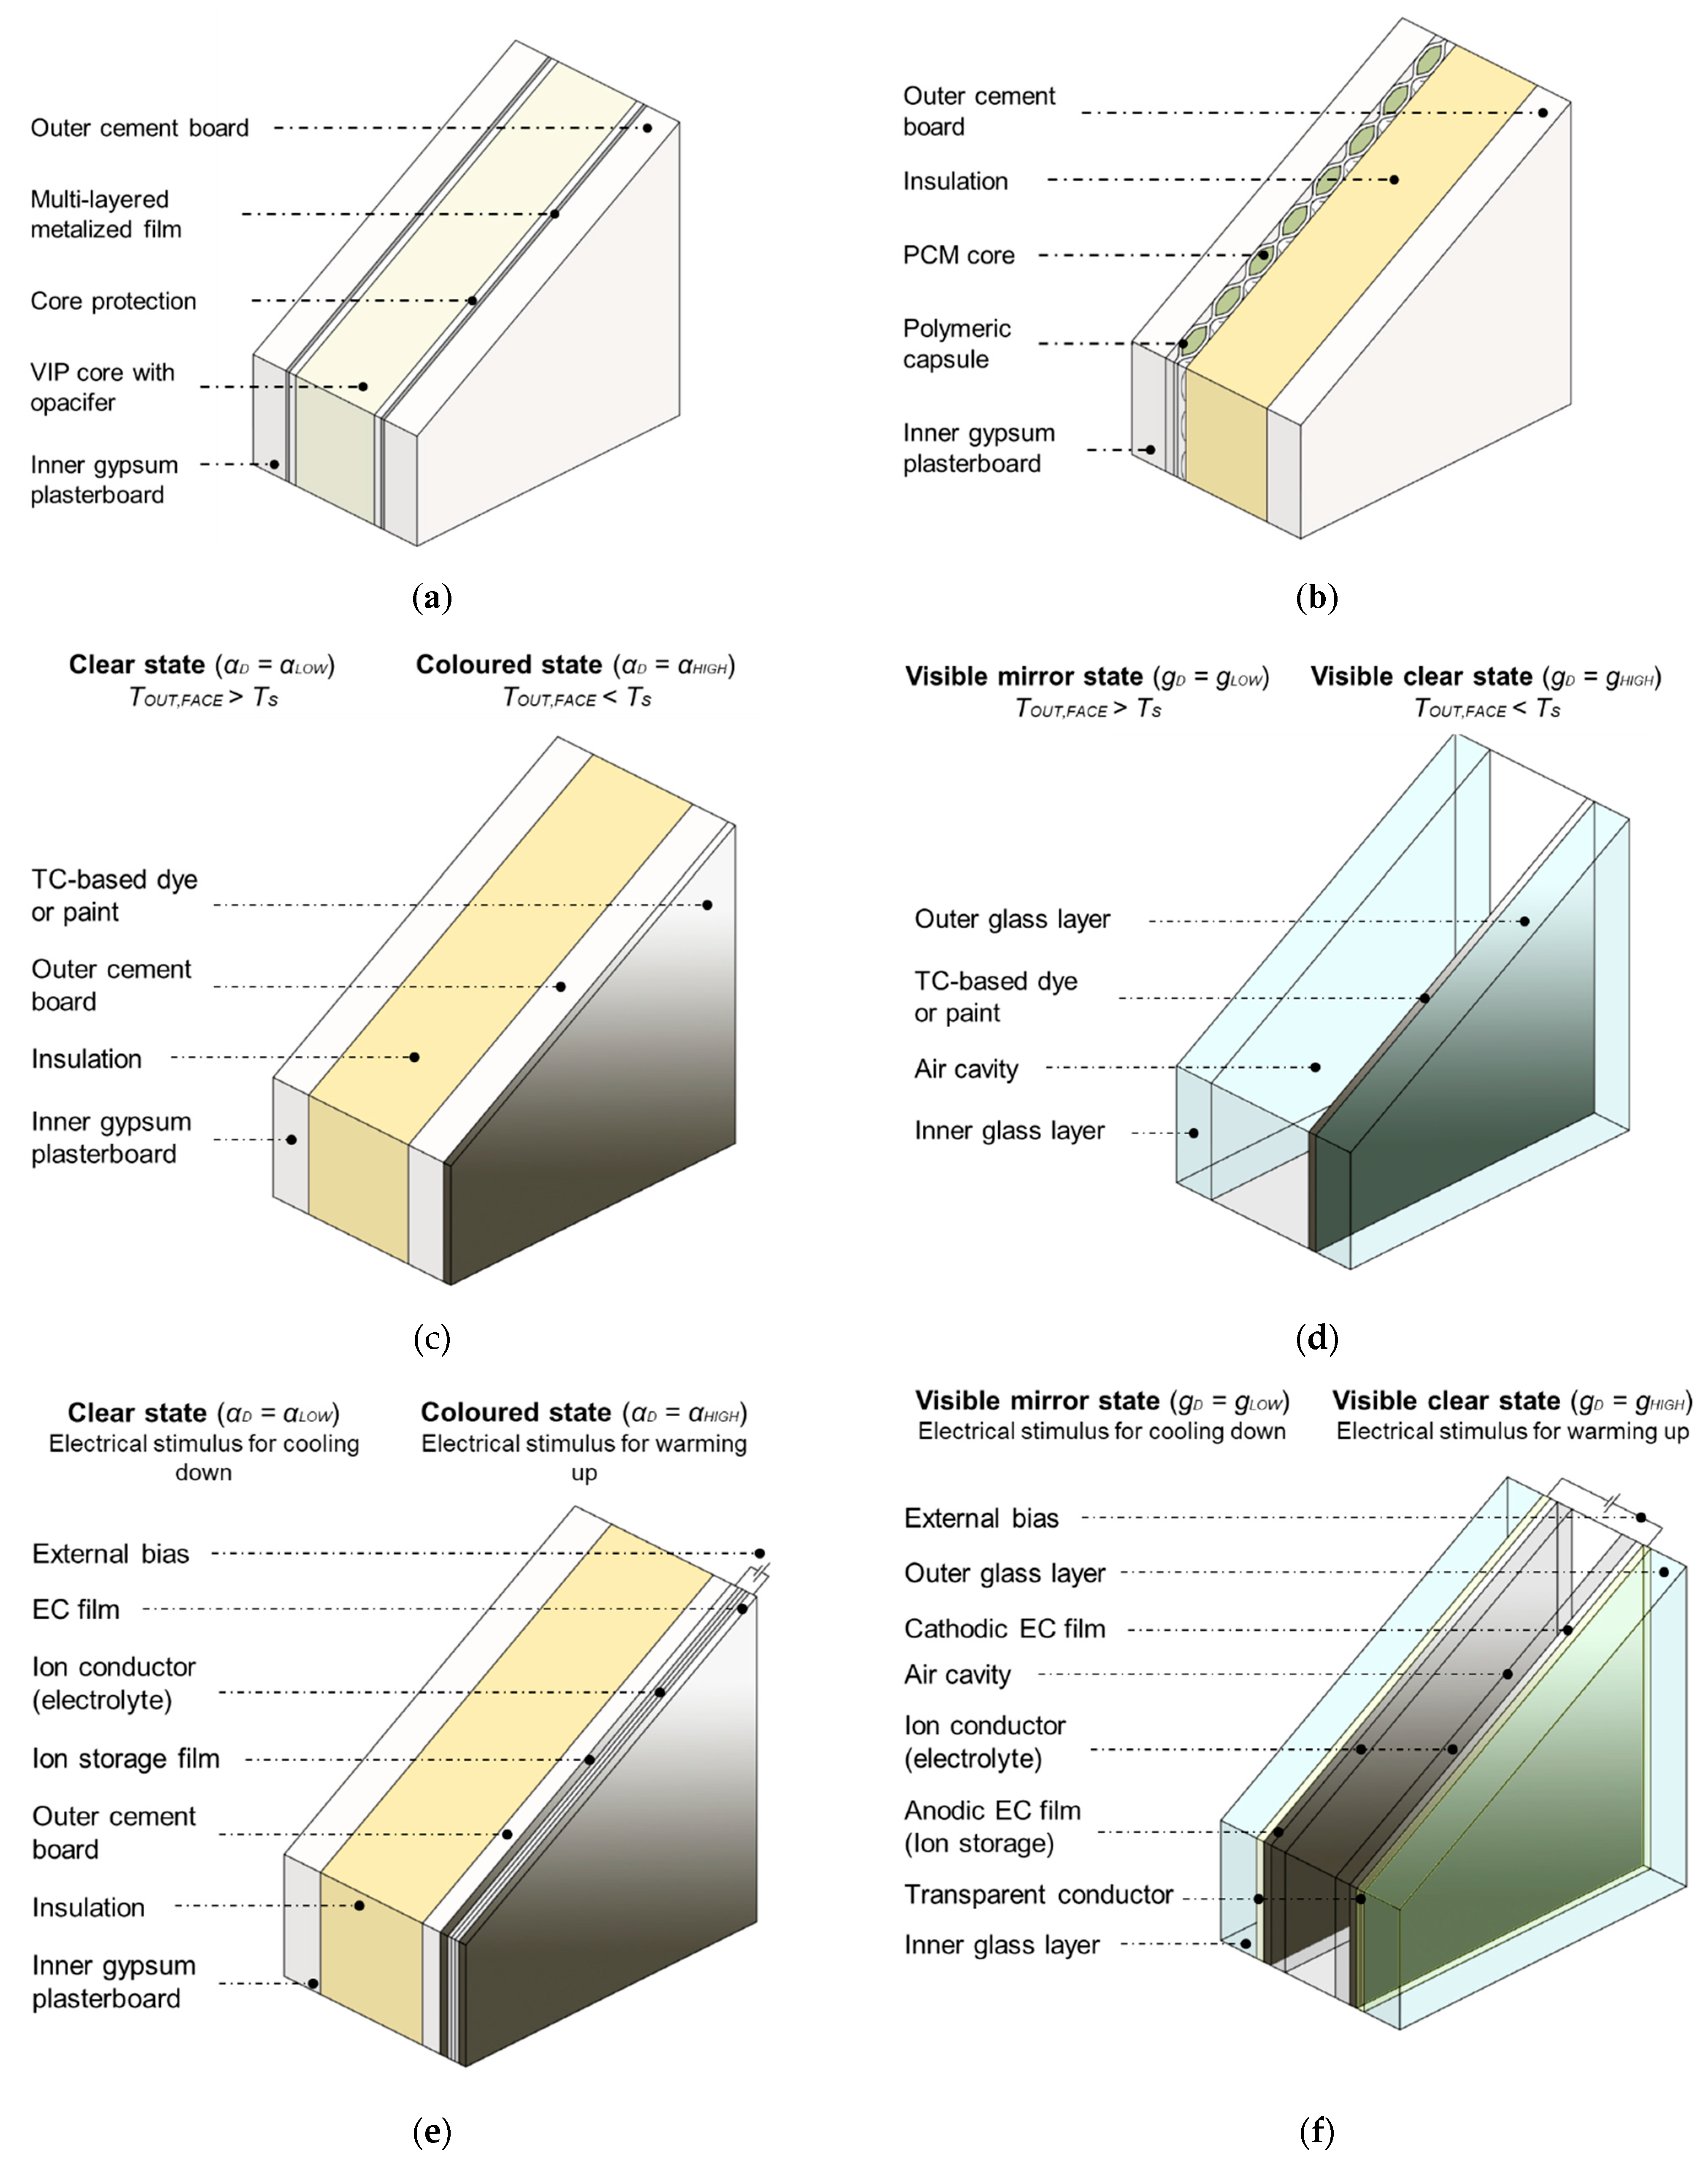
Figure 3.
Energy performance results for VIP and PCM envelope interventions in non-cooled HVAC scenario, with base case benchmarked. The gray rectangle represents the range of optimal solutions, where both CDH and EP,H are minimized. The blue shaded scatters represent different ventilation flow rates. The black dots represent the starting point of each case without any ventilation improvements. Units on the axis were translated and scaled for better page formatting.

Figure 4.
Design optimization of solar absorptance ranges and switching temperatures for TCCs in Dutch scenario and comparison with different benchmarked static coating solutions. Such static solutions are labeled with the corresponding colors in grayscale. The gray rectangle represents the range of optimal solutions, where both CDH and EP,H are minimized. The orange-shaded scatters represent different switching temperatures. Units on the axis were translated and scaled for better page formatting.
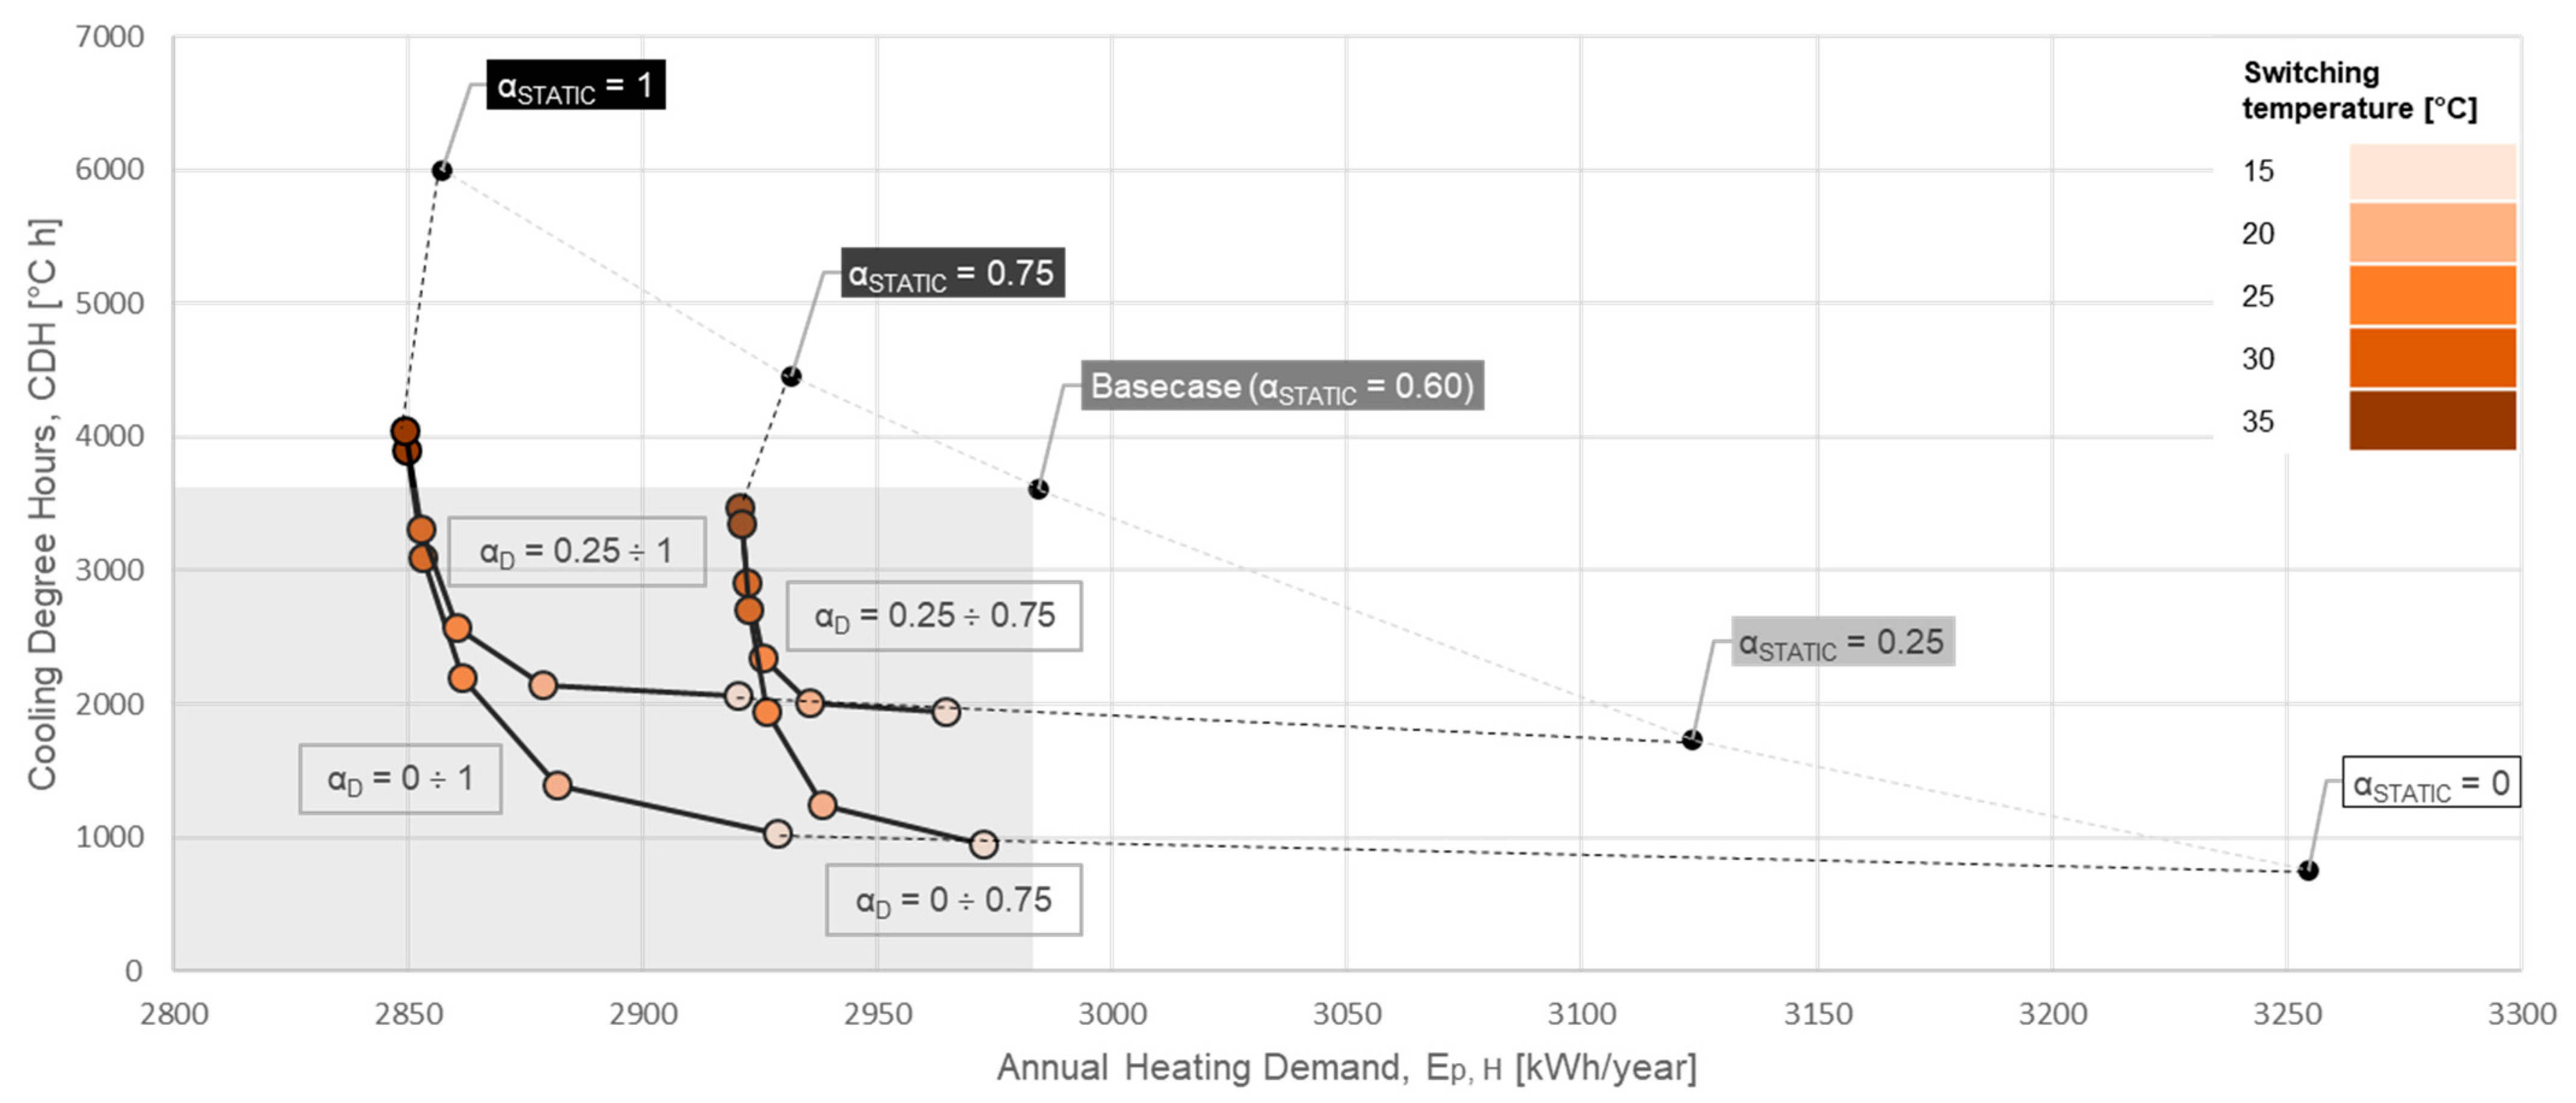
Figure 5.
Energy performance comparison of optimal cases for TCCs, ECCs, TCWs and ECWs in Dutch (a) and Italian (b) scenarios, investigating different switching temperatures. TCCopt and ECCopt (in green) are the optimal cases (αD in the range from 0 to 1) for thermochromic and electrochromic coatings, respectively. TCWopt and ECWopt (in blue) are the optimal cases (gD in the range from 0 to 1) for thermochromic and electrochromic coatings, respectively. Dashed lines represent the hypothetical static references for coatings (in green) and glasses (in blue). Units on the axis were translated and scaled for better page formatting.
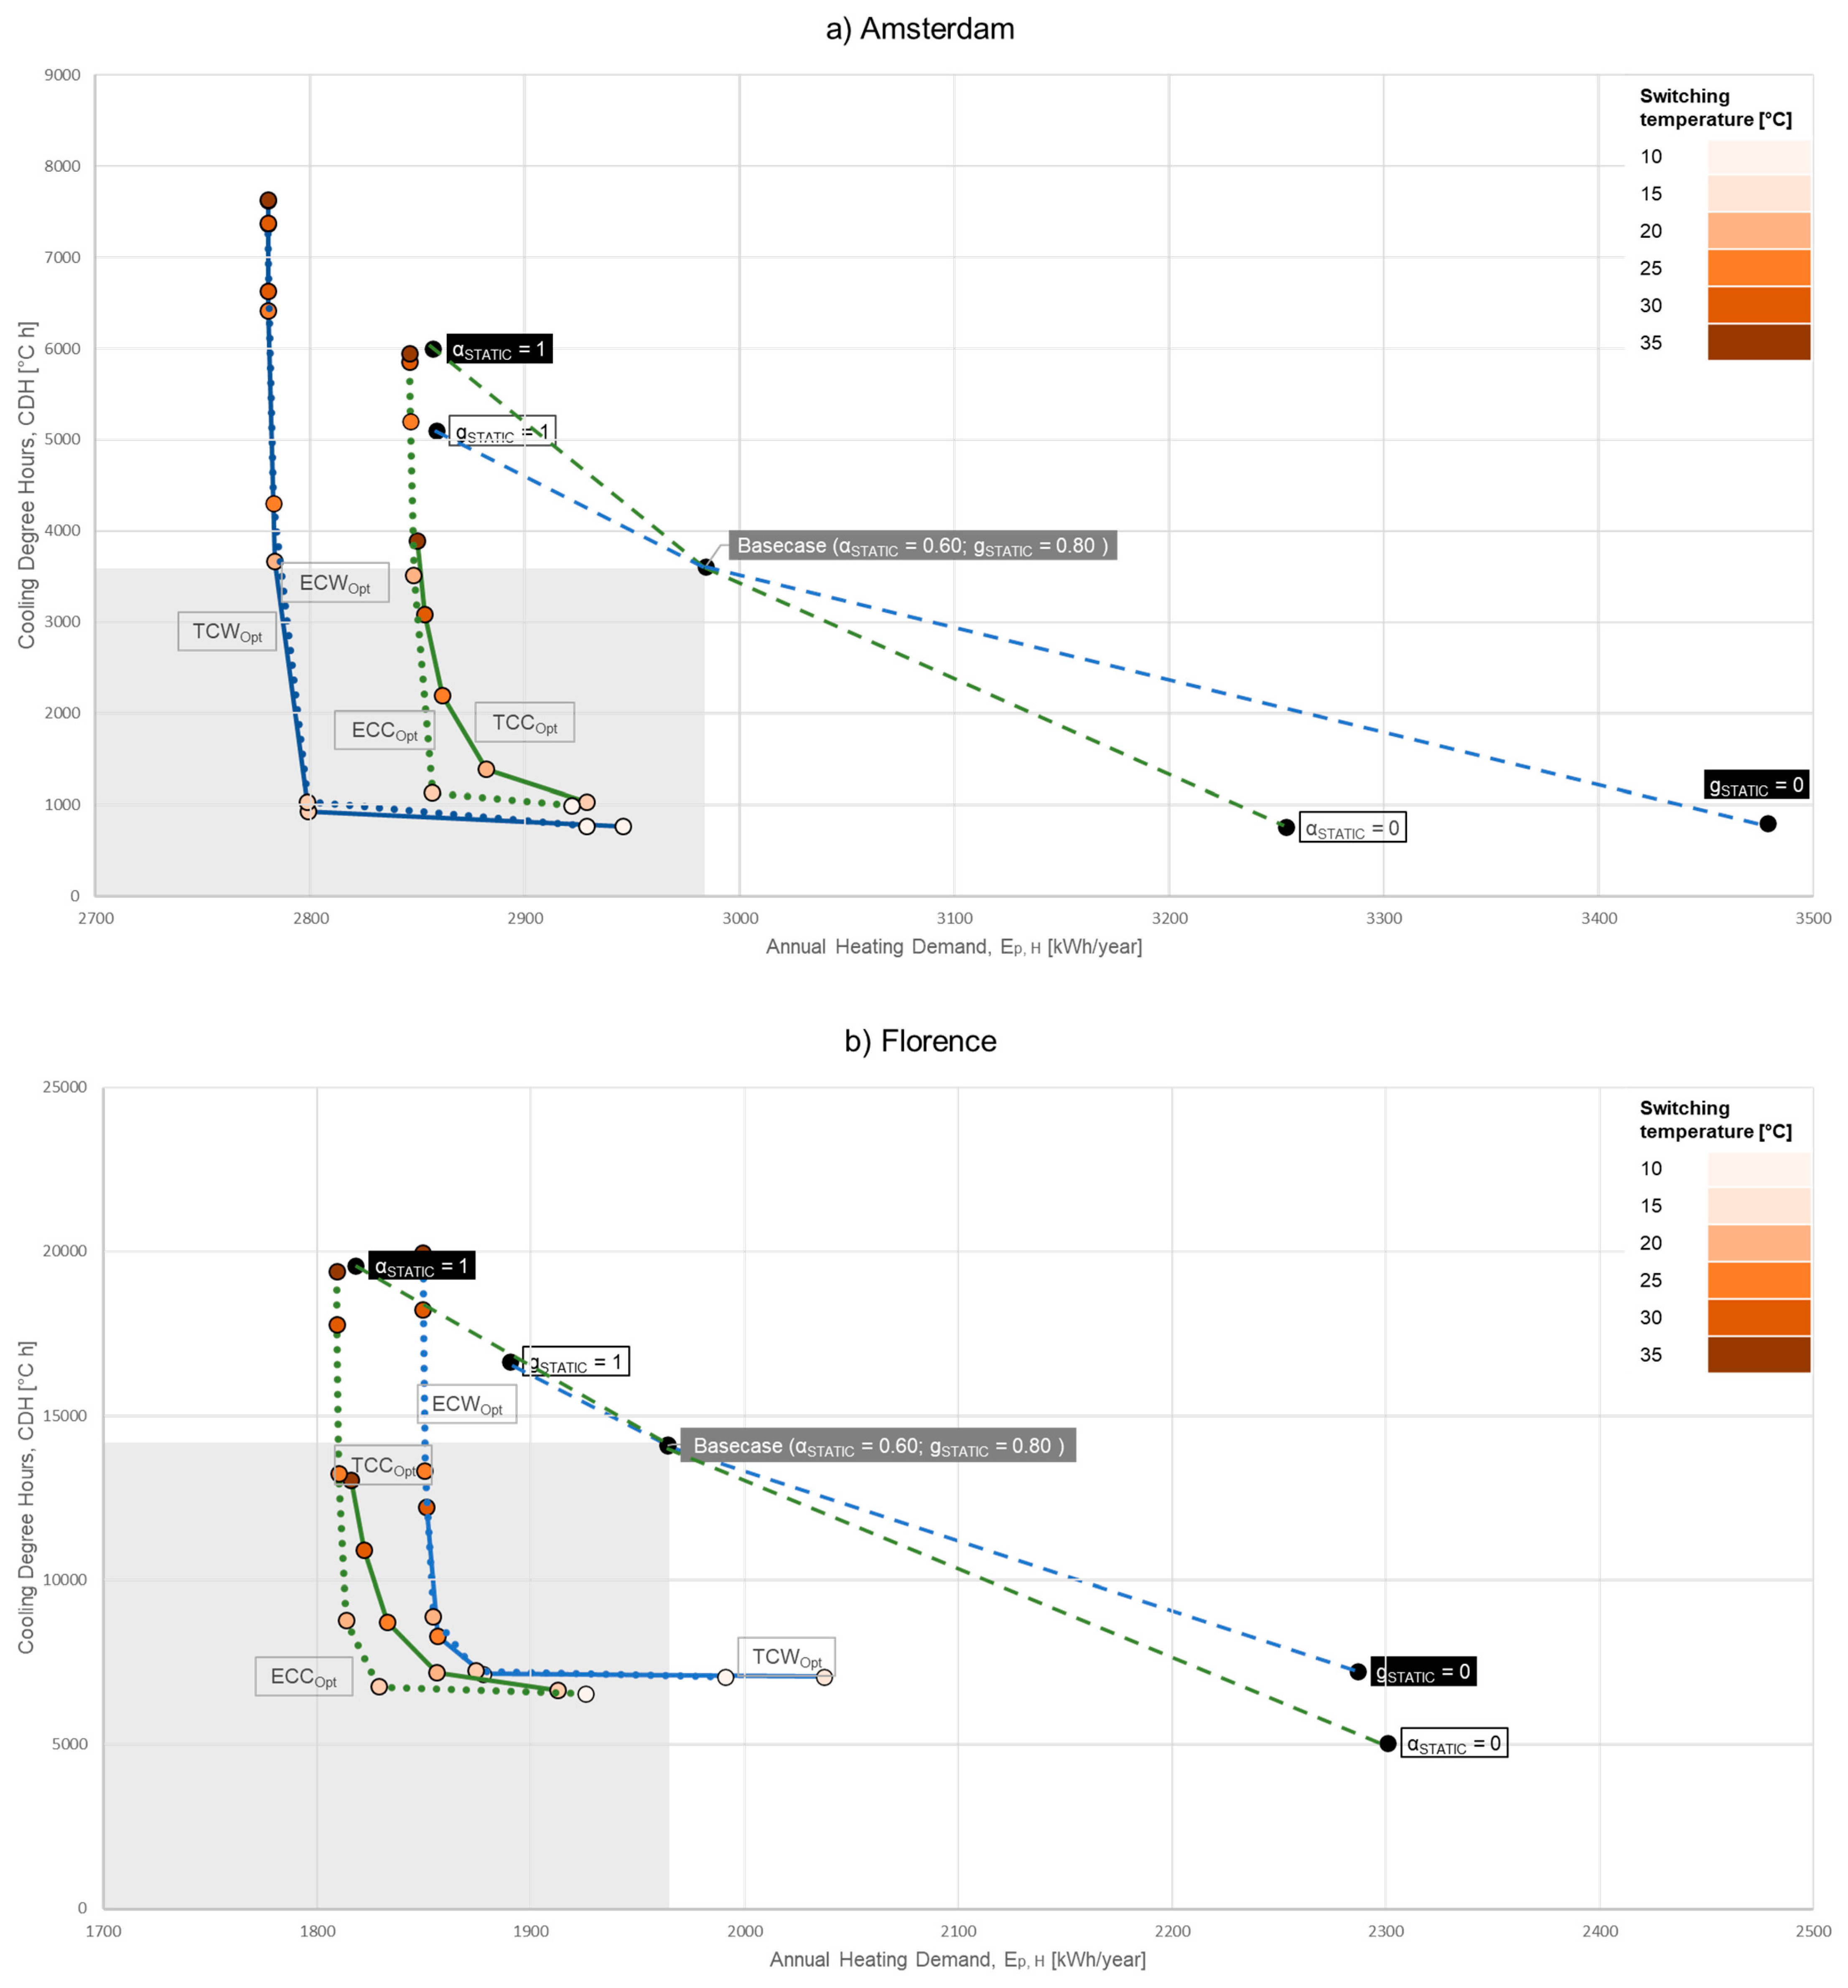
Figure 6.
Overall energy performance comparison of the investigated technologies for case with active cooling. Each intervention is shown with its percentage annual saving amount, referring to the base case. Results are illustrated for Dutch (a) and Italian (b) scenarios.
Figure 6.
Overall energy performance comparison of the investigated technologies for case with active cooling. Each intervention is shown with its percentage annual saving amount, referring to the base case. Results are illustrated for Dutch (a) and Italian (b) scenarios.

Table 1.
Main boundary conditions and operational schedules considered in the simulations for both climate scenarios.
Table 1.
Main boundary conditions and operational schedules considered in the simulations for both climate scenarios.
| Unit | Value | Schedule | ||
|---|---|---|---|---|
| Building size | m | 8.00 (L) 3.00 (W) 2.60 (H) | - | |
| Glazing surface | m2 | 1.41 (East) 2.65 (South) 1.41 (West) | - | |
| Envelope | Shading | - | - | On when solar radiation on external façade is >190 W/m2 |
| Infiltration | ACH | 0.20 | Always on | |
| HVAC system | Ventilation | l/m2 s | 0.50 | Cold season (21 Septeber–20 June): 12:00 a.m.–6:00 a.m. (OFF), 6:00 a.m.–9:00 p.m. (ON), 9:00 p.m.–12:00 a.m. (OFF) Warm season (21 June–20 September): 24 hours (ON) |
| Heating setpoint | °C | 20 | Cold season (21 Septeber–20 June): 12:00 a.m.–6:00 a.m. (OFF), 6:00 a.m.–9:00 p.m. (ON), 9:00 p.m.–12:00 a.m. (OFF) Warm season (21 June–20 September): always OFF | |
| Cooling setpoint | °C | 24 | Cold season (21 Septeber–20 June): always OFF Warm season (21 June–20 September): 12:00 a.m.–8:00 a.m. (OFF), 8:00 a.m.–9:00 p.m. (ON), 9:00 p.m.–12:00 a.m. (OFF) | |
| Internal heat gains | People | W/person | 85 | 12:00 a.m.–8:00 a.m. (100%), 8:00 a.m.–6:00 p.m. (50%), 6:00 p.m.–12:00 a.m. (100%) |
| Lights | W/m2 | 6.5 | 12:00 a.m.–8:00 a.m. (0%), 8:00 a.m.–6:00 p.m. (30%), 6:00 p.m.–12:00 a.m. (75%) | |
| Equipment | W/m2 | 4.0 | 12:00 a.m.–8:00 a.m. (0%), 8:00 a.m.–6:00 p.m. (30%), 6:00 p.m.–12:00 a.m. (75%) | |
Table 3.
Overview of global performance optimization for Amsterdam climate scenario, according to winter and summer energy and comfort performance, and considerations for transportation flexibility (“Good”, “Average” or “Bad”). For each performance indicator (columns), green cells indicate the most suitable solutions, yellow cells indicate neutral solutions, and red cells indicate the least suitable solutions.
| Winter Performance | Summer Performance | ||||
|---|---|---|---|---|---|
| Optimal Case | Ep, H (kWh/Year) | Ep, H (kWh/Year) | CDH (°C h) | Transportation Flexibility | |
| VIP | - | 1053.0 | 401.0 | 2610 | Bad |
| PCM | Tm = 23 °C | 2578.2 | 91.7 | 642 | Good |
| TCC | αD in the range 0–1 Ts = 15 °C | 2930.2 | 268.2 | 1032 | Average |
| ECC | αD in the range 0–1 Ts = 15 °C | 2860.6 | 314.1 | 989 | Average |
| TCW | αD in the range 0–1 Ts = 15 °C | 2802.3 | 243.2 | 778 | Average |
| ECW | αD in the range 0–1 Ts = 15 °C | 2804.3 | 260.6 | 778 | Average |
Table 4.
Overview of global performance optimization for Florence climate scenario, according to winter and summer energy and comfort performance, and considerations for transportation flexibility (“Good”, “Average” or “Bad”). For each performance indicator (columns), green cells indicate the most suitable solutions, yellow cells indicate neutral solutions, and red cells indicate the least suitable solutions.
| Winter Performance | Summer Performance | ||||
|---|---|---|---|---|---|
| Optimal Case | Ep, H (kWh/Year) | Ep, H (kWh/Year) | CDH (°C h) | Transportation Flexibility | |
| VIP | - | 582.1 | 1285.5 | 12400 | Bad |
| PCM | Tm = 23 °C | 1640.0 | 766.5 | 6102 | Good |
| TCC | αD in the range 0–1 Ts = 15 °C | 1914.7 | 1044.4 | 6642 | Average |
| ECC | αD in the range 0–1 Ts = 15 °C | 1832.7 | 1096.3 | 6551 | Average |
| TCW | αD in the range 0–1 Ts = 15 °C | 1880.9 | 1054.5 | 7086 | Average |
| ECW | αD in the range 0–1 Ts = 15 °C | 1878.4 | 1082.5 | 7088 | Average |
Disclaimer/Publisher’s Note: The statements, opinions and data contained in all publications are solely those of the individual author(s) and contributor(s) and not of MDPI and/or the editor(s). MDPI and/or the editor(s) disclaim responsibility for any injury to people or property resulting from any ideas, methods, instructions or products referred to in the content. |
© 2024 by the authors. Licensee MDPI, Basel, Switzerland. This article is an open access article distributed under the terms and conditions of the Creative Commons Attribution (CC BY) license (https://creativecommons.org/licenses/by/4.0/).
Share and Cite
MDPI and ACS Style
Rapone, L.; Butt, A.A.; Loonen, R.C.G.M.; Salvadori, G.; Leccese, F. Investigating Advanced Building Envelopes for Energy Efficiency in Prefab Temporary Post-Disaster Housing. Energies 2024, 17, 2008. https://doi.org/10.3390/en17092008
AMA Style
Rapone L, Butt AA, Loonen RCGM, Salvadori G, Leccese F. Investigating Advanced Building Envelopes for Energy Efficiency in Prefab Temporary Post-Disaster Housing. Energies. 2024; 17(9):2008. https://doi.org/10.3390/en17092008
Chicago/Turabian StyleRapone, Lorenzo, Afaq A. Butt, Roel C. G. M. Loonen, Giacomo Salvadori, and Francesco Leccese. 2024. "Investigating Advanced Building Envelopes for Energy Efficiency in Prefab Temporary Post-Disaster Housing" Energies 17, no. 9: 2008. https://doi.org/10.3390/en17092008
Note that from the first issue of 2016, this journal uses article numbers instead of page numbers. See further details here.