
A Systematic Review on Fuzzy Decision Support Systems and Multi-Criteria Analysis in Urban Heat Island Management

1
Faculty of Civil Engineering, Architecture and Geodesy, University of Split, 21000 Split, Croatia
2
Faculty of Geodesy, University of Zagreb, 10000 Zagreb, Croatia
*
Author to whom correspondence should be addressed.
Energies 2024, 17(9), 2013; https://doi.org/10.3390/en17092013
Submission received: 23 March 2024
/
Revised: 15 April 2024
/
Accepted: 20 April 2024
/
Published: 24 April 2024
(This article belongs to the Special Issue Fuzzy Decision Support Systems for Efficient Energy Management)
Abstract
:The phenomenon known as urban heat islands (UHIs) is becoming more common and widespread, especially in large cities and metropolises around the world. The main cause of these temperature variations between the city center and the suburbs is the replacement of large tracts of natural land with artificial (built-up) surfaces that absorb solar heat and radiate it back at night. UHIs have been the subject of numerous studies, most of which were about defining the main characteristics, factors, indexes, etc., of UHIs using remote sensing technologies or about determining mitigating activities. This paper provides a comprehensive overview of the literature, as well as a bibliometric analysis, to discover research trends related to the application of decision support systems and multi-criteria decision-making for UHI management, with a special emphasis on fuzzy theory. Data collection is conducted using the Scopus bibliographic database. Throughout the literature review, it was found that there were not many studies on multi-criteria analysis and decision support system applications regarding UHIs. The fuzzy theory application was also reviewed, resulting in only a few references. However, this topic is current, with an increase in published papers, and authors see this as an opportunity for improvement and further research.
1. Introduction
The urbanization and changes in lifestyle and the environment that have taken place in recent decades have brought many benefits, provided new opportunities, and, in some aspects, raised the quality of life. However, in addition to the positive aspects, there are also some drawbacks to replacing the natural environment with a built-up one, among which is the appearance of urban heat islands (UHIs). This phenomenon can be defined as increased air and land temperatures in the built-up area compared to the surrounding rural areas. According to Yamamoto [1], it is a phenomenon that affects almost every major city and it primarily occurs when extensive natural land is substituted with artificially constructed surfaces that absorb solar radiation or heat during the day and emit it at night [2,3]. The difference in air temperature between the city’s center and the suburbs can be from 1 to more than 10 degrees Celsius [4,5,6]. The biggest temperature differences occur in cities with populations exceeding 100,000 residents in lowland areas or valleys and in the summer period [7]. For the time being, the main and most effective option for mitigating the effects of UHIs is an increase in vegetation areas [8,9]. Urban vegetation can, to some extent, regulate the microclimate, mainly through shading [10] and evapotranspiration [11].
To make it easier to follow the review of the literature and comprehend the complexity of the issue, the introduction includes a detailed explanation of all the basic terms related to UHIs; factors that contribute to their occurrence; and UHI types, detection methods, and methods of mitigation.
1.1. Basic Concepts of UHIs
In addition to solar heating and current weather conditions, several factors affect the creation of UHIs. As already mentioned, urbanization leads to the loss of vegetation and the replacement of natural materials with metallic, asphaltic, and concrete substances, each possessing distinct thermal conductivities [12,13,14]. As a result of the removal of natural surfaces and vegetation during city development and expansion, there are lower levels of evaporation and humidity, which leads to the retention of heat during the day and its subsequent release at night [15,16,17,18]. Additionally, chopping down trees eliminates the cooling effect that trees’ crowns provide, which is crucial for maintaining human comfort. Furthermore, artificial building materials have a high absorption of solar radiation, due to their low albedo [16,17,18]. Albedo indicates the proportion of shortwave radiation that a surface material reflects [19], which means that materials with a low albedo store more solar energy and directly contribute to the rise in urban temperature, i.e., the creation of a microclimate [20]. Materials with a low albedo and a high absorption of solar radiation include dark materials such as asphalt, while, for example, white roofs do not absorb much solar radiation. An important physical property of a material is its thermal diffusivity. For materials with a high heat diffusivity (which is a combination of thermal conductivity and heat capacity), such as concrete, heat penetrates deeper into their layers and is retained for longer. Natural materials and rural areas generally have a lower thermal diffusivity than built-up areas [15].
The development of UHIs is also influenced by the geometry of the built-up area. Tall buildings create a canyon geometry that causes heat to be trapped in the bottom layers. Due to the reduced sky view, heat release via longwave radiation is reduced and is captured by taller buildings, creating an urban canopy [15,21,22]. Due to the densely distributed tall buildings, less heat is convected from the surface to the air, since the buildings reduce the speed of the wind, which would otherwise cool the area [15,23]. The UHI effect is greatest during calm, clear weather when there is no wind [24]. The increase in temperature is influenced by both the arrangement of vegetation and built-up areas. According to Kazak [25], smaller urban development cores are more favorable to UHIs, while large urban clusters have a greater exposure to UHIs. Part of the reason for the increase in temperature is anthropogenic heat, which is caused by traffic, electrical energy consumption (air conditioning), industrial processes, and human and animal biological metabolism [15,20]. These activities also contribute to air pollution, which negatively affects air temperature. Exhaust gases released by cars or industry, in particular mineral and carbon aerosols, retain solar radiation in the Earth’s atmosphere and thereby influence the creation of a microclimate, causing the greenhouse effect [26]. The UHI effect is most pronounced in summer, due to the prevalence of solar radiation. Other current weather conditions also influence the creation of a microclimate; for example, anticyclone conditions increase the UHI effect, while wind speed and cloud cover are negatively correlated with UHIs [2,27].
There are several UHI types—Atmospheric Urban Heat Islands (AUHIs), Surface Urban Heat Islands (SUHIs), and Subsurface Urban Heat Islands. AUHIs occur when the air temperature is higher in urban areas compared to rural areas and can be split into two groups, as follows: canopy layer urban heat islands, representing the zone amidst the urban surface and the height of the trees or buildings, and boundary layer heat islands, which encompass the space extending from the top of the canopy layer to approximately one mile above the surface, reaching an area where urban landscapes cease to impact the atmosphere. Canopy layer urban heat islands are indicative of the near-surface temperature, i.e., the temperature recorded using a shielded thermometer at a two meter height above the ground. SUHIs are measured using land surface temperature (LST), which is higher in urban areas than in the adjacent rural areas, and are present throughout both the day and the night. Subsurface UHIs are indicative of the difference in temperature between the soil beneath the urban area and the soil in the neighboring rural area [2,28,29].
A conventional measure of the UHI’s magnitude is urban heat island intensity (UHII), which is determined as the difference between the maximum urban temperature, , and a representative temperature of the rural area, , over a specified period [28], as follows:
The choice of temperature (air, LST, or soil) depends on the type of heat island whose magnitude is being determined.
Stewart and Oke [30] introduced the local climate zones (LCZs) scheme, which is now a standard and is used in many research studies, to make it easier to distinguish between what belongs in an urban and a rural area. The LCZs scheme enables the objective determination of UHIs and includes 17 classes, 10 types of built environment, and 7 land types [30].
Urban heat islands can be identified using various techniques, including both the direct and indirect measurement of temperature and physical modeling [31]. The conventional method of measuring air temperature at stationary meteorological stations situated 1.5–2 m above ground is one form of direct measurement [18]. The primary drawbacks of this method are its high cost and the restricted coverage of meteorological stations; the meteorological stations that are currently in place are frequently located in remote areas, are insufficient in number, and are situated at elevations and locations that are not appropriate for identifying heat islands [15,29]. Another way of directly determining UHIs is via temperature measurement using moving sensors, mounted, for example, on a moving vehicle or a balloon for vertical measuring the changes in air temperature. The problem with such measurements is the high price of achieving simultaneous measurements at multiple locations. Indirect ways of determining UHIs include remote sensing techniques that use satellites and aircraft to measure LST. Satellites provide a good spatial resolution, but their problem is temporal resolution, since their data are only available at the time of satellite passage over a certain part of the Earth [15,31]. A new method of determining heat islands that would circumvent the shortcomings of satellite observations is the determination of AUHIs using a Global Navigation Satellite System, which uses precise point positioning measurements and temperatures are determined using the Zenith tropospheric refraction [32].
The urban microclimate plays a crucial role in determining the standard of living within a city and UHI effects have a substantial impact on both the physical environment and the socioeconomic sphere [33,34,35]. The emergence of UHIs in urban areas has the capacity to worsen the negative impacts of global warming, which are harmful to human health, water consumption, and the ecosystem itself. Cities are experiencing higher temperatures, particularly during the summer, which increases the demand for air conditioners and, consequently, energy consumption. Due to changes in local wind patterns and increased energy consumption, there are also increased levels of air pollution and greenhouse gas emissions, which enhance the ground-level ozone generation. SUHIs adversely affect the quality of water, causing its thermal pollution by increasing the temperature of storm water runoff, which then flows into rivers, seas, and lakes. All this affects human comfort and health, causing respiratory difficulties, heat stress, non-fatal heat stroke, and increasing mortality attributed to heat-related causes, which particularly applies to vulnerable groups with certain health issues, elderly people, and small children [29,35,36,37].
Recent studies have demonstrated that changes in momentum, mass, and heat transfer surrounding urban structures, which are caused by urban morphology, have a major effect on the urban outdoor environment [38]. The street canyon’s poor anthropogenic heat removal and dilution is a result of stagnant airflow surrounding densely populated, towering buildings. Thus, in order to lessen the severity of UHIs, efficient methods for anthropogenic heat removal and dilution are essential. Numerous studies have been conducted on air flow in densely populated metropolitan areas. However, estimating the anthropogenic heat dispersion simply from the information of the air flow may be challenging, if not incorrect [38,39]. In order to assess the impact of human heat on air temperature, a microscale Computational Fluid Dynamics (CFD) simulation is often used to produce precise and high-resolution modeling results of heat transfer and dispersion in the street canyon [40].
There are several different techniques for the mitigation of the UHI effect and Santamouris et al. [41] classified these, as concerns cooling mechanisms, into the following: cool material, urban greenery, evaporative techniques, and underground cooling. Using vegetation, particularly trees, is one of the best strategies for mitigating UHIs [42]. By creating shady area and facilitating evapotranspiration, trees and other vegetation help to cool urban microclimates [37]. Green strategies include urban forests (parks), street trees, private green gardens, and green roofs (GRs) or facades [43]. Cool materials reduce temperatures by improving solar reflection and reducing solar absorption and their advantages are their low cost and easy implementation [44]. Various kinds of cool roofs and cool pavements are being used [37]. Evaporation methods, which include water bodies and sprinklers, can enhance the release of latent heat [45]. Urban water bodies (including lakes and rivers) are considered urban cooling islands [46], whose cooling effects can be felt up to 800 m away [47]. Underground cooling refers to reducing the temperature in the indoor area, in order to reduce both the anthropogenic heat that affects the outdoor temperature and to reduce energy consumption [45].
1.2. Decision Support Systems with Fuzzy Theory and Multi-Criteria Decision-Making
In order to make the right decisions for environmental and ecological purposes, as well as for the prediction of outcomes, computer science can assist and support ecologists, engineers, urban planners, and other experts in the formulation of ecological assessments. As a result, computer science has become an essential tool for environmental scientists and urban planners to solve complex ecological problems. The often-used tools in the environmental sector are decision support systems (DSSs), which are computer programs that support ecologists and urban planners in decision-making [48]. By demonstrating advanced reasoning abilities, DSSs can enhance environmental decision-making and encourage more effective practices. With the intention of giving computers the ability to “think” like experts, expert systems researchers create the majority of DSSs [49]. There are various DSS tools available to support decision-making and most of them rely on models and algorithms for data and information analysis and elaboration. Some of them are based on Analytical Hierarchy Processes and other multi-criteria decision-making techniques, or they are combined with different management strategies [50,51]. In environmental DSSs, trade-offs between socio-political, environmental, and economic aspects must be taken into account. Multiple stakeholder perspectives frequently complicate this process. Decisions in various sectors can be supported by multi-criteria decision-making (MCDM), a formal methodology that arose to address existing technical knowledge and stakeholder values. Environmental decision-making can particularly benefit from MCDM [52].
A distinguishing feature of a DSS is its knowledge, which enables the system to intelligently and specifically give information on an observed problem to increase efficacy. There are, in fact, two kinds of DSSs—knowledge-based and non-knowledge-based. The second applies machine learning, via neural networks or genetic algorithms, to artificial intelligence principles [53], while fuzzy logic-based DSSs (FDSSs) are a type of knowledge-based system [54,55]. These systems primarily rely on rules in the form of if–then statements and the data are typically linked to these rules.
Soft computing plays a major role in the development of fuzzy principles, which have roots in a variety of previous studies, including Zadeh’s papers on fuzzy sets [56] and the analysis of complex systems and decision processes [57]. When dealing with fuzzy concepts, it is necessary to create fuzzy sets (with defined membership functions) and applied logical operations to those sets. The foundation for creating models of fuzzy systems is fuzzy logic, which offers guidelines for operations on fuzzy sets. To begin with, one must acknowledge that fuzzy logic is really an extension of conventional Boolean logic. Stated differently, fuzzy logic reduces to normal binary logic if fuzzy values remain at the extremes of 1 (totally true) and 0 (absolutely false) [58]. Fuzzy logic is more advantageous and effective for handling expert judgments and decision-making because, in contrast to other methods, it can handle the ambiguity and uncertainty of data.
1.3. Research Focus
Since the 1950s, the urban population has been growing rapidly and, according to [59], worldwide, a greater number of people live in urban areas compared to rural settlements. In 2018, this percentage was 55% and it is projected to reach 68% by the year 2050 [59]. As a result of this urbanization, there is a decrease in green space, an expansion of cities, and an increase in artificial material use, all of which have a negative impact on the development of UHIs. When such actions are taken without planning, the issue is even more serious. Thankfully, the problem of UHIs has become more widely acknowledged in recent years and, as a result, environmental policies and strategies have taken it into account, while increased research on the subject is being conducted. The problem is not easily solvable; it is necessary to develop a strategy and, according to [60], no UHI mitigation method is ideal; but, to solve the problem, several methods should be combined. This is where multi-criteria decision-making (MCDM), decision support systems (DSSs), and fuzzy theory found their role.
The aim of this research was to determine the incidence of the decision-making approaches and fuzzy theory in the management of UHIs. Research focus, thus, began with the formation of the following research questions:
- What are the research trends in using DSSs and MCA for UHI decision-making?
- How is fuzzy theory used?
- Does the theme develop over time?
- What are the most relevant authors and sources in the research field?
The first part of this paper provides an overview of the literature and the second part presents a bibliometric analysis to discover research trends in the use of the mentioned techniques for UHI mitigation, with a special emphasis on DSSs, MCDM, and fuzzy theory. An in-detail review is given for the remote sensing, mitigation, and management of UHIs; then, an application of multi-criteria analysis (MCA) and DSSs is presented as a support in various mitigation and management activities in evaluating and lowering the impact of UHIs. Finally, a discussion and the authors’ conclusions are presented, as well as further research directions.
2. Literature Review
In this section, a thorough review is given regarding both general and review studies, remote sensing, and the mitigation of UHIs. Furthermore, studies on the application of MCDM on UHIs and DSSs are presented. All of the cited literature is obtained from internationally renowned databases and reputable scientific journals. It addresses the issue of UHIs in a manner that is scientifically representative and also covers the identification and addressing of UHI effect, as well as choosing mitigation strategies. Table 1 is a part of the table that presents a summary of the studies reviewed, while the entire table (Table A1) is presented in Appendix A.
2.1. Remote Sensing and Mitigation of UHIs
In a study from Nwakaire et al. [61], a literature review on UHIs was provided, focusing specifically on urban pavements. Reports were provided on the state-of-the-art in UHI measurement, assessment, and mitigation. Kim and Brown [65] conducted a comprehensive systematic literature review, selecting 51 papers through a rigorous five-step filtering process. Their study focuses on examining the spatial extent of UHIs, the conceptual frameworks employed for UHI estimation, and the methodologies utilized for UHI estimation and analysis. A comprehensive assessment of records in Scopus and Web of Science (WOS), related to UHI analysis utilizing LST and remote sensing data and techniques, was reported by Almeida, Teodoro, and Gonçalves [66]. The review encompassed the years 2000–2020. A paper by Deilami, Kamruzzaman, and Liu [67] conducted a comprehensive and methodical review of the many temporal and spatial aspects influencing the UHI effect. In addition to examining the types of satellite images used, the methods for categorizing changes in land use and cover, the models for assessing the correlation between spatiotemporal factors and the UHI effect, and the impacts of these factors on UHIs, the paper systematically identified 75 eligible studies for review, specifically focusing on the UHI effect.
Nimac, Buli, and Uvela-Aloise [68] introduced a methodology for evaluating the impact of changes in land use/land cover and climate conditions on the total change in urban heat load in Zagreb from the 1960s to the present. Four modeling experiments were executed, involving the integration of two different city scenarios and two 30-year periods, which did not overlap. This approach allowed for a separate evaluation of the impacts of changes in land use/land cover and climate conditions.
The overall goal of Chen, Zheng, and Hu’s research [60] was not restricted to examining the impact of a single variable on the microclimate results; rather, they examined and assessed the impact of various cooling technique combinations in each open LCZ. This information was useful for optimizing urban development programs at both the neighborhood and street levels. Finding the best cooling combinations to reduce air temperature in LCZ-4 (open high-rise), LCZ-5 (open middle-rise), and LCZ-6 (open low-rise) were the main challenges. The examination of individual factors (such as vegetation, ground albedo, and GRs) on pedestrian air temperature within the same LCZ type and under identical LCZ conditions was another challenge. Finally, it was crucial to ascertain whether the cooling effects of a similar intervention differed across various LCZs.
LST is a crucial variable for many different Earth processes. Duplančić Leder, Leder and Hećimović [31] and Duplančić Leder and Leder [69], in their research, gathered data on LST thanks to satellite thermal data. Using Landsat thermal channels, the LST in the Split metropolitan region [31] and Mostar area [69] was ascertained. The findings suggested that the observed climatic changes and the intense urbanization that has occurred in the Split metropolitan region and Mostar area are causing UHIs. Another study by Duplančić Leder and Bačić [70] used the well-known LCZ classification system in the Split metropolitan region and matched it with the zones that had the highest urban temperatures. Additionally, the research identified important issues and offered possible solutions to lower the impact of UHIs. In order to make it easier to determine the border between built-up and non-built-up areas and to calculate the intensity of the UHI, Estacio et al. [71] proposed an automated geographic information system (GIS)-based methodology for determining LCZs. Although the methodology was developed in the Quezon City, Philippines, it can also be applied to other cities by modifying the input data. Using Landsat TM satellite imagery, Bokaie et al. [72] explored the correlation between LST and land use/land cover (LULC) in Tehran Metropolitan City. For this, the LULC map was created using the supervised classification approach [73] and the LST was determined using the algorithm. UHI locations were identified, based on the LST map that was produced by analyzing the satellite image’s thermal band, and their status, in connection to the population density and current LULC classes, was assessed. The findings demonstrated that the causal agent of the UHI produced in Tehran is distinct. To determine the LST and the UHI and to research their relationships with LULC and air pollution in Tabriz, Iran, Feizizadeh and Blaschke [74] proposed integrating Spectral Mixture Analysis and Endmember Remote Sensing Indices.
After researching 32 urban parks in Jinan, China, Zhu et al. [75] developed absolute and relative indices to illustrate the distinct characteristics of the parks’ cooling islands. The land cover of parks was determined using high-spatial-resolution GF-2 pictures, while the thermal environment was examined using buffer analysis on Landsat 8 TIR photos. LST, remote sensing-based ecological index, and biophysical composition index data were used by Firozjaei et al. [76] to predict the land surface’s ecological state. Zhang et al. [77] used heat, wetness, dryness, and greenness to evaluate the quality of the urban eco-environment. Zhang et al.’s [78] main focus was using land use data to assess how natural ecological land has changed. The retrieval of LST based on remote sensing data was the main emphasis of Jiang et al. [79]. Peng et al. [80] concentrated on using anthropogenic heat flux to study the impact of UHIs. However, evaluating the ecological environment solely on the basis of one criterion is incomplete and prejudiced. Several criteria are used in various studies to assess the ecological environment. A study by You et al. [81] used hot-spot analysis and Moran’s I to explain the geographical distribution of UHIs in the central area of Fuzhou, China. The study separated the drivers into socio-economic factors and physical geographic factors. Geodetector software was used to conduct the factor interaction analysis and the influence study of a single factor on LST.
The aim of the research from Despini et al. [82] was to examine the potential of surface albedo, one of the qualities that contributes the most to the creation of UHIs. Remote sensing data were utilized to examine urban surfaces, while solar reflective materials were used to create hypotheses for various scenarios. To evaluate UHI mitigation, energy conservation, and economic savings, multiple parameters were calculated for every scenario.
Santos et al. [83] created a brand-new framework that offers a statistical evaluation of models of urban climate in a Singaporean urban environment. The climate model converts high-dimensional data into a low-dimensional ranking system, based on statistical measures that represent stakeholders’ intended objectives. An analysis is conducted on various urban morphologies, taking into account operational energy costs and calculating their environmental impact on UHIs and population allocation potential.
In order to mitigate the UHI effect, Amani-Beni et al. [46] examined the effects of urban parks on microclimates and offered a point of reference for the management and planning requirements of urban green spaces. In their study, the researchers examined the cooling impacts of trees, grass, and water features in urban parks in Beijing’s built-up areas. They also examined the variations in air temperature, humidity, and thermal comfort across different types of urban green spaces, as well as their management approaches. Also, in another study by the same authors [84], they identified the urban park’s cooling effect on the neighborhood and made a contribution to the design, scientific planning, and management of urban green spaces. Using satellite imagery and the functionalities of Google Earth Engine—a robust geospatial analysis platform—Pritipadmaja, Garg, and Sharma [85] aimed to evaluate the cooling impact of blue–green spaces in Bhubaneswar. Their objective was to explore the implications of these features in mitigating UHI effects. The purpose of this study was to add to the body of knowledge already available on UHI mitigation techniques and to offer insightful information about the unique circumstances of Bhubaneswar. In particular, the links between the city’s built-up, water, and vegetation indices, as well as fluctuations in LST, were examined.
In their study, Dong et al. [86] measured the cooling effect in high-density metropolitan areas at the city level, taking into account actual GR projects. The range of the effective cooling buffer zone and the quantitative link between the area of GRs and their LST were of special interest to them. In order to do this, the cooling effect of urban GRs was statistically analyzed using geographic information systems and data from Landsat 8 remote sensing images taken between 2014 and 2017. Imran et al. [87] assessed the potential benefits of cool roofs and GRs for decreasing the impact of UHIs, as well as how these strategies affected people’s thermal comfort during one of the worst heatwaves ever recorded in Melbourne, southeast Australia, in January 2009. Due to the extremely dry and warm weather, this study demonstrates that convective rolls are more significant in the extreme heatwave event than the advection of moist air from rural areas, which has been reported to be a major mechanism in earlier studies. This study also demonstrated that UHIs are not greatly impacted by the initial soil wetness for GRs. In their research, Sanchez and Reames [88] examined how accessible GRs are to low-income and deprived groups in Detroit, Michigan, taking into account the UHI effect and the city’s existing cooling center infrastructure. Sections of the city were assessed for their susceptibility to the UHI effect; because GRs increase surface albedo and evaporative cooling, they can mitigate this effect. In order to ascertain if GRs have been installed where there is the greatest need for ecosystem services and to ascertain how socioeconomic features may be connected to the sites of green infrastructure mitigating UHIs, existing GR initiatives were mapped. On the other hand, appropriate building- and urban-scale solutions are needed to reduce the energy demand for space cooling and to mitigate the UHI effect. Specifically, it has been determined that building roofs represent a potential area of intervention, with the ability to deliver substantial environmental benefits and energy savings. Within this context, cool roofs and GRs represent two highly intriguing options that could potentially achieve the dual goals of lowering energy use and enhancing interior and outdoor comfort levels. Therefore, a numerical comparison of the energy and environmental performance of three different types of roofs—a standard roof, a cool roof, and a GR—was made by Gagliano et al. [89]. Thus, it is discovered that cool, green roofs offer more environmental advantages and energy savings than typical, heavily insulated roofs.
Considering the realms of city planning, urban climatology, and climate science, Gunawardena, Wells, and Kershaw [90] provided a meta-analysis of the main ways that green and blue space affect urban canopy and boundary layer temperatures. According to their study, when it comes to mitigating heat stress, tree-dominated greenspace is the most effective. Additionally, the evapotranspiration-based cooling effect of both green and blue space is most significant for conditions pertaining to the urban canopy layer. In order to address difficulties, Guo, Wu, and Chen [91] conducted a comparative study between four highly urbanized Chinese cities that were comparable in terms of geography, but differed in terms of urban planning and ecological surroundings. The premise of this study was that complicated mechanisms exist between LST and spatial patterns of greenspace and that these links can be inferred by determining the relative contributions of landscape metrics related to greenspace under various conditions. By combining stepwise regression with hierarchical partitioning, they created a novel method to examine the regional differences in greenspace contributions to urban heat reduction.
He [92] examined the relationships between building and urban heat fluxes, the parameters that could influence the application of UHI mitigation approaches on building components, and the boundaries of the green building-based UHI mitigation system. Some of the aspects of UHIs that influenced the benefits of green building, as well as the theory behind heat mitigation are examined in more detail, along with the potentials for setting up the green building-based UHI mitigation system. All things considered, this research provided a theoretical and practical basis for the creation of a green building-based UHI mitigation system, which is a noteworthy response from the building industry to rising temperatures.
Semenzato and Bortolini [93] examined the model’s applicability and created a technique that would yield temperature predictions that could be evaluated against the real temperature, in order to confirm the model’s accuracy. The sole application of this model in Europe, at the moment, exists in the Po Valley climate area, where numerous cities are severely impacted by the UHI phenomena and its associated pollution. In addition, this study used locally obtained datasets, as opposed to conventional satellite-derived land cover data, and applied the model at a finer resolution than previous investigations.
In order to identify the most efficient method for preserving urban energy, Zheng et al. [94] examined the relation between UHI mitigation strategies and urban energy consumption. Based on the theory of grey-box models and an urban energy consumption modeling tool, an inventive and thorough workflow is suggested. The procedure takes into account the mutual influences of urban energy consumption and UHIs by merging city object information with created urban microclimates. Nuruzzaman [20] made an attempt to evaluate several approaches to combat the impact of UHIs; the mechanisms by which these tactics work are depicted with diagrams. The potential UHI mitigation measures discussed in this research included the use of high albedo materials and pavements, as well as pervious pavements; green vegetation; GRs; shade trees; urban design; and the presence of water bodies in city areas.
2.2. Multi-Criteria Decision-Making and Fuzzy Theory Application in UHI Management
Using a mixed-method research approach, Sangkakool et al. [95] determined and measured the primary elements influencing the adoption of GRs. A qualitative content analysis was used to identify the important variables; internal/external and positive/negative elements were included in the structure; and an Analytical Hierarchy Process, based on expert judgments, was used to quantitatively assess the components. Three primary factors impacting Thailand’s potential for GR dissemination are identified using the analysis. In their study, Qi, Ding, and Ling [96] suggested a framework for decision-making to aid in the choice of urban heat mitigation techniques. The study’s particular objectives were to provide a tool that can adapt appropriate mitigation techniques to urban situations and to determine the best combination of urban heat mitigation techniques for a given urban context. Sangiorgio, Bruno, and Fiorito [97] used the current multi-criteria index-based approach to offer various strategies to reduce the UHI issue in Bari, Puglia, Italy’s core district. First, the UHII index is used to create an intensity map of Bari’s 17 urban areas. Second, for a total of 344 examined urban areas, the results are contrasted with those of five other significant European cities. The suggested method needed to gather a lot of data in order to create the database and generate the index. Temizkan, Merve, and Kayili [98] proposed a top cover for mitigating the UHI effect in KBU Social Life Center square, as well as to enable the collection of rainwater in the campus’ vast area. An MCDM method, PROMETHEE, was used to determine the optimum cover material. The most acceptable material to be utilized for the recommended top cover is a polycarbonate panel, which was selected due to its cost, roof efficiency, and albedo coefficient properties. In Qureshi and Rachid’s study [99], the application of several MCDM strategies was used to determine an intervention to mitigate outdoor urban heat stress. A total of eight established and traditional methods were calculated to assess the order of importance of the interventions. Teixeira and Amorim [100] used a multi-criteria model utilizing multiple linear regression to integrate primary air temperature data with spatial information, such as land use and terrain, in order to study AUHIs. The model studied in the Brazilian city of Presidente Prudente demonstrates that vegetation lowers atmospheric temperatures and it emphasizes that urban surface materials serve as the primary sources of energy, influencing heat transfer to the atmosphere.
In a study by Turhan et al. [101], the authors provided an integrated framework for decision-making that will assist in the reduction in the influence of UHIs on residential buildings’ energy efficiency. The model combines an MCDM model with simulations of building energy performance and urban microclimates. Real-time measurement data from one of the Urban GreenUP project’s case study areas in Izmir, Turkey, are used in the research.
Tabatabaee et al. [102] proposed a framework for evaluating the key benefits, opportunities, costs, and risks of GR installation and the mutual dependence between these factors. The Enhanced Fuzzy Delphi Method is employed in the first section of the methodology to identify the specified key parameters unique to the Malaysian region. These are first determined using the literature review and subsequently by interviewing experts. The fuzzy-DEMATEL method is used in the second part of the model to determine the inner dependencies among the key parameters that were previously determined. In their study, Sturiale and Scuderi [103] developed a methodological framework to assess residents’ social perceptions of urban green spaces. The suggested method is designed to help the city’s government to implement a new, strong urban development by utilizing an integrated approach between participatory planning and social multi-criteria evaluation methodologies, in the context of Catania’s “urban green system”. Rosasco and Perini [104] compared a traditional solution with a greening system, in order to study the factors influencing designers in their choice of building roof systems. The study’s conclusions determine their importance and the part that each factor had in the decision-making process using an MCA based on sustainability. Since plants naturally purify the air and trap carbon, a widespread installation of GRs in metropolitan areas offers the chance to enhance air quality [105]. It was possible to address other environmental problems that are specific to urban regions, like mitigating the UHI effect [106], which are indicative of higher temperatures in the cities than in the nearby rural areas.
The land suitability evaluation of the urban greenbelt and the estimation of the environmental appropriateness and change indicators, with relation to the current and future urban sprawl, were the primary research goals in the study by Rabbani, Madanian, and Daneshvar [107]. When evaluating land suitability, multiple criteria were applied in order to determine the geographical priority and appropriateness for a certain subject in a specific location. Ten essential factors were selected as raster data layers and were then combined to create a land suitability map that could be used to assess potential greenbelt sites. The agglomeration of UHIs was taken into account in this study, as a direct result of urbanization on the local climate and environment.
In order to determine what causes UHIs, Mushtaha et al. [108] divided the factors into the following three categories: the general urban surroundings, specific buildings around them, and the wider environment. This was carried out by reviewing prior research on the topic. In order to identify the most significant causes of UHIs, this study developed an approach using two research techniques, in an effort to corroborate earlier studies on the topic. The Analytical Hierarchy Process (AHP) was utilized in the first stage of the study to rank the UHI factors and, consequently, to determine the most significant factor of each category, based on the opinions of experts. This procedure was extended to examine the hierarchy of UHI components in an existing surrounding, which had most of the pertinent factors in its design and construction, during the study’s second phase. Moradi et al. [109] presented a scenario-based spatial MCDM approach for assessing urban environment quality as the primary objective of their study. As proposed in the research, it was acceptable to use the suggested method to learn more about the detrimental effects of climate change on people’s quality of life in marginalized communities, as well as the important role that climate-resilient urban design may play.
Green infrastructure is being expanded by cities in order to improve ecosystem services and resilience. Despite being praised for their versatility, green infrastructure projects are typically located to maximize a single benefit, such as a reduction in storm water, rather than a variety of other advantages. This is partly due to the dearth of city-scale, stakeholder-informed methods for methodically identifying ecosystem service tradeoffs, synergies, and “hotspots” related to the location of green infrastructure. In order to close this gap, Meerow and Newell [110] provided the Green Infrastructure Spatial Planning model, a multi-criteria, GIS-based strategy that incorporates the following six advantages: storm water management, air quality, green space, social vulnerability, UHI mitigation, and landscape connectedness.
The ability to meet the material and spiritual requirements of residents is referred to as quality in the urban setting. Urban planners and managers work to raise the living standard and life quality for residents by improving the urban environment. Therefore, Mahmoudzadeh et al. [111] used the spatial analysis of an MCDM method, CRITIC, to evaluate the quality of the urban environment. The Tabriz Metropolis Municipality’s districts 2 and 4 were the sites of the study.
A new methodological framework for evaluating a building’s capacity to withstand rising temperatures, taking into account the consequences on nearby metropolitan areas, was proposed by Lassandro and Turi [112]. They concentrated on the resilient retrofitting techniques required to develop buildings, based on three major macro-categories, as follows: mitigation ability, adaptability, and reliability. To deal with heat waves, a collection of indicators was established, in order to achieve a Response Index. The reference building and its surrounding area are used to test the method. Using an MCA based on the observed indicators, the final comparative analysis was conducted. The greenest solutions with the highest albedo were the most responsive ones. Furthermore, Kotharkar, Bagade, and Singh [113] investigated the main LCZs in Nagpur, India, which have a larger coverage area. To determine the criticality of the LCZs, they used The Order of Preference by Similarity to Ideal Solution (TOPSIS) method. Applying the ENVI met tool, they determined the key LCZs and assessed various measures, including greening and the use of reflective surfaces, such as cool pavement and CRs.
An example of a built-up area’s development activity is that of Searang City, which has increased dramatically due to the city’s rapid population growth. Due to the increased development, the occurrence of UHIs in Serang City is growing. Serang City is advised to continue developing, in the meantime, to create space for neighborhood events. In light of this, Januadi Putra et al. [114] offered a spatial analysis utilizing Spatial Multi-Criteria Evaluation to ascertain the development of built-up areas, based on the sustainability concept. The distribution of UHIs, the distance from the road, the distance from the river, the land use data, and the physiographic data were all analyzed using a specific weighting system to determine the built-up area’s suitability.
Yan et al. [115] suggested an ecological environment assessment technique for remote sensing that relies on the projection pursuit model. First, remote sensing technology is used to gather a number of ecological parameters for the urban ecological environment. Then, the projection pursuit model, a practical multi-criteria evaluation technique, is used to assess the natural environment in its entirety. An analysis of Shanghai City’s ecological environment changes over the last five years is conducted using the evaluation results. Teotónio et al. [116] adapted existing multi-criteria decision models for the setting of GR installations. The goal of the methodology they developed was to find a GR with an optimal cost–benefit ratio in accordance with the interests of investors; it was based on the Measuring Attractiveness by a Categorical-Based Evaluation Technique (MACBETH). The method was tested on an example in Lisbon for choosing among six types of GRs on a parking lot and the intensive GR turned out to be the best.
A new index has been proposed by Sangiorgio et al. [117] to measure the hazard of the absolute maximum intensity of UHIs in urban districts during the summer, by accounting for all the factors influencing the phenomenon. The methodology allows for the holistic assessment of UHIs. The suggested index was established by analyzing the parameters using the AHP method, a comprehensive data acquisition process that includes state-of-the-art techniques, optimization procedures for index calibration, and two validation tests involving a Jackknife resampling procedure.
A technique for mapping the UHIs, based on regional climate zones, has also been proposed by Phillips et al. [118]. The approach uses vector data, which is more time-consuming and requires a lot of data, but it produces better results than raster classification. The following two additional criteria were added to the classification in order to improve it: the compactness index and the vegetation parameter. LCZ polygons were digitized from cadastral data and their classification was carried out using a trapezoidal fuzzy logic model, which was determined using a decision tree.
Mostafa et al. [119] studied the urbanization trend, the changes in land use and cover that go along with it, and how these changes affected the LST and the UHI effect in Gharbia City, Egypt. In order to do this, they tracked the dynamics of LULC change using multi-temporal Landsat images from 1991 to 2018; then, they used the CA–Markov chain and the FAHP–CA–Markov chain to predict the LULC change. While both approaches yield good results, the integration of the FAHP and CA–Markov chains improves the prediction and identifies high-urbanization potential locations.
2.3. Decision Support System and Fuzzy Logic in UHIs
A few studies gave contributions to UHI mitigation and optimization using DSSs. Mostofi et al. [120] presented a spatial DSS in Tehran, Iran, to examine the influence of the type of roof covering on SUHI values and their variation, at the neighborhood scale. Another DSS is developed by Bathaei [121] and its purpose was to help the decision maker choose the most suitable method to mitigate UHIs, based on resiliency and sustainability concerns. The best mitigation strategy was chosen using the Weighted Scoring method (WSM). The proposed DSS has a Graphical User Interface and it was validated on a hypothetical example. Kazak, J. [25] proposed the use of a DSS to assess urban areas for potential exposure to the UHI effect. In the research by Metronamica [122], a spatial DSS, based on cellular automata, was used to analyze three different scenarios of possible future land use changes in the Wrocław Larger Urban Zone (Poland). Scenarios were created with regard to different spatial planning documents—local policy, regional policy, and national policy. The analysis showed that more scattered, smaller urban development cores are more favorable in relation to UHIs, while large urban clusters have a greater exposure to UHIs. Tuczek et al. [123] developed a DSS for mitigating the UHI effect; it was intended for city planners and policymakers, in order to support the planning process. This optimization tool helps to achieve balance between economy and ecology, by maximizing revenue from selling lands, while keeping the UHI intensity within appropriate limits.
Qureshi and Rachid [124] contributed to the UHI problem by reviewing the decision support toolss used for UHI mitigation and identifying their most important key factors. They reviewed existing spatial and non-spatial decision support toolss and analyzed, categorized, and ranked these tools, as well as their advantages and disadvantages, to help decision-makers in selecting heat resilience measures from the design phase to the heat mitigation phase. Mahdiyar et al. [125] developed a DSS for determining the best form of GR for residential buildings in Kuala Lumpur, enabling decision-makers to select the best alternative, by taking into account all significant financial and non-financial decision elements. The criteria were identified in two rounds using the Enhanced Fuzzy Delphi method (EFDM).
Further studies developed approaches based on decision-making or decision trees, for managing UHIs. A web application named “Right place, right tree—Boston” was created by Werbin et al. [62] to aid in decision-making when planting new trees in an effort to lower UHIs. To assist in identifying priority areas, the Boston Heat Vulnerability Index was created. Authors stated that HVIs are rarely used in decision-making and, according to them, the main reason for this is that a unique index should be created for that region, rather than using one that was created for a larger area, because of the inconsistent results. Acosta et al. [63] have developed an easy-to-use methodology for street-level UHI modeling to help governments and urban planners, taking UHIs into account when creating plans. In order to determine which features would be included in the model, supervised methods of decision trees and random forests were used to evaluate the significance or influence of particular features on UHIs. Qi et al. [64] proposed a five-step methodology to help in the decision-making process when choosing a combination of UHI mitigation strategies for a particular urban context.
3. Materials and Methods
The research methodology used is based on the methods of [126,127]. The selection of keywords and their analysis, which has not previously been conducted in this manner, represents the research’s innovation and contribution. To the best of the authors’ knowledge, there has not been a thorough literature review and bibliometric analysis of how multi-criteria analysis and decision support systems are used to address urban heat islands in this manner, particularly when it comes to fuzzy theory, which has not been covered by many authors in this field. This kind of study has shown that there is interest in using these techniques, but it also leaves room for more research, particularly in the area of applying fuzzy theory or creating fuzzy DSSs for UHI mitigation.
According to [126], the standard workflow of scientific in-depth research consists of the following five stages: study design, data collection, data analysis, data visualization, and interpretation. The process of study design involves formulating research questions and selecting bibliometric techniques to address them. Selecting the database for a search, filtering the results, and exporting the information are all included in the data collection phase. Data analysis refers to the selection of software and the analysis of the collected data itself, while data visualization refers to choosing the preferred visualization methods and selecting the appropriate software. The description and interpretation of the results are both included in the last phase.
The workflow of this study is presented in Figure 1. The study design can be found in the chapter entitled Research focus, while data collection, analysis, visualization, and interpretation are described in detail below.
After the research questions were formed, the data collection phase began with a keyword search in several bibliographic databases—Scopus, WoS, and IEEE explore. Using the same search criteria, the largest number of documents was found in the Scopus database. As many relevant papers contained in the other two databases were also found in this one, the research continued with a further and more detailed search exclusively of the Scopus database (https://www.scopus.com/ (accessed on 10 November 2023)). According to the Scopus Fact Sheet from 2022 [128], it contains 84+ million records, which date from as far back as 1788, from 7+ thousand publishers. Publications in Scopus are divided into the following four major subject areas: life sciences (15%), physical sciences (27%), health sciences (23%), and social sciences (35%) [128].
The final search query resulted in 248 records and was performed in November 2023; therefore, the analysis includes documents that were available at that time. The initial search began with the use of different keywords and their combinations within “All fields”. However, such a research query resulted in a large number of articles that are not thematically related to the search topic and are not usable for analysis. Since these papers dealt with entirely different topics and would have only mentioned one of the search terms somewhere in the text or references, the search has been reduced to the fields “Article title, Abstract, Keywords.” A similar methodology can be found in papers [129,130]. The search conducted within fields “Article title, Abstract, Keywords” consisted of several keyword combinations (“urban heat island” AND “decision support system”, “urban heat island” AND “multi-criteria decision making”, “urban heat island” AND “multi-criteria analysis”, “urban heat island” AND “decision making”), which were interconnected with the operator OR. The above expression yielded 271 records, which were further reduced by excluding reviews (18) and conference reviews (2), as well as limiting the language to English (which excluded 4 documents), so that the final number of analyzed records was 248. The timespan was not limited, given that the development of the topic is being analyzed.
To conduct a parallel analysis of the papers that contain fuzzy theory, additional filtering was tried on the found documents to separate them. The search query only yielded four papers when the keywords “fuzzy” or “fuzzy theory” were added. As a result, a separate bibliometric analysis was not conducted for this small sample of papers, but they were included in the 248 papers that were mentioned. The details of the papers found on “fuzzy theory” are contained in Table 2.
The data on the selected records were exported in csv format, in order to perform a bibliometric analysis. Bibliometric analysis is a favored and thorough method for analyzing scientific data, the popularity of which has recently grown, due to the development and availability of scientific databases (such as Scopus and Web of science) and tools for conducting the analysis itself (such as VOSviewer, Bilbiometrix, and Gephi). Bibliometrics uses large volumes of scientific data and provides insight into the global research trends in a particular field [133,134]. The review process is based on the statistical measurement of science and it is transparent and reproducible; hence, it offers more objective and reliable analyses than other literature review methods [127,135,136,137].
In the next step, the exported data were loaded into the bibliometrics tool. This study used the open-source bibliometrix R-package (R 4.3.2) to conduct bibliometric analysis. bibliometrix is a unique tool for quantitative research in scientometrics and bibliometrics, which provides all the instruments necessary to pursue a complete bibliometric analysis; its web application—biblioshiny—is easy to use for those with no coding skills [138].
4. Results
4.1. Descriptive Analysis
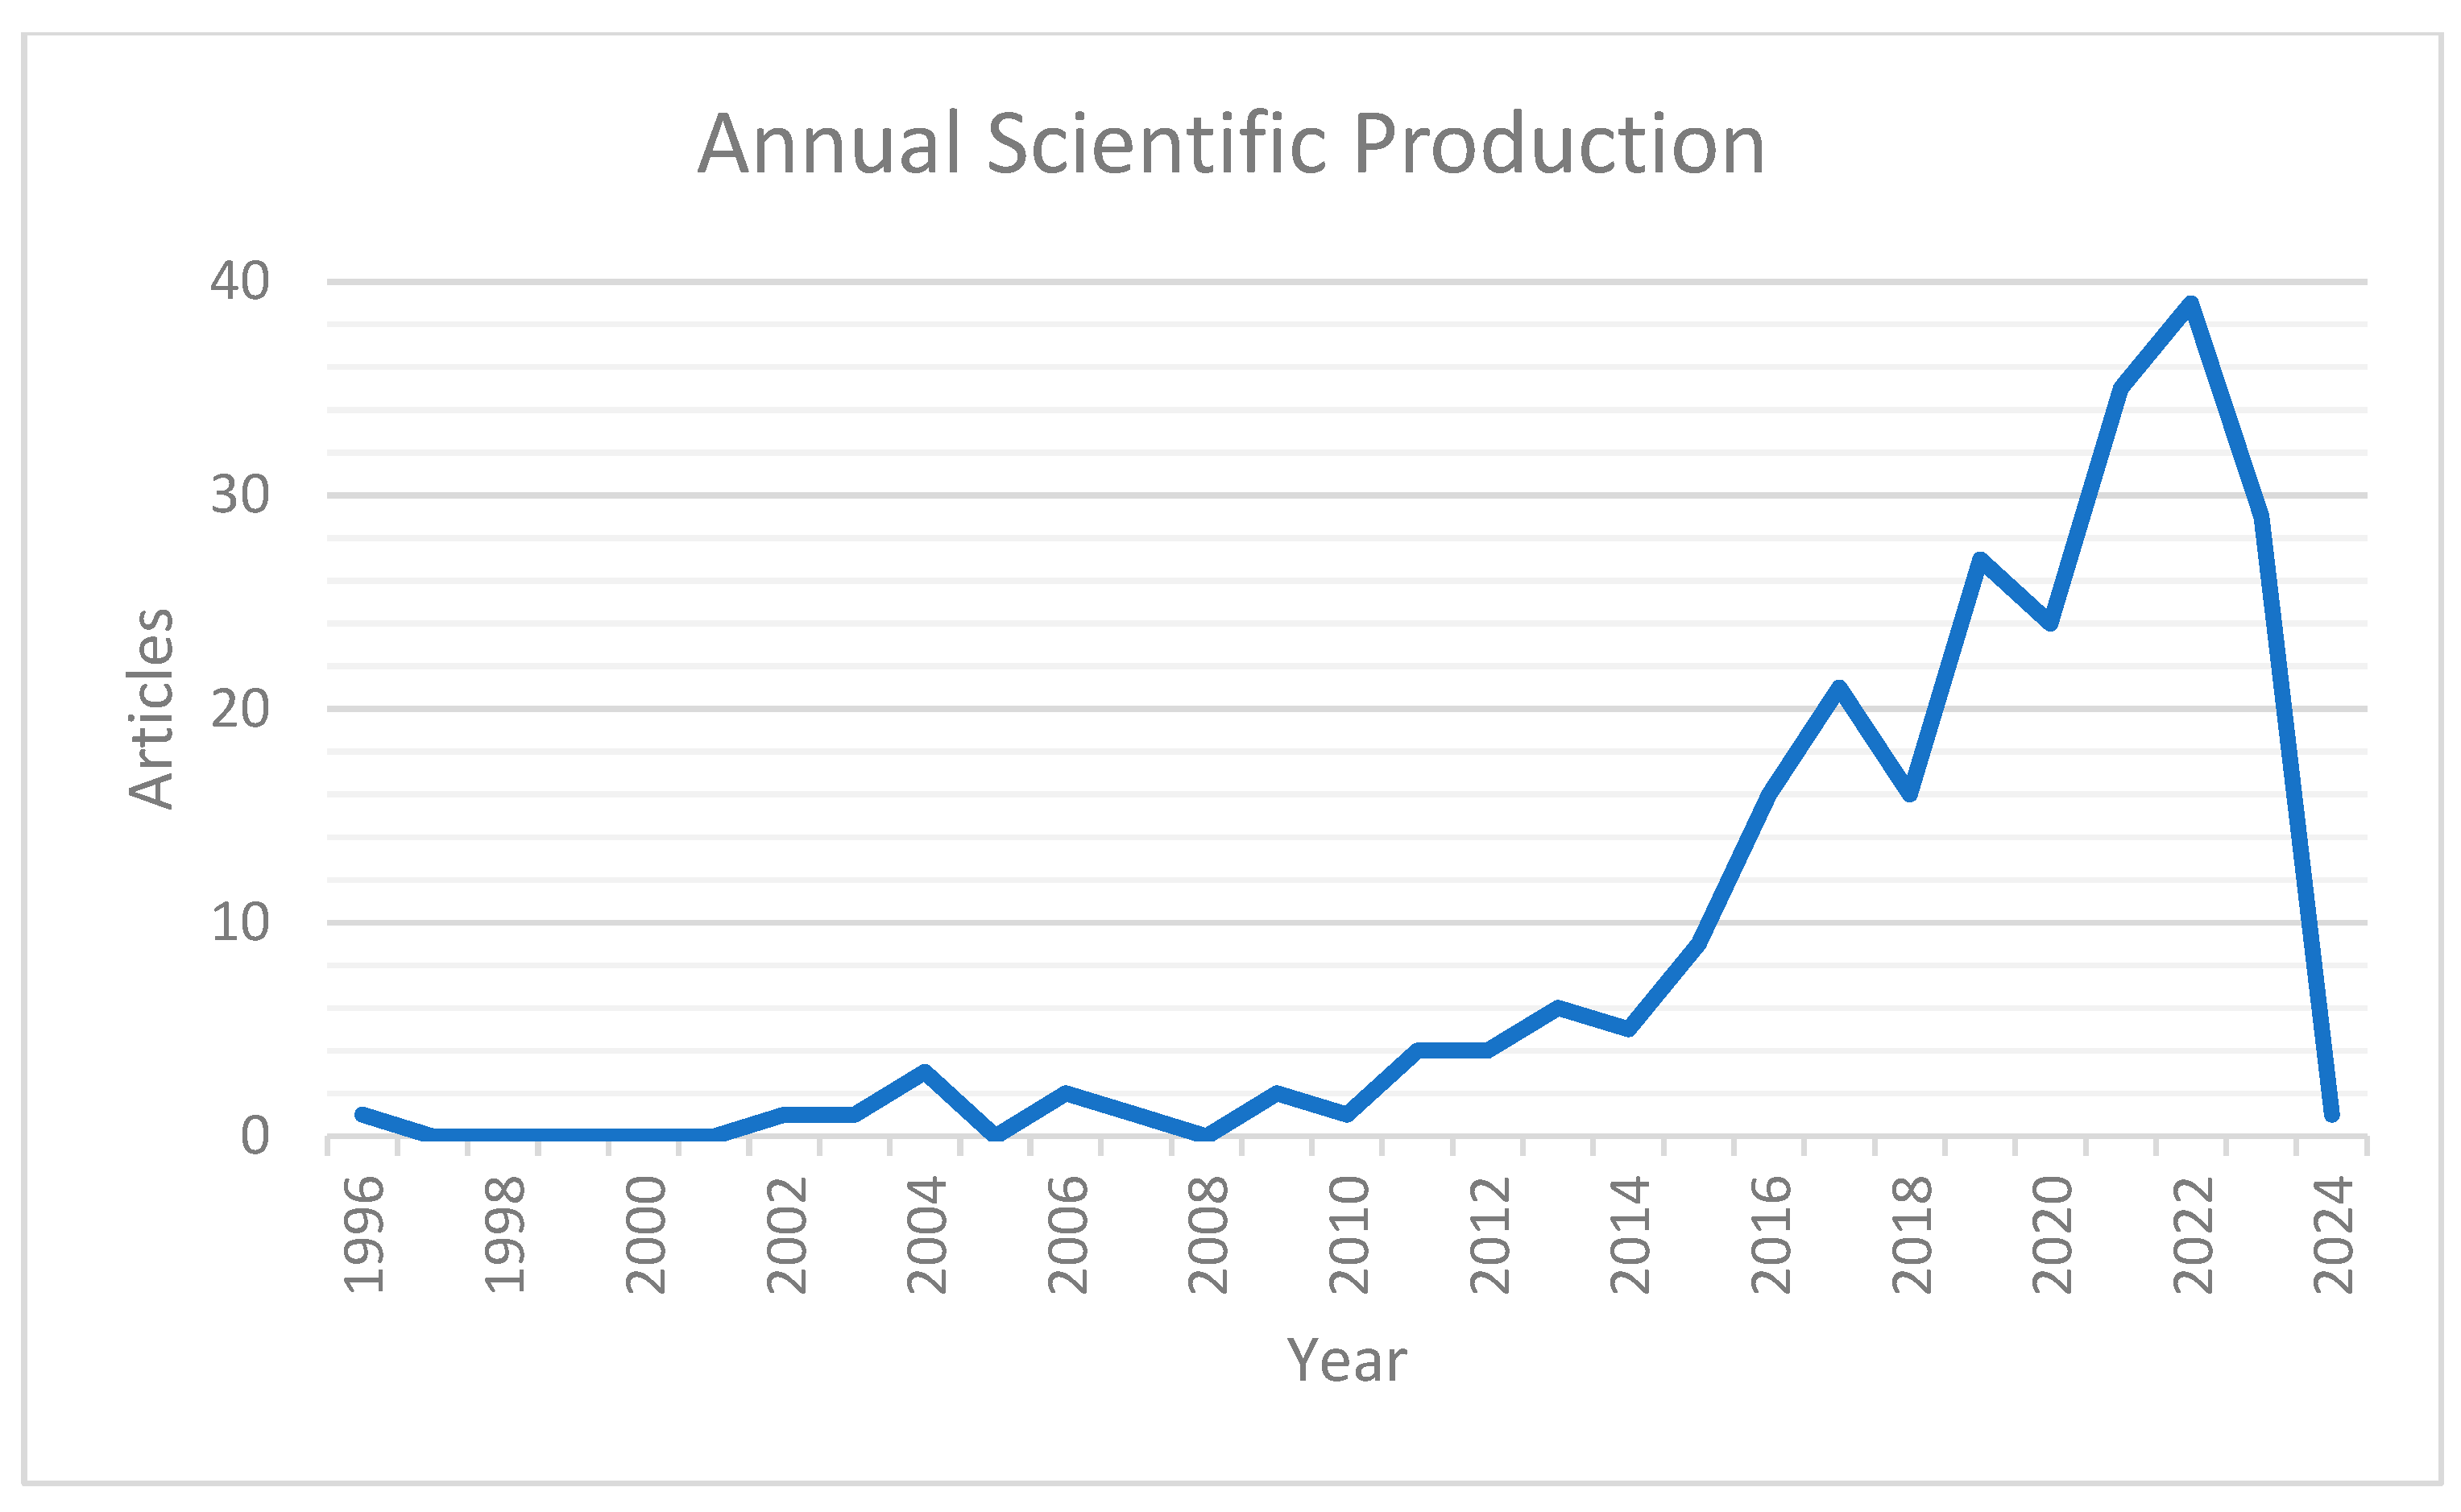
The main information regarding the collection process is presented in Table 3. The described search strategy resulted in 248 documents from 144 sources. The oldest record dates from 1996 (Table 3, Figure 2) and, as previously mentioned, the time period was not limited when filtering the documents. It can be noted that the time span is from 1996 to 2024. The papers that were accessible as of 15 November 2023, were examined; however, one of them was located in a journal volume from 2024. Since that paper was already available in November, when it was included in the analyses, the authors did not want to exclude it.
The majority of the documents were articles (183), followed by conference papers (47) and books (17), while there was only one book among the records. The average number of citations per document was 21.88 and the total number of cited documents was 12,584. There were only 18 single-authored documents, while the average number of co-authors per document was 4.03.
Figure 2 shows the Annual Scientific production of papers related to the use of MCA and DSSs in UHI management. The horizontal axis represents years, while the vertical axis represents the number of publications.
4.2. Sources and Authors Analysis
The most relevant sources, according to the number of published records, were Science of the Total Environment and Sustainable Cities and Society, with 11 published articles. The list of the first ten sources, according to the number of published records, arranged in descending order, is shown in Table 4.
Table 5 shows the 10 most local cited sources, arranged in descending order. As expected, among the 10 most cited sources, there are also a good number of sources from the list of those with the most published records. The most cited journal is Remote sensing applications: society and environment, with 207 local citations, followed by Building and environment, with 186 citations and Energy and buildings, with 129 citations.
Table 6 presents statistics about the 20 most relevant authors, according to the total number of citations, sorted in descending order. The most cited author was Chen L., with 405 citations and 4 publications, followed by Zhang H., with 306 citations and 6 published documents and Sun R., with 271 citations and 2 publications. After them, there were several authors with 263 citations and 1 publication. According to [14], the H-index, or Hirsch index, is the number of articles (H) published by an author, each of which has been cited in other publications at least h times. The M-index is obtained when the h-index is divided by the number of years since the author published the first paper (n). The G-index provides an assessment of the global citation of a set of articles, giving more weight to highly cited articles. This is obtained by ranking the articles in descending order, with regard to the number of citations; then, the g-index represents the largest number, so that the first g articles received (together) at least g2 citations [139].
Chen L. and Zhang H. are perhaps some of the most sonorous names in the searched area, since they were also among the 10 most productive authors (Figure 3). Moreover, Zhang H. was the most productive author and, from Figure 3, it can be seen that he has been dealing with this topic for a long time, with his first publication dating from 2013. Figure 3 shows the authors’ production over time for the first 10 authors, by the number of their published articles. The line represents author’s timeline, the size of the circle corresponds to the number of published papers, and the level of transparency indicates the number of total citations per year. Chen L. is also among the authors who have been publishing in this field for a long time, with their first publication hailing from the year 2011 and the last hailing from the year 2020; Li X. is also among these authors, with their first publication originating from 2014 and their last publication dating from 2023.
4.3. Topic Development Analysis
There was a total of 797 author’s keywords among the collection of records (Table 3). Figure 4 presents a word cloud of the 50 most frequent keywords, where the words that appear more often are more prominent, displayed in a larger font size, while words that appear less frequently are shown in a smaller font size. When creating the world cloud, the keywords “urban heat island”, “UHI”, and similar were excluded, since they dominate the appearance and, considering that the entire research revolves around UHIs, it is not necessary to show them in order to see trends in the research papers.
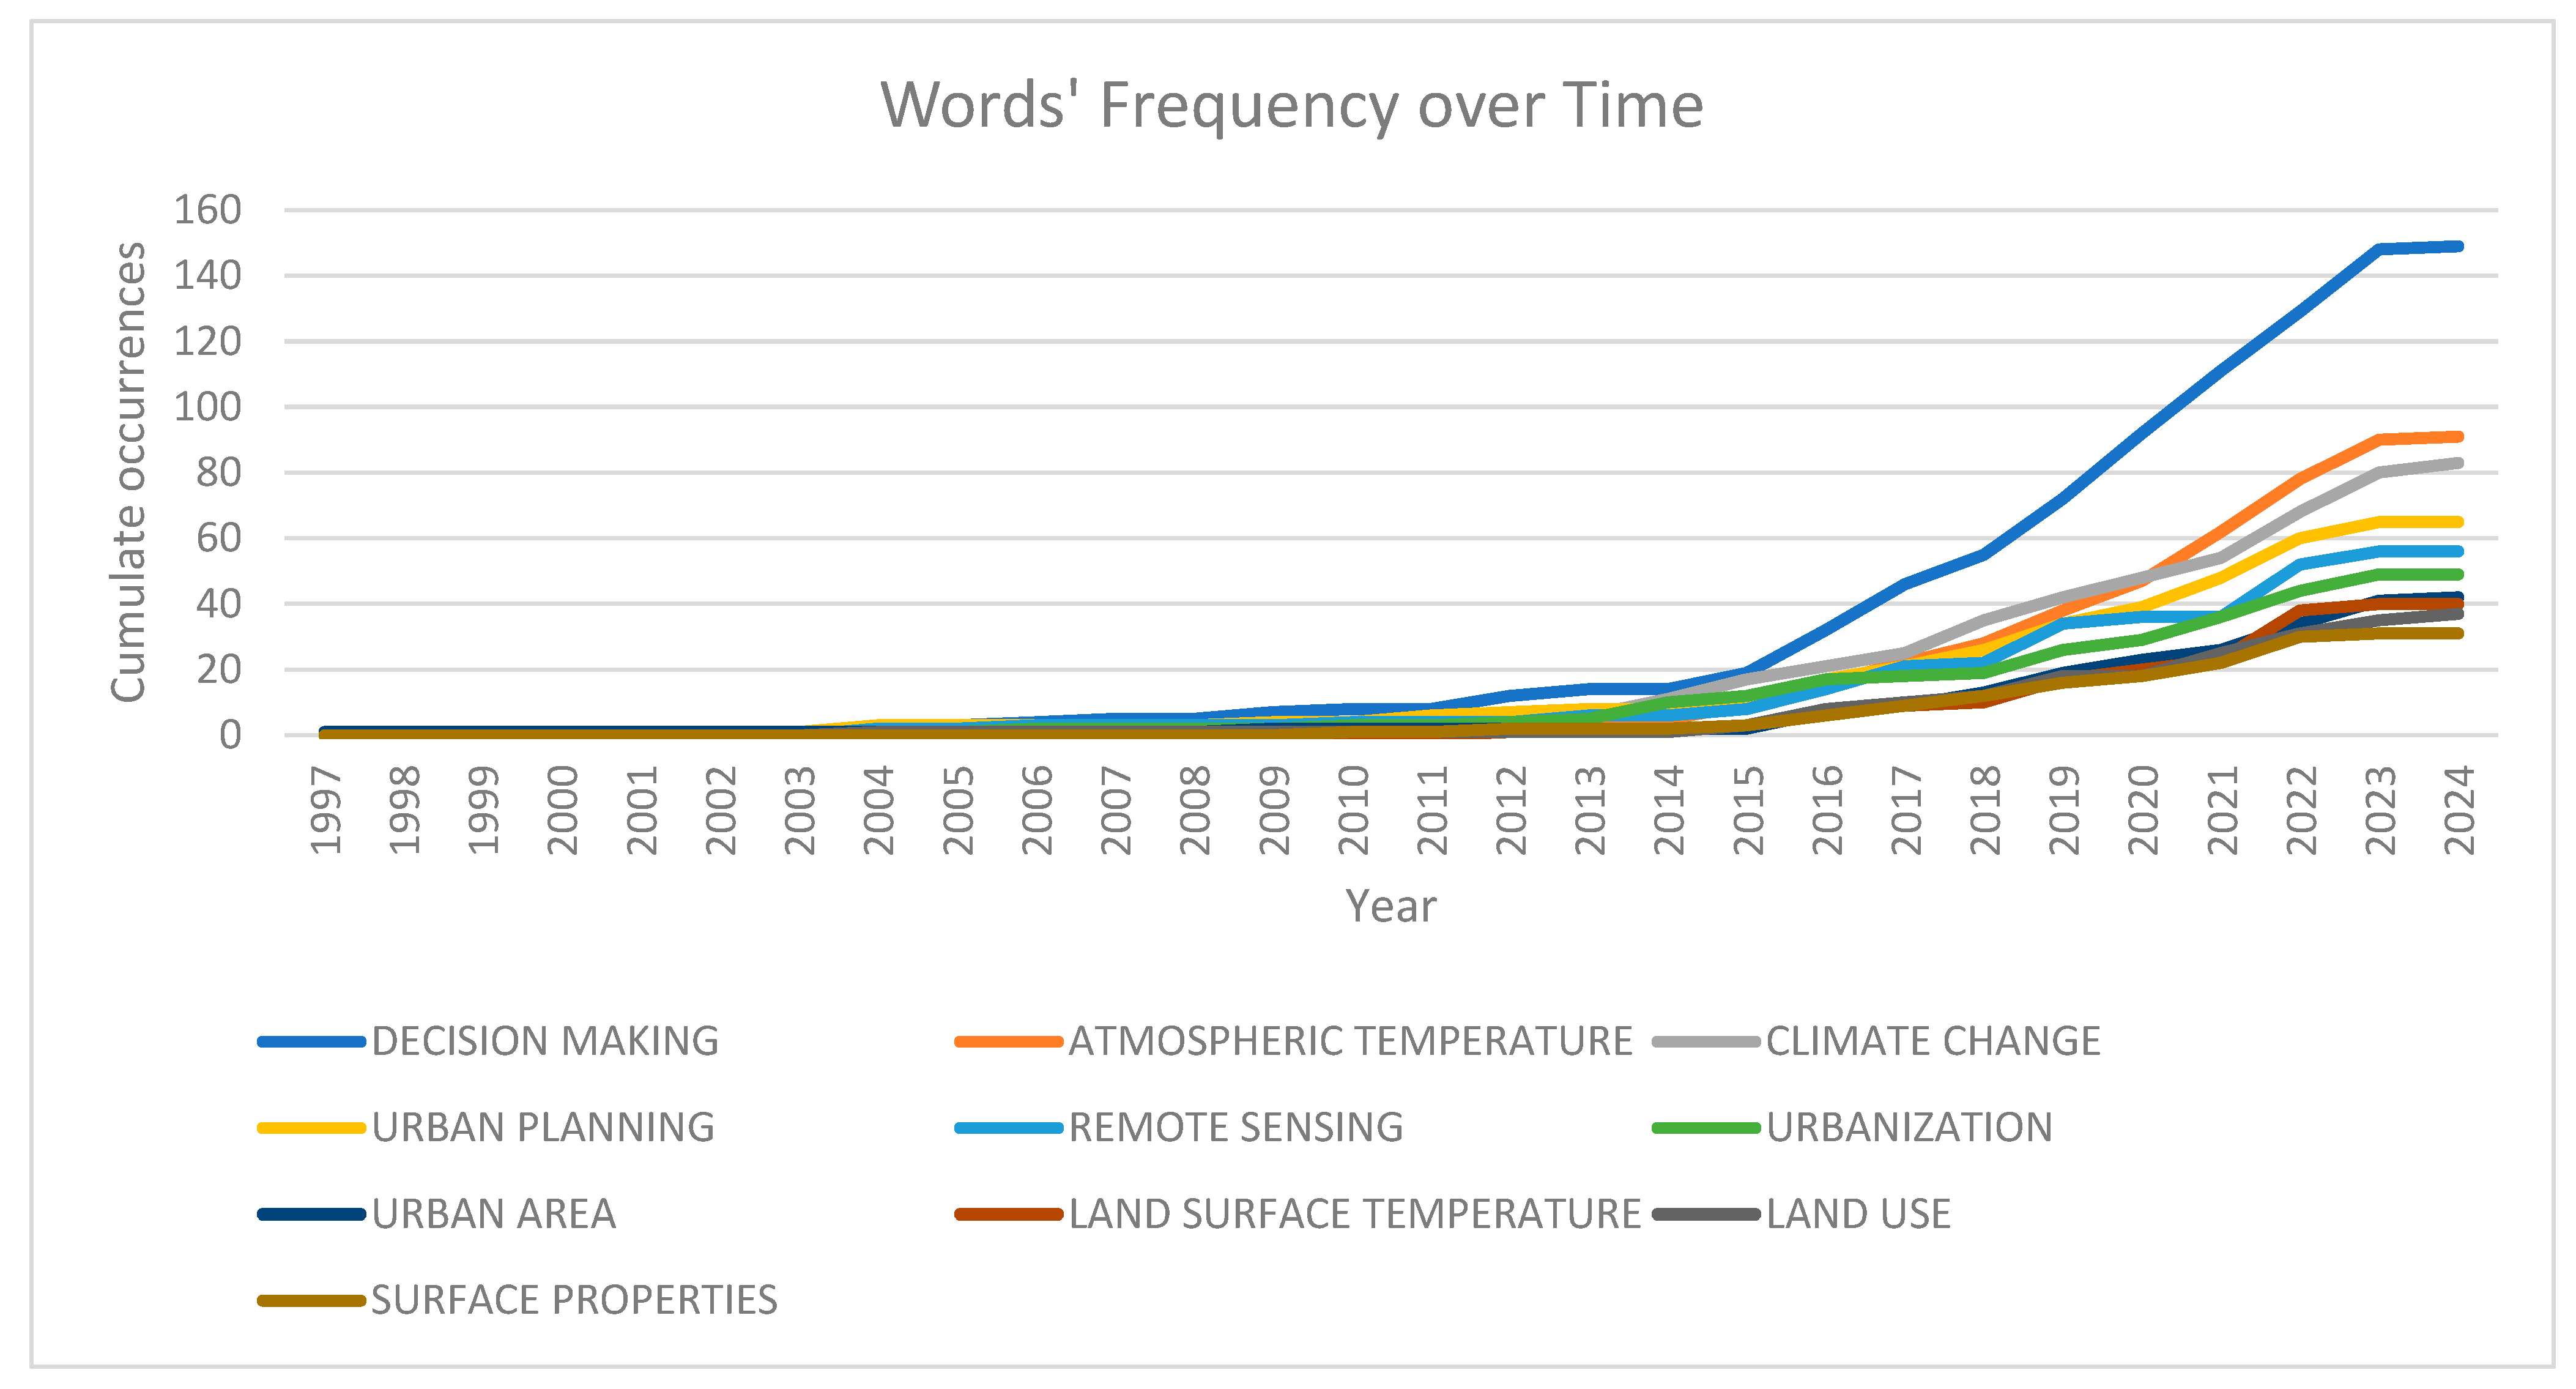
Figure 5 presents words’ frequency over time for the 10 most common keywords, plus words according to their cumulative occurrences. Similar to creating a word cloud, when creating this graph, the words “urban heat island”, “urban heat islands”, “urban heat island (UHI)”, “UHI”, “heat island”, and “China” were excluded from the set of words. It is interesting to note that the term “decision making” recorded the greatest growth.
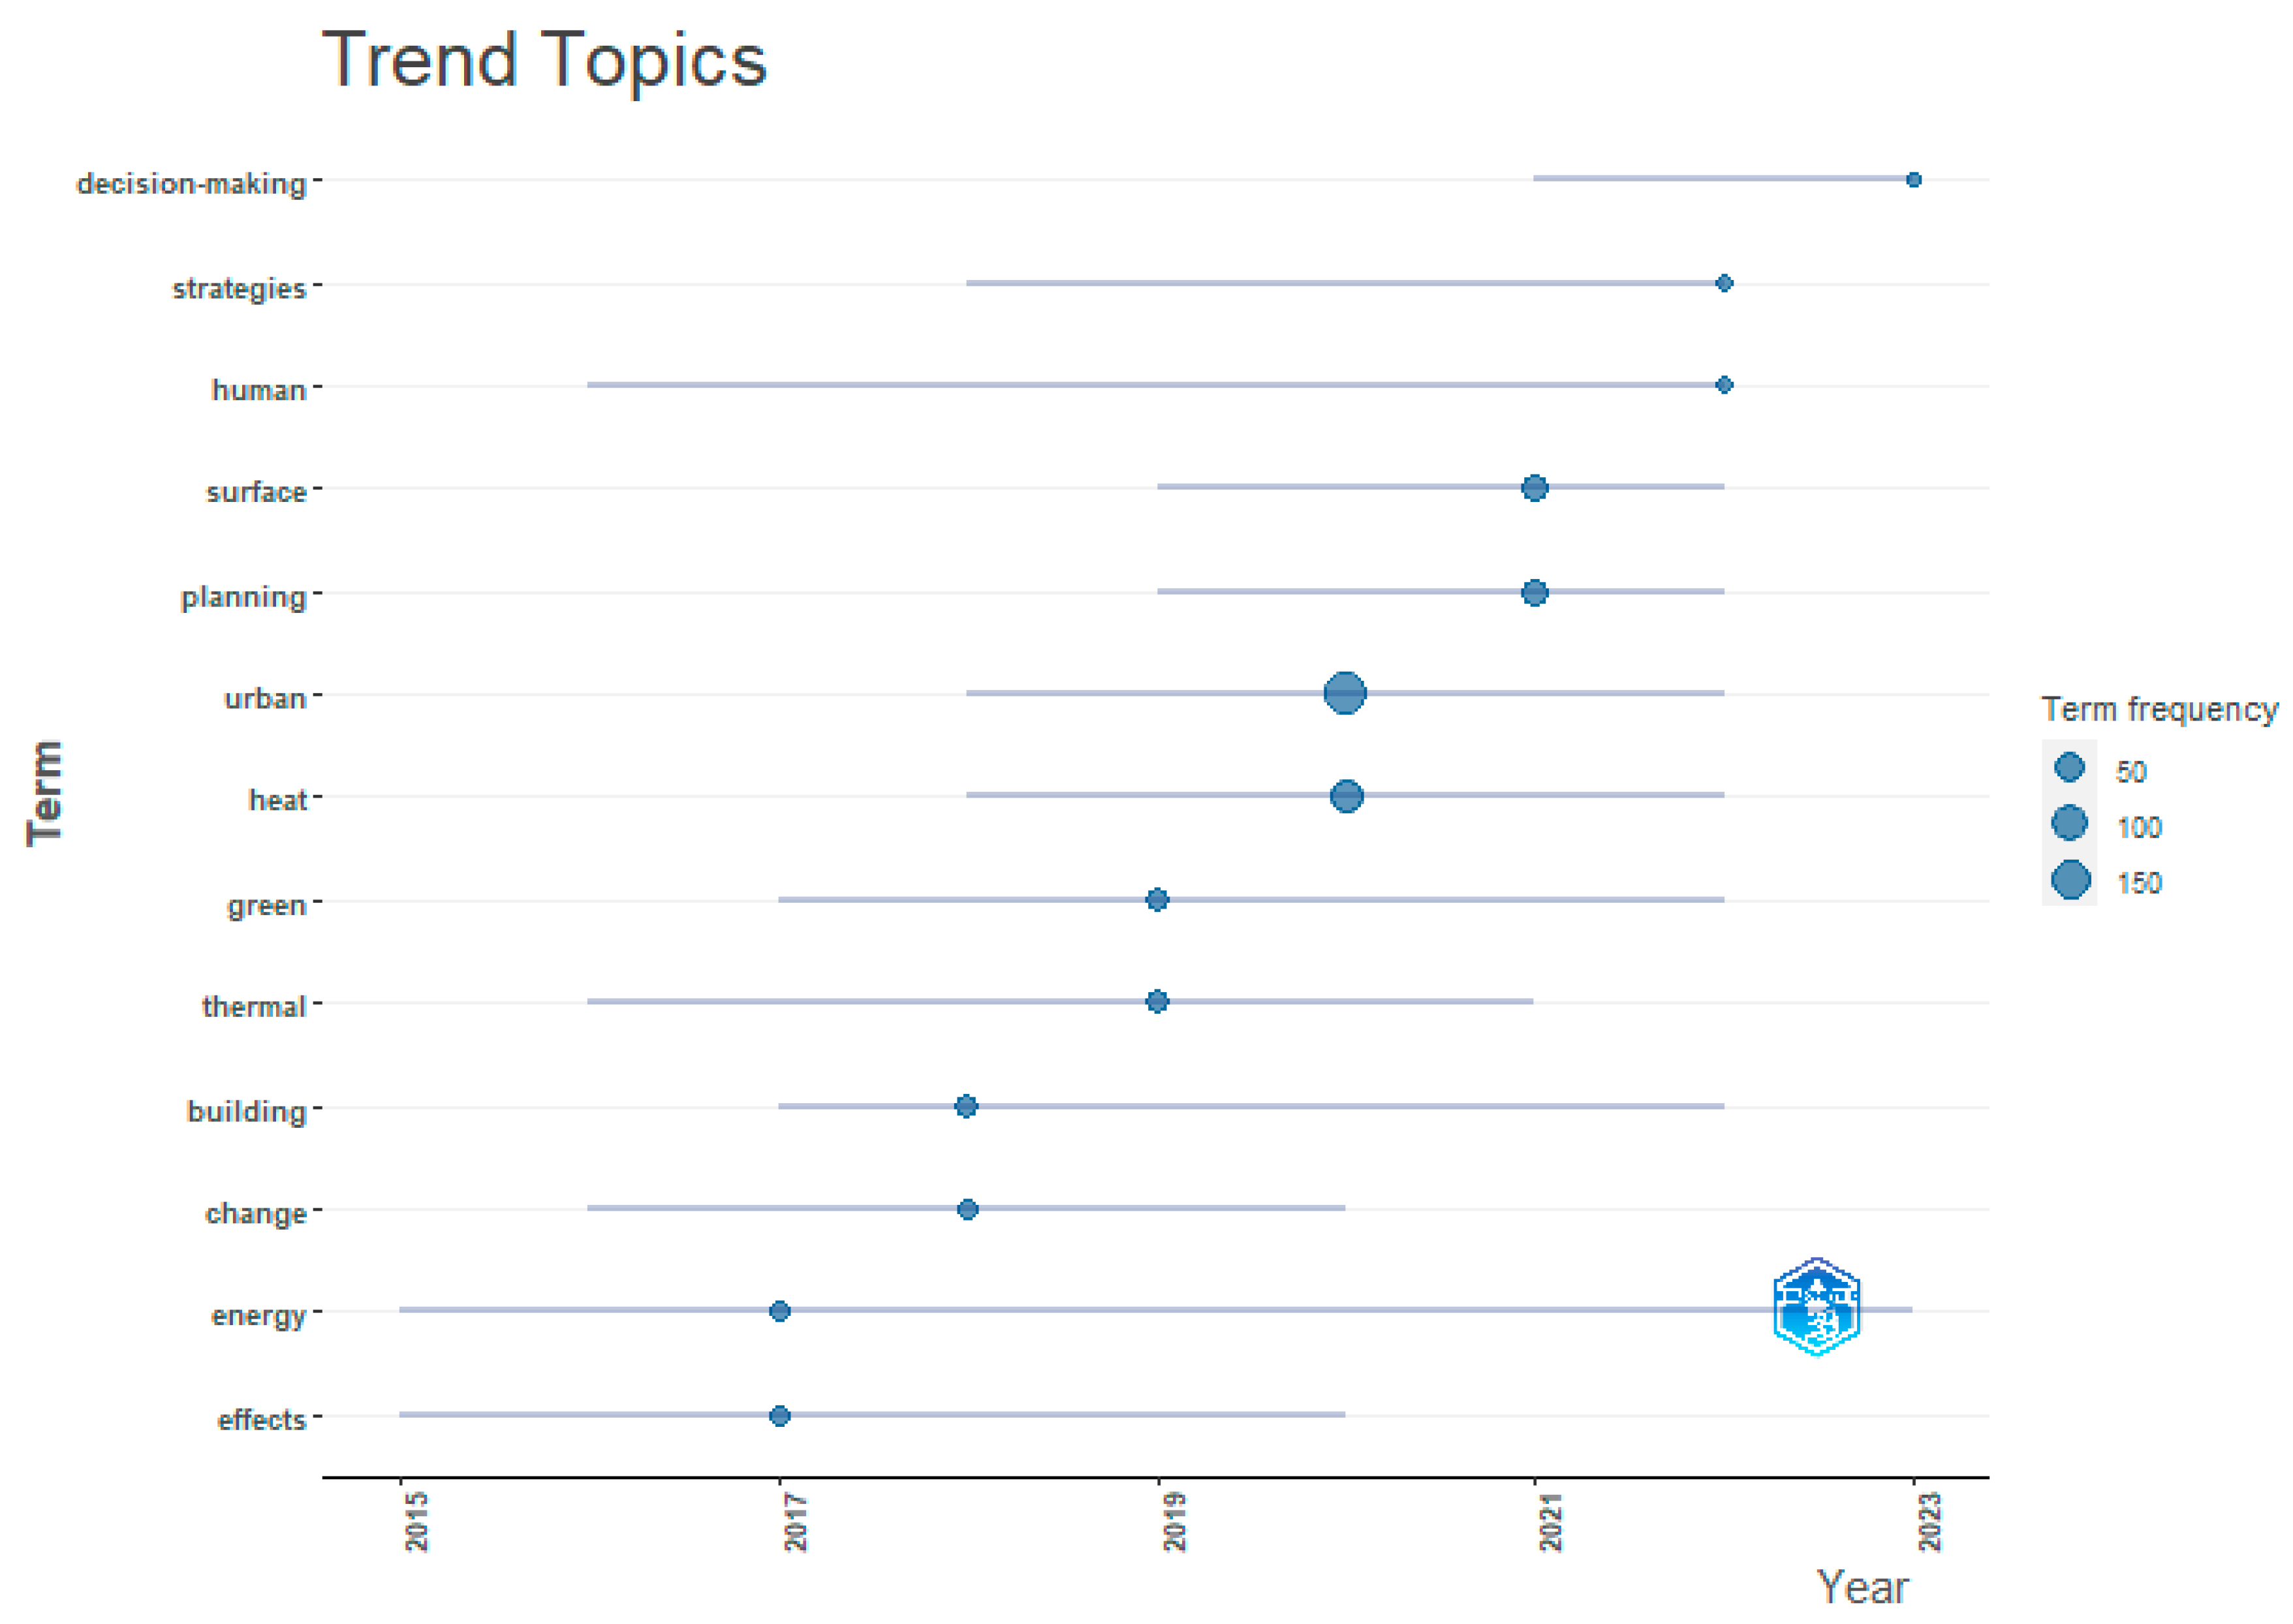
Figure 6 shows the development of the researched topic in the last 10 years, with regard to the keywords that appear most often in the titles of papers. When creating the graph, trivial words such as “research” and “study”, as well as geographical names such as “China”, “Germany”, “Arizona”, and “Hong Kong”, were excluded. The line presents the timeline of the appearance of each word, while the circle size presents the term frequency.
Figure 7 shows the co-occurrence network of the 50 most common keywords; the nodes represent the keywords, and their size is proportional to the number of occurrences of that word. The lines connecting the nodes show the co-occurrence of words, while the thickness of the line suggests the occurrence of that co-occurrence. Thus, it can be seen that the terms “urban heat island”, “decision making”, and “atmospheric temperature”, with the highest mutual co-occurrence, are particularly prominent. It can also be noticed that there are three thematic clusters that are shown in different colors and that these three terms are in the same cluster.
5. Discussion
The literature is thoroughly reviewed in Chapter 2, with a summary available in Table A1, in Appendix A. To systematically represent the reviewed literature, Table 1 includes information on authors, titles, year of publication, study location, methodology, and main findings. Three subchapters make up Chapter 2, as follows: the first reviews the use of remote sensing in UHI management; the second reviews multi-criteria decision-making and the application of fuzzy theory in UHI mitigation; and the third reviews Decision Support Systems and fuzzy logic in UHIs. Since remote sensing is the fundamental technique for identifying and analyzing AUHIs, the chapter on this subject has the highest number of cited articles. Among the literature, there are several articles that provide an overview of the literature related to the emergence of UHIs [65,67] or the UHI mitigation method [20], but the authors did not find an overview and analysis such as this one. From the analysis of UHI mitigation techniques, it can be concluded that the best results are obtained when vegetation is applied [101]. While some research has focused on specific UHI mitigation strategies, like green roofs [86,88], only a few studies have combined multiple strategies to obtain the best possible solution, because doing so might be complex and it is a field that requires further investigation.
The bibliometric analysis aimed to answer research questions related to the use of MCA methods, DSSs, and fuzzy theory in UHI management. Initially, it was intended that two parallel bibliometric analyses would be conducted, but only four papers were found for the second analysis, related to fuzzy theory, and, as a result, a unified bibliometric analysis was performed. Since each of these four papers was written by a different author and was published in a different journal, it is impossible to identify the author or journal that prevails. After the first two papers were published in 2012 and 2013, there was a big time gap, but it seems that fuzzy theory still finds its application in dealing with UHIs, since two more recent papers were published in 2019 and 2023. This sequence is very interesting; it shows that there are strongholds and also opens up a lot of space for future research.
An analysis of the papers retrieved from the Scopus database revealed that the use of these methods began relatively late, only in 1996; however, the annual scientific production on the use of MCA methods and DSSs for dealing with the UHI effect grows over time (Figure 2). As it can be seen from Figure 2, the number of published documents in the first few years varied around zero or slightly above zero, while, from 2011, it started to grow exponentially. The peak occurred in 2022, when a total of 39 documents were published. There is a decrease in 2023, as compared to 2022, but this may be because some of the 2023 papers were not available when the study was conducted. Given that the year 2023 was not yet over at the time of data collection, it remains to be seen whether the number of records will exceed 2022 or not, since the positive growth trend shows that more and more researchers are dealing with this topic.
Table 3 shows that the average age of the documents is 4.4 years, indicating how current the topic is. Moreover, it is evident from the graph displaying the words’ frequency over time (Figure 5), which displays the ten most common keywords, that the term “decision making” has grown the most over the past ten years. The co-occurrence network (Figure 7) shows that the terms “urban heat island”, “decision making”, and “atmospheric temperature” have the highest mutual co-occurrence. Among all the pictures and graphs that deal with the most common concepts, there is no fuzzy theory, which is expected, considering the number of papers.
With 11 published articles, “Science of the Total Environment” and “Sustainable Cities and Society” are the sources with the most published works (Table 4), while “Remote Sensing Applications: Society and Environment” and ”Building and Environment” are the sources with the most local citations (Table 5). As might be expected given the topic, the majority of the articles were published in journals that dealt with environmental issues and sustainability.
“Remote Sensing Applications: Society and Environment” is the journal with the highest number of local citations, totaling 207. It is interesting to note that this journal, even as the most cited one, is not at all on the list of sources with the most published papers. This fact might suggest that the few articles published in this journal are highly relevant and have received numerous citations. This could be the case due to the tight connection between remote sensing and UHI management. Remote sensing not only makes it possible to identify and track SUHIs spatially, but it also offers additional environmental and spatial analysis, which makes comprehensive UHI management easier. Spatial analysis and data visualization are made possible by the use of GIS tools in the processing of satellite images. According to [31], the potential drawback of remote sensing could be its temporal resolution; however, its primary benefit lies in the more effortless and cost-effective acquisition of data, in comparison to the field measurements.
6. Conclusions
This review paper provides an overview of the use of MCA methods and decision support systems when dealing with the UHI phenomenon, with special reference to the use of fuzzy theory. An extensive review of the literature, produced by research on UHI mitigation techniques, demonstrates that the methods listed above contribute to solving the problem and also prompted the writing of this paper. It was noted during that part of the study that MCA techniques and decision support systems have become more common in this field in recent years. In addition to confirming that the topic is up-to-date and that annual production is growing, the bibliometric analysis also revealed research trends in the area, as well as the most relevant authors and sources. However, it also revealed that the topic is not as well researched as it could be.
The contribution and innovation of this research is found in the analysis and detailed review of the literature on the use of MCA, DSSs, and fuzzy logic in UHI management, which has not been conducted in this way until now.
It is important to point out some limitations of this research. The research represents the static state of the literature and research at the time of writing the paper; but, as time goes on, there will certainly be some new knowledge and ways of using the discussed methods. Also, only records from the Scopus database were used in this bibliometric analysis. As a proposal for future research, records from several scientific databases should be integrated and analyzed.
This study demonstrated that the topic is current and evolving over time. Figure 4 shows that “urban planning” and “climate change adaptation” appear among the most frequent keywords, which shows that this problem is starting to be included in plans and strategies. The use of MCA methods and DSSs in UHI mitigation helps to take into account all factors, in order to achieve environmental sustainability goals. Only a few papers using fuzzy theory were found and the authors see this as an opportunity for improvement and for further research. Upon reviewing the literature, numerous works were discovered that address a specific measure or aspect of UHI mitigation, such as the application of green roofs and the selection of the most suitable one. A few studies have attempted to address this phenomenon by including more measures and combining them, as it is not an easy task. There were a few publications on fuzzy methodology and DSSs, but none on fuzzy DSS development. Given the complexity of the factors that influence the formation of UHIs, as well as the fact that there is no unified solution to this problem, other than the fact that mitigation techniques need to be combined, future research could go in the direction of forming a fuzzy DSS model and associated sub-models based on artificial intelligence and machine learning, in order to take all criteria into account and achieve improvement in UHI management. A city experiencing the UHI problem should be used to test such a model, and possible solutions could be compared to those used in other cities, similar as in [97].
Author Contributions
Conceptualization, M.Ć., K.R., J.K.P. and A.K.; methodology, M.Ć.; software, M.Ć.; validation, M.Ć.; formal analysis, M.Ć.; investigation, M.Ć.; resources, M.Ć.; data curation, M.Ć.; writing—original draft preparation, M.Ć.; writing—review and editing, M.Ć., K.R., J.K.P. and A.K.; visualization, M.Ć.; supervision, K.R., J.K.P. and A.K. All authors have read and agreed to the published version of the manuscript.
Funding
This research received no external funding.
Data Availability Statement
Not applicable.
Acknowledgments
This research is partially supported through the project KK.01.1.1.02.0027, a project co-financed by the Croatian Government and the European Union through the European. Regional Development Fund—the Competitiveness and Cohesion Operational Programme.
Conflicts of Interest
The authors declare no conflicts of interest.
Nomenclature
| AHP | Analytical Hierarchy Process | MACBETH | Measuring Attractiveness by a Categorical-Based Evaluation Technique |
| AUHI | Atmospheric Urban Heat Island | MCA | Multi-criteria analysis |
| DSS | Decision support system | MCDM | Multi-criteria decision-making |
| EFDM | Enhanced Fuzzy Delphi method | SUHI | Surface Urban Heat Island |
| GIS | Geographic information system | TOPSIS | The Order of Preference by Similarity to Ideal Solution |
| GR | Green roof | UHI | Urban Heat Island |
| LCZ | Local Climate Zones | UHII | Urban Heat Island intensity |
| LST | Land Surface Temperature | WOS | Web of Science |
| LULC | Land use/Land cover | WSM | Weighted Scoring method |
Appendix A

Table A1.
Summary of the studies reviewed (full table).
| Author(s) | Title | Year | Study Location | Methodology | Findings |
|---|---|---|---|---|---|
| Nuruzzaman, M. [20] | Urban heat island: causes, effects and mitigation measures-a review | 2015 | Not specified | Review of various measures to encounter UHI effect. | The most effective measures are green vegetation, high albedo materials, and pervious pavements. |
| Duplančić Leder, T. et al. [31] | Split Metropolitan area surface temperature assessment with remote sensing method | 2016 | Split, Croatia | Landsat thermal channels have been used to determine the LST. | Microclimate changes and severe changes in LST and UHI effects. |
| Amani-Beni, M. et al. [46] | Impact of urban park’s tree, grass and waterbody on microclimate in hot summer days: A case study of Olympic Park in Beijing, China | 2018 | Beijing, China | Observation of the greenery impact on the park during summer days. | The park was 0.48–1.12 °C cooler during the day; increased air humidity was observed at 2.39–3.74%; a reduced human comfort index was used to generate a more comfortable thermal environment. |
| Nwakaire, C. M. et al. [61] | Urban Heat Island Studies with emphasis on urban pavements: A review | 2020 | Not specified | Literature review of UHIs, with emphasis on urban pavements. | One of the main findings included using creative designs that can provide cooling without compromising the structural integrity of the pavement, which is a key component of effective UHI mitigation techniques for highway pavements. |
| Kim, S. W. et al. [65] | Urban heat island (UHI) intensity and magnitude estimations: A systematic literature review | 2021 | Not specified | Literature review of 51 study dealing with UHI intensity and magnitude estimation. | The current UHI energy models for calculating UHIs must be updated to take into account the city’s three-dimensional physical layout. The literature review demonstrates that UHI research requires the development of an optimal analysis method. |
| Almeida, C. R.d. et al. [66] | Study of the Urban Heat Island (UHI) Using Remote Sensing Data/Techniques: A Systematic Review | 2021 | Not specified | Literature review of publications in Scopus and Web of Science on UHI analysis using RS data/techniques and LST, from 2000 to 2020. | The Northern Hemisphere concentrates the majority of studied areas, particularly in Asia (69.94%), so Cfa climate areas are the most represented. Landsat products were most frequently used to estimate LST (68.39%) and LULC (55.96%); ArcGIS (30.74%) was the most frequently used software for data treatment; and correlation (38.69%) was the most frequently applied statistical technique. |
| Deilami, K. et al. [67] | Urban heat island effect: A systematic review of spatio-temporal factors, data, methods, and mitigation measures | 2018 | Not specified | Literature review of different spatial and temporal factors affecting the UHI effect. | Ordinary least square regression is the most widely used method (68%) to investigate the relationship between different spatio-temporal factors and the UHI effect, followed by comparative analysis (33%). The most common factors affecting the UHI effect, as reported in the reviewed studies, are vegetation cover (44%), season (33%), built-up area (28%), day/night (25%), population density (14%), and water body (12%), among others. In total, 54% of the studies used Landsat TM images for modeling the UHI effect, followed by Landsat ETM (34%) and MODIS (28%). |
| Nimac, I. et al. [68] | The contribution of urbanisation and climate conditions to increased urban heat load in Zagreb (Croatia) since the 1960s | 2022 | Zagreb, Croatia | Two land use/land cover (LULC) scenarios are examined, together with the appropriate climate conditions, using modeling techniques. | The findings show that, with an average increase in summer days of 35 days, climate change has a major impact on the change in total heat load (88%). Changes in LULC have less of an effect (12%), but they have a significant impact on the spatial variability of the heat load. |
| Chen, Y. et al. [60] | Numerical simulation of local climate zone cooling achieved through modification of trees, albedo and green roofs—a case study of Changsha | 2020 | Changsha, China | Through the integration of in situ measurements and ENVI-met numerical simulations, it constructed and modeled 39 scenarios and analyzed the cooling impacts of different cooling factor combinations. | The findings demonstrate that, in three LCZs, an increased albedo and more trees are more effective than green roofs at lowering summer potential temperatures at street level (2 m high); the effects of cooling factors differ depending on the LCZ class, with an increase of 60% in trees resulting in lower outdoor temperatures; the application of combined cooling methods can cause an increase in air temperature (up to 0.96 ◦C). |
| Duplančić Leder, T. et al. [69] | Land Surface Temperature Determination in the Town of Mostar Area | 2018 | Mostar, Bosnia and Hercegovina | The atmospheric corrections and LST were calculated using accessible meteorological data and Landsat 5, 7, and 8 satellite images. | Mostar is a town where the maximum land surface temperatures can be expected, since it has LST values of more than 50 °C, which are documented in this study. |
| Duplančić Leder, T. and Bačić, S. [70] | The influence of local climate zones on the thermal characteristics of the city of Split | 2021 | Split, Croatia | Local climatic zoning (LCZ) and its occurrence with the zones of the highest urban temperatures are applied. | Water surfaces and greenery reduce the intensity of UHIs. |
| Estacio, I. et al. [71] | GIS-based mapping of local climate zones using fuzzy logic and cellular automata | 2019 | Quezon City, Philippines | Automated GIS-based methodology for determining LCZs and Landsat 8 were used. The membership percentage of 100 m cells to an LCZ type was determined using fuzzy logic. To extract the LCZ map from the fuzzy layers, cellular automata were used. | The findings indicate that five out of seven land cover LCZs and seven out of ten built-up LCZs were detected. Every LCZ type had temperatures that matched those reported in the literature, according to LST data obtained from Landsat 8. |
| Bokaie, M. et al. [72] | Hosseini, A. Assessment of urban heat island based on the relationship between land surface temperature and land use/land cover in Tehran | 2016 | Tehran, Iran | The relationship between LST and LULC was studied using Landsat TM satellite images. Vegetation and greenery in different areas were studied using the normalized vegetation index (NDVI), using remotely sensed data. | The findings demonstrated that the causal agent of the UHIs produced in Tehran is distinct. This discrepancy illustrates the strong correlation between land surface temperature and land cover and is mostly caused by the state of LULC in the area. |
| Jiménez-Muñoz, J. C. and Sobrino, J. A. [73] | A generalized single-channel method for retrieving land surface temperature from remote sensing data | 2003 | Not specified | A single-channel algorithm is developed that can be applied to different sensors onboard a satellite to estimate LST. | The thermal channels with effective wavelengths close to 11 μm yield the greatest findings; for AVHRR-4, ATSR2-11, and TM-6, root mean square deviation values of 1.6 K, 2 K, and 1.3 K have been found. For AVHRR-5 and ASTR2-12, thermal channels with an effective wavelength close to 12 μm yield an inferior performance, with root mean square deviation values greater than 2 K. |
| Feizizadeh, B. and Blaschke, T. [74] | Examining urban heat island relations to land use and air pollution: Multiple endmember spectral mixture analysis for thermal remote sensing | 2013 | Tabriz, Iran | Spectral Mixture Analysis and Endmember Remote Sensing Indices are combined to calculate LST, detect UHIs, and look into the connections between UHI, LULC, and air pollution. | The findings show that LULC has a significant impact on LST and that LST and LULC are intimately related to UHIs. |
| Zhu, W. et al. [75] | How to measure the urban park cooling island? A perspective of absolute and relative indicators using remote sensing and buffer analysis | 2021 | Jinan, China | The land cover of parks was determined using high-spatial-resolution GF-2 pictures, and the thermal environment was examined using buffer analysis on Landsat 8 TIR photos. To investigate the connections between the park cooling island and park attributes, linear statistical models were created. | The average park cooling area was roughly 120.68 ha and the average land surface temperature (LST) of urban parks was found to be around 3.6 °C lower than that of the study area. The biggest temperature differential, of 7.84 °C, occurred during summer daylight. |
| Firozjaei, M.K. et al. [76] | Land Surface Ecological Status Composition Index (LSESCI): A novel remote sensing-based technique for modeling land surface ecological status | 2021 | 14 test sites | The Landsat multi-temporal imagery, National Land Cover Database (NLCD), and Imperviousness and High Resolution Layer Imperviousness (HRLI) datasets were used. Improved Ridd’s conceptual Vegetation–Impervious–Soil triangle model was used. Combination of the Biophysical Composition Index (BCI) information and LST was applied. | Over the past 20 years, the mean values of the Remote Sensing-based Ecological Index (RSEI) and Land Surface Ecological Status Composition Index (LSESCI) have grown, which is indicative of the detrimental effects of Anthropogenic Destructive Activities (ADAs) on the ecosystem. Nevertheless, there was a considerable difference in the modeling findings of LSES derived from the RSEI and LSESCI. The LSESCI showed a stronger association with the moisture, dryness, heat, and greenness indices than with the RSEI. |
| Zhang, Z. et al. [77] | Evaluating Natural Ecological Land Change in Function-Oriented Planning Regions Using the National Land Use Survey Data from 2009 to 2018 in China | 2021 | China | Natural ecological land types were classified into forest, grassland, wetland, and bare land using land use data from the National Land Use Survey from 2009 to 2018. The changes in natural ecological land types in the major function-oriented zones between 2009 and 2018 were then discussed. | Between 2009 and 2018, there was a general downward tendency in the amount of natural ecological lands. However, this trend was reversed after 2015, when regulations for environmental conservation and ecological projects were put into place. |
| Zhang, T. et al. [78] | Assessing the Urban Eco-Environmental Quality by the Remote-Sensing Ecological Index: Application to Tianjin, North China | 2021 | Tianjin, China | Methodology for the new RSEI is proposed. | The case study’s findings demonstrate that seasonal variability affects both the contributions of RSEI indicators to eco-environment quality and RSEI values. To account for this seasonal variability, differentiating the normalization of indicator measures and utilizing more representative remote-sensing images should be used. |
| Jiang, Y. and Lin, W. [79] | A Comparative Analysis of Retrieval Algorithms of Land Surface Temperature from Landsat-8 Data: A Case Study of Shanghai, China | 2021 | Shanghai, China | A variety of algorithms, including the Radiative Transfer Equation (RTE), Mono-Window Algorithm (MWA), Split-Window Algorithm (SWA), and Single-Channel Algorithm (SCA), have been developed for the purpose of extracting LST from satellite imagery. | The outcomes demonstrated that all four algorithms were capable of recovering LST with reasonable success and that the LST retrieval outcomes were largely constant throughout a given spatial scale. The SWA is better suited for recovering LST in Shanghai in the summer, when the city experiences extremely high humidity and temperatures. |
| Peng, T. et al. [80] | Temporal and Spatial Variation of Anthropogenic Heat in the Central Urban Area: A Case Study of Guangzhou, China | 2021 | Guangzhou, China | Using Landsat data and the surface energy balance equation, the urban anthropogenic heat flux (AHF) in the central Guangzhou urban area in 2004, 2009, 2014, and 2020 was retrieved. The temporal and spatial characteristics of various anthropogenic heat types were investigated by combining the transfer matrix and the migration of the gravity center. | The findings show that, while different types of anthropogenic heat had different characteristics in terms of area expansion and spatial changes, the overall change trend of anthropogenic heat in Guangzhou’s central urban area was enhanced, with the degree of enhancement being related to the type of urban functional land. |
| You, M. et al. [81] | Quantitative analysis of a spatial distribution and driving factors of the urban heat island effect: a case study of Fuzhou central area, China | 2021 | Fuzhou, China | The application of Moran’s I and hot-spot analysis helped to clarify the geographical pattern of UHI in the center area of Fuzhou, China. | According to the findings, the LST displayed a gradient layer structure with low temperatures in the northwest and high temperatures in the southeast that was significantly correlated with industrial zones. Moreover, soil moisture (impact = 0.792) > NDBI (influence = 0.732) > MNDWI (influence = 0.618) > NDVI (influence = 0.604) were the four parameters that had the biggest influence (q-Value) on LST. |
| Despini, F. et al. [82] | Urban surfaces analysis with remote sensing data for the evaluation of UHI mitigation scenarios | 2021 | Modena, Italy | The Worldview3 sensor (WV3) collected satellite photos, which were then processed to identify the various types of urban surfaces and to determine each surface’s albedo value. | The five scenarios that comprised the mitigation interventions assumed the replacement or retrofitting of specific urban surfaces, such as parking lots, rooftops, and roadways, with materials that reflect solar radiation. From the standpoint of public administration, scenarios 4 and 5 were shown to be the most favorable, with advantages for the general welfare of the populace. |
| Santos, L. G. et al. [83] | Climate-informed decision-making for urban design: Assessing the impact of urban morphology on urban heat island | 2021 | Singapore | A novel framework for urban design that takes climate change into account is carried out. With the help of this framework, various options can be impartially examined, in order to assess various scenarios. It offers a foundation for doing so. The Data Processing Unit (DPU), the Climate Model, and the Analysis are the three primary components of the framework. | The outcome is a matrix of scores for each scenario that shows which design performs greatest on predetermined measures. The scenarios that include the tallest buildings (81 m) and either a medium (40%) or low (30%) density provide a good compromise between the external trade-offs associated with the environmental effect and the number of people assigned to each site area, as well as the energy costs associated with running the district. |
| Amani-Beni, M. et al. [84] | Impacts of urban green landscape patterns on land surface temperature: Evidence from the adjacent area of Olympic Forest Park of Beijing, China | 2019 | Beijing, China | This study investigates the connection between the surrounding areas’ cooling effect and urban greening trends. | According to the findings, waterbodies and forests might decrease temperatures by 12.82% and 6.51%, respectively, below those of the impermeable surface. |
| Pritipadmaja, Garg, R. D. and Sharma, A. K. [85] | Assessing the cooling effect of blue-green spaces: implications for Urban Heat Island mitigation | 2023 | Bhubaneswar, India | Google Earth Engine (GEE) was used to interpret satellite photos and generate LST data for the blue–green spaces. The presence and features of these blue–green regions were measured using the Normalized Difference Vegetation Index (NDVI) and the Modified Normalized Difference Water Index (MNDWI). | Significant geographical variations in the LST were found, with lower temperatures in the blue–green spaces and higher temperatures in built-up and bare land areas. Furthermore, a correlation study demonstrated the built-up index’s (NDBI) significant influence on the LST, highlighting the effect of urbanization on regional climate dynamics. |
| Dong, J. et al. [86] | Quantitative study on the cooling effect of green roofs in a high-density urban Area—A case study of Xiamen, China | 2020 | Xiamen Island, China | Using Landsat 8 remote sensing images from the summers of 2014 and 2017, the relative difference between the average land surface temperature (LST) of Xiamen Island and the green roofs was estimated in geographic information systems (GISs), to illustrate the cooling effect of the green roof project. | Results showed that the average LST difference between green roofs and Xiamen Island decreased by 0.91 °C, indicating that green roofs could effectively alleviate UHI effects in high-density urban areas; the cooling effect was significant up to 100 m from the green roof installation in Xiamen Island, known as the characteristic cooling buffer zone; regression analysis revealed that for every 1000 m2 increase in green roof area, the average LST of the roof and its characteristic cooling buffer zone decreased by 0.4 °C. |
| Imran, H. M. et al. [87] | Effectiveness of green and cool roofs in mitigating urban heat island effects during a heatwave event in the city of Melbourne in southeast Australia | 2018 | Melbourne, Australia | The non-hydrostatic regional climate models (RCMs) model employed in this study is called WRFv3.8.1 and it has been used extensively in studies on urban meteorology. | As a result of raising the green roof fractions from 30% to 90% and the cool roof albedo from 0.50 to 0.85, the maximum roof surface UHI is lowered by 1 °C to 3.8 °C and 2.2 °C to 5.2 °C during the day, according to the results. Cool roofs can reduce UHIs by up to 1.4 °C, making them more effective than green roofs, in this regard. |
| Sanchez, L. and Reames, T. G. [88] | Cooling Detroit: A socio-spatial analysis of equity in green roofs as an urban heat island mitigation strategy | 2019 | Detroit, USA | The most vulnerable places for the ecosystem services provided by green roofs, as well as the demographic makeup of the populations that make up these regions, were identified using spatial data on land surface temperature, income, and race. | The majority of low-income residents are within walking distance of cooling centers, but are not included in the Detroit Future City Urban Green Neighborhoods, according to an analysis of the study’s spatial data; in contrast, green roofs were found in the wealthy, primarily white area of Detroit’s urban core. |
| Gagliano, A. et al. [89] | A multi-criteria methodology for comparing the energy and environmental behavior of cool, green and traditional roofs | 2015 | Mediterranean | Three types of roofs are compared numerically in terms of their energy and environmental performance—standard roofs (SRs), cool roofs (CRs), and green roofs (GRs). | Consequently, it is discovered that cool and green roofs offer greater environmental and energy savings than typical, heavily insulated roofs. For instance, under the usual Mediterranean climate, green roofs with minimal insulation performed the best in terms of mitigating UHIs. |
| Gunawardena, K. R. et al. [90] | Utilising green and bluespace to mitigate urban heat island intensity | 2017 | London, UK | This research offers a meta-analysis of the main influences that green space and blueprint have on the temperatures of the urban canopy and boundary layer, as viewed from the angles of urban climatology, city planning, and climate science. | This research indicates that tree-dominated greenspace provides the greatest heat stress alleviation when it is most needed and that the evapotranspiration-based cooling influence of both green and blue space is primarily significant for urban canopy layer circumstances. |
| Guo, G. et al. [91] | Complex mechanisms linking land surface temperature to greenspace spatial patterns: Evidence from four southeastern Chinese cities | 2019 | Guangzhou, Foshan, Dongguan, and Shenzhen, China | Greenspace data were taken from 0.5 m resolution photos and LST was estimated using Landsat 5/8 summer and winter images. | The findings showed that LST is systematically impacted by the spatial composition and layout of greenspace. The size and importance of these associations, however, differed greatly. Particularly during the summer, the combined contributions of the greenspace landscape measures were more important in determining LST than their individual contributions. |
| He, X. et al. [92] | Observational and modeling study of interactions between urban heat island and heatwave in Beijing | 2020 | Beijing, China | The Advanced Research version WRF (ARW) model is used in conjunction with a multilayer urban canopy model (Building Environment Parameterization, or BEP) and a sub-model for indoor–outdoor heat exchange (Building Energy Model, or BEM) to simulate the spatiotemporal variations of UHIs over the course of a heatwave period. | The findings indicated that higher surface evapotranspiration differences between urban and rural areas are the primary source of heatwave-related urban heat island augmentation during the day; whereas, increased anthropogenic heat and improved warm advection are the primary causes of this enhancement at night. |
| Semenzato, P. and Bortolini, L. [93] | Urban Heat Island Mitigation and Urban Green Spaces: Testing a Model in the City of Padova (Italy) | 2023 | Padova, Italy | At a height of two meters above the ground, temporal trends, variations in air temperature, and their spatial distribution were all simulated using the i-Tree Cool Air model. The model is a component of the USDA Forest Service’s i-Tree Hydro+ software suite, which consists of process-based environmental models. | The findings indicate that there are temperature variations between green spaces shaded by trees and urban open places with impermeable cover (streets and squares) of up to nearly 10 °C. In metropolitan areas with sealed surfaces, the simulated night time air temperature is 4.4 °C higher than the reference station readings, although it is only marginally colder in areas with tree cover. |
| Zheng, T. et al. [94] | A Novel Urban Heat Island Mitigation Strategies-Engaged City Scale Building Energy Consumption Prediction Workflow: Case Study and Validation | 2022 | Osaka, Japan | The urban weather generating workflow, 3D urban model, data-driven modeling, urban energy consumption modeling, and simulation outcome comprise the five steps of this workflow. | According to the findings, the cool pavement approach is the best one, since it minimizes the rise in heating energy use (4.86%), maximizes the reduction in total urban operational energy use (0.29%), and is insensitive to the embodied energy and CO2 emissions of buildings. It also maximizes the reduction in cooling energy use (2.57%). Therefore, increasing the pavement’s albedo, or “cool pavement”, is the best way to reduce urban heat island effects in Osaka city. |
| Sangkakool, T. et al. [95] | Prospects of green roofs in urban Thailand–a multi-criteria decision analysis | 2018 | Thailand | This paper deals with identifying and quantifying the key factors that influence green roof adoption in Thailand, which was achieved through a combination of SWOT analysis and AHP. | The key factors were quantified and it was concluded that builders, architects, and planners should be further educated and encouraged to utilize green roofs, since specific technical knowledge is not yet widespread. |
| Qi, J. et al. [96] | A decision-making framework to support urban heat mitigation by local governments | 2022 | Not specified | A combination of the best UHI mitigation strategies for the urban context is selected using ontology-based knowledge, sensitivity analysis, and genetic algorithm-based multi-objective optimization. | The paper presents a novel framework that enables automated decision-making for choosing optimal combination of UHI mitigation strategies, using AI. |
| Sangiorgio, V. et al. [97] | Comparative Analysis and Mitigation Strategy for the Urban Heat Island Intensity in Bari (Italy) and in Other Six European Cities | 2022 | Bari (Italy) and in another six European cities | Using the recently developed index-based approach, Iuhii, this paper assesses the absolute maximum UHI intensity in Bari and suggests various mitigation strategies. Secondly, comparative evaluation of seven European cities is given. | The Bari districts most vulnerable to high intensity UHI levels were identified. Good examples of reducing the phenomenon in other cities are found through comparative analyses. For a city in Puglia, practical mitigation scenarios are put forth for the first time. |
| Temizkan, S. and Kayili, M. T. [98] | Investigation of proper material selection for rainwater harvesting in squares having higher urban heat island effect potential: KBU Social Life Center example | 2021 | Turkey (Demir Çelik Campus) | Finding the best cover designs that encourage green spaces and reduce heat island effects was the aim of the project. The PROMETHEE method was utilized to identify a material that is significantly optimal for use in the cover. | This study suggested a top cover to mitigate the effects of the heat island that was observed in the KBU Social Life Center Square, which can be described as a large heat island on campus, and to collect rainwater over a large area of the square. |
| Qureshi, A. M. and Rachid, A. [99] | Comparative Analysis of Multi-Criteria Decision-Making Techniques for Outdoor Heat Stress Mitigation | 2022 | Not specified | Eight MCDM approaches were compared in order to determine which measurements would be best for mitigating urban heat under particular conditions. The models were used with weighting criteria that came from the direct weighting method and the AHP. | The outcomes demonstrate that for every normalization technique, WSM and PROMETHEE produced dependable and consistent results. The frequency of consistent ranking was enhanced by the combination of AHP and applied MCDMs, with the exception of ELECTRE-NS. |
| Teixeira, D. C. F. and Amorim, M. C. D. C. T. [100] | Multicriteria Spatial Modeling: Methodological Contribution to the Analysis of Atmospheric and Surface Heat Islands in Presidente Prudente, Brazil | 2022 | Presidente Prudente, Brazil | In order to analyze AUHIs, researchers combine spatial data from a multi-criteria model, based on multiple linear regression, with air temperature data, including relief and land use. The surface temperature (Landsat) is compared to the estimated and measured air temperatures. | The study demonstrates that vegetation lowers atmospheric temperatures, but urban surface materials are the primary energy sources influencing heat transfer. Precise mappings such as the one proposed is important for decision-making and planning measures. |
| Turhan, C. et al. [101] | An Integrated Decision-Making Framework for Mitigating the Impact of Urban Heat Islands on Energy Consumption and Thermal Comfort of Residential Buildings | 2023 | Vilayetler Evi Zone (VEZ) in Izmir/Turkey | Research proposes an integrated framework that combines hybrid microclimates and building energy performance simulations (in order to investigate four different strategies for UHI mitigation) with MCDM. | The findings demonstrated that, of all the mitigation strategies, the application of vegetation—such as green roofs and replacing existing trees with ones with a high leaf area density—ranks highest. |
| Tabatabaee, S. et al. [102] | An assessment model of benefits, opportunities, costs, and risks of green roof installation: A multi criteria decision making approach | 2019 | Malaysia | This paper proposed a framework for evaluating the key benefits, opportunities, costs, and risks of GR installation and their mutual dependence, using EFDM and the fuzzy-DEMATEL method. | Among the identified benefits, opportunities, costs, and risks, storm water management, contribution to mitigation of urban heat islands, additional structural support, and irregular maintenance were identified as being the most influential. It was also demonstrated that, in order to fully benefit from GR installation, the most influential benefits and opportunities should receive the majority of attention rather than the most important. |
| Sturiale, L. and Scuderi, A. [103] | The role of green infrastructures in urban planning for climate change adaptation | 2019 | Catanya, Italy | This framework integrates participatory planning with social multi-criteria evaluation framework for assessing how the public views urban green spaces from a social perspective. | This study demonstrates an intriguing possibility for the broader application of Multi-Critical Social Assessment in green space governance, due to its capacity to incorporate ecological, social, and economic values. |
| Rosasco, P. and Perini, K. [104] | Selection of (green) roof systems: A sustainability-based multi-criteria analysis | 2019 | Not specified | This paper uses a sustainability-based multi-criteria analysis to compare a traditional solution with a greening system, in order to investigate the factors that influence choice of the building roof systems. | When choosing between a green roof and a traditional roof, performance, thermal insulation qualities, roof protection, and system weight are the most important factors to consider. |
| Rosenzweig, C. et al. [106] | Mitigating New York City’s Heat Island with Urban Forestry, Living Roofs, and Light Surfaces | 2006 | New York, USA | This study compares observed meteorological, satellite, and GIS data with a regional climate model (MM5) to assess how various mitigation strategies affect surface and near-surface air temperatures in New York. | The study’s findings indicate that there is a significant amount of variation in the mitigation strategies’ effects amongst scenarios, case study locations, and heatwave days and that the application of these strategies needs to be adapted to the local conditions. |
| Rabbani, G. et al. [107] | Multi-criteria modeling for land suitability evaluation of the urban greenbelts in Iran | 2021 | Iran | This study proposes multi-criteria spatial modeling for a land suitability evaluation of the urban greenbelt in 25 major cities of Iran. | The rise in the environmental change index values over time suggests that new, appropriate urban green belt plans with updated regulations and best practices are required to stop the degradation of urban land use. |
| Mushtaha, E. et al. [108] | A study of the impact of major Urban Heat Island factors in a hot climate courtyard: The case of the University of Sharjah, UAE | 2021 | University of Sharjah, UAE | The Analytical Hierarchy Process (AHP) was used to rank the UHI factors. ENVI-met (4.4.2.) simulation software was used to test and evaluate each factor. | Air movement is the most effective element in the environmental category, according to the data, with a value of 0.283, while urban greenery is the most effective factor in the urban category, with a recorded value of 0.317. |
| Moradi, B. et al. [109] | A scenario-based spatial multi-criteria decision-making system for urban environment quality assessment: case study of Tehran | 2023 | Tehran, Iran | The AHP method was used to determine the weight of the effective criteria. The approach known as ordered weighted averaging (OWA) was then applied. | The study’s findings demonstrated that a sizable portion of the local populace lives under unacceptable UEQ settings, highlighting the need to improve the situation. |
| Meerow, S. and Newell, J. P. [110] | Spatial planning for multifunctional green infrastructure: Growing resilience in Detroit | 2017 | Detroit, USA | The Green Infrastructure Spatial Planning (GISP) model is presented, which is a multi-criteria, GIS-based method that includes the following benefits: air quality, storm water management, green space, urban heat island mitigation, and landscape connectivity. | The analysis offers preliminary evidence that green infrastructure is not being placed in storm water abatement high-priority locations, much less to mitigate the effects of urban heat islands, enhance habitat connectivity, or improve air quality. But, as the Detroit GISP model shows, it might be built in areas that reduce air pollution, urban heat islands, and storm water all at the same time. |
| Mahmoudzade, H. et al. [111] | Evaluating urban environmental quality using multi criteria decision making | 2024 | Tabriz, Iran | This study used a multi-criteria decision-making (MCDM) approach that used CRITIC to assess the quality of the urban environment using spatial analysis. | Air pollution, green space per capita, recreational space, and health care per capita do not seem to differ significantly, on average. In two urban areas, the creation of environmental quality maps highlights the significance of relevant neighborhood-level variables. |
| Lassandro, P. and Di Turi, S. [112] | Multi-criteria and multiscale assessment of building envelope response-ability to rising heat waves | 2019 | Bari, Italy | The selected approaches are examined in three distinct cities with rising summer temperatures, using an integrated, multilevel analysis with EnergyPlus and ENVI_met. Applying a multi-criteria analysis based on the discovered indicators, the final comparative analysis is conducted. | The results demonstrate the value of employing a multiple criterion analysis and a double-level approach when assessing how well-suited various building envelope retrofitting methods are to handle the escalating frequency of heat waves. Green solutions with high albedo values were the most responsive. |
| Kotharkar, R. et al. [113] | A systematic approach for urban heat island mitigation strategies in critical local climate zones of an Indian city | 2020 | Nagpur, India | Determination of the LCZ criticality using The Order of Preference by Similarity to Ideal Solution (TOPSIS) technique. | In the older, unplanned settlement with dense urban agglomeration (LCZ 3), the application of cool roof shows significant reductions in air temperature; however, increasing the green area ration is found to be a more effective strategy for the sparsely built (LCZ 9) and planned settlement with open spaces (LCZ 3F). |
| Putra, M. I. J. et al. [114] | Spatial Multi-Criteria Analysis for Urban Sustainable Built Up Area Based on Urban Heat Island in Serang City | 2019 | Serang, Indonesia | A simulation model was developed with a sustainable principle, carried out by performing equal weighting on each factor so that the obtained value and spatial distribution from the appropriate area was obtained and was suitable for the development of the built-up area in Serang City. | The region’s suitability area of 3.313 Ha was determined using the results of SMCE modeling. This area was distributed at various locations in Serang City and was expanded linearly along the road network to cover 3.538 Ha. In the meantime, the majority of Serang City’s central, north, and west regions—which together account for 19.553 Ha—are unsuitable for a built-up area. |
| Yan, Y. et al. [115] | A multi-criteria evaluation of the urban ecological environment in Shanghai based on remote sensing | 2021 | Shanghai, China | Development of an ecological environment evaluation method, based on remote sensing and a projection pursuit model. | In order to assess the urban ecological environment in a more convenient and objective manner, remote sensing-based detection has been used. Next, a multi-criteria assessment approach has been suggested for the analysis of the ecological environment, based on a projection pursuit model. Finally, a thorough assessment of Shanghai City’s ecological environment changes over the last five years was conducted. |
| Teotónio, I. et al. [116] | Decision support system for green roofs investments in residential buildings | 2020 | Lisbon, Portugal | The proposed methodology is based on the MACBETH method and determines the green roof option with the best trade-off between costs and benefits, in agreement with the preferences of the users/investors. | With a score of 69.43 out of 100, the methodology application selects the intensive green roof as the optimal alternative. The results of the sensitivity and robustness analyses supported the best option conclusions. This strategy maximizes building retrofitting, while assisting in the decision-making process regarding green roofs, as well as enabling sound and well-informed urban planning decisions. |
| Sangiorgio, V. et al. [117] | Development of a holistic urban heat island evaluation methodology | 2020 | European cities | Development of a new index aimed at quantifying the hazard of the absolute maximum UHI intensity in urban districts during the summer season, by taking all the parameters influencing the phenomenon into account. | The results are obtained by utilizing three interrelated techniques, as follows: an optimization process, using a Jackknife resampling approach to calibrate the index by utilizing the effective UHI intensity measured in a total of 41 urban districts and 35 European cities; the Analytic Hierarchy Processes to analyze the parameters involved in the UHI phenomenon; and a state-of-the-art technique to acquire a large set of data. |
| Philipps, N. et al. [118] | Urban Heat Island Mapping Based on a Local Climate Zone Classification: a Case Study in Strasbourg City, France | 2022 | Strasbourg, France | Establishment of an LCZ classification for the city of Strasbourg by using a vector-based method that relies on a large vector database composed of land cover and cadastral parcels data. | The obtained final LCZ map demonstrates that the devised vector-based approach enables the acquisition of pertinent LCZ classification. The values of the LCZ parameters are then utilzsed to calculate a multiple linear regression (MLR), with the goal of obtaining an UHI intensity for every LCZ polygon. The great regional heterogeneity of the phenomena is accurately illustrated in the resulting UHI map of the Eurométropole de Strasbourg (EMS). |
| Mostafa, E. et al. [119] | Urbanization Trends Analysis Using Hybrid Modeling of Fuzzy Analytical Hierarchical Process-Cellular Automata-Markov Chain and Investigating Its Impact on Land Surface Temperature over Gharbia City, Egypt | 2023 | Gharbia, Egypt | The development of two comparable models for the simulation of spatiotemporal dynamics of land use in the study area—CA–Markov chain and FAHP–CA–Markov chain hybrid models. | The two comparable models were validated using the Jaccard coefficient, which confirmed that both models are valid and can be utilized for future predictions. In contrast to the hybrid FAHP–CA–Markov chain model, which can predict urban sprawl-prone sites in a methodical manner, while taking the dynamics driving urban growth into account, the results of the classic CA–Markov chain model were more haphazard. |
| Kazak, Jan K. [25] | The use of a decision support system for sustainable urbanization and thermal comfort in adaptation to climate change actions—The case of the Wrocław larger urban zone (Poland) | 2018 | Wrocław, Poland | The development of a decision support system that can be used for the assessment of areas, in relation to their potential exposure to the UHI effect. | The scenario that is least susceptible to UHI impacts is revealed by the computations. The study gives local government officials recommendations on where to concentrate their efforts to build more environmentally friendly urban structures and improve their ability to withstand extreme weather conditions and climate change. |
| Mostofi, N. et al. [120] | Developing an SDSS for optimal sustainable roof covering planning based on UHI variation at neighborhood scale | 2021 | Tehran, Iran | The development of a spatial decision support system (SDSS) to investigate the effect of parcels’ roof covering type on surface heat island (SHI) values and their variation, at the neighborhood scale. | The two primary components of the present research’s innovation, the SDSS, are determining the study area’s UHI value and selecting the best set of parcels to replace their roof coverings with flagstone, high-albedo material, or three different types of vegetation. The findings show that, because flagstone and high-albedo materials have local impacts on reducing the UHI effects, it is important to inhibit UHI effects at the study area boundary with plant roof covering, in order to control UHI in the center of the region. |
| Bathaei, B. [121] | Decision Support System to Select the Most Effective Strategies for Mitigating the Urban Heat Island Effect Using Sustainability and Resilience Performance Measures | 2021 | Not specified | The development of a decision support system (DSS) to assist decision-makers in reducing the effects of UHIs, by allowing them to choose the most viable mitigation method/technique based on resiliency and sustainability concerns. | The study’s contribution is the creation of a DSS that resembles a knowledge-sharing platform, to assist decision-makers, policymakers, urban planners, and architects in extracting UHIMSs. A more resilient and sustainable design is the anticipated outcome in a broad sense. The groundwork for developing a dynamic computer-based decision support system (DSS) to choose the most effective UHIMSs is laid by this study. |
| Tuczek, M. et al. [123] | Toward a decision support system for mitigating urban heat | 2019 | Not specified | The development of a DSS with an optimization model at its core, which optimizes the corresponding urban areas with respect to the highest possible revenue, while maintaining an optimal building/vegetation balance. | To address the identified research gap and to address the research question posed, the best solution would likely be an optimization model that provides a thorough discounted cash flow calculation in the future and takes into account a range of economic factors, including site-specific land prices, electricity costs for energy demand, and air conditioning, as well as a variety of potential alternatives for building and vegetation types. |
| Qureshi, A. M. and Rachid, A. [124] | Review and Comparative Study of Decision Support Tools for the Mitigation of Urban Heat Stress | 2021 | Not specified | Review of different decision support tools for mitigating UHI. | This review demonstrates how MCA can be applied to any research area and how criteria can be modified to fit the specific area. A comparative analysis leads to the conclusion that the DSS tool meets many requirements for mitigating UHIs. |
| Mahdiyar, A. et al. [125] | A prototype decision support system for green roof type selection: A cybernetic fuzzy ANP method | 2019 | Kuala Lumpur, Malaysia | The development of a decision support system (DSS) for selecting the optimum type of GR for residential buildings in Kuala Lumpur. | During the project’s design phase, a number of interrelated selection criteria for GR types were taken into account. This study’s unique contribution, from the perspective of MCDM, is the prototype DSS that was created by employing a CFANP technique to automate the complete GR type selection decision-making process. |
| Werbin, Z. et al. [62] | A tree-planting decision support tool for urban heat island mitigation | 2020 | Boston, USA | The development of a Boston-specific Heat Vulnerability Index (HVI). | Researchers from Boston University examined the City of Boston’s strategy for expanding the urban canopy, because the city has encountered challenges in establishing a long-lasting growth. They determined what barriers there were to applying scientific information to tree-planting decisions and collaborated with the city to create a tool that would help with the process. The tool itself is replicable or adaptable to other cities and the process of development offers a model of a fruitful collaboration between academia and the public sector. |
| Acosta, M. P. et al. [63] | How to bring UHI to the urban planning table? A data-driven modeling approach | 2021 | Montreal, Canada | The development of a decision support tool for the modeling of UHIs at the street level. | The methodology for creating a decision assistance tool for street-level UHI modeling was described in this research study. Urban planners can utilize this simple-to-use tool to look at how their design decisions will affect street-level traffic. There are five levels of UHI potential, ranging from low to high, represented by the UHI evaluation matrix. |
| Qi, J. et al. [64] | Planning for cooler cities: A framework to support the selection of urban heat mitigation techniques | 2020 | Sydney, Australia | The development of a decision-making framework, related to UHI mitigation | One of the study’s contributions is the creation of a method that can determine the best combinations of UHMTs and planning and design elements with the greatest potential for cooling in a particular urban setting. The framework can support high-performance production and sustainable development, in addition to giving decision-makers the best UHMTs for creating a workable policy for mitigating urban heat islands. |
References
- Yamamoto, Y. Measures to mitigate urban heat islands. Sci. Technol. Trends Q. Rev. 2006, 18, 6583. [Google Scholar]
- Oke, T.R. The energetic basis of the urban heat island. Q. J. R. Meteorol. Soc. 1982, 108, 1–24. [Google Scholar] [CrossRef]
- Quattrochi, D.A.; Luvall, J.C.; Rickman, D.L.; Estes, M.G.; Laymon, C.A.; Howell, B.F. A decision support information system for urban landscape management using thermal infrared data: Decision support systems. Photogramm. Eng. Remote Sens. 2000, 66, 1195–1207. [Google Scholar]
- Sen, S.; Roesler, J.; Ruddell, B.; Middel, A. Cool Pavement Strategies for Urban Heat Island Mitigation in Suburban Phoenix, Arizona. Sustainability 2019, 11, 4452. [Google Scholar] [CrossRef]
- Wijeyesekera, D.C.; Nazari, N.A.R.B.M.; Lim, S.M.; Masirin, M.I.M.; Zainorabidin, A.; Walsh, J. Investigation into the Urban Heat Island Effects from Asphalt Pavements. OIDA Int. J. Sustain. Dev. 2012, 5, 97–118. [Google Scholar]
- Akbari, H.; Rose, L.S. Characterising the Fabric of the Urban Environment: A Case Study of Metropolitan Chicago, Illinois; Lawrence Berkeley National Laboratory: Berkeley, CA, USA, 2001. [Google Scholar]
- Voogt, J.A. Urban Heat Island. In Encyclopedia of Global Environmental Change; Munn, T., Ed.; Wiley: Chichester, UK, 2002; Volume 3, pp. 660–666. [Google Scholar]
- Anyanwu, E.C.; Kanu, I. The role of urban forest in the protection of human environmental health in geographically prone unpredictable hostile weather conditions. Int. J. Environ. Sci. Technol 2006, 3, 197–201. [Google Scholar] [CrossRef]
- Li, H.; Harvey, J.T.; Holland, T.J.; Kayhanian, M. The use of reflective and permeable pavements as a potential practice for heat island mitigation and storm water management. Environ. Res. Lett 2013, 8, 015023. [Google Scholar] [CrossRef]
- Emmanuel, M.R. An Urban Approach to Climate-Sensitive Design: Strategies for the Tropics; Spon Press: London, UK, 2005; p. 208. [Google Scholar]
- Yu, C.; Hien, W.N. Thermal benefits of city parks. Energy Build. 2006, 38, 105–120. [Google Scholar] [CrossRef]
- Salazar, A.; Baldi, G.; Hirota, M.; Syktus, J.; McAlpine, C. Land use and land cover change impacts on the regional climate of non-Amazonian South America: A review. Glob. Planet. Chang. 2015, 128, 103–119. [Google Scholar] [CrossRef]
- Shiflett, S.A.; Liang, L.L.; Crum, S.M.; Feyisa, G.L.; Wang, J.; Jenerette, G.D. Variation in the urban vegetation, surface temperature, air temperature nexus. Sci. Total Environ. 2017, 579, 495–505. [Google Scholar] [CrossRef] [PubMed]
- Vitanova, L.L.; Kusaka, H. Study on the urban heat island in Sofia City: Numerical simulations with potential natural vegetation and present land use data. Sustain. Cities Soc. 2018, 40, 110–125. [Google Scholar] [CrossRef]
- Gartland, L.M. Heat Islands: Understanding and Mitigating Heat in Urban Areas, 1st ed.; Routledge: London, UK, 2012. [Google Scholar]
- Santamouris, M.; Paraponiaris, K.; Mihalakakou, G. Estimating the ecological footprint of the heat island effect over Athens, Greece. Clim. Chang. 2007, 80, 265–276. [Google Scholar] [CrossRef]
- Akbari, H.; Gartland, L.; Konopacki, S. Measured Energy Savings of Light Colored Roofs: Results from Three California Demonstration Sites: Lawrence Berkeley National Lab; Environmental Energy Technologies Div.: Berkeley, CA, USA, 1998. [Google Scholar]
- Oke, T. Boundary Layer Climates, 2nd ed.; Methuen: London, UK, 1987; p. 289. [Google Scholar]
- Chen, J.; Zhou, Z.; Wu, J. Field and laboratory measurement of albedo and heat transfer for pavement materials. Constr. Build. Mater. 2019, 202, 46–57. [Google Scholar] [CrossRef]
- Nuruzzaman, M. Urban heat island: Causes, effects and mitigation measures—A review. Int. J. Environ. Monit. Anal. 2015, 3, 67–73. [Google Scholar] [CrossRef]
- Masson, V. Urban surface modeling and the mesoscale impact of cities. Theor. Appl. Climatol. 2006, 84, 35–45. [Google Scholar] [CrossRef]
- Giridharan, R.; Ganesan, S.; Lau, S.S.Y. Daytime urban heat island effect in high-rise and high-density residential developments in Hong Kong. Energy Build. 2004, 36, 525–534. [Google Scholar] [CrossRef]
- Priyadarsini, R.; Hien, W.N.; David, C.K.W. Microclimatic modeling of the urban thermal environment of Singapore to mitigate urban heat island. Sol. Energy 2008, 82, 727–745. [Google Scholar] [CrossRef]
- Tumanov, S.; Stan-Sion, A.; Lupu, A.; Soci, C.; Oprea, C. Influences of the city of Bucharest on weather and climate parameters. Atmos. Environ. 1999, 33, 4173–4183. [Google Scholar] [CrossRef]
- Kazak, J.K. The use of a decision support system for sustainable urbanization and thermal comfort in adaptation to climate change actions—The case of the Wrocław larger urban zone (Poland). Sustainability 2018, 10, 1083. [Google Scholar] [CrossRef]
- Bousse, Y.S. Mitigating the Urban Heat Island Effect with an Intensive Green Roof during Summer in Reading. Doctoral Dissertation, Reading University, Reading, UK, 2009. [Google Scholar]
- Pongracz, R.; Bartholy, J.; Dezso, Z. Remotely sensed thermal information applied to urban climate analysis. Adv. Space Res. 2006, 37, 2191–2196. [Google Scholar] [CrossRef]
- Oke, T.R.; Mills, G.; Christen, A.; Voogt, J.A. Urban Climates; Cambridge University Press: Cambridge, UK, 2017. [Google Scholar]
- Fadhil, M.; Hamoodi, M.N.; Ziboon, A.R.T. Mitigating urban heat island effects in urban environments: Strategies and tools. In IOP Conference Series: Earth and Environmental Science; IOP Publishing: Bristol, UK, 2023; Volume 1129, p. 012025. [Google Scholar]
- Stewart, I.D.; Oke, T.R. Local Climate Zones for Urban Temperature Studies. Bull. Amer. Meteor. Soc. 2012, 93, 1879–1900. [Google Scholar] [CrossRef]
- Duplančić Leder, T.; Leder, N.; Hećimović, Ž. Split Metropolitan area surface temperature assessment with remote sensing method. Građevinar 2016, 68, 895–905. [Google Scholar]
- Mendez-Astudillo, J.; Lau, L.; Lun, I.Y.F.; Tang, Y.T.; Moore, T. Urban Heat Island Monitoring with Global Navigation Satellite System (GNSS) Data. In Urban Heat Island (UHI) Mitigation: Hot and Humid Regions; Enteria, N., Santamouris, M., Eicker, U., Eds.; Springer: New York, NY, USA, 2021; pp. 43–59. [Google Scholar]
- Rehan, R.M. Cool city as a sustainable example of heat island management case study of the coolest city in the world. HBRC J. 2016, 12, 191–204. [Google Scholar] [CrossRef]
- Filho, W.L.; Icaza, L.E.; Emanche, V.O.; Al-Amin, A.Q. An Evidence-Based Review of Impacts, Strategies and Tools to Mitigate Urban Heat Islands. Int. J. Environ. Res. Public Health 2017, 14, 1600. [Google Scholar] [CrossRef]
- Leal Filho, W.; Wolf, F.; Castro-Díaz, R.; Li, C.; Ojeh, V.N.; Gutiérrez, N.; Nagy, G.J.; Savić, S.; Natenzon, C.E.; Al-Amin, A.Q.; et al. Addressing the urban heat islands effect: A cross-country assessment of the role of green infrastructure. Sustainability 2021, 13, 753. [Google Scholar] [CrossRef]
- Vujovic, S.; Haddad, B.; Karaky, H.; Sebaibi, N.; Boutouil, M. Urban heat island: Causes, consequences, and mitigation measures with emphasis on reflective and permeable pavements. CivilEng 2021, 2, 459–484. [Google Scholar] [CrossRef]
- US Environmental Protection Agency. Urban Heat Island Basics. In Reducing Urban Heat Islands: Compendium of Strategies; US Environmental Protection Agency: Washington, DC, USA, 2008. Available online: https://19january2017snapshot.epa.gov/sites/production/files/2014-06/documents/basicscompendium.pdf (accessed on 8 February 2024).
- Yuan, C.; Adelia, A.S.; Mei, S.; He, W.; Li, X.X.; Norford, L. Mitigating intensity of urban heat island by better understanding on urban morphology and anthropogenic heat dispersion. Build. Environ. 2020, 176, 106876. [Google Scholar] [CrossRef]
- Gagliano, A.; Nocera, F.; Aneli, S. Computational fluid dynamics analysis for evaluating the urban heat island effects. Energy Procedia 2017, 134, 508–517. [Google Scholar] [CrossRef]
- Kouhirostami, M.; Abukhalaf, A.H.I.; Kouhirostamkolaei, M. Eliminating Air Pollution in Cities Through Sustainable Urban Planning. Acad. Lett. 2022, 4588. [Google Scholar] [CrossRef]
- Santamouris, M.; Ding, L.; Fiorito, F.; Oldfield, P.; Osmond, P.; Paolini, R.; Prasad, D.; Synnefa, A. Passive and active cooling for the outdoor built environment e analysis and assessment of the cooling potential of mitigation technologies using performance data from 220 large scale projects. Sol. Energy 2017, 154, 14–33. [Google Scholar] [CrossRef]
- Wang, X.; Dallimer, M.; Scott, C.E.; Shi, W.; Gao, J. Tree species richness and diversity predicts the magnitude of urban heat island mitigation effects of greenspaces. Sci. Total Environ. 2021, 770, 145–211. [Google Scholar] [CrossRef] [PubMed]
- Kleerekoper, L.; van Esch, M.; Salcedo, T.B. How to make a city climate-proof addressing the urban heat island effect. Resources. Conserv. Recycl. 2012, 64, 30–38. [Google Scholar] [CrossRef]
- Zhang, L.; Fukuda, H.; Liu, Z. The value of cool roof as a strategy to mitigate urban heat island effect: A contingent valuation approach. J. Clean. Prod. 2019, 228, 770–777. [Google Scholar] [CrossRef]
- Maleki, A.; Mahdavi, A. Evaluation of Urban Heat Islands Mitigation Strategies Using 3dimentional Urban Micro-climate Model ENVI-Met. Asian J. Civ. Eng. 2016, 17, 357–371. [Google Scholar]
- Amani-Beni, M.; Zhang, B.; Xu, J. Impact of urban park’s tree, grass and waterbody on microclimate in hot summer days: A case study of Olympic Park in Beijing, China. Urban For. Urban Green. 2018, 32, 1–6. [Google Scholar] [CrossRef]
- Wu, Z.; Zhang, Y. Water bodies’ cooling effects on urban land daytime surface temperature: Ecosystem service reducing heat island effect. Sustainability 2019, 11, 787. [Google Scholar] [CrossRef]
- Gregory, R.; Failing, L.; Harstone, M.; Long, G.; McDaniels, T.; Ohlson, D. Structured Decision Making: A Practical Guide to Environmental Management Choices; John Wiley & Sons: New York, NY, USA, 2012. [Google Scholar]
- Liu, S.; Duffy, A.H.; Whitfield, R.I.; Boyle, I.M. Integration of decision support systems to improve decision support performance. Knowl. Inf. Syst. 2010, 22, 261–286. [Google Scholar] [CrossRef]
- Jajac, N.; Marović, I.; Rogulj, K.; Kilić, J. Decision support concept to selection of wastewater treatment plant location—The case study of town of Kutina, Croatia. Water 2019, 11, 717. [Google Scholar] [CrossRef]
- Ivić, M.; Kilić, J.; Rogulj, K.; Jajac, N. Decision Support to Sustainable Parking Management—Investment Planning through Parking Fines to Improve Pedestrian Flows. Sustainability 2020, 12, 9485. [Google Scholar] [CrossRef]
- Huang, I.B.; Keisler, J.; Linkov, I. Multi-criteria decision analysis in environmental sciences: Ten years of applications and trends. Sci. Total Environ. 2011, 409, 3578–3594. [Google Scholar] [CrossRef]
- Taranath, N.L.; Prabhu, B.A.; Dani, R.; Tiwari, D.; Darshan, L.M. Non-knowledge Based Decision Support System. In Proceedings of the Third International Conference on Sustainable Expert Systems: ICSES 2022, Lalitpur, Nepal, 9–10 September 2022; Springer Nature Singapore: Singapore, 2023; pp. 399–409. [Google Scholar]
- Kilić, J.; Rogulj, K.; Jajac, N. Fuzzy expert system for land valuation in land consolidation processes. Croat. Oper. Res. Rev. 2019, 10, 89–103. [Google Scholar] [CrossRef]
- Rogulj, K.; Kilić Pamuković, J.; Antucheviciene, J.; Zavadskas, E.K. Intuitionistic fuzzy decision support based on EDAS and grey relational degree for historic bridges reconstruction priority. Soft Comput. 2022, 26, 9419–9444. [Google Scholar] [CrossRef]
- Zadeh, L.A. Fuzzy sets. Inform. Control 1965, 8, 338–353. [Google Scholar] [CrossRef]
- Zadeh, L. Fuzzy sets as a basis for a theory of possibility. Fuzzy Set. Syst. 1978, 1, 3–28. [Google Scholar] [CrossRef]
- Unwin, S.D. A fuzzy set theoretic foundation for vagueness in uncertainty analysis. Risk Anal. 1986, 6, 27–34. [Google Scholar] [CrossRef]
- United Nations, Department of Economic and Social Affairs, Population Division. World Urbanization Prospects: The 2018 Revision (ST/ESA/SER.A/420); United Nations: New York, NY, USA, 2019. [Google Scholar]
- Chen, Y.; Zheng, B.; Hu, Y. Numerical simulation of local climate zone cooling achieved through modification of trees, albedo and green roofs—A case study of Changsha, China. Sustainability 2020, 12, 2752. [Google Scholar] [CrossRef]
- Nwakaire, C.M.; Onn, C.C.; Yap, S.P.; Yuen, C.W.; Onodagu, P.D. Urban Heat Island Studies with emphasis on urban pavements: A review. Sustain. Cities Soc. 2020, 63, 102476. [Google Scholar] [CrossRef]
- Werbin, Z.; Heidari, L.; Buckley, S.; Brochu, P.; Butler, L.; Connolly, C.; Bloemendaal, L.H.; McCabe, T.D.; Miller, T.; Hutyra, L.R. A tree-planting decision support tool for urban heat island mitigation. bioRxiv 2020, 15, 821785. [Google Scholar] [CrossRef]
- Acosta, M.P.; Vahdatikhaki, F.; Santos, J.; Hammad, A.; Dorée, A.G. How to bring UHI to the urban planning table? A data-driven modeling approach. Sustain. Cities Soc. 2021, 71, 102948. [Google Scholar] [CrossRef]
- Qi, J.; Ding, L.; Lim, S. Planning for cooler cities: A framework to support the selection of urban heat mitigation techniques. J. Clean. Prod. 2020, 275, 122903. [Google Scholar] [CrossRef]
- Kim, S.W.; Brown, R.D. Urban heat island (UHI) intensity and magnitude estimations: A systematic literature review. Sci. Total Environ. 2021, 779, 146389. [Google Scholar] [CrossRef]
- Almeida, C.R.d.; Teodoro, A.C.; Gonçalves, A. Study of the Urban Heat Island (UHI) Using Remote Sensing Data/Techniques: A Systematic Review. Environments 2021, 8, 105. [Google Scholar] [CrossRef]
- Deilami, K.; Kamruzzaman, M.; Liu, Y. Urban heat island effect: A systematic review of spatio-temporal factors, data, methods, and mitigation measures. Int. J. Appl. Earth Obs. Geoinf. 2018, 67, 30–42. [Google Scholar] [CrossRef]
- Nimac, I.; Herceg-Bulić, I.; Žuvela-Aloise, M. The contribution of urbanisation and climate conditions to increased urban heat load in Zagreb (Croatia) since the 1960s. Urban Clim. 2022, 46, 101343. [Google Scholar] [CrossRef]
- Duplančić Leder, T.; Leder, N. Land Surface Temperature Determination in the Town of Mostar Area. Teh. Vjesn. 2018, 25, 1219–1226. [Google Scholar]
- Duplančić Leder, T.; Bačić, S. Utjecaj lokalnih klimatskih zona na termalna obilježja područja grada Splita. In Proceedings of the 16th Symposium of Authorized Geodesy Engineers, Opatija, Croatia, 4–7 November 2021; pp. 73–80. [Google Scholar]
- Estacio, I.; Babaan, J.; Pecson, N.J.; Blanco, A.C.; Escoto, J.E.; Alcantara, C.K. GIS-based mapping of local climate zones using fuzzy logic and cellular automata. Int. Arch. Photogramm. Remote Sens. Spat. Inf. Sci. 2019, 42, 199–206. [Google Scholar] [CrossRef]
- Bokaie, M.; Zarkesh, M.K.; Arasteh, P.D.; Hosseini, A. Assessment of urban heat island based on the relationship between land surface temperature and land use/land cover in Tehran. Sustain. Cities Soc. 2016, 23, 94–104. [Google Scholar] [CrossRef]
- Jiménez-Muñoz, J.C.; Sobrino, J.A. A generalized single-channel method for retrieving land surface temperature from remote sensing data. J. Geophys. Res. Atmos. 2003, 108, 4688. [Google Scholar] [CrossRef]
- Feizizadeh, B.; Blaschke, T. Examining urban heat island relations to land use and air pollution: Multiple endmember spectral mixture analysis for thermal remote sensing. IEEE J. Sel. Top. Appl. Earth Obs. Remote Sens. 2013, 6, 1749–1756. [Google Scholar] [CrossRef]
- Zhu, W.; Sun, J.; Yang, C.; Liu, M.; Xu, X.; Ji, C. How to measure the urban park cooling island? A perspective of absolute and relative indicators using remote sensing and buffer analysis. Remote Sens. 2021, 13, 3154. [Google Scholar] [CrossRef]
- Firozjaei, M.K.; Fathololoumi, S.; Kiavarz, M.; Biswas, A.; Homaee, M.; Alavipanah, S.K. Land Surface Ecological Status Composition Index (LSESCI): A novel remote sensing-based technique for modeling land surface ecological status. Ecol. Indic. 2021, 123, 107375. [Google Scholar] [CrossRef]
- Zhang, Z.; Zhang, Y.; Yu, X.; Lei, L.; Chen, Y.; Guo, X. Evaluating Natural Ecological Land Change in Function-Oriented Planning Regions Using the National Land Use Survey Data from 2009 to 2018 in China. ISPRS Int. J. -Geo-Inf. 2021, 10, 172. [Google Scholar] [CrossRef]
- Zhang, T.; Yang, R.; Yang, Y.; Li, L.; Chen, L. Assessing the Urban Eco-Environmental Quality by the Remote-Sensing Ecological Index: Application to Tianjin, North China. ISPRS Int. J. -Geo-Inf. 2021, 10, 475. [Google Scholar] [CrossRef]
- Jiang, Y.; Lin, W. A Comparative Analysis of Retrieval Algorithms of Land Surface Temperature from Landsat-8 Data: A Case Study of Shanghai, China. Int. J. Environ. Res. Public Health 2021, 18, 5659. [Google Scholar] [CrossRef] [PubMed]
- Peng, T.; Sun, C.; Feng, S.; Zhang, Y.; Fan, F. Temporal and Spatial Variation of Anthropogenic Heat in the Central Urban Area: A Case Study of Guangzhou, China. ISPRS Int. J. -Geo-Inf. 2021, 10, 160. [Google Scholar] [CrossRef]
- You, M.; Lai, R.; Lin, J.; Zhu, Z. Quantitative analysis of a spatial distribution and driving factors of the urban heat island effect: A case study of fuzhou central area, China. Int. J. Environ. Res. Public Health 2021, 18, 13088. [Google Scholar] [CrossRef] [PubMed]
- Despini, F.; Ferrari, C.; Santunione, G.; Tommasone, S.; Muscio, A.; Teggi, S. Urban surfaces analysis with remote sensing data for the evaluation of UHI mitigation scenarios. Urban Clim. 2021, 35, 100761. [Google Scholar] [CrossRef]
- Santos, L.G.; Nevat, I.; Pignatta, G.; Norford, L.K. Climate-informed decision-making for urban design: Assessing the impact of urban morphology on urban heat island. Urban Clim. 2021, 36, 100776. [Google Scholar] [CrossRef]
- Amani-Beni, M.; Zhang, B.; Xie, G.D.; Shi, Y. Impacts of urban green landscape patterns on land surface temperature: Evidence from the adjacent area of Olympic Forest Park of Beijing, China. Sustainability 2019, 11, 513. [Google Scholar] [CrossRef]
- Pritipadmaja, G.R.D.; Sharma, A.K. Assessing the cooling effect of blue-green spaces: Implications for Urban Heat Island mitigation. Water 2023, 15, 2983. [Google Scholar] [CrossRef]
- Dong, J.; Lin, M.; Zuo, J.; Lin, T.; Liu, J.; Sun, C.; Luo, J. Quantitative study on the cooling effect of green roofs in a high-density urban Area—A case study of Xiamen, China. J. Clean. Prod. 2020, 255, 120152. [Google Scholar] [CrossRef]
- Imran, H.M.; Kala, J.; Ng, A.W.M.; Muthukumaran, S. Effectiveness of green and cool roofs in mitigating urban heat island effects during a heatwave event in the city of Melbourne in southeast Australia. J. Clean. Prod. 2018, 197, 393–405. [Google Scholar] [CrossRef]
- Sanchez, L.; Reames, T.G. Cooling Detroit: A socio-spatial analysis of equity in green roofs as an urban heat island mitigation strategy. Urban For. Urban Green. 2019, 44, 126331. [Google Scholar] [CrossRef]
- Gagliano, A.; Detommaso, M.; Nocera, F.; Evola, G. A multi-criteria methodology for comparing the energy and environmental behavior of cool, green and traditional roofs. Build. Environ. 2015, 90, 71–81. [Google Scholar] [CrossRef]
- Gunawardena, K.R.; Wells, M.J.; Kershaw, T. Utilising green and bluespace to mitigate urban heat island intensity. Sci. Total Environ. 2017, 584, 1040–1055. [Google Scholar] [CrossRef]
- Guo, G.; Wu, Z.; Chen, Y. Complex mechanisms linking land surface temperature to greenspace spatial patterns: Evidence from four southeastern Chinese cities. Sci. Total Environ. 2019, 674, 77–87. [Google Scholar] [CrossRef]
- He, X.; Wang, J.; Feng, J.; Yan, Z.; Miao, S.; Zhang, Y.; Xia, J. Observational and modeling study of interactions between urban heat island and heatwave in Beijing. J. Clean. Prod. 2020, 247, 119169. [Google Scholar] [CrossRef]
- Semenzato, P.; Bortolini, L. Urban Heat Island Mitigation and Urban Green Spaces: Testing a Model in the City of Padova (Italy). Land 2023, 12, 476. [Google Scholar] [CrossRef]
- Zheng, T.; Qu, K.; Wang, Y.; Darkwa, J.; Calautit, J.K. A Novel Urban Heat Island Mitigation Strategies-Engaged City Scale Building Energy Consumption Prediction Workflow: Case Study and Validation. SSRN 4159963. Available online: https://ssrn.com/abstract=4159963 (accessed on 15 February 2023).
- Sangkakool, T.; Techato, K.; Zaman, R.; Brudermann, T. Prospects of green roofs in urban Thailand—A multi-criteria decision analysis. J. Clean. Prod. 2018, 196, 400–410. [Google Scholar] [CrossRef]
- Qi, J.; Ding, L.; Lim, S. A decision-making framework to support urban heat mitigation by local governments. Resour. Conserv. Recycl. 2022, 184, 106420. [Google Scholar] [CrossRef]
- Sangiorgio, V.; Bruno, S.; Fiorito, F. Comparative Analysis and Mitigation Strategy for the Urban Heat Island Intensity in Bari (Italy) and in Other Six European Cities. Climate 2022, 10, 177. [Google Scholar] [CrossRef]
- Temizkan, S.; Kayili, M.T. Investigation of proper material selection for rainwater harvesting in squares having higher urban heat island effect potential: KBU Social Life Center example. Int. Adv. Res. Eng. J. 2021, 5, 454–463. [Google Scholar] [CrossRef]
- Qureshi, A.M.; Rachid, A. Comparative Analysis of Multi-Criteria Decision-Making Techniques for Outdoor Heat Stress Mitigation. Appl. Sci. 2022, 12, 12308. [Google Scholar] [CrossRef]
- Teixeira, D.C.F.; Amorim, M.C.D.C.T. Multicriteria Spatial Modeling: Methodological Contribution to the Analysis of Atmospheric and Surface Heat Islands in Presidente Prudente, Brazil. Climate 2022, 10, 56. [Google Scholar] [CrossRef]
- Turhan, C.; Atalay, A.S.; Gokcen Akkurt, G. An Integrated Decision-Making Framework for Mitigating the Impact of Urban Heat Islands on Energy Consumption and Thermal Comfort of Residential Buildings. Sustainability 2023, 15, 9674. [Google Scholar] [CrossRef]
- Tabatabaee, S.; Mahdiyar, A.; Durdyev, S.; Mohandes, S.R.; Ismail, S. An assessment model of benefits, opportunities, costs, and risks of green roof installation: A multi criteria decision making approach. J. Clean. Prod. 2019, 238, 117956. [Google Scholar] [CrossRef]
- Sturiale, L.; Scuderi, A. The role of green infrastructures in urban planning for climate change adaptation. Climate 2019, 7, 119. [Google Scholar] [CrossRef]
- Rosasco, P.; Perini, K. Selection of (green) roof systems: A sustainability-based multi-criteria analysis. Buildings 2019, 9, 134. [Google Scholar] [CrossRef]
- Rowe, B. Chapter 3.5—Green Roofs for Pollutants’ Reduction. In Nature Based Strategies for Urban and Building Sustainability; Pérez, G., Perini, K., Eds.; Butterworth-Heinemann: Oxford, UK, 2018; pp. 141–148. [Google Scholar]
- Rosenzweig, C.; Solecki, W.D.; Slosberg, R.B. Mitigating New York City’s Heat Island with Urban Forestry, Living Roofs, and Light Surfaces; New York City Regional Heat Island Initiative; New York State Energy Research and Development Authority (NYSERDA): New York, NY, USA, 2006. [Google Scholar]
- Rabbani, G.; Madanian, S.; Mansouri Daneshvar, M.R. Multi-criteria modeling for land suitability evaluation of the urban greenbelts in Iran. Model. Earth Syst. Environ. 2021, 7, 1291–1307. [Google Scholar] [CrossRef]
- Mushtaha, E.; Shareef, S.; Alsyouf, I.; Mori, T.; Kayed, A.; Abdelrahim, M.; Albannay, S. A study of the impact of major Urban Heat Island factors in a hot climate courtyard: The case of the University of Sharjah, UAE. Sustain. Cities Soc. 2021, 69, 102844. [Google Scholar] [CrossRef]
- Moradi, B.; Akbari, R.; Taghavi, S.R.; Fardad, F.; Esmailzadeh, A.; Ahmadi, M.Z.; Attarroshan, S.; Nickravesh, F.; Arsanjani, J.J.; Amirkhani, M.; et al. A scenario-based spatial multi-criteria decision-making system for urban environment quality assessment: Case study of Tehran. Land 2023, 12, 1659. [Google Scholar] [CrossRef]
- Meerow, S.; Newell, J.P. Spatial planning for multifunctional green infrastructure: Growing resilience in Detroit. Landsc. Urban Plan. 2017, 159, 62–75. [Google Scholar] [CrossRef]
- Mahmoudzadeh, H.; Abedini, A.; Aram, F.; Mosavi, A. Evaluating urban environmental quality using multi criteria decision making. Heliyon 2024, 10. [Google Scholar] [CrossRef] [PubMed]
- Lassandro, P.; Di Turi, S. Multi-criteria and multiscale assessment of building envelope response-ability to rising heat waves. Sustain. Cities Soc. 2019, 51, 101755. [Google Scholar] [CrossRef]
- Kotharkar, R.; Bagade, A.; Singh, P.R. A systematic approach for urban heat island mitigation strategies in critical local climate zones of an Indian city. Urban Clim. 2020, 34, 100701. [Google Scholar] [CrossRef]
- Putra, M.I.J.; Affandani, A.Y.; Widodo, T.; Wibowo, A. Spatial Multi-Criteria Analysis for Urban Sustainable Built Up Area Based on Urban Heat Island in Serang City. In IOP Conference Series: Earth and Environmental Science; IOP Publishing: Bristol, UK, 2019; Volume 338, p. 012025. [Google Scholar]
- Yan, Y.; Yu, X.; Long, F.; Dong, Y. A multi-criteria evaluation of the urban ecological environment in Shanghai based on remote sensing. ISPRS Int. J. Geo-Inf. 2021, 10, 688. [Google Scholar] [CrossRef]
- Teotónio, I.; Cabral, M.; Cruz, C.O.; Silva, C.M. Decision support system for green roofs investments in residential buildings. J. Clean. Prod. 2020, 249, 119365. [Google Scholar] [CrossRef]
- Sangiorgio, V.; Fiorito, F.; Santamouris, M. Development of a holistic urban heat island evaluation methodology. Sci. Rep. 2020, 10, 17913. [Google Scholar] [CrossRef]
- Philipps, N.; Landes, T.; Kastendeuch, P.; Najjar, G.; Gourguechon, C. Urban Heat Island Mapping Based on a Local Climate Zone Classification: A Case Study in Strasbourg City, France. Int. J. Environ. Geoinform. 2022, 9, 57–67. [Google Scholar] [CrossRef]
- Mostafa, E.; Li, X.; Sadek, M. Urbanization Trends Analysis Using Hybrid Modeling of Fuzzy Analytical Hierarchical Process-Cellular Automata-Markov Chain and Investigating Its Impact on Land Surface Temperature over Gharbia City, Egypt. Remote Sens. 2023, 15, 843. [Google Scholar] [CrossRef]
- Mostofi, N.; Aghamohammadi Zanjirabad, H.; Vafaeinejad, A.; Ramezani, M.; Hemmasi, A. Developing an SDSS for optimal sustainable roof covering planning based on UHI variation at neighborhood scale. Environ. Monit. Assess. 2021, 193, 372. [Google Scholar] [CrossRef] [PubMed]
- Bathaei, B. Decision Support System to Select the Most Effective Strategies for Mitigating the Urban Heat Island Effect Using Sustainability and Resilience Performance Measures. Doctoral Thesis, The University of Texas Rio Grande Valley, Edinburg, TX, USA, 2021. [Google Scholar]
- Metronimica. Available online: http://www.metronamica.nl/ (accessed on 12 November 2023).
- Tuczek, M.; Degirmenci, K.; Desouza, K.C.; Watson, R.T.; Yigitcanlar, T.; Hansen, V.G.; Omrani, S.; Bamdad, K.; Breitner, M.H. Toward a Decision Support System for Mitigating Urban Heat; Association for Information Systems: Atlanta, GA, USA, 2019. [Google Scholar]
- Qureshi, A.M.; Rachid, A. Review and Comparative Study of Decision Support Tools for the Mitigation of Urban Heat Stress. Climate 2021, 9, 102. [Google Scholar] [CrossRef]
- Mahdiyar, A.; Tabatabaee, S.; Durdyev, S.; Ismail, S.; Abdullah, A.; Rani, W.N.M.W.M. A prototype decision support system for green roof type selection: A cybernetic fuzzy ANP method. Sustain. Cities Soc. 2019, 48, 101532. [Google Scholar] [CrossRef]
- Zupic, I.; Cater, T. Bibliometric methods in management and organization. Organ. Res. Methods 2015, 18, 429–472. [Google Scholar] [CrossRef]
- Aria, M.; Cuccurulo, C. bibliometrix: An R-tool for comprehensive science mapping analysis. J. Informetr. 2017, 11, 959–975. [Google Scholar] [CrossRef]
- Scopus Fact Sheet. Available online: https://assets.ctfassets.net/o78em1y1w4i4/28v2L8eQgAGxOnnvZlqJWh/7947feb83982b078ec1d70c297055c34/ELSV_15617_Scopus_Fact_Sheet_Update_WEB.pdf (accessed on 2 November 2023).
- Racetin, I.; Krtalic, A. Systematic Review of Anomaly Detection in Hyperspectral Remote Sensing Applications. Appl. Sci. 2021, 11, 4878. [Google Scholar] [CrossRef]
- Tavra, M.; Lisec, A.; Galešić Divić, M.; Cetl, V. Unpacking the role of volunteered geographic information in disaster management: Focus on data quality. Geomat. Nat. Hazards Risk 2024, 15, 2300825. [Google Scholar] [CrossRef]
- Lissner, T.K.; Holsten, A.; Walther, C.; Kropp, J.P. Towards sectoral and standardised vulnerability assessments: The example of heatwave impacts on human health. Clim. Chang. 2012, 112, 687–708. [Google Scholar] [CrossRef]
- Borri, D.; Camarda, D.; Pluchinotta, I. Planning urban microclimate through multiagent modelling: A cognitive mapping approach. In Proceedings of the Cooperative Design, Visualization, and Engineering: 10th International Conference, CDVE, Alcudia, Mallorca, Spain, 22–25 September 2013; Springer: Berlin/Heidelberg, Germany, 2013; pp. 169–176. [Google Scholar]
- Donthu, N.; Kumar, S.; Mukherjee, D.; Pandey, N.; Lim, W.M. How to conduct a bibliometric analysis: An overview and guidelines. J. Bus. Res. 2021, 133, 285–296. [Google Scholar] [CrossRef]
- Alsharif, A.H.; Salleh, N.Z.; Baharun, R. Research trends of neuromarketing: A bibliometric analysis. J. Theor. Appl. Inf. Technol. 2020, 98, 2948–2962. [Google Scholar]
- Broadus, R. Toward a definition of bibliometrics. Scientometrics 1987, 12, 373–379. [Google Scholar] [CrossRef]
- Diodato, V. Dictionary of Bibliometrics, 1st ed.; Haworth Press: Binghamton, NY, USA, 1994. [Google Scholar]
- Pritchard, A. Statistical bibliography or bibliometrics. J. Doc. 1969, 25, 348. [Google Scholar]
- Bibliometrix. Available online: https://www.bibliometrix.org/home/ (accessed on 10 November 2023).
- Biblioshiny. Available online: https://bibliometrix.org/biblioshiny/biblioshiny2.html (accessed on 10 November 2023).
Figure 1.
Workflow of bibliometric analysis on Fuzzy Decision Support and Multi-Criteria Analysis in UHI management.
Figure 1.
Workflow of bibliometric analysis on Fuzzy Decision Support and Multi-Criteria Analysis in UHI management.

Figure 2.
Annual scientific production on DSSs and MCA in UHI management. The figure was created according to bibliometrix data.
Figure 2.
Annual scientific production on DSSs and MCA in UHI management. The figure was created according to bibliometrix data.

Figure 3.
Authors’ production over time of the first ten authors, according to their productivity. The figure was created using the bibliometrix R-package [127,138].

Figure 4.
Word cloud of the 50 most frequent keywords on DSSs and MCA in UHI management. The figure was created using the bibliometrix R-package [127,138].

Figure 5.
Words’ frequency over time for the 10 most common keywords. The figure was created according to bibliometrix data.
Figure 5.
Words’ frequency over time for the 10 most common keywords. The figure was created according to bibliometrix data.

Figure 6.
Trend topics in the last 10 years, with regard to the keywords that appear most often in the titles of papers. The figure was created using the bibliometrix R-package [127,138].

Figure 7.
Co-occurrence network of the 50 most common keywords on DSSs and MCA in UHI management. The figure was created using the bibliometrix R-package [127,138].

Table 1.
Summary of the studies reviewed.
| Author(s) | Title | Year | Study Location | Methodology | Findings |
|---|---|---|---|---|---|
| Nuruzzaman, M. [20] | Urban heat island: causes, effects and mitigation measures-a review | 2015 | Not specified | Review of various measures used to encounter UHI effects. | The most effective measures are green vegetation, high albedo materials, and pervious pavements. |
| Duplančić Leder, T. et al. [31] | Split Metropolitan area surface temperature assessment with remote sensing method | 2016 | Split, Croatia | Landsat thermal channels have been used to determine the LST. | Microclimate changes and severe changes in LST and UHI effects. |
| Amani-Beni, M. et al. [46] | Impact of urban park’s tree, grass and waterbody on microclimate in hot summer days: A case study of Olympic Park in Beijing, China | 2018 | Beijing, China | Observation of the greenery impact on the park during summer days. | The park was 0.48–1.12 °C cooler during the day; increased air humidity was observed at 2.39–3.74%; and a reduced human comfort index was used to generate a more comfortable thermal environment. |
| Nwakaire, C. M. et al. [61] | Urban Heat Island Studies with emphasis on urban pavements: A review | 2020 | Not specified | Literature review of UHIs, with emphasis on urban pavements. | One of the main findings included using creative designs that can provide cooling without compromising the structural integrity of the pavement, which is a key component of effective UHI mitigation techniques for highway pavements. |
| … | |||||
| Werbin, Z. et al. [62] | A tree-planting decision support tool for urban heat island mitigation | 2020 | Boston, USA | Development a Boston-specific Heat Vulnerability Index (HVI). | Researchers from Boston University examined the City of Boston’s strategy for expanding the urban canopy because the City has encountered challenges in establishing a long-lasting growth. They determined what barriers there were to applying scientific information to tree-planting decisions and collaborated with the city to create a tool that would help with the process. The tool itself is replicable or adaptable to other cities, and the process of development offers a model of a fruitful collaboration between academia and the public sector. |
| Acosta, M. P. et al. [63] | How to bring UHI to the urban planning table? A data-driven modeling approach | 2021 | Montreal, Canada | Development of the decision support tool for the modeling of UHI at the street-level. | The methodology for creating a decision assistance tool for street-level UHI modeling was described in this research study. Urban planners can utilize this simple-to-use tool to look at how their design decisions will affect street-level traffic. There are five levels of UHI potential, ranging from low to high, represented by the UHI evaluation matrix. |
| Qi, J. et al. [64] | Planning for cooler cities: A framework to support the selection of urban heat mitigation techniques | 2020 | Sidney, Australia | Development decision-making framework to UHI mitigation | One of the study’s contributions is the creation of a method that can determine the best combinations of UHMTs and planning and design elements with the greatest potential for cooling in a particular urban setting. The framework can support high-performance production and sustainable development in addition to giving decision-makers the best UHMTs for creating a workable policy for mitigating urban heat. |
Table 2.
Research results on fuzzy theory search query.
| Authors | Title | Year | Source Title | Cited by | Author’s Keywords | Ref. |
|---|---|---|---|---|---|---|
| Lissner T.K.; Holsten A.; Walther C.; Kropp J.P. | Towards sectoral and standardised vulnerability assessments: The example of heatwave impacts on human health | 2012 | Climatic Change | 33 | / | [131] |
| Borri D.; Camarda D.; Pluchinotta I. | Planning urban microclimate through multiagent modelling: A cognitive mapping approach | 2013 | Lecture Notes in Computer Science | 11 | Behavioural knowledge; Decision support system; Fuzzy cognitive mapping; Multiple agents; Urban microclimate planning | [132] |
| Tabatabaee S.; Mahdiyar A.; Durdyev S.; Mohandes S.R.; Ismail S. | An assessment model of benefits, opportunities, costs, and risks of green roof installation: A multi criteria decision making approach | 2019 | Journal of Cleaner Production | 55 | Cleaner production; Fuzzy DEMATEL; Green roof; Multi criteria decision making (MCDM); Sustainability | [102] |
| Mostafa E.; Li X.; Sadek M. | Urbanization Trends Analysis Using Hybrid Modeling of Fuzzy Analytical Hierarchical Process-Cellular Automata-Markov Chain and Investigating Its Impact on Land Surface Temperature over Gharbia City, Egypt | 2023 | Remote Sensing | 8 | CA-Markov chain; fuzzy AHP; Gharbia governorate; hybrid models; LULCC dynamics; UHI | [119] |
Table 3.
Main information about the 248 publications collected from the Scopus database.
| Description | Results |
|---|---|
| MAIN INFORMATION ABOUT DATA | |
| Timespan | 1996:2024 |
| Sources (Journals, Books, etc.) | 144 |
| Documents | 248 |
| Document Average Age | 4.4 |
| Average citations per doc | 21.88 |
| References | 12,584 |
| DOCUMENT CONTENTS | |
| Keywords Plus (ID) | 1797 |
| Author’s Keywords (DE) | 797 |
| AUTHORS | |
| Authors | 902 |
| Authors of single-authored docs | 17 |
| AUTHORS COLLABORATION | |
| Single-authored docs | 18 |
| Co-Authors per Doc | 4.03 |
| International co-authorships % | 25 |
| DOCUMENT TYPES | |
| Article | 183 |
| Book | 1 |
| Book chapter | 17 |
| Conference paper | 47 |
Table 4.
Most relevant sources according to the number of published records.
| Sources | Articles |
|---|---|
| Science of the Total Environment | 11 |
| Sustainable Cities and Society | 11 |
| Sustainability (Switzerland) | 9 |
| Remote Sensing | 8 |
| Urban Climate | 8 |
| Urban Forestry and Urban Greening | 7 |
| Energy and Buildings | 6 |
| International Archives of the Photogrammetry, Remote Sensing and Spatial Information Sciences—Isprs Archives | 6 |
| Building and Environment | 5 |
| Journal of Cleaner Production | 5 |
Table 5.
Most local cited sources, according to the number of local citations.
| Sources | Number of Local Citations |
|---|---|
| Remote Sensing Applications: Society and Environment | 207 |
| Building and Environment | 186 |
| Energy and Buildings | 177 |
| Landscape and Urban Planning | 129 |
| Remote Sensing | 117 |
| Science of the Total Environment | 115 |
| Energy and Buildings | 109 |
| Remote Sensing of Environment | 106 |
| Landscape and Urban Planning | 104 |
| Sustainable Cities and Society | 100 |
Table 6.
Most relevant authors, sorted by total number of citations.
| Author | h-Index | g-Index | m-Index | Total Citations | Number of Publications | First Publication Year |
|---|---|---|---|---|---|---|
| Chen, L. | 4 | 4 | 0.308 | 405 | 4 | 2011 |
| Zhang, H. | 5 | 6 | 0.455 | 306 | 6 | 2013 |
| Sun, R. | 2 | 2 | 0.167 | 271 | 2 | 2012 |
| Cai, Y-B | 1 | 1 | 0.091 | 263 | 1 | 2013 |
| Chen, M-N | 1 | 1 | 0.091 | 263 | 1 | 2013 |
| Ma, W-C | 1 | 1 | 0.091 | 263 | 1 | 2013 |
| Qi, Z-F | 1 | 1 | 0.091 | 263 | 1 | 2013 |
| Ye, X-Y | 1 | 1 | 0.091 | 263 | 1 | 2013 |
| Maderspacher, J. | 1 | 1 | 0.125 | 231 | 1 | 2016 |
| Pauleit, S. | 1 | 1 | 0.125 | 231 | 1 | 2016 |
| Wamsler, C. | 1 | 1 | 0.125 | 231 | 1 | 2016 |
| Zölch, T. | 1 | 1 | 0.125 | 231 | 1 | 2016 |
| Yu, Z. | 3 | 3 | 0.6 | 187 | 3 | 2019 |
| Corburn, J. | 1 | 1 | 0.067 | 184 | 1 | 2009 |
| Wang, X. | 2 | 2 | 0.4 | 169 | 2 | 2019 |
| Qi, J. | 2 | 2 | 0.286 | 162 | 2 | 2017 |
| Vejre, H. | 2 | 2 | 0.4 | 154 | 2 | 2019 |
| Yang, G. | 2 | 2 | 0.4 | 154 | 2 | 2019 |
| Ben-Dor, E. | 1 | 1 | 0.05 | 140 | 1 | 2004 |
| Chudnovsky, A. | 1 | 1 | 0.05 | 140 | 1 | 2004 |
Disclaimer/Publisher’s Note: The statements, opinions and data contained in all publications are solely those of the individual author(s) and contributor(s) and not of MDPI and/or the editor(s). MDPI and/or the editor(s) disclaim responsibility for any injury to people or property resulting from any ideas, methods, instructions or products referred to in the content. |
© 2024 by the authors. Licensee MDPI, Basel, Switzerland. This article is an open access article distributed under the terms and conditions of the Creative Commons Attribution (CC BY) license (https://creativecommons.org/licenses/by/4.0/).
Share and Cite
MDPI and ACS Style
Ćesić, M.; Rogulj, K.; Kilić Pamuković, J.; Krtalić, A. A Systematic Review on Fuzzy Decision Support Systems and Multi-Criteria Analysis in Urban Heat Island Management. Energies 2024, 17, 2013. https://doi.org/10.3390/en17092013
AMA Style
Ćesić M, Rogulj K, Kilić Pamuković J, Krtalić A. A Systematic Review on Fuzzy Decision Support Systems and Multi-Criteria Analysis in Urban Heat Island Management. Energies. 2024; 17(9):2013. https://doi.org/10.3390/en17092013
Chicago/Turabian StyleĆesić, Majda, Katarina Rogulj, Jelena Kilić Pamuković, and Andrija Krtalić. 2024. "A Systematic Review on Fuzzy Decision Support Systems and Multi-Criteria Analysis in Urban Heat Island Management" Energies 17, no. 9: 2013. https://doi.org/10.3390/en17092013
Note that from the first issue of 2016, this journal uses article numbers instead of page numbers. See further details here.