Residential Energy Performance Metrics

Abstract
:
1. Introduction
- Energy efficiency performance data collection of the S&T solar homes;
- Verification and possible suggestions for improvement of residential design software such as the Sustainable Buildings Industry Council’s ‘Energy-10’ and the U.S. Department of Energy’s ‘Energy Plus’;
- Design and development of cost effective sensor system for residential energy performance feedback;
- Cost effective home automation and energy management control system using the sensor system.
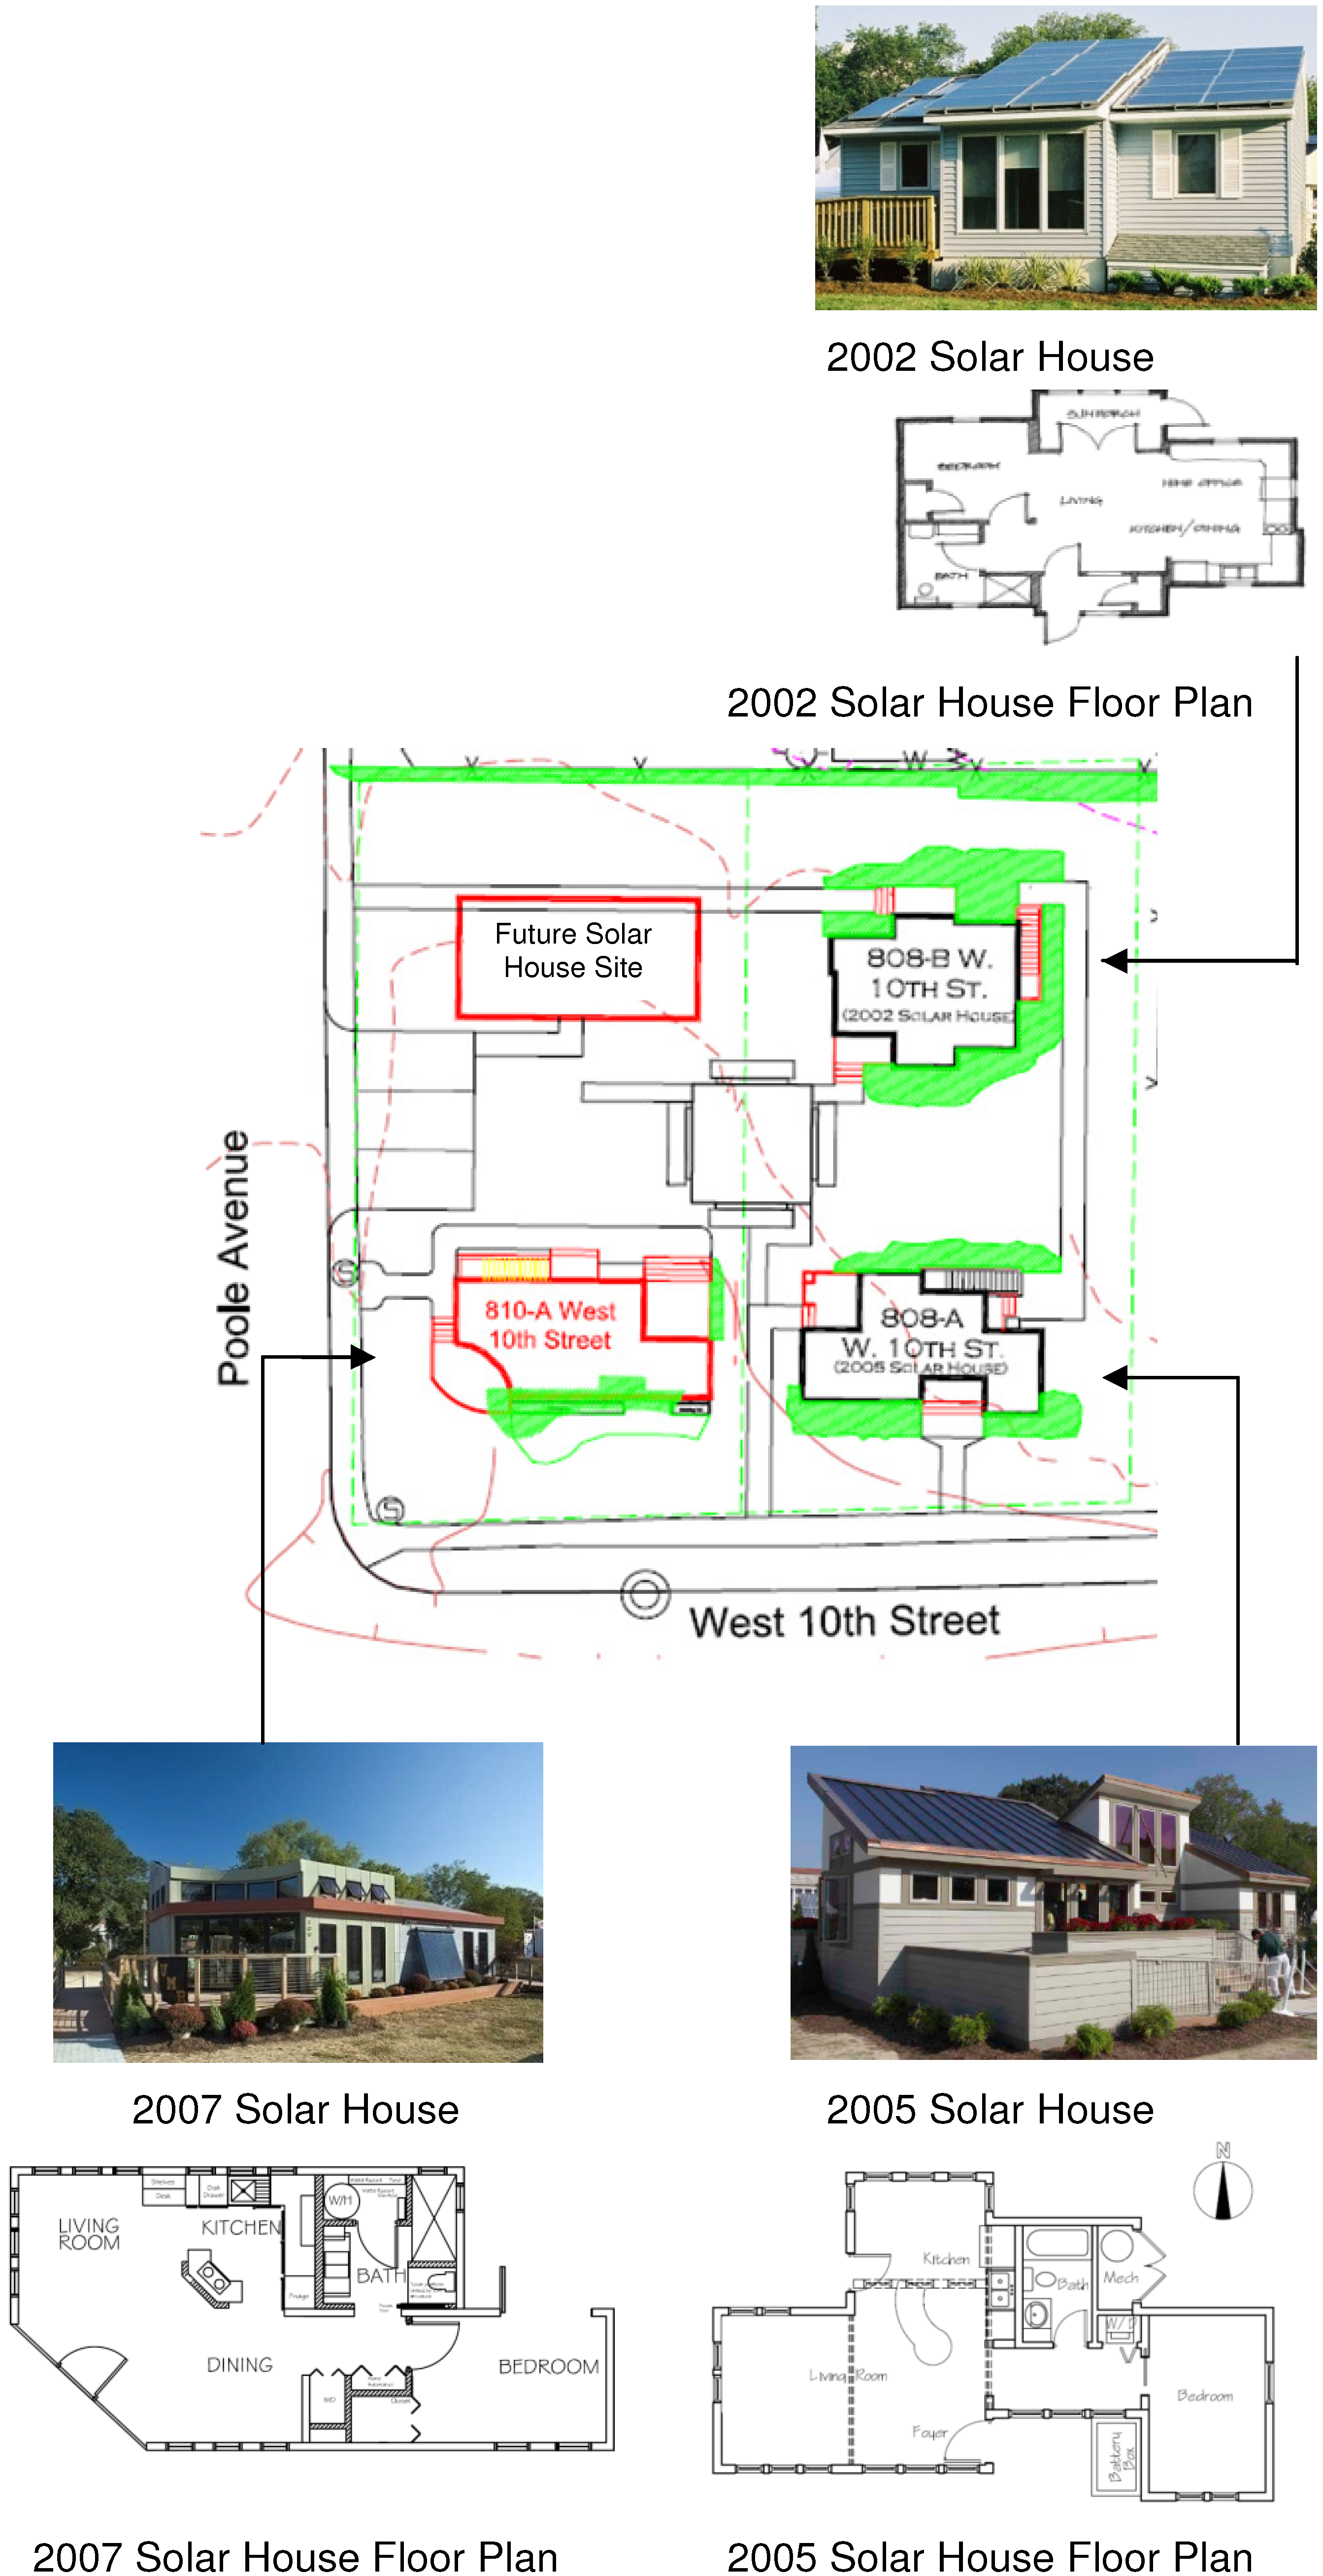
1.1. S&T Solar Village

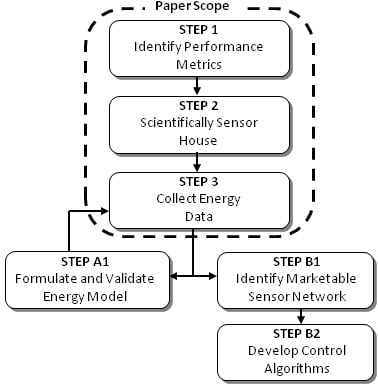
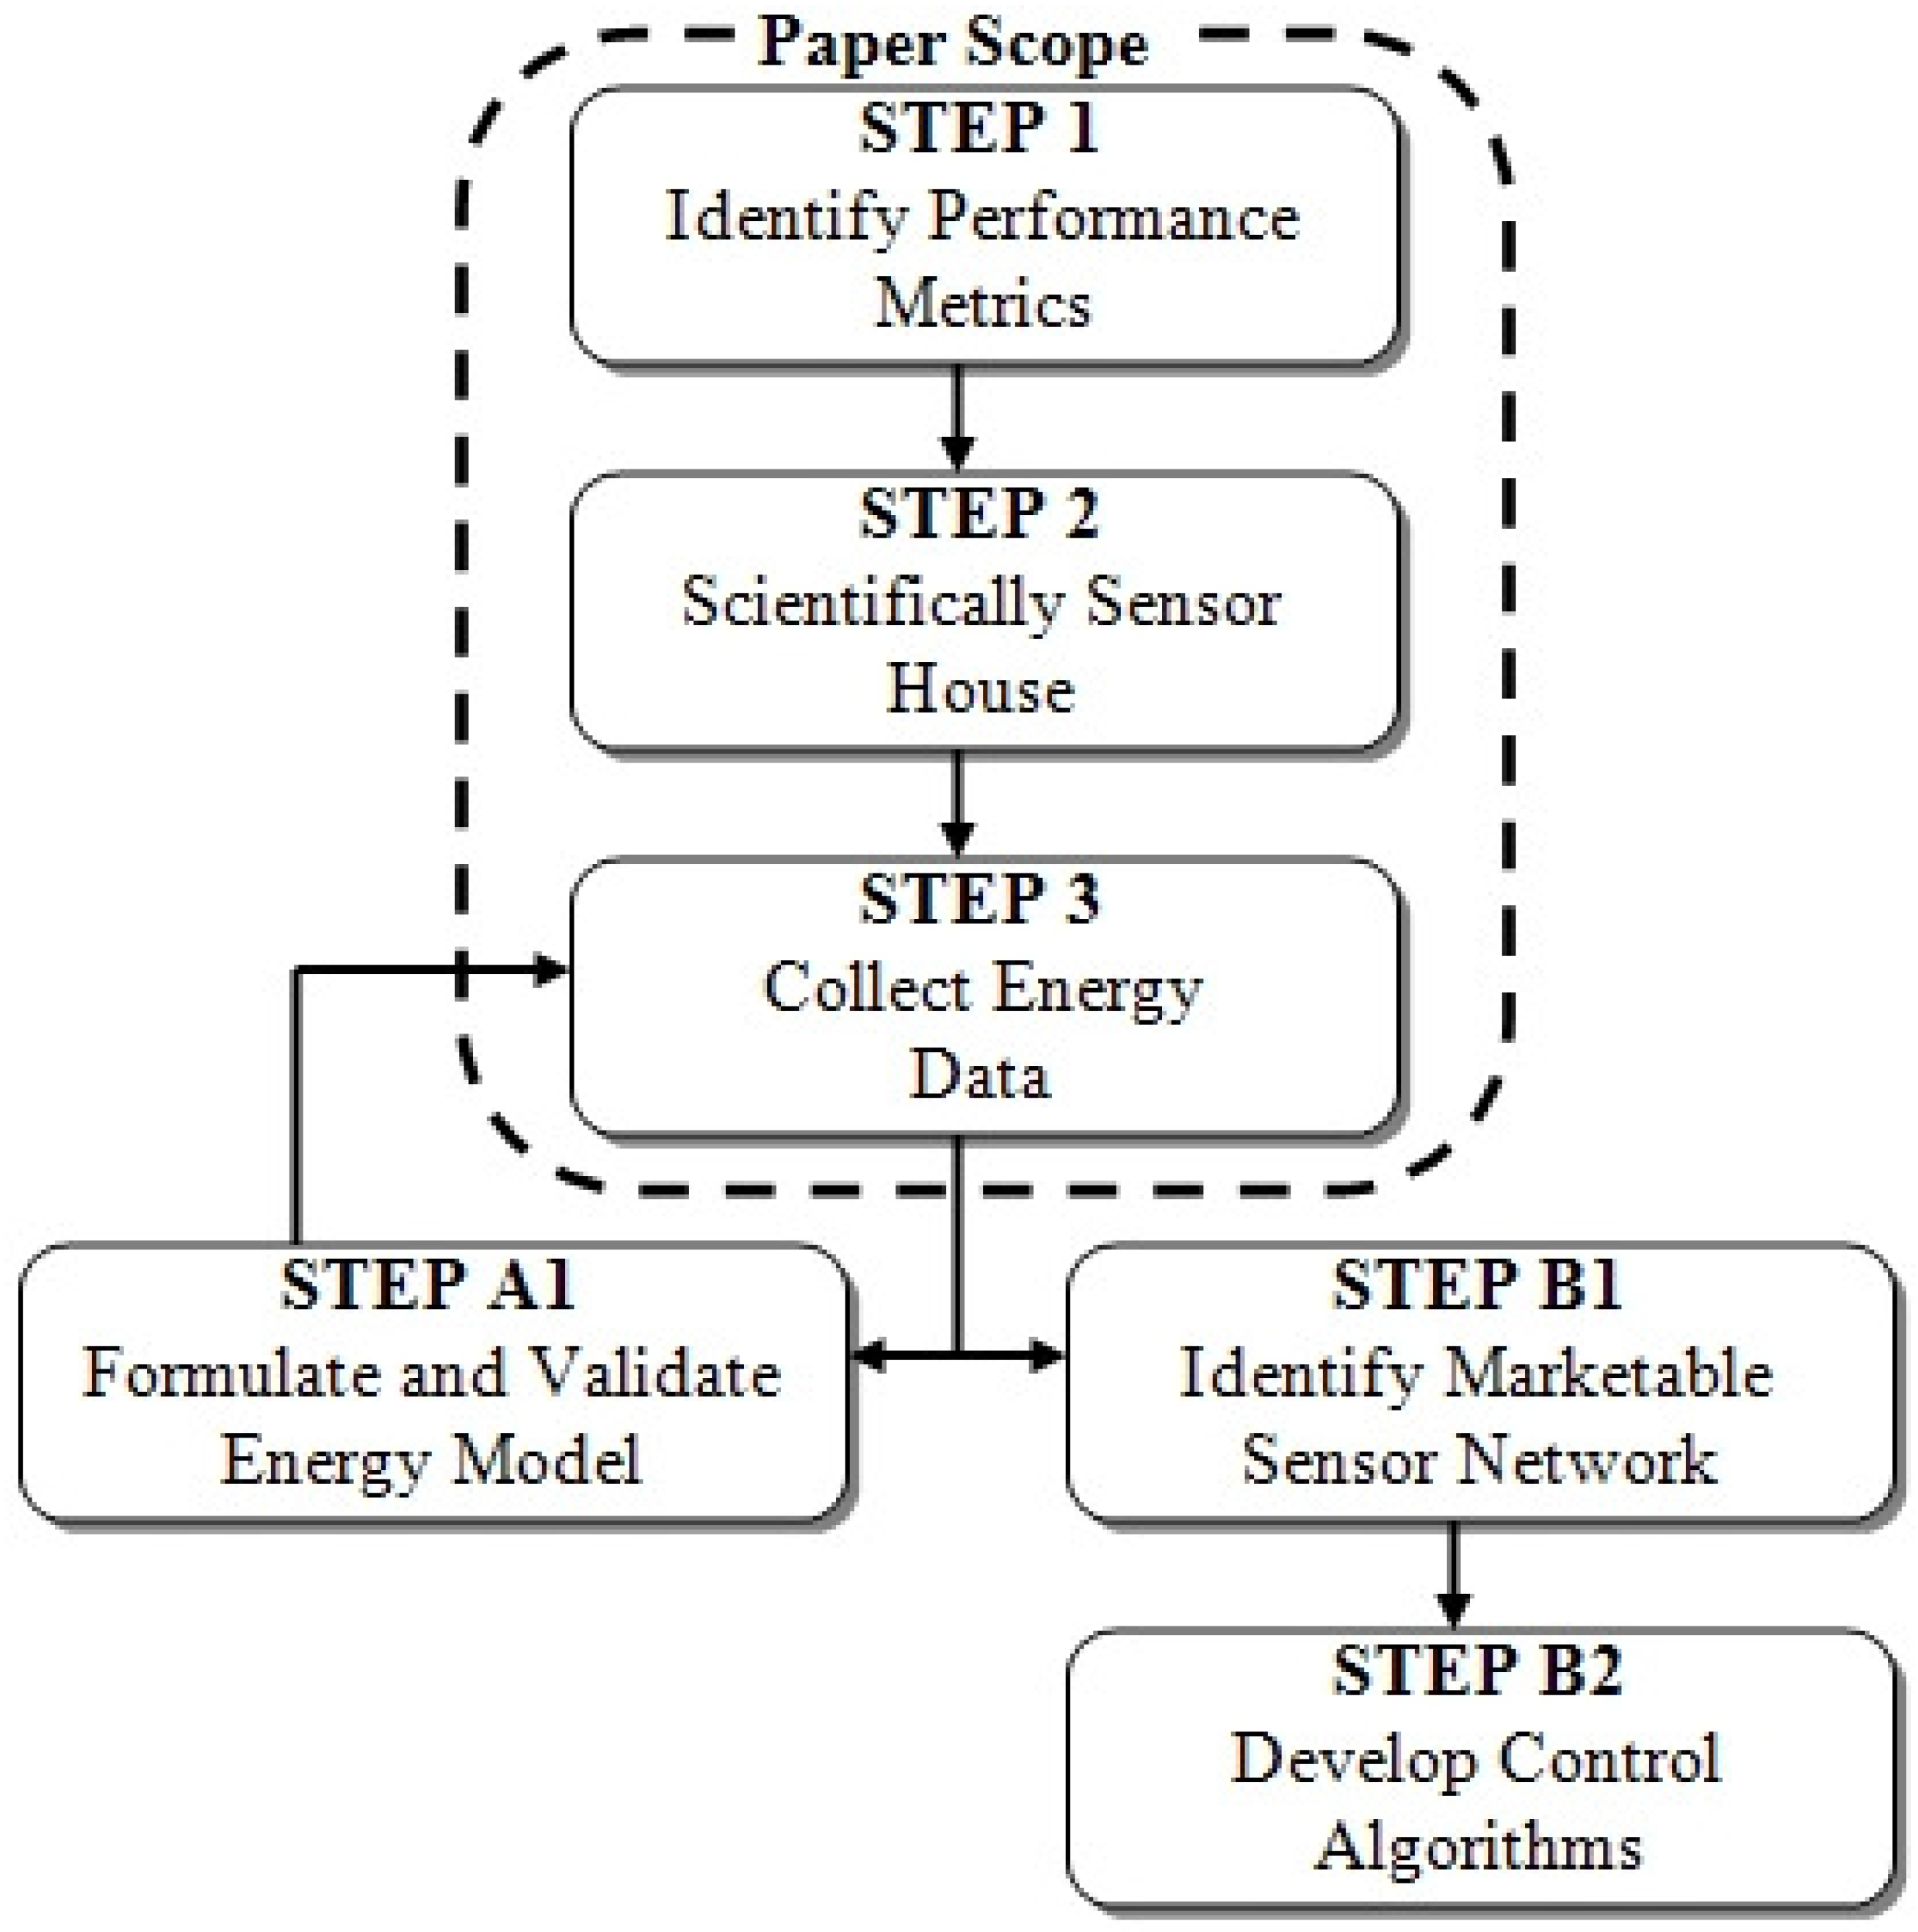
1.2. Research Approach: Model the Entire Building Envelope

2. Results and Discussion
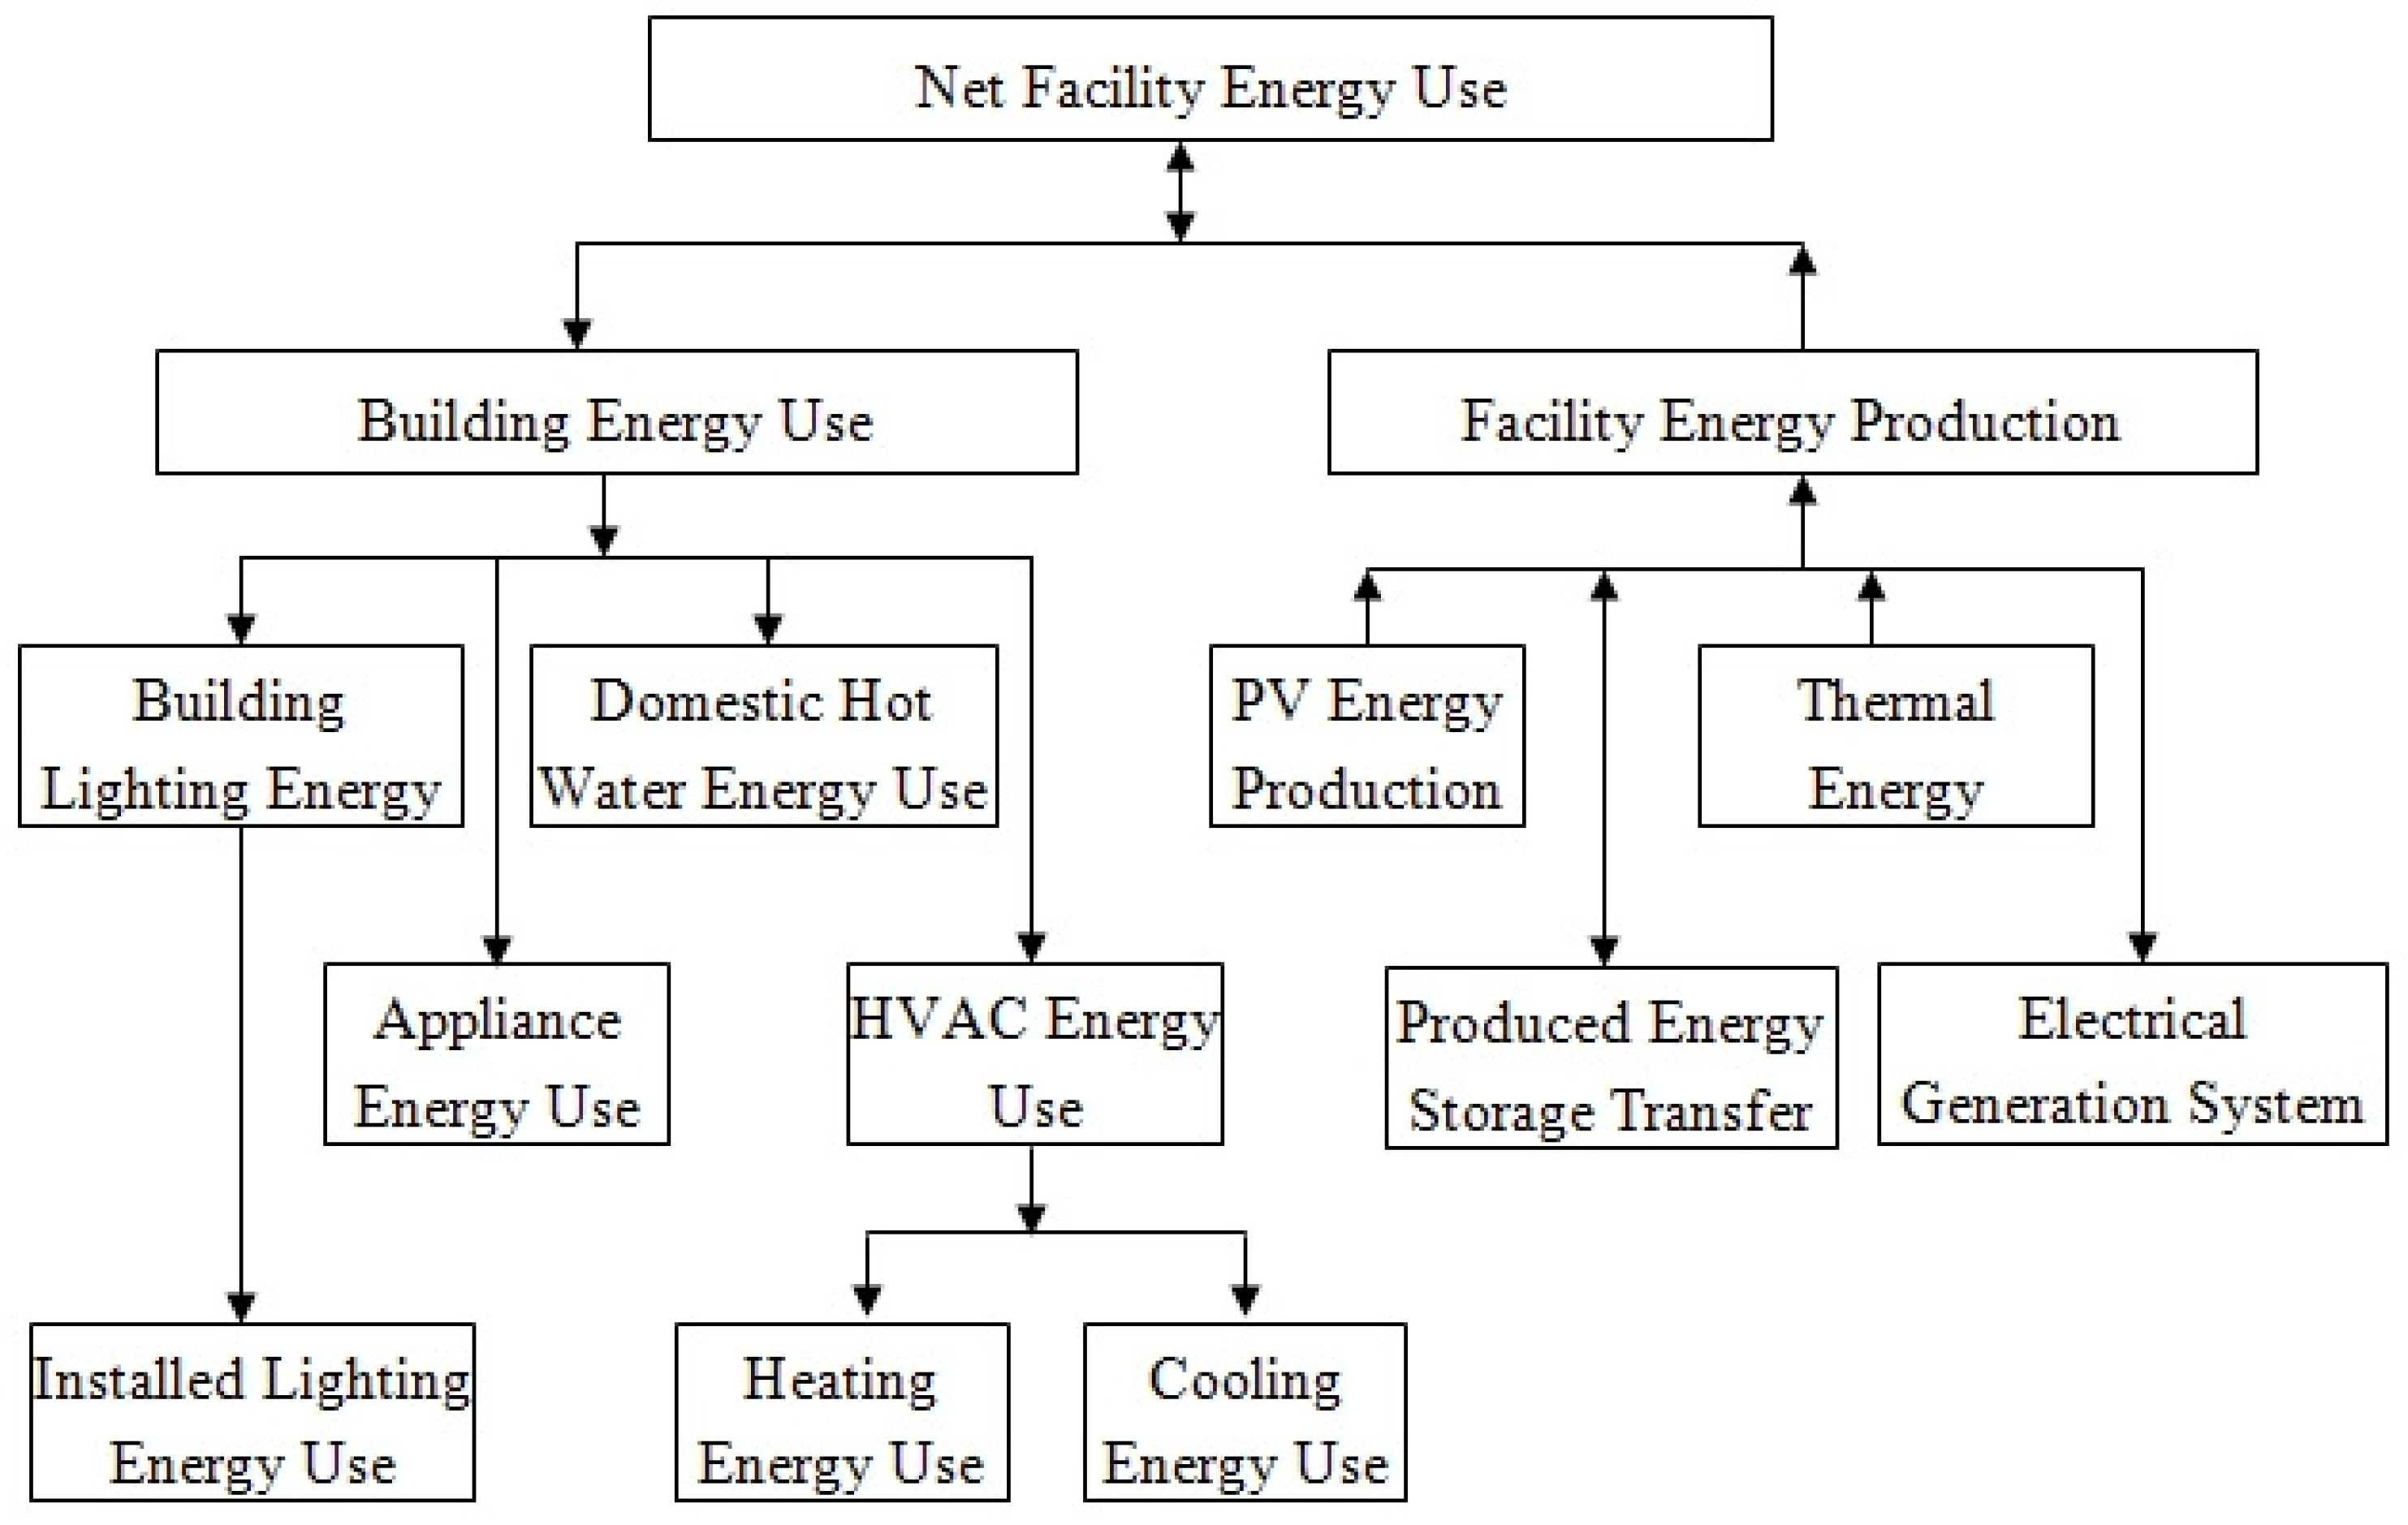
2.1. Performance Metrics
- Compare performance with the design intent of the building
- Compare performance with other buildings
- Evaluate building performance rating systems
- Perform economic analysis of energy-efficient strategies in buildings
- Establish long-term performance records that enable maintenance staff to monitor trends in energy performance.
2.1.1. Functional Area (FA)
2.1.2. Photovoltaic Energy Production (PVEP)
2.1.3. Thermal Energy Production (TEP)
2.1.4. Electrical Generation System Losses (EGSL)
2.1.5. Facility Energy Production (FEP)
2.1.6. Produced Energy Storage Transfer (PEST)
2.1.7. Outdoor Ambient Temperature (OT)
2.1.8. Indoor Zone Temperature (IT)
2.1.9. Cooling Energy Use (CEU)
2.1.10. Heating Energy Use (HEU)
2.1.11. HVAC Energy Use (HVACEU)
2.1.12. Domestic Hot Water Load (DHWL)
2.1.13. Domestic Hot Water Energy Use (DHWEU)
2.1.14. Domestic Hot Water System Efficiency (DHWSE)
2.1.15. Installed Lighting Energy Use (ILEU)
2.1.16. Building Lighting Energy Use (BLEU)
2.1.17. Appliance Energy Use (AEU)
2.1.18. Building Energy Use (BEU)
2.1.19. Building Energy Use Intensity (BEUI)
2.1.20. Net Facility Energy Use (NFEU)
2.1.21. Net Facility Electrical Demand (NFED)
2.1.22. Net Facility Load Factor (NFLF)
2.1.23. Building Purchased Energy Cost (BPEC)
2.1.24. Building Purchased Energy Cost Intensity (BPECI)
2.1.25. Net Facility Purchased Energy Cost (NFPEC)

3. Experimental Section
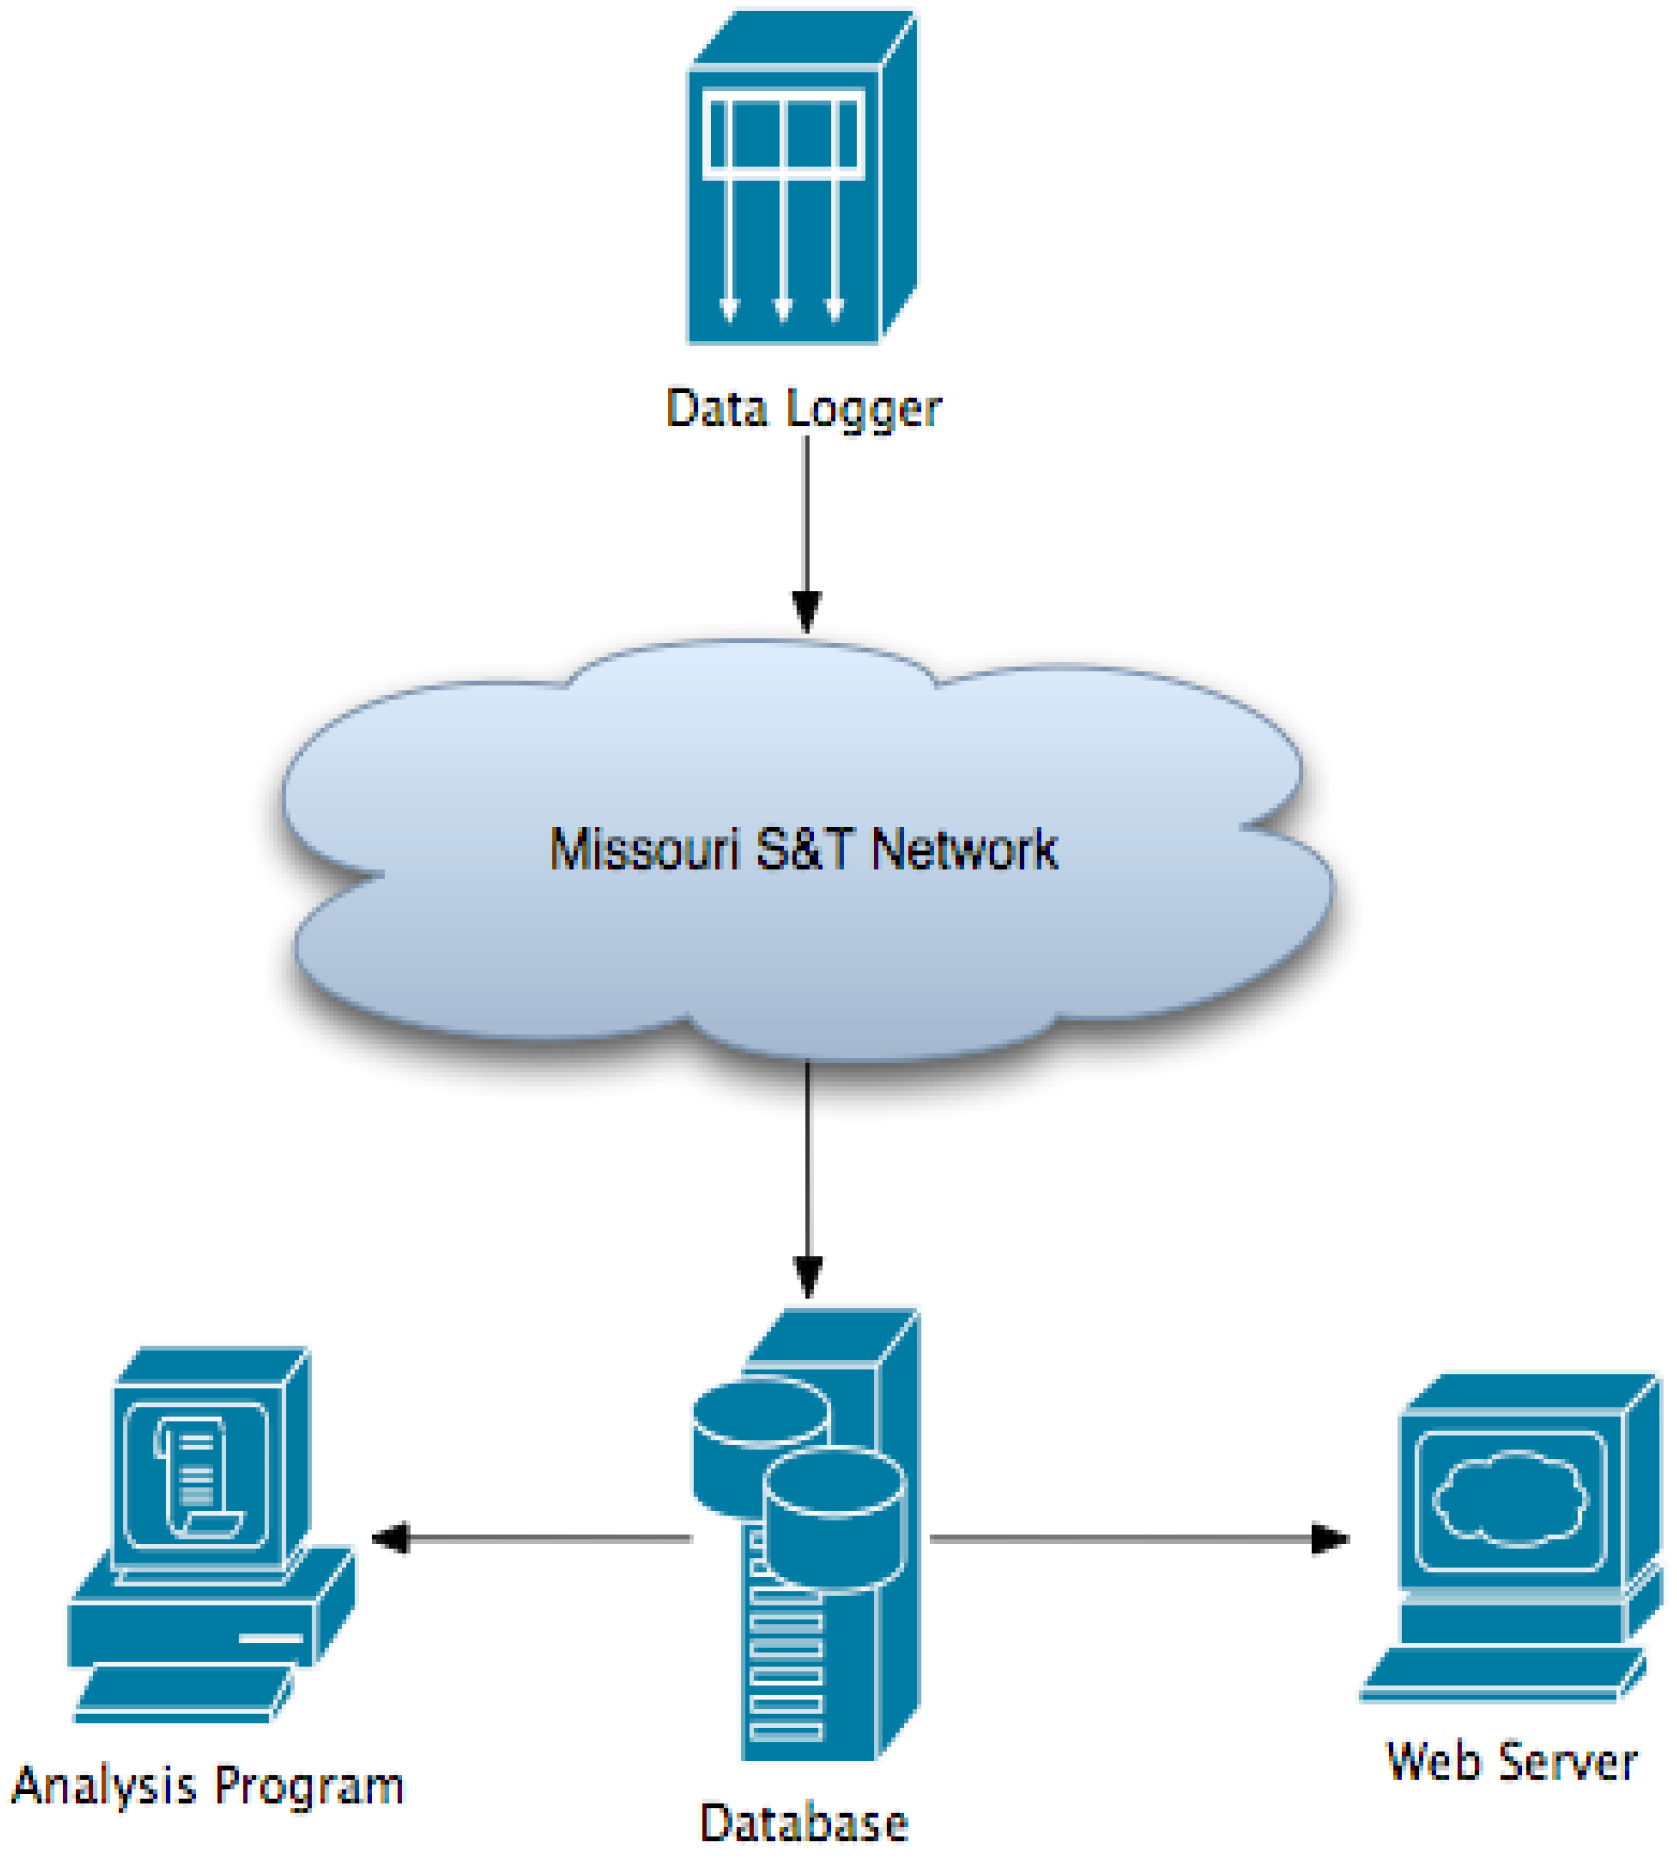
3.1. Sensor Network
3.2. Identified Sensors

| Purpose | Frequency | Measurement Quantity | ||||||||
|---|---|---|---|---|---|---|---|---|---|---|
| Model Calibration | Weather File | Occupancy Behavior | 1-minute data | 5-second data | 2002 House | 2005 House | 2007 House | |||
| Outside air | Temperature | F | x | x | 1 | 1 | 1 | |||
| Outside air | Humidity | %RH | x | x | 1 | 1 | 1 | |||
| Solar radiation | Solar Radiation | W/m2 | x | x | 4 | 4 | 4 | |||
| Wind speed | Speed | mpg | x | x | 1 | 1 | 1 | |||
| Wind direction | Direction | degrees | x | x | 1 | 1 | 1 | |||
| AC energy drawn by 240V branch circuits | AC Energy | Wh | x | x | 4 | 4 | 4 | |||
| AC energy drawn by 120V branch circuits | AC Energy | Wh | x | x | 16 | 16 | 16 | |||
| Refrigerator | Temperature | F | x | x | 1 | 1 | 1 | |||
| Freezer | Temperature | F | x | x | 1 | 1 | 1 | |||
| Clothes washer | Temperature | F | x | x | 1 | 1 | 1 | |||
| Clothes dryer | Temperature | F | x | x | 1 | 1 | 1 | |||
| Dishwasher | Temperature | F | x | x | 1 | 1 | 1 | |||
| Cold water mains | Volumetric Flow | gallons | x | x | 1 | 1 | 1 | |||
| Domestic hot water | Volumetric Flow | gallons | x | x | 1 | 1 | 1 | |||
| Cold water mains | Temperature | F | x | x | x | 1 | 1 | 1 | ||
| Domestic hot water | Temperature | F | x | x | x | 2 | 2 | 3 | ||
| Supply air | Temperature | F | x | x | 1 | 1 | 1 | |||
| Return air | Temperature | F | x | x | 1 | 1 | 1 | |||
| Bi-directional AC energy to/from grid | AC Energy | Wh | x | x | 1 | 1 | 1 | |||
| Bi-directional AC energy to/from inverters | AC Energy | Wh | x | x | 2 | 2 | 2 | |||
| Hydronic heating and cooling loops | Temperature | F | x | x | 8 | 8 | ||||
| Hydronic heating and cooling loops | Volumetric Flow | gallons | x | x | 1 | 1 | ||||
| Various spaces and surfaces | Illumination | fc | x | x | 3 | 3 | 3 | |||
| PV cell | Temperature | F | x | x | 4 | 4 | 4 | |||
| PV strings | DC Voltage | V | x | x | 4 | 4 | 4 | |||
| DC bus | DC Voltage | V | x | x | 1 | 1 | 1 | |||
| PV strings | DC Current | A | x | x | 4 | 4 | 3 | |||
| Charge controllers | DC Current | A | x | x | 4 | 4 | 3 | |||
| Batteries | DC Current | A | x | x | 1 | 1 | 1 | |||
| Inverters | DC Current | A | x | x | 2 | 2 | 2 | |||
| Collector loop | Volumetric Flow | gallons | x | x | 1 | 1 | 1 | |||
| Collector loop | Temperature | F | x | x | 2 | 2 | 2 | |||
| Hot water storage tank | Temperature | F | x | x | 3 | 3 | 3 | |||
| Conditioned zone air | Temperature | F | x | x | 2 | 2 | 2 | |||
| Conditioned zone air | Humidity | %RH | x | x | 2 | 2 | 2 | |||
| Unconditioned zone air | Temperature | F | x | x | 1 | 1 | 1 | |||
| Unconditioned zone air | Humidity | %RH | x | x | 1 | 1 | 1 | |||
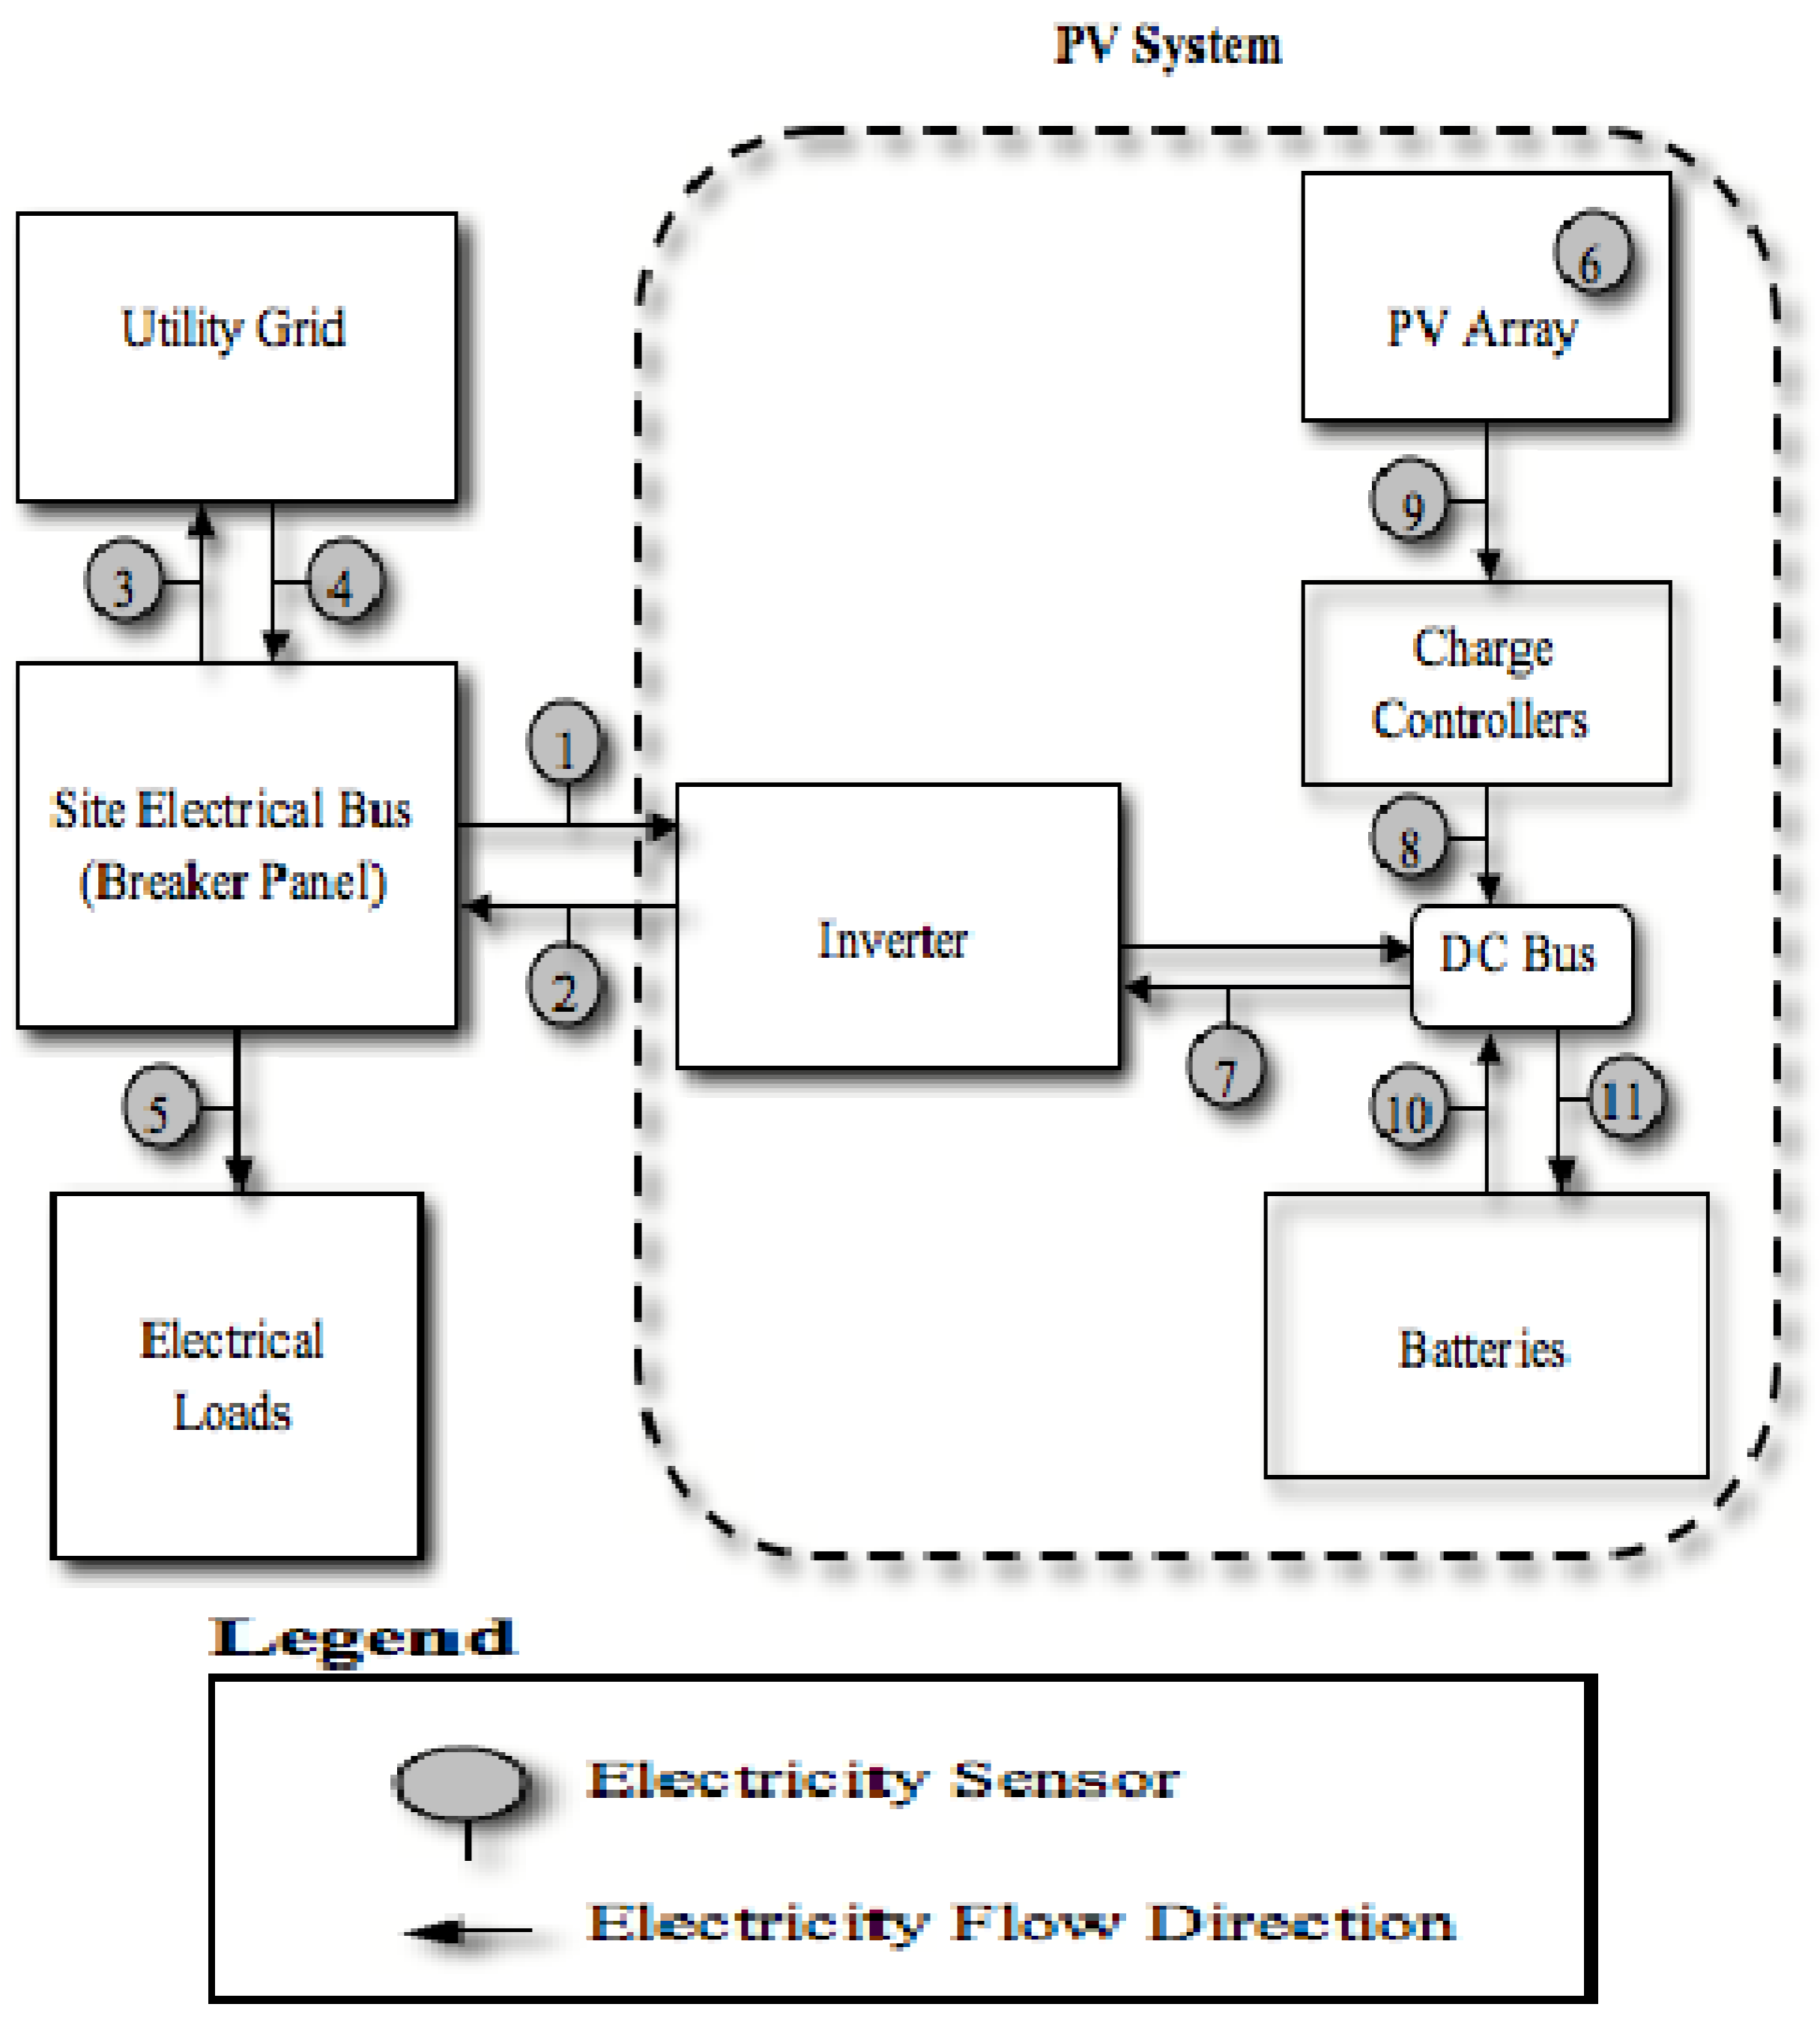
3.3. PV Performance

| Sensor # | Sensor Measurement Description |
|---|---|
| 1 | PV System Standby Use |
| 2 | Total PV System AC Production |
| 3 | Total Electric Delivered To the Utility |
| 4 | Total Electric Consumed From the Utility |
| 5 | Total Facility Electricity Use |
| 6 | Incident Solar Radiation |
| 7 | Inverter DC Power |
| 8 | PV Array Production after Charge Controllers |
| 9 | PV Array Production |
| 10 | Battery Bank Output |
| 11 | Battery Bank Input |
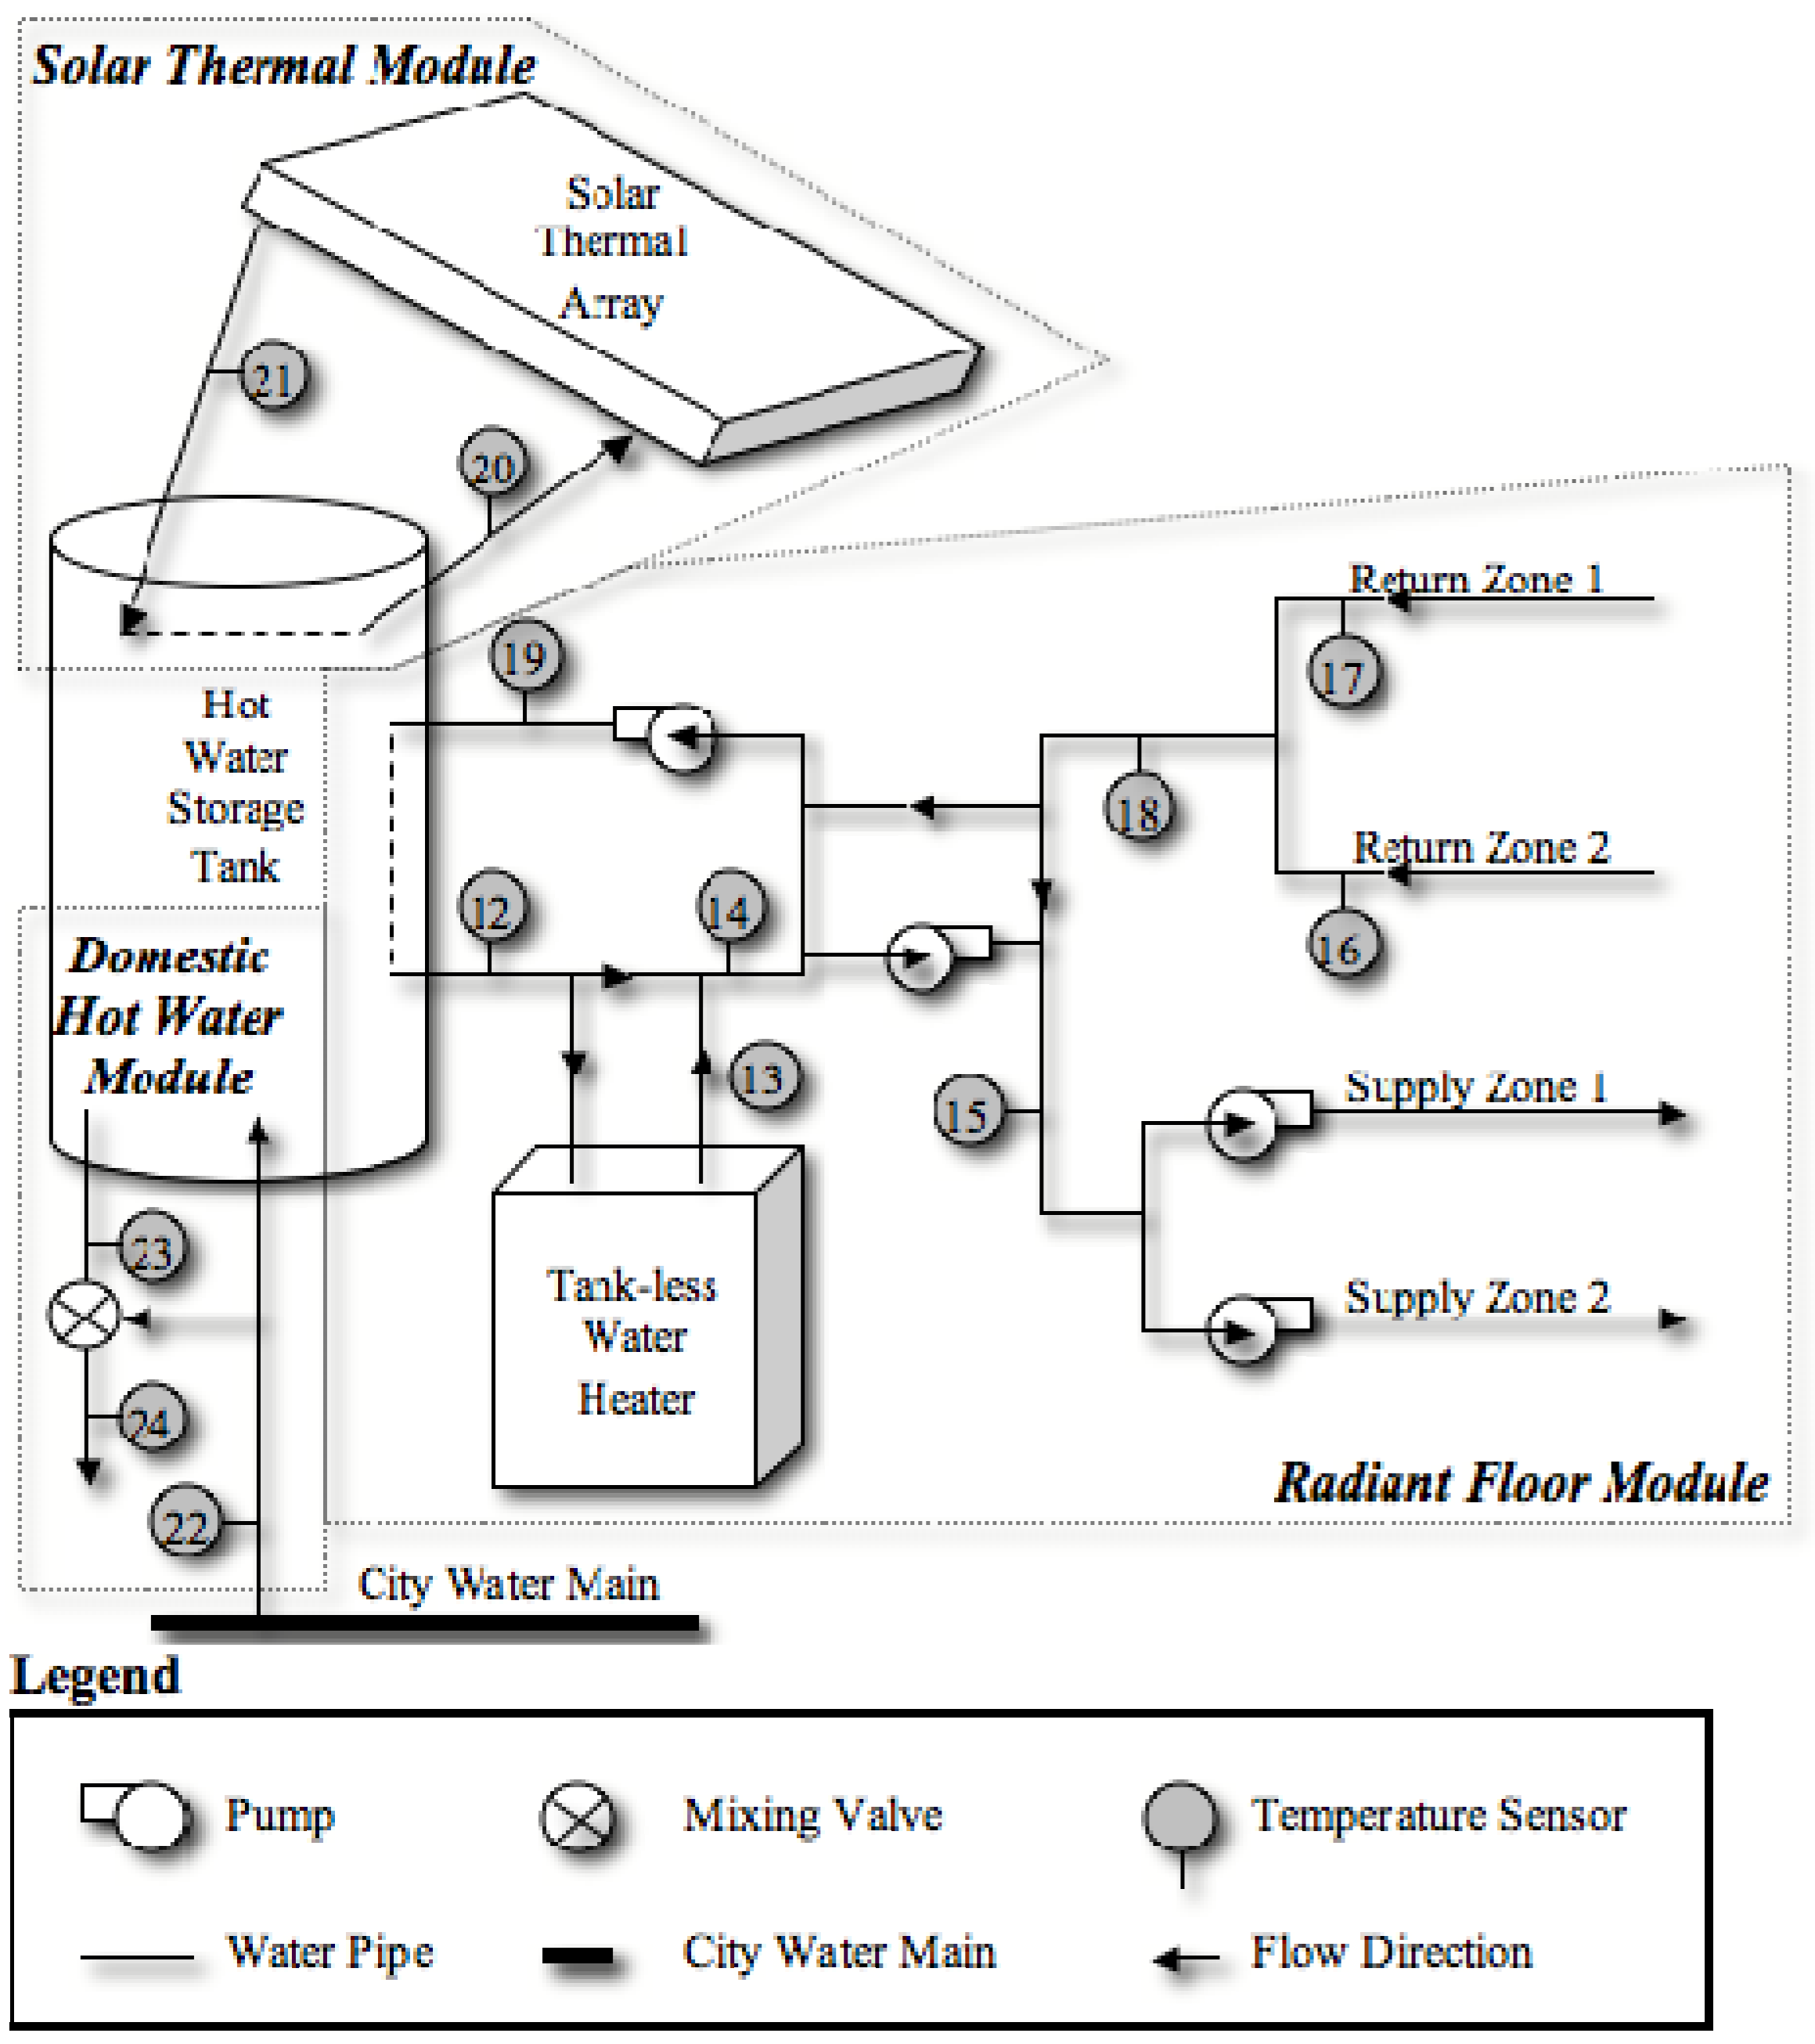
3.4. HVAC Performance
| Sensor # | Sensor Measurement Description |
|---|---|
| 12 | Radiant Floor Tank Output Temperature |
| 13 | Tank-less Heater Temperature |
| 14 | Primary Loop Supply Temperature |
| 15 | Zone Supply Temperature |
| 16 | Zone 2 Return Temperature |
| 17 | Zone 1 Return Temperature |
| 18 | Mixed Return Temperature |
| 19 | Radiant Floor Tank Return Temperature |
| 20 | Solar Thermal Array Input Temperature |
| 21 | Solar Thermal Array Output Temperature |
| 22 | City Water Main Supply Temperature |
| 23 | Hot Water Tank Supply Temperature |
| 24 | Domestic Hot Water Supply Temperature |
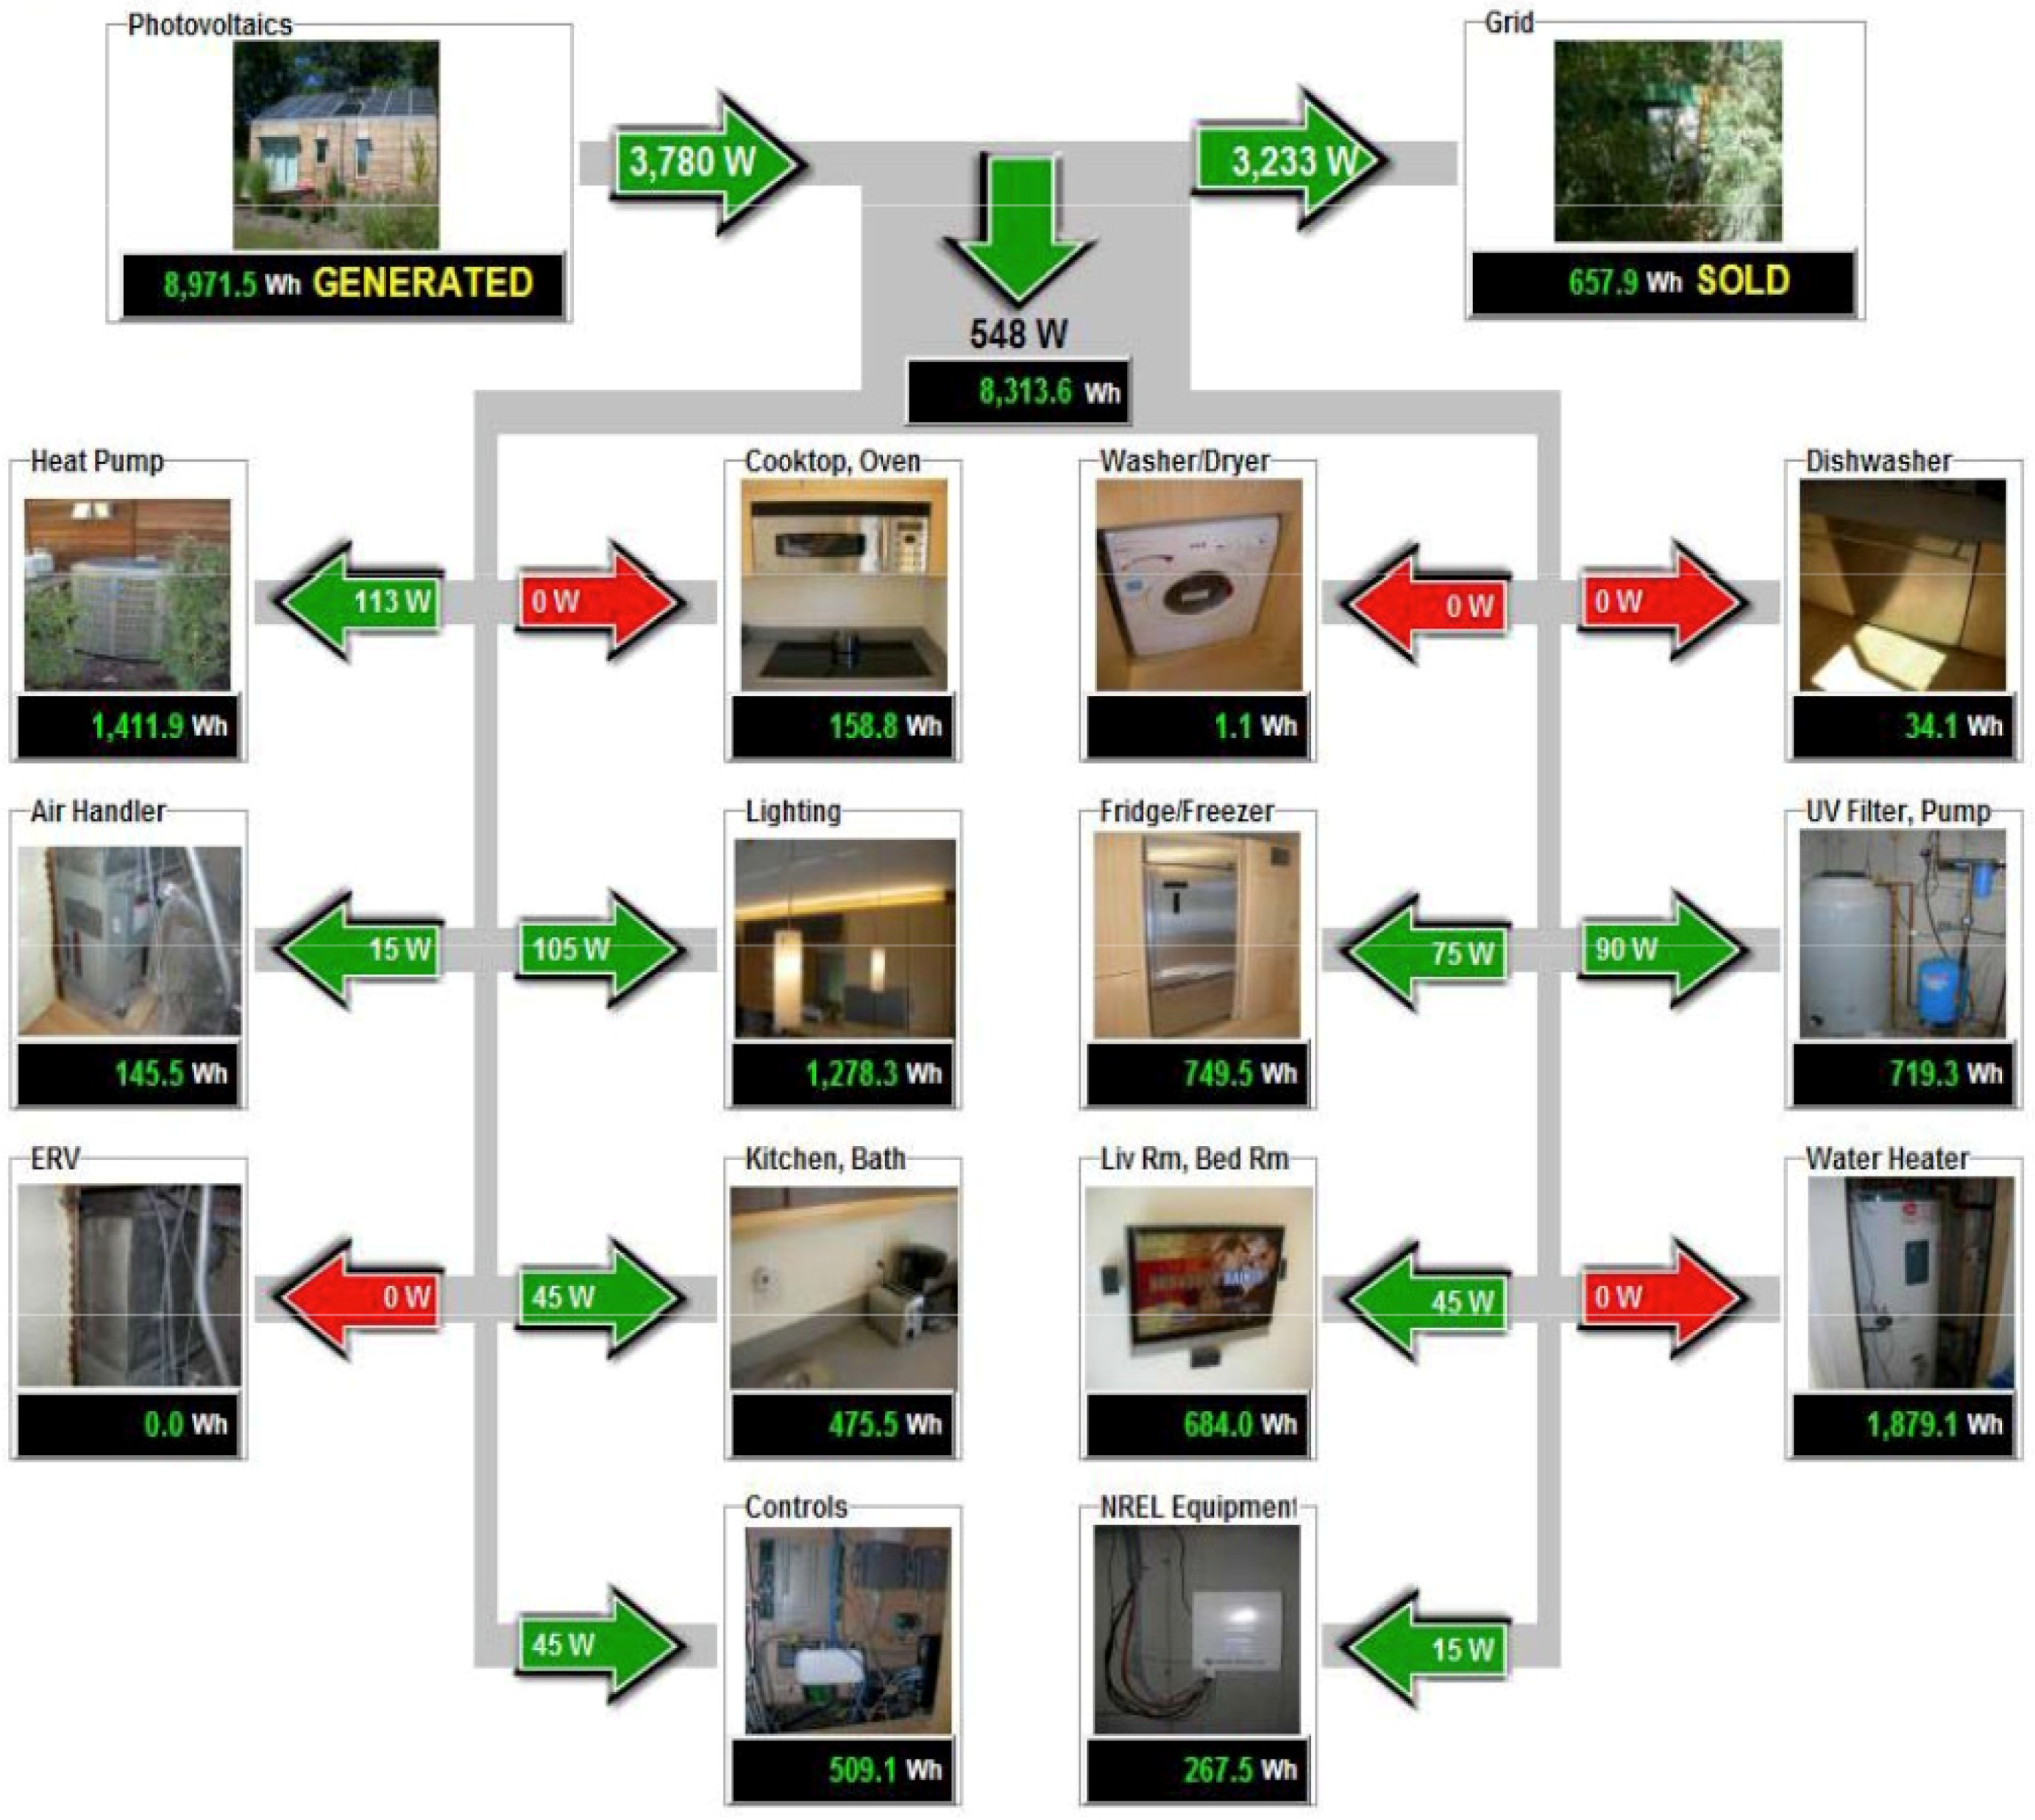
3.5. Feedback Interface
3.6. Resident Performance Survey

4. Conclusions
- Developing a building energy use model based upon the homes.
- Validate energy modeling programs with data collected at solar village and identifying possible improvements.
- Identifying a marketable residential sensor network.
- Developing performance control algorithms.
Acknowledgements
References and Notes
- Building America–Building Technologies Program. Energy Efficiency and Renewable Energy, United States Department of Energy: Washington, DC, USA, 2010. Available online: http://www1.eere.energy.gov/buildings/building_america/ (Accessed on 20 January 2009).
- Independent Statistics and Analysis. United States Energy Information Administration: Washington, DC, USA, 2010. Available online: http://www.eia.doe.gov/ (Accessed on 15 January 2009).
- Deru, M.; Torcellini, P. Performance Metrics Research Project; NREL/TP-550-38700; National Renewable Energy Laboratory: Golden, CO, USA, October 2005.
- Barley, D.; Deru, M.; Pless, S.; Torcellini, P. Procedure for Measuring and Reporting Commercial Building Energy Performance; NREL/TP-550-38601; National Renewable Energy Laboratory: Golden, CO, USA, October 2005.
- Pless, S.; Deru, M.; Torcellini, P.; Hayter, S. Procedure for Measuring and Reporting the Performance of Photovoltaic Systems in Buildings; NREL/TP-550-38603; National Renewable Energy Laboratory: Golden, CO, USA, October 2005.
- Wassmer, M. Solar Decathlon: Long-Term Monitoring and Benchmarking. In Presented to United States Department of Energy Building Technologies and Solar Energy Technologies Programs, Golden, Colorado, USA, October 2008; p. 23.
© 2010 by the authors; licensee MDPI, Basel, Switzerland. This article is an open access article distributed under the terms and conditions of the Creative Commons Attribution license (http://creativecommons.org/licenses/by/3.0/).
Share and Cite
Wright, C.; Baur, S.; Grantham, K.; Stone, R.B.; Grasman, S.E. Residential Energy Performance Metrics. Energies 2010, 3, 1194-1211. https://doi.org/10.3390/en3061194
Wright C, Baur S, Grantham K, Stone RB, Grasman SE. Residential Energy Performance Metrics. Energies. 2010; 3(6):1194-1211. https://doi.org/10.3390/en3061194
Chicago/Turabian StyleWright, Christopher, Stuart Baur, Katie Grantham, Robert B. Stone, and Scott E. Grasman. 2010. "Residential Energy Performance Metrics" Energies 3, no. 6: 1194-1211. https://doi.org/10.3390/en3061194