1. Introduction
The use of energy simulation software has increased significantly in the past ten years as consumers, engineers, and architects become more interested in applying energy conservation and efficiency techniques [
1]. With the advances in energy simulation programs numerous research studies have been looking at ways to better predict building energy performance through the use of computer generated models [
2,
3,
4,
5]. Many different software packages exist such as Energy-10, EnergyPlus and Ecotect to perform this task, several of which have been developed within the Department of Energy [
6]. These simulations often target “energy retrofits”, focusing on decreasing or offsetting the overall energy use of a building by implementing more efficient equipment, improving the building envelope, and optimizing operating conditions.
There is a biennial competition that challenges colleges and universities from around the world to create energy-efficient residential homes. The U.S. Department of Energy Solar Decathlon joins 20 international, collegiate teams in a competition to design, build, and operate the most attractive and energy-efficient solar-powered house [
7]. This competition includes both objective and subjective contests. Students from Missouri University of Science and Technology (Missouri S&T) have participated in this prestigious competition since its conception, producing homes that have ranked well overall. However, there has been little comparison between the solar houses predicted performance and competition performance in order to improve future designs.
2. Scope of Work
Having recently competed in the 2009 Solar Decathlon Competition, the solar house team at Missouri S&T decided to use the information gathered by the U.S. Department of Energy during the scoring and monitoring of the house to create an energy model. This model was begun after the completion of the competition using the Energy-10 software program which was chosen due to its user-friendly interface. The intention of this simulation was to model the home as it was tested during competition, and to use the resulting charts and graphs to conclude if an energy model could be used in the future to predict the performance of the house prior to competition.
Energy-10 Version 1.8 software by the National Renewable Energy Laboratory was used to simulate Team Missouri’s 2009 entry into the U.S. Department of Energy’s Solar Decathlon. An initial simulation was performed prior to the competition using Energy-10 Version 1.7 for design purposes; however, a revised more accurate simulation was performed after the competition using Version 1.8, allowing data collected during the competition to be used in the analysis.
3. House Description
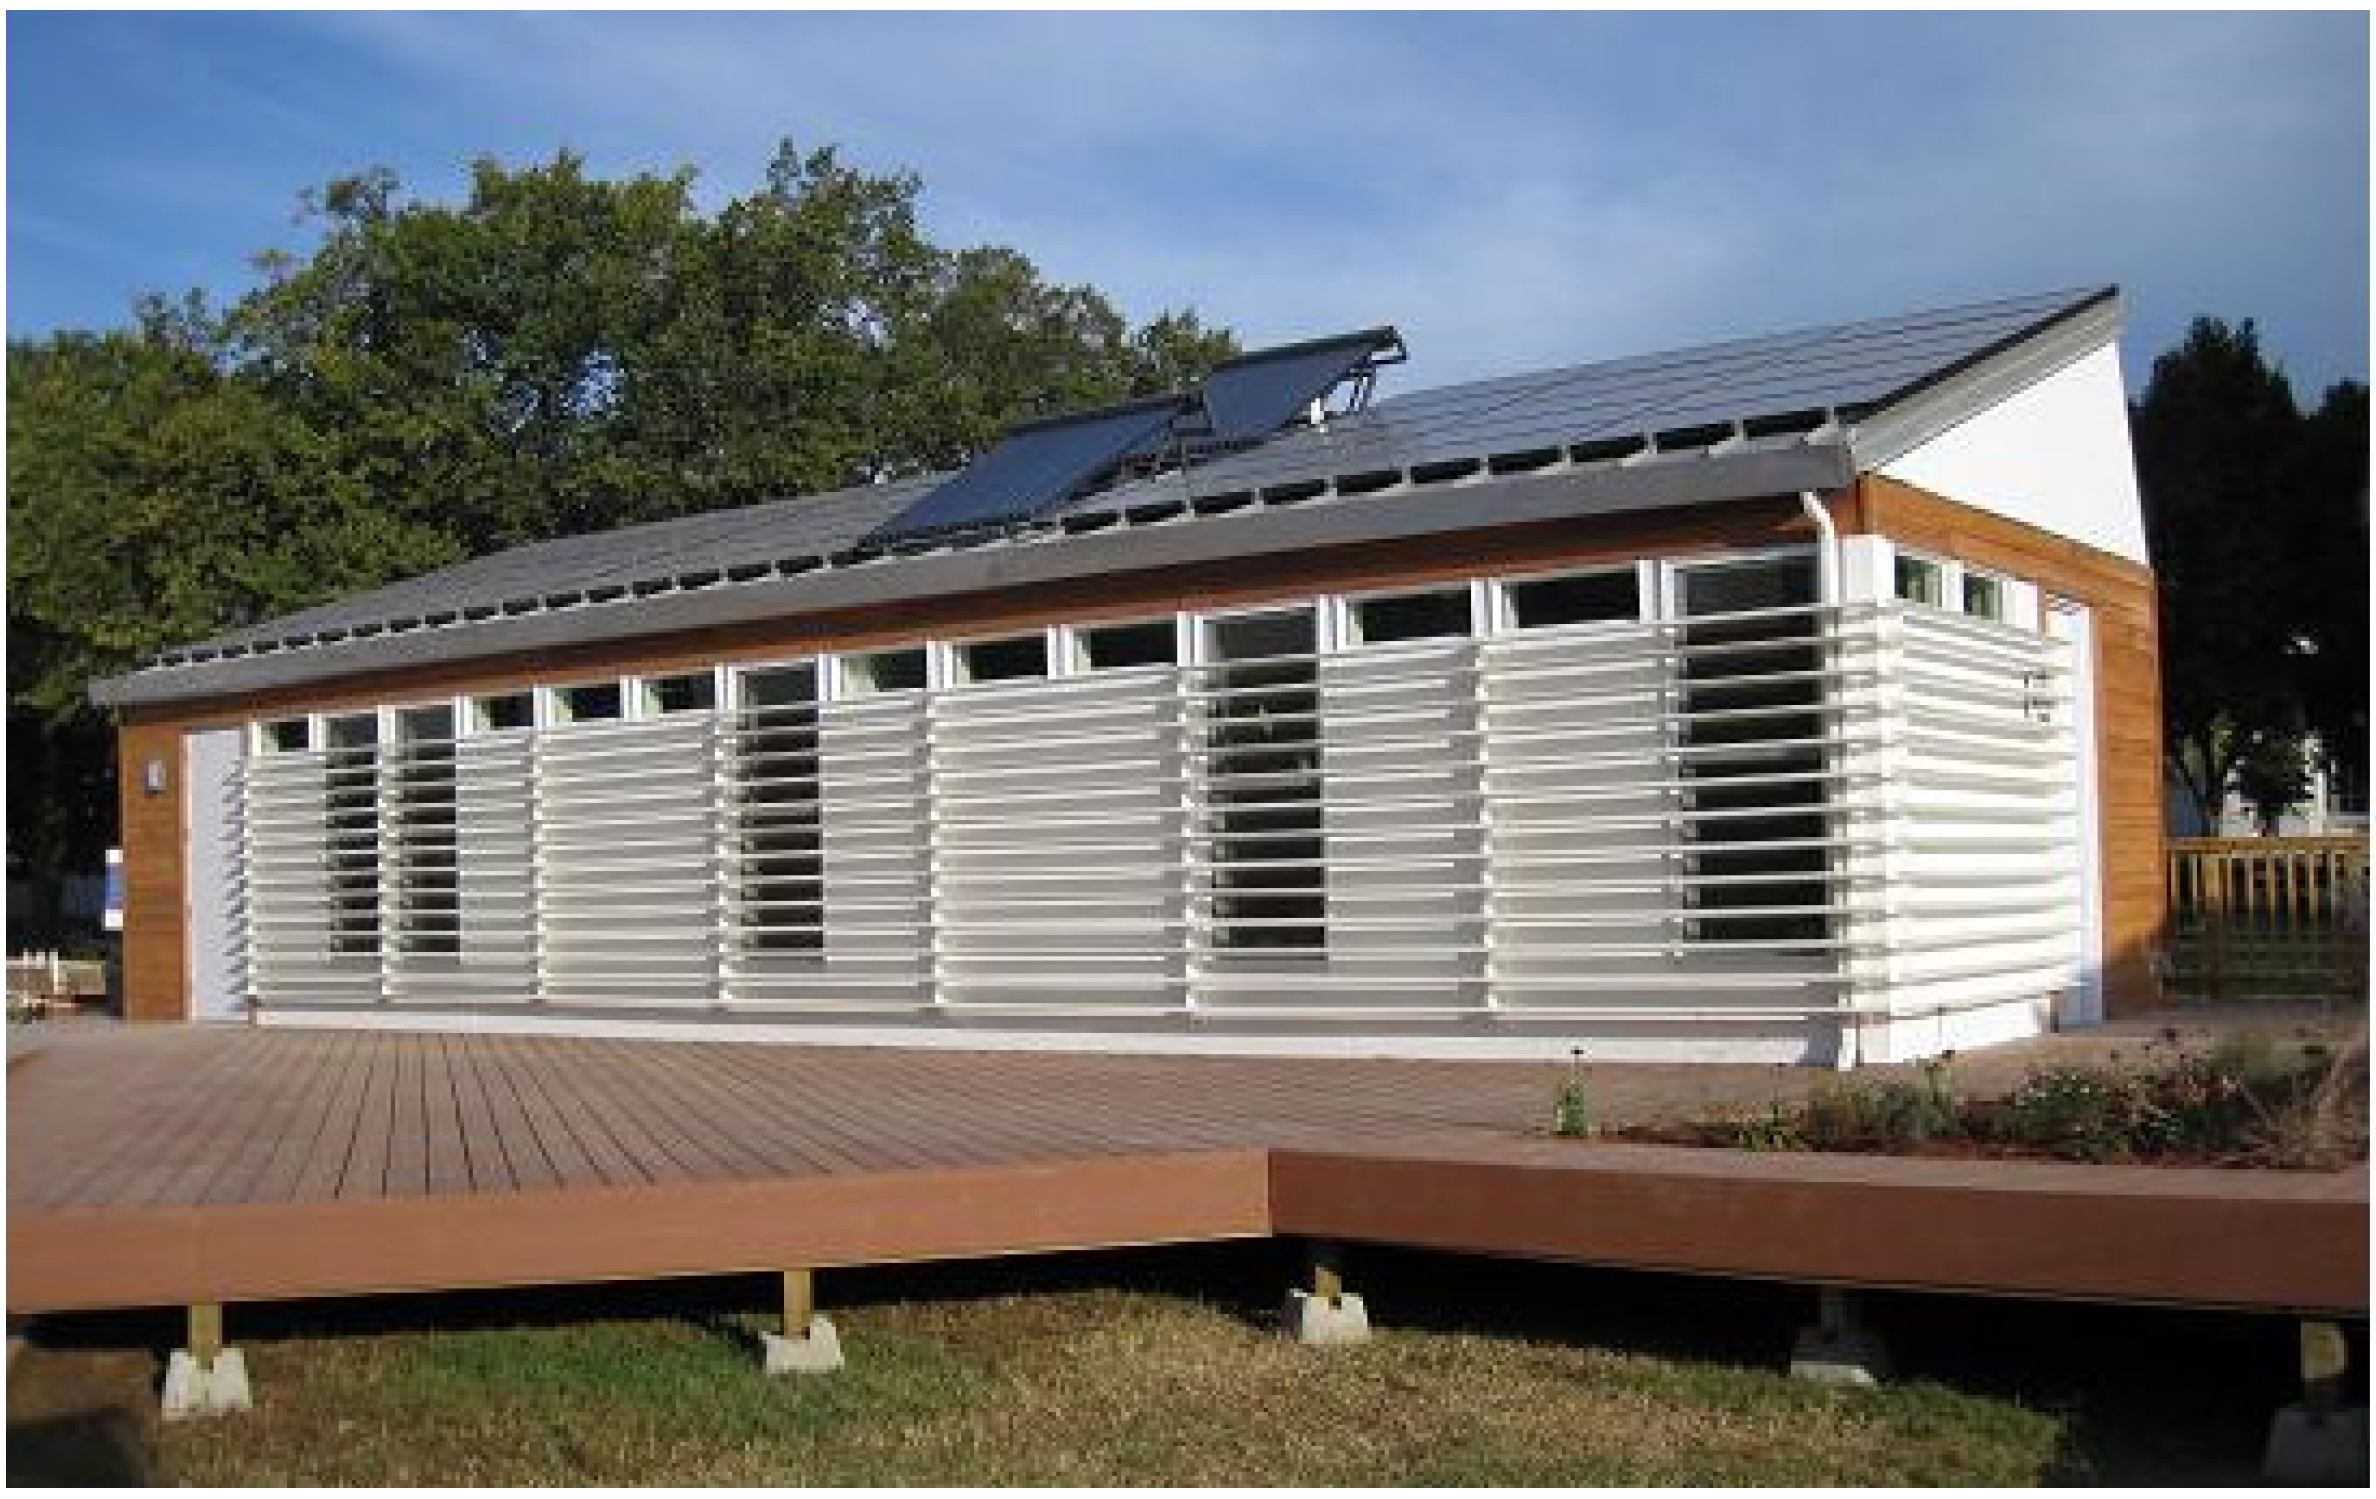
Team Missouri’s 2009 Solar Decathlon entry (
Figure 1) featured an 8 kW photovoltaic (PV) array with a solar thermal array composed of evacuated tubes. The south side of the home utilizes a stationary louver system for passive heating and cooling. The structure is composed of Structurally Insulated Panels (SIPS) and utilizes a reversible heat pump as well as radiant floor heating. A home energy monitoring system, ‘Chameleon’, was developed to monitor the homes environment and energy usage. Accessible via touch screens located throughout the house, users are able to control the LED lighting, operable clerestory windows and shades. The chameleon system monitors weather conditions and runs the appliances at the time when operation will be most energy efficient.
Figure 1.
Team Missouri’s 2009 Solar Decathlon entry.
Figure 1.
Team Missouri’s 2009 Solar Decathlon entry.
4. Brief Overview of the 2009 Solar Decathlon Competition
The 2009 Solar Decathlon Competition took place on the National Mall in Washington D.C. from 8–21 October 2009. The competition allows the teams two years to design and construct their homes. Due to the location, the homes did not only need to be efficient and attractive, they had to be transportable. Therefore, teams were given 7 days to reconstruct their house, test their systems, and tie to the grid. Once constructed, there were 8 days of competition and public tours. During this time, each of the 20 teams had to showcase and test their all electric, solar powered homes. This included jury tours, cooking dinner, doing laundry, and maintaining indoor temperature. The objective contests were the only ones that were taken into consideration during the energy analysis of the home and will be the only ones described in this section. A detailed breakdown of all contests can be found at the Solar Decathlon website [
7]. Daily measurements for the 5 objective contests were taken from 8–16 October The 5 objective contests included: Comfort Zone, Hot Water, Appliances, Home Entertainment, and Net Metering. A breakdown of the requirements of these contests is as follows:
Comfort Zone:
- ○
22 °C (72 °F) ≤ Temperature ≤ 24 °C (76 °F)
- ○
40% ≤ Relative Humidity ≤ 60%
Appliances:
- ○
1.11 °C (34 °F) ≤ Refrigerator Temperature ≤ 4.44 °C (40 °F)
- ○
–29 °C (–20 °F) ≤ Freezer Temperature ≤ –15 °C (–5 °F)
- ○
Clothes Washer: run one complete, uninterrupted cycle within a specified period of time with the temperature reaching at least 43.3 °C (110 °F) at one point during the cycle
- ○
Clothes Dryer: return a load of laundry to equal to or less than the total weight of the load before washing
- ○
Dishwasher: run a complete, uninterrupted cycle within a specified period of time with the temperature reaching at least 48.9 °C (120 °F) at one point during the cycle.
Home Entertainment:
- ○
Cooking: use a kitchen appliance to vaporize 2.268 kg (5 lb) of water within a specified amount of time.
- ○
Lighting:
- ▪
Workstation: keep the workstation desk surface light level above 538 lux (50 foot-candles) during the scoring period
- ▪
House: keep all interior and exterior lights on during specified periods of time
- ○
Dining: host two dinner parties for neighbors during contest week
- ○
Public Exhibit: have computer, TV, and home automation displays on during public and jury tours
- ○
Home Theater: host one movie night for neighbors during contest week
Hot Water:
- ○
56.8 L (15 gal) of hot water must be drawn in no more than 10 minutes and must reach a minimum temperature of 43.3 °C (110 °F)
Net Metering:
- ○
produce a net amount of AC electrical energy of 0.0 kWh or more
Portions of the contests, affecting the scoring of the teams and the results of the competition, but not affecting the energy simulation were not described. These 5 contests were intended to simulate the use of the house as if it were being lived in, and most of the contests occurred once daily throughout the 8 days.
5. Simulation
Energy-10 is a software tool that, when used in the design phase, can help architects, engineers, and builders quickly identify the most cost-effective and energy-saving measures to implement when designing a low-energy building [
8]. More than a dozen sustainable design strategies can be chosen from to find the best fit for a particular location or situation such as passive solar, photovoltaics, and high efficiency HVAC [
6].
Initially, several factors such as building size, materials, construction methods and location were used to generate the base model. Next, more detailed information about the structure was incorporated, such as the number, size, and thermal properties of windows, doors, walls, the floor, and the roof [
7]. In order to achieve this, the density, specific heat, and thermal conductivity of several materials had to be added to the material database. This included oriented strand board (OSB), polyurethane foam, and Warmboard Radiant Flooring [
9].
Specific information regarding system components were updated to the simulation as well. These included the BP Solar SX3200 photovoltaic (PV) panels, the Fronius inverter, and the Apricus evacuated tubes as provided by the manufacturers [
11,
12,
13,
14]. One Energy-10 input that was found to affect the results of the simulation significantly is the Internal Gains dialog box. This tab requires inputting the entire load for all internal lights, external lights, people (in number), hot water, and other. The “Other” category covers all loads that are not included in the aforementioned categories, such as HVAC loads, appliances, and other plug loads. The values in each category are not simulated individually; they are simulated as a total load. All of the internal and external lights in the house were LED with the exception of one fluorescent fixture. Therefore, the major loads in the home came from the “Hot Water” and “Other” categories. The appliances and equipment that fall under this category and are relevant to the performance of the house during competition are summarized in
Table 1.
Table 1.
The various appliances and wattages used in Team Missouri’s solar house entry during 2009 Solar Decathlon.
Table 1.
The various appliances and wattages used in Team Missouri’s solar house entry during 2009 Solar Decathlon.
| Hot Water | |
| Appliance | Power (W) |
| Water Heater [15] | 10450 |
| Water Heater (Radiant) [16] | 0 |
| Dishwasher [17] | 1510 |
| TOTAL | 11960 |
| Watts per sq. m. | 200.3 |
| (Watts per sq. ft.) | (18.60) |
| OTHER | |
| Appliance | Power (W) |
| Washer [18] | 330 |
| Dryer [19] | 5760 |
| Refrigerator [20] | 52 |
| Oven [21] | 2900 |
| Cooktop [22] | 2960 |
| Air Heat Pump [23] | 1320 |
| TOTAL | 13322 |
| Watts per sq. m | 223.2 |
| (Watts per sq. ft.) | (20.72) |
The wattages of the equipment and appliances are summarized in
Table 1. These values are taken from the loads provided by the manufacturers. Some of the peak manufacturer loads were reduced based on the actual usage of these elements during competition, as well as to Energy Star Energy Guides for the refrigerator, dishwasher, and washer. For example, the domestic water heater was reduced by 5% because during competition it was never operated at peak load. The radiant water heater was reduced to zero because the system was not sufficient at keeping the interior temperature consistent and was turned off within the first two days. The heating for the house was then controlled by the air heat pump. The oven and cooktop loads were reduced based on the cooking portion of the competition (
i.e. the cooktop was reduced to the equivalent load of the 2 largest burners which would have been the maximum usage during that time).
After all of these values were found and accounted for, the total wattage was divided by the finished floor space of the house, 59.7 sq. m (643 sq. ft.) to give watts per square meter. These values were then placed in the Internal Gains tab, and the hourly profiles of each category were calculated. These hourly profiles, shown in
Table 2, were approximated based on the operation schedule of the house during competition. An explanation of what loads were in use during these hours is shown in
Table 3.
Table 2.
Load profile for internal gains for weekend.
Table 2.
Load profile for internal gains for weekend.
| Load | 1 | | | | | 6 | | | | | | 12 | | | | | | 18 | | | | | | 24 |
|---|
| Internal Lights | 0 | 0 | 0 | 0 | 0 | 0 | 0 | 1 | 1 | 1 | 3 | 3 | 3 | 3 | 3 | 0 | 0 | 0 | P | P | P | 0 | 0 | 0 |
| External Lights | 0 | 0 | 0 | 0 | 0 | 0 | 0 | 0 | 0 | 0 | 0 | 0 | 0 | 0 | 0 | 0 | 0 | 0 | P | P | P | 0 | 0 | 0 |
| People | 0 | 0 | 0 | 0 | 0 | 0 | 2 | 2 | 6 | 0 | 0 | 0 | 0 | 0 | 0 | 0 | 6 | 6 | 6 | 6 | 6 | 0 | 0 | 0 |
| Hot Water | 0 | 0 | 0 | 0 | 0 | 0 | 0 | 0 | 1 | 0 | 0 | 0 | 0 | 0 | 0 | 0 | 1 | 0 | 1 | 0 | 0 | 0 | 0 | 0 |
| Other | 1 | 1 | 1 | 1 | 1 | 1 | 1 | 1 | 1 | 0 | 0 | 0 | 0 | 0 | 0 | 0 | 4 | 8 | 3 | 1 | 1 | 1 | 1 | 1 |
Table 3.
Load profile calculations for weekend.
Table 3.
Load profile calculations for weekend.
| Load Type | Load Details | Relative Value |
| Internal Lights | | |
| 8:00 am–10:00 am | Task Lighting contest | 1 |
| 10:00 am–5:00 pm | Tour lighting | 3 |
| 5:00 pm–7:00 pm | No light usage | 0 |
| 7:00 pm–10:00 pm | All lights on full | P |
| 10:00 pm–8:00 am | No light usage | P |
| External Lights | | |
| 7:00 pm–10:00 pm | All lights on full | P |
| 10:00 pm–7:00 pm | No light usage | 0 |
| People | | |
| 7:00 am–9:00 am | Observer and Project Manager | 2 |
| 9:00 am–10:00 am | Team | 6 |
| 10:00 am–5:00 pm | Tours- no contests | 0 |
| 5:00 pm–10:00 pm | Team | 6 |
| 10:00 pm–7:00 am | No People | 0 |
| Hot Water | | |
| 9:00 am–10:00 am | Hot Water Draw | 1 |
| 10:00 am–5:00 pm | Tours- no hot water usage | 0 |
| 5:00 pm–6:00 pm | Dishwasher | 1 |
| 6:00 pm–7:00 pm | No hot water usage | 0 |
| 7:00 pm–8:00 pm | Hot Water Draw | 1 |
| 8:00 pm–9:00 am | No hot water usage | 0 |
| Other | | |
| 7:00 am–10:00 am | Air Heat Pump, Refrigerator, and Cooktop (cooking contest) | 1 |
| 10:00 am–5:00 pm | Tours- TV, Refrigerator, Computer, Touchscreens | 0 |
| 5:00 pm–6:00 pm | Cooktop, Washer, Air Heat Pump, Refrigerator | 4 |
| 6:00 pm–7:00 pm | Oven, Dryer, Air Heat Pump, Refrigerator | 8 |
| 7:00 pm–8:00 pm | Oven and Cooktop (warming only–50%), Air Heat Pump, Refrigerator | 3 |
| 8:00 pm–7:00 am | Air Heat Pump and Refrigerator | 1 |
The values inputted in
Table 2, from 1–9 with P being the Peak value, as stated before, were calculated based on what loads were occurring in the house, and what contests were being measured. No contests, with the exception of the internal lights and small loads such as the TV, computer and touchscreens, were measured during tour hours and therefore values during tours are most always zero. For example, he hot water draw contest required the team to draw 56.8 L (15 gal) of water from a 408.8 L (108 gal) tank. Therefore the number was calculated as follows based on the numbers from
Table 1:
Therefore “1” was inputted as the relative value for the hour during which the hot water draw occurred. Similar calculations were preformed based on the information presented in
Table 1 and
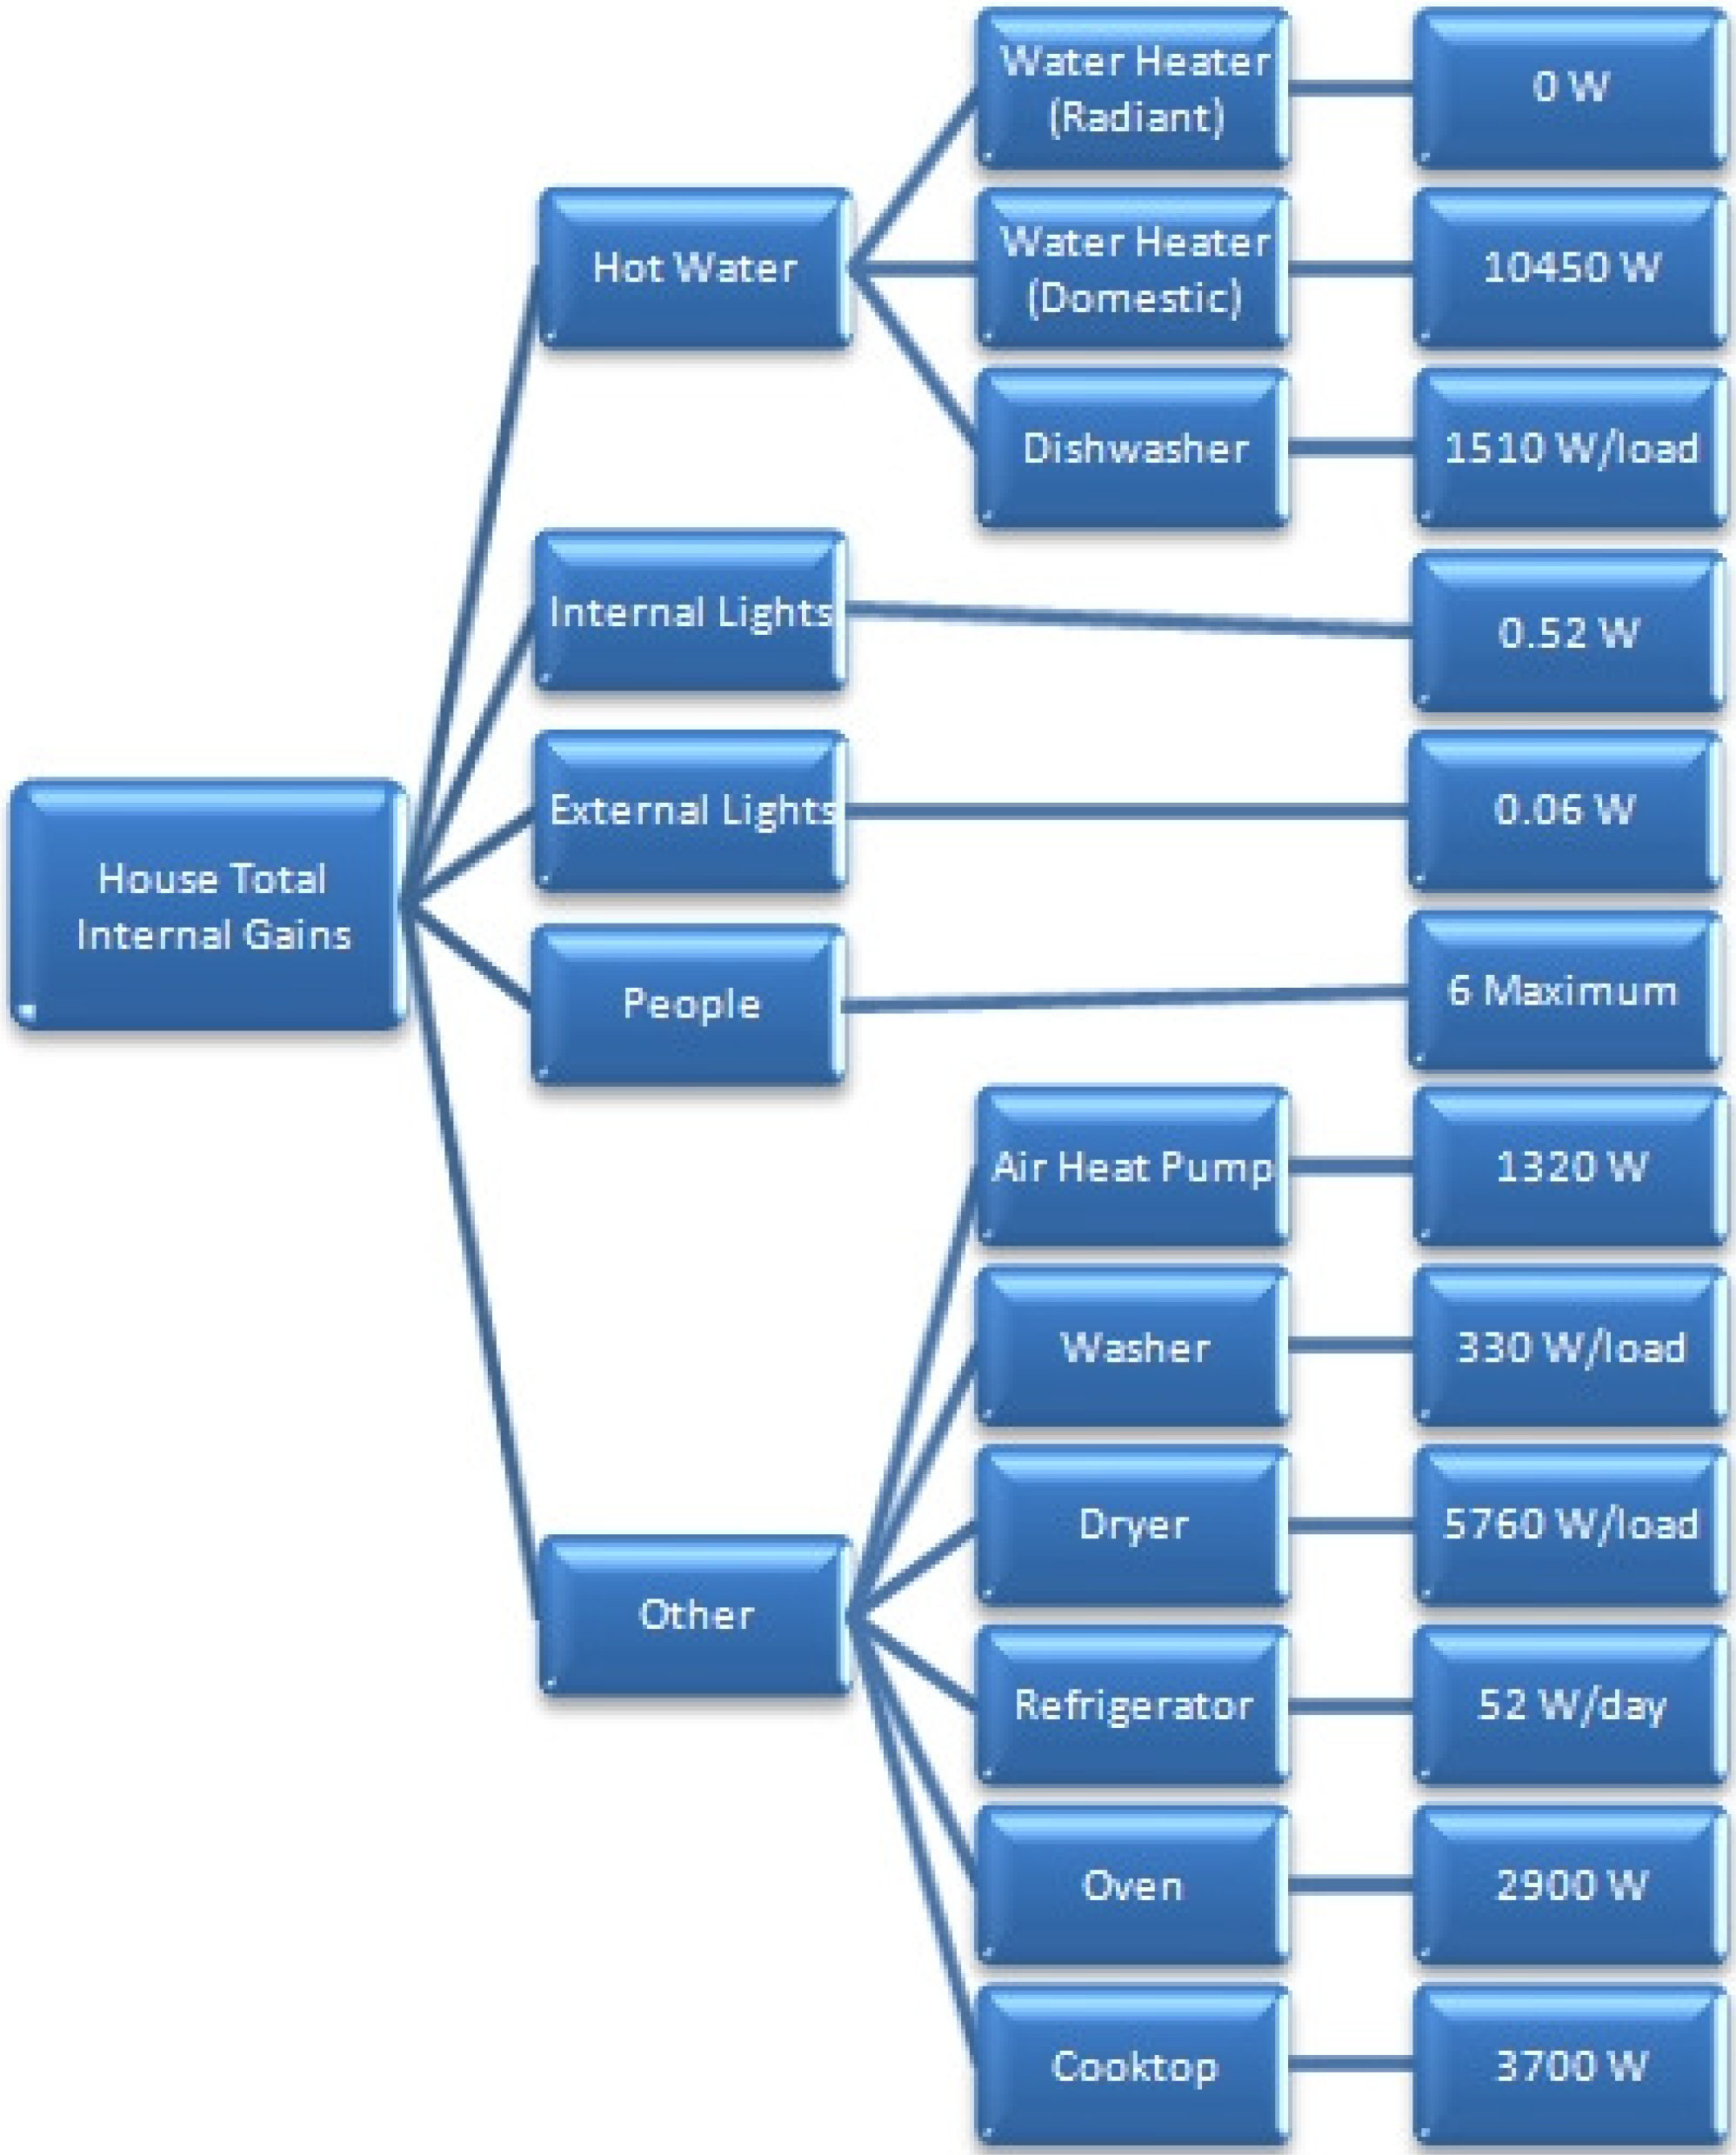
Table 3. A summary of all of the loads can be seen in
Figure 2.
Figure 2.
Summary of loads for Team Missouri’s 2009 solar house.
Figure 2.
Summary of loads for Team Missouri’s 2009 solar house.
6. Results and Discussion
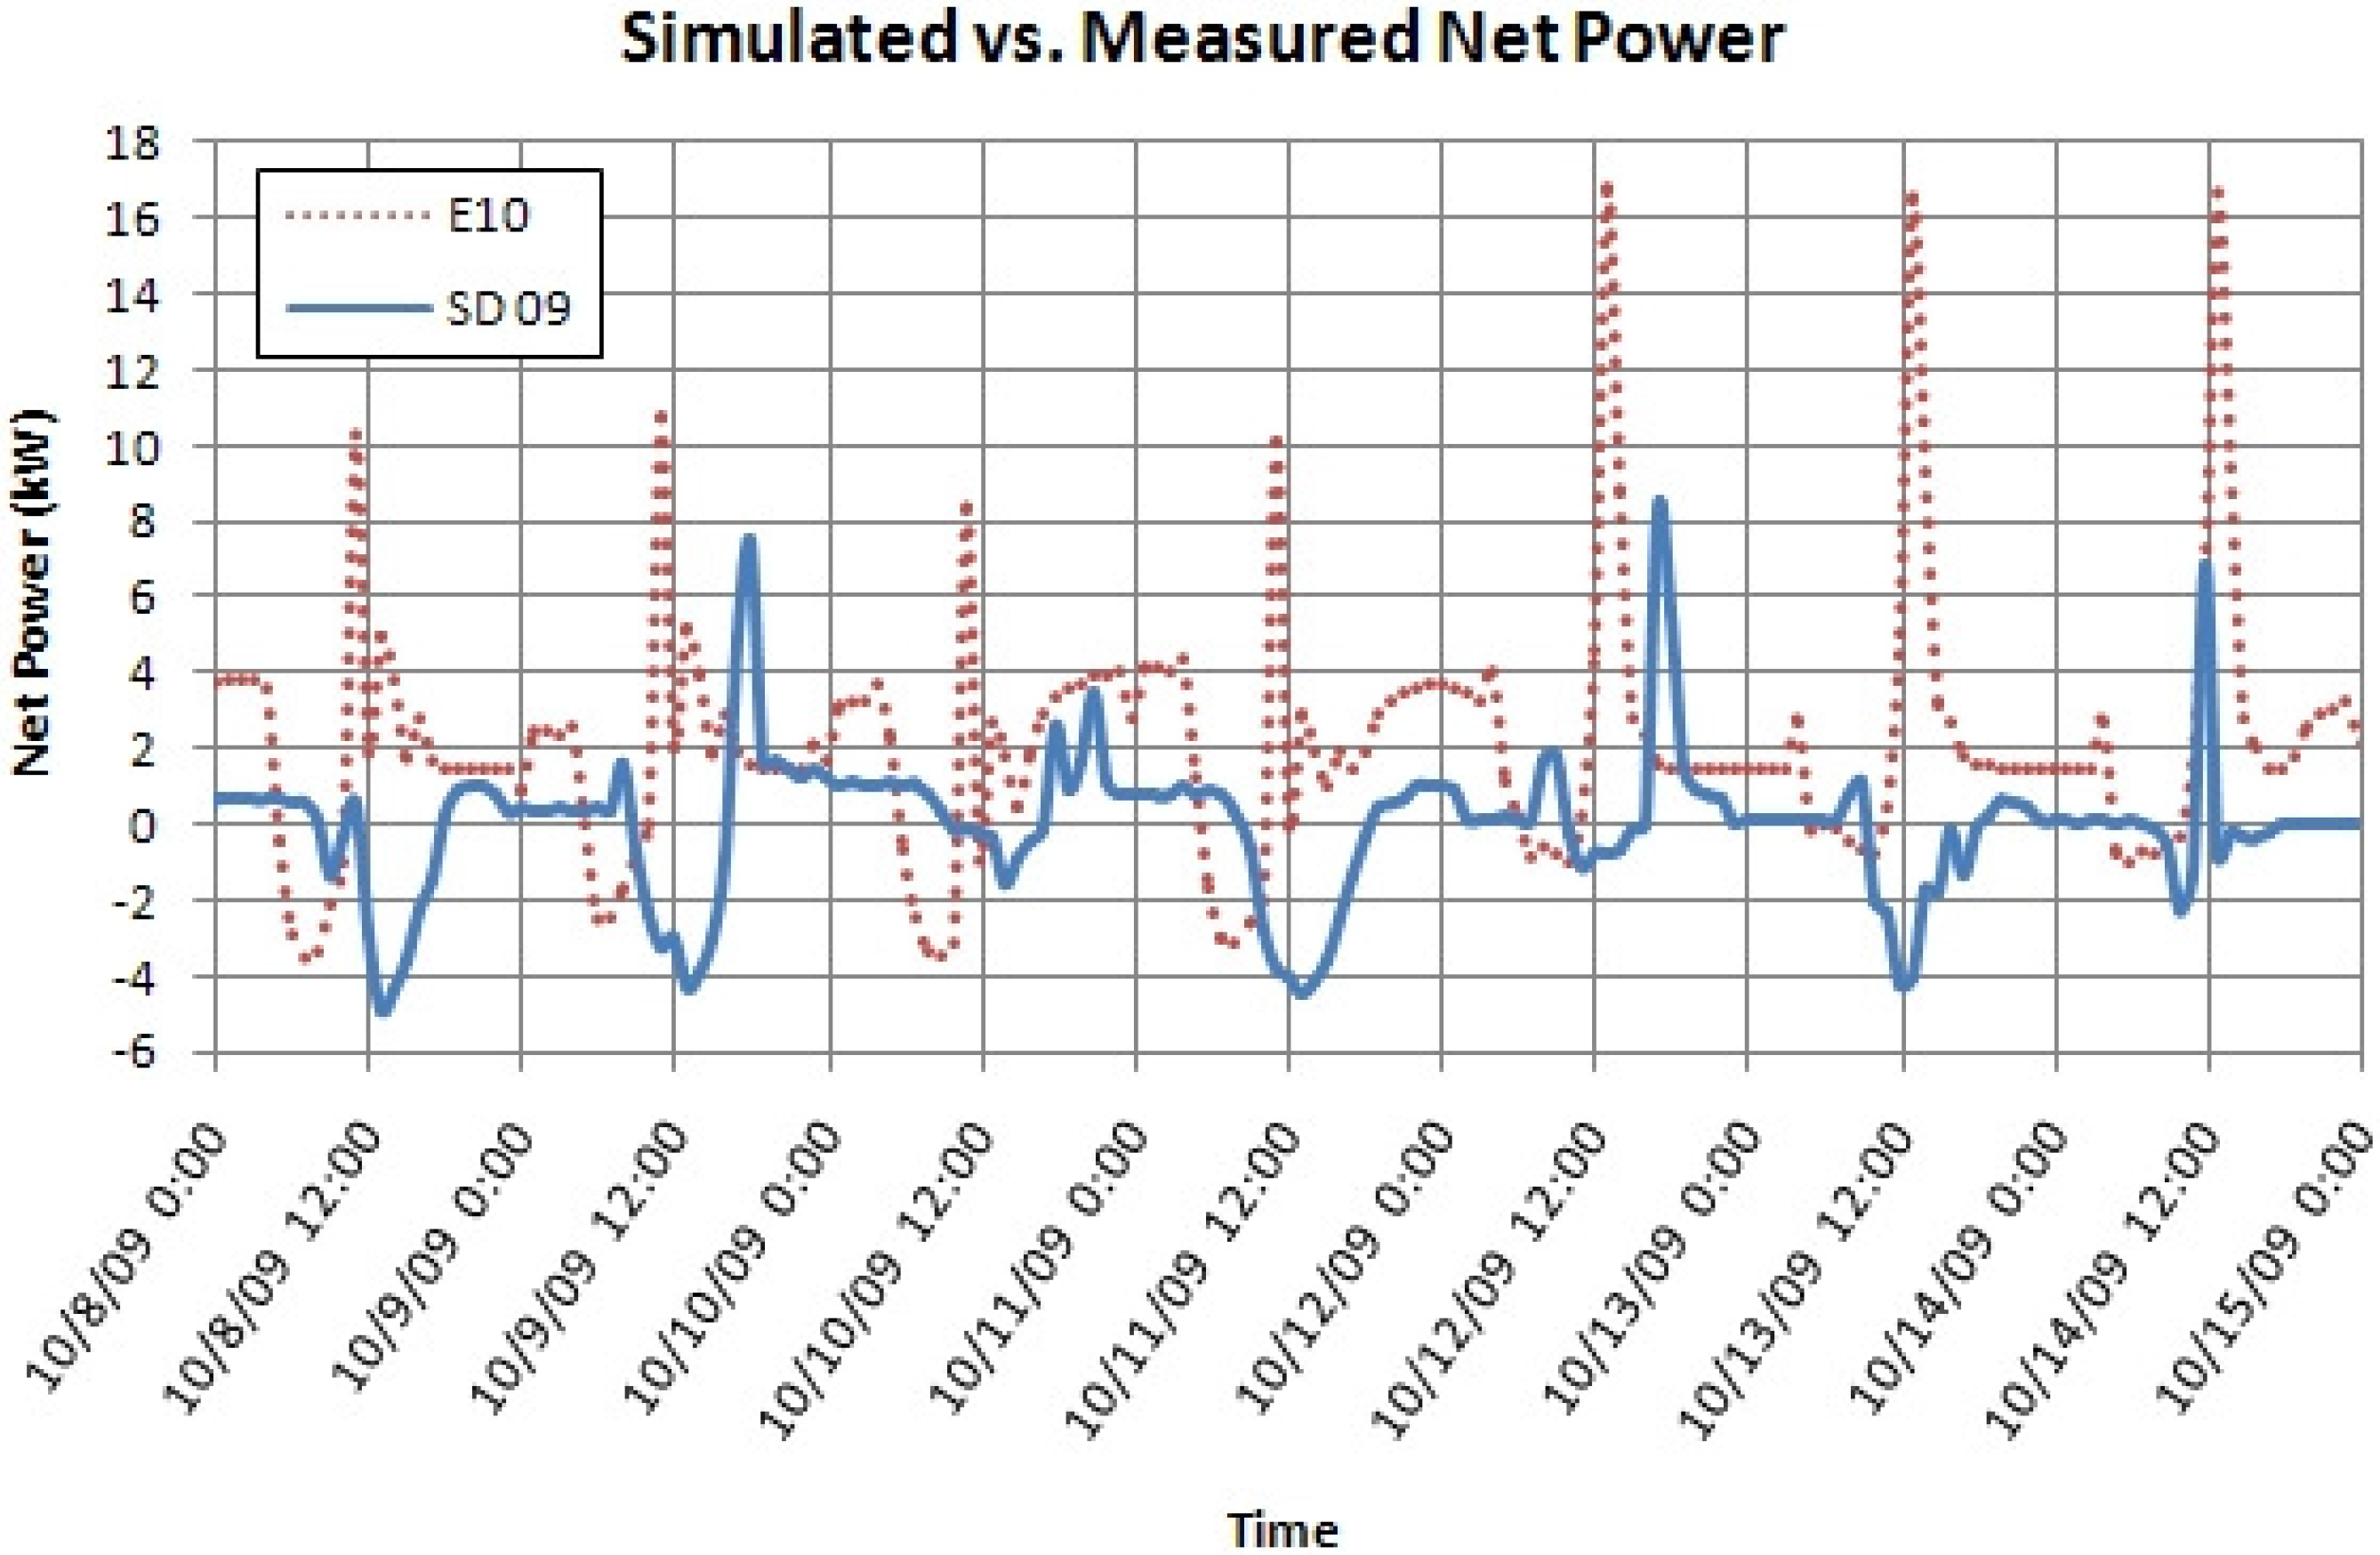
The graph produced from the 2009 Solar Decathlon competition that was used in this comparison can be seen plotted with the Energy-10 graph in
Figure 3. In this graph, a positive value indicates PV production, and a negative value indicates building energy consumption. Energy-10 creates many different graphs after a building is simulated. The only graph which allowed a direct comparison to the competition graphs was the hourly Building Electric graph. This is plotted in
Figure 3 with the competition graph. It should be noted the Solar Decathlon graph had data points every 15 min while the Energy-10 graph took data points every hour, so the Solar Decathlon data was reduced by using only the data collected on the hour.
An important part in the comparison of the data collected during competition and Energy-10 was that the house was grid-tied. Energy-10 automatically simulates PV as a grid-tied system, thus allowing a comparative analysis between the two graphs. As it can be seen in the graph, many of the same trends are followed and PV production can easily be identified during mid day. As detailed in the contest description, cooking a full meal for 6 guests was done in the house on Friday, 9 October, and Monday 12 October. These positive spikes can easily be seen in the graph, on the “SD 09” line. These same positive spikes can be seen in the Energy-10 graph, due to the limits of Energy-10, are shown on the weekends only.
Figure 3.
Comparison of AC power usage and generated between the simulated model vs. measurements.
Figure 3.
Comparison of AC power usage and generated between the simulated model vs. measurements.
Differences in the graphs could partially be contributed to Energy-10 limiting the user to specify different load profiles for weekdays and weekends. Therefore, the exact operating schedule that the house was tested with in competition was not able to be mirrored in the simulation. Other factors, such as the actual insulation value of the house and windows could have affected the competition results. As was mentioned in the introduction, the houses must be transported, reconstructed, and then deconstructed. Therefore, the house still could have some air leaks due to improperly insulated seams. This error could be eliminated when the home is set up permanently. Other errors could have occurred during construction which could affect the home’s performance. The Energy-10 results indicate that much more power was used in the house than actually was for competition purposes. There is a difference of about 10 kW between the peaks on Wednesday, but only a difference of about 3 kW between the peaks on Friday night. These differences could be a result of additional factors. The model only allows an hourly profile. Most contests that were simulated did not take an entire hour, such as running the dishwasher, cooking water, hot water draws, and washing clothes. This error could be accounted for in the future by considering the amount of time each contest took, and adjusting the relative value accordingly.
Other differences that could not be accounted for in the model were based on strategies the team took during competition. For example, the team made a decision to stay net zero for the Energy Balance competition. As a result, Team Missouri opted out of participating in several contests. Therefore, it can be seen that the graph flattens out at the end, on Wednesday, 15 October.
Table 4 shows the average net power consumed by the house as measured in competition, and simulated by Energy-10. It is reiterated in this chart that Energy-10 simulates a much higher kilowatt usage. However, it is interesting to note that the kilowatt PV production is often lower than the actual. These differences are inherit with any simulation program and include the use of historical weather data
versus actual weather conditions, and the difference in occupant load at any given time causing the effects of latent and sensible heat to be difficult to determine.
Table 4.
Average daily net power.
Table 4.
Average daily net power.
| | SD09 | E10 | Difference (%) |
|---|
| 10/8/2009 | –0.46 | 1.82 | 125.27 |
| 10/9/2009 | 0.15 | 1.89 | 92.14 |
| 10/10/2009 | 0.69 | 1.92 | 63.77 |
| 10/11/2009 | –0.69 | 2.19 | 131.59 |
| 10/12/2009 | 0.87 | 2.67 | 67.55 |
| 10/13/2009 | –0.51 | 1.94 | 126.43 |
| 10/14/2009 | 0.06 | 1.98 | 97.09 |
| 10/15/2009 | –0.05 | 1.84 | 102.86 |
| Total | 0.05 | 16.26 | 99.68 |
7. Conclusions
The purpose of this study was to develop an understanding of the various factors that need to be considered in the development of an energy model. The information gained from this study will assist in future solar house designs to consider the additional factors when developing an energy model and improve forecasted projections in terms of energy usage. By isolating certain loads within a model in Energy-10 it can be determined what factors cause a home to use more energy, and different ways to reduce these loads can be researched and implemented.
It is expected that the simulation will not exactly mirror the minute-by-minute numbers accumulated in competition. However, the large discrepancies observed do raise a question as to the accuracy of the simulation. A simulation which enables partial hour load profiles, or minute-by-minute, as well as individual profiles for each load, would allow the user to isolate errors and causes of such discrepancies. From the results of the simulation, it can be concluded that Energy-10 may not be the ideal tool when a highly detailed simulation is required. The purpose of the program is to provide an initial analysis of the chosen systems and structure of the house, and to propose a building using more energy efficient alternatives. This is not the manner in which it was used in this simulation. The team will continue to research other possibilities in building energy modeling, as well as possible improvements to Energy-10 modeling based on errors discovered in the current 2009 model, including modeling partial hours. However, a program which has a wider range of capabilities should be used for a final meticulous analysis.
Due to its ease of use, Energy-10 is useful in the initial design stages to gauge the effectiveness of chosen systems and allows the user to identify areas of improvement. It is also a reliable source to test different energy efficient strategies and compare the results to find what combinations of strategies lend the most efficient building. These strategies, which range from photovoltaics to passive solar and high efficiency HVAC, can be chosen in any combination to fit the designers’ needs. Energy-10 is a valuable source in the beginning stages of energy efficient and sustainable design.
8. Future Work
Other building energy modeling resources are being researched by the Missouri S&T solar house team including EnergyPlus and VE-Ware. VE-Ware has more input possibilities and is compatible with Revit, the required modeling software for the Solar Decathlon, which eliminates time waste associated with duplicate modeling. EnergyPlus not only allows a detailed load profile input, it has a wider range of capabilities and virtually no constraints on input possibilities.
Work will continue on refinement of this energy model including modeling of partial hours in attempt to produce more acceptable results and formulate a strategy for future models. This research project will serve as a reference for the expected performance of the 2009 solar house as an addition to Missouri University of Science and Technology’s Solar Building Benchmark. This project already includes Missouri S&T’s 2002, 2005, and 2007 entries into the Solar Decathlon. The Solar Building Benchmark will use a variety of sensors to track energy consumption and record weather conditions, and use this collected data for energy modeling software analysis.

