Article

Study on the Decomposition of Factors Affecting Energy-Related Carbon Emissions in Guangdong Province, China

1
Sustainable Development Research Center, Guangzhou Institute of Geochemistry, Chinese Academy of Sciences, Guangzhou, Guangdong 510640, China
2
Key Laboratory of Marginal Sea Geology,Chinese Academy of Sciences, Guangdong 510640, China
3
Graduate University of Chinese Academy of Sciences, Beijing 100049, China
*
Author to whom correspondence should be addressed.
Energies 2011, 4(12), 2249-2272; https://doi.org/10.3390/en4122249
Submission received: 31 October 2011 / Revised: 18 November 2011 / Accepted: 12 December 2011 / Published: 19 December 2011
(This article belongs to the Special Issue Energy Policy on Climate Change)

Abstract

:
Guangdong is China’s largest province in terms of energy consumption. The energy-related carbon emissions in Guangdong province are calculated, and two extended and improved decomposition models for energy-related carbon emissions are established with the Logarithmic Mean Divisia Index method based on the basic principle of Kaya identity. Main results are as follows: (1) the energy-related carbon emissions from the three strata of industry, except the primary industry, and household energy consumption in Guangdong province show increasing trend from 1995 to 2009; (2) the main driving and inhibiting factors which influence energy-related carbon emissions are economic output and energy intensity, respectively, while the contributions of energy mix, industrial structures, population size and living standards are not significant during the period of interest. It is concluded that optimizing the energy mix by exploiting new energy sources and cutting down energy intensity by developing low-carbon technologies are the two most effective approaches to reduce carbon emissions for Guangdong province in the future. The results and proposals in this paper provided reference for relevant administrative departments in the Government of Guangdong province to develop policies for energy conservation and emission reduction as well as to promote development of low-carbon economy.

1. Introduction

As stated in the IPCC Fourth Assessment Report (AR4), energy-related greenhouse gas emissions, mainly from fossil fuel combustion for heat supply, electricity generation and transport, account for around 70% of total emissions including carbon dioxide, methane and some traces of nitrous oxide [1]. Energy-related carbon emissions in China occupy a considerable share of the World’s total emissions. The International Energy Agency listed the statistical data (IEA, 2010) of energy-related carbon emissions of countries around the world during the period 1971–2008 [2], which shows that energy-related CO2 emissions were 6.044 billion tons in China and 5.85 billion tons in the United States in 2007, when China surpassed the United States for the first time and became the world’s top country of energy-related carbon emissions. Since then, China has played an outstanding role in the issue of World carbon emissions and is facing growing international pressure to reduce emissions. The Chinese government has made a solemn promise to the World in the United Nations Conference on Climate Change held in Copenhagen in late 2009 to cut down the CO2 emissions per unit GDP in 2020 by 40%–45% compared to that in 2005, which had been already incorporated into the medium and long-term planning program of national economic and social development as a binding indicator. China’s energy-related carbon emissions have became hot research topics for domestic and foreign scholars since then [3,4,5,6,7,8,9,10,11]. Researches on energy-related carbon emissions and analysis on their factors in Provinces and Cities of China have also become issues of interest recently [12,13,14,15,16,17,18,19,20,21,22,23].
Guangdong, located in the subtropical part of southern China mainland (Figure 1), between latitude 20°13'–25°31'N and longitude 109°39'–117°19'E, is one of the regions which have the most abundant light, heat and water resources in China. Guangdong’s economy has achieved rapid development since reform and opening up in 1978. Guangdong’s Gross Domestic Product (GDP), urbanization rate and permanent population reached 3948.26 billion Yuan (constant price), 63.4% and 101.3 million persons in 2009, respectively. This indicates that Guangdong has become the biggest province in population and economy in China. There are nine major industries, including three fresh industries (electronic and information technology, electric equipment and special-purpose machinery, petroleum and chemistry), three traditional industries (textile and garments, food and beverage, building materials) and three potential industries (logging and papermaking, medicine, motor vehicle). Energy is the main driving force of economic development, for the rapid economic development must bring about huge amount of energy consumption, so Guangdong has inevitably become China’s largest province in terms of energy consumption and carbon emissions, and is facing greater pressure to reduce emissions.
On July 19, 2010, the National Development and Reform Commission of China issued the notice of conducting national pilot work of low-carbon provinces and low-carbon cities, in which five Provinces, including Guangdong, and eight Cities were selected as the pilot districts for the national pilot program for low-carbon development, so the pressure on carbon reduction become more urgent for Guangdong.
Figure 1. Geographic location of Guangdong province in China.
Energies 04 02249 g001
However, the literature search results show that there are indeed some studies on energy consumption, but few on energy-related carbon emissions in Guangdong province [24,25,26,27]. Only related researches from Xiao et al. [28], Liu et al. [29], Kuang et al. [30] and Chen [31] have appeared up to now. Therefore, we here calculated the energy-related carbon emissions in Guangdong province and established two decomposition models with the Logarithmic Mean Divisia Index (LMDI) method based on the extended Kaya identity, and discussed the contribution of the major factors to the energy-related carbon emissions and quantified their contribution as well. We also try to provide some proposals and suggestions for carbon reduction, and expect that the results and proposals in this paper can be of reference value for administrative departments in the Government of Guangdong province to develop policies for energy conservation and emission reduction and promote development of a low-carbon economy.

2. Methods and Data Sources

2.1. Calculation of Energy-Related Carbon Emissions

In this article we divide the energy consumption into two sectors: termed Productive and Household (Figure 2). Productive energy consumption refers to energy consumption by the three strata of industry. Farming, forestry, animal husbandry, fishery and water conservancy belong to the primary industry. Industry and Construction belong to the secondary industry. Transport, storage, postal and telecommunication services, wholesale and retail trade and catering services, and others, belong to the tertiary industry. Among them, energy consumption by the industry sector includes the End-use energy consumption by industry sectors and energy consumption of thermal power and heat power production. There are 17 types of energy, including coal, crude oil, natural gas and other fossil fuels and their products, according to Energy Balance Sheet of Guangdong Province in China Energy Statistical Yearbook. Energy-related carbon emissions are calculated as follows:
Energies 04 02249 i001
where C is carbon emissions from energy consumption, i is the type of industry, j is the type of energy, Cij represents carbon emissions of energy j in industry i, Eij represents consumption of energy j in industry i, and fj is carbon emissioncoefficient of energy j. Carbon emission coefficients of different kinds of energy can be seen from Table 1.
Figure 2. The division of energy consumption sectors. Note: As the electricity and heat consumption do not produce carbon emissions directly, their carbon emissions are produced indirectly from fossil fuels combustion in the production process. In addition, hydropower, nuclear power and wind power almost do not produce carbon emissions. Therefore, carbon emissions of power generation calculated in this paper only include carbon emissions of electricity generated by thermal power plants. To avoid double counting, indirect carbon emissions of thermal power and heat in End-use part no longer included in the total carbon emissions.
Energies 04 02249 g002
Table 1. Carbon emission coefficients of different kinds of energy.
Energy TypeNet Calorific Value (TJ/103 t)Carbon Content (t/TJ)Carbon Emission Coefficients (tC/t)Energy TypeNet Calorific Value (TJ/103 t)Carbon Content (t/TJ)Carbon Emission Coefficients (tC/t)
Raw Coal20.726.60.551Crude Oil42.320.00.846
Washed Clean Coal28.225.80.728Gasoline44.318.90.837
Other Washed Coal28.225.80.728Kerosene43.819.60.858
Briquettes20.726.60.551Diesel Oil43.020.20.869
Coke28.229.20.823Fuel Oil40.421.10.852
Coke-oven Gas0.197Liquefied Petroleum Gas47.317.20.814
Other Gas0.197Refinery Gas49.515.70.777
Other Coking Products28.20.823Other Petroleum Products40.220.00.804
Natural Gas0.444
Notes: 1. The unit of carbon emission coefficient of “Coke-oven Gas”, “Other Gas” and “Natural Gas” is “ton Carbon/ton standard coal equivalent” or “tC/tSCE”. Carbon emission coefficient of Natural Gas comes from reference [32], carbon emission coefficients of “Coke-oven Gas” and “Other Gas” are calculated according to the relationship between their calorific value and natural gas’; 2. The unit of other energy’s carbon emission coefficient is “ton C/ ton”or “tC/t”, it represents carbon emission from one tone physical quantity energy. Carbon emission coefficient = net calorific value × carbon content, net calorific value and carbon content come from 2006 IPCC Guidelines for National Greenhouse Gas Inventories [33]. Carbon content per unit coal is higher than oil, but its net calorific value is lower than that of oil, resulting in the carbon emission coefficient of coal being lower than for oil. We reference here the article [16].

2.2. Decomposition of Factors Affecting Energy-Related Carbon Emissions

Models used for decomposition of factors affecting energy-related carbon emissions by scholars from China and abroad varies in form due to the different focus in their research [34,35,36,37,38,39,40,41]. The LMDI (Logarithmic Mean Divisia Index) method is widely used in decomposition of factors affecting energy-related carbon emission for that it can satisfy the requirement of factor reversible and the residual item eliminated, which makes the model more convincing [42].
Nevertheless, most researches use the LMDI technique based on time series analysis. We divide the energy consumption into two sectors in this article, and thereupon, we establish extended models for the Productive and Household sectors respectively, based on the basic principle of Kaya identity [43] and LMDI decomposition method. For giving detailed statement to the decomposition results, we use both period-wise analysis [37] and time series analysis. Total energy-related carbon emission C is the sum of energy-related carbon emissions from productive sector C1, and that from household sector C2:
C = C1 + C2
(1) Model for Decomposition of Factors Affecting Energy-Related Carbon Emissions from Productive Sector
The population size in China was twice as large as in the USA, but the carbon emissions in the Productive sectors was much less than that in USA 20 years ago. Hence, it is the economic output rather than the population size that contributed most to the carbon emission in Productive sectors. This article highlights the influence of total economic output (GDP) on carbon emission from Productive sectors, economic development level (per capita GDP) and population size do not appear in the model. Therefore, we extended the Kaya identityand established a decomposition model for Productive sector as follows:
Energies 04 02249 i002
where GDP represents Gross Domestic Product, i is the type of industry, j is the type of energy, Cij represents carbon emissions of energy j in industry i, PEij represents consumption of energy j in industry i, PEi represents energy consumption of industry i, GDPi is the value contribution of the industry i to GDP.
Let Energies 04 02249 i003,
Equation (3) can be rewritten as:
Energies 04 02249 i004
where fij is the carbon emission coefficients of different kinds of energy, m1ij is the share of energy j in energy consumption of industry i, di is the energy consumption per unit GDP in the industry i, si is the share of gross domestic product of the industry i, g is GDP.
Setting carbon emissions as C0 for the baseline year and CT for the year T, with the subscript tot represents the total change, there is:
ΔCtot = CrC0
The expression for the contribution of the decomposed factors to the energy-related carbon emissions from the Productive sector are as follows:
Energies 04 02249 i005
Energies 04 02249 i006
Energies 04 02249 i007
Energies 04 02249 i008
Energies 04 02249 i009
where Energies 04 02249 i010 represent carbon emission coefficient effect, energy mix effect, energy intensity effect, industrial structure effect, and economic output effect respectively.
The total effect of energy-related carbon emission from productive sector is as follows:
ΔC1tot = ΔCfij + ΔCm1ij + ΔCti + ΔCst + ΔCg
(2) Model for Decomposition of Factors Affecting Household Energy-Related Carbon Emissions
Household energy-related carbon emissions are not only related to the types and consumption structures of energy, but also related to population size. The factor decomposition model for household energy-related carbon emissions is as follows:
Energies 04 02249 i011
where E is the household energy consumption, Ej is the household consumption of energy j, Cj is carbon emissions from energy j, P is the size of population.
Let Energies 04 02249 i012, Equation (12) can be rewritten as:
Energies 04 02249 i013
where fj has the same mean with fij in Equation (4), is the share of energy j in household energy consumption, l is the energy consumption per capita and p is population size. The expression for the contribution of the decomposed factors to the energy-related carbon emissions from Household sector are:
Energies 04 02249 i014
Energies 04 02249 i015
Energies 04 02249 i016
Energies 04 02249 i017
where β = C j T C j 0 ln C j T ln C j 0 ,    Δ C f j ,    Δ C m 2 j ,    Δ C l ,  and  Δ C p represent carbon emission coefficient effect, energy mix effect, living standard effect and population size effect, respectively.
The total effect of household energy-related carbon emissions is as follows:
ΔC2tot = ΔCfj + ΔCm2j + ΔCi + ΔCp
A comprehensive model for decomposition of factors affecting energy-related carbon emissions is obtained by combining the above-established decomposition model Equation (11) and Equation (18) as follows:
ΔCtot = ΔC1tot + ΔC2tot = ΔCf + ΔCm + ΔCti + ΔCsi + ΔCg + ΔCp + ΔCl
where ΔCm = ΔCm1ij + ΔCm2j. Carbon emission coefficient of different kinds of energy is generally treated as constant in the actual application. Therefore, in the comprehensive decomposition model, ΔCf = ΔCfij = ΔCfj = 0. Equation (19) can be simplified as:
ΔCtot = ΔCm + ΔCti + ΔCsi + ΔCg + ΔCp + ΔCl
where ΔCm, ΔCti, ΔCsi, ΔCg, ΔCp, ΔCl represent energy mix effect, energy intensity effect, industrial structure effect, economic output effect, population size effect and living standard effect, respectively.

2.3. Data Sources and Processing

The energy data used in this paper are listed in Table A1 and Table A2, data quoted from Energy Balance Sheet of Guangdong Province in the China Energy Statistical Yearbook (1996–2010). Other data used in this article come from the Statistical Yearbook of Guangdong Province (1996–2010) of the corresponding year. To eliminate the effect of price changes, we converted the GDP at current price to the GDP at constant price in the year 2000 by using Indices of GDP (IGDP, preceding year = 100). The way of this transformation is shown in Figure 3. GDP is a magnitude of value index, its value influenced by the change of price and volume. GDP at constant prices is the GDP at a price for a fixed period (baseline period) converted from the GDP at current price, so that it can eliminate the effect of price change, reflect changes in volume and reflect actual results of production activity when the values of two different periods are compared. GDP at constant price by sectors are listed in Table A3. The year 1995 is set as baseline year in LMDI factor decomposition.
Figure 3. The way to convert the GDP at current price to the GDP at constant price in the year 2000. Notes: IGDP represent Indices of GDP (taking the Indices of GDP for the preceding year = 100), which can be obtained from the official statistical yearbooks directly.
Energies 04 02249 g003

3. Results and Discussion

3.1. Discussion on the Estimates of Energy-Related Carbon Emissions

The estimated results of energy-related carbon emissions (Table 2) show that the total energy-related carbon emissions in Guangdong province increased from 4452.44 × 104 tC (ton of Carbon) in 1995 to 13007.02 × 104 tC in 2009, and the average annual growth rate is 7.96%.For the energy-related carbon emissions from the three strata of industry and household sectors, only energy-related carbon emissions from the primary industry showed decreasing trend, which fluctuate in a narrow range, decreasing from 145.60 × 10⁴ tC in 1995 to 120.86 × 10⁴ tC in 2009, and the average annual decline rate is 1.32%. The energy-related carbon emissions from the secondary industry, tertiary industry and household show increasing trends, from 3580.04 × 104 tC, 403.25 × 10⁴ tC and 323.55 × 10⁴ tC in 1995 to 10611.96 × 104 tC, 1628.49 × 104 tC and 645.72 × 10
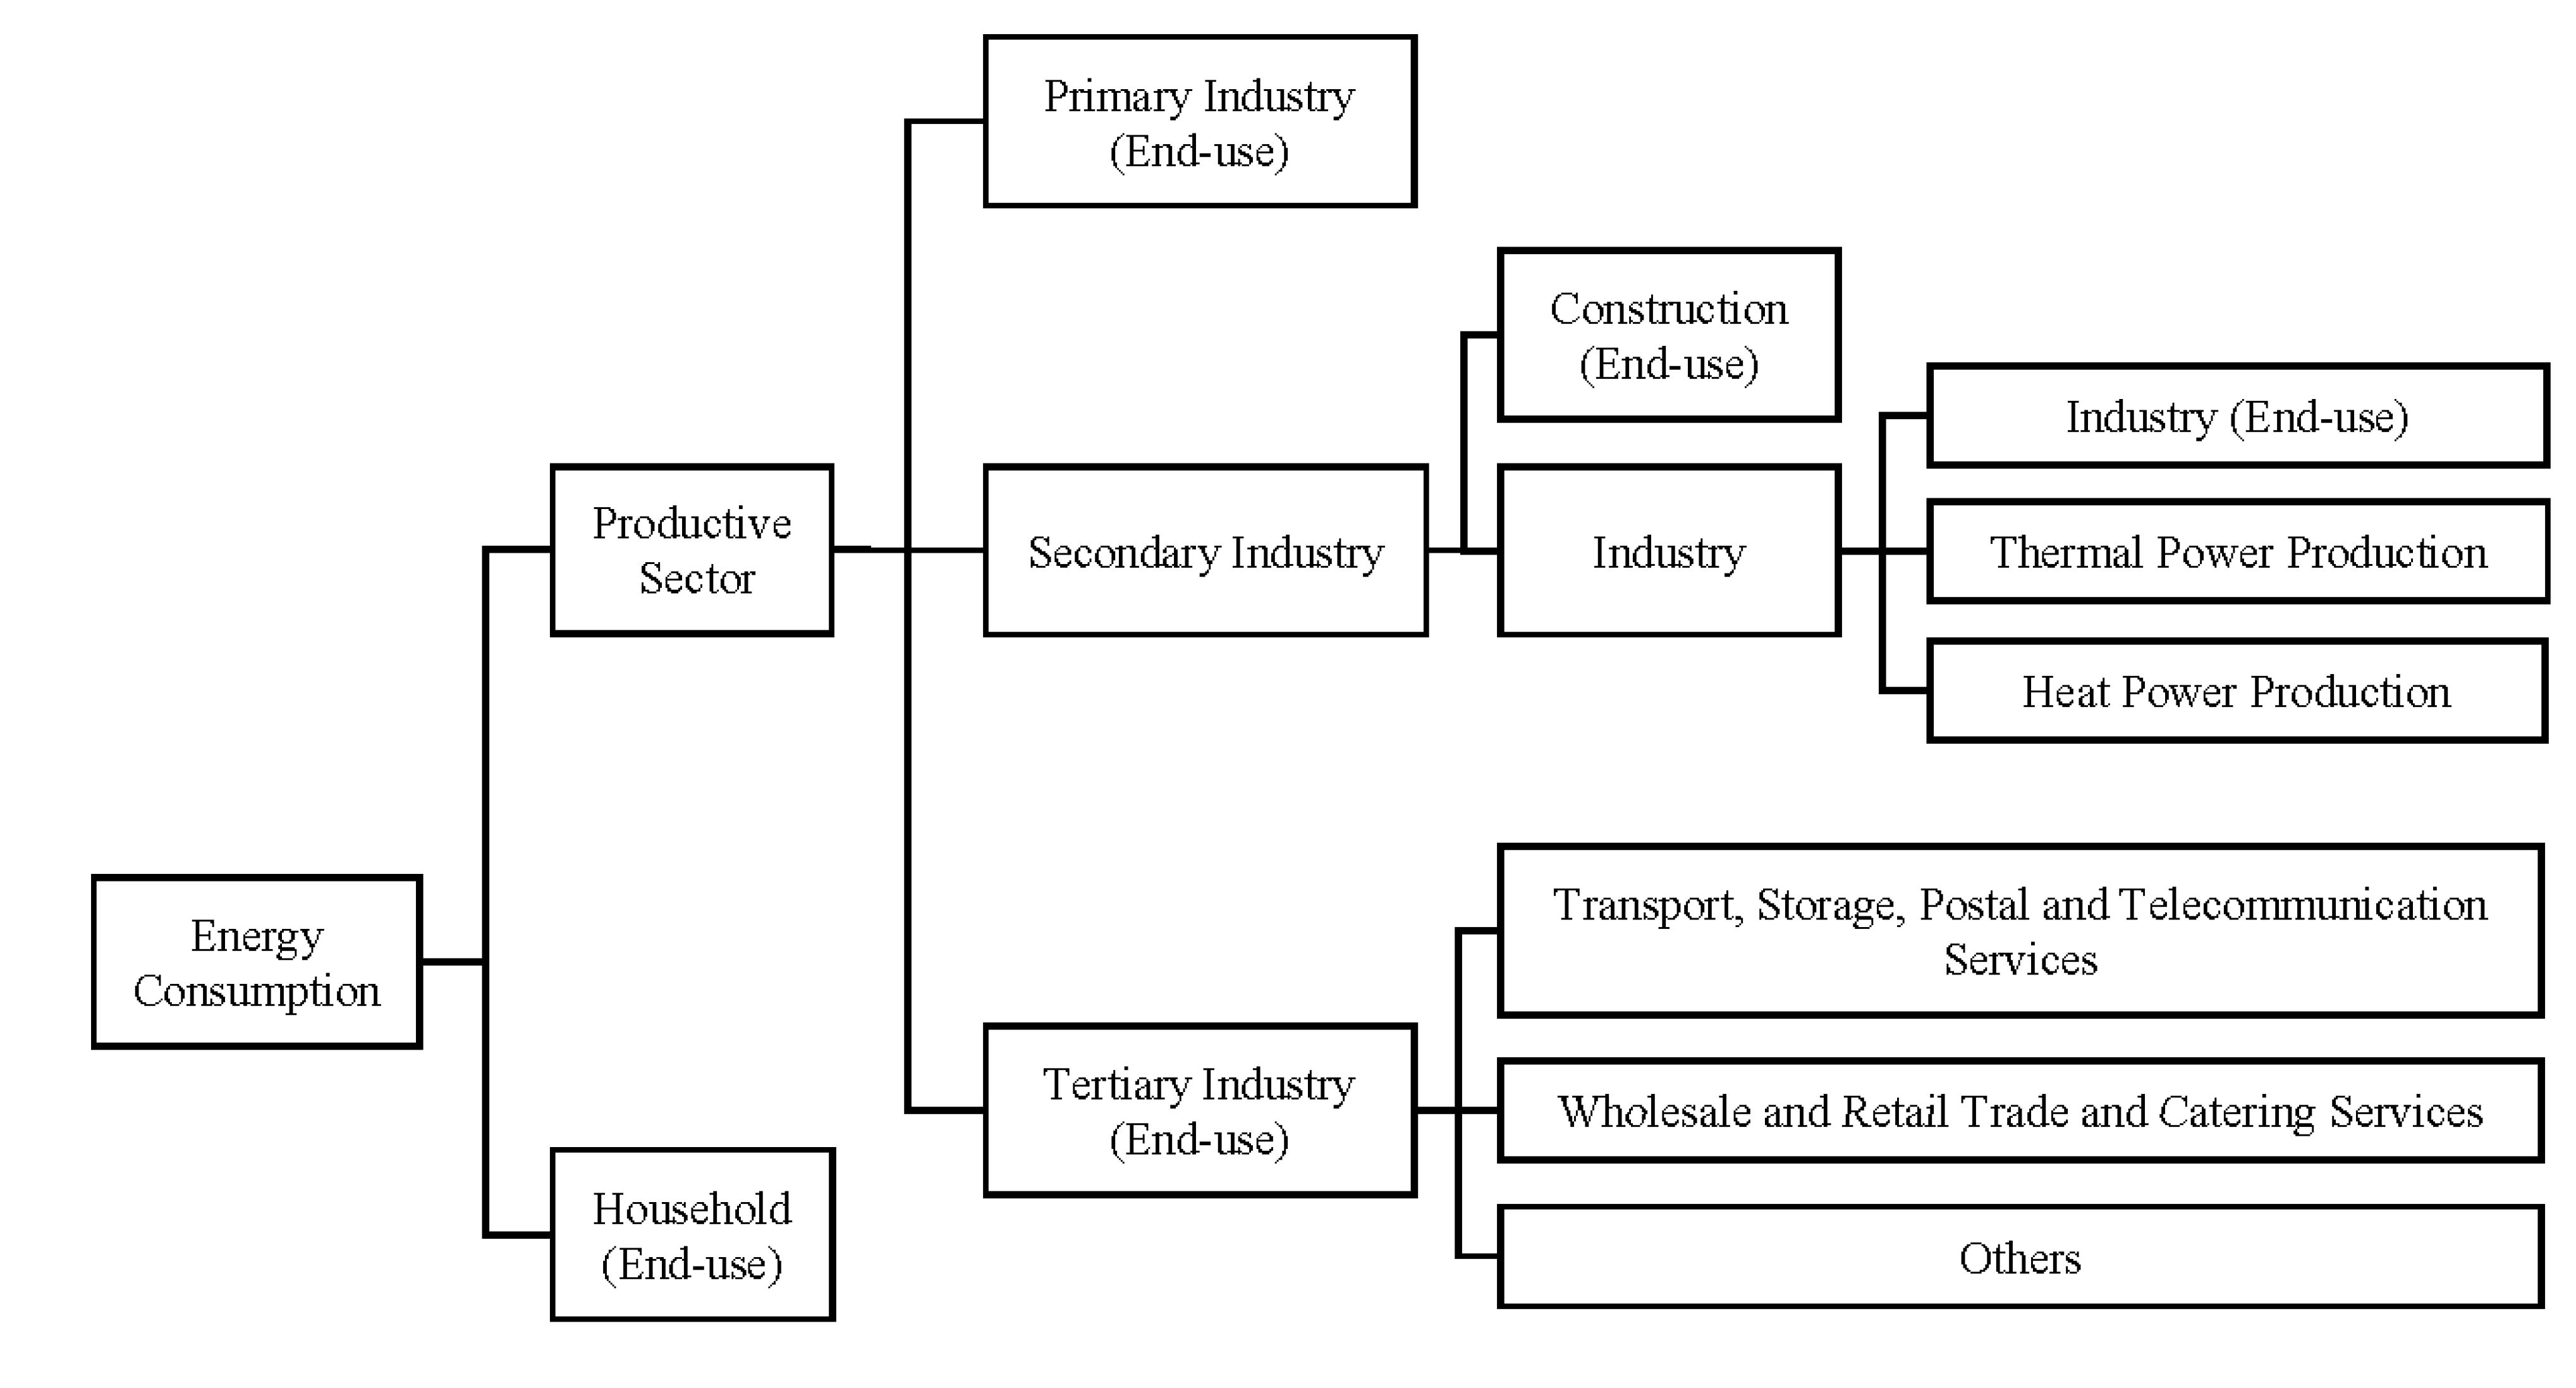
⁴ tC in 2009, respectively, and the average annual growth rate are 8.07%, 10.48% and 5.06%, respectively. It is obvious that the secondary industry is the largest source of carbon emissions, which accounts for more than 80% of the total energy-related carbon emissions. End-use in industry and thermal power plants are the two major contributors to carbon emissions in the secondary industry. They acted alternatively as the largest source of carbon emissions. The largest contributor to carbon emissions in tertiary industry is the sector of transport, storage, postal and telecommunication services. Therefore, in the process of carbon emission reduction in Guangdong province, the secondary industry, especially the industrial sector, is undoubtedly the focus of emission reduction. Moreover, carbon emission reduction in tertiary industry, especial in the sector of transport, storage, postal and telecommunication services, cannot be ignored.
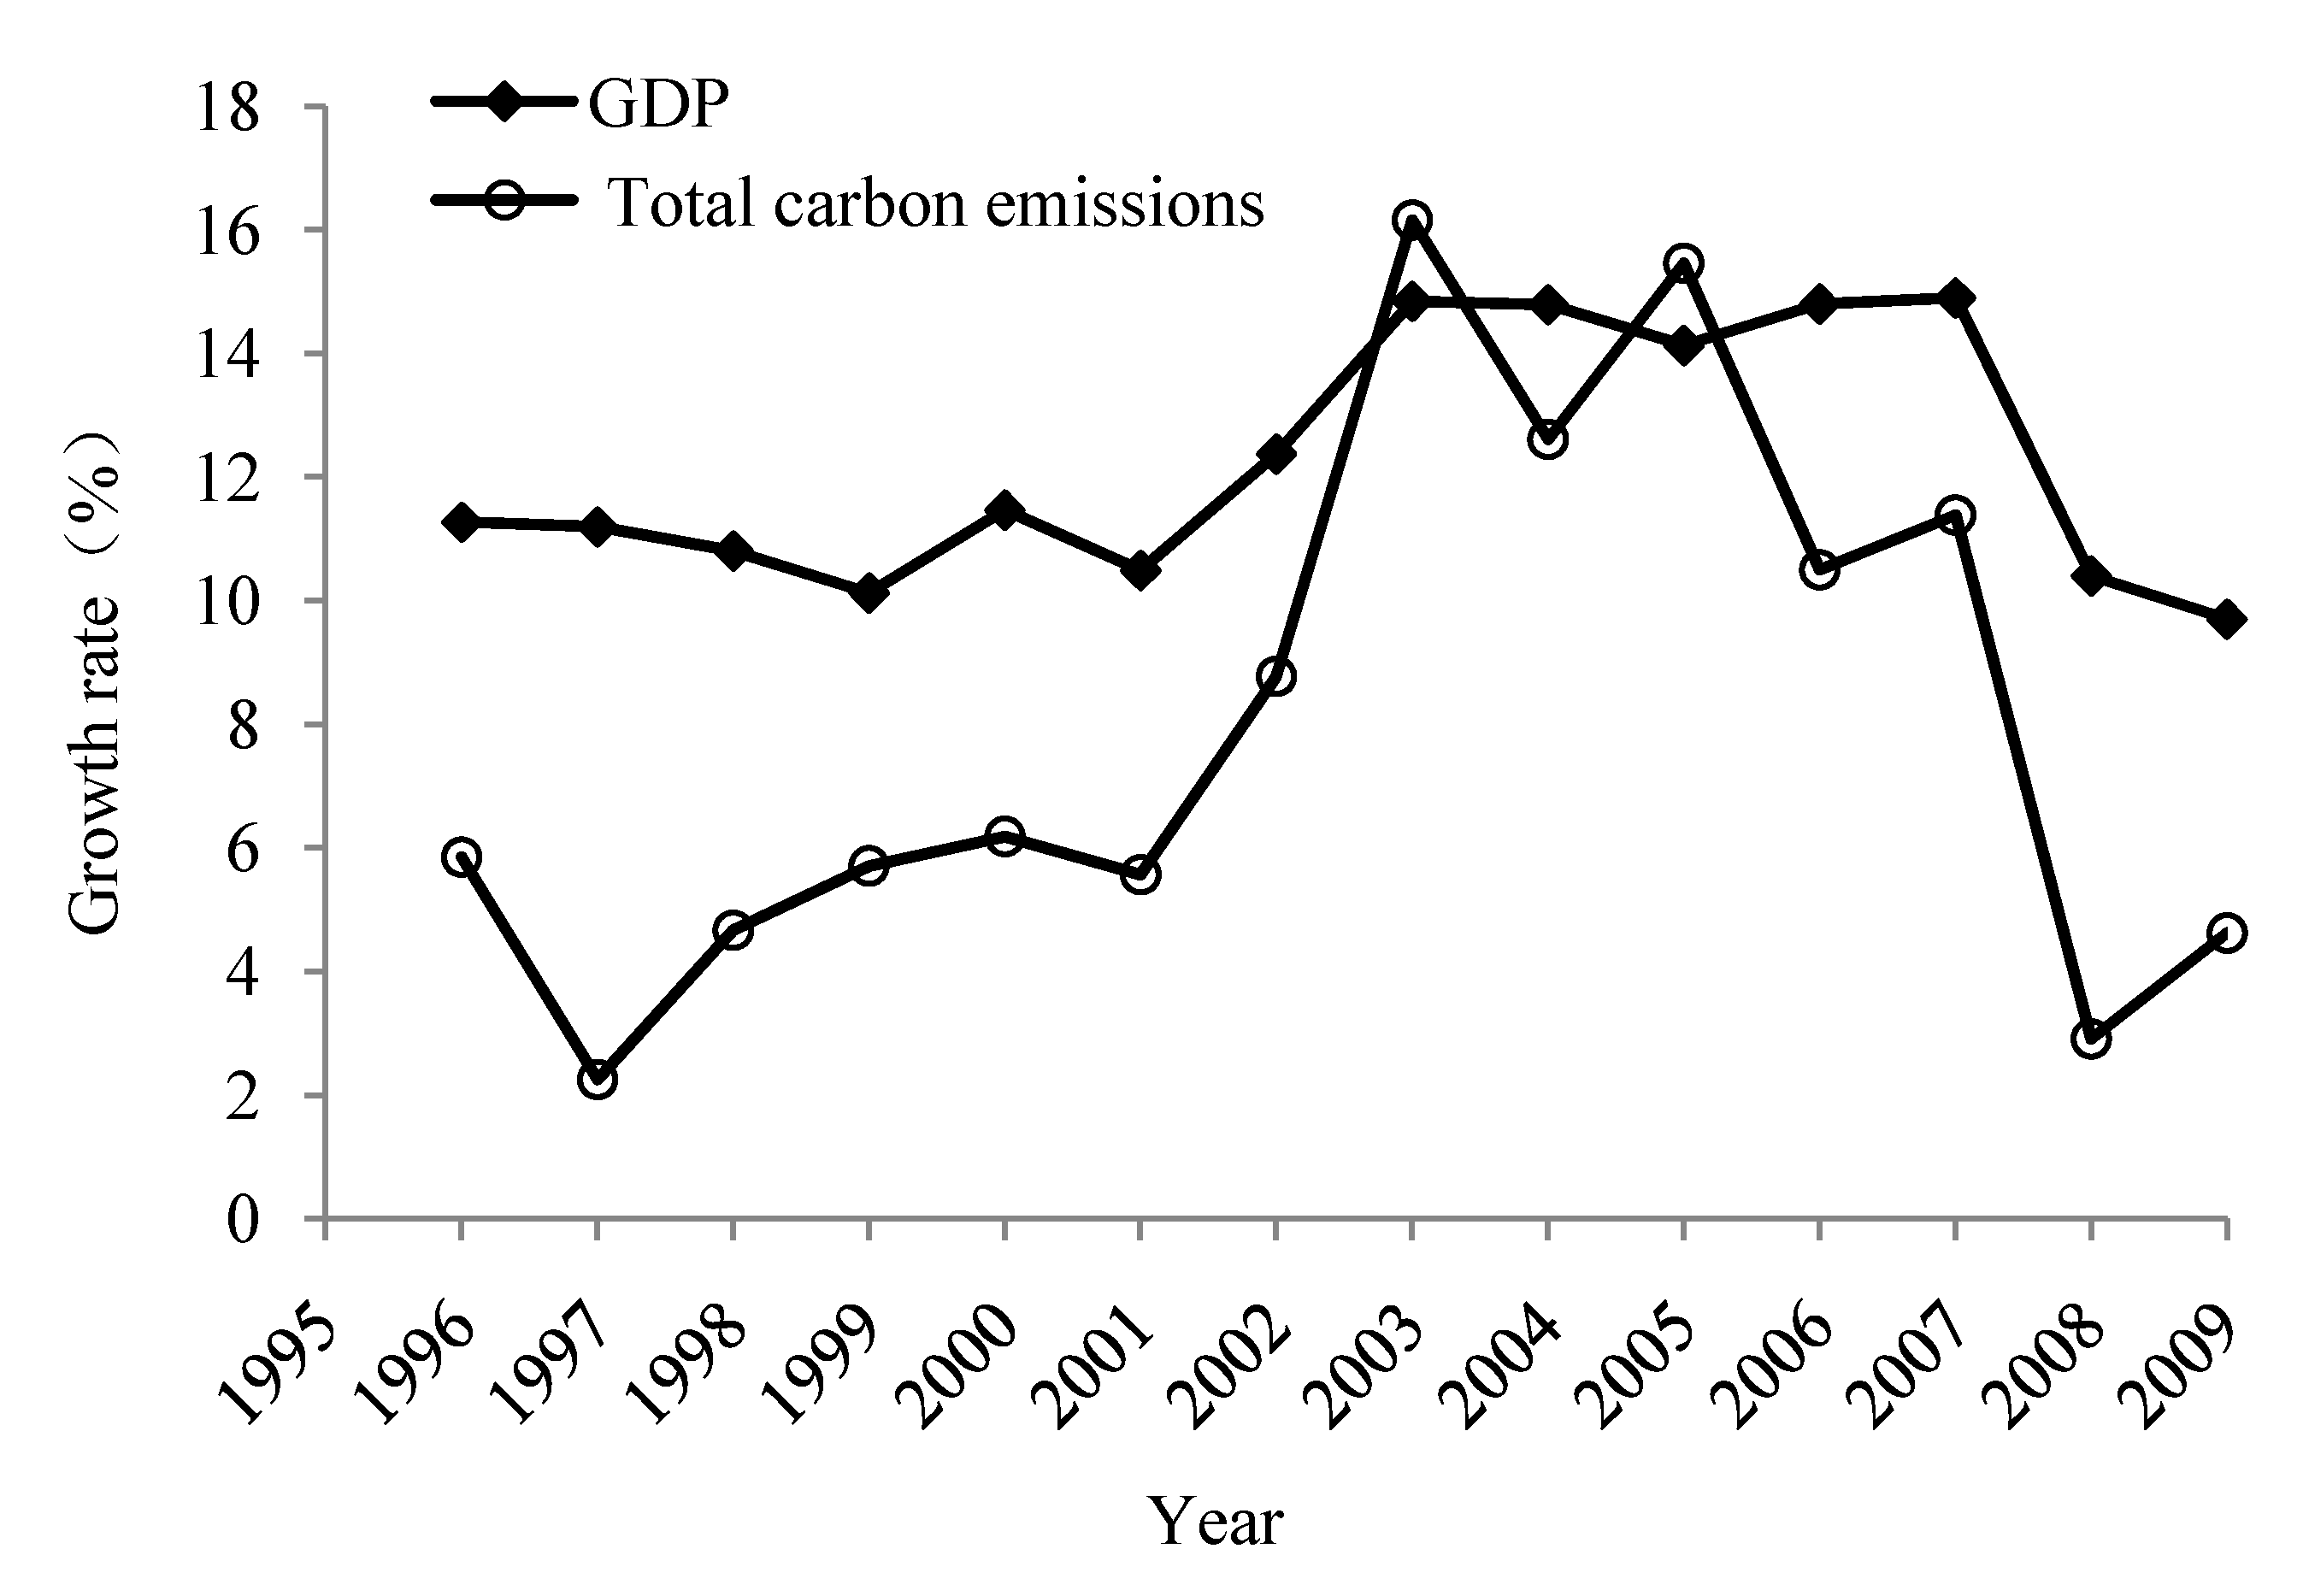
Growth rates of economic development and carbon emission during the period 1995–2009 can be seen from Figure 4. During the period of 9th Five-Year Plan (1996–2000), short for China’s 9th Five-Year Plan for National Economic and Social Development (1996–2000), the Asian Financial Crisis (1997) originated in Thailand made China’s foreign trade export growth rate decreased from 20% in 1996 to 0.5% in 1997, it is undoubtedly was a fatal blow to Guangdong where economic development mainly relies on exports. Meanwhile, some deep-seated contradictions formed in the rapid development of Guangdong since reform and opening up began to surface gradually during this period. Both reasons lead to economic growth rate of Guangdong declining year to year. Until 2000, it began to rise again.
The growth rate of energy-related carbon emissions increased year by year after a sharp drop in 1997. During the execution period of the 10th Five-Year Plan (2001–2005), Guangdong’s economy achieved rapid development by seizing the opportunities of economic globalization; China formally joined the WTO and the international industrial transfer system. The growth rate of the economy reached its highest point (14.84%) in 2003. Driven by the rapid development of the economy, growth rates of energy consumption and carbon emissions increased year by year. At the same time, Guangdong was facing a gradually intensifying situation of domestic and international energy supply and energy price fluctuations, energy development and conservation policy was involved, and the growth rate of energy-related carbon emissions began to decline in the late 10th Five-Year Plan Period. Guangdong’s economy maintained a steady and rapid growth rate in the first two years of the 11th Five-Year Plan Period (2006–2010). The Global Financial Crisis in 2008 once again frustrated the development of Guangdong’s economy, and its economic growth rate dropped significantly compared to 2007. With the implementation of industry and labor “double transfer” policy in 2008, Guangdong’s economic growth rate declined in 2008 and 2009 during the process of industrial restructuring. Guangdong made greater energy conservation efforts to achieve the target to drop the energy consumption per unit GDP by 16% in 2010 compared to that in 2005, resulting in a declining growth rate of carbon emissions, especially in 2008, growth rate of carbon emissions has declined abruptly as compared to 2007.
Figure 4. Growth rate of GDP and total carbon emissions.
Energies 04 02249 g004
Table 2. Estimation results of energy-related carbon emissions in Guangdong province.
YearCarbon Emission by Sectors (104 tC)Total Carbon Emissions
Primary IndustrySecondary IndustryTertiary IndustryHousehold
TotalIndustry (End-use)PowerHeatConstructionTotalTransport etc.Wholesale etc.Others
1995145.603580.041857.161587.75102.2632.86403.25313.2061.5328.52323.554452.44
1996146.463811.261906.581789.55101.9013.22406.08331.4258.5116.15348.904712.71
1997118.313987.112090.251784.80100.5611.48375.21310.5453.1711.50338.104818.73
1998145.884134.782112.481883.16126.6612.48447.13382.8151.9512.37315.705043.49
1999119.624374.682096.122142.26122.9913.32516.93457.8156.602.52319.945331.18
2000141.294610.831989.962488.75117.0315.09600.66526.4458.7015.52307.995660.77
2001155.744839.782086.732604.54132.5215.99649.20569.9562.6416.60330.935975.65
2002120.445337.762206.132944.46170.4616.71709.80615.0175.9118.89331.896499.89
2003119.426276.973018.443054.65182.8721.00781.08689.4470.7120.93372.547550.01
2004130.827080.512742.144194.61118.6025.17898.44793.2581.2823.90392.168501.93
2005150.887919.223265.994496.74116.0740.421242.151058.53142.2841.34504.079816.32
2006131.678905.413958.834754.06149.0043.521288.031088.22158.3641.45521.7710846.87
2007116.679948.804414.365289.46197.1547.831427.781199.50181.2747.01588.1312081.38
2008120.4310188.724882.215093.83168.7443.951507.961293.05171.9642.95615.5712432.68
2009120.8610611.965354.804980.43226.1450.581628.491355.13227.5345.83645.7213007.02

3.2. Discussion on the Factor Decomposition Results of Energy-Related Carbon Emissions

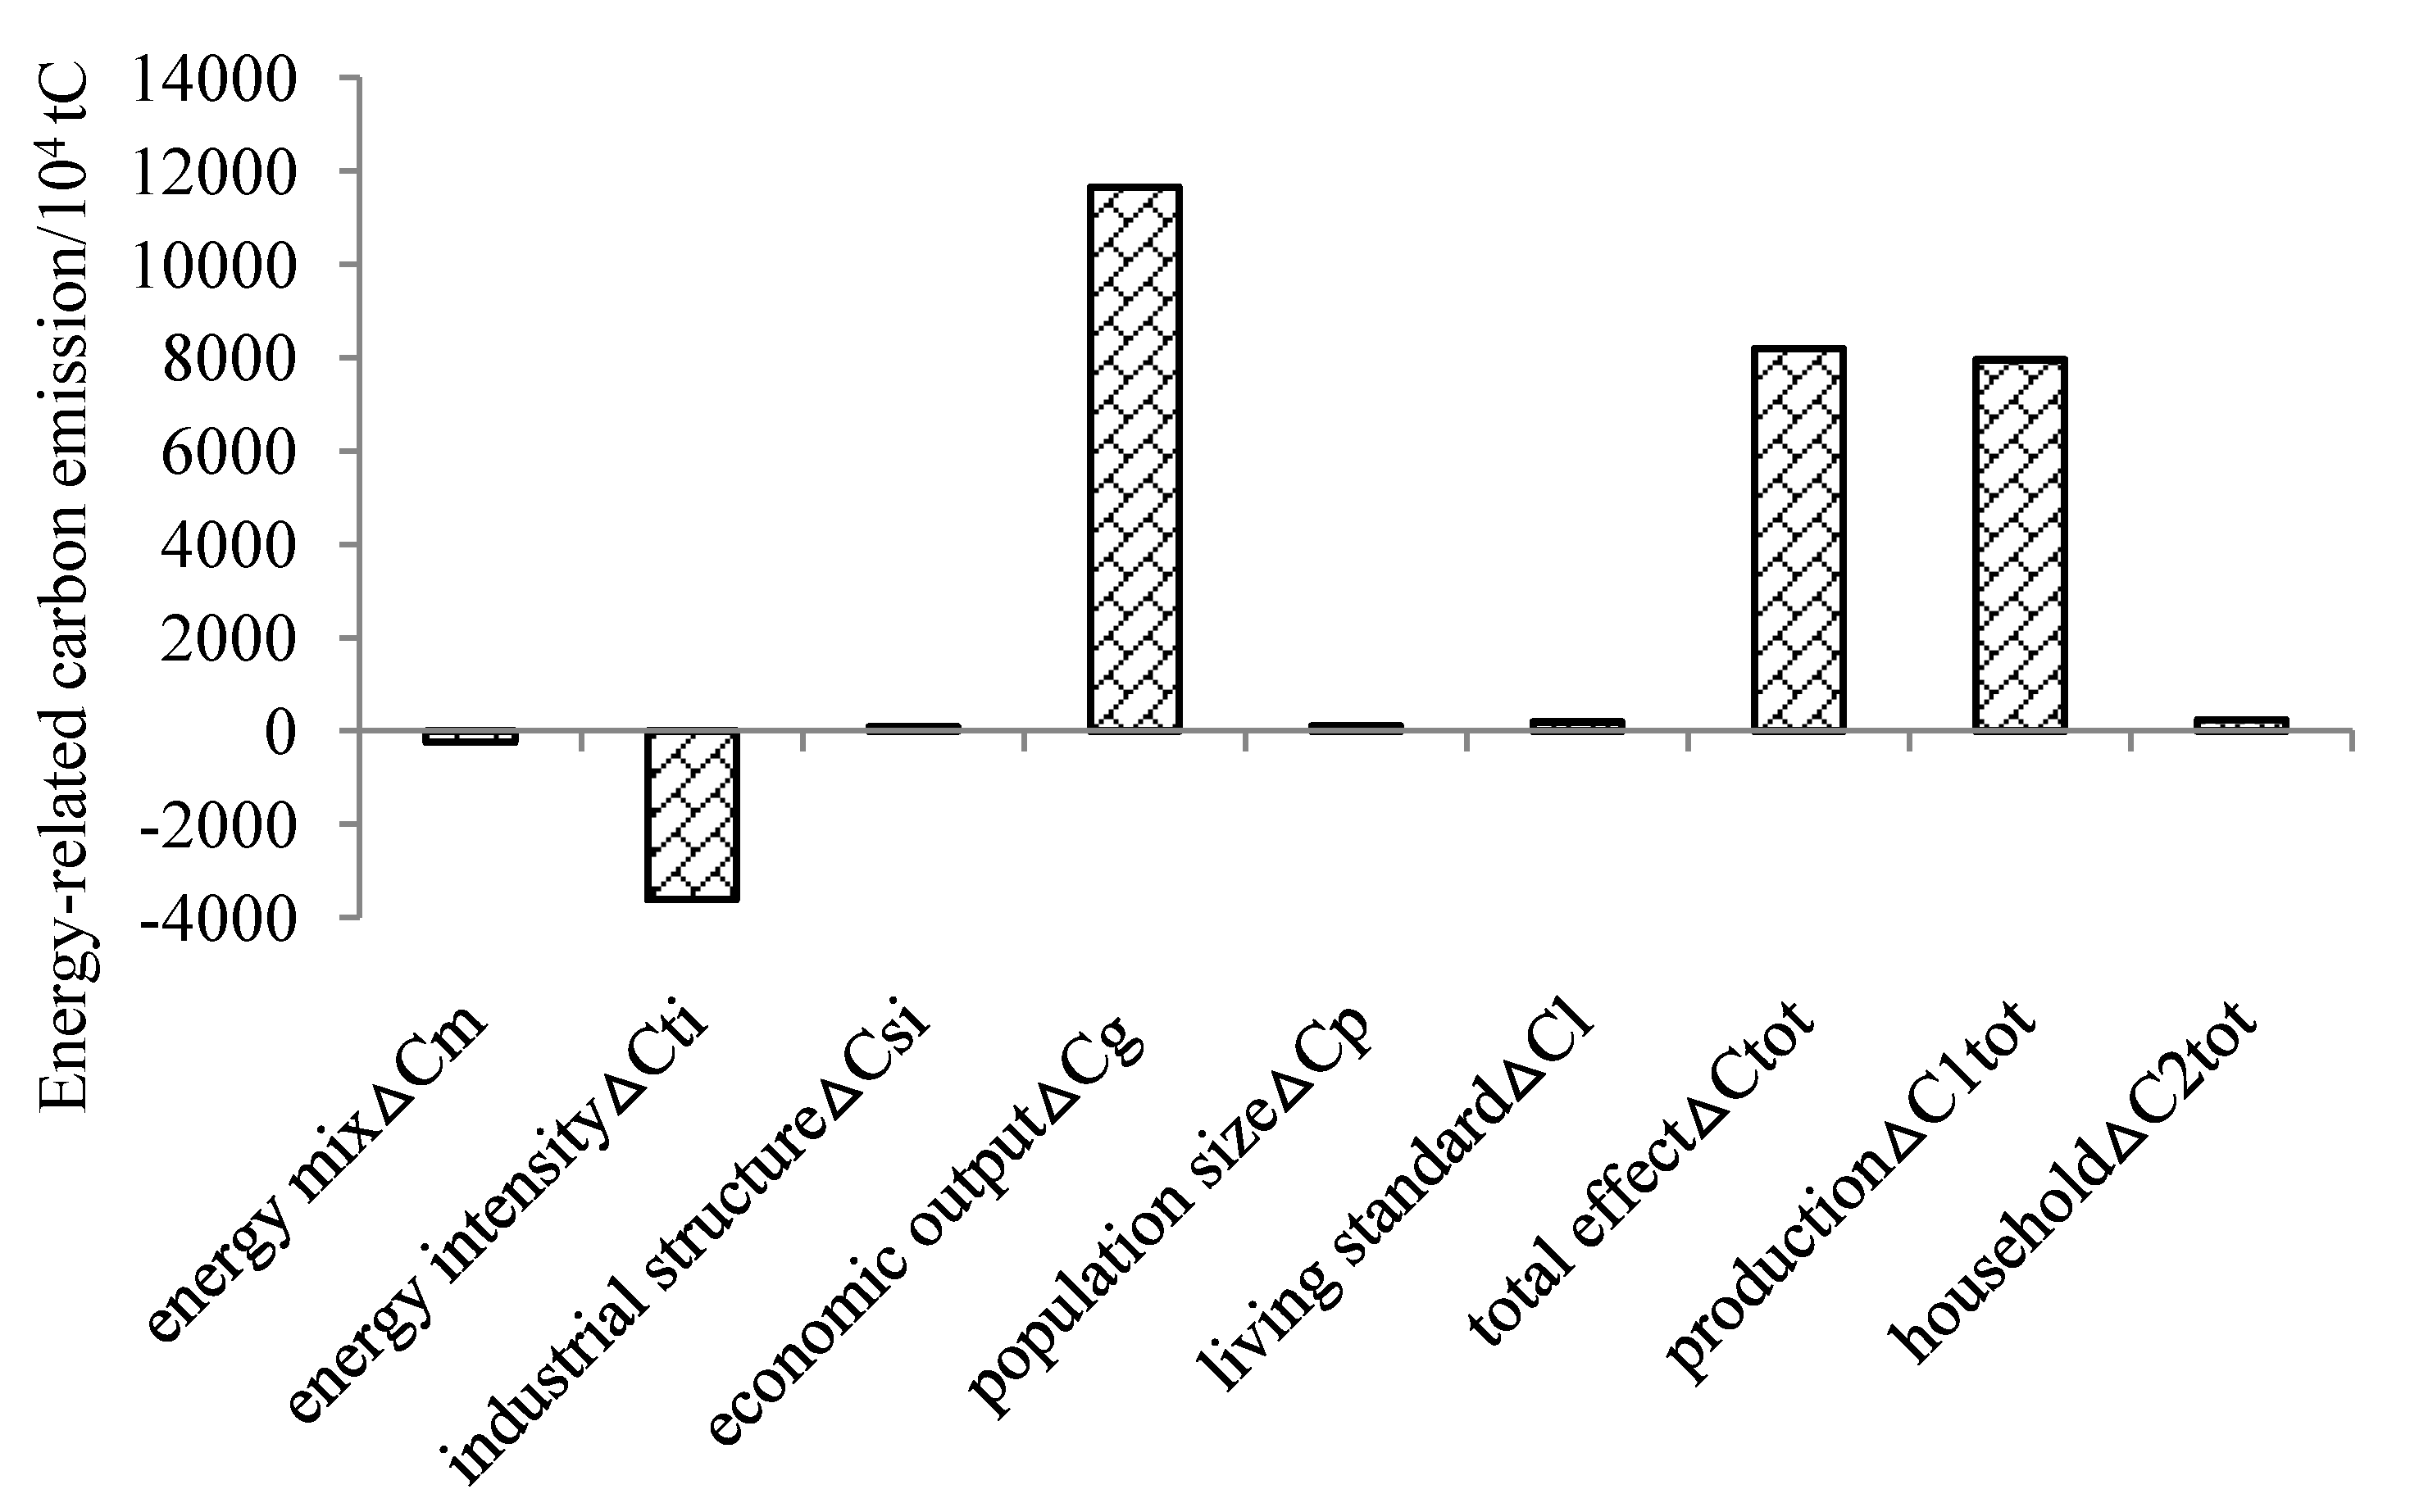
Results of period-wise analysis (Figure 5) show that the decomposed factors have an overall increase effect on carbon emissions, of which, the economic output gives the largest contribution to the increase in energy-related carbon emissions during the period 1996–2009. This indicates that the increase of carbon emissions is mainly caused by the increase of total economic output. Energy intensity has a significant reduction effect on energy-related carbon emissions, it is the main inhibitory factor. Other factors show weak effects on carbon emission temporarily during the period of interest in this article, e.g., energy mix show weak reduction effect, while population size, industrial structure and living standard show weak increase effect. As the sectors of energy consumption is concerned, the productive sector accounts for more than 94% of the total increased energy-related carbon emissions, much larger than that from household sector.
Figure 5. The contribution of each decomposition factors.
Energies 04 02249 g005
Results of LMDI factor decomposition listed in detail in Table A4 and Table A5. Total contribution values of the six factors on the carbon emissions increased from 248.18 × 10⁴ tC in 1996 to 8199.54 × 104 tC in 2009. Detailed description of contribution of the six factors on carbon emissions will be given by time series analysis.
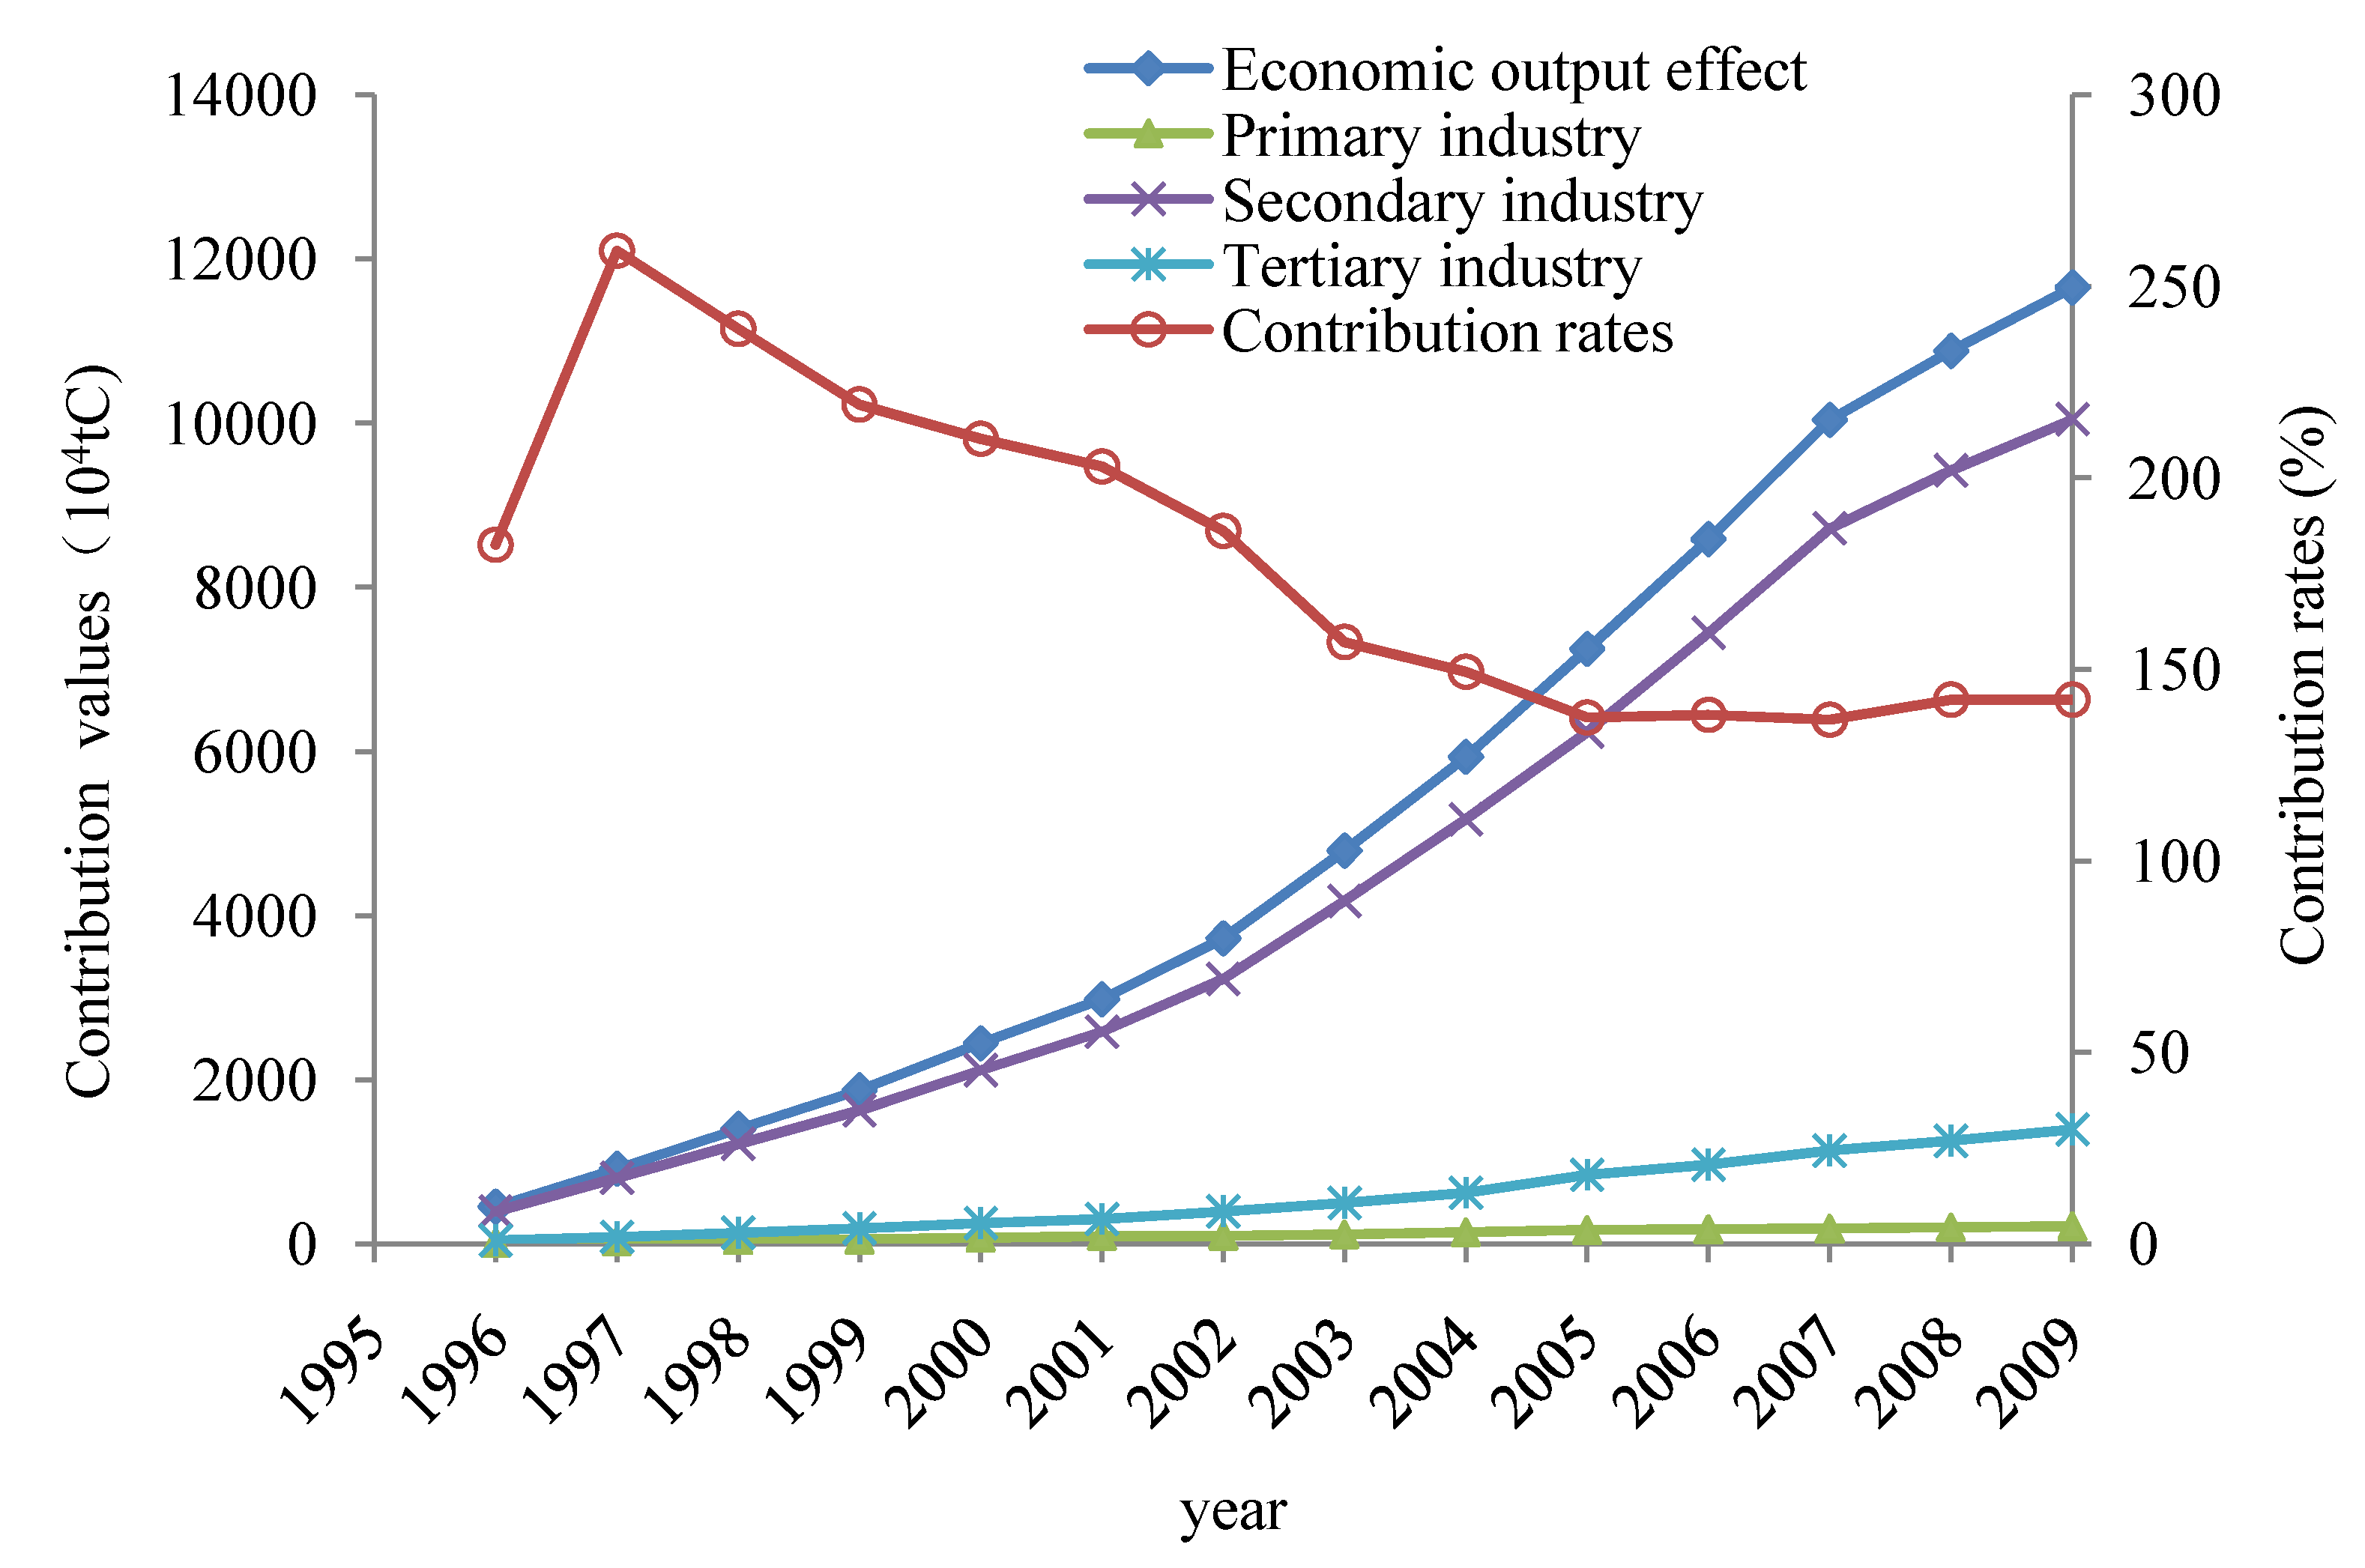
(1) Economic Output Effect
Guangdong’s economy grows rapidly and GDP increased from 638.3 billion Yuan (Renminbi) in 1995 to 3204 billion Yuan in 2009, with an average annual growth rate as high as 12.22%. From Figure 6, the contribution of economic output to carbon emissions increased from 453.15 × 10⁴ tC in1996 to 11653.35 × 104 tC in 2009. The secondary industry produced the largest contribution to carbon emissions, which increased from 394.59 × 10⁴ tC in 1996 to 10046.13 × 104 tC in 2009, and accounts for more than 86% of the total contribution from economic output effect. Second to that is the tertiary industry, and contribution of the primary industry is the least. The contribution rate of economic output to carbon emissiond declined markedly since its peak level (259.34%) in 1997, but began to rise again slightly since 2008. It shows that increase effect of economic output on energy-related carbon emissions was becoming gradually weaker from 1997 to 2007, but an increasing trend occurred again since 2008.Further study is needed to find out if this increasing trend would last to the 12th Five-Year Plan Period (2011–2015) or even later. The contribution rate of economic output to carbon emission is more than 100% all over the period of interest, indicating that all the reduction effects are offset by the increasing effect of the economic output. The fact that economic growth has a growing influence on energy-related carbon emissions give us a warning that it is still crucial to coordinate the relationship between economic development and energy consumption properly.
Figure 6. The contribution of economic output effect from 1996 to 2009.
Energies 04 02249 g006
(2) Energy Mix Effect
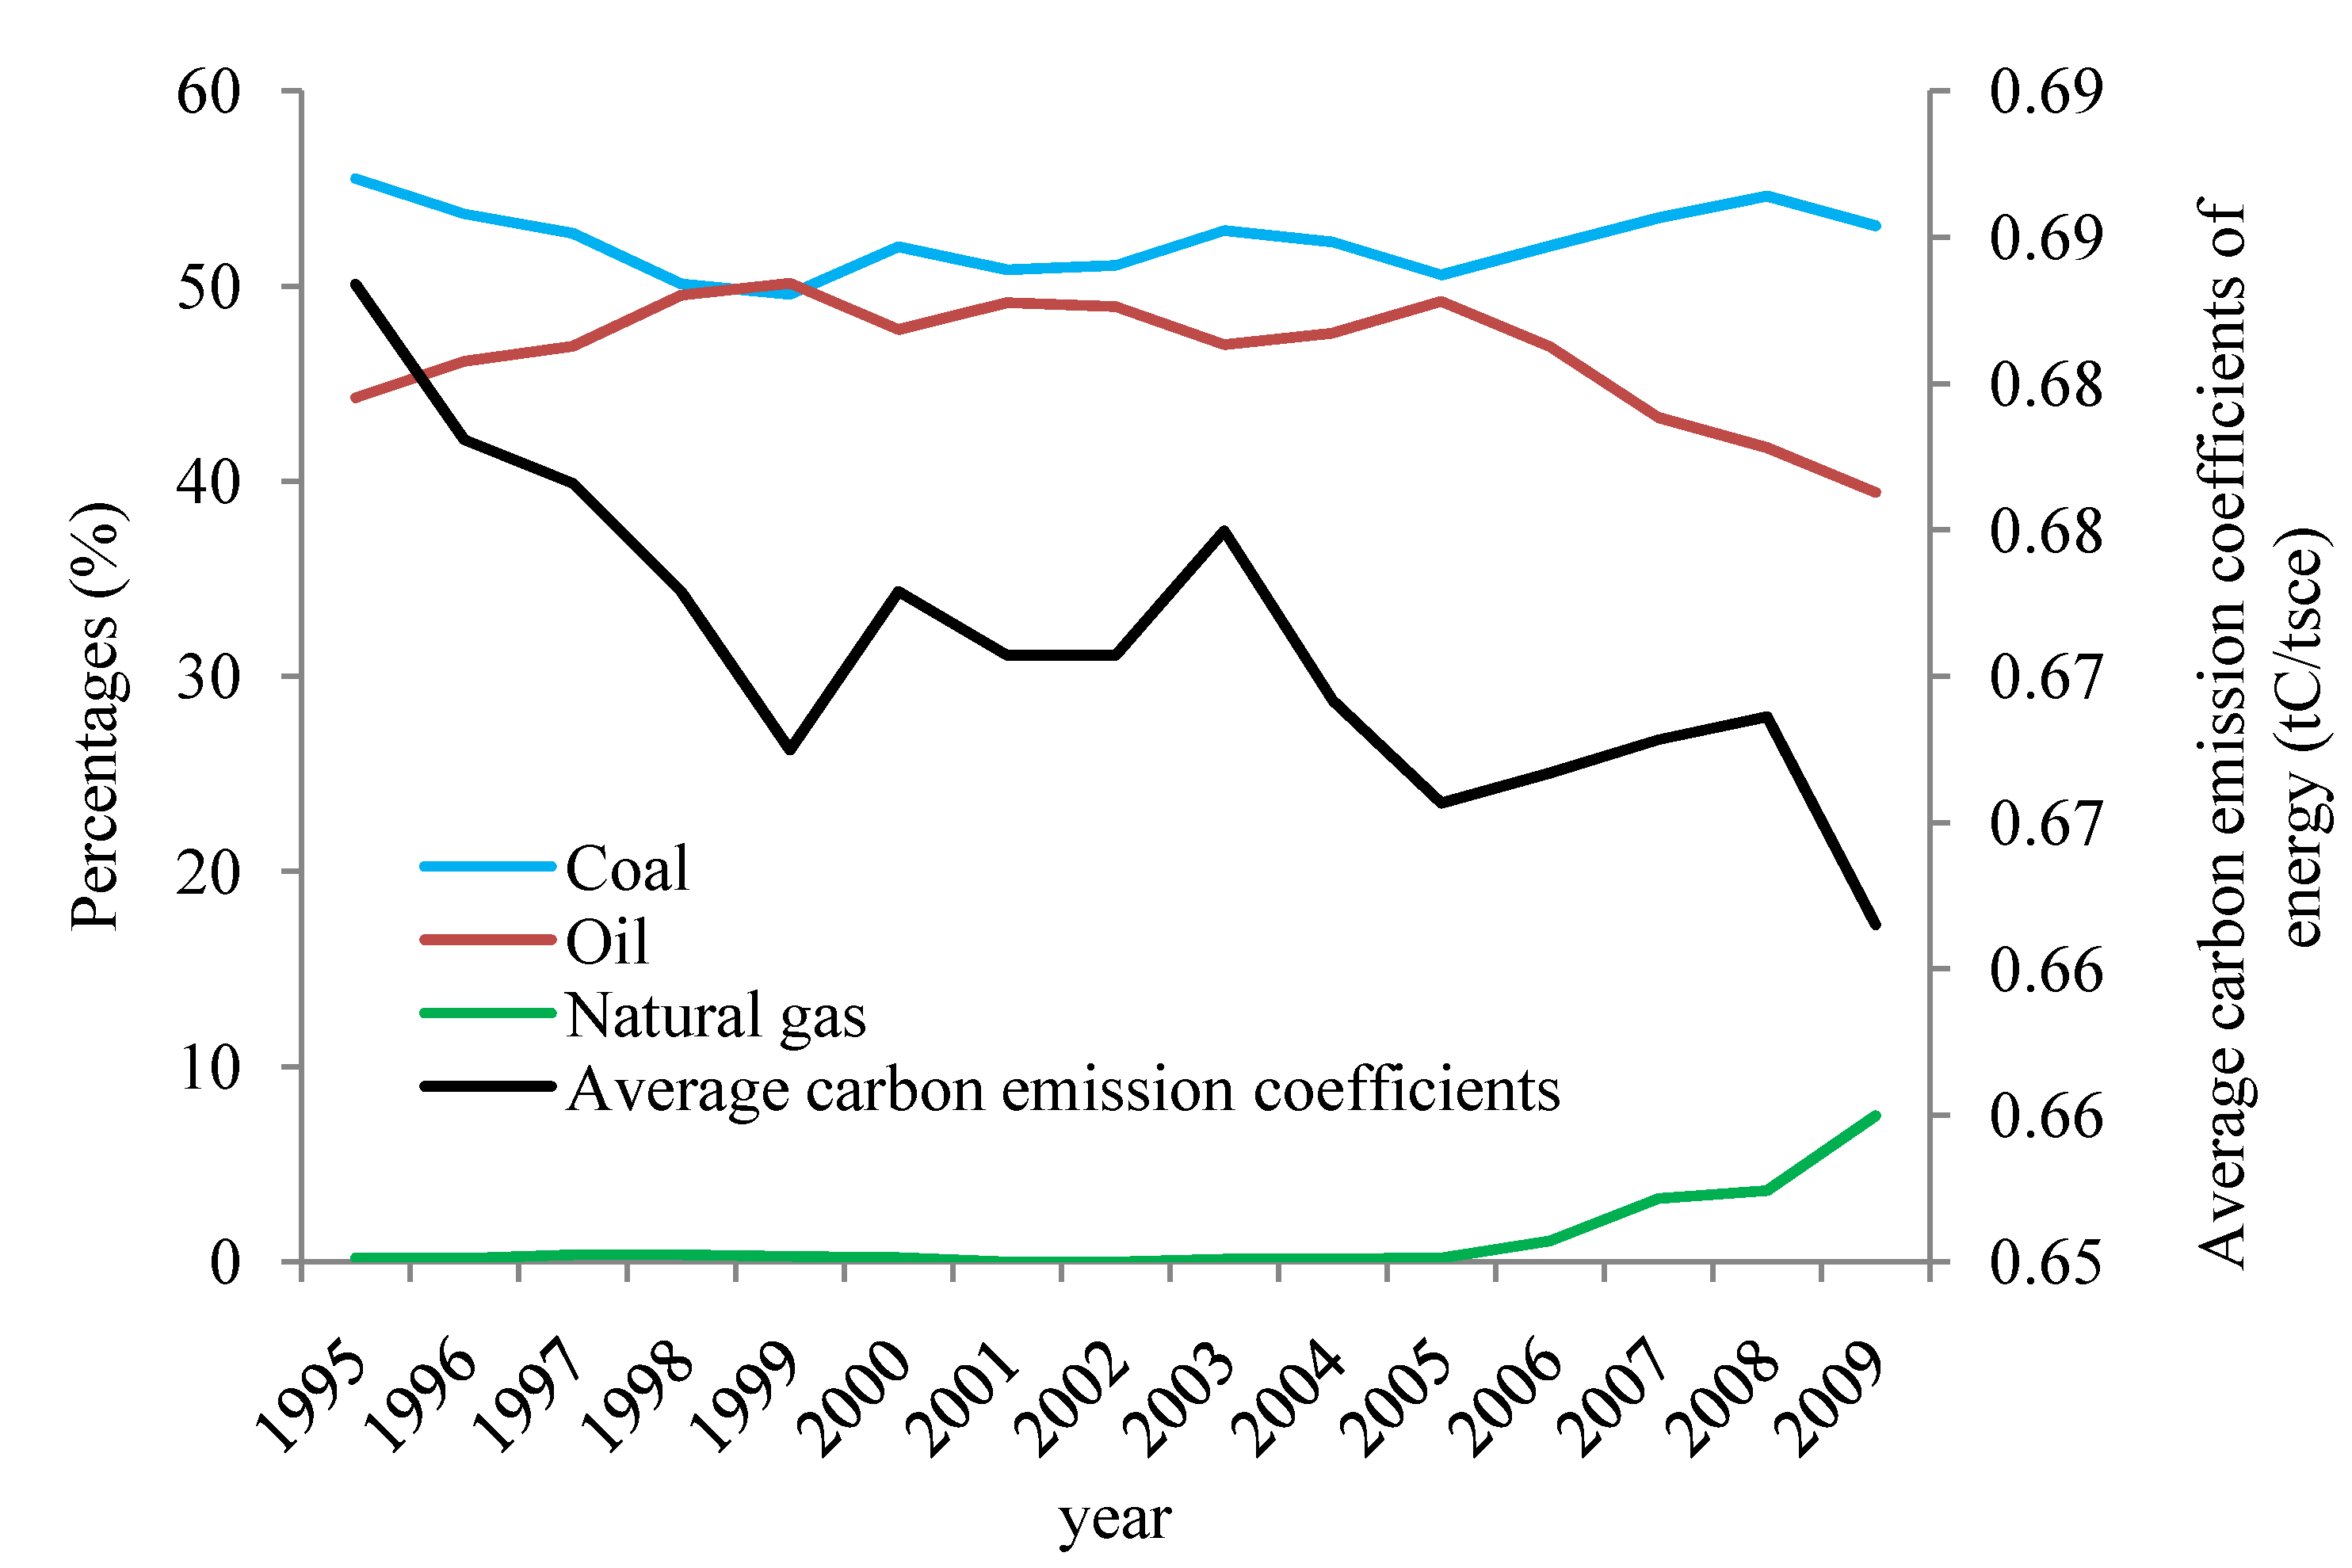
The energy mix in Guangdong improved a little during the period of interest. This small improvement can be seen from the contributions of coal, oil and natural gas to total energy consumption, it also can be seen from the change trend of the average carbon emissions coefficient of energy, which is the ratio of total carbon emissions to total energy consumption. From Figure 7, the proportion of coal was essentially unchanged, the proportion of oil had a slight decline and natural gas has risen during the 11th Five-Year Period, while the average carbon emissions coefficient showed only a small reduction. Overall, the energy mix based on coal, oil and other carbon-rich energy in Guangdong province had not changed much yet. Results of LMDI factor decomposition indicate that the effect of energy mix on carbon emissions is not significant during this period. The contribution of energy mix to carbon emission reduction increased from 50.86 × 10⁴ tC in1996 to 238.40 × 10⁴ tC in 2009 (Table A4), while its contribution rate decreased from 20.50% to 2.91% (Table A5). With the nuclear power, wind power, solar power, natural gas and other clean energy sources flowing intoconsumption field in recent years, the proportion of coal in terminal energy consumption is decreasing, while that of high-quality clean energy is increasing year by year. However, the advantage of resource endowment to develop new energy sources in Guangdong province has not been fully utilized, and the strategic effect of its substitution is still not significant. Yet, with the gradual increase of the capacity of the hydro, nuclear and wind power plants, coupled with the active promotion of the pilot projects on the utilization of solar energy and biomass energy in Guangdong province, development and utilization of renewable energy sources promise good prospects in the future. There is great potential to optimize the energy mix and it will be one of the most effective approaches for Guangdong to meet carbon abatement targets in the future.
Figure 7. Energy mix and average carbon emission coefficients of energy.
Energies 04 02249 g007
(3) Industrial Structure Effect
Much attention has been paid to the adjustment of the industrial structure in Guangdong province. However, industrial restructuring is more difficult in Guangdong than in other provinces. Because Guangdong’s economic and social development mainly relies on exports, its industry support is relatively weak. During the period of interest, the effect of the industrial structure adjustment is not obvious. 
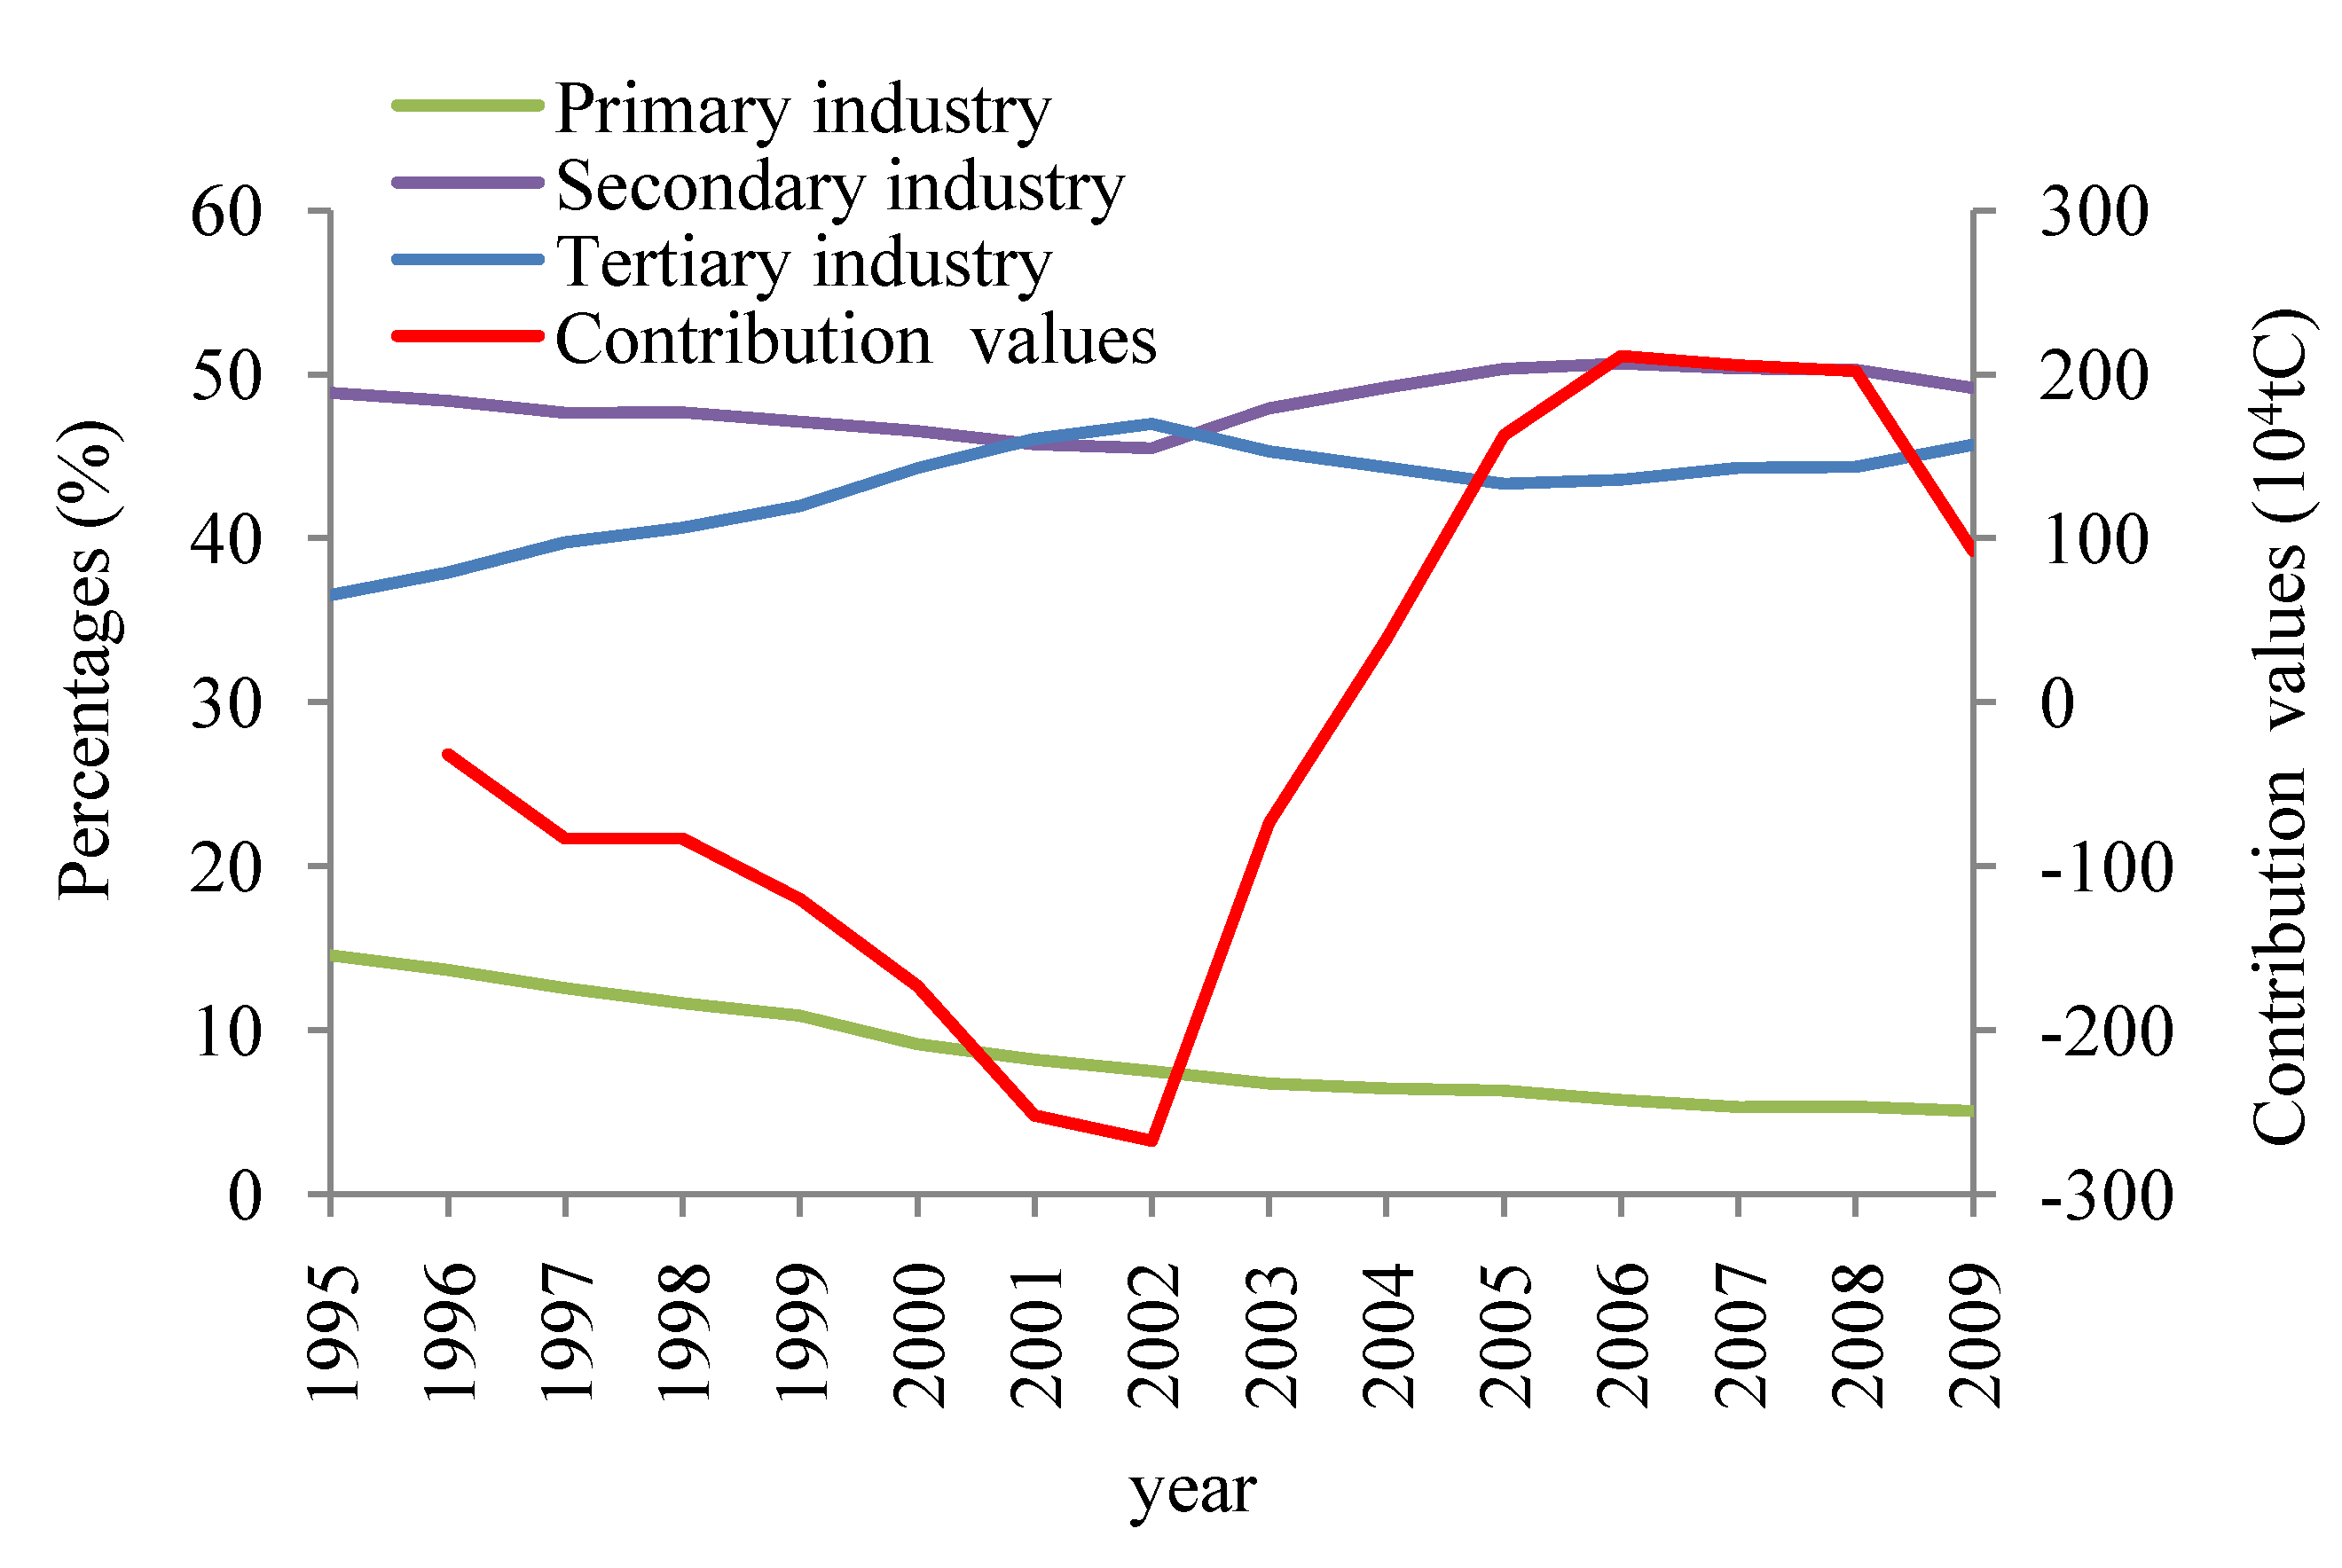
Figure 8 shows that the industrial structure was optimized during 1995–2002, the proportion of second industry declined while the proportion of tertiary industry increased almost linearly, and the industrial structure showed a reduction effect on energy-related carbon emissions in this stage.
The proportion of second industry increased while the proportion of tertiary industry declined during 2003–2006, so the industrial structure showed overall increase effect on energy-related carbon emissions in this period. The proportion of second industry declined again during 2007–2009, the increase effect weakened and shows a tendency to a reduction effect. This indicates that the bottleneck constraining the industrial restructuring in Guangdong province had been broken through by then. Especially during the 11th Five-Year Plan (2006–2010) period, great efforts were made to adjust the industrial structure in Guangdong, when industrial structure optimization began to take effect on the mitigation of carbon emissions.
Figure 8. Change of industrial structures and contribution of industrial structure effect.
Energies 04 02249 g008
(4) Energy Intensity Effect
Energy intensity has a significant constraining effect on the increase of carbon emissions. 
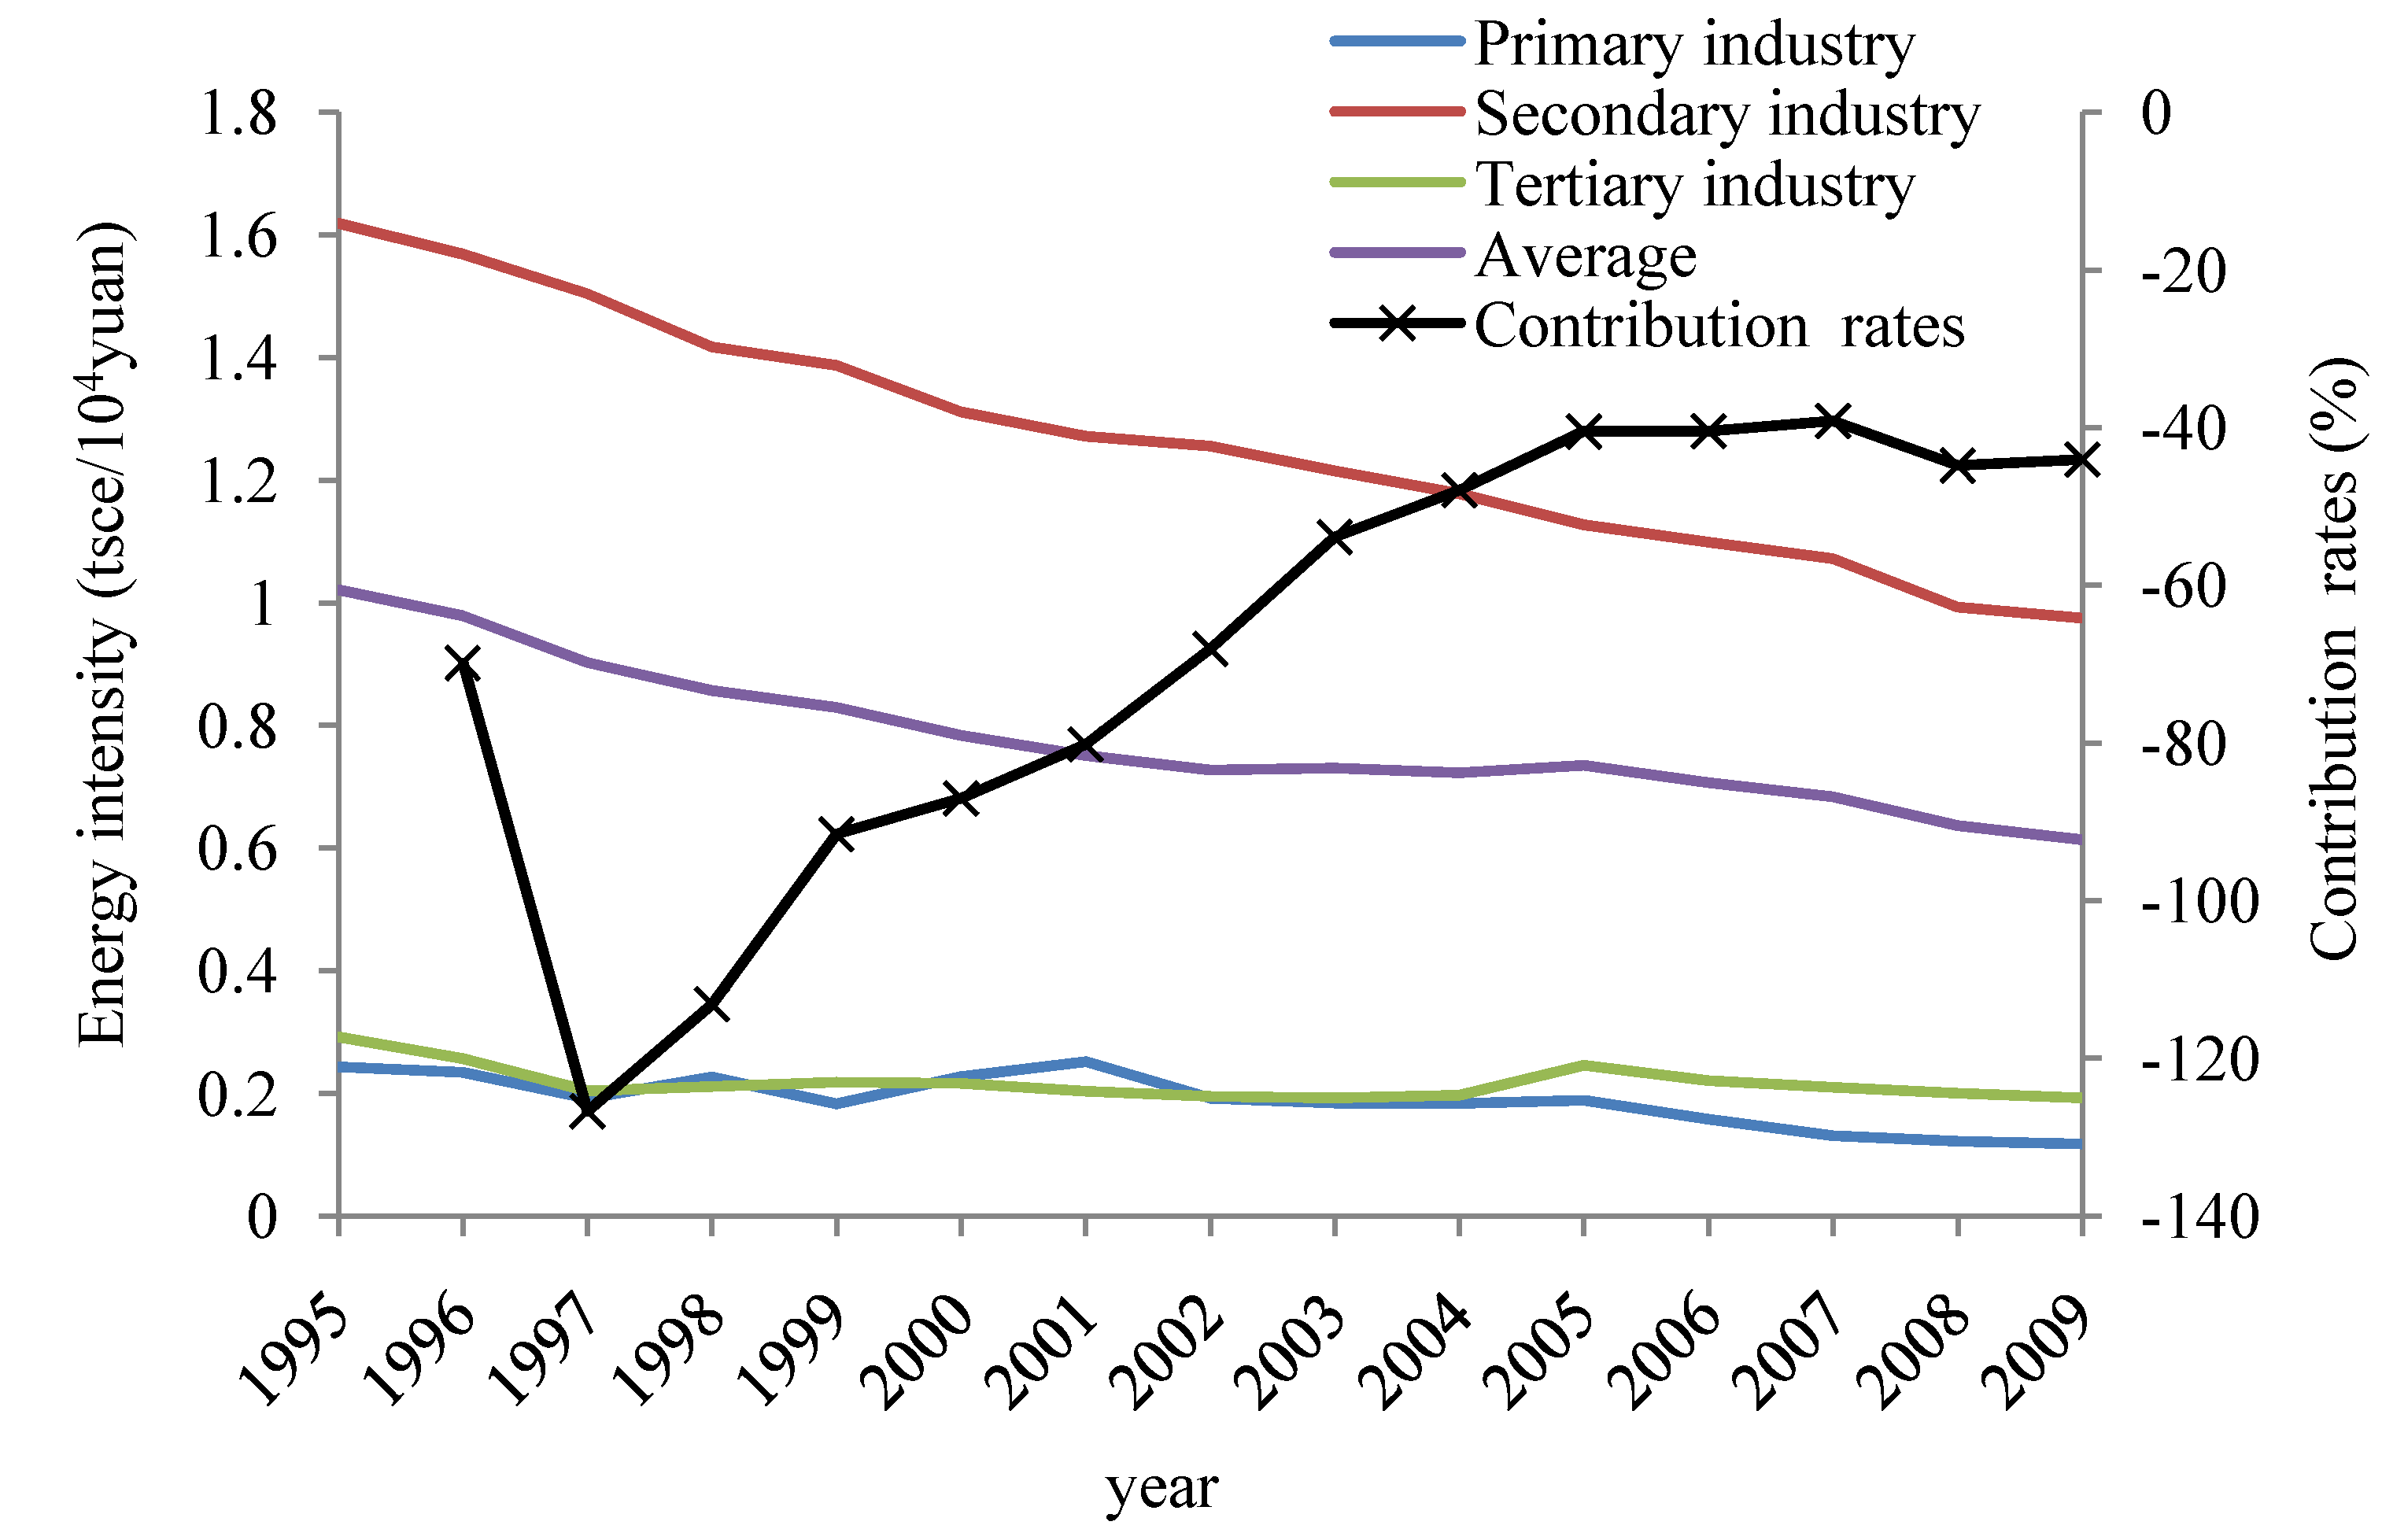
Figure 9 shows that energy intensity of the three strata of industry and average energy intensity declined year by year.
Figure 9. Changes of energy intensity and contribution rates of energy intensity effect.
Energies 04 02249 g009
Average energy intensity decreased from 1.02 tsce (tons of standard coal equivalent) per ten thousand Yuan GDP in1995 to 0.61 tsce per ten thousand Yuan GDP in 2009, with a yearly declining rate of 3.61%. The carbon emissions decline due to energy intensity decline increased from 173.49 × 10⁴ tC in 1996 to 3612.81 × 104 tC in 2009. The contribution rates of the energy intensity to total carbon emissions have increased year by year since its lowest level (−126.73%) in 1997, but has began to rise again slightly since 2008. This shows that the reduction effect of energy intensity on carbon emissions is gradually becoming weaker from 1997 to 2007, but it shows a slowly increasing trend since 2008. That contribution rates of the energy intensity to total carbon emissions have declined since 1997 can be explained from the aspect of economics. Improving energy efficiency and reducing energy intensity is relatively easy at the beginning, but it will become more difficult later according to the laws of economic development. In the 11th Five-Year Period (2006–2010), Guangdong has put much effort and paid a high price such as eliminating backward productive capacity and shutting down many small scale thermal power plants and cement factories to achieve the target to drop the energy consumption per unit GDP by 16% in 2010 compared to that in 2005. The potential to lower the energy intensity by eliminating backward productive capacity and shutting down small scale power plants and cement factories is very limited. It means that it will become increasingly difficult in the future to achieve emission reductions through shutting down power plants and cement factories. Guangdong needs other ways to reduce energy intensity and improve energy efficiency.
(5) Population Size and Standard of Living Effects
Guangdong’s rapid economic and social development and labor-intensive industries require a lot of labor. This attracts many outsiders seeking to find a job or a chance for doing business in Guangdong. As a result, the permanent population increased every year. Carbon emissions from households increased from 323.55 × 10⁴ tC in 1995 to 645.72 × 10⁴ tC in 2009, per capita carbon emissions of household increased from 0.044 tC in 1995 to 0.067 tC in 2009. The contribution of population size to carbon emissions increased from 7.87 × 10⁴ tC in 1996 to 106.97 × 10⁴ tC in 2009 (Table A4), while its contribution rate decreased from 3.17% to 1.3% Table A5). This indicates that the increase effect of population size on carbon emissions is weakening. The standard of living is the dominant factor affecting household energy-related carbon emissions, however, its contribution to total energy-related carbon emissions is neither significant nor stable, and its contribution rates remain at the range of −5% to 5% (Table A5). Population and energy consumption and carbon emissions per capita are listed in Table A6.
Overall, total energy-related carbon emissions in Guangdong province increased year by year from 1995 to 2009 because the emission reduction effects are not strong enough to offset the emission increase effects of economic output, and this upward trend will be difficult to reverse in the forthcoming 12th Five-Year Period (2011–2015).

4. Conclusions and Suggestions

4.1. Conclusions

In this paper, we have analyzed the variation trends of energy-related carbon emissions from the Productive and Household sectors in Guangdong province, China, during the period 1995–2009 based on the estimated results. We also discussed the influence of energy mix, energy intensity, industrial structure, economic output, population size and living standard on the energy-related carbon emissions in Guangdong province in detail by both period-wise analysis and time series analysis.
The energy-related carbon emissions from the three strata of industry, except the primary industry, and household energy consumption in Guangdong province show an increasing trend from 1995 to 2009. The main driving and inhibiting factors which influence energy-related carbon emissions are economic output and energy intensity, respectively, while the contributions of energy mix, industrial structures, population size and living standard are not significant during the period of interest.
Recently, two kinds of decomposition methods have been used for energy-related carbon emissions, decomposition on energy-related carbon emissions per capita and decomposition on total energy-related carbon emissions. We adopt here decomposition on total energy-related carbon emissions, where economic factor is referred to as total economic output. In other studies which adopt decomposition on energy-related carbon emissions per capita method, economic factor is referred to as economic level (economic output per capita).
Same conclusions in our study and other similar studies at China and abroad are: the main driving factor and inhibiting factor affecting energy-related carbon emissions are economic output (or level) and energy intensity, respectively. Optimization of energy mix and industrial structure can help reduce carbon emissions. There are three major differences in our study: (1) this article highlights the influence of total economic output (GDP) on carbon emission of the Productive sectors, and therefore, population size does not appear in the model. That is to say, the influence of population size on energy-related carbon emissions of Productive sectors is not considered. That’s why the contribution of population size to carbon emissions is not significant in this article, but significant in other similar studies at China and abroad; (2) our results show that the contribution rates of economic output to carbon emissions declined markedly since its peak level (259.34%) in 1997, but began to rise again slightly since 2008. But in other similar studies at China and abroad, the contribution rate of economic factor has almost always kept growing, and in some studies even exponential growth occurred during the period of interest; (3) We found a very interesting phenomenon (Figure 6 and Figure 9), namely that the contribution rate of economic output and energy intensity have exactly the same change route during the period studied. The increase effect of economic output and reduction effect of energy intensity were enhanced at the same time and also weakened at the same time.

4.2. Suggestions on Carbon Emission Reduction

The authors hold that there are two most effective approaches to reduce carbon emissions in the future for Guangdong province according to the analysis results in Section 3 and the current situation that Guangdong is facing:
(1) Optimizing energy mix by exploiting new energy sources. The irrational energy structure based on coal, oil and other carbon-rich energy in Guangdong province had not improved too much yet, so the potential to improve the energy mix in the future is great. Optimization of the energy mix can be realized mainly by means of making great efforts to exploit new energy sources. Its subtropical maritime climate characteristics make Guangdong rich in solar energy, wind energy, biomass energy, oceanic energy and other new energy resources, and it is endowed with a broad space and potential to develop and utilize low carbon energy sources. As the biggest province in the economy of China, Guangdong has a strong economic basis to develop new energy sources. Guangdong should take full use of its economic advantage to invest in the exploitation of clean energy sources, especially solar energy, wind energy and oceanic energy.
(2) Cutting down energy intensity by developing low-carbon technologies. The potential to lower the energy intensity through eliminating backward productive capacity and shutting down small scale power plants and cement factories is very limited. Guangdong needs other ways to reduce energy intensity and improve energy efficiency in the future. Energy intensity is closely related with energy mix, industrial structure and technological progress. Cutting down energy intensity to achieve carbon emissions reduction by optimizing energy mix and industrial structure are mainly from the perspective of controlling carbon sources. It is incomplete because economic development is inseparable from the energy consumption, so carbon emissions are inevitable. It is necessary to use advanced technology to reduce carbon emissions or CO2 should be used as a useful resource to achieve real carbon emission reduction in the future. As the biggest province in economy of China, Guangdong should make full use of its economic advantages to invest in developing low-carbon technologies or introducing advanced foreign technology, such as in the industry sector, conversion of energy into power, industrial processing capacity and heat by widely adopt symbiotic production technology. In the power production sector, by adopting advanced Natural Gas Combustion Combined Cycle Power Generation technology or cogeneration technology. In the sector of transportation, by developing technology for improving power and energy efficiency. Paying attention to research and development of CCS technology is also very important, for it will be the main technique used for future carbon reductions.

Acknowledgements

The authors gratefully acknowledge the financial support from the Key Program for Science and Technology plan of Guangdong Province 2008A030203003 and 2010A040101009. GIGCAS Contribution No. 1423.

Appendix

Table A1. Energy consumption by types (104 ton standard coal equivalent).
YearRaw CoalWashed Clean CoalOther Washed CoalBriquettesCokeCoke-oven GasOther GasOther Coking ProductsCrude OilGasoline
19953453.43.00.00.0128.112.919.00.027.7413.8
19963542.80.50.021.8135.19.318.92.939.7387.3
19973539.61.30.025.5154.412.519.01.429.4386.3
19983541.89.20.722.2154.38.816.81.246.6414.6
19993683.46.20.121.1159.39.687.11.451.1423.6
20004137.05.10.017.1140.99.963.11.649.3441.8
20014255.65.70.017.9168.010.470.01.829.6476.8
20024652.29.90.018.5171.79.772.60.524.2505.7
20035552.323.60.318.9221.310.284.50.536.9550.4
20046093.013.65.522.3267.833.5199.42.632.4656.7
20056864.517.83.524.5290.326.8227.63.024.91039.1
20067682.515.23.9143.9286.725.1306.43.3141.31135.0
20078602.117.74.4289.1430.719.6312.22.330.01232.6
20089028.018.04.7322.9424.823.5327.86.428.31305.0
20098912.6378.25.3337.9441.324.1328.69.528.51408.4
YearKeroseneDiesel OilFuel OilLiquefied Petroleum GasRefinery GasOther Petroleum ProductsNatural GasTotal
199582.4869.9911.7319.856.4203.713.66515.3
199682.5872.61032.3498.469.9223.812.16950.0
199795.3796.41023.4501.878.6430.926.47122.1
199896.6941.01182.8521.375.9434.626.77495.4
199998.51110.91243.5536.482.9467.322.78005.1
2000131.31114.71334.9545.6104.4297.019.08412.5
2001140.71187.31473.4614.9111.0346.20.08909.4
2002151.21233.91640.9666.5115.0392.80.09665.4
2003175.31361.31764.6767.6113.0488.216.811185.8
2004191.91489.32177.2865.7105.0527.521.512705.2
2005226.21903.92275.41043.5105.9638.731.014746.7
2006231.61992.72242.9923.2131.4830.4174.216269.7
2007251.82095.61880.71038.4134.91160.7587.518090.4
2008269.42213.21538.61092.4127.51184.0680.218594.6
2009282.72284.61278.61119.0126.71223.21473.519662.6
Table A2. Energy consumption by sectors (104 ton standard coal equivalent).
Sector19951996199719981999200020012002
Primary Industry226.2227.7190.6230.9192.0223.9245.1192.4
Secondary IndustryIndustry(End-use)2614.02698.22987.43051.43090.12903.93064.03258.9
Thermal Power production2227.52519.82507.62654.03004.13450.73612.84080.8
Heat Power production152.9149.5143.1184.3180.1173.5194.0248.8
Construction(End-use)54.721.719.421.122.525.526.928.2
Total5049.15389.25657.55910.86296.86553.66897.77616.7
Tertiary Industry (End-use)Transport, Storage, Postal and Telecommunication Services532.9564.2530.2641.4778.4895.8970.81053.1
Wholesale and Retail Trade and Catering Services100.9100.191.188.698.7105.6113.1135.2
Others147.4189.1185.0166.4169.6157.9172.8165.2
Household (End-use)559.0641.5632.8601.9616.9606.7653.8660.6
Total6515.36950.07122.17495.48005.18412.58909.49665.4
Sector2003200420052006200720082009
Primary Industry190.6208.5239.7209.1184.8190.5191.3
Secondary IndustryIndustry(End-use)4421.14183.34994.86081.76706.97343.18177.9
Thermal Power production4189.55782.66146.36445.67204.06928.16794.8
Heat Power production266.7172.5172.3218.0289.0233.7306.2
Construction(End-use)35.442.569.174.581.875.286.5
Total8912.710180.911382.512819.814281.714580.115365.4
Tertiary IndustryEnd-useTransport, Storage, Postal and Telecommunication Services1175.41352.01815.41867.82059.22219.42325.9
Wholesale and Retail Trade and Catering Services125.5144.4248.9277.1316.5300.9415.2
Others198.2200.4278.9263.4284.9325.8349.2
Household (End-use)745.1777.8987.41023.01166.11228.31284.3
Total11185.812705.214746.716269.718090.418594.619662.6
Table A3. GDP by sectors.
YearGDP (100 Million Yuan)Percentages of the Three Strata of Industry (%) (Industrial Structure)
GDPPrimary IndustrySecondary IndustryTertiary IndustryGDPPrimary IndustrySecondary IndustryTertiary Industry
19956382.98930.053120.152332.7810014.648.936.5
19967102.29971.823436.872693.6010013.748.437.9
19977897.22993.763762.853140.6010012.647.639.8
19988750.321020.134171.743558.4510011.747.740.7
19999636.191051.064540.664044.4710010.947.142.0
200010741.25986.324999.514755.421009.246.544.3
200111867.90974.765427.705465.441008.245.746.1
200213336.331002.606067.836265.901007.545.547.0
200315316.081037.127339.506939.461006.847.945.3
200417581.181136.858649.327795.011006.549.244.3
200520065.411270.4910102.018692.911006.350.343.3
200623035.091327.4411669.9310037.711005.850.743.6
200726467.311412.2513330.3611724.701005.350.444.3
200829219.911566.7814692.4212960.711005.450.344.4
200932040.011631.3315759.0414649.641005.149.245.7
Table A4. Contribution of each decomposed factor to energy-related carbon emissions in Guangdong province.
YearContribution of Carbon Emission by Factors (104 tC)Total EffectΔCtotCarbon Emissions (104 tC)
Energy Mix ΔCmEnergy Intensity ΔCtiIndustrial Structure ΔCsiEconomic Output ΔCgPopulation Size ΔCpLiving Standard ΔClProductive ΔC1totHousehold ΔC2tot
1996−50.86−173.49−31.61453.157.8743.12248.18228.9419.24
1997−79.06−446.82−83.17914.3816.3530.90352.58348.993.60
1998−102.38−663.18−82.981400.4323.6410.48586.01597.55−11.55
1999−160.97−781.81−119.961871.2932.4512.71853.71856.67−2.96
2000−103.18−1012.08−172.892443.9346.27−39.521162.531208.29−45.76
2001−108.48−1177.30−251.932980.4150.76−25.511467.951496.07−28.12
2002−122.89−1361.25−267.283722.0354.89−26.221999.272019.85−20.57
2003−93.94−1643.76−73.464791.5561.026.693048.113035.8612.25
2004−182.29−1904.1138.915933.7868.4515.573970.303938.8131.49
2005−187.59−2135.41162.837249.0481.02102.685272.565134.71137.86
2006−262.25−2516.38211.168586.3885.01110.846214.756068.28146.47
2007−294.80−2873.23205.5610039.4194.88160.477332.287147.06185.23
2008−277.72−3432.30202.0810881.05101.07180.837655.027445.33209.69
2009−238.40−3612.8192.1511653.35106.97198.298199.547959.39240.15
Table A5. Contribution rate of each decomposed factor to energy-related carbon emission (%).
YearEnergy MixEnergy IntensityIndustrial StructureEconomic OutputPopulation SizeLiving StandardProductiveHousehold
ΔCmCtotΔCtiCtotΔCsiCtotΔCgCtotΔCpCtotΔClCtotΔC1totCtotΔC2totCtot
1996−20.50−69.90−12.74182.593.1717.3792.257.75
1997−22.42−126.73−23.59259.344.648.7698.981.02
1998−17.47−113.17−14.16238.984.031.79101.97−1.97
1999−18.86−91.58−14.05219.203.801.49100.35−0.35
2000−8.88−87.06−14.87210.233.98−3.40103.94−3.94
2001−7.39−80.20−17.16203.033.46−1.74101.92−1.92
2002−6.15−68.09−13.37186.172.75−1.31101.03−1.03
2003−3.08−53.93−2.41157.202.000.2299.600.40
2004−4.59−47.960.98149.451.720.3999.210.79
2005−3.56−40.503.09137.491.541.9597.392.61
2006−4.22−40.493.40138.161.371.7897.642.36
2007−4.02−39.192.80136.921.292.1997.472.53
2008−3.63−44.842.64142.141.322.3697.262.74
2009−2.91−44.061.12142.121.302.4297.072.93
Table A6. Energy consumption and carbon emissions per capita.
YearPopulation (104 Persons)Energy Consumption per Capita (tsce)Per Capita Energy Consumption of Household (tsce)Carbon Emissions per Capita (tC)Per capita Carbon Emissions of Household (tC)
19957387.500.8820.0810.6030.044
19967569.780.9180.0930.6230.046
19977779.690.9150.0900.6190.043
19987990.030.9380.0840.6310.040
19998217.910.9720.0850.6490.039
20008650.030.9730.0710.6540.036
20018733.181.0200.0750.6840.038
20028842.081.0960.0750.7350.038
20038962.691.2480.0830.8420.042
20049110.661.3950.0850.9330.043
200591941.6040.1071.0680.055
200693041.7490.1101.1660.056
200794491.9150.1231.2790.062
200895441.9480.1291.3030.064
200996382.0400.1331.3500.067

References

  1. Intergovernmental Panel on Climate Change (IPCC). Climate Change 2007: The Physical Science Basis; IPCC: New York, NY, USA, 2007. Available online: http://www.ipcc.ch/ (accessed on 30 July 2011).
  2. International Energy Agency (IEA). CO2 Emissions from Fuel Combustion 2010 Edition; IEA: Paris, 2010. Available online: http://www.iea.org/stats/index.asp (accessed on 30 July 2011).
  3. Dhakal, S. Urban energy use and carbon emissions from cities in China and policy implications. Energy Policy 2009, 37, 4208–4219. [Google Scholar] [CrossRef]
  4. Zhang, M.; Mu, H.L.; Ning, Y.D.; Song, Y. Decomposition of energy-related CO2 emission over 1991–2006 in China. Ecol. Econ. 2009, 68, 2122–2128. [Google Scholar] [CrossRef]
  5. He, J.; Deng, J.; Su, M. CO2 EMISSION from China’s energy sector and strategy for its control. Energy 2010, 35, 4494–4498. [Google Scholar] [CrossRef]
  6. Zhao, M.; Tan, L.R.; Zhang, W.G.; Ji, M.H.; Liu, Y.; Yu, L.Z. Decomposing the influencing factors of industrial carbon emissions in shanghai using the LMDI method. Energy 2010, 35, 2505–2510. [Google Scholar] [CrossRef]
  7. Wang, T.; Watson, J. Scenario analysis of China’s emissions pathways in the 21st century for low carbon transition. Energy Policy 2010, 38, 3537–3546. [Google Scholar] [CrossRef]
  8. Zhang, L.X.; Wang, C.B.; Yang, Z.F.; Chen, B. Carbon emissions from energy combustion in rural China. Procedia Environ. Sci. 2010, 2, 980–989. [Google Scholar] [CrossRef]
  9. Chang, C.C. A multivariate causality test of carbon dioxide emissions, energy consumption and economic growth in China. Appl. Energy 2010, 87, 3533–3537. [Google Scholar] [CrossRef]
  10. Rout, U.K.; Vob, A.; Singh, A.; Fahl, U.; Blesl, M.; Gallachóir, B.P.Ó. Energy and emissions forecast of China over a long-time horizon. Energy 2011, 36, 1–11. [Google Scholar] [CrossRef]
  11. Wang, R.; Liu, W.J.; Xiao, L.S.; Liu, J.; Kao, W. Path towards achieving of China’s 2020 carbon emission reduction target-a discussion of low-carbon energy policies at province level. Energy Policy 2011, 39, 2740–2747. [Google Scholar] [CrossRef]
  12. Xu, G.Q.; Liu, Z.Y.; Jiang, Z.H. Decomposition model and empirical study of carbon emissions for China, 1995-2004. China Popul. Resour. Environ. 2006, 16, 158–161. (in Chinese). [Google Scholar]
  13. Zhu, Q.; Peng, X.Z.; Lu, Z.M.; Wu, K.Y. Factors decomposition and empirical analysis of variations in energy carbon emission in China. Resour. Sci. 2009, 31, 2072–2079. (in Chinese). [Google Scholar]
  14. Liu, H.G.; Liu, W.D. Decomposition of energy-induced CO2 emissions in industry of China. Progress Geogr. 2009, 28, 285–292. (in Chinese). [Google Scholar]
  15. Wang, Z.; Zhai, S.Y.; Ma, X.Z. The historical characteristics and trend forecasting of carbon emissions form energy consumption in Henan province. Areal Res. Dev. 2010, 29, 69–74. (in Chinese). [Google Scholar]
  16. Zhu, Y.; Qiu, S.F. Caculation and analysis on energy-related CO2 emissions in Fujian province. Fujian Trib. 2010, 10, 145–148. (in Chinese). [Google Scholar]
  17. Guo, C.X. Decomposition of China’s CARBON emissions: Based on LMDI method. China Popul. Resour. Environ. 2010, 20, 4–9. (in Chinese). [Google Scholar]
  18. Qian, G.X.; Zhang, Y.P.; Wu, J.G. Decomposition analysis on changes of energy-related CO2 emission in Inner Mongolia. Technol. Econ. 2010, 29, 77–84. (in Chinese). [Google Scholar]
  19. Wang, Y.; Zhang, J.Y.; Zhao, Y.C.; Zheng, C.G. Empirical study of decomposition of CO2 emission factors. Water Resour. Power 2010, 28, 161–165. (in Chinese). [Google Scholar]
  20. Li, G.Z.; Li, Z.Z. Empirical analysis on decomposition of energy-related carbon emissions of agriculture in China: Based on LMDI method. J. Agrotech. Econ. 2010, 10, 66–72. (in Chinese). [Google Scholar]
  21. Liu, Y.N.; Hong, Y.Z.; Yu, J.J. Decomposition empirical study of carbon emissions for Fujian. Technol. Econ. 2010, 29, 58–61. (in Chinese). [Google Scholar]
  22. Wen, J.G. 2010, Decomposition model and empirical study of carbon emissions for Jiangsu province. East China Econ. Manag. 2010, 24, 29–32. (in Chinese). [Google Scholar]
  23. Gao, C.L.; Gao, G.; Tian, C.X. Decomposition analysis and reduction approaches of carbon emissions for energy consumption in Henan province. China Min. Mag. 2010, 20, 46–49. (in Chinese). [Google Scholar]
  24. Zeng, L.M.; Huang, H. Guangdong energy current situation and development trend. Energy Technol. 2006, 27, 151–155. (in Chinese). [Google Scholar]
  25. Zhang, R.S.; Tan, Z.S. Multivariate analysis and strategy on energy consumption structure of Guangdong. Consume Guide 2008, 16, 4–5. (in Chinese). [Google Scholar]
  26. Tian, Z.H.; Chen, W.L. Analysis on the present situation and the countermeasures for development of energy in Guangdong. Guangdong Sci. Technol. 2010, 235, 15. (in Chinese). [Google Scholar]
  27. Han, J.B. An empirical study on the relationship between economic growth and resources consumption in Guangdong province. J. Guangzhou Radio TV Univ. 2010, 2, 76–81. (in Chinese). [Google Scholar]
  28. Xiao, H.J.; Kuang, Y.Q.; Hang, N.S.; Zhu, Z.Y.; Liu, Y.; Tang, J.L. Variation of the carbon budget in Guangzhou during its rapid industrialization course. Ecol. Environ. 2006, 15, 1209–1215. (in Chinese). [Google Scholar]
  29. Liu, Y. On current CO2 emission in Guangdong and policy trends. China Open. Herald 2009, 146, 40–43. (in Chinese). [Google Scholar]
  30. Kuang, Y.Q.; Ouyang, T.P.; Zou, Y.; Liu, Y.; Li, C.; Wang, D.H. Present situation of carbon source and sink and potential for increase of carbon sink in Guangdong province. China Popul. Resour. Environ. 2010, 20, 56–61. (in Chinese). [Google Scholar]
  31. Chen, M.Z. Study on the carbon emission factors in Guangdong province based on divisia decomposition method. Meteorol. Environ. Res. 2010, 1, 7–10. [Google Scholar]
  32. Energy Research Institute of National Development and Reform Commission (ECIDC). China Energy Sustainable Development and CO2 Emission Scene Analysis Synthesis Report; ECIDC: Beijing, China, 2003. [Google Scholar]
  33. Intergovernmental Panel on Climate Change (IPCC). 2006 IPCC Guidelines for National Greenhouse Gas Inventories; IPCC: Kanagawa, Japan, 2006. Available online: http://www.ipcc-nggip.iges.or.jp (accessed on 29 July 2011).
  34. Ang, B.W. The LMDI approach to decomposition analysis: A practical guide. Energy Policy 2005, 33, 867–871. [Google Scholar] [CrossRef]
  35. Wang, C.; Chen, J.N.; Zou, J. Decomposition of energy-related CO2 emission in China: 1957–2000. Energy 2005, 30, 73–83. [Google Scholar] [CrossRef]
  36. Liu, L.C.; Fan, Y.; Wu, G.; Wei, Y.M. Using LMDI method to analyze the change of China’s industrial CO2 emissions from final fuel use: An empirical analysis. Energy Policy 2007, 35, 5892–5900. [Google Scholar] [CrossRef]
  37. Hatzigeorgiou, E.; Polatidis, H.; Haralambopoulos, D. CO2 Emissions in Greece for 1990–2002: A Decomposition analysis and comparison of results using the arithmetic mean divisia index and logarithmic mean divisia index techniques. Energy 2008, 33, 492–499. [Google Scholar] [CrossRef]
  38. Tunç, G.; Aşık, S.T.; Akbostancı, E. A decomposition analysis of CO2 emissions from energy use: Turkish case. Energy Policy 2009, 37, 4689–4699. [Google Scholar] [CrossRef]
  39. Papagiannaki, K.; Diakoulaki, D. Decomposition analysis of CO2 emissions from passenger cars: The cases of Greece and Denmark. Energy Policy 2009, 37, 3259–3267. [Google Scholar] [CrossRef]
  40. Malla, S. CO2 Emissions from electricity generation in seven Asia-Pacific and North American Countries: A decomposition analysis. Energy Policy 2009, 37, 1–9. [Google Scholar] [CrossRef]
  41. Oh, I.; Wehrmeyer, W.; Mulugetta, Y. Decomposition analysis and mitigation strategies of CO2 emissions from energy consumption in South Korea. Energy Policy 2010, 38, 364–377. [Google Scholar] [CrossRef]
  42. Ang, B.W. Decomposition analysis for policymaking in energy: Which is the preferred method? Energy Policy 2004, 32, 1131–1139. [Google Scholar] [CrossRef]
  43. Kaya, Y. Impact of Carbon Dioxide Emission Control on GNP Growth: Interpretation of Proposed Scenarios. In Paper Presented at the IPCC Energy and Industry Subgroup, Response Strategies Working Group, Paris, France, 1990.

