Article

Assessing Climate Change Impacts on Global Hydropower

by
Byman Hamududu
* and
Aanund Killingtveit
Department of Hydraulic and Environment Engineering, Faculty of Engineering Science and Technology, Norwegian University of Science and Technology, Trondheim 7491, Norway
*
Author to whom correspondence should be addressed.
Energies 2012, 5(2), 305-322; https://doi.org/10.3390/en5020305
Submission received: 15 December 2011 / Revised: 13 January 2012 / Accepted: 6 February 2012 / Published: 14 February 2012
(This article belongs to the Special Issue Energy Policy on Climate Change)

Abstract

:
Currently, hydropower accounts for close to 16% of the world’s total power supply and is the world’s most dominant (86%) source of renewable electrical energy. The key resource for hydropower generation is runoff, which is dependent on precipitation. The future global climate is uncertain and thus poses some risk for the hydropower generation sector. The crucial question and challenge then is what will be the impact of climate change on global hydropower generation and what are the resulting regional variations in hydropower generation potential? This paper is a study that aims to evaluate the changes in global hydropower generation resulting from predicted changes in climate. The study uses an ensemble of simulations of regional patterns of changes in runoff, computed from global circulation models (GCM) simulations with 12 different models. Based on these runoff changes, hydropower generation is estimated by relating the runoff changes to hydropower generation potential through geographical information system (GIS), based on 2005 hydropower generation. Hydropower data obtained from EIA (energy generation), national sites, FAO (water resources) and UNEP were used in the analysis. The countries/states were used as computational units to reduce the complexities of the analysis. The results indicate that there are large variations of changes (increases/decreases) in hydropower generation across regions and even within regions. Globally, hydropower generation is predicted to change very little by the year 2050 for the hydropower system in operation today. This change amounts to an increase of less than 1% of the current (2005) generation level although it is necessary to carry out basin level detailed assessment for local impacts which may differ from the country based values. There are many regions where runoff and hydropower generation will increase due to increasing precipitation, but also many regions where there will be a decrease. Based on this evaluation, it has been concluded that even if individual countries and regions may experience significant impacts, climate change will not lead to significant changes in the global hydropower generation, at least for the existing hydropower system.

1. Introduction

Climate change is one of the great challenges of the 21st century [1]. The International Energy Agency (IEA) report of 2011 projected that renewables based electricity generation would triple between 2008 and 2035 under the increasing-use-of-renewables scenario. Hydropower generation makes a substantial contribution to meeting today’s increasing world electricity demands. The report adds that the share of renewables in global electricity generation increases from 19% to almost a third (nearly the same as coal). The primary increase is said to come from hydropower and wind but hydropower remains dominant over the projection period. It is projected that global hydropower generation might grow by nearly 75% from year 2008 to year 2050 under business-as-usual scenario but that it could grow by roughly 85% over the same period in a scenario with aggressive action to reduce greenhouse gas (GHG) emissions. However, even under this latter scenario, increased hydropower generation is projected to provide only about 2% of the total GHG emission reductions from the global electric power sector compared to business-as-usual by year 2050 (with all renewable technologies nonetheless providing nearly 33.5% of GHG abatement from the power sector). According to IEA, a realistic potential for global hydropower is 2 to 3 times higher than the current generation, with most remaining development potential existing in Africa, Asia, and Latin America. IEA also notes that, while run-of-river (smaller) hydropower plants could provide as much as 150 to 200 GW of new generating capacity worldwide, only 5% of the world’s small-scale (i.e., small, low, and hydro) hydropower potential has been exploited [2].
In year 2009, hydropower accounted for about 16% (approximately 3551 TWh/a) of total global electricity generation and has reached 26% of the total installed capacity for electricity generation [3]. Global generation of hydropower has been growing steadily by about 2.3% per year on average since 1980 while the EU reports increases of up to 3.1% per year for the European Union. Global average growth rates of hydropower generation in the future are estimated to continue in the range of 2.4–3.6% per year between 1990 and 2030 (EIA, 2009). The highest growth rates are expected in developing countries which have high unexploited hydropower potentials, but also in other countries, for example, parts of Eastern Europe. In Western Europe, an annual increase of only 1% is estimated [4]. In contrast to the above, there are also indications that the annual energy generation of some existing hydropower stations in some parts of the world has decreased since the 1970s, for example in some parts of Europe [5]. The reductions have generally been attributed to changes in average discharge, but it is not clear whether they reflect cyclic fluctuations, steadily rising water abstractions for other uses, or the consequences of long-term changing climate conditions. Recent climate studies have pointed out that the time has come to move beyond the wait-and-see approach in future climate scenarios. Projections of changes in runoff are supported by the recently demonstrated climate models. The global pattern of observed annual stream flow trends is unlikely to have arisen from unforced variability and is consistent with modeled response to climate forcing [6].
The IPCC in its AR4 concluded that climate change is occurring faster than earlier reported [7,8,9]. Many future climate scenarios point to the fact that the climate is changing rapidly although there are many arguments over the causes of these changes. Climate change will result in changes in various river flow conditions such as timing and quantity, sediment load, temperature, biological/ecosystem changes, and fish responses [10]. Climate change and the resulting changes in precipitation and temperature regimes will affect hydropower generation. It is reported that hydropower systems with less storage capacities are more vulnerable to climate change, as storage capacity provides more flexibility in operations. Although hydropower systems may benefit from more storage and generation capacity, expansion of such capacities may not be economically and environmentally justified. These changes would affect hydropower generation in all regions of the world. Given the significant role of hydropower, the assessment of possible impacts of climate changes on regional discharge regimes and hydropower generation is of interest and importance for management of water resources in power generation.
Figure 1. Global Total Electricity Generation Trends (TWh) in the last 20 years.
Energies 05 00305 g001
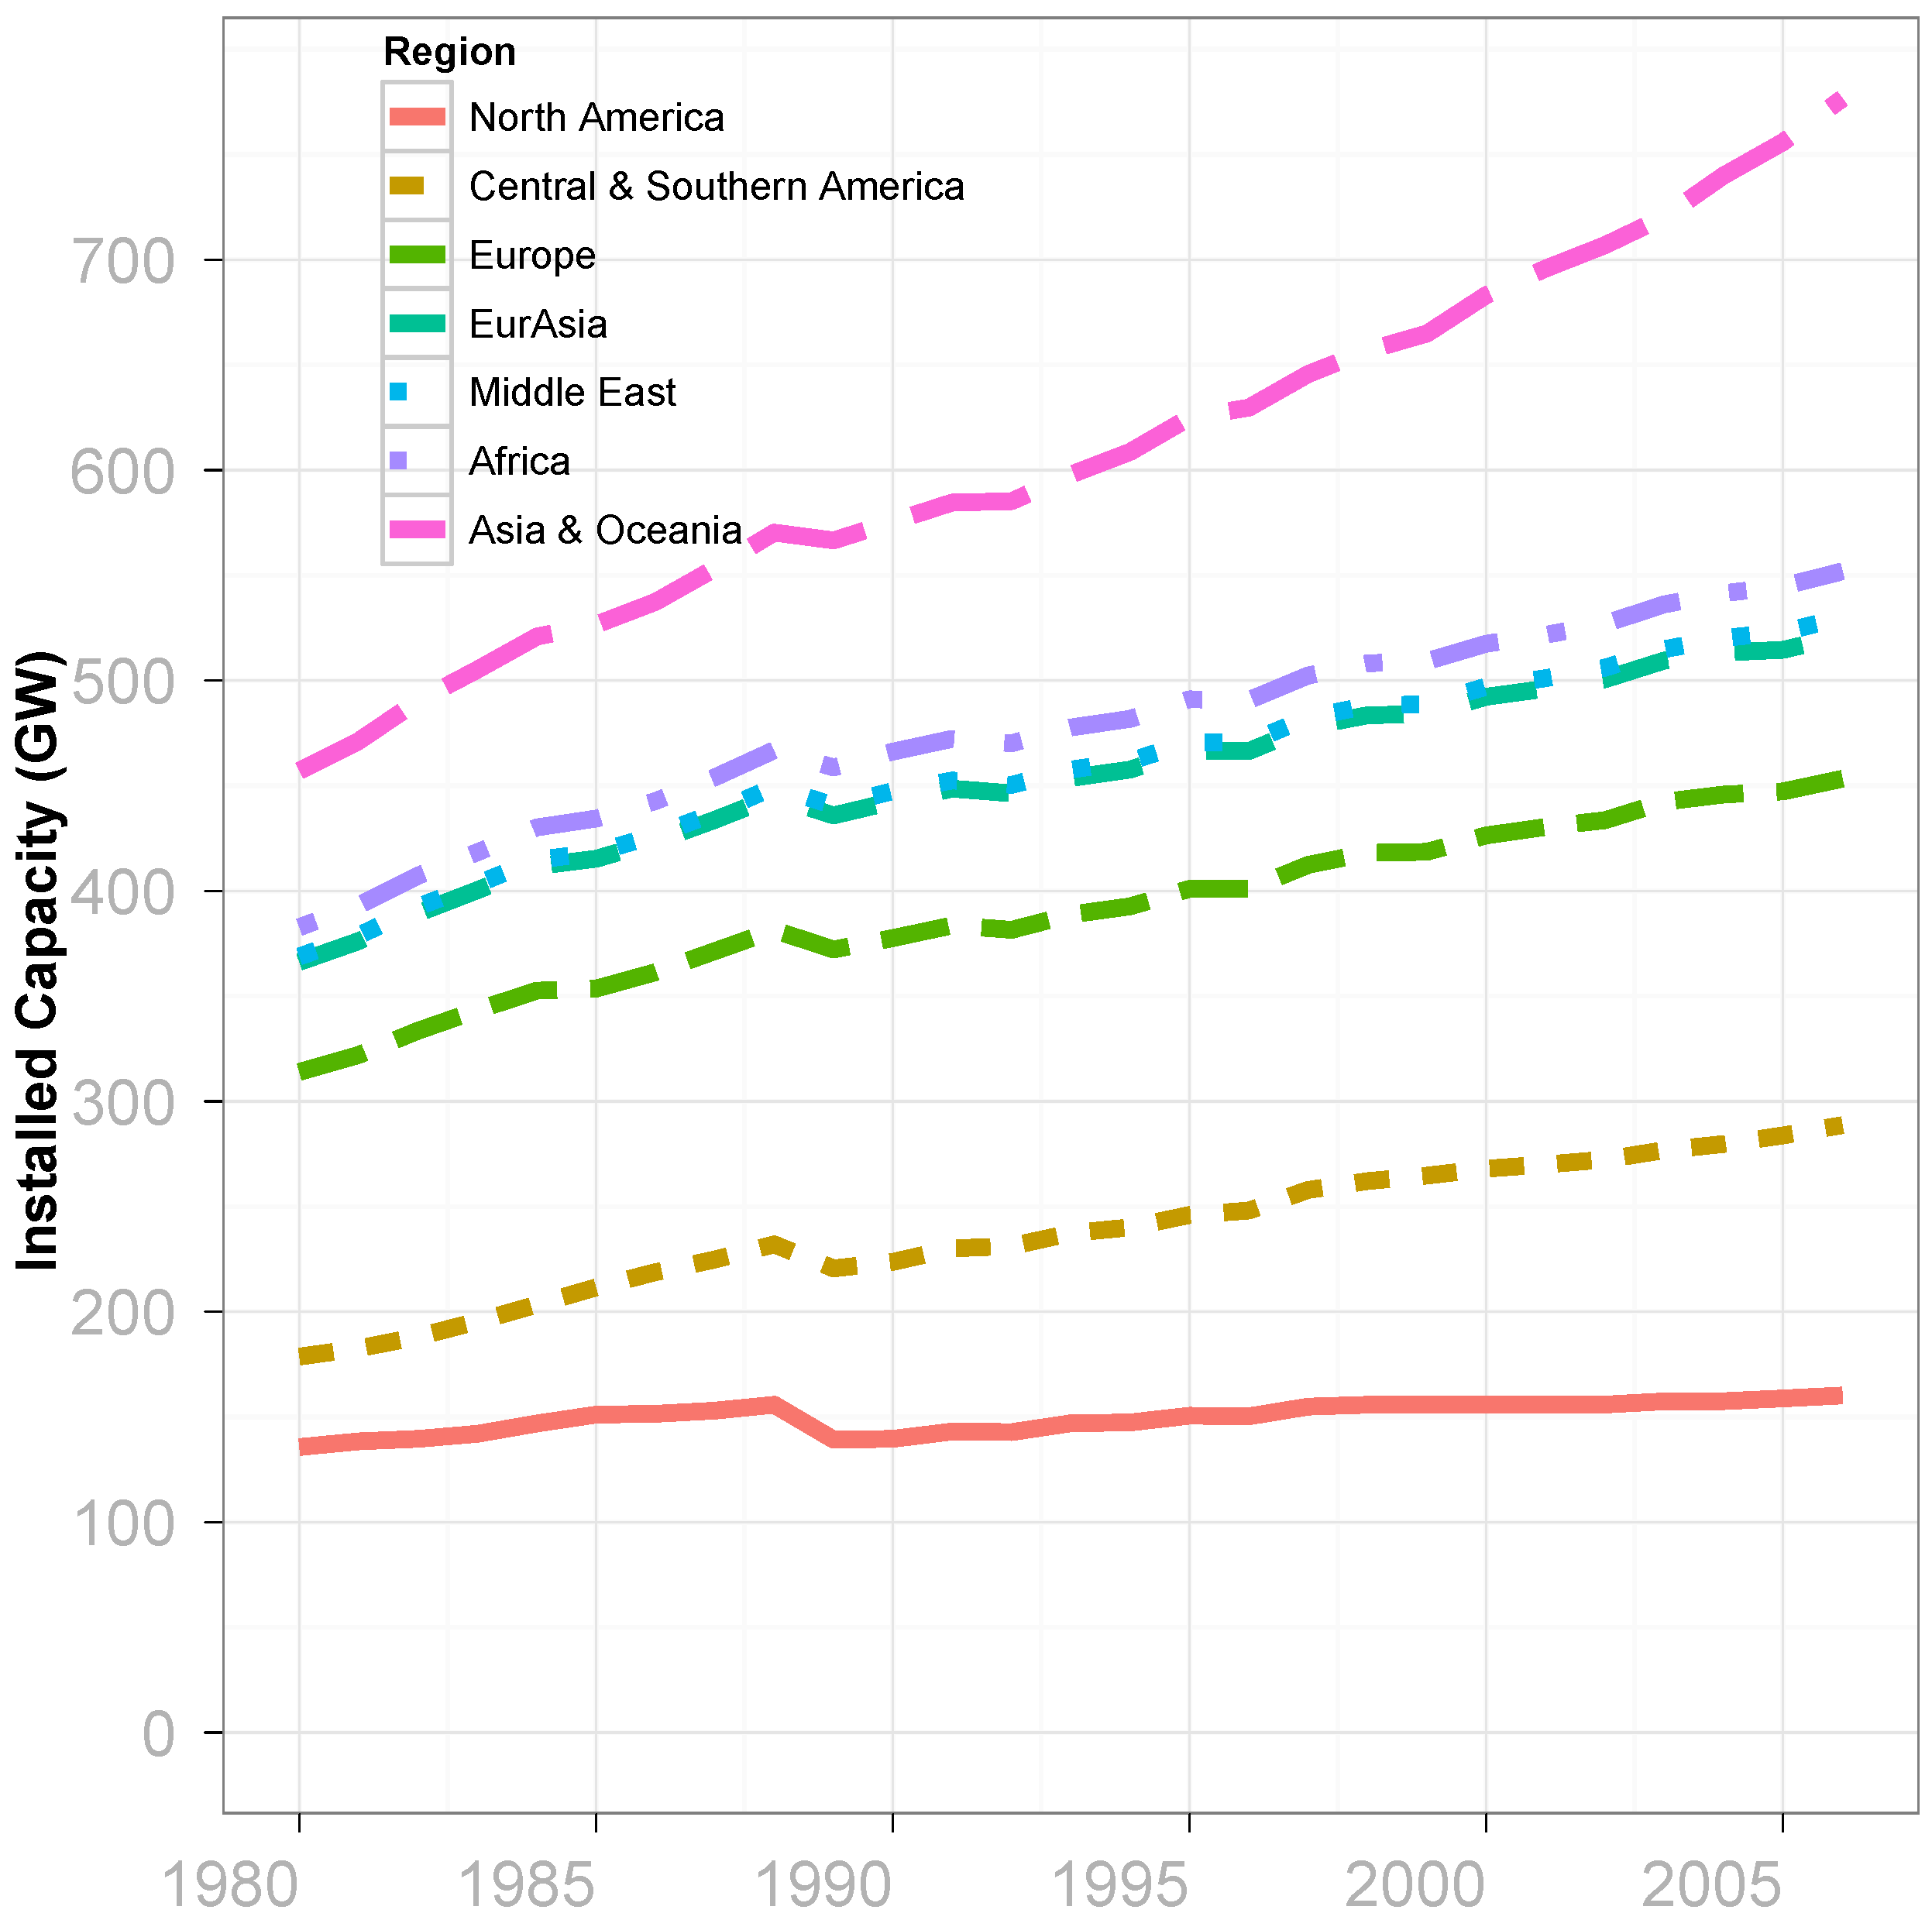
Global hydropower generation capacity has been increasing steadily over the last 30 years, and the past few years have shown an increased growth rate. Figure 1 shows the ratio of hydropower to the total electricity generation from year 1980 to year 2008. Although the ratio is reducing from 0.20 to 0.16, the Figure shows that hydropower generation is also increasing and is projected to continue increasing till year 2050. The global hydropower capacities and the contributions from various continents/regions of the world from 1980 to 2008 are presented in Figure 2. Europe, America, and Asia have sizable share of hydropower capacities. The installed capacity for Europe and Northern America, though large, has not been increasing much during this period while that in Southern/Central America and Asia/Oceania has greatly increased during this period as seen in Figure 2. However, the continental potentials are different, large in other regions like Africa. Table 1 shows regional hydropower characteristics in terms of hydropower in operation, total potential, under-construction, planned and countries with more than 50% of their total electricity demand supplied by hydropower.
Figure 2. Trends in Global Installed Hydropower Capacities (1980–2006).
Energies 05 00305 g002
Table 1. World Hydropower in operation, under construction and Planned [3].
RegionHydropower in
Operation
% of Total Potential
hydropower
Hydropower
under construction
Hydropower
Planned
Countries with 50%
of electricity supply
MW%MWMW#
Africa23,4829.35,22276,60023
Asia 1401,62617.8125,736141,3009
Europe 2179,15253.93,02811,4008
North & Central
America169,10534.3779817,4006
South America139,42426.319,55557,30011
Australiasia/Oceania13,37020.16715004
World-Total926,159161,406305,50061
1 Includes Russia and Turkey; 2 Excludes Russia and Turkey.
This study provides an overview of present (existing) global hydropower generation and its future prospects with respect to climate change. The focus of this work is global (all countries) i.e., low resolution (less detail), although for clarity’s sake, some large countries like Australia, Brazil, Canada, China, India and USA had to be subdivided into provinces or states. Assessment of climate change impacts on hydropower can be done at various levels of detail with different methods. On a global scale, low resolution analysis is acceptable as detailed modeling may be costly and tedious. While recognizing the fact that climate change impacts hydropower in different ways—volume of flow, timings of flow, etc., the analysis has been confined to changes in mean flows (volume of flow). In addition, there is no estimate of the future hydropower development as doing so would require more detailed data (national development plans or trends) for each state and country. The study aims to answer questions related to national, regional and global hydropower generation and the expected increases or decreases in the same due to future changes in climate and water availability, and the extent of such changes. In order to answer the above, GIS analysis has been utilized to understand and visualize regional scenarios of hydropower generation. The analysis makes no attempt to analyze the impact of climate change on electricity demand, as it focuses on the side of generation. The GIS has been used here as a tool to merge and analyze different databases in order to gain insights into the anticipated changes. The database included data on world countries hydropower capacities, generation, global water resources, global runoff, dams, hydropower plants, etc. Table 2 shows regional hydropower statistics and of special interest is the installed capacity and hydropower generation in 2009. The table highlights the technically feasible, annual average potential, and feasible increase. The capacity factor of a power plant is the ratio of the actual output of a power plant over a period of time and its output if it had operated at full nameplate capacity the entire time. The lowest capacity factor is in Europe and clearly shows that hydropower in Europe is used mainly for peaking purposes than in the other regions [3].
Table 2. Regional Hydropower Potential (2009). The table highlights the technically feasible, annual average potential, annual generation capacity, and feasible increase [3].
RegionTechnically
Feasible Potential
Capacity
Potential
Installed
Capacity
2009
Generation
Capacity
Factor
Feasible Capacity
Increase
TWh/yMWMWTWh/y%
Africa1750424,27723,482980.471925
Asia68001,928,286401,62615140.4670
Australasia/Oceania20055,35113,370370.41408
Europe1140352,804179,1525420.37214
North America1510360,397169,1056890.48225
Latin America2968596,185139,4246710.57464
Total/Average14,3683,722,930776,76035510.44
There are many methods of assessing climate change impacts on hydropower generation systems. The use of a method depends on many factors such as the level of detail required, the geographical coverage, hydropower system description, and observation data availability. For example, the level of detail required for a global assessment differ from that needed for basin level assessments. Many studies have carried out assessment of hydropower generation in different parts of the world in various ways. Usually basin level assessment involves downscaling from GCMs through detailed hydrologic modeling and hydropower simulations, while on a regional level assessment, details begin to reduce. The methods can be seen as stepped analyses, where as the modeling begins to be complex, the detail and data requirements also do, beginning at the global scale down to small basin scale. Medellin-Azuara et al. [11] used downscaled hydrologic data in customized modeling scheme to assess the adaptability and adaptations of entire California’s water supply system to dry climate warming. Madani and Lund [12] used an energy-based hydropower optimization model, avoiding the conventional modeling (simulation/optimization) methods, due to the large number of hydropower plants in California. The model used was developed for low-resolution, system-wide hydropower studies [12]. In a rather more detailed study of the Danube basin, development of hydropower was modeled using a special, coupled-physically-based hydrological model for three hydropower plants [13]. Another study on changes to whitewater recreation in California’s Sierra Nevada used only elevation and runs as the predictors in identification, mapping and geomorphic classification to anticipate changes in runoff volume and timing from climate warming [14].
In a non-conventional approach, a method of modeling high elevation hydropower systems was developed and applied in California [15]. The method is energy-based and optimization was carried out on energy generation data on a monthly time scale and seasonal energy storage capacities. However there are some limitations as pointed out [15]. The method is a simplified approach where detailed hydropower data is unavailable. It is a simple approach for developing a good representation of an extensive hydropower system with little time or resources for policy and adaptation studies. Based on the results of some applications, the method is said to be skillful and useful for studying large hydropower systems when there is less details required. The developed method can be used for studying the effects of climate change on a large hydropower system [15]. In the above method, a large hydropower system (national or regional, large basin) can be modeled. However at the global scale, a more simplified approach is necessary not only to reduce on the complexities but due to lack of data for such a thorough detailed approach.
The approach used in this analysis aggregates different types of hydropower systems from different climates to highlight the larger global picture. The approach is based on the fact that the current hydropower generation system may only be limited by water availability. The main assumption is that if water supply reduces, the hydropower systems will likewise reduce generation and vice versa, assuming that current systems can be upgraded. With this approach, changes in annual mean flows are the main predictors of hydropower generation in each unit.

2. Methodology

The runoff baseline data is taken from the IPCC AR4 (2007), which is based on data supplied by Milly et al. [6]. An ensemble of 12 climate models was used with qualitative and statistically significant skill to simulate observed regional patterns of twentieth-century multi-decadal changes in streamflow. The realism of hydroclimatic simulations varies across models, so an ensemble from a subset of the models with the selection based on performance was used. The GCMs were ranked with respect to root-mean-square (r.m.s.) error (over the 165 basins and all runs) of the logarithm of long-term mean discharge per unit area; the logarithmic transform is commonly used in hydrology because flows can range over several orders of magnitude. A total of 12 GCMs were retained (35 runs of 20C3M) with the lowest error for use in the ensemble analyses [6]. Changes are expressed in terms of percentage variation from current runoff figures. The runoff changes are assessed at a national scale. On average, runoff can be thought of as the difference between the precipitation and evaporation over long periods of time and this makes it the available water for use, be it for hydropower, irrigation, domestic consumption, etc. In order to assess the future water availability, 12 GCMs with 20th century GRDC data [6] and future (A1B scenario) were used to evaluate the global trends of runoff. A total of 165 global basins with more than 28 years of data (greater 10% missing data) were used in regression analyses to predict the future resource availability. The model ensemble was in agreement in most regions, but there were some instances where the model ensembles did not produce similar trends and these were excluded from the analysis [6]. The agreement criteria were based on 60% of the GCM agreeing on the trends of future runoff. In the countries where the GCM predictions did not agree, i.e., less than 66%, GCM having the same sign of increase or decrease were left out. The 12 GCMs results were tabulated and based on the above; a single value (median) was assigned to each country or state. The important measure of agreement was the trend, either positive or negative. The median was chosen as representing the mid-trend line of the GCMs for the particular unit, and so is not affected by the outliers. The mean was thus avoided, and the median was used in this analysis [6].
These estimated changes in runoff are the bases for country values (GCM estimates) and used as predictors in projecting hydropower generation for each country or state. The process data indicated that large changes in water resources can be expected in the coming decades due to climate changes across the globe. However, from this analysis, it is not possible to show the changes in seasons or in the timing of the water resources, which in some regions may be more pronounced. The changes are not weighted or did not have any spatial detail to represent the spatial variability in runoff areas within each country or state, and as such the results are generalized. The climate models do not simulate the high spatial resolution/detail in terms of projected climate change variables because of their large grid sizes. The runoff changes provided in this study are meant to provide a broad indication of the likely country based median changes.
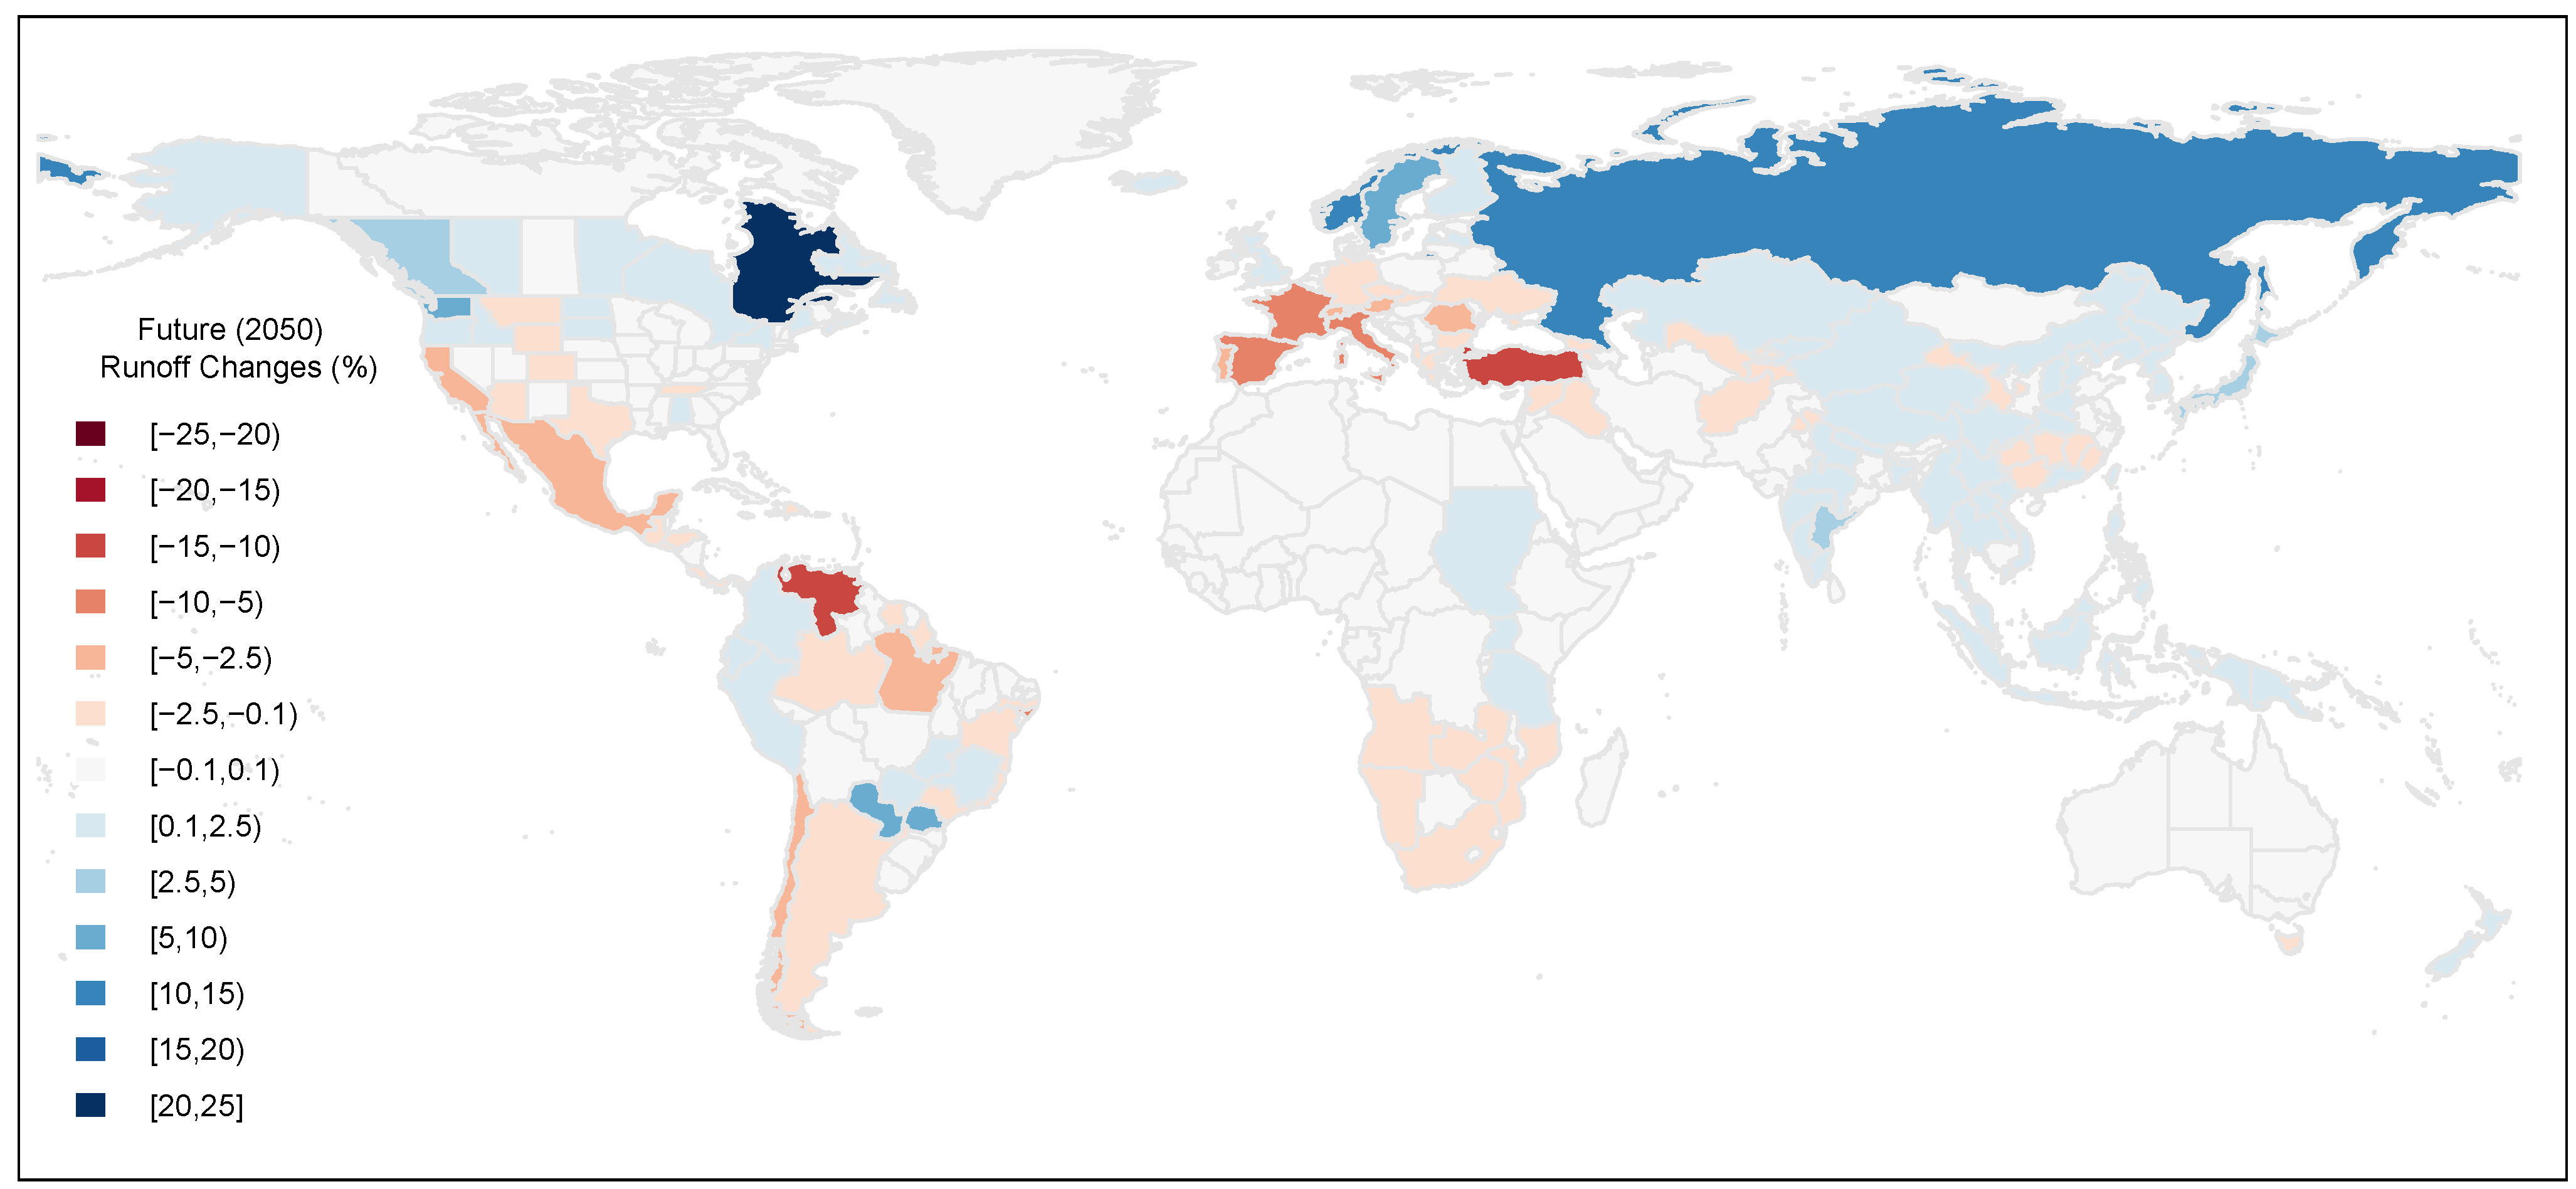
Using GIS, the hydropower generation by countries were mapped into a GIS database system where different tables were merged for analysis. A GIS database management expedites the analysis on various tables that make up the database. The analysis was carried out on a national basis although some countries were subdivided into states due to their size; i.e., United States, Canada, Brazil, China, India and Australia. The countries or sub-regions were taken as units on which further analysis was based. The computed runoff changes is also mapped on a different layer. Computed future (2050) changes in runoff are based on results from 12 GCMs [6]. The GCMs differ in their future projections but a single value was sought by analyzing whether the general changes were positive or negative from most models. In all countries or states where the GCM agreed, in terms of trends, a median of the forecast of the GCMs was computed and the median value was then applied to annual hydropower generation for each of these units. The changes are then mapped to produce the future (year 2050) generation based on the current generation levels.
Figure 3. Future (2050) Runoff changes (%) based on 12 GCMs under A1B scenario.
Energies 05 00305 g003
Based on the above data, the analysis was carried out to convert changes in water resource availability to changes in hydropower generation. The runoff was assumed to be the main determinant of or limitation to hydropower generation. Results are given in the next section. The computational details are illustrated by a more detailed table for Africa (Table A1 where the database and computations can be seen for individual countries. The same level of detail has been applied for all other countries and sub-regions. The methodology is based on the fact that hydropower generation (N) is a function of flow (Q, in m3s−1), head (H, in m) and efficiencies. The most varying factor is the flow (Q), referred to as water resources for every unit.
N = 9.81 Q H η
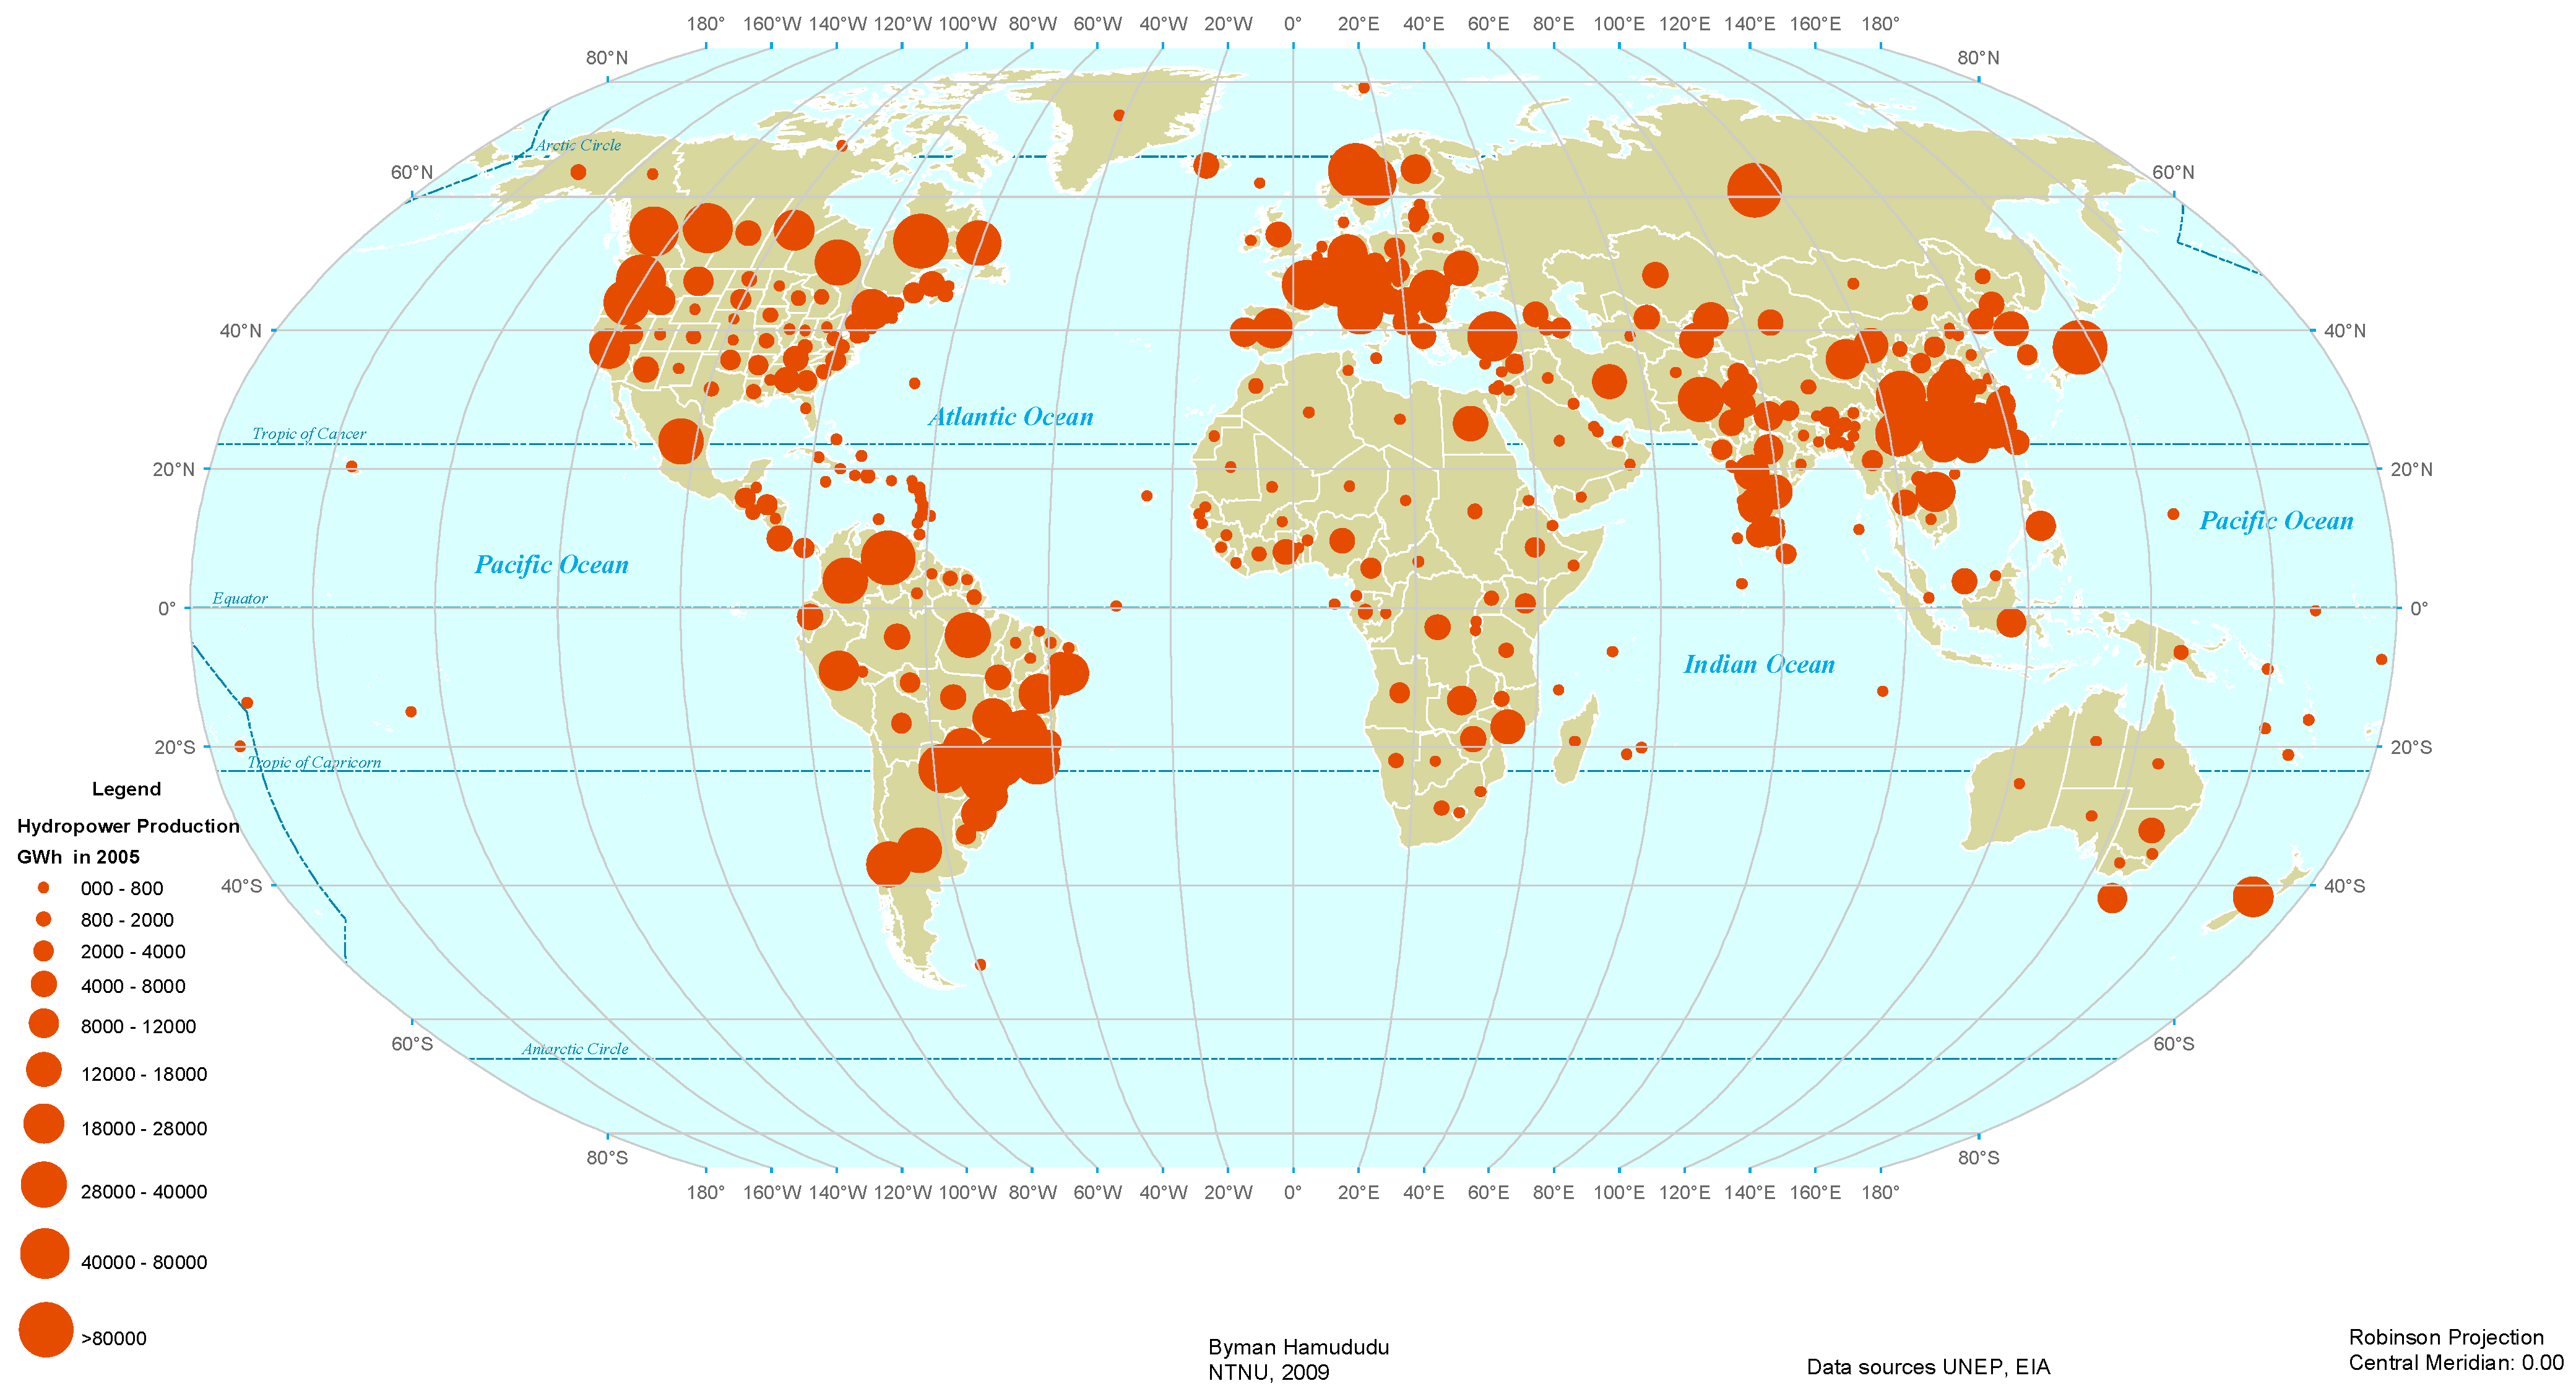
The procedure uses the flow (Q) for the water resources for each country and assumes that the changes in water resources for that unit will impact the hydropower produced in the future. It is further assumed that most of the new hydropower developments will take place in the same regions where the existing systems are located. The results are expressed in percentage change relative to the generation of the existing system. This same percentage change is likely to occur even when the generating capacity is increased. Figure 4 shows data on hydropower generation; the sizes are proportional to the hydropower production for that country or state in year 2005.
Figure 4. Hydropower generation (GWh) in 2005.
Energies 05 00305 g004

3. Data

Data were obtained from various sources and transformed where necessary into GIS layers. Most of the data of hydropower and energy were obtained from Energy Information Administration (EIA) of US, which is the official energy statistics of the US government freely available from their website [16] (Department of Energy 2009). Other national-level energy data were obtained directly from national websites and integrated into one database. GIS-related data like political boundaries and maps were obtained from UNEP geodata portal [17] (UNEP/DEWA/GRID-Europe, 2006), the data on dams from International Commission on large dams (ICOLD), national-level water resources data from Food and Agriculture Organization (Water Development and Management Unit, FAO) [18]. Data for trends and projections are based on a global runoff analysis by Milly (2005). Milly et al. showed global pattern of trends in stream flow and water availability in a changing climate. The study highlighted the variations in changes in runoff over the entire globe from region to region [5]. The following GCMs in Table 3 were used in the analysis. Runoff increases are predicted for the mainly northern regions of America, Canada, Europe and Russia as well as parts of India and Bangladesh, East Africa and a few countries in Southern America. The rest have reductions while for much of Central and West Africa, forecast cannot be made with certainty.
Table 3. GCMs used in the projections of future 2050 runoff changes after [5].
#ModelVersionModelling CentreCountry
1CGHRCGCM3.1 (T63),Canadian Centre for Climate Modeling & AnalysisCanada
2ECHOG Meteorological Institute of the University of Bonn, Meteorological Research Institute of KMA, and Model and Data group,Germany/ Korea
3FGOALSFGOALS-g1.0, LASG/Institute of Atmospheric Physics,China
4GFCM20GFDL-CM2.0US Dept. of Commerce/NOAAA/Geophysical Fluid Dynamics LaboratoryUSA
5GFCM21GFDL-CM2.1US Dept. of Commerce/NOAAA/Geophysical Fluid Dynamics LaboratoryUSA
6GIEHGISS-EH, NASAGoddard Institute for Space ShuttlesUSA
7HADCM3UKMO-HadCM3Hadley Centre for Climate Prediction and Research/Met OfficeUK
8HADGEMUKMO-HadGEM1Hadley Centre for Climate Prediction and Research/Met OfficeUK
9MIHRMIROC3.2 (hires),Center for Climate System Research (The University of Tokyo), National Institute for Environmental Studies, and Frontier Research Center for Global Change (JAMSTEC)Japan
10MPEH5MPEH5:ECHAM5/MPI-OM, Max Planck Institute for MeteorologyGermany
11MRCGCMMRI-CGCM2.3.2Meteorological Research InstituteJapan
12NCCCSMCCSM3National Center for Atmospheric ResearchUSA
Table 4 shows the regions of the world and the countries grouped according to UNEP (2009). Note that some countries are unconventionally placed in regions, for example Russia and Turkey are grouped along with other Asia countries and not Europe. This changes the regional statistics i.e., adding the generation from Russia and Turkey to the already high hydropower production in Asia.
Table 4. Global Regional Groupings of the Countries according to UNEP(2009), after [17].
ContinentRegionCountries within the Region
AfricaEasternBurundi, Comoros, Djibouti, Ethiopia, Kenya, Madagascar, Mauritius, Reunion, Rwanda, Seychelles, Somalia, Tanzania, Uganda,
CentralCentral African Rep, Cameroon, Chad, Congo, Eq. Guinea, Gabon, Sao tome
NorthernAlgeria, Egypt, Libya, Morocco, Sudan, Tunisia, W. Sahara
SouthernAngola, Botswana, Lesotho, Malawi, Mozambique, Namibia, South Africa, Swaziland, Zambia, Zimbabwe
WesternBenin, Burkina Faso, Cape Verde, Gambia, Ghana, Guinea, Guinea-Bissau, Ivory coast., Liberia, Mali, Mauritania, Niger, Nigeria, Senegal, Sierra Leone, Togo
AsiaCentralKazakhstan, Kirgizia, Tadzhikstan, Turkmenistan, Uzbekistan, Russia
EasternChina, Hong Kong, Japan, North Korea, South Korea, Mongolia, Taiwan
South EasternPapua New guinea, Brunei, Burma, Indonesia, Kampuchea, Laos, Malaysia, Philippines, Singapore, Thailand, Vietnam
Southern westAfghanistan, Bangladesh, Bhutan, India, Maldives, Nepal, Pakistan, Sri Lanka
WesternArmenia, Azerbaijan, Bahrain, Cyprus, Georgia, Iran, Iraq, Israel, Jordan, Kuwait, Lebanon, Oman, Qatar, Saudi Arab, Syria, Turkey, United Arab Emirates Yemen
AustralasiaAustralia, New Zealand
EuropeEasternBelarus, Bulgaria, Czech republic, Estonia, Hungary, Latvia, Lithuania, Moldavia, Poland, Romania, Slovakia, Ukraine
NorthernDenmark, Faroe island ., Finland, Iceland, Ireland, Norway, Sweden
SouthernAlbania, Bosnia and Herzegovina, Croatia, Greece, Italy, Macedonia, Malta, Portugal, San marino, Serbia, Slovenia, Spain
WesternUK., Austria, Belgium, France, Germany, Liechtenstein, Luxembourg, Netherlands, Switzerland
AmericaCaribbeanAnguilla, Antigua & b, Bahamas, Barbados, Cuba, Dominica, Domrep, Grenada, Guadalupe, Haiti, Jamaica, Martinique, Nantilles, Puerto Rico, St Chrs-nv, St Lucia, Stvinc & gr, Trinidad & Tobago, Turks & c.i,
CentralBelize, Costa Rica, El Salvador, Guatemala, Honduras, Mexico, Nicaragua, Panama, Bermuda,
NorthernCanada, USA
SouthernArgentina, Bolivia, Brazil, Chile, Colombia, Ecuador, Falkland, French Guiana, Guyana, Paraguay, Peru, Surinam, Uruguay, Venezuela
OceaniaNew .Caledonia, Solomon, Vanuatu, Cooking island, Guam, Kiribati, Nauru, Tuvalu, Fiji, French Polynes, Tonga, Hawaii, West Samoa

4. Results and Discussion

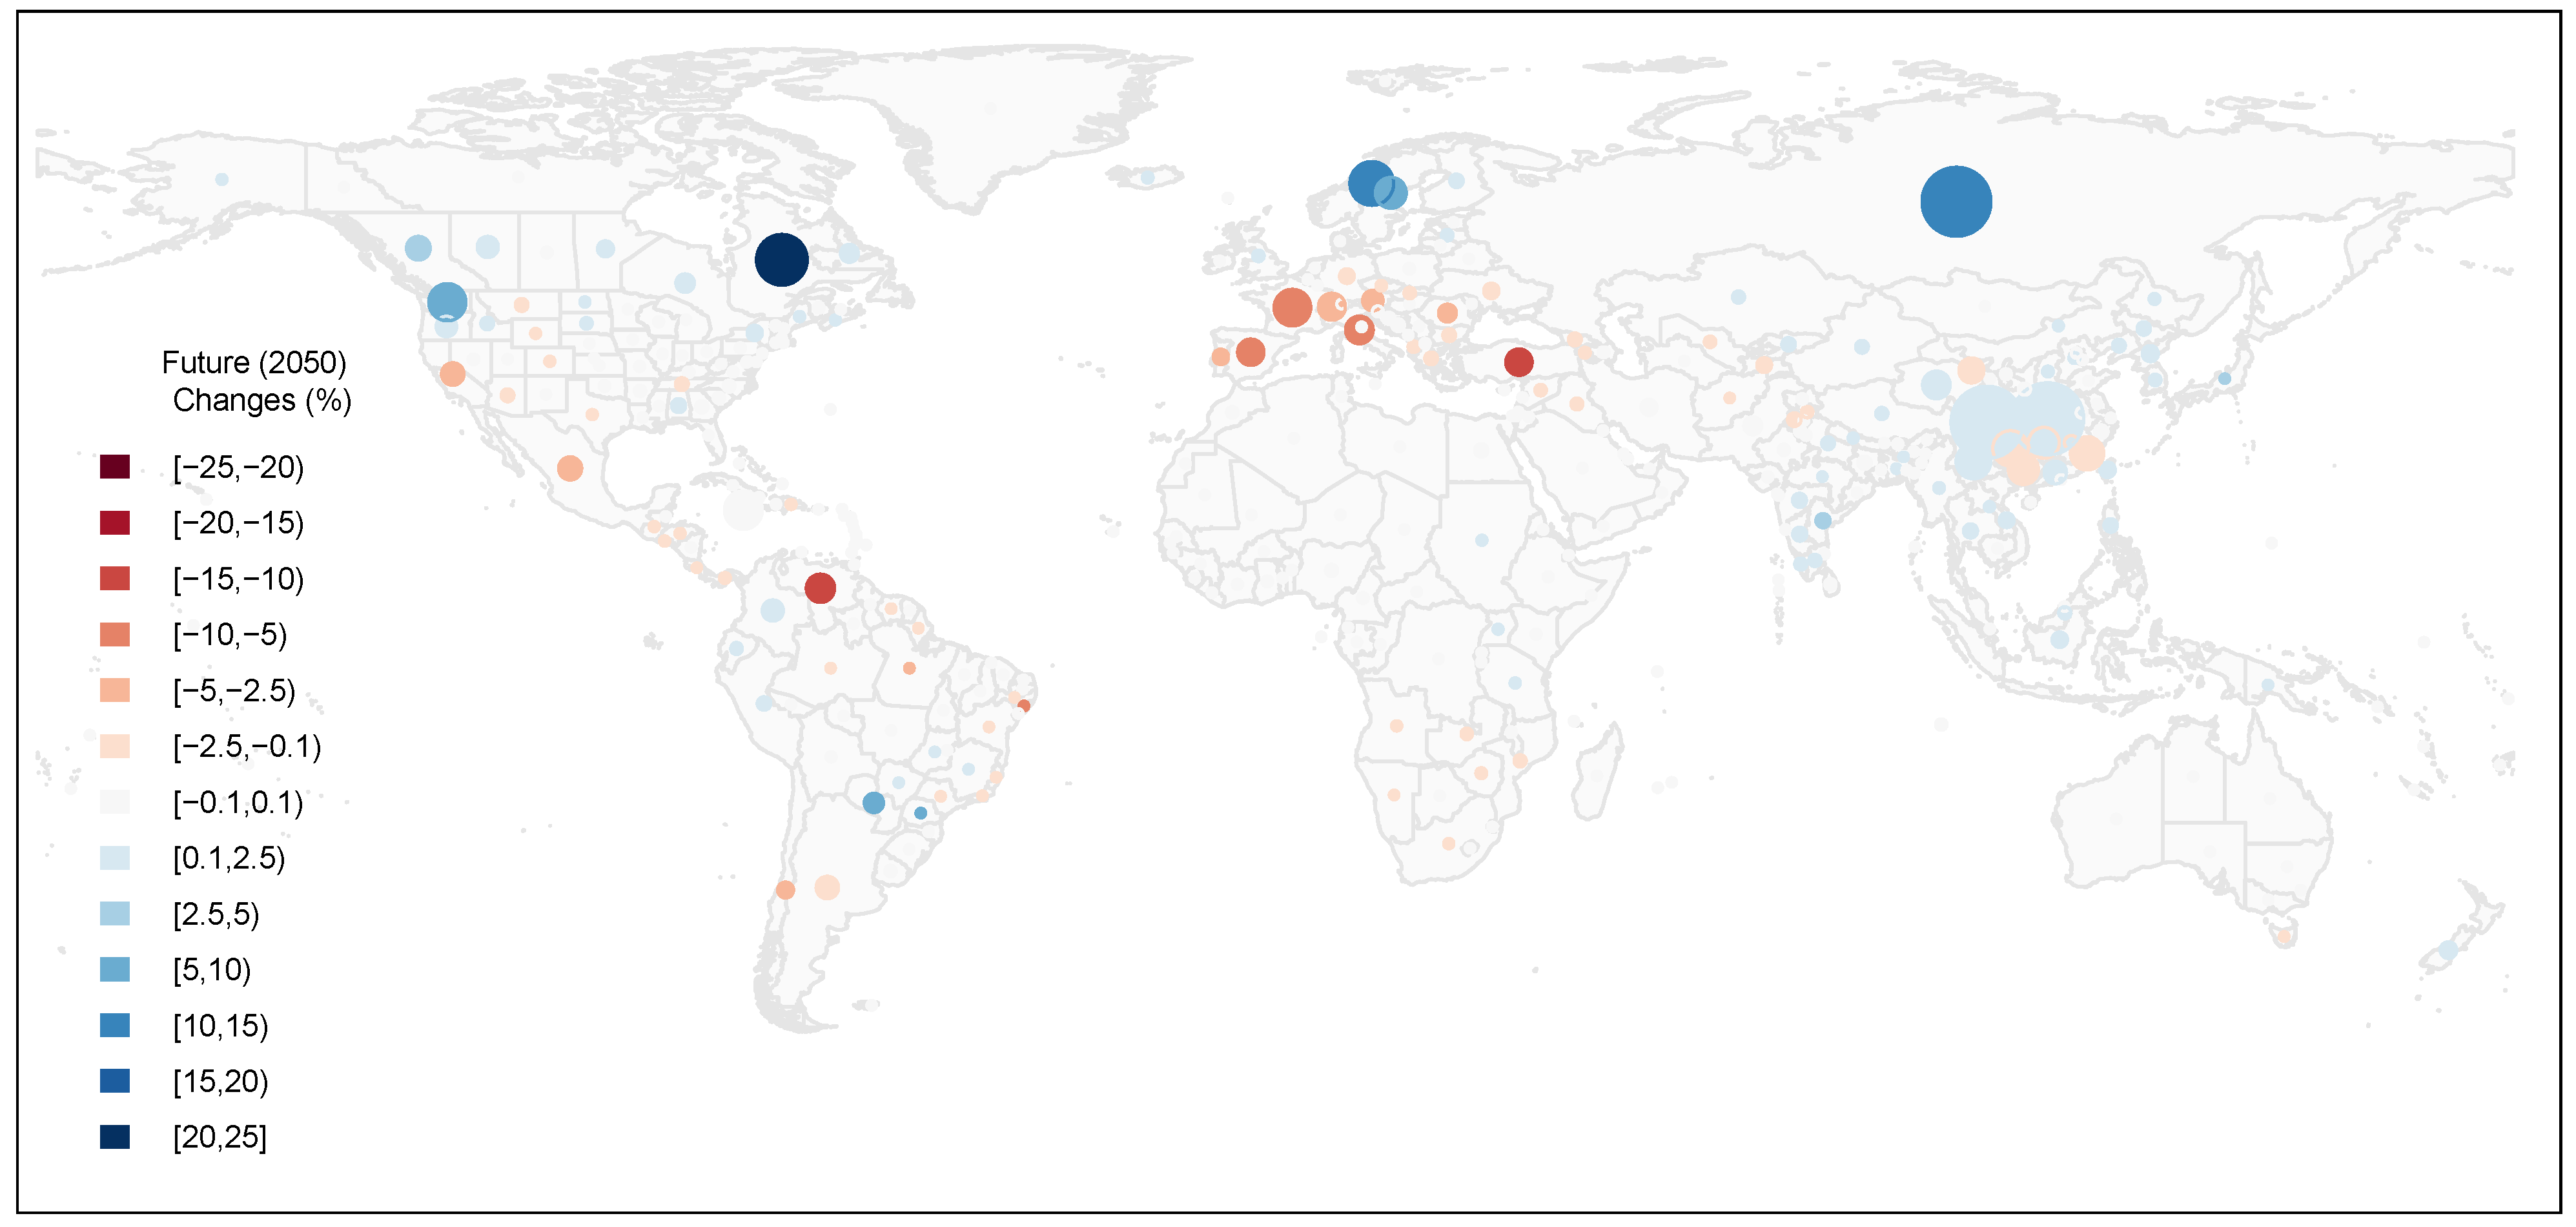
The results from the analysis are shown in Figure 5. The size of the dots indicates the installed capacity while the colour (red for reduction ad blue for increase) indicate the changes for each country/state where GCM prediction on runoff data were consistent and reliable (in agreement). Most of the highlights are in line with many site-specific studies on hydropower and climate in most of the regions of the world. The regions of Europe, US and Canada all have projections similar to results obtained in the studies [19,20,21,22,23,24,25,26].
Table 5 shows that 2931 TWh of hydro-electricity were produced in year 2005. From the analysis, based on 2005 global hydropower generation, it can be said that by year 2050, the hydropower generation would be affected differently in various regions of the world. There are regions where hydropower generation will increase and there are also regions where hydropower generation will decrease.
In Africa, there are some countries with increasing hydropower generation and others with decreasing hydropower generation, as illustrated in the appendix. The Eastern African region shows increases in almost all countries except Ethiopia where there were disagreements among the GCMs. The Southern and Northern regions show decreases in hydropower generation. The Western region remains nearly the same but there are some countries with increases while others have decreases, and again here in most countries there were disagreements among GCMs on future runoff.
Figure 5. Percentage Changes in Global Hydropower generation resulting from 12 GCMs (AR4 2007) under A1B scenario.
Energies 05 00305 g005
Table 5. Summary of Regional (2050) Changes in Hydropower generation.
ContinentRegionGeneration TWhChange TWh% Change of total
AfricaEastern10.970.110.59
Central12.450.040.22
Northern15.84-0.08-0.48
Southern34.32-0.07-0.83
Western16.030.000.03
89.600-0.05
Asia1Central217.342.292.58
Eastern482.320.710.08
South Eastern57.220.631.08
Southern141.540.700.41
Western70.99-1.66-1.43
996.122.660.27
Australasia/Oceania39.8-0.030
Europe2Eastern50.50-0.60-1.00
Northern227.723.321.46
Southern96.60-1.79-1.82
Western142.39-1.73-1.28
517.21-0.8-0.16
AmericaNorthern, Central/ Caribbean654.70.330.05
Southern660.810.300.03
1,315.50.630.05
Global2,9312.460.08
1 Includes Russia and Turkey; 2 Excludes Russia and Turkey.
For Asia, positive trends owing to climate change have been projected for most countries. An exception is the Middle East (here grouped under Asia) which has decreasing trends. This continent shows the largest increases vis-a-vis the others. In fact, all the parts of this continent show increases apart from western part, which does not produce a lot of hydropower.
The Americas have a continental net increase with major producers having increases (south and north) and only central America having a reduced generation in the future. The northern part of America shows (mostly) increases and this changes southward with the central region of America showing decreases. Changes in the America nearly cancel out as decreases in some parts are offset by increases in others.
Southern, Eastern and Western Europe have reductions while the Northern part shows increased generation, and with increased generation in high-producing regions, the regional net growth is positive. The large producers are in the Northern region, and as such, the continental changes show net increases in hydropower generation.
Most of Australasia has reduced generation while Oceania shows an increase. There are disagreements among the GCMs on future projections over Australia. There are only a few states where there are agreements. This makes it difficult to make a good picture of future hydropower generation of this region.
From the results, it can be seen that most of the high hydropower-producing countries in the north (Canada, US and parts of Europe and Russia) will have increased generation, while for most of the south, whether big or small, hydropower generation will decrease.
It should be stated here that the analysis was carried out on a national basis (states for the largest countries), while this papers summarizes the results at a regional level. There are many differences within each region. Even when the overall region may register an increase, it is likely that some countries within the region may experience reductions. Table 5 has been appended to show intra-regional variations for one continent, Africa. Africa has been chosen to highlight these internal differences in changes due to its high hydropower potentials (undeveloped) and its having the greatest variations and the highest necessity for development in the future due to increasing population.
The global change in future hydropower generation due to climate change shows a slight increase over the current global hydropower generation (0.46 TWh). This could be improved by bringing on-stream fresh capacity either already under construction or on the anvil.

5. Limitations

The overall objective of this study was to present a global picture of impacts of climate change on hydropower generation. In order to do this efficiently, a lot of simplifications were made. These included ignoring the impacts such as changes in timing of flow, changes in sediment transport, etc. These are important factors in hydropower operation, but were not included in this analysis. In addition there were no adaption and/or mitigation on operations included in the analysis, and as such, no storage analysis or non-storage analysis was performed.
The changes are computed on the current hydropower generation and no future hydropower development has been included, firstly due to the fact that these data are difficult to obtain for each country or state for the whole world, and secondly because the analysis would become more complex, requiring more resources.
Another simplification is that changes are computed at country level (except for very large countries). The study recognizes that climate change impacts can vary spatially and sometimes over short distances, but again, the simplification that for each country, an average change is assumed may seem acceptable. The objective was to show the bigger global picture and the direction of change on the global scale.
The amount of electricity produced by a hydropower system depends on: (1) the discharge/flow (amount of water passing through the turbine per unit time); (2) the site head (the height of the water source); and (3) the turbine generating capacity and efficiency. In order to evaluate the impacts of climate change on hydropower globally, only the mean discharge/flow has been used as a factor to hydropower generation, which is also a simplification.
The above simplification would lead to some differences when the results presented in this study are compared to a more local detailed analysis of climate change impact on one or two hydropower system, where more plant data, time series data and detailed down-scaling is carried out. However a few comparisons made so far showed that the results were not very different (within ranges).
There are many factors that could be used to mitigate impacts on climate change on hydropower especially in operations. These have not been dealt with in this current study. Such factors include the storage capacity, pumped storage system, operation rule curve changes, etc. These were considered to be outside the scope of this study.
The primary function of a hydropower system is to generate power. However in many countries, the hydropower systems play important roles as general purpose water handling facilities. The multipurpose use of water and demand is important as the impacts of climate threaten the agreements that exist between many users of water. In areas projected with decrease, as the water resources decrease, competition and re-examinations of agreements may result. This ultimately would result in changes in the hydropower generation.
This study has not examined the impact of increased frequency of droughts and floods, as forecast in many places with climate change. If droughts and floods become more frequent, this scenario would severely impacts hydropower production. These extreme events would reduce the reliability of hydropower system to produce power. In regions where mean annual flow does not change, it is still possible that hydropower production would be severely affected if the droughts become more frequent. The impacts of changes in extreme events should be examined carefully on a local scale.

6. Conclusions

Hydropower generation is mainly influenced by runoff although there are other limiting factors. Changes in runoff will therefore lead to changes in hydropower generation. In its most accurate form, hydropower-plant based analysis for individual stations gives a better picture of future generation. However, when one is considering the global level, scale becomes an important issue.
The overall impacts on the global technical potential is expected to be slightly positive. However, results also indicate the possibility of substantial variations across regions and even within countries. Globally, hydropower generation computations show a very slight increase around year 2050 of about 0.46 TWh per annum. However, different countries and regions of the world will have significant changes; some with positive and others with negative changes. This study therefore provides general estimates of regional and global perspectives of the probable future hydropower generation scenarios.
Climate change is a challenge for the entire hydropower sector; the challenge is to come up with mitigation measures for hydropower operations and designs against these effects. Some regions have minimal infrastructure to act as a buffer the impacts of change.
The hydropower sector is one of the sectors least adversely affected on a global scale. Although the various regions will have varying changes, at the global level, there could be a slight gain in total global hydropower generation. It is worth mentioning here that after factoring in the uncertainty through the whole analysis process, it can be said that hydropower generation will remain nearly the same for some time into the future—till year 2050.
Investment (construction of new plants) in the hydropower sector could help reduce the gap (deficit) that may be created by effects of climate change on power generation in areas where there is still untapped potential. In other areas where the potential is nearly exhausted, better technology (e.g., high efficiencies) on existing systems would help mitigate the impacts or boost the contribution of hydropower to global electricity generation.

Acknowledgments

The authors would like to thank the Norwegian Research Council through Norwegian University of Science and Technology for the financial support. The authors would like to also thank P.C.D. Milly for data on the future global runoff projections. The rest of the data sources mentioned under data section are also acknowledged for the data access and use.

References

  1. IPCC. Special Report on Renewable Energy Sources and Climate Change Mitigation; Technical Report; Intergovernmental Panel on Climate Change: Geneva, Belgium, 2011. [Google Scholar]
  2. EIA. International Energy Outlook 2011; U.S. Department of Energy, Energy Information Administration: Washington, DC, USA, 2011.
  3. Bartle, A. Hydropower and Dams, World Atlas; Aqua Media International Ltd.: Sutton, UK, 2010. [Google Scholar]
  4. Lehner, B.; Czisch, G.; Vassolo, S. The impact of global change on the hydropower potential of Europe: A model-based analysis. Energy Policy 2005, 33, 839–855. [Google Scholar] [CrossRef]
  5. Milly, P.C.D.; Betancourt, J.; Falkenmark, M.; Hirsch, R.M.; Kundzewicz, Z.W.; Lettenmaier, D.P.; Stouffer, R.J. Climate change: Stationarity is dead: Whither water management? Science 2008, 319, 573–574. [Google Scholar] [CrossRef] [PubMed]
  6. Milly, P.C.D.; Dunne, K.A.; Vecchia, A.V. Global pattern of trends in streamflow and water availability in a changing climate. Nature 2005, 438, 347–350. [Google Scholar] [CrossRef] [PubMed]
  7. Bates, B.; Kundzewicz, Z.; Wu, S.; Palutikof, J. Climate Change and Water; Intergovernmental Panel on Climate Change: Geneva, Belgium, 2008. [Google Scholar]
  8. Arnell, N.W.; Hudson, D.A.; Jones, R.G. Climate change scenarios from a regional climate model: Estimating change in runoff in southern Africa. J. Geophys. Res. 2003, 108. [Google Scholar] [CrossRef]
  9. IPCC. Climate Change 2007: The Physical Science Basis. Contribution of Working Group I to the Fourth Assessment Report of the Intergovernmental Panel on Climate Change; IPCC: Geneva, Belgium, 2007. [Google Scholar]
  10. Madani, K. Hydropower licensing and climate change: Insights from cooperative game theory. Adv. Water Resour. 2011, 34, 174–183. [Google Scholar] [CrossRef]
  11. Medellin-Azuara, J.; Harou, J.J.; Olivares, M.A.; Madani, K.; Lund, J.R.; Howitt, R.E.; Tanaka, S.K.; Jenkins, M.W.; Zhu, T. Adaptability and adaptations of California’s water supply system to dry climate warming. Clim. Chang. 2008, 87, 75–90. [Google Scholar] [CrossRef]
  12. Madani, K.; Lund, J.R. Estimated impacts of climate warming on California’s high-elevation hydropower. Climat. Chang. 2010, 102, 521–538. [Google Scholar] [CrossRef]
  13. Koch, F.; Prasch, M.; Bach, H.; Mauser, W.; Appel, F.; Weber, M. How will hydroelectric power generation develop under climate change scenarios? A case study in the upper danube basin. Energies 2011, 4, 1508–1541. [Google Scholar] [CrossRef] [Green Version]
  14. Ligare, S.T.; Viers, J.H.; Null, S.E.; Rheinheimer, D.E.; Mount, J.F. Non-uniform changes to whitewater recreation in California’s Sierra Nevada from regional climate warming. River Res. Appl. 2011. [Google Scholar] [CrossRef]
  15. Madani, K.; Lund, J. Modeling California’s high-elevation hydropower systems in energy units. Water Resour. Res. 2009, 45. [Google Scholar] [CrossRef]
  16. U.S. Energy Information Administration (EIA). International Energy Outlook, 2011. Available online: http://www.eia.gov/forecasts/ieo/ (accessed on 14 February 2012).
  17. United Nations Environment Programme (UNEP). Environment Data Explorer, GEO Data Portal, 2010. Available online: http://geodata.grid.unep.ch/ (accessed on 14 February 2012).
  18. Food and Agriculture Organization (FAO). Water: Natural Resources Management and Environment Department, 2010. Available online: http://www.fao.org/nr/water/ (accessed on 14 February 2012).
  19. Markoff, M.S.; Cullen, A.C. Impact of climate change on Pacific Northwest hydropower. Clim. Chang. 2008, 87, 451–469. [Google Scholar] [CrossRef]
  20. Christensen, N.S.; Wood, A.W.; Voisin, N.; Lettenmaier, D.P.; Palmer, R.N. The effects of climate change on the hydrology and water resources of the Colorado River Basin. Clim. Chang. 2004, 62, 337–363. [Google Scholar] [CrossRef]
  21. Shongwe, M.E.; van Oldenborgh, G.J.; van den Hurk, B.J.J.M.; de Boer, B.; Coelho, C.A.S.; van Aalst, M.K. Projected changes in mean and extreme precipitation in Africa under global warming. Part I: Southern Africa. J. Clim. 2009, 22, 3819–3837. [Google Scholar] [CrossRef]
  22. Filion, Y. Climate change: Implications for Canadian water resources and hydropower generation. Can. Water Rescour. J. 2000, 25, 255–269. [Google Scholar] [CrossRef]
  23. Dibike, Y.B.; Coulibaly, P. Hydrologic impact of climate change in the Saguenay watershed: Comparison of downscaling methods and hydrologic models. J. Hydrol. 2005, 307, 145–163. [Google Scholar] [CrossRef]
  24. Cherkauer, K.A.; Sinha, T. Hydrologic impacts of projected future climate change in the Lake Michigan region. J. Great Lakes Res. 2010, 36, 33–50. [Google Scholar] [CrossRef]
  25. Bergstrom, S.; Carlsson, B.; Gardelin, M.; Lindstrom, G.; Pettersson, A.; Rummukainen, M. Climate change impacts on runoff in Sweden; assessments by global climate models, dynamical downscaling and hydrological modelling. Clim. Res. 2001, 16, 101–112. [Google Scholar] [CrossRef]
  26. Meili, Z.; Qian, Y.; Zhihui, L. Climate impacts on hydro-power development in China. Proc. SPIE 2005, 5884. [Google Scholar] [CrossRef]

Appendix

Table A1. African Regions and Countries in detail.
RegionCountryRunoff
(mm/yr)
Installed Capacity
(MW)
Hydropower generation
2005 (GWh)
Changes in
hydropower %
East AfricaBurundi132329813.1
Comoros72312
Djibouti140
Ethiopia976692,8051.6
Kenya526772,996
Madagascar567105653-4.5
Mauritius1,08159113
Reunion1,941125575
Rwanda2063512915.1
Somalia21
Tanzania965571,76012.9
Uganda2723061,83914.9
Central AfricaCentr. Afr. Rep2321983
Cameroon6128053,8740.0
Chad37
Congo2,40992351-4.2
Guinean96033
Gabon627170806-6.6
Sao tome2,100611
Zaire DRC5492,4107,322-0.1
North AfricaAlgeria6280549
Egypt592,74512,518
Libya0
Morocco721,4981,398
Sudan263081,2277.1
Tunisia3066144-30.8
Western Saharan3
Southern AfricaAngola147497.52,197-7.4
Botswana25
Lesotho9976350-8.8
Malawi1452831,369-0.4
Mozambique2742,13613,131-9.5
Namibia222491,641-21.2
South Africa41661903-11.6
Swaziland26241158-12.7
Zambia1391,6988,794-4.5
Zimbabwe518505,776-10.4
West AfricaBenin21311
Burkina Faso463299.47
Ghana2221,1985,573-1.6
Guinea918129436-2.9
Guinea-Bissau922
Ivory coast.2516041,423-6.2
Liberia2,409
Mali80155240
Mauritania119749
Nigeria3141,9387,8710.4
Senegal2000264
Sierra Leone2,206406.1
Togo2576773