Measuring the Failure of Planning and Its Impact on Sustainable Travel in Dublin, Ireland


Abstract
:1. Introduction
2. Policy Context and Literature Review
3. Methodology
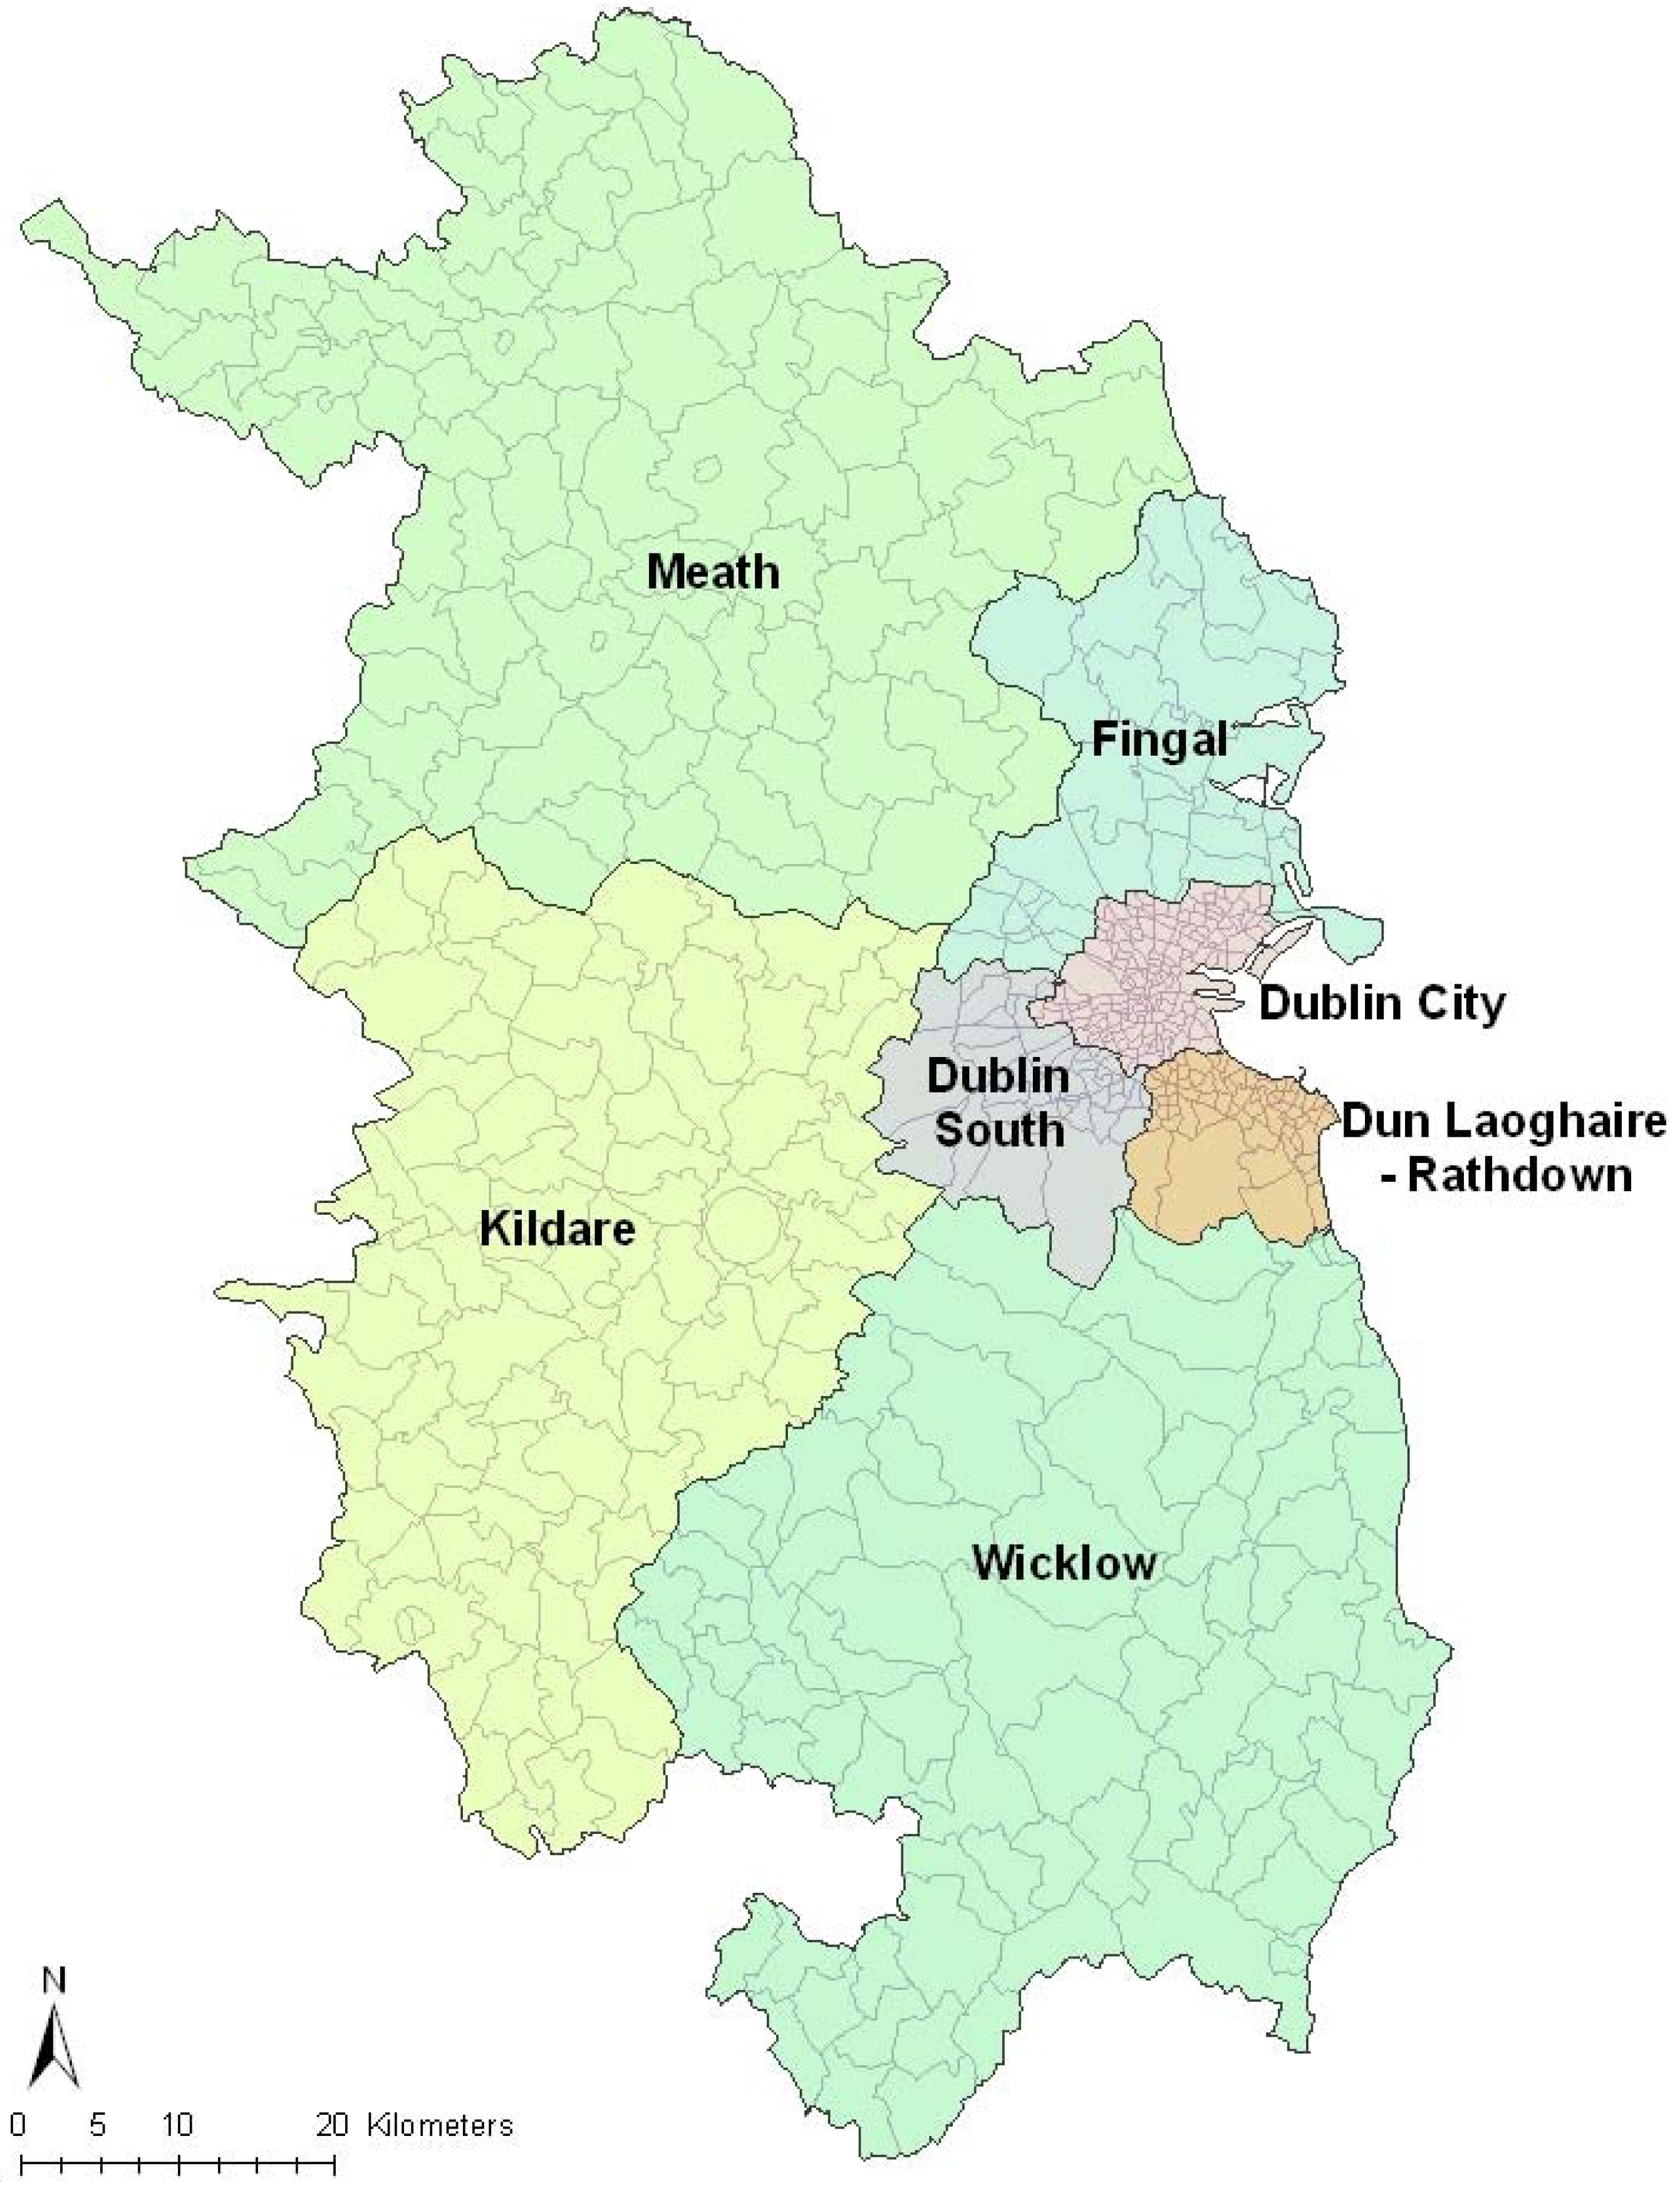
3.1. Data
3.2. Descriptive Analysis
4. Results and Analysis
4.1. Characteristics of the Sample

| Year Built | ||||
| N | % | Number of Houses Built per Annum | ||
| 1919–1970 | 182,786 | 36 | 3584 | |
| 1971–1995 | 196,603 | 39 | 8192 | |
| 1996–2000 | 49,102 | 10 | 12,276 | |
| 2001–2006 | 76,828 | 15 | 15,366 | |
| Total | 505,319 | 100 | ||
| Mode of Transport | ||||
| N | % | Average Distance (KM) | Average Travel Time (minutes) | |
| Walk | 70,080 | 13 | 2.17 | 19 |
| Cycle | 20,602 | 4 | 5.48 | 22 |
| Bus | 76,816 | 14 | 9.51 | 43 |
| Rail | 39,534 | 7 | 13.47 | 45 |
| Motorcycle | 6607 | 1 | 10.84 | 25 |
| Car-Driver | 260,754 | 49 | 11.24 | 31 |
| Car-Passenger | 19,997 | 4 | 9.75 | 28 |
| Lorry/Van | 19,239 | 4 | 13.91 | 35 |
| Other means | 1028 | 0 | - | - |
| Work from home | 8218 | 2 | - | - |
| NA | 9354 | 2 | - | - |
| Total | 532,219 | 100 | - | - |
4.2. Characteristics of the Housing Location
4.3. Characteristics of the Households
5. Conclusions
| Year Built | Before 1919 | 1919–1940 | 1941–1960 | 1961–1970 | 1971–1980 | 1981–1990 | 1991–1995 | 1996–2000 | 2001–2006 | |||||||||
|---|---|---|---|---|---|---|---|---|---|---|---|---|---|---|---|---|---|---|
| No. of Bus Stops | N | % | N | % | N | % | N | % | N | % | N | % | N | % | N | % | N | % |
| None | 9655 | 24 | 9463 | 28 | 18,372 | 31 | 12,754 | 26 | 21,020 | 22 | 12,224 | 19 | 6587 | 17 | 8459 | 17 | 17,267 | 22 |
| 1–5 stops | 16,189 | 41 | 15,347 | 45 | 25,840 | 44 | 18,471 | 37 | 34,559 | 37 | 20,927 | 33 | 11,047 | 28 | 13,263 | 27 | 19,104 | 25 |
| 6–10 stops | 8286 | 21 | 6555 | 19 | 11,413 | 19 | 12,919 | 26 | 24,043 | 25 | 16,168 | 26 | 9921 | 25 | 9232 | 19 | 20,005 | 26 |
| 11–20 stops | 4314 | 11 | 1898 | 6 | 3250 | 5 | 4764 | 10 | 7830 | 8 | 6864 | 11 | 5480 | 14 | 4719 | 10 | 7965 | 10 |
| 20+ stops | 1353 | 3 | 514 | 2 | 457 | 1 | 972 | 2 | 6960 | 7 | 6702 | 11 | 6271 | 16 | 13,429 | 27 | 12,487 | 16 |
| Total | 39,797 | 100 | 33,777 | 100 | 59,332 | 100 | 49,880 | 100 | 94,412 | 100 | 62,885 | 100 | 39,306 | 100 | 49,102 | 100 | 76,828 | 100 |
| Average | 5.35 | 4.17 | 4.0 | 5.16 | 6.01 | 7.19 | 8.56 | 9.6 | 8.11 | |||||||||
| Rail Available | ||||||||||||||||||
| No | 27,762 | 70 | 25,521 | 76 | 49,454 | 83 | 42,101 | 84 | 77,555 | 82 | 50,194 | 80 | 29,802 | 76 | 38,929 | 79 | 61,634 | 80 |
| Yes | 12,035 | 30 | 8,256 | 24 | 9,878 | 17 | 7,779 | 16 | 16,857 | 18 | 12,691 | 20 | 9,504 | 24 | 10,173 | 21 | 15,194 | 20 |
| Total | 39,797 | 100 | 33,777 | 100 | 59,332 | 100 | 49,880 | 100 | 94,412 | 100 | 62,885 | 100 | 39,306 | 100 | 49,102 | 100 | 76,828 | 100 |
| Density of Housing Units | ||||||||||||||||||
| Less than 1000 per km2 | 2140 | 5 | 1361 | 4 | 1674 | 3 | 3475 | 7 | 9145 | 10 | 7018 | 11 | 4680 | 12 | 7001 | 14 | 23,094 | 30 |
| 1001–3000 per km2 | 5064 | 13 | 5830 | 17 | 11,812 | 20 | 12,139 | 24 | 29,761 | 32 | 25,233 | 40 | 11,783 | 30 | 10,701 | 22 | 17,265 | 22 |
| 3001–6000 per km2 | 11,908 | 30 | 13,263 | 39 | 32,459 | 55 | 27,284 | 55 | 48,216 | 51 | 24,518 | 39 | 16,295 | 41 | 24,797 | 51 | 26,932 | 35 |
| 6001–9000 per km2 | 11,552 | 29 | 10,191 | 30 | 10,850 | 18 | 5928 | 12 | 6397 | 7 | 4630 | 7 | 3947 | 10 | 3963 | 8 | 6151 | 8 |
| 9001–12,000 per km2 | 7524 | 19 | 2397 | 7 | 2059 | 3 | 855 | 2 | 632 | 1 | 1079 | 2 | 1605 | 4 | 1267 | 3 | 2342 | 3 |
| 12,001+ per km2 | 1609 | 4 | 735 | 2 | 478 | 1 | 199 | 0 | 261 | 0 | 407 | 1 | 996 | 3 | 1373 | 3 | 1044 | 1 |
| Total | 39,797 | 100 | 33,777 | 100 | 59,332 | 100 | 49,880 | 100 | 94,412 | 100 | 62,885 | 100 | 39,306 | 100 | 49,102 | 100 | 76,828 | 100 |
| Average | 6356 | 5444 | 4722 | 4109 | 3593 | 3435 | 4060 | 4047 | 3288 | |||||||||
| Number of Cars per Household | ||||||||||||||||||
| One | 14,462 | 37 | 12,879 | 39 | 22,526 | 38 | 16,463 | 33 | 30,128 | 32 | 22,480 | 36 | 13,241 | 34 | 16,495 | 34 | 31,380 | 41 |
| Two | 11,397 | 29 | 11,211 | 34 | 20,897 | 36 | 19,966 | 40 | 37,627 | 40 | 24,399 | 39 | 16,335 | 42 | 20,754 | 43 | 28,519 | 38 |
| Three or more | 3741 | 10 | 3424 | 10 | 6587 | 11 | 7621 | 15 | 18,021 | 19 | 8587 | 14 | 3870 | 10 | 4162 | 9 | 4334 | 6 |
| None | 9575 | 24 | 5856 | 18 | 8758 | 15 | 5409 | 11 | 7846 | 8 | 6889 | 11 | 5511 | 14 | 7249 | 15 | 11,617 | 15 |
| Total | 39,175 | 100 | 33,370 | 100 | 58,768 | 100 | 49,459 | 100 | 93,622 | 100 | 62,355 | 100 | 38,957 | 100 | 48,660 | 100 | 75,850 | 100 |
| Average | 1.33 | 1.47 | 1.54 | 1.76 | 1.90 | 1.69 | 1.58 | 1.54 | 1.40 | |||||||||
| Year built | Before 1919 | 1919–1940 | 1941–1960 | 1961–1970 | 1971–1980 | 1981–1990 | 1991–1995 | 1996–2000 | 2001–2006 | |||||||||
|---|---|---|---|---|---|---|---|---|---|---|---|---|---|---|---|---|---|---|
| Gender | N | % | N | % | N | % | N | % | N | % | N | % | N | % | N | % | N | % |
| Male | 21,665 | 54 | 18,183 | 54 | 32,254 | 54 | 27,439 | 55 | 51,977 | 55 | 33,686 | 54 | 21,450 | 55 | 26,965 | 55 | 40,348 | 53 |
| Female | 18,132 | 46 | 15,594 | 46 | 27,078 | 46 | 22,441 | 45 | 42,435 | 45 | 29,199 | 46 | 17,856 | 45 | 22,137 | 45 | 36,480 | 47 |
| Total | 39,797 | 100 | 33,777 | 100 | 59,332 | 100 | 49,880 | 100 | 94,412 | 100 | 62,885 | 100 | 39,306 | 100 | 49,102 | 100 | 76,828 | 100 |
| Age | ||||||||||||||||||
| 15–24 | 4040 | 10 | 3795 | 11 | 7389 | 12 | 6373 | 13 | 15,384 | 16 | 10,021 | 16 | 4516 | 11 | 5641 | 11 | 9191 | 12 |
| 25–34 | 12,868 | 32 | 8744 | 26 | 13,929 | 23 | 12,273 | 25 | 22,999 | 24 | 15,850 | 25 | 13,105 | 33 | 21,514 | 44 | 45,704 | 59 |
| 35–44 | 9373 | 24 | 8254 | 24 | 15,038 | 25 | 11,593 | 23 | 15,319 | 16 | 13,779 | 22 | 12,798 | 33 | 15,295 | 31 | 15,853 | 21 |
| 45–54 | 8003 | 20 | 7795 | 23 | 14,574 | 25 | 9733 | 20 | 21,380 | 23 | 16,550 | 26 | 6827 | 17 | 5015 | 10 | 4326 | 6 |
| 55–64 | 4654 | 12 | 4390 | 13 | 7128 | 12 | 8034 | 16 | 17,860 | 19 | 6134 | 10 | 1856 | 5 | 1418 | 3 | 1495 | 2 |
| 65+ | 859 | 2 | 799 | 2 | 1274 | 2 | 1874 | 4 | 1470 | 2 | 551 | 1 | 204 | 1 | 219 | 0 | 259 | 0 |
| Total | 39,797 | 100 | 33,777 | 100 | 59,332 | 100 | 49,880 | 100 | 94,412 | 100 | 62,885 | 100 | 39,306 | 100 | 49,102 | 100 | 76,828 | 100 |
| Average | 39 | 40 | 40 | 41 | 40 | 39 | 37 | 35 | 33 | |||||||||
| Socio-Economic Grouping | ||||||||||||||||||
| SEG1 | 7551 | 19 | 6087 | 18 | 9688 | 16 | 8567 | 17 | 14,688 | 16 | 11,000 | 17 | 8262 | 21 | 9786 | 20 | 15,001 | 20 |
| SEG2 | 6614 | 17 | 3859 | 11 | 4912 | 8 | 3884 | 8 | 6066 | 6 | 5136 | 8 | 4383 | 11 | 5435 | 11 | 9092 | 12 |
| SEG3 | 7110 | 18 | 5229 | 15 | 7691 | 13 | 6704 | 13 | 11,659 | 12 | 8428 | 13 | 6136 | 16 | 7370 | 15 | 12,135 | 16 |
| SEG4 | 8686 | 22 | 8720 | 26 | 16,590 | 28 | 14,285 | 29 | 28,676 | 30 | 17,906 | 28 | 10,317 | 26 | 12,784 | 26 | 20,141 | 26 |
| SEG5 | 2083 | 5 | 2739 | 8 | 6134 | 10 | 4961 | 10 | 11,196 | 12 | 6346 | 10 | 3125 | 8 | 4069 | 8 | 6044 | 8 |
| SEG6 | 2384 | 6 | 2571 | 8 | 5608 | 9 | 4438 | 9 | 8694 | 9 | 5208 | 8 | 2466 | 6 | 3449 | 7 | 5314 | 7 |
| SEG7 | 1261 | 3 | 1345 | 4 | 2686 | 5 | 1758 | 4 | 3442 | 4 | 2386 | 4 | 945 | 2 | 1451 | 3 | 2220 | 3 |
| SEG8 | 1833 | 5 | 1534 | 5 | 2951 | 5 | 2626 | 5 | 4779 | 5 | 2840 | 5 | 1683 | 4 | 2135 | 4 | 2440 | 3 |
| SEG9 | 156 | 0 | 86 | 0 | 90 | 0 | 77 | 0 | 176 | 0 | 108 | 0 | 61 | 0 | 71 | 0 | 116 | 0 |
| SEG10 | 52 | 0 | 31 | 0 | 44 | 0 | 77 | 0 | 104 | 0 | 67 | 0 | 34 | 0 | 57 | 0 | 112 | 0 |
| SEG11 | 2067 | 5 | 1576 | 5 | 2938 | 5 | 2503 | 5 | 4932 | 5 | 3460 | 6 | 1894 | 5 | 2495 | 5 | 4213 | 5 |
| Total | 39,797 | 100 | 33,777 | 100 | 59,332 | 100 | 49,880 | 100 | 94,412 | 100 | 62,885 | 100 | 39,306 | 100 | 49,102 | 100 | 76,828 | 100 |
| No. of People per Household | ||||||||||||||||||
| 1 | 6460 | 16 | 3624 | 11 | 4762 | 8 | 2947 | 6 | 4425 | 5 | 5174 | 8 | 3916 | 10 | 4556 | 9 | 10,626 | 14 |
| 2 | 12,260 | 31 | 8336 | 25 | 13,548 | 23 | 10,498 | 21 | 16,809 | 18 | 12,753 | 21 | 10,103 | 26 | 14,516 | 30 | 32,815 | 43 |
| 3+ | 20,749 | 53 | 21,526 | 64 | 40,497 | 69 | 36,062 | 73 | 72,174 | 77 | 44,251 | 71 | 25,035 | 64 | 29,787 | 61 | 33,072 | 43 |
| Total | 39,469 | 100 | 33,486 | 100 | 58,807 | 100 | 49,507 | 100 | 93,408 | 100 | 62,178 | 100 | 39,054 | 100 | 48,859 | 100 | 76,513 | 100 |
| Average | 2.9 | 3.2 | 3.3 | 3.4 | 3.6 | 3.5 | 3.2 | 3.1 | 2.7 | |||||||||
Acknowledgements
References
- Economic and Social Research Institute. Quarterly Economic Commentary; Economic and Social Research Institute: Dublin, Ireland, 2009. [Google Scholar]
- Central Statistics Office. Construction and Housing in Ireland, 2008 ed.; Central Statistics Office: Dublin, Ireland, 2008. [Google Scholar]
- Central Statistics Office. Transport 2007; Central Statistics Office: Dublin, Ireland, 2008.
- Commins, N.; Nolan, A. The Determinants of Mode of Transport to Work in the Greater Dublin Area; Economic Social Research Institute Working Paper Series, Working Paper No. 268; ESRI: Dublin, Ireland, 2008. [Google Scholar]
- Vega, A.; Reynolds-Feighan, A. Employment sub-centres and travel-to-work mode choice in the Dublin region. Urban Stud. 2008, 45, 1747–1768. [Google Scholar] [CrossRef]
- McGuirk, P.M.; MacLaran, A. Changing Approaches to Urban Planning in an “Entrepreneurial City”: The Case of Dublin. Eur. Plan. Stud. 2001, 9, 437–457. [Google Scholar] [CrossRef]
- Convery, F.; McInerney, D.; Sokol, M.; Stafford, P. Organising space in a dynamic economy: insights for policy from the Irish experience. Built Environ. 2006, 32, 172–183. [Google Scholar] [CrossRef]
- Dargay, J. The effect of income on car ownership: evidence of asymmetry. Transp. Res. A 2001, 35, 807–821. [Google Scholar]
- Eurostat. Motorisation Rate; Cars per 1000 Inhabitants; European Commission: Brussels, Belgium, 2011. Available online: http://epp.eurostat.ec.europa.eu/tgm/table.do?tab=table&init=1&plugin=1&language=en&pcode=tsdpc340 (accessed on 29 January 2011).
- Ewing, R.; Cervero, R. Travel and the built environment. In Transportation Research Record: Journal of the Transportation Research Board, No. 1780; Transportation Research Board of the National Academies: Washington, DC, USA, 2001; pp. 87–114. [Google Scholar]
- Johnson, A. Bus Transit and Land Use: Illuminating the Interaction. J. Public Transp. 2003, 6, 21–39. [Google Scholar] [CrossRef]
- Sterner, T. Policy Instruments for Environmental and Natural Resource Management; Resources for the Future: Washington, DC, USA, 2003. [Google Scholar]
- McDonnell, S.; Ferreira, S.; Convery, F. Using bus rapid transit to mitigate emissions of CO2 from transport. Transp. Rev. 2008, 28, 735–756. [Google Scholar] [CrossRef]
- Howley, M.; O’Leary, F.; Gallachóir, B.Ó. Energy in Ireland 1990–2006 (2007 Report); Sustainable Energy Ireland, Energy Policy Statistical Support Unit: Dublin, Ireland, 2007. [Google Scholar]
- Scott, S. Research needs of sustainable development. In Economic Social Research Institute Working Paper Serious; Working Paper No. 162; ESRI: Dublin, Ireland, 2004. [Google Scholar]
- Department of Transport. Transport 21; Department of Transport: Dublin, Ireland, 2005. [Google Scholar]
- Department of Finance. Monthly Economic Bulletin: June 2009; Department of Finance: Dublin, Ireland, 2009. [Google Scholar]
- Environmental Protection Agency. Final Allocation Decision Pursuant to Article 11.1 of SI 437 of 2004; Environmental Protection Agency: Wexford, Ireland, 2005. [Google Scholar]
- European Union. Decision of the European Parliament and of the Council on the Effort of Member States to Reduce Their Greenhouse Gas Emissions to Meet the Community’s Greenhouse Gas Emission Reduction Commitments up to 2020. 2008/0014(COD) PE-CONS3738/08, Brussels 26th of March, 2009. Available online: http://register.consilium.europa.eu/pdf/en/08/st03/st03738.en08.pdf (accessed on 29 January 2011).
- Central Statistics Office. Census of Population of Ireland 2006, Place of Work, Census of Anonymised Records (POWCAR) Users Guide; CSO: Dublin, Ireland, 2007. [Google Scholar]
- Button, K.; Nijkamp, P.; Rietveld, P. Land-use, transportation and urban development. In Urban Dynamics and Growth: Advances in Urban Economics; Capello, R., Nijkamp, P., Eds.; North-Holland: Amsterdam, The Netherland, 2005. [Google Scholar]
- Williams, B.; Shiels, P. The Socio-Economic Profile of Dublin, in Les Cahiers; Quarterly publication of the Institute of Urban Planning and Development (IAURIF): Paris, France, 2002. [Google Scholar]
- Williams, B.; Walsh, S.; O’Neill, S. Commercial real estate in Dublin after the boom. J. Real Estate Portfolio Manag. 2002, 8, 107–115. [Google Scholar]
- McDonnell, S.; Ferreira, S.; Convery, F. Bus Priority Provision and Willingness to Pay Differentials Resulting from Modal Choice and Residential Location: Evidence from a Stated Choice Survey. J. Transp. Econ. Policy 2009, 43, 213–235. [Google Scholar]
- DEHLG. Minister Gormley Publishes Details of Dublin Mayor Bill; Press Release, Department of Environment, Heritage and Local Government: Dublin, Ireland, 2010; Available online: http://www.environ.ie/en/LocalGovernment/LocalGovernmentReform/News/MainBody,22379,en.htm (accessed on 29 January 2011).
© 2011 by the authors; licensee MDPI, Basel, Switzerland. This article is an open access article distributed under the terms and conditions of the Creative Commons Attribution license (http://creativecommons.org/licenses/by/3.0/).
Share and Cite
McDonnell, S.; Caulfield, B. Measuring the Failure of Planning and Its Impact on Sustainable Travel in Dublin, Ireland. Energies 2011, 4, 727-740. https://doi.org/10.3390/en4050727
McDonnell S, Caulfield B. Measuring the Failure of Planning and Its Impact on Sustainable Travel in Dublin, Ireland. Energies. 2011; 4(5):727-740. https://doi.org/10.3390/en4050727
Chicago/Turabian StyleMcDonnell, Simon, and Brian Caulfield. 2011. "Measuring the Failure of Planning and Its Impact on Sustainable Travel in Dublin, Ireland" Energies 4, no. 5: 727-740. https://doi.org/10.3390/en4050727