3.1. Effect of Pore-Pressure/Consolidation on Kinetics of Methane Hydrate Formation
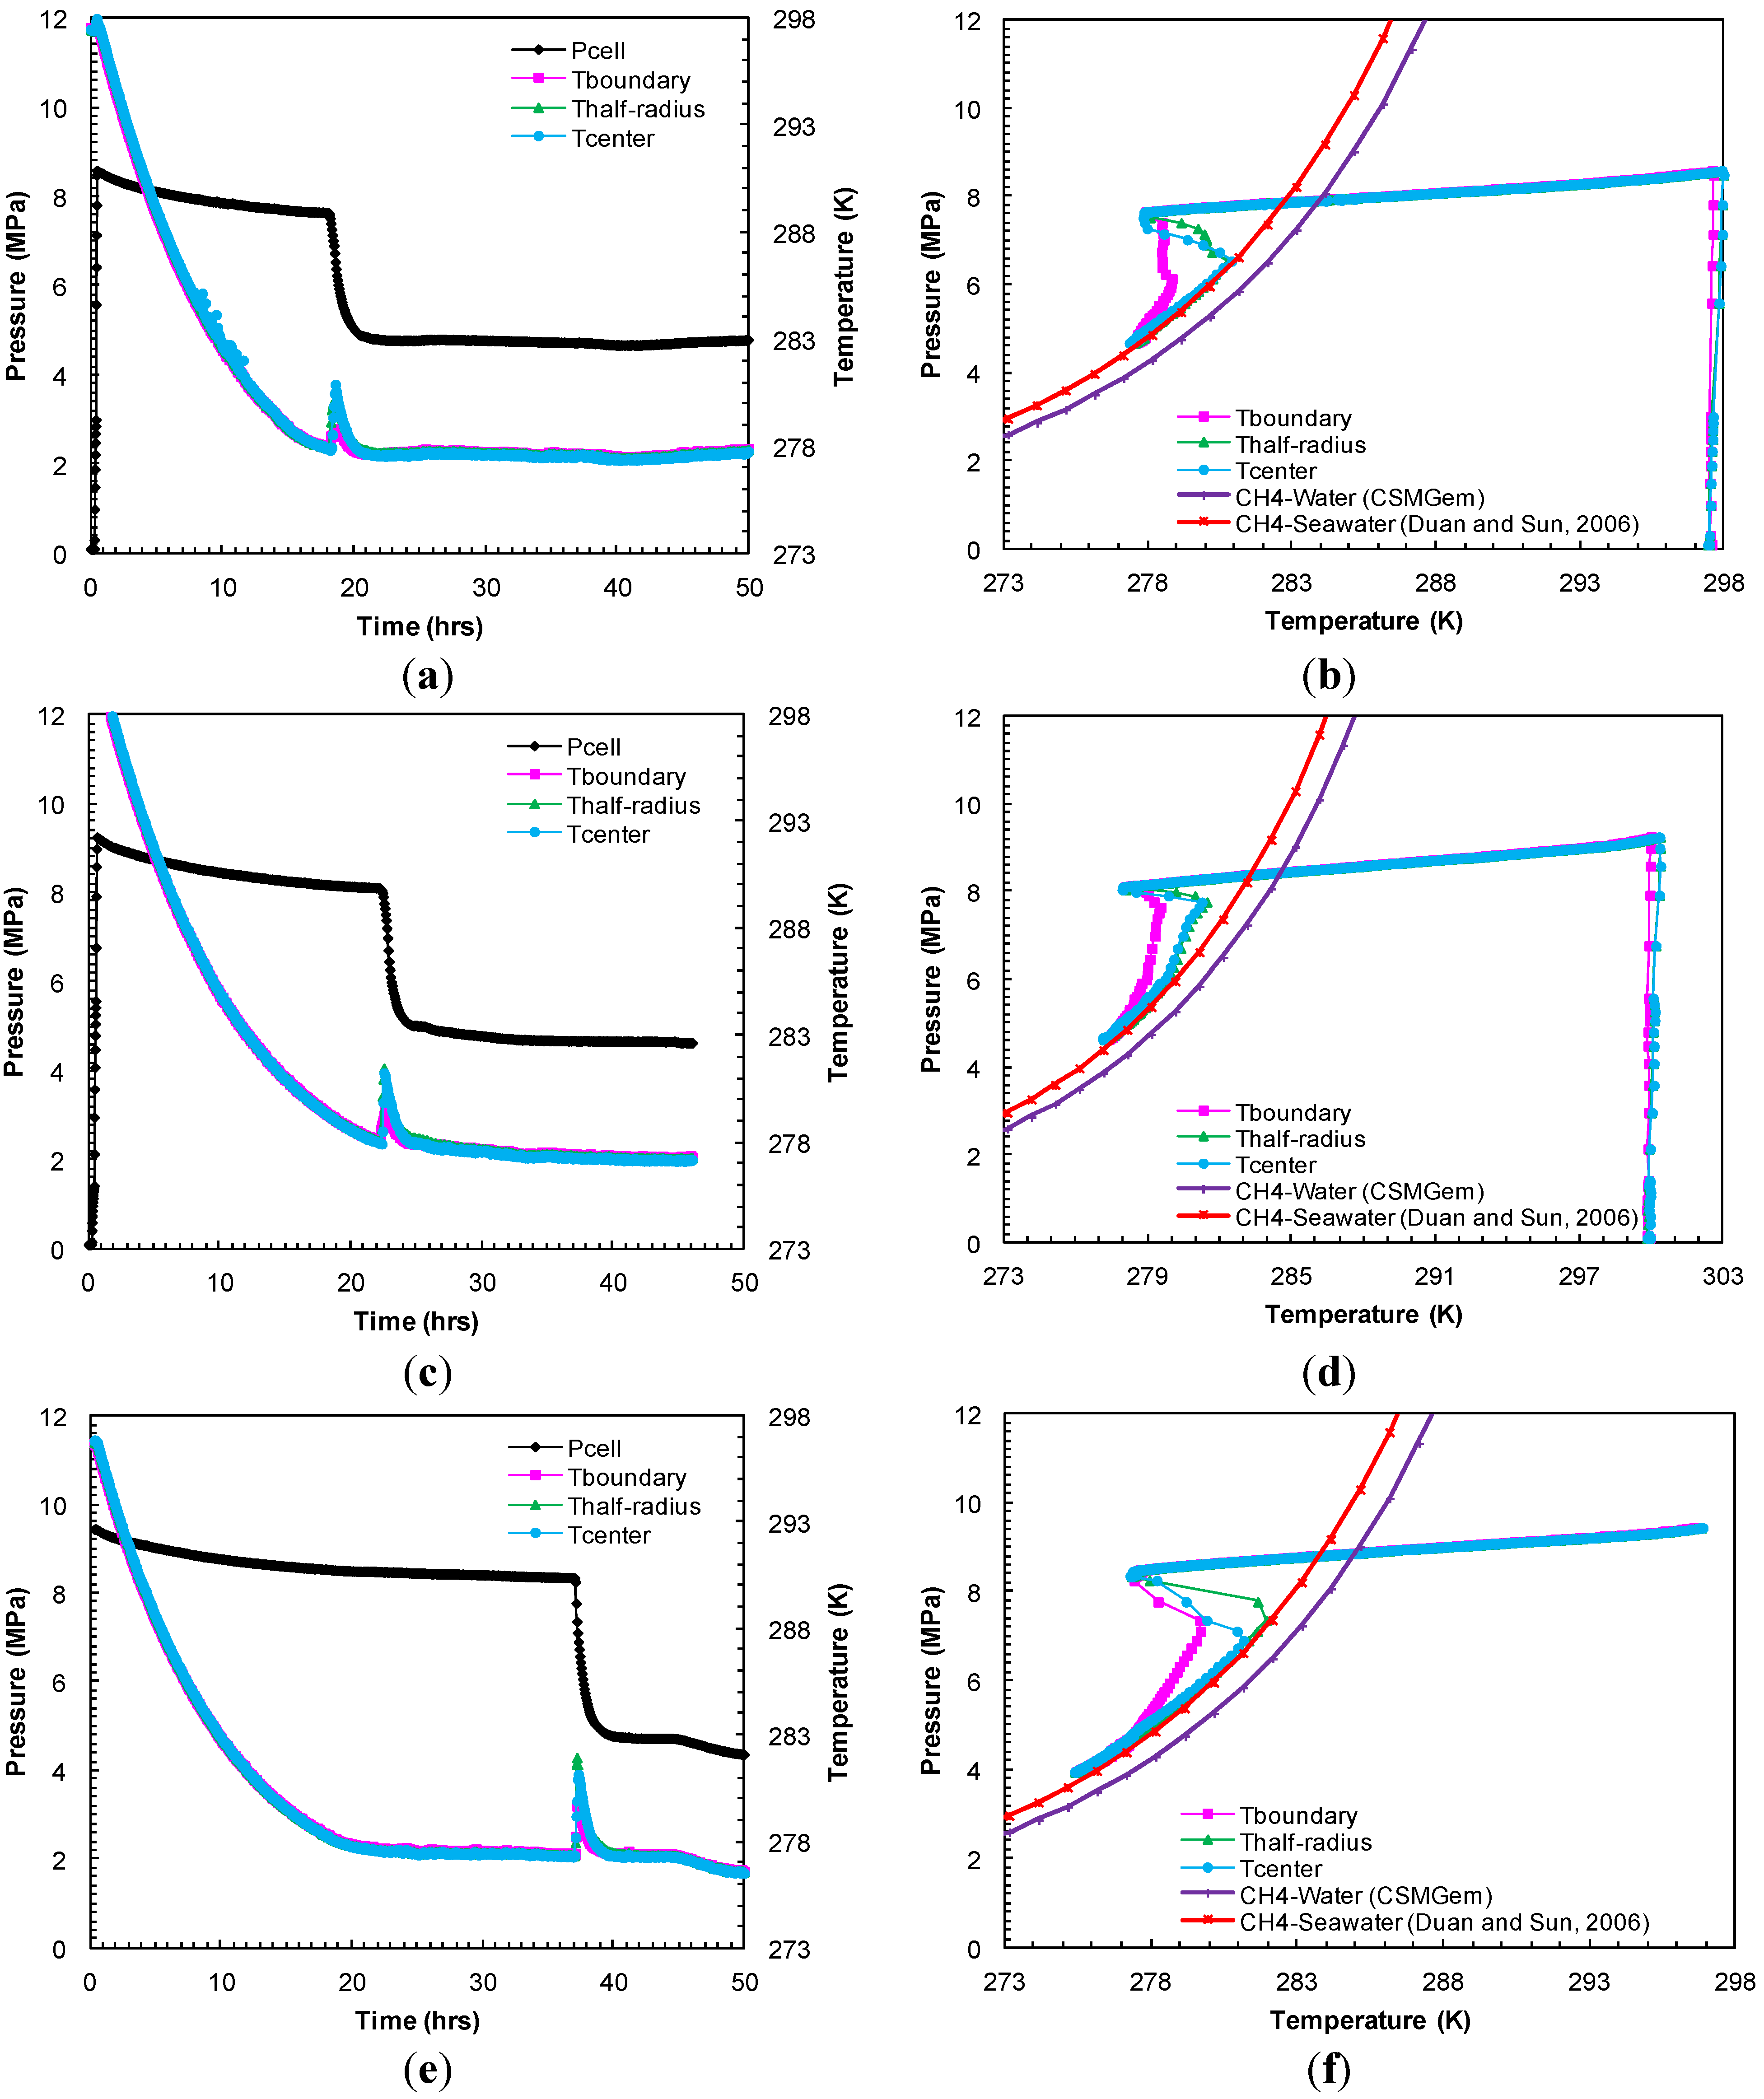
A set of experiments (Experiments 1–3) were performed under a constant confining pressure of 10.4 MPa and a sediment temperature of 277.2 K. However, the methane charging pressure (pore pressure) was varied to study hydrate formation kinetics at different effective pressures that are defined as the difference between the confining pressure and pore pressure. In Experiment 1, under an effective pressure of 1.9 MPa, the sediment cooling lowered the system pressure gradually (
Figure 2a). After 8.8 h of cooling, the
P-
T values of the system entered the hydrate stability region (
Figure 2b). However, hydrate formation was observed after 18.2 h of cooling
i.e., 9.4 h after the system entered into the hydrate stability region. Hydrate formation was initially accompanied by a temperature spike in all thermocouple readings due to the exothermic nature of hydrate formation and a pressure drop due to methane consumption. Subsequently, the pore pressure reached a constant value, an equilibrium pressure of 4.8 MPa at a temperature of 277.6 K after 22 h (
Figure 2a). This can also be discerned from
Figure 2b where the system
P-
T conditions followed the methane-seawater (33%) equilibrium curve from Duan and Sun [
18]. In Experiment 2, with methane charging pressure set at 9.2 MPa, the system
P-T conditions entered the hydrate stability region after 10.5 h of cooling (
Figure 2c). However, the hydrate formation initiated at 22.4 h,
i.e., 11.9 h after the system
P-
T conditions entered the hydrate stability region. Consequently, the system
P-
T reached equilibrium conditions: 4.7 MPa at 277.5 K, for the methane-seawater system as shown in
Figure 2d. For the 9.5 MPa charging (Experiment 3), the hydrate formation began to appear at 37.1 h,
i.e., 29.3 h after the system entered into the hydrate stability region at 7.9 h in
Figure 2e.
Figure 2f shows the system
P-
T conditions which follow the theoretical methane-seawater equilibrium values: 4.7 MPa at 277.4 K at the end of the formation event in Experiment 3.
Figure 2.
(a,c,e) Cell pressure/temperatures against time during methane charging and subsequent hydrate formation in Experiments 1–3; (b,d,f) Comparison of cell pressure against temperature within sand-pack during hydrate formation in Experiments 1–3 with the seawater-bulk methane hydrate stability curve.
Table 3 compares hydrate formation time measured after the system
P-
T conditions entered the methane hydrate-seawater stability regions for Experiments 1–3. The effective stress is inversely related to the coefficient of compression (compression index) [
19]. Hence, as the effective stress decreases, the coefficient of compression increases with the degree of consolidation.
Table 3 shows that the hydrate formation event was delayed with increasing pore pressure or consolidation in Experiments 1–3. This is consistent with Kleinberg
et al. [
20] who studied the hydrate formation kinetics under sub-seafloor conditions mimicked in the 5.1 cm diameter and 30 cm long Berea sandstone. Yousif and Sloan [
21] also performed similar experiments with lower permeability (8.388 × 10
−2 μm
2). Berea sandstone with mean pore radius of 3.5 µm at effective pressure of 1 MPa where long formation time (40 h) was observed, followed by slow growth of hydrates in the pore space. In the most permeable Berea sandstone core, no hydrate formation was seen until the first hour and a slow accumulation thereafter over the next 5 h.
Table 3.
Summary of the effect of pore-pressure/consolidation on the kinetics of methane hydrate formation Experiments 1–3 at a constant confining pressure and cooling rate. Note: Time for hydrate formation is reported after system pressure-temperature entered into hydrate stability region.
Table 3.
Summary of the effect of pore-pressure/consolidation on the kinetics of methane hydrate formation Experiments 1–3 at a constant confining pressure and cooling rate. Note: Time for hydrate formation is reported after system pressure-temperature entered into hydrate stability region.
| Experiment | Pore pressure (MPa) | Confining pressure (MPa) | Effective pressure (MPa) | Time for hydrate formation (h) |
|---|
| 1 | 8.59 | 10.44 | 1.95 | 9.39 |
| 2 | 9.25 | 10.44 | 1.29 | 11.86 |
| 3 | 9.54 | 10.44 | 1.01 | 29.27 |
3.2. Kinetics of Dissociation of Methane Hydrates by Step-wise Depressurization at a Constant Temperature
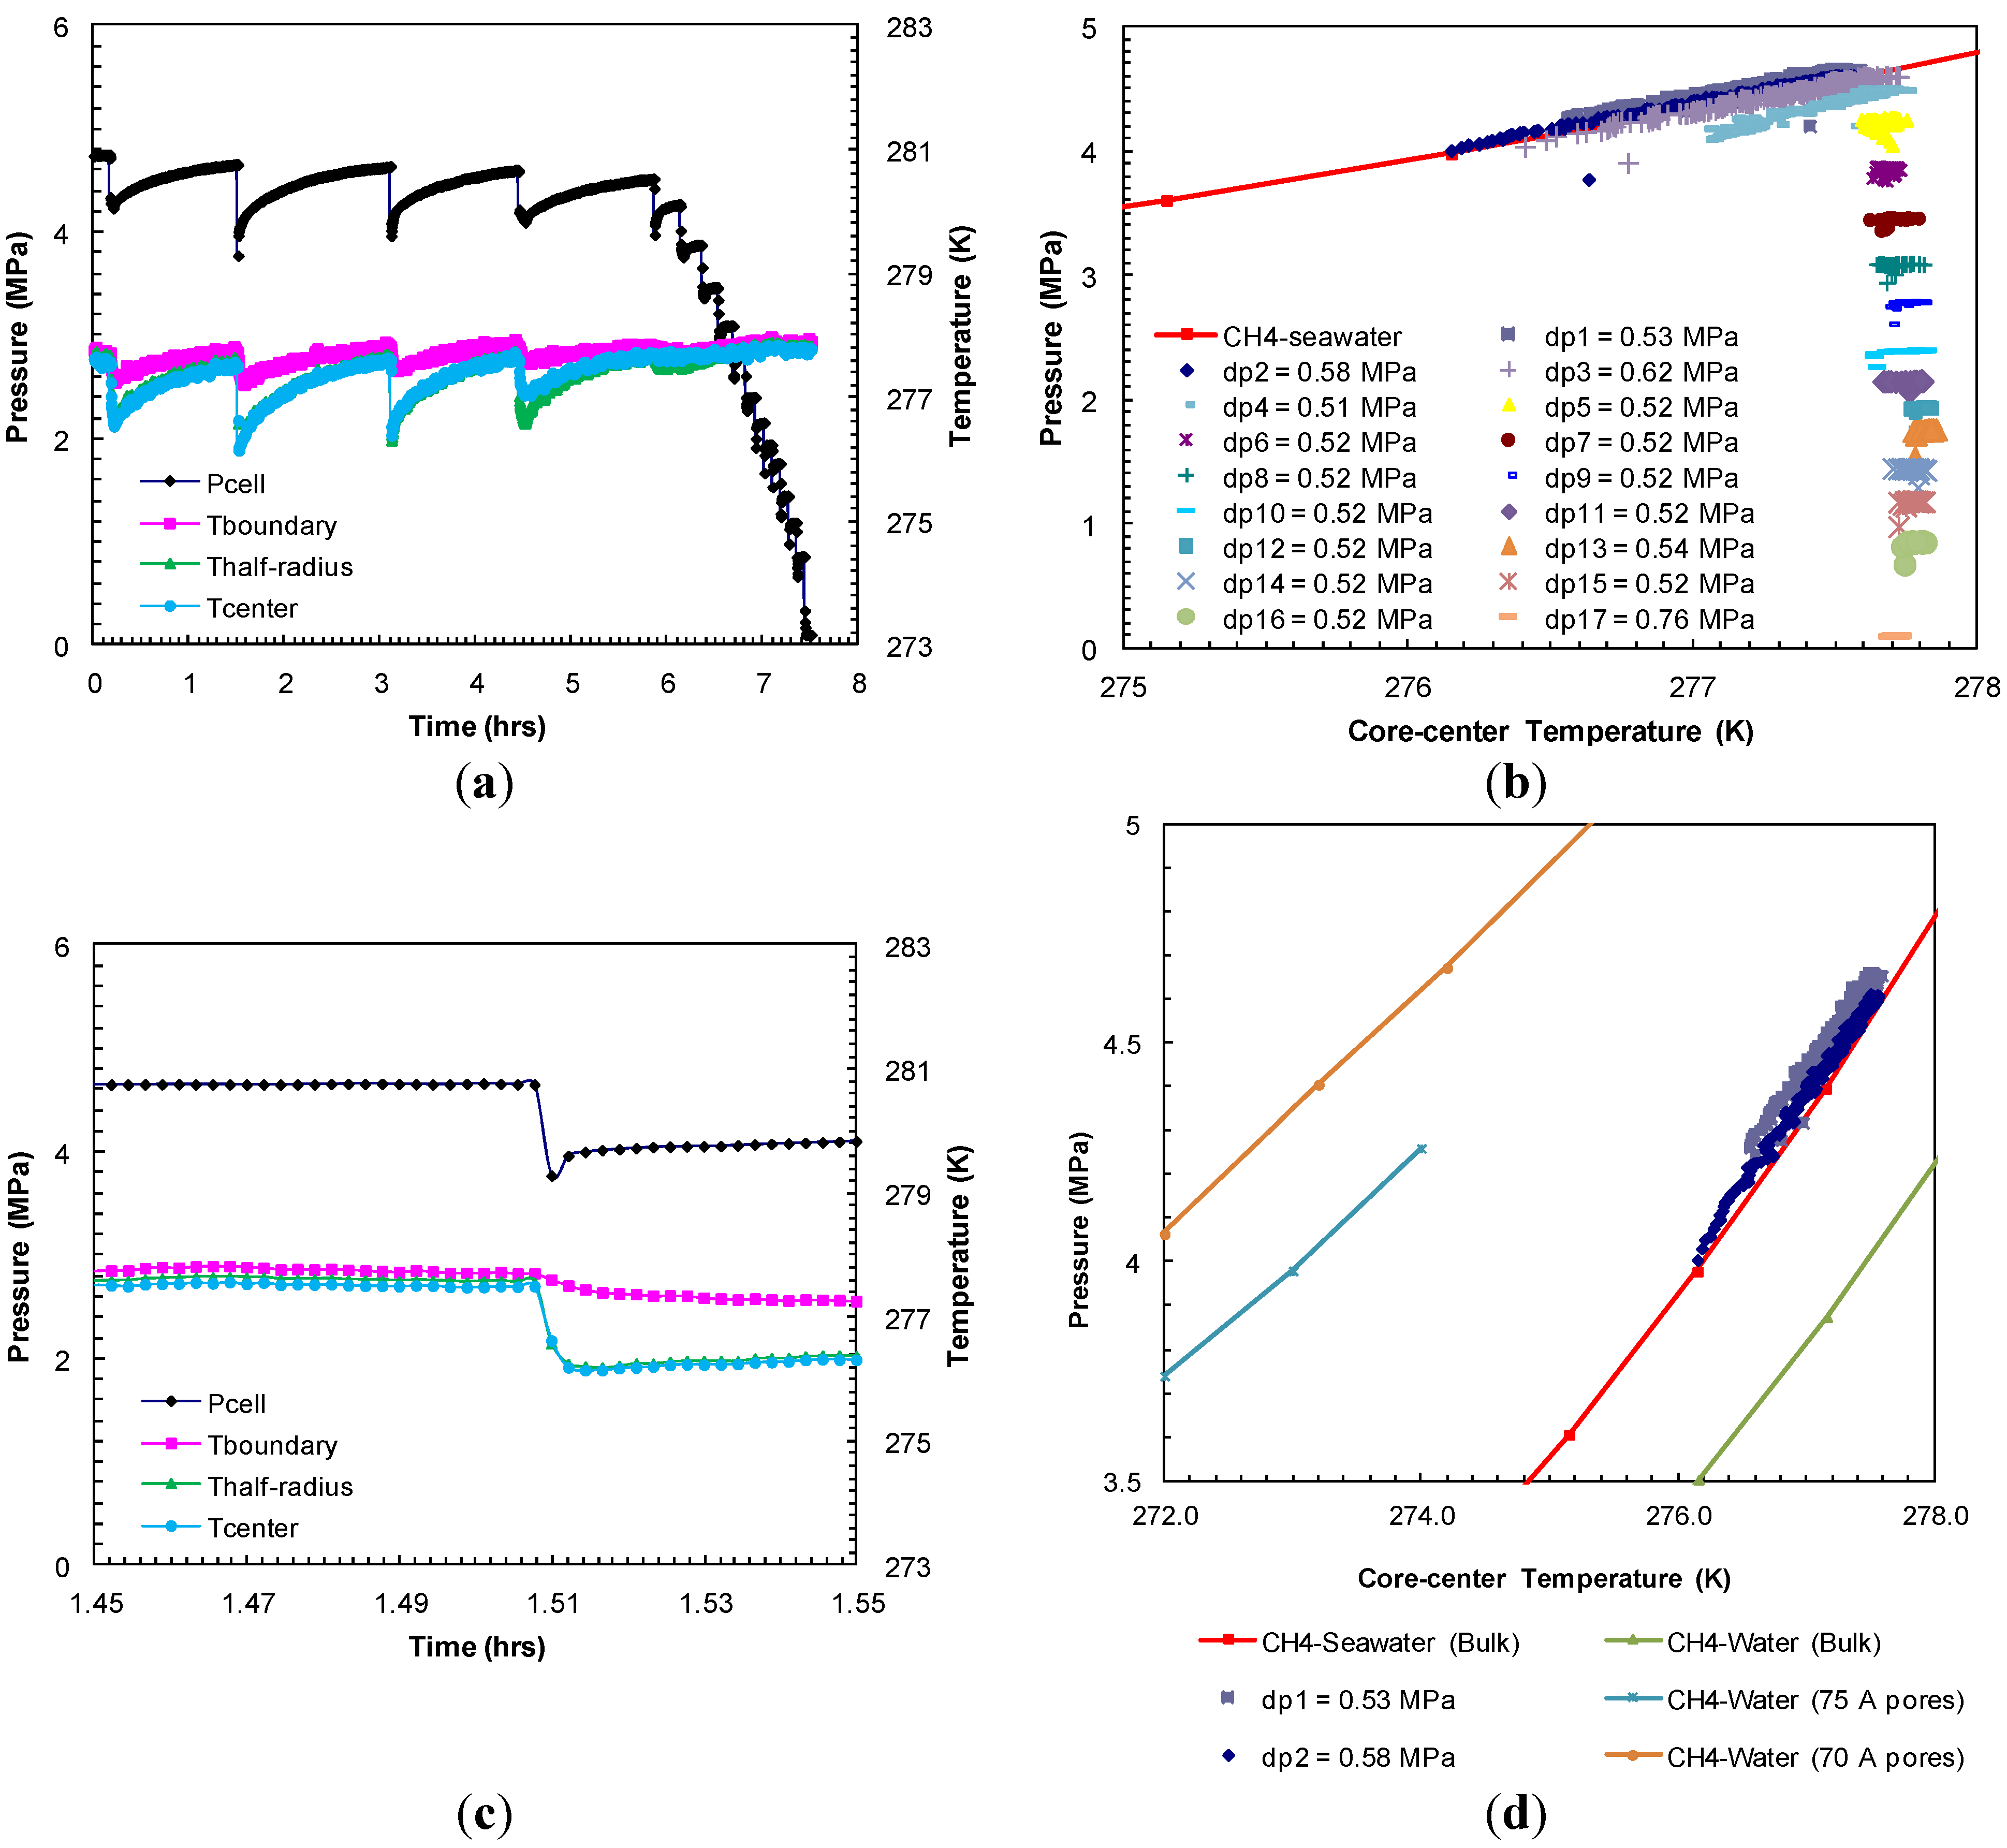
The dissociation of formed methane hydrates was achieved through a step-wise depressurization from the hydrate equilibrium pressure at the set bath temperature. The entire dissociation event from Experiment 1 is shown in
Figure 3a. The dissociation at each depressurization step was short lived. As the gas evolved due to depressurization, the sediment temperature dropped due to endothermic hydrate dissociation that accompanies gas expansion. As the gas evolution ceased (in 8–10 s), the cell outlet valve was closed after which the sediments were allowed to warm up to the bath temperature. This allowed for studying the subsequent dissociation at a constant (bath) temperature. The second pressure drop (dp2) of 0.96 MPa resulted in the sediment cooling as low as 276.2 K (
Figure 3c). It is evident that the greater the pressure drop during dissociation, higher the degree of cooling and longer time period was observed for sediments to reach the bath temperature.
Figure 3b shows each post-depressurization event (dps1–17)
P-
T conditions during sediment warm-up to the bath temperature. These post-depressurization
P-
T conditions representing hydrate equilibrium during thermally induced dissociation follow the theoretical pure methane hydrate-seawater
P-
T stability curve [
18] until hydrates were present within the sediments. After the fourth pressure drop (dp4) of 0.5 MPa, all hydrates dissociated completely and the subsequent post-depressurization curves represent methane gas warm-up.
Figure 3d compares observed post-depressurization curves for initial pressure drops (dps1 and 2) with
P-
T stability curves for theoretical pure methane hydrate-seawater (33%) [
18], theoretical pure methane hydrate-water [
22] and laboratory observations of methane hydrate-water system in 75 Å [
1] and 70 Å pores [
9]. Clearly, salinity and pore size of the host media significantly affect hydrate stability conditions. The post-depressurization curves for initial pressure drops (dps1 and 2) are slightly shifted towards a higher pressure from the theoretical pure methane hydrate-seawater. This slight shift could be due to the minimal excess pore pressure (≈0.1 MPa) generated as a result of confined and well-connected Ottawa sand pores (pore diameter: 46–58 µm) and lower rate of gas hydrate dissociation at hydrate equilibrium
P-
T conditions. These observations are consistent with theoretical study by Xu and Germanovich [
23] where the magnitude of excess pore pressure was found to depend on the sediments pore network and the rate of gas hydrate dissociation.
Figure 3.
(
a) Cell pressure/temperatures against time during dissociation with sequences of pressure drop and thermally induced dissociation in Experiment 1; (
b) Post-depressurization equilibrium pressure against temperature measured at the center of the sand-pack in Experiment 1. Each dataset corresponds to pressure-temperature (
P-
T) conditions during thermally induced dissociations. Equilibrium conditions of methane hydrates-seawater were obtained from Duan and Sun [
18]; (
c) Cell pressure/temperatures against time during dissociation at 1.51 h from (
a); (
d) Post-depressurization (dps1–5) equilibrium pressure against temperature measured at the center of the sand-pack from (
b).
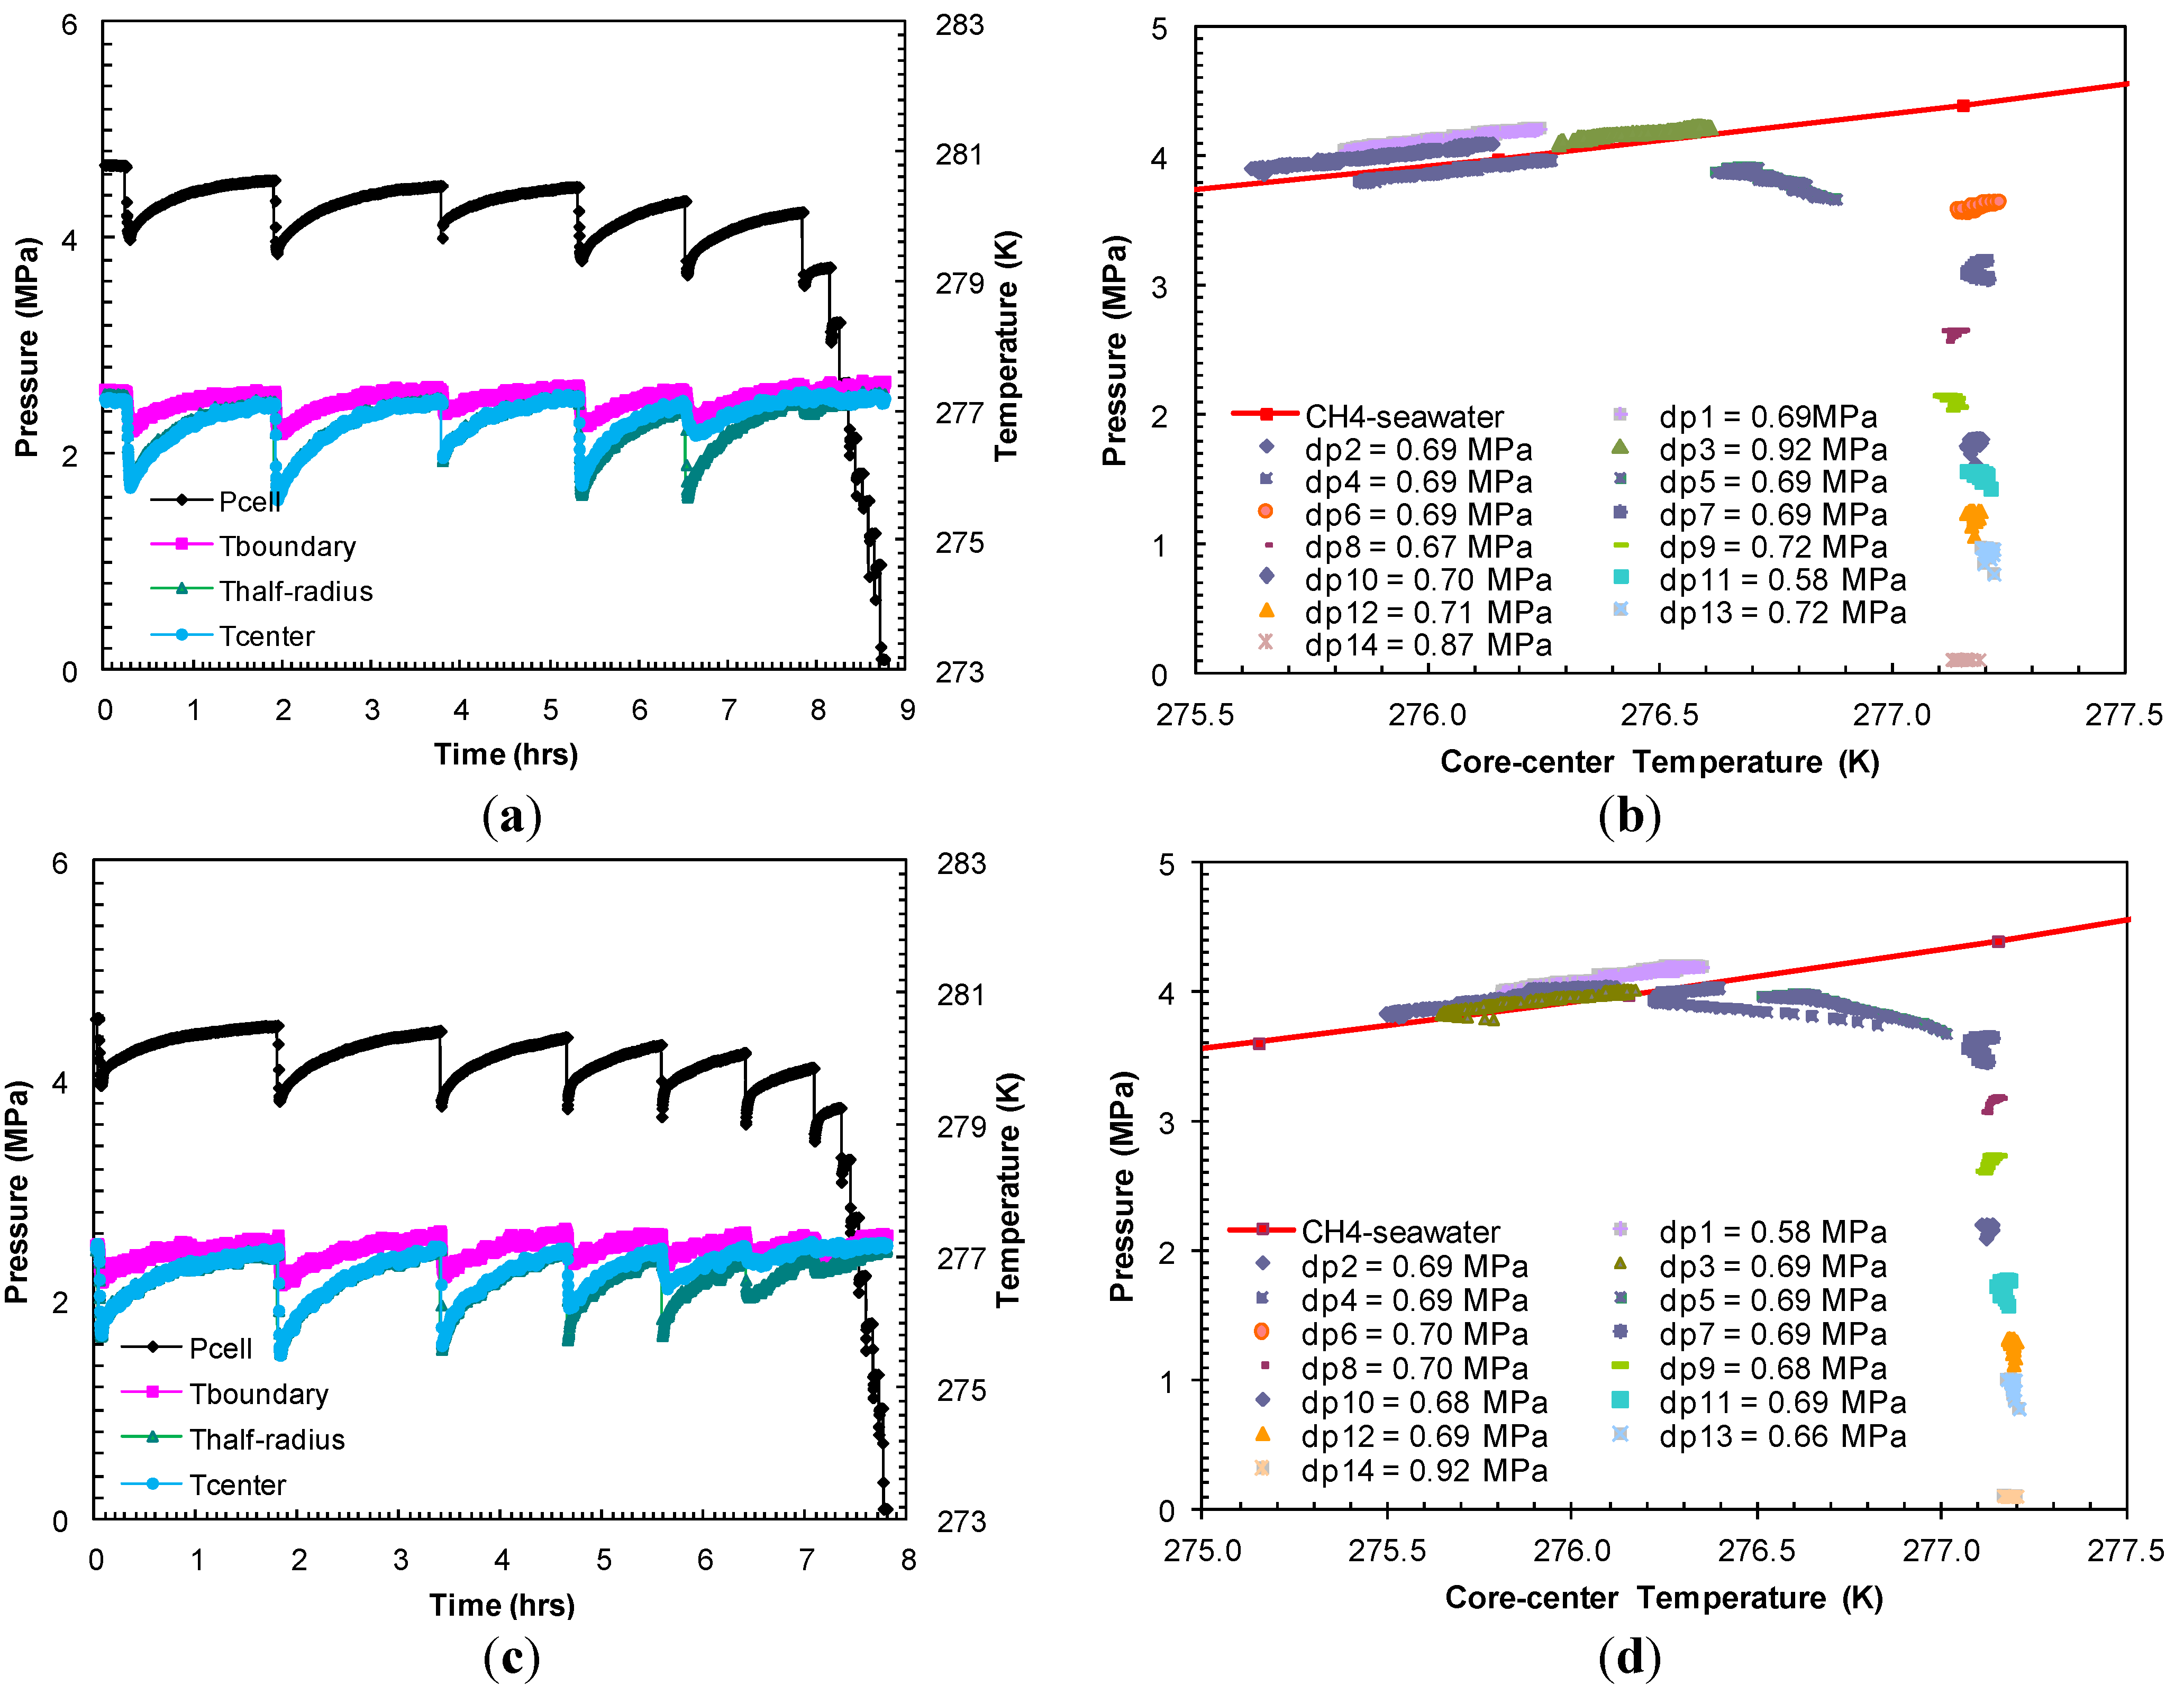
The hydrates formed in Experiment 2 were dissociated with pressure drops (dps1–5) ranging between 0.69 MPa and 0.92 MPa from the equilibrium pressure at a bath temperature of 277.2 K (
Figure 4a). The dissociation events shown in
Figure 4b indicated that the
P-
T equilibrium after the first five pressure drops (dps1–5) followed the theoretical
P-
T stability curve for bulk methane hydrates from seawater with a minimal excess pore pressure. The pressure drops following the first five gas releases did not affect sediment temperature, which confirmed complete hydrate dissociation.
Figure 4.
(
a,
c) Cell pressure/temperatures against time during dissociation with sequences of pressure drop and thermally induced dissociation in Experiments 2 and 3; (
b,
d) Post-depressurization equilibrium pressure against temperature measured at the center of the sand-pack in Experiments 2 and 3. Each dataset corresponds to
P-
T conditions during thermally induced dissociations. Equilibrium conditions of methane hydrates-seawater were obtained from Duan and Sun [
18].
In Experiment 3, the dissociation was carried out with a series of pressure drops (dps1–7) 0.61–0.69 MPa from the hydrate equilibrium pressure at the bath temperature (277.2 K) (
Figure 4c) attained at the end of the formation event. The post-depressurization
P-
T equilibrium (
Figure 4d) confirms complete hydrate dissociation after the seventh pressure drop (dp7) of 0.70 MPa. With an individual pressure drop of similar order in Experiment 2 (
Figure 4b) and Experiment 3 (
Figure 4d), the number of pressure drops to dissociate hydrates in Experiment 3 is higher than that required in Experiment 2. This may be due to the higher hydrate saturation in Experiment 3 as a result of an elevated methane charging pressure.
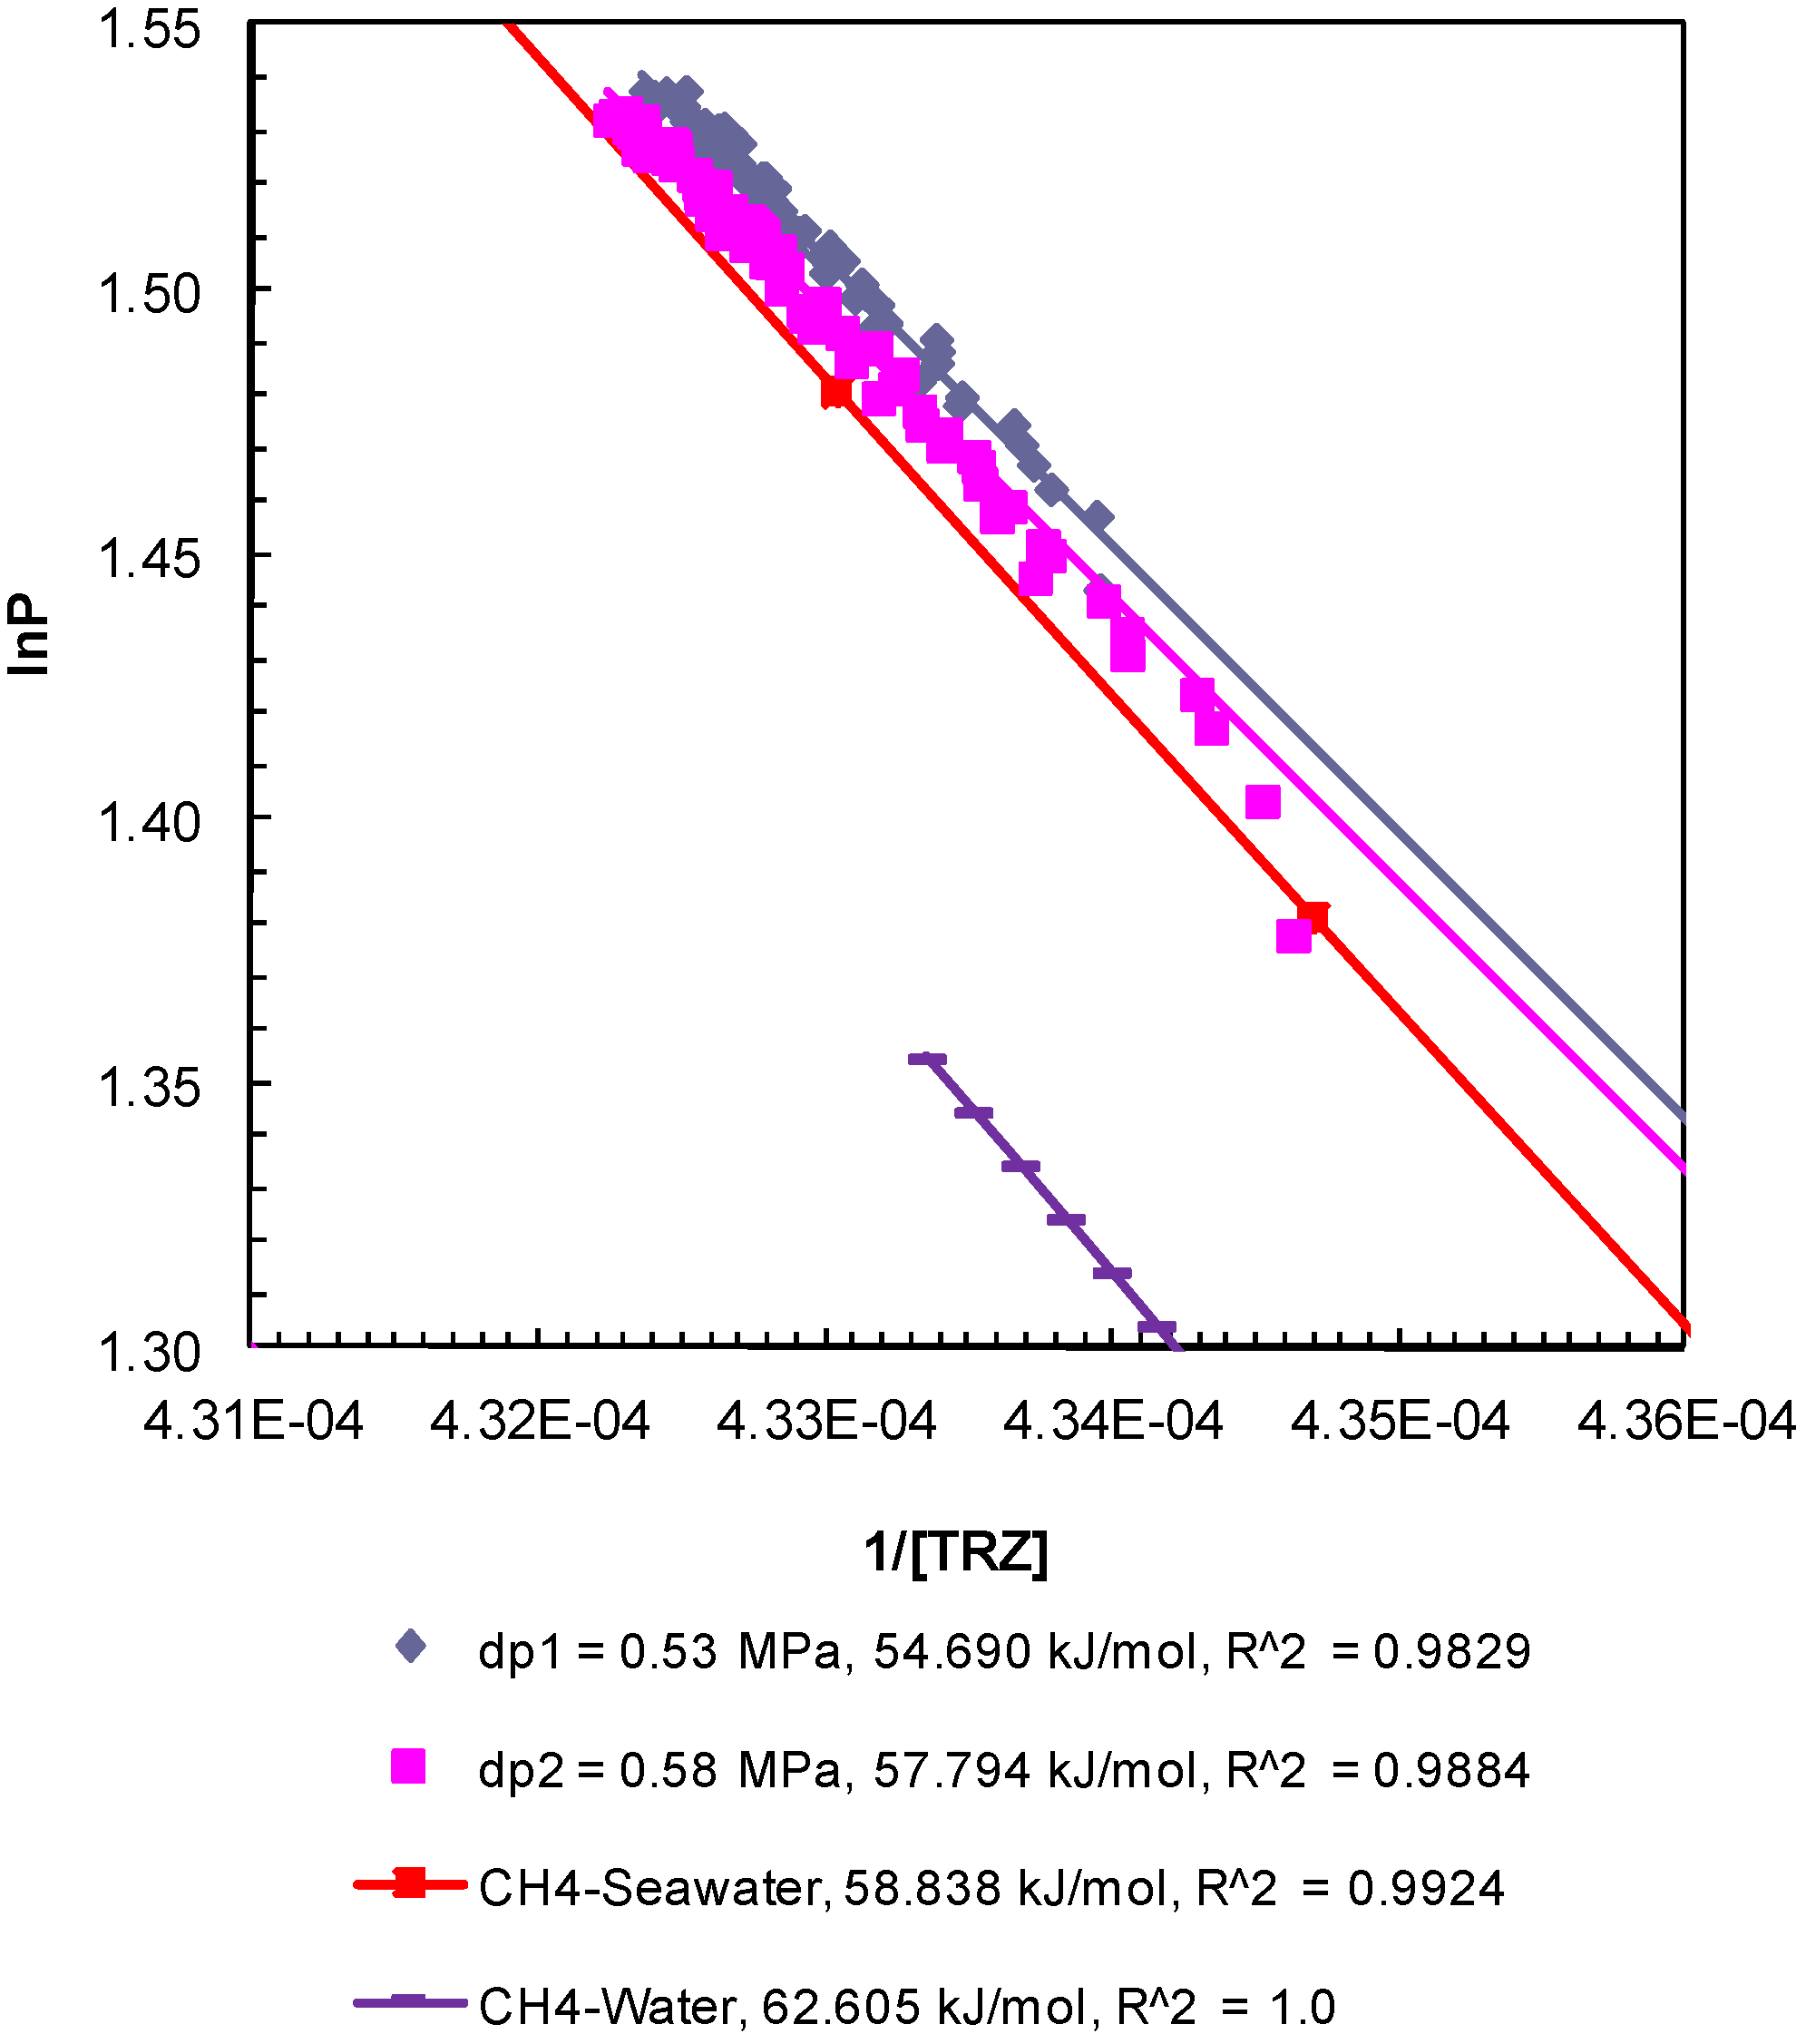
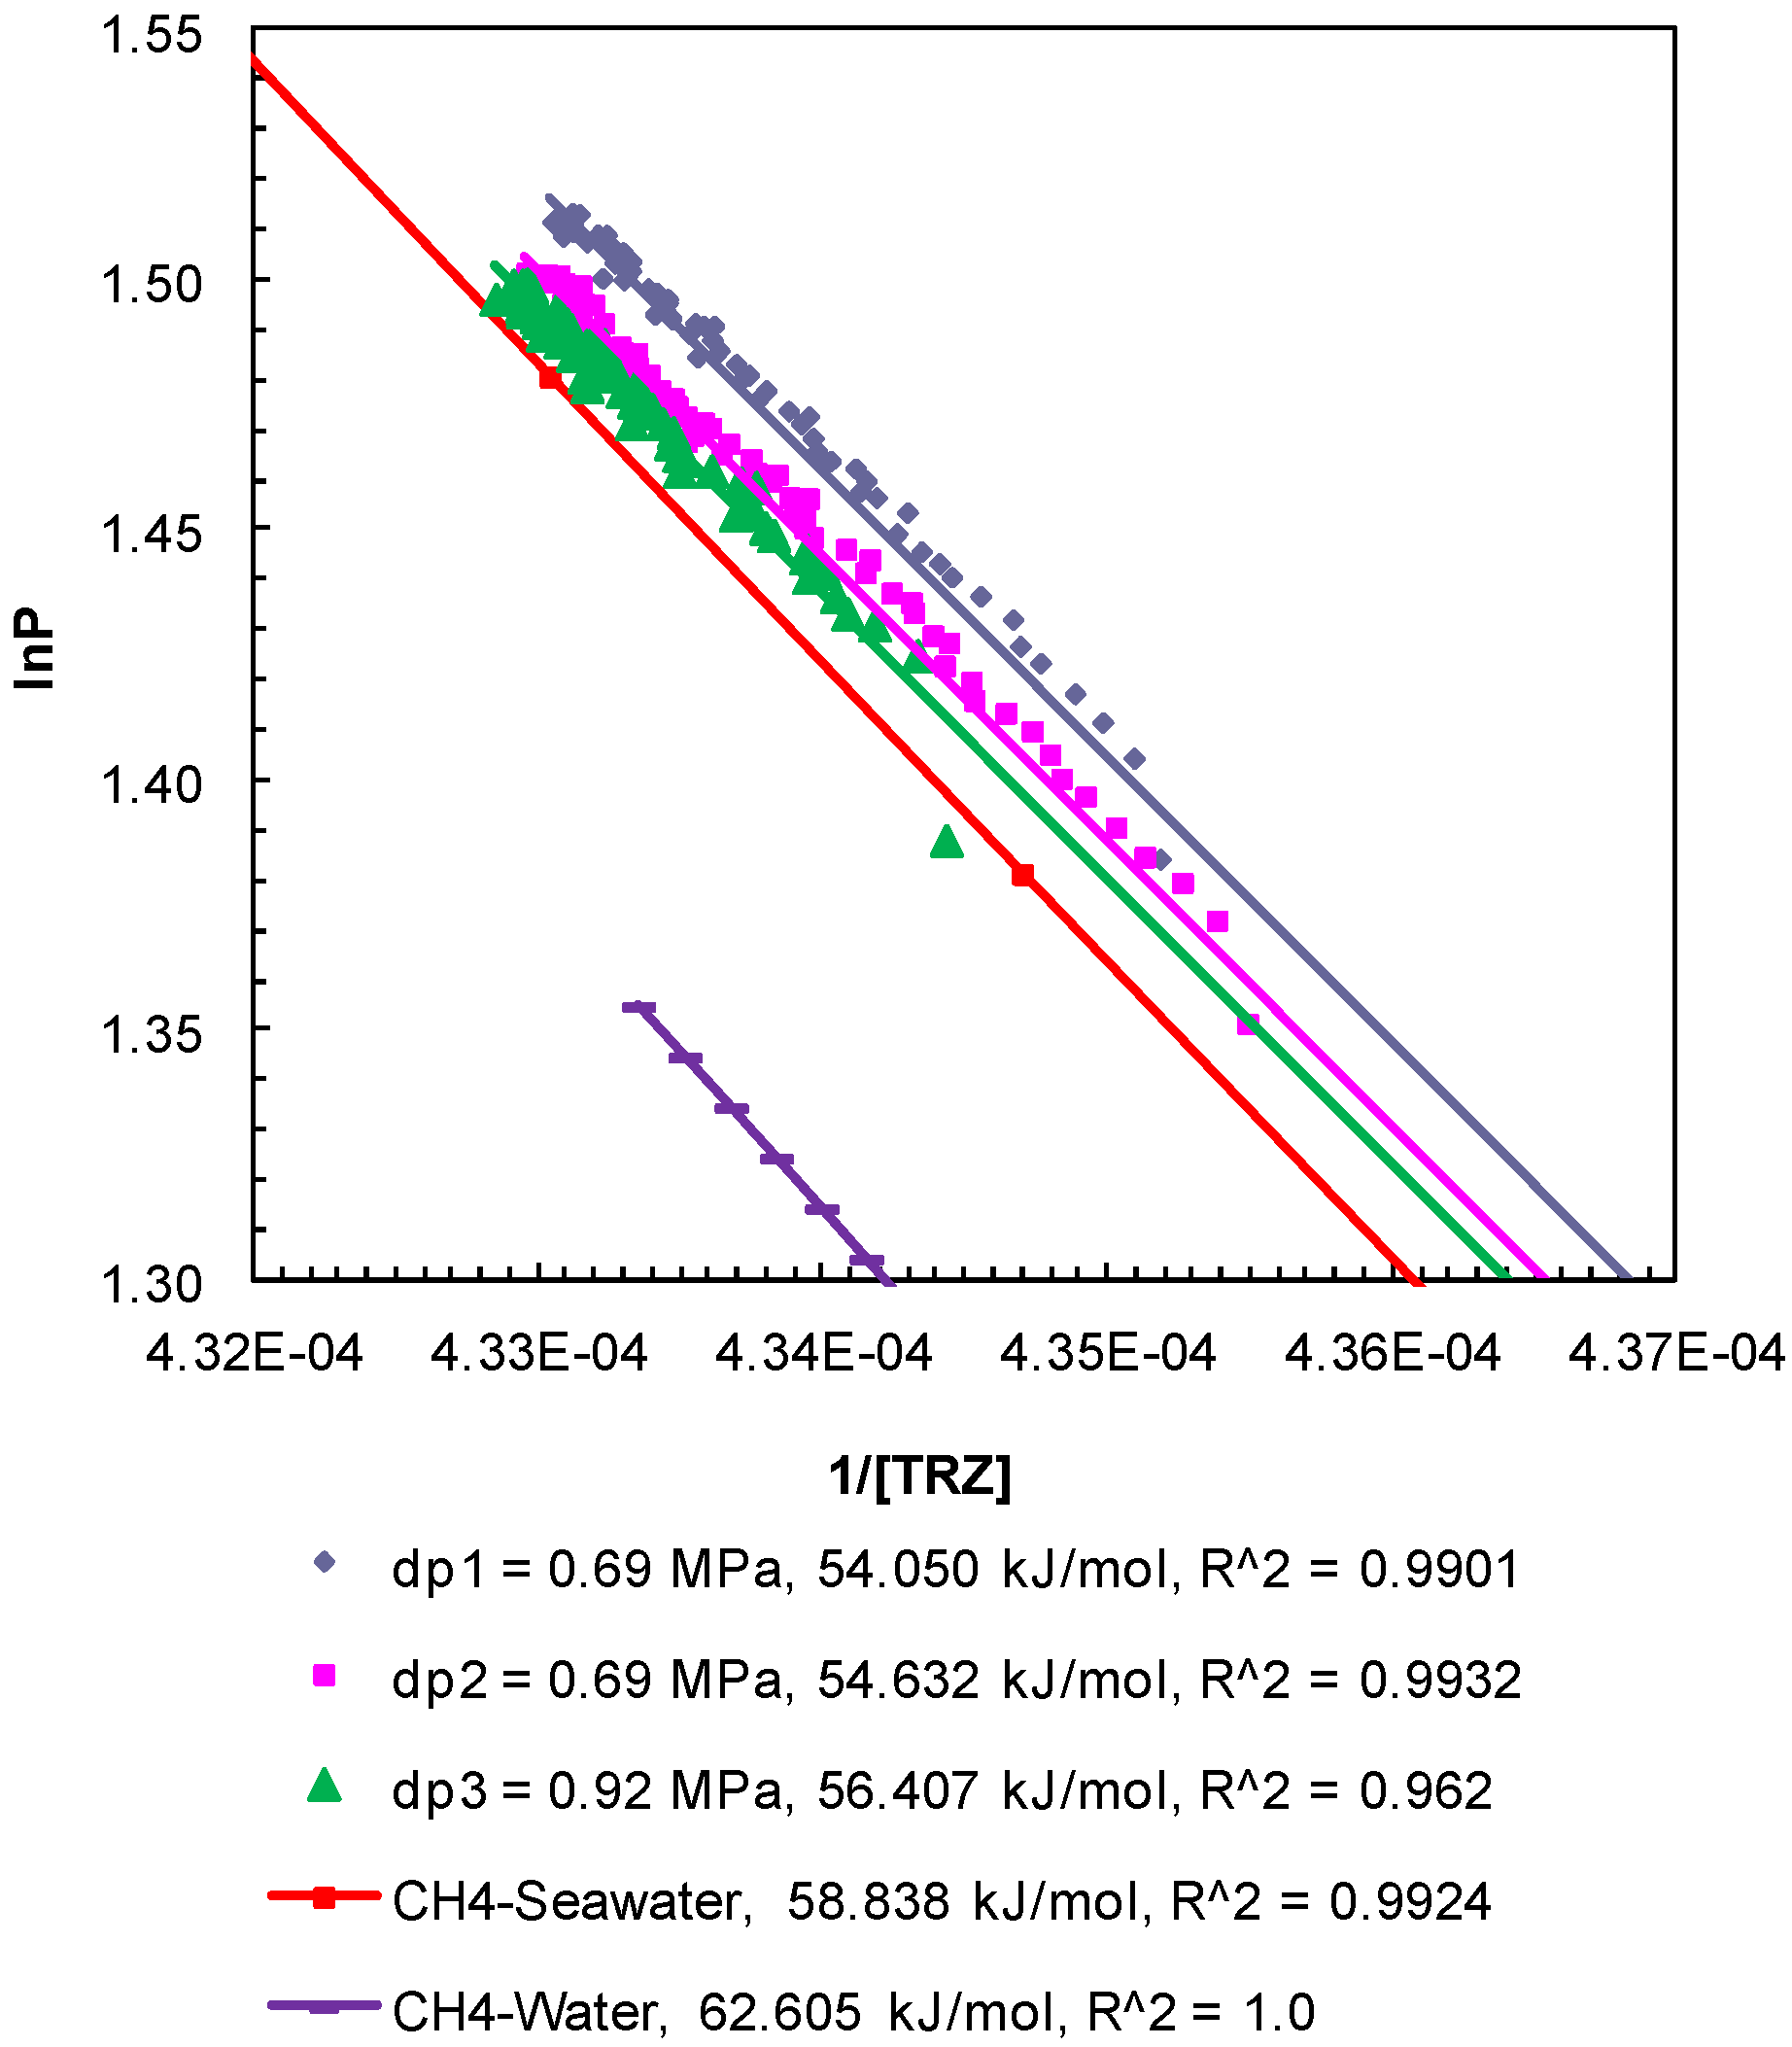
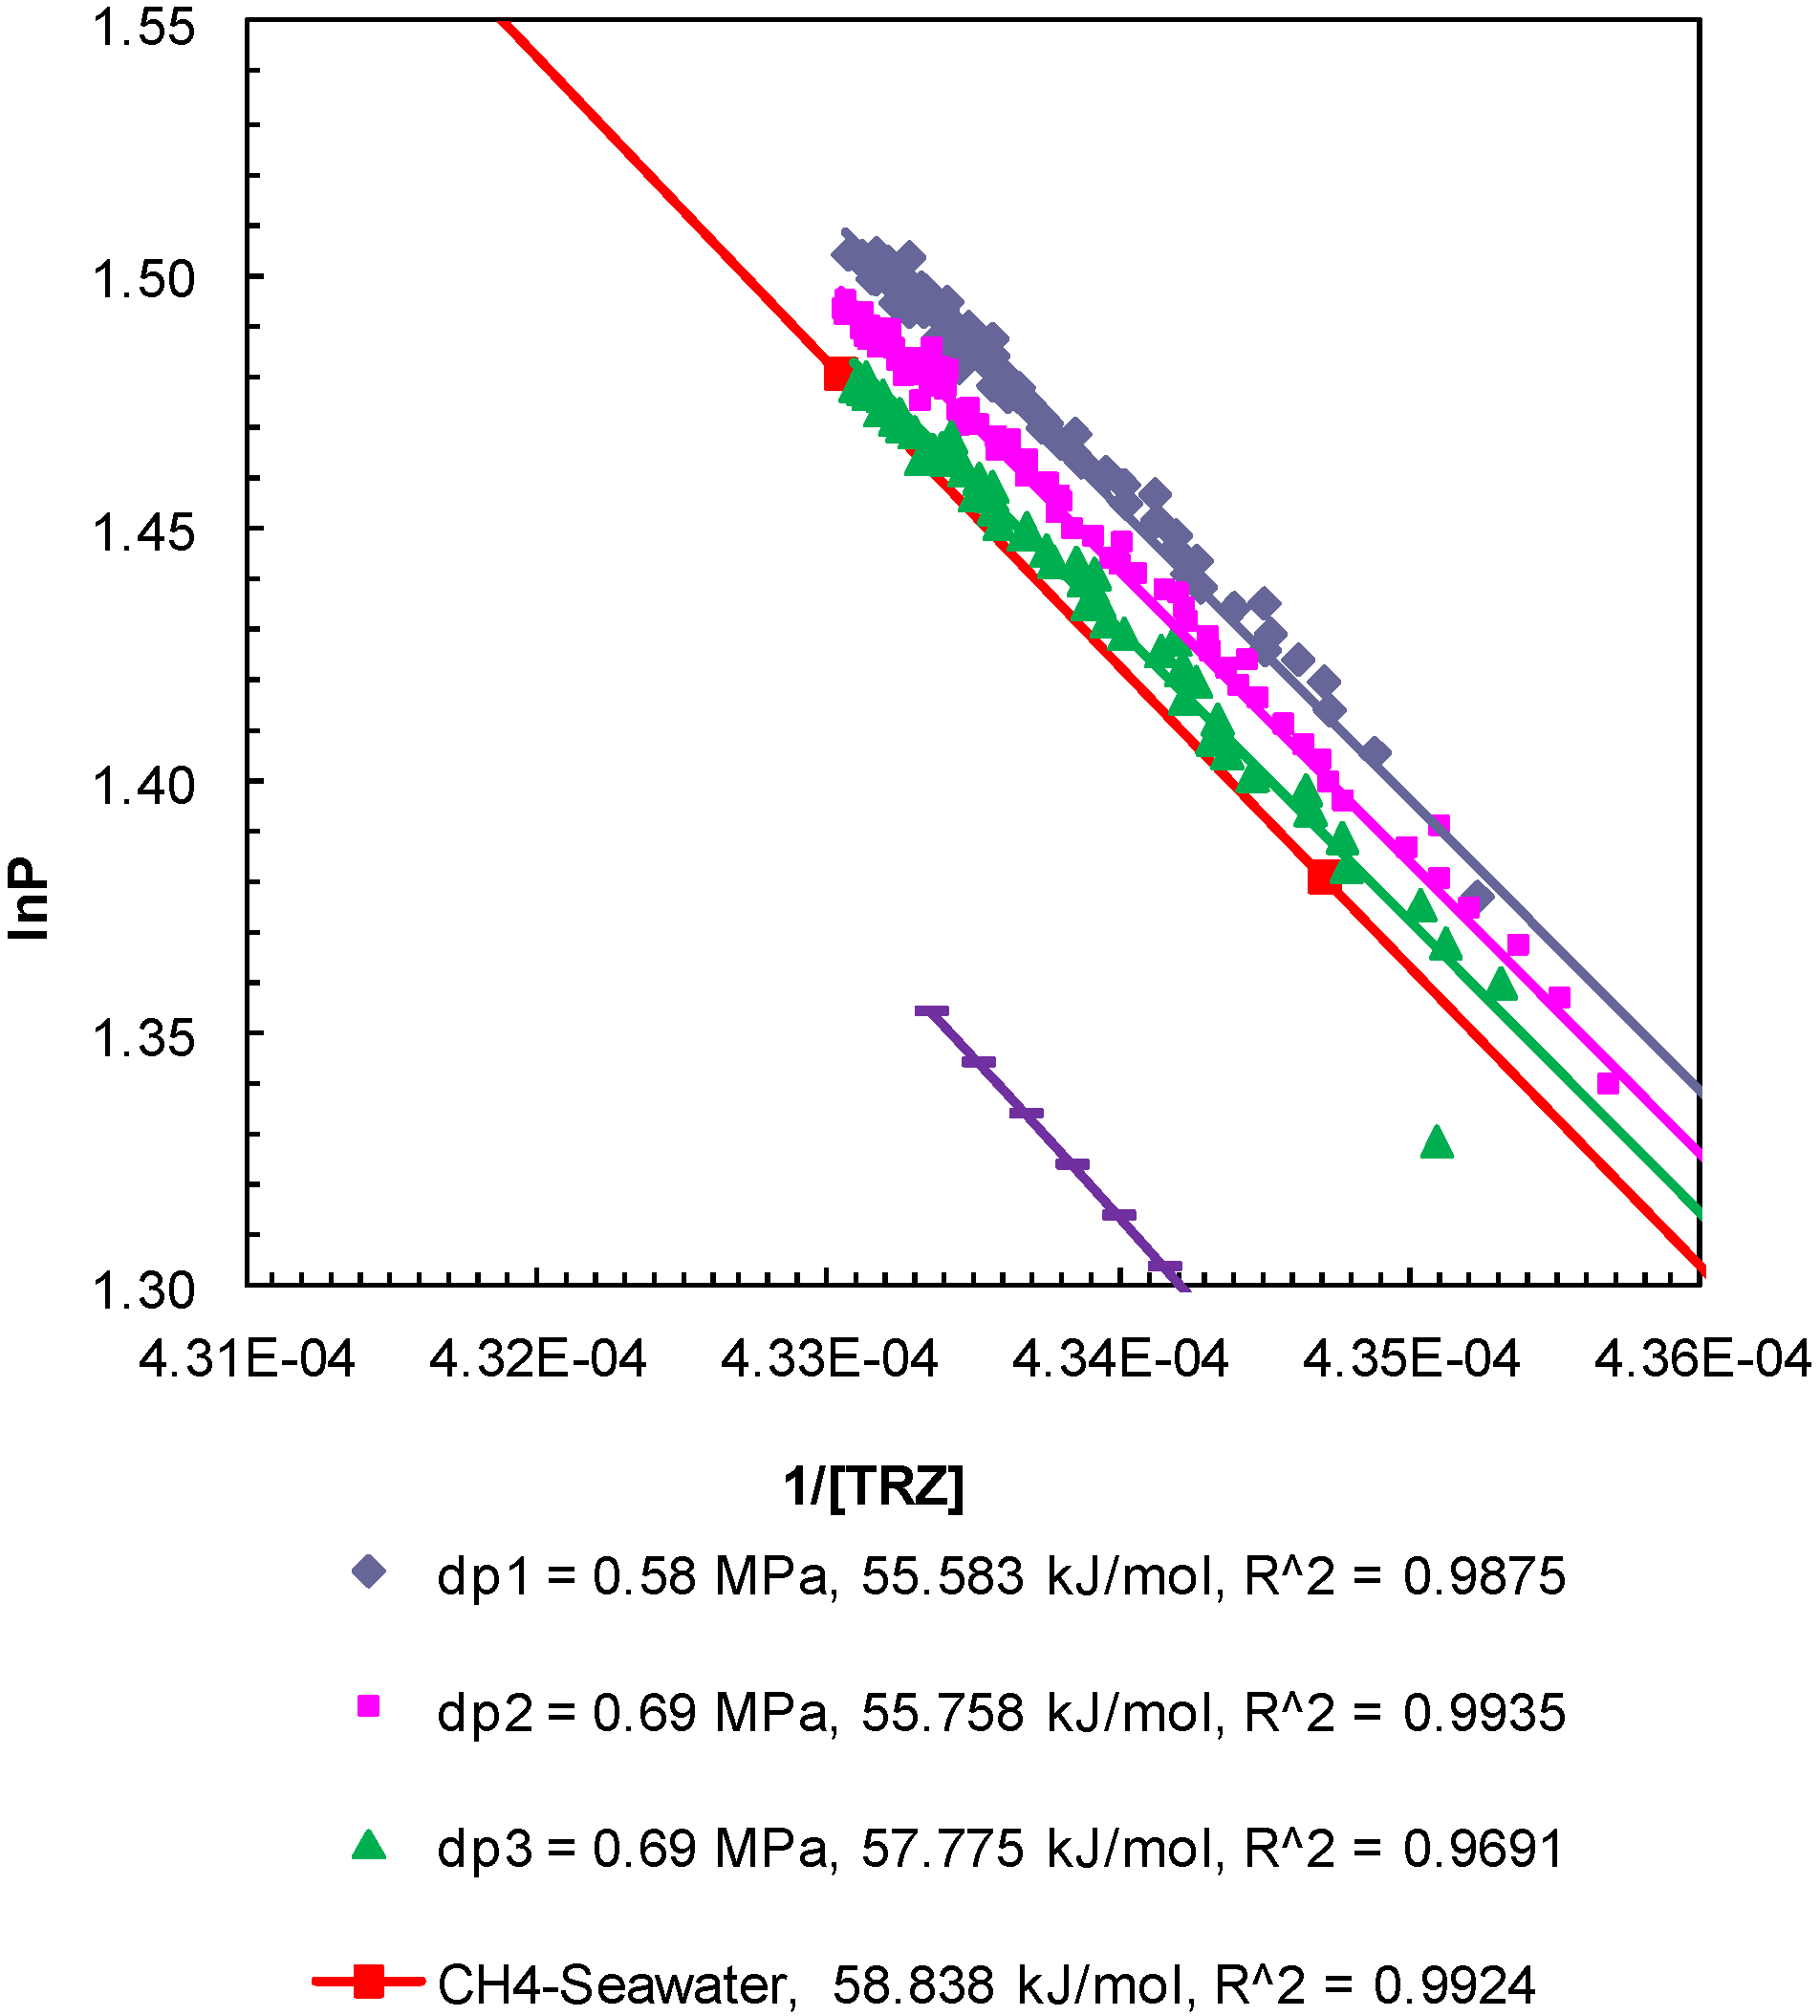
The enthalpy of hydrate dissociation was computed using the Clausius-Clapeyron equation [
24] applied to the post-depressurization
P-
T data from Experiment 1 (
Figure 5), Experiment 2 (
Figure 6), and Experiment 3 (
Figure 7). The slopes of ln
P plotted against 1/[
TR
Z], where
P (MPa) is pore pressure;
T (K) is sediment temperature; R (8.314 J/mol-K) is universal gas constant; and
Z is methane compressibility at
P-
T conditions, yield values of the enthalpy of dissociation of methane hydrates between 54.50 kJ/mol and 57.79 kJ/mol. The computed values are consistent but lower than those computed from theoretical
P-
T data for bulk hydrates obtained from CSMGem (Center for Hydrate Research Colorado School of Mines, Golden, Colorado, USA) [
22] (62.61 kJ/mol) and that from methane-seawater equilibrium data (58.84 kJ/mol) obtained from Duan and Sun [
18]. The enthalpies of dissociation reported from experimental investigations of bulk methane hydrates [
25] and carbon dioxide hydrates [
26] are 54.44 ± 1.45 and 63.6 ± 1.8 kJ/mol, respectively. The values obtained from the post-depressurization data in this study exhibit conditions such as seawater and excess pore pressure developed during thermally induced dissociation of methane hydrates from Ottawa sand-pack (pore diameter: 46–58 µm) under a confining pressure of 10.44 MPa.
Figure 5.
Post-depressurization (dps1 and 2)
P-
T conditions from Experiment 1 plotted as ln
P against 1/[
TR
Z]. The Clausius-Clapeyron equation was used to calculate the enthalpy of dissociation (∆
Hhyd in kJ/mol) of methane hydrates from seawater in porous media at a confining pressure of 10.44 MPa. Equilibrium conditions of bulk methane hydrates-water obtained from CSMGem and those for bulk methane hydrates-seawater obtained from Duan and Sun [
18] were used to calculate the theoretical ∆
Hhyd. The R
2 values indicate the correlation coefficient for linear regression performed to compute the slope as ∆
Hhyd.
Figure 6.
Post-depressurization (dps1–3) P-T conditions from Experiment 2 plotted as lnP against 1/[TRZ]. The Clausius-Clapeyron equation was used to calculate enthalpy of dissociation (∆Hhyd in kJ/mol) of methane hydrates from seawater in porous media at a confining pressure of 10.44 MPa. The R2 values indicate the correlation coefficient for linear regression performed to compute the slope as ∆Hhyd.
Figure 7.
Post-depressurization (dps1–3) P-T conditions from Experiment 3 plotted as lnP against 1/[TRZ]. The Clausius-Clapeyron equation was used to calculate enthalpy of dissociation (∆Hhyd in kJ/mol) of methane hydrates from seawater in porous media at a confining pressure of 10.44 MPa. The R2 values indicate the correlation coefficient for linear regression performed to compute the slope as ∆Hhyd.
3.3. Effect of Sediment Temperature on the Kinetics of Dissociation of Methane Hydrates by Step-Wise Depressurization
Experiments 4–6 were also performed with a method similar to the one that was utilized in Experiments 1–3, i.e., the hydrate formation was achieved by a single gradual charging of methane (9.1 MPa) through a completely seawater saturated sand-pack under a confining pressure of 10.4 MPa. However, the cell was cooled down to experimental temperatures of 275.2, 279.2 and 281.2 K in Experiments 4–6, respectively, to investigate the effect of sediment temperature on: (a) the degree of sub-cooling during each depressurization step; (b) the time scale for sediments to warm-up to the bath temperature after each depressurization; and (c) to establish methane hydrate P-T equilibrium in porous media at temperatures even lower and higher than previous Experiments 1–3.
In Experiments 4–6, the dissociation of hydrates was achieved with pressure drops of about 0.69 MPa from the equilibrium pressure for the methane hydrates-seawater system governed by the experimental temperature. In Experiment 4, the endothermic cooling responses observed at all thermocouples reading for the first nine pressure drops (dps1–9) at cell temperature (275.2 K) confirmed complete hydrate dissociation in the system (
Figure 8a). The presence of hydrates until the ninth pressure drop of 0.68 MPa is also confirmed by the post-depressurization
P-
T shown in
Figure 8b where the plots for dps1–9 follow the theoretical methane-seawater
P-
T curve [
18].
In Experiment 5, the dissociating pressure drops were on the order of about 0.69 MPa from the equilibrium pressure (5.55 MPa) at a cell temperature of 279.2 K. After about ten pressure drops (dps1–10), all hydrates appear to have dissociated since the cell pressure did not come back to the hydrate equilibrium pressure and no endothermic cooling was observed within the sand-pack (
Figure 9c,d).
Experiment 6 involved methane charging pressure of 9.27 MPa and an experimental temperature of 281.2 K. The system attained
P-
T conditions of 8.66 MPa and 283.6 K after 8.7 h of cooling to enter the hydrate-seawater stability region. However no apparent signs of hydrate formation (sudden pressure drop or exothermic temperature profiles) were observed at the end of 140 h with the system
P-
T conditions of 7.48 MPa and 281.2 K. Subsequently, the dissociation was achieved with a series of pressure drops of 0.69 MPa.
Figure 8e shows system the
P-
T data against time during the entire event of dissociation.
Figure 8f compares the recorded system
P-
T with a methane-seawater equilibrium curve data.
Figure 8e shows that no endothermic cooling was recorded by any of the system thermocouples during the entire dissociation event, which confirms negligible hydrate formation in the system.
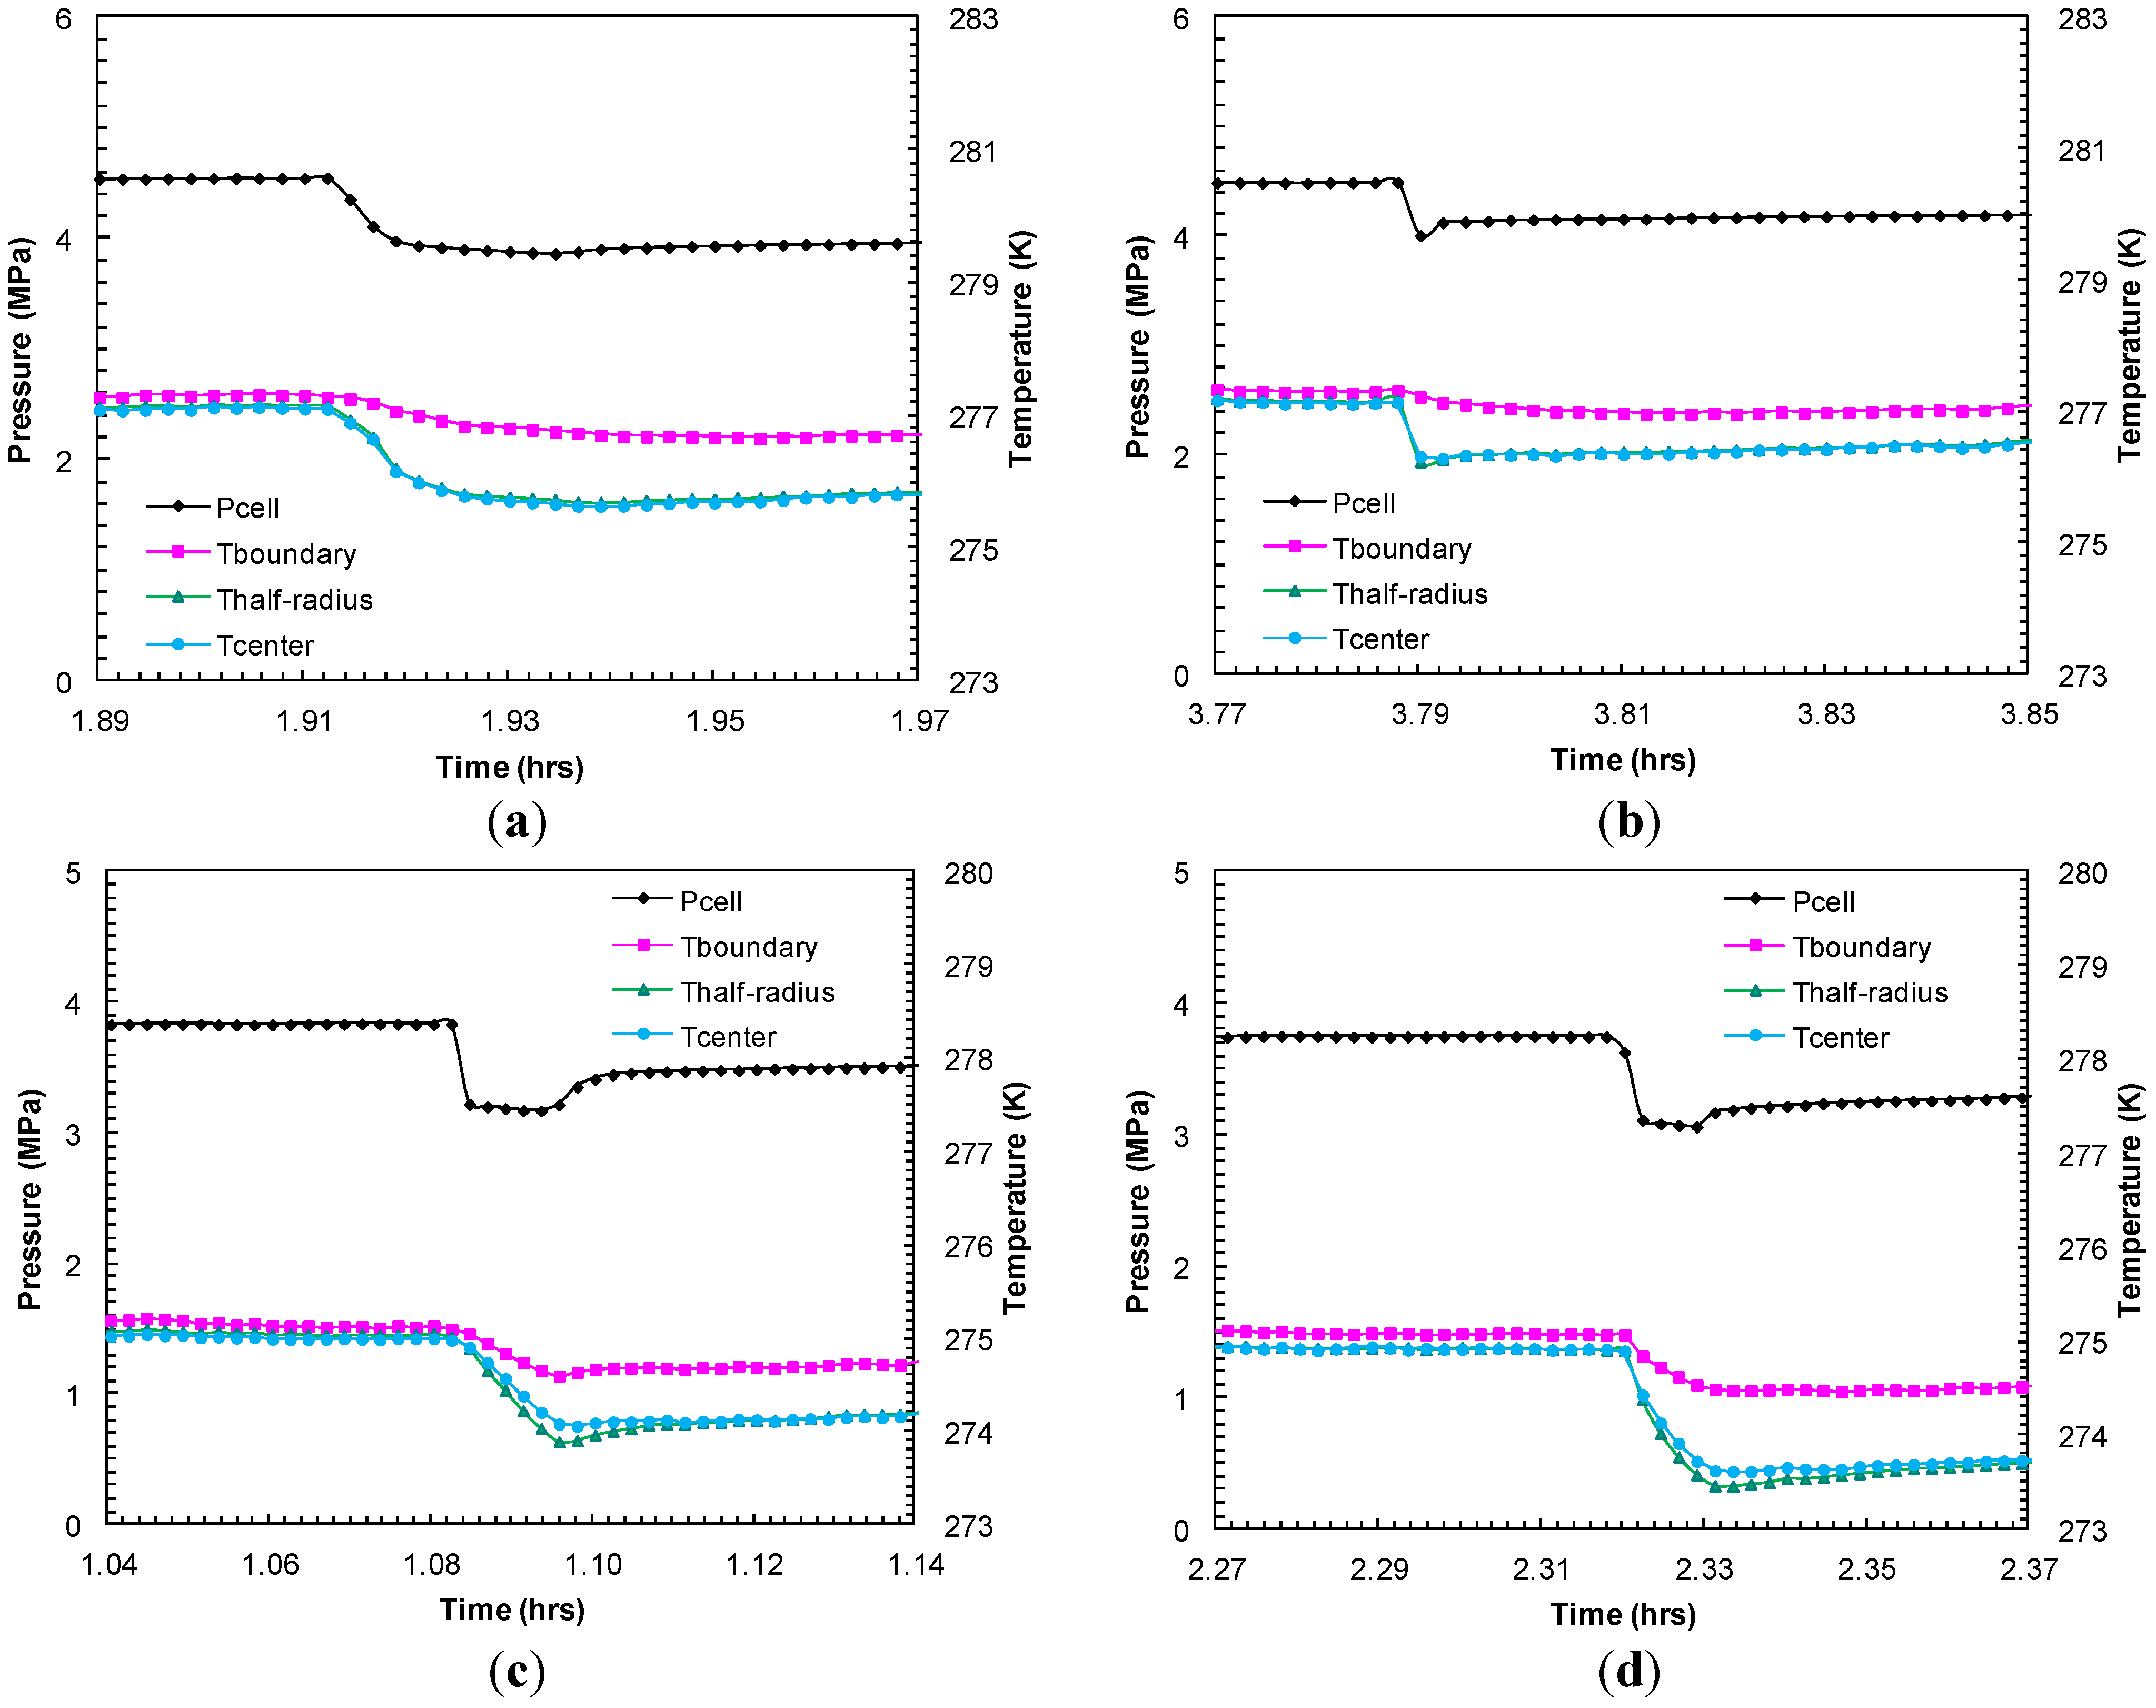
Figure 9 compares the thermocouple responses during short-lived dissociations at similar pressure drops from Experiments 2 and 4 in order to examine the preferential hydrate dissociation due to depressurization. The endothermic effect due to hydrate dissociation was recorded with a higher degree of cooling at the center than at the half-radius and the boundary of the sand-pack. Although the degree of cooling at the sand-pack boundary could be controlled by heat transfer between the core holder and the surrounding water bath maintained at a constant temperature, a higher degree of cooling observed at the center of the sand-pack may be due to hydrates predominantly formed within/dissociated from the interior part of the sand-pack. However, as expected, during thermally induced dissociation, the sand-pack boundary warmed at a faster rate than the sand-pack interior.
Figure 8.
(
a,
c,
e) Cell
P-
T against time during dissociation with sequences of pressure drop and thermally induced dissociation in Experiments 4–6; (
b,
d,
f) Post-depressurization equilibrium pressure against temperature measured at the center of the sand-pack in Experiments 4–6. Each dataset corresponds to
P-
T conditions during thermally induced dissociations. Equilibrium conditions of methane hydrates-seawater were obtained from Duan and Sun [
18].
Figure 9.
Thermocouple responses at various locations within sand-pack (center, half radius, sand-pack boundary) during dissociation with successive pressure drops: (a) dp2 = 0.69 MPa; and (b) dp3 = 0.92 MPa from Experiment 2; (c) dp2 = 0.66 MPa; and (d) dp3 = 0.68 MPa from Experiment 4.
Figure 9.
Thermocouple responses at various locations within sand-pack (center, half radius, sand-pack boundary) during dissociation with successive pressure drops: (a) dp2 = 0.69 MPa; and (b) dp3 = 0.92 MPa from Experiment 2; (c) dp2 = 0.66 MPa; and (d) dp3 = 0.68 MPa from Experiment 4.
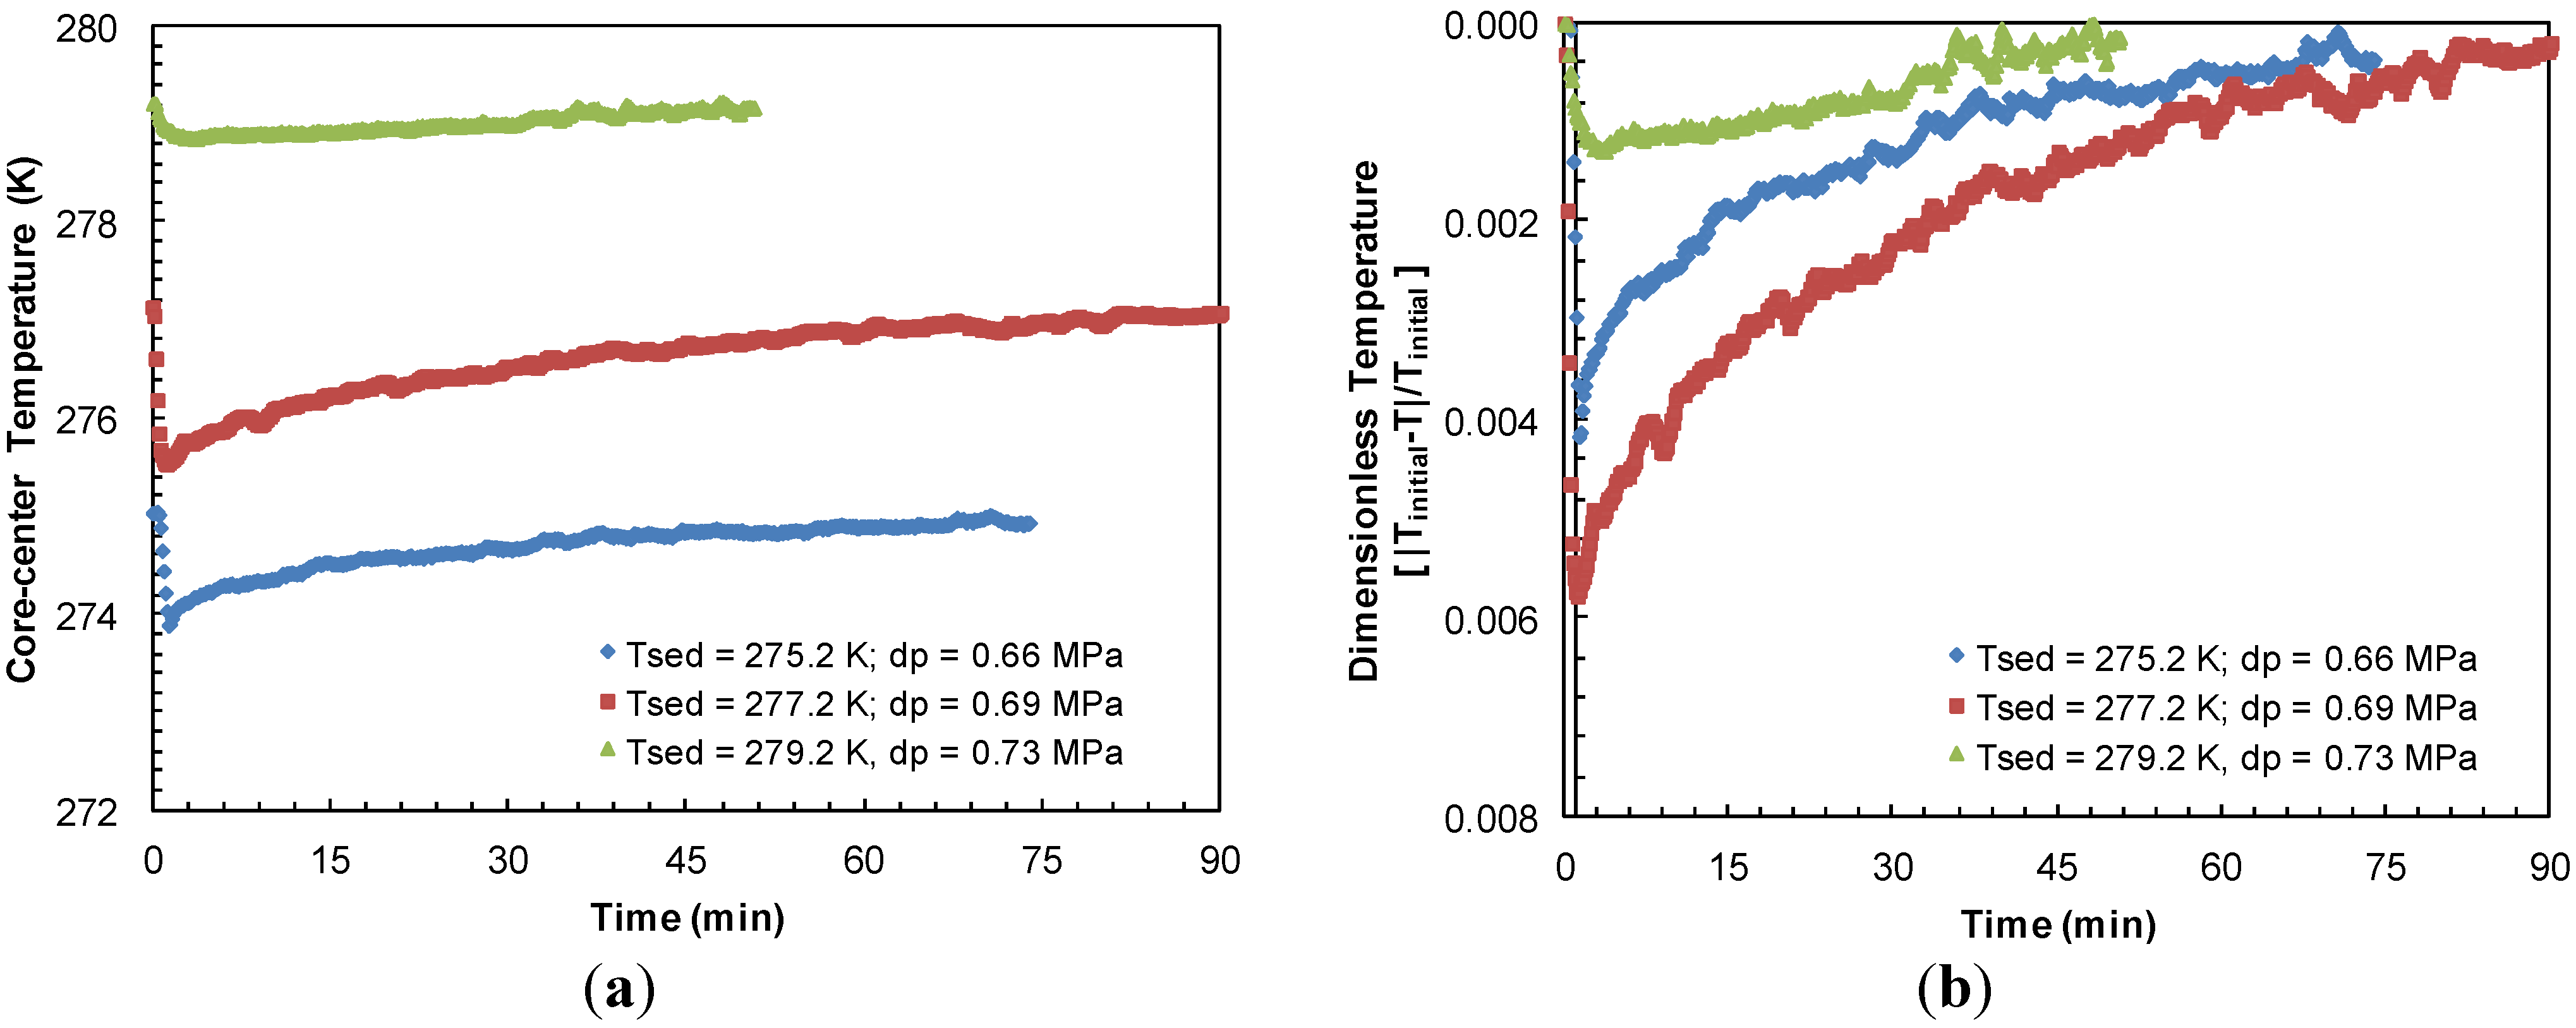
The data from Experiments 1–3 show that higher pressure drops during the dissociation of hydrates at a constant sediment temperature (277.2 K) caused a larger degree of sediment-cooling. The higher degree of sediment cooling obviously requires a longer time for sediments to reach to the bath temperature. However, the degree of cooling of the sediment was also found to be dependent upon the sediment temperature (Experiments 3–5) for a constant pressure drop.
Figure 10a compares the sediment cooling and subsequent time for warm-up to the bath temperature from Experiments 3–5 at similar pressure drops. The highest endothermic effect due to hydrate dissociation was observed when sediment temperature dropped to a low of 273.9 K at the center of sand-pack due to a pressure drop of 0.66 MPa below the equilibrium pressure at 275.2 K.
Figure 10b depicts the sediment sub-cooling data from
Figure 10a on a relative dimensionless scale against time. It appears that a lower sediment temperature causes a higher degree of cooling upon hydrate dissociation and in turn, it takes longer for the system to warm-up to its initial value.
Figure 10.
(a) Thermocouple response at half-radius of the sand-pack during dissociation with similar pressure drops below hydrate equilibrium pressure at sediment temperatures of 275.2, 277.2 and 279.2 K in Experiments 4, 3 and 5, respectively; (b) Dimensionless sediment temperature change [|Initial-T|/Initial] against time for similar pressure drops for dissociation from sediments at 275.2, 277.2, and 279.2 K. Experiments 3–5 were performed at a constant confining pressure of 10.44 MPa.

