1. Introduction
Global warming is attributed to the greenhouse effect caused by increasing greenhouse gases, particularly carbon dioxide. For sustainable human development, the emission of greenhouse gases must be diminished; instead of fossil energy, renewable energy should be developed. Electricity generation from large, fossil fuel-based thermal power plants should first be reduced. A suitable alternative is to gradually increase electricity generation from clean and renewable distributed generation (DG) technologies, which are interconnected with distribution systems. Such technologies reduce the emission of CO
2 and other special gases, improve operating efficiency, and eliminate the need to expand the transmission systems of existing power systems. Because of these benefits, DG development has become a popular trend. It is expected that lots of distributed energy resources (DERs), such as DG and distributed storage (DS) systems will interconnected with traditional electrical power distribution systems in the near future. According to Chen [
1], DERs with rated capacities between 1 MW and 25 MW are usually interconnected with the bus bar of the secondary side of HV/MV distribution transformers. DERs with rated capacities between 100 kW and 1 MW are commonly interconnected with primary distribution systems, and DERs with rated capacities of less than 100 kW are commonly interconnected with secondary distribution systems. In the current work, we focused on the optimal dispatch in microgrids (MGs) with various types of DG, whose capacities are between 100 kW and 2 MW. The DG systems are interconnected with primary distribution systems. In distribution systems with DERs, sophisticated techniques are required for steady state and transient operating conditions. Given that the planning, operation, and control of existing systems are affected by DG penetration, only the optimal control and dispatch strategies for the DG systems improve the performance of power distribution systems. To consider DG penetration, IEEE Std 1547-2003 [
2] and IEC 61400-21 [
3] provide technical specifications and requirements for interconnections to ensure the security and stability of existing power systems. The DG penetration levels of existing systems improve yearly because of sufficiently mature technological development and research. A MG is the part of a distribution system that includes DERs and controllable/uncontrollable loads with a single point of common coupling (PCC) [
4,
5]. The MG can be operated in grid-tied and autonomous modes. The use of MGs is the new development trend in power systems; hence, investigating the structure of the system, related operating control technology, and scheduling management is necessary.
Optimal dispatch problems are one of the key factors that affect operation cost and keep constant voltage and frequency in MGs operation. Yu
et al. [
6] proposed the economic benefit model, which consists of reduction of peak shaving cost, generation benefit of DGs, reduction of the network loss and the benefit of energy storage systems, for the operation optimization of an active distribution network. Kim
et al. [
7] proposed a multi-agent system for autonomous operation of the islanded MG in a power market environment. Liu
et al. [
8] used an inexact mix-integer two-stage programming model for the management of low-carbon energy systems. Jin
et al. [
9] suggested some strategies for sustainable development of energy management systems (EMSs) in western China. Chen
et al. [
10] presented a smart EMS to optimize the operation of the MG. Mohamed
et al. [
11] used a mesh adaptive direct search method (DSM) for online optimal management of the MG. Chung
et al. [
12] presented power control methods which used the particle swarm optimization algorithm and gain-scheduling method, to coordinate multiple MG generators for both grid-connected and autonomous modes. Kuo
et al. [
13] designed multi-agent systems for real-time intelligent control in MGs. The related researches mentioned above have advantages and disadvantages on their proposed algorithms and approaches and have been verified in different cases and systems. The direct search algorithms use only function values and require only a numerical value without any knowledge of the internal structure of a problem. The first time that the phrase “direct search” was used in a paper was by Hooke and Jeeves in 1961 [
14]. DSM is easily adapted to nonlinear, non-convex, non-differentiable, or disconnected problems, making it highly suitable for solving the optimal dispatch problem in MGs with various DG types that are composed of different operation cost functions. Based on the optimization techniques mentioned above, this paper proposes a simple and efficient DSM for solving optimal dispatch problem with five the types of DG into several existing primary distribution feeders to create a medium-voltage MG. We simulated the optimal dispatch of DG, considering the minimization of fuel costs under grid-tied and autonomous conditions. In the remainder of this paper, the proposed MG is discussed in
Section 2. The optimal dispatch problem of the MG is described in
Section 3. The numerical results are discussed in
Section 4.
Section 5 concludes the paper.
3. Description of the Optimal Dispatch Problem
Many algorithms and techniques, such as mesh adaptive direct search, sequential quadratic programming, genetic algorithms, and game theory, have been used to solve the optimal dispatch problems of power systems. In general, the search algorithm can be divided into direct and indirect search algorithms, where the direct search algorithm only considers objective function, it is also called non-gradient or zeroth order method; however, the indirect search algorithm must consider partial derivatives of objective function, it is also called decent method. Furthermore, some of the direct search algorithms for solving nonlinear optimization are random search method, grid search method, pattern method, Rosen Brock’s method, and simplex method,
etc. References [
11,
22] had demonstrated the feasibility of direct search algorithm. This paper proposes the DSM, which is based on the simplex method to solve the optimal dispatch problem of a medium-voltage MG. The concept of the proposed DSM is according to the unit with minimum incremental cost (
ICmin) is chosen to increase its output without violating the upper and lower power generation limits, until the power balance. On the contrary, the maximum incremental cost (
ICmax) is chosen to decrease its output, until the power balance. It can be expressed as:
subject to:
where
ICi is the incremental cost of unit
i; Δ
Pi denotes the predetermined computing step. Let Δ
Pi approaches zero in Equation (7), Equation (7) can be represented as:
It is easy to explain the incremental cost with respect to power changes in Equation (8). In this paper, a simplex method that chooses the minimum IC values to compute the new vertices and moves towards the optimum point iteratively is used to perform the DSM. Furthermore, the basic principle of the proposed algorithm comes from the combinations of the conventional Lagrangian Relaxation method and dynamic programming method. Therefore, the proposed method has no restrictions on the cost functions of DG, which included distributed generators and power purchased/sold from power grid in MG, and performs a direct search of solution space. This algorithm begins with an initial feasible solution and search for the optimal solution along a feasible path at all time. Units in MG without violating the upper or lower limits are to increase or decrease their generations by a predetermined step ΔP for computing their incremental cost and decrement cost. Consequently, it overcomes the lambda-iteration method suffering from the oscillatory problem in various generation unit systems. Besides, the advantage of DSM is to handle several inequality constrains without introducing any multipliers, and it also can solve the derivatives unavailable problems or more complicated cost functions.
In this paper, the power output limits of the DG units of the medium-voltage MG can be derived after studying the power output models of renewable DG, the cost functions of non-renewable DG, the objective function that considers fuel cost minimization, and the constraints of power balance.
The objective function for the optimal dispatch problem at time
t can be expressed as follows:
subject to:
and:
where
Ci(
t) is the cost function of
i-th DGs at time
t;
denotes the power generation of
i-th DGs at time
t; and
PD(
t) represents the total load demand of the MG at time
t. Additionally,
CPurchased(
t) is the electricity purchased cost at time
t;
CSold(
t) is the electricity sold cost at time
t;
PPurchased(
t) represents the power purchased from the upper utility power grid;
Ploss(
t) represents the system power loss; and
PSold(
t) represents the power sold to the utility power grid. Besides,
is the lower generation limit of
i-th DGs;
represents the upper generation limit of
i-th DGs;
Vi,min and
Vi,max are the lower and upper limits of bus voltage, respectively. The setting values of
Vi,min and
Vi,max are 0.975 p.u. and 1.025 p.u. In addition to,
Ii,max represents the maximum ampere capacity of the conductor, and the maximum normal operating current of the 477 cross-linked polyethylene wire (XPW) conductor is 300 A in Taipower.
In this paper, the implicit Z
BUS Gauss method [
23] was used for solving the three-phase power flow. The implicit Z
BUS Gauss method is based on the principle of superposition applied to the bus voltages along the feeders. The voltage on each bus can be considered to be contributed from two different types of sources: the specified incoming bus voltage of distribution substation and current injection which is generated by the DGs, loads, capacitors and reactors. After running the power flow program, the bus voltage, current flows in each line section, and power loss were calculated. These numerical values were used to exam the constraints of the proposed approach. The specific parameters of the MG for solving power flow are listed in
Table 1.
Table 1.
Parameters of the circuit components. PV: photovoltaic; and XPW: cross-linked polyethylene wire.
Table 1.
Parameters of the circuit components. PV: photovoltaic; and XPW: cross-linked polyethylene wire.
| Components | Parameter | Value |
|---|
| Equivalent source of the power grid | Short-circuit capacity | 8129 MVA |
| X/R | 34 |
| Main transformer (delta-grounded Y connection) | Rated capacity | 25 MVA |
| Per-unit impedance, X/R | 8%, 16.32 |
| Rated voltage | 161 kV/11.4 kV |
| Interconnected transformer (grounded Y-grounded Y connection) of fuel cell generation system and wind turbine generator | Rated capacity | 1500 kVA |
| Per-unit impedance, X/R | 6%, 7 |
| Rated voltage | 11.4 kV/0.48 kV |
| Interconnected transformer (grounded Y-grounded Y connection) of gas turbine and diesel engine generators | Rated capacity | 2000 kVA |
| Per-unit impedance, X/R | 4.9%, 10 |
| Rated voltage | 11.4 kV/0.48 kV |
| Interconnected transformer (grounded Y-grounded Y connection) of PV generation system | Rated capacity | 500 kVA |
| Per-unit impedance, X/R | 9.6%, 7 |
| Rated voltage | 11.4 kV/0.48 kV |
| Primary feeder (477 XPW) | Line impedance | 0.131 + j0.364 Ω/km |
The following steps can organize the procedure of the proposed DSM:
- Step 1
Input data: system topology, load demand, maximum demand contract, purchased/sold electricity cost, cost function of DGs, and generation limits of DGs.
- Step 2
Set up the computation step ∆P, and compute the initial values of the IC for each DG using Equations (4), (6) and (8).
- Step 3
Read the power demand PD, and calculate the summation of minimum output for each DG and minimum purchased electricity from upstream power grid (only under grid-tied operation conditions), and run the power flow program to check the constraints, then calculate the mismatch of power balance (ε) using Equation (10), if it is power balance, then stop the iteration procedure, and go to Step 7.
- Step 4
If ε is negative, it means the power demand is greater than the power output, so the DG without violating the upper limits is chosen to increase its output by computation step ∆P (the upstream power grid is included in grid-tied mode). Compute new value of IC for the dispatched DG, and run power flow program to check the constraints and calculate ε, if it is power balance, then it is convergence, and go to Step 7.
- Step 5
If ε is positive, it means the power demand is less than power output, the DG without violating the lower limits is chosen to decrease its output by computation step ∆P (the upstream power grid is included in grid-tied mode). Restore the previous value of IC for the dispatched DG, and run power flow program to check the constraints and calculate ε, if it is power balance, then it is convergence, and go to Step 7.
- Step 6
Calculate the output of each DG and the total cost CT using Equation (9).
- Step 7
Stop calculations and output hourly optimal dispatch results.
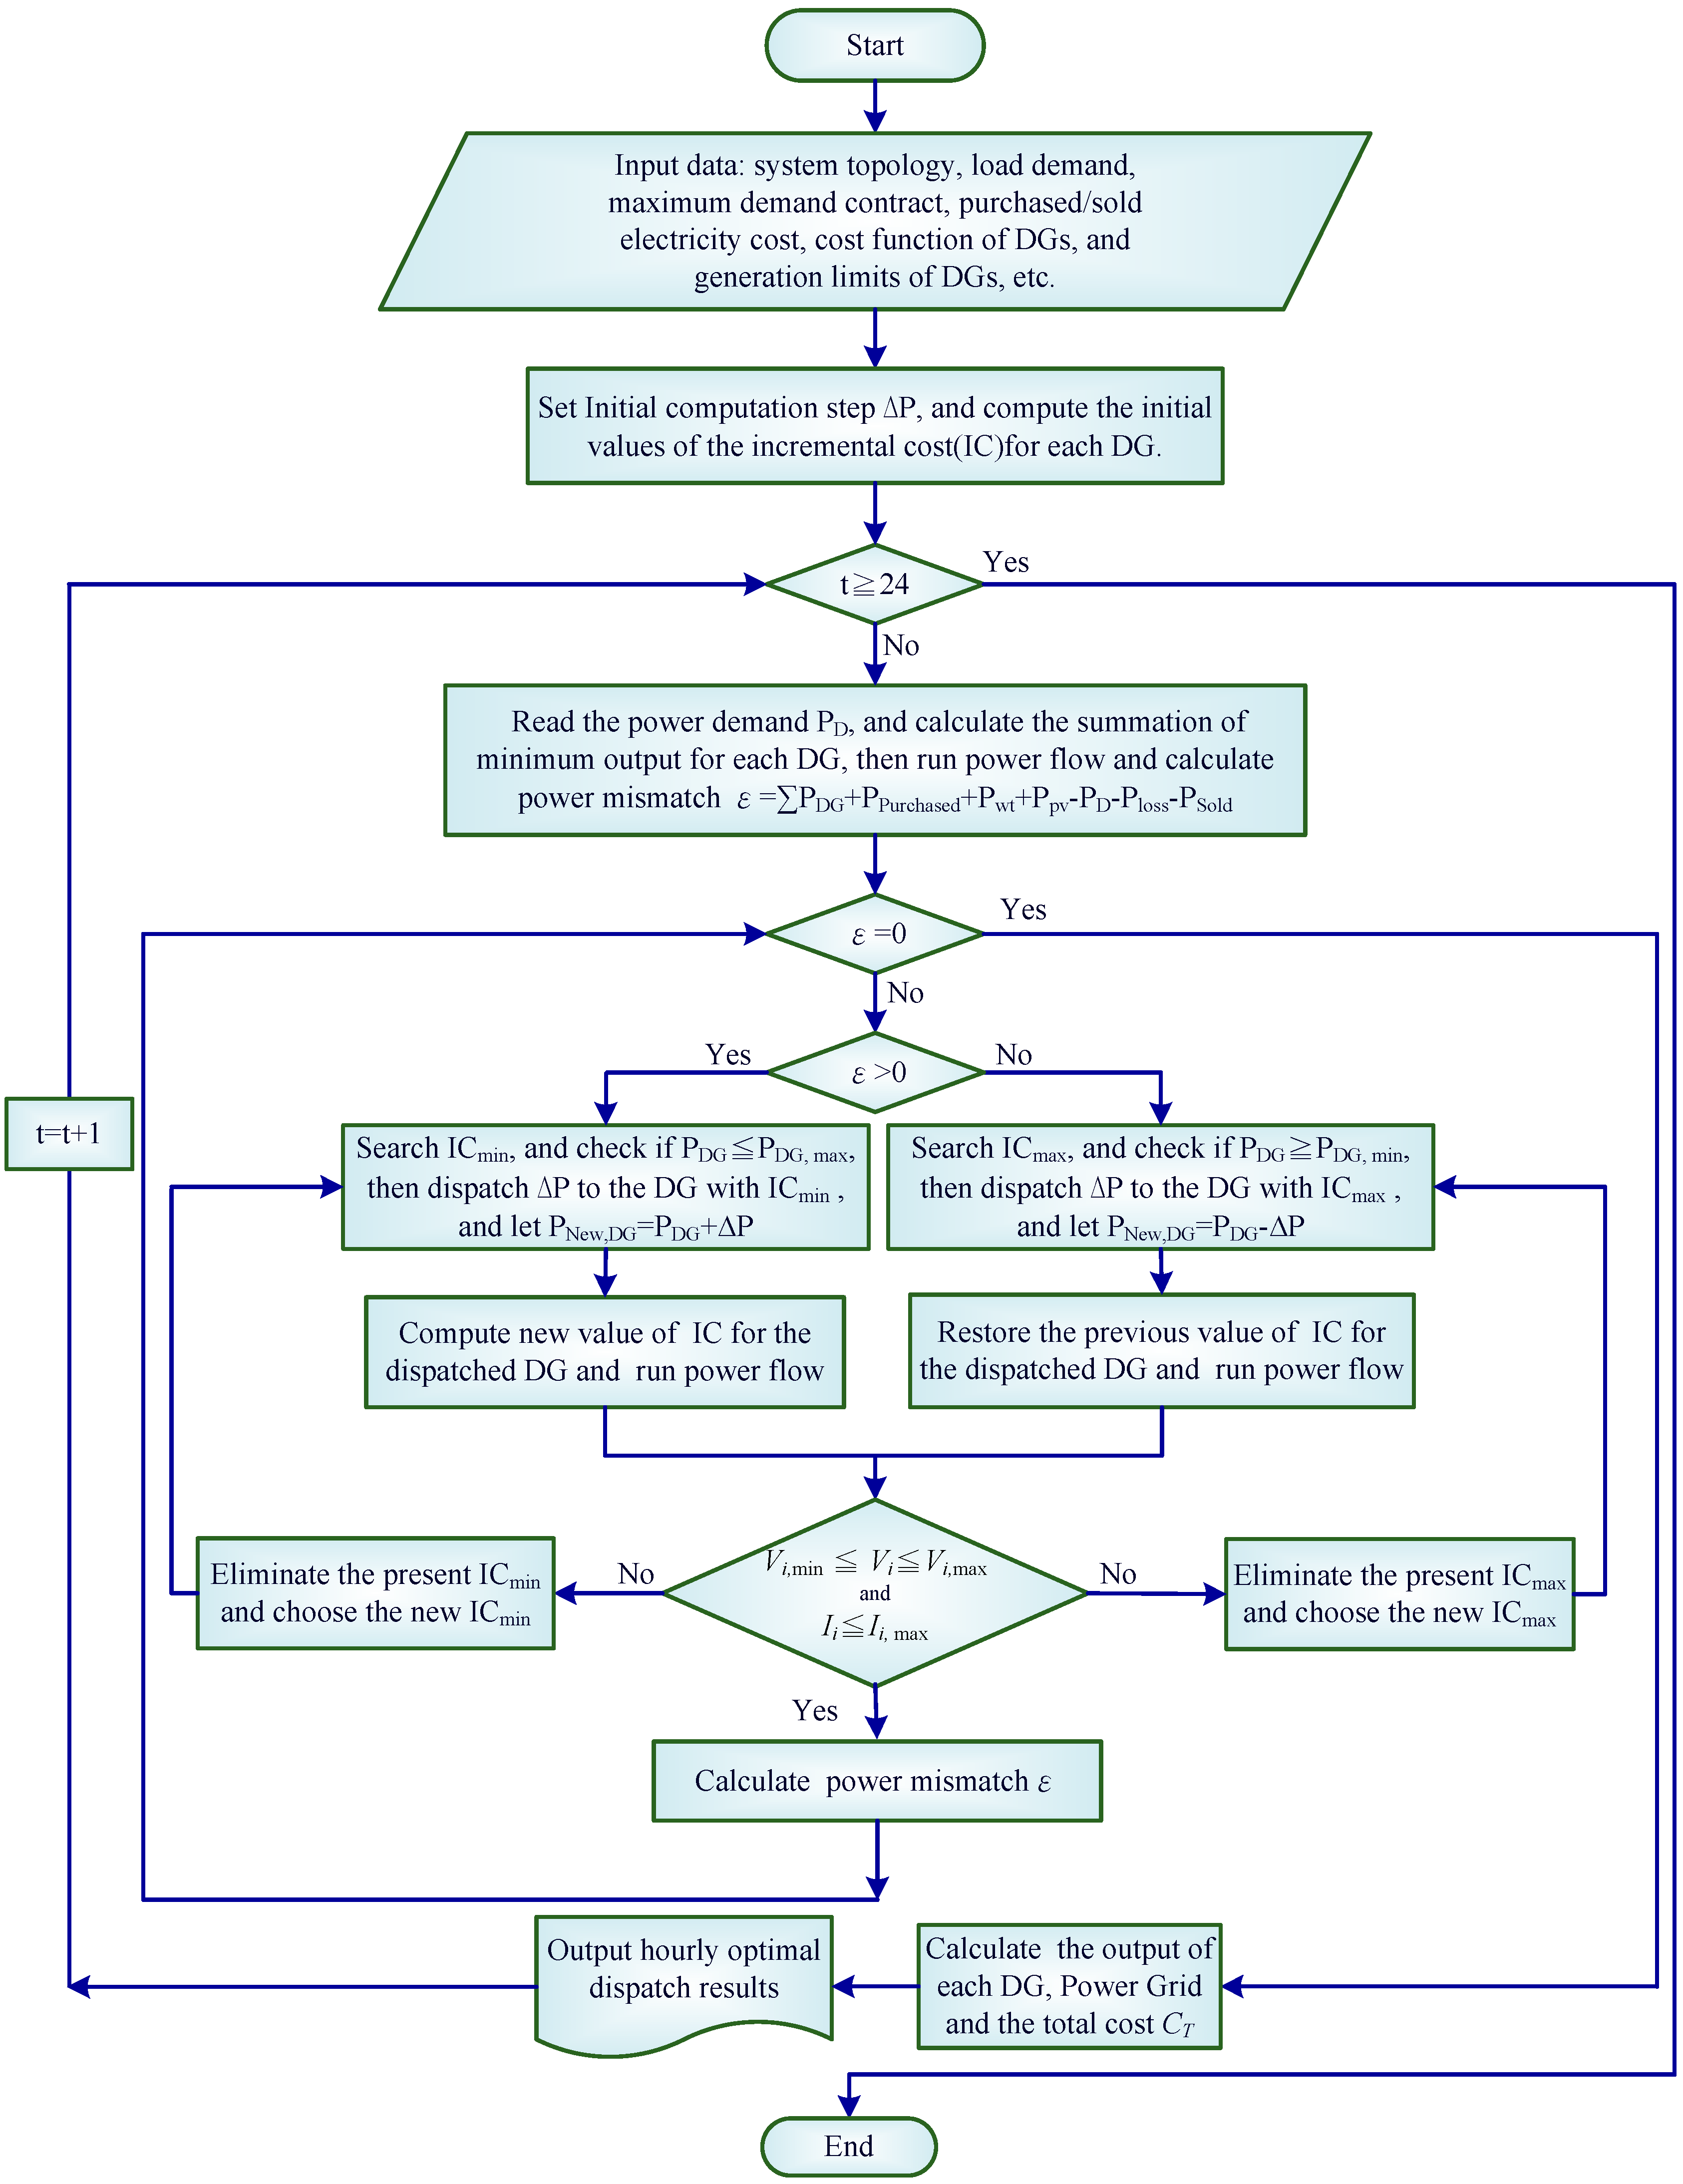
As stated above, the flow chart of the proposed DSM for hourly dispatch can be illustrated in
Figure 6. In this paper, it is an hourly dispatch problem, but the proposed approach is not limit to hourly dispatch problem, in which it is dependent on the input data, such as the generations of renewable units and load demands.
Figure 6.
Flow chart of the proposed direct search method (DSM).
Figure 6.
Flow chart of the proposed direct search method (DSM).
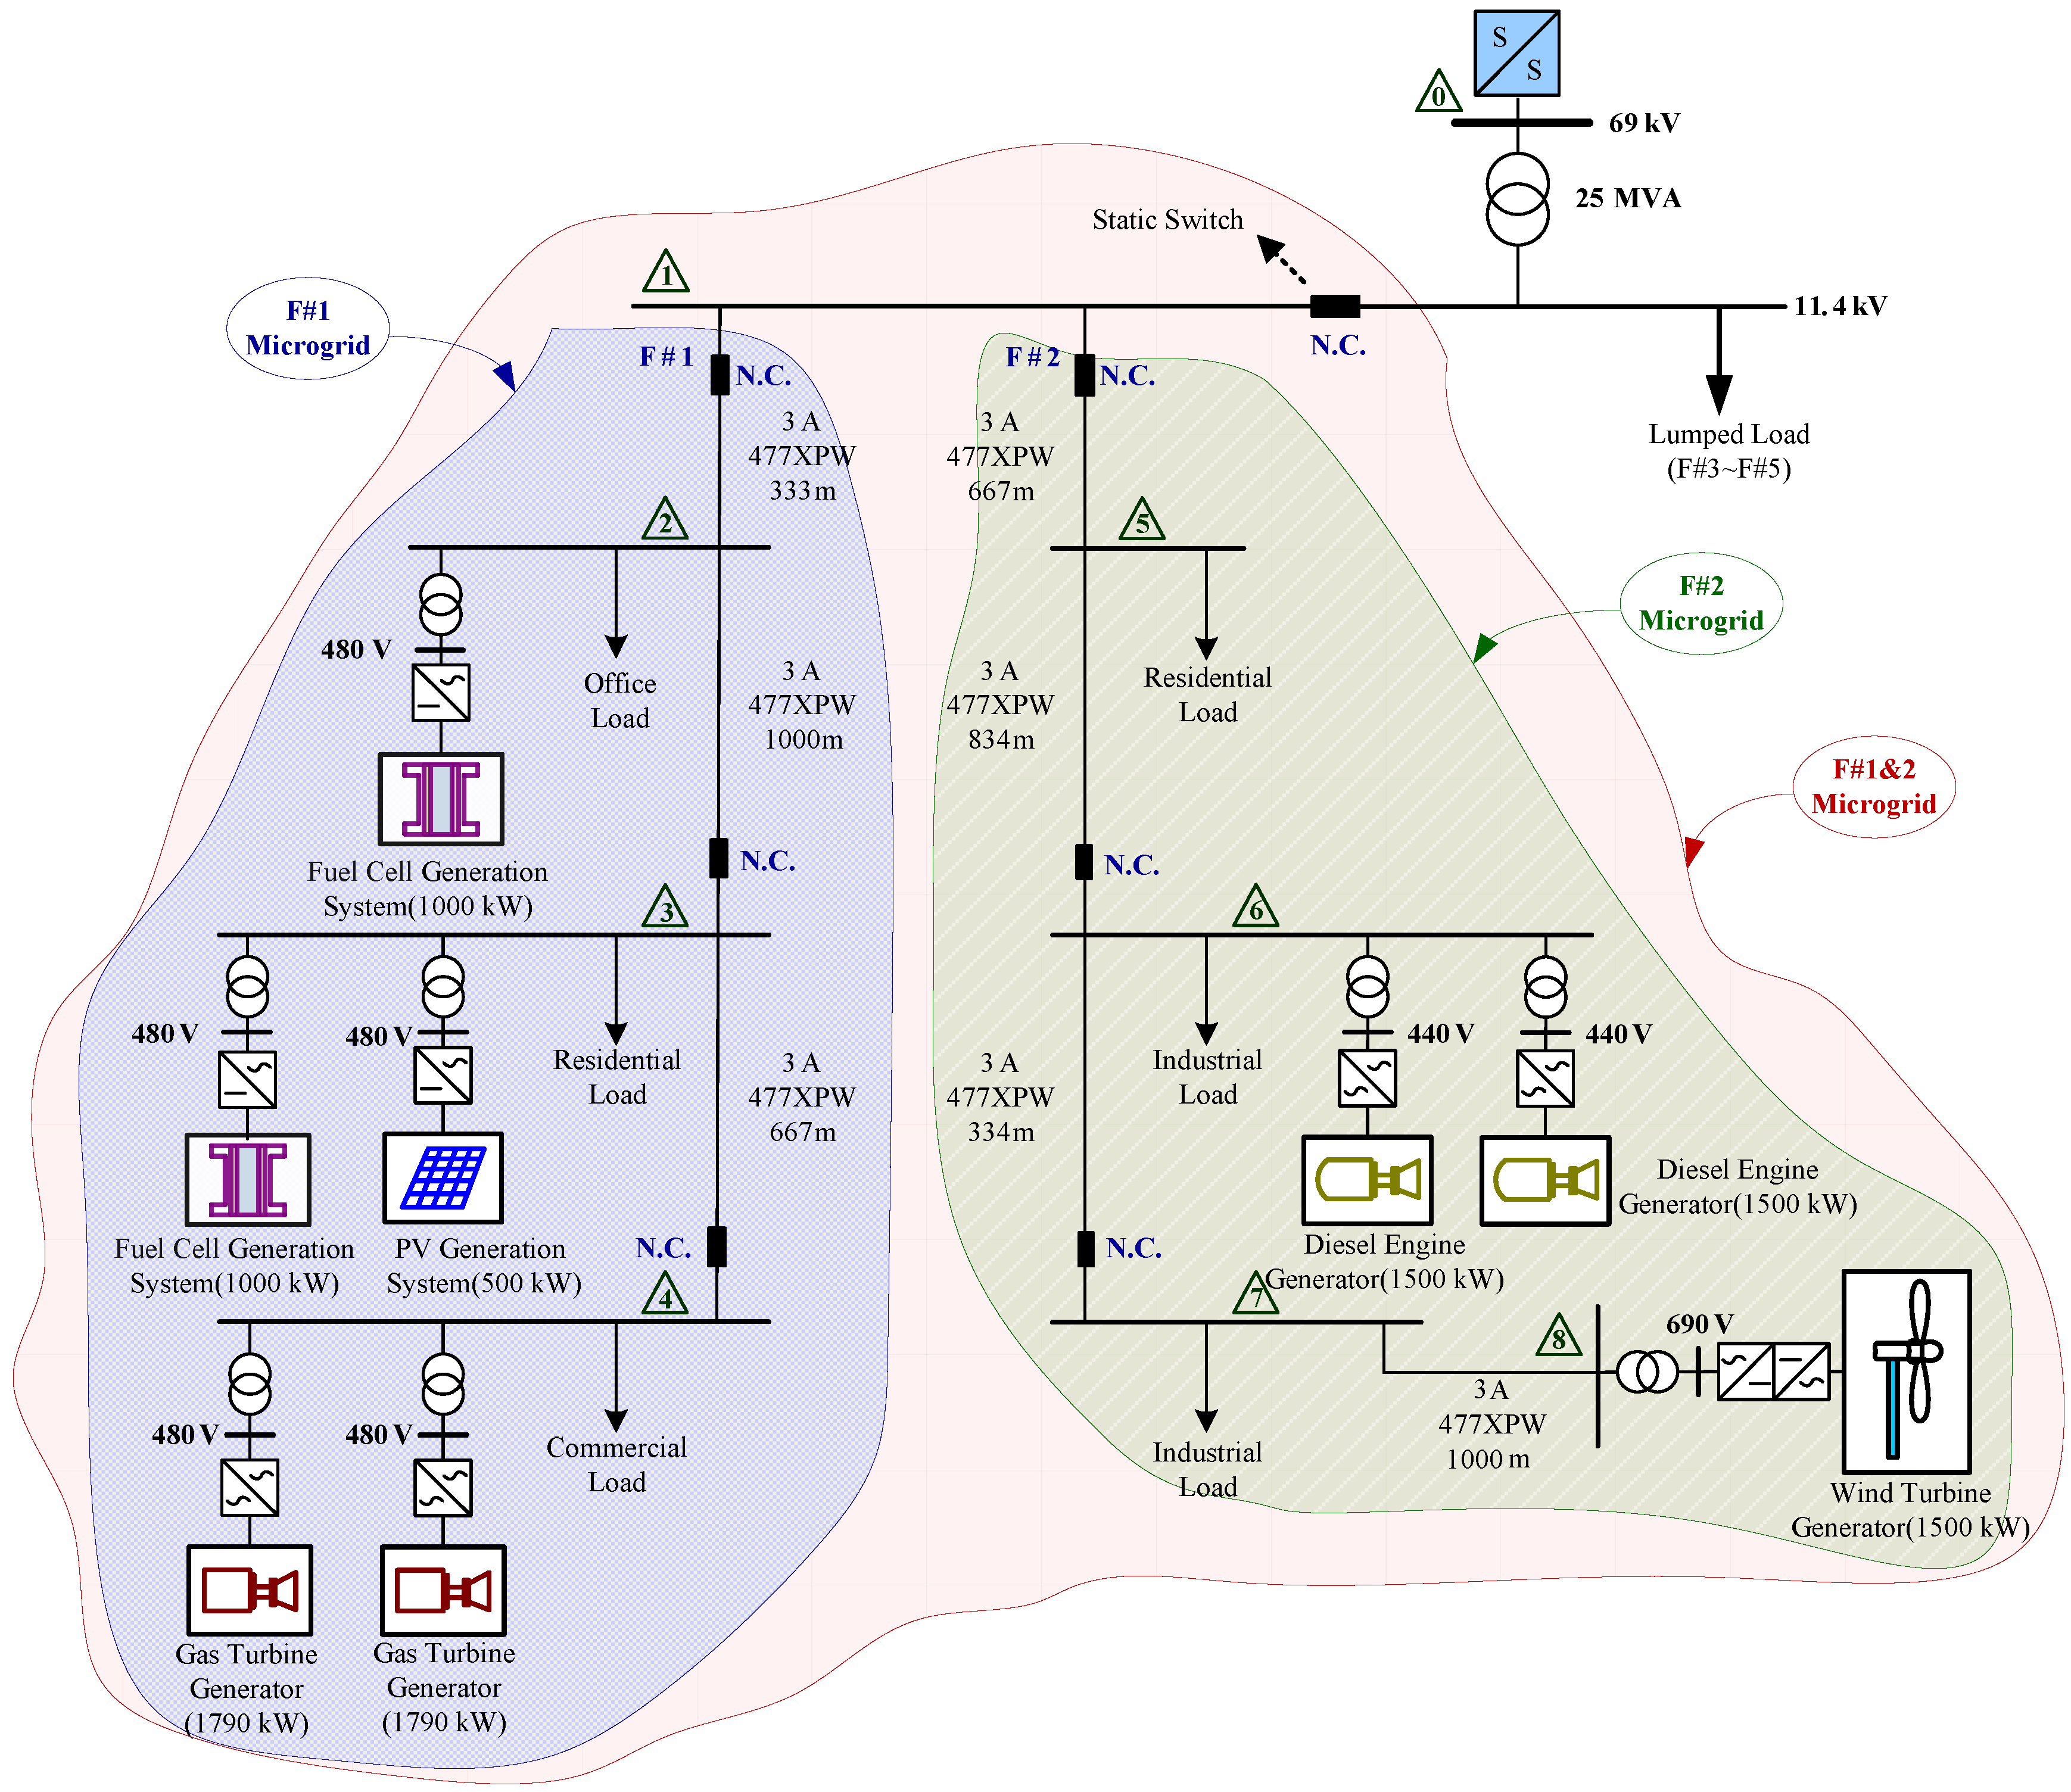
In using the DSM in solving the optimal dispatch problem of a medium-voltage MG, the F#1&2 MG (
Figure 1) is chosen as the sample system. The correlative detailed data are first incorporated; this data include correct weather forecasting, load data, and generation data. The parameters of each DG are listed in
Table 2.
Table 2.
Parameters of the DGs.
Table 2.
Parameters of the DGs.
| Parameters | Rated capacity (kW) | Generating cost of coefficient |
|---|
| α ($/h) | β ($/kW·h) | γ (($/kW·h)2) |
|---|
| Fuel cell generation system (FC#1, FC#2) | 1000 | 0 | 0.0848 | 0 |
| Diesel engine generator (DE#1, DE#2) | 1500 | 0.3312 | 0.0156 | 0.0002484 |
| Gas turbine generator (GT#1, GT#2) | 1790 | 0.4969 | 0.0116 | 0.0001987 |
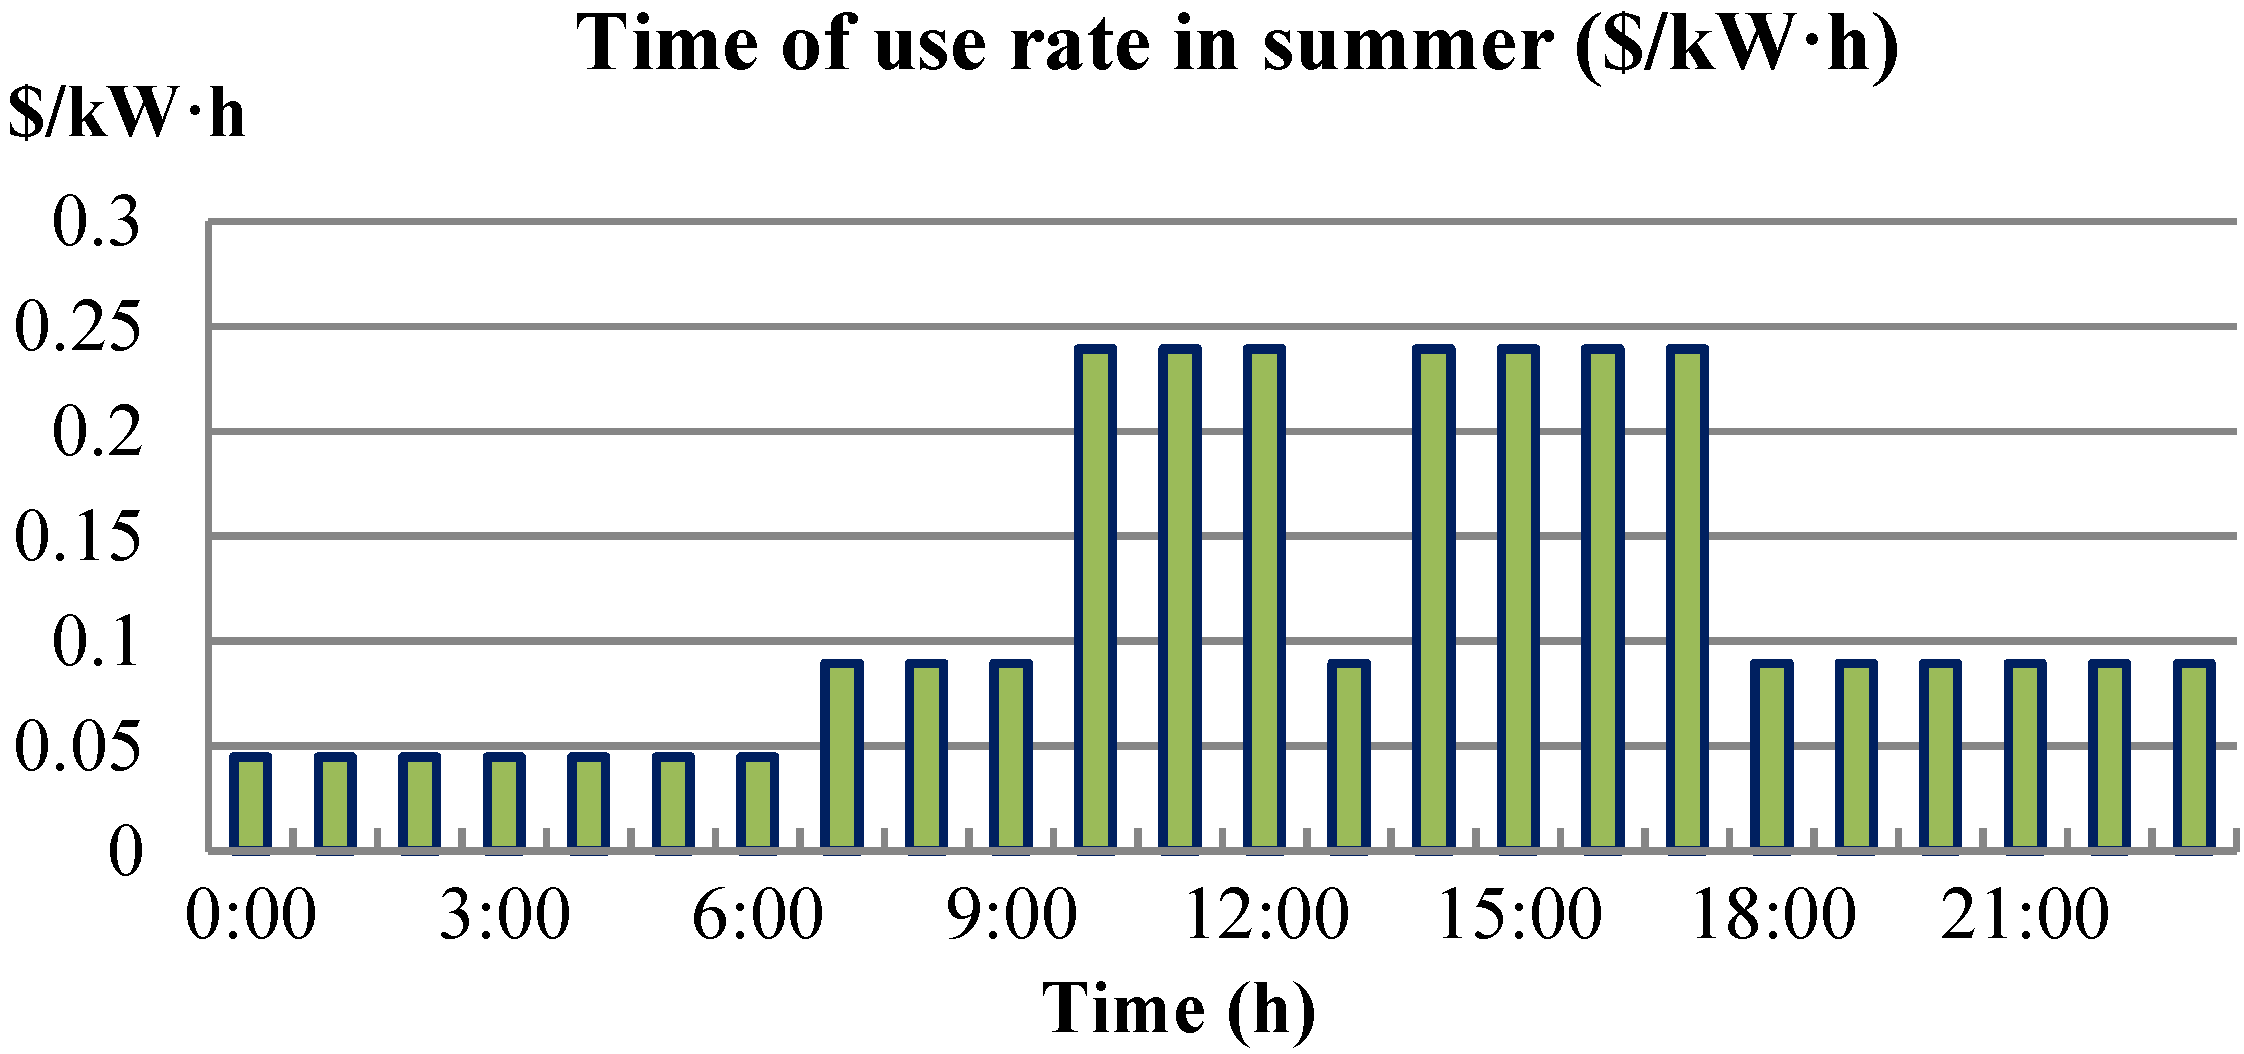
The purchased/sold electricity cost of the F#1&2 MG are depicted in
Figure 7. The purchased/sold electricity cost includes peak-load (0.2392 $USD/kW·h), half-peak-load (0.0894 $USD/kW·h), and off-peak-load (0.0447 $USD/kW·h) pricing from the upstream utility power grid during the summer season.
Figure 7.
Electricity purchased/sold cost of the MG.
Figure 7.
Electricity purchased/sold cost of the MG.
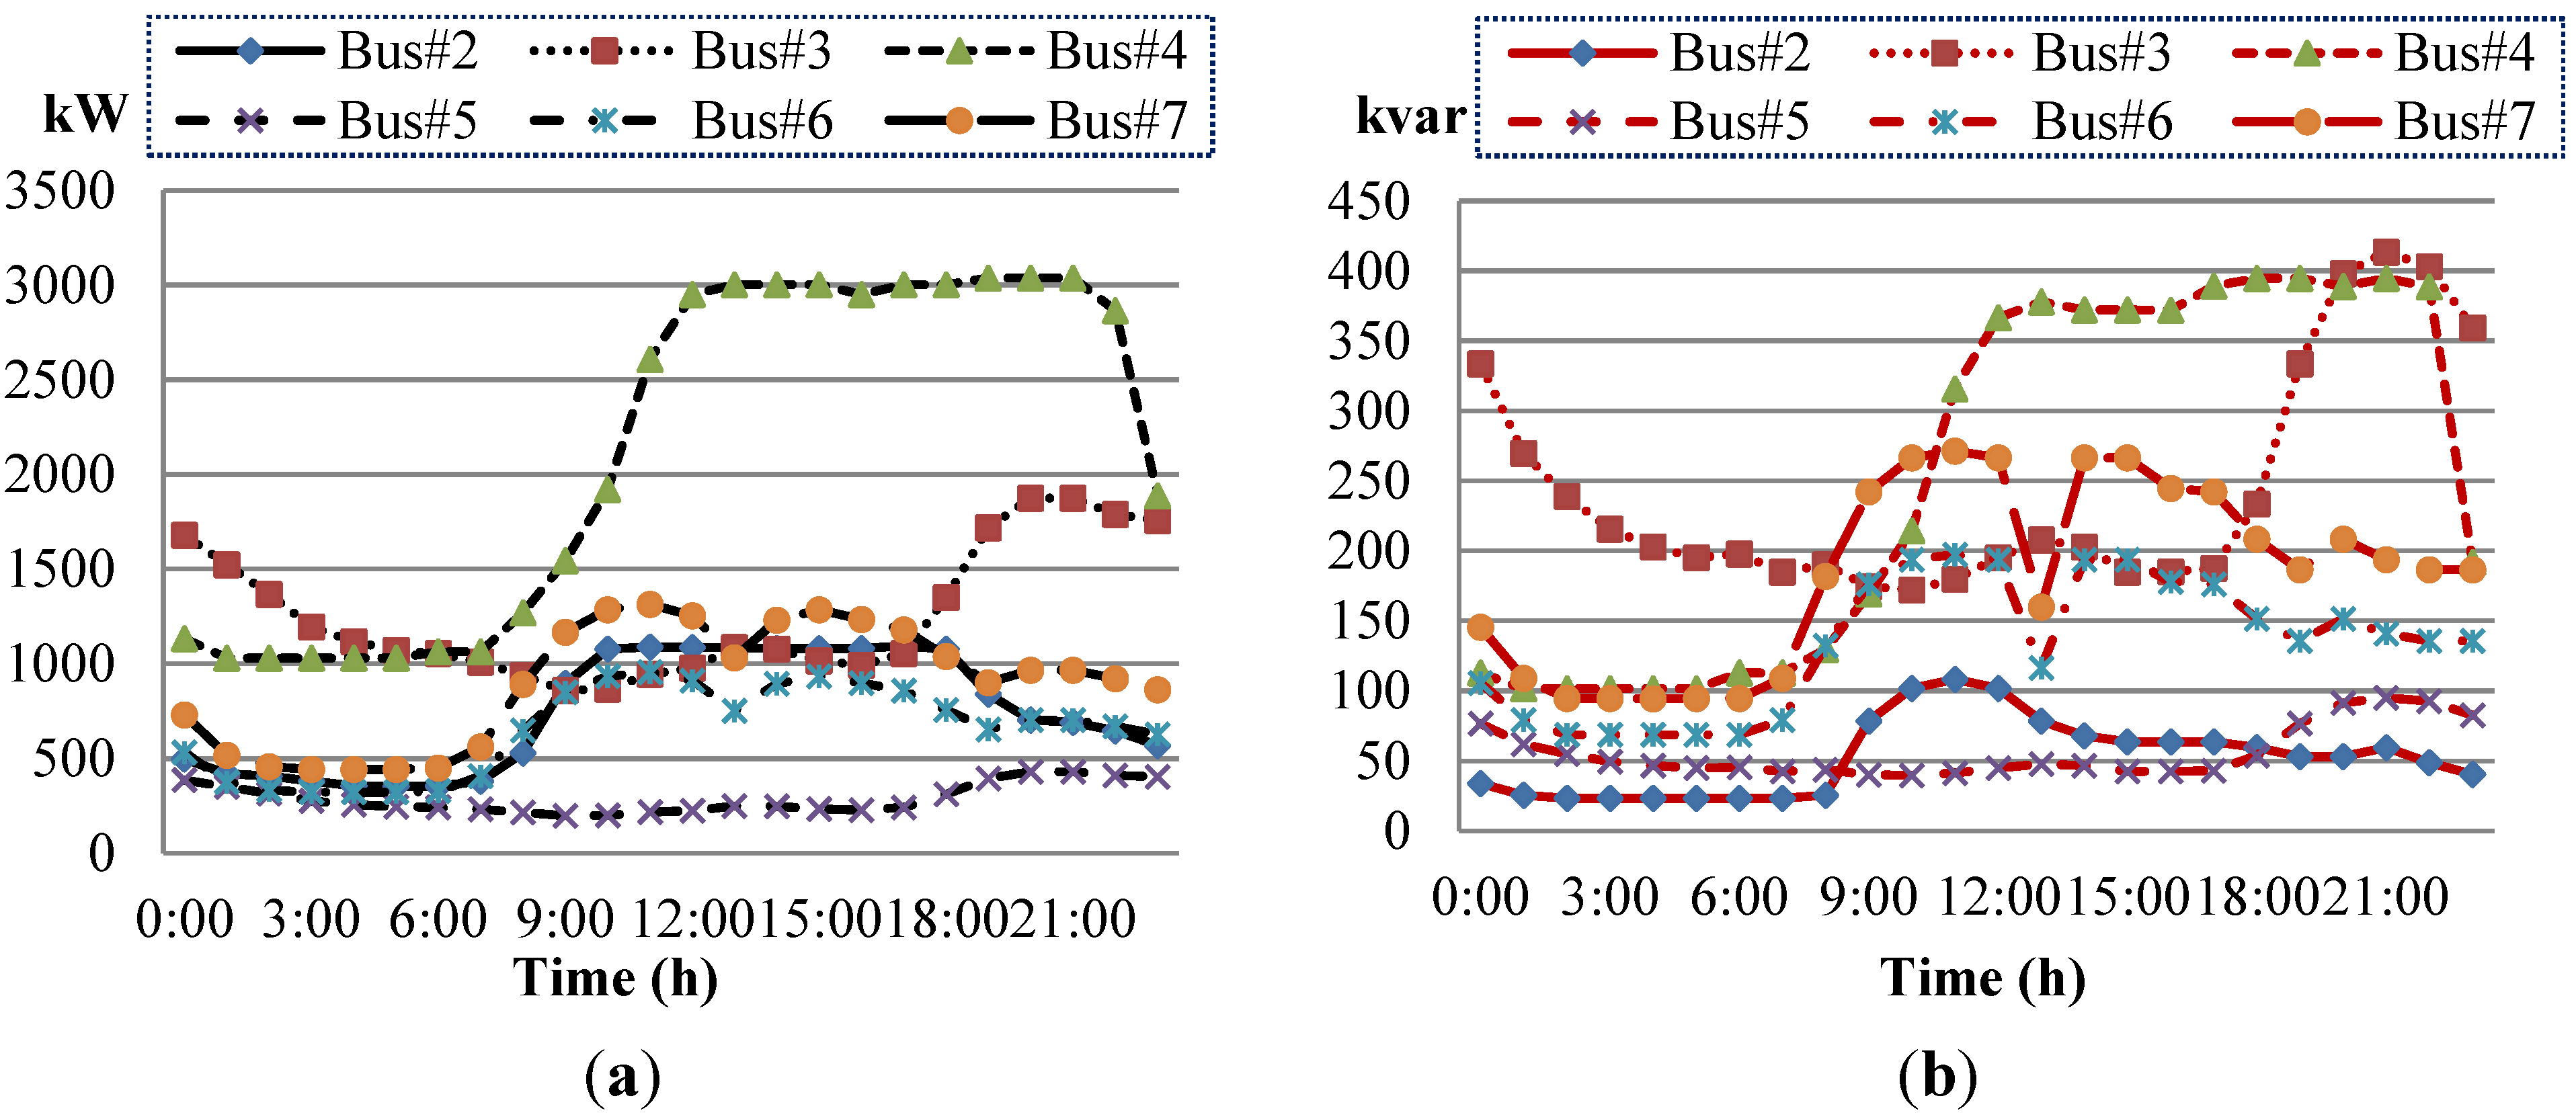
The equivalent lumped daily load demand curves for specific summer days, which correspond to different load types at each bus, are illustrated in
Figure 8. The real power generation curves of renewable energy DG can be calculated using corresponding equations, measured solar irradiation, and wind speed data (
Section 2.4.1). Computation step Δ
P, which affects iteration number, execution time, and results, is essential to the proposed DSM. We set Δ
P to l kW.
Figure 8.
Equivalent lump-load demand curve at each bus: (a) real power; and (b) reactive power.
Figure 8.
Equivalent lump-load demand curve at each bus: (a) real power; and (b) reactive power.
4. Numerical Results and Discussion
To verify the effectiveness of the proposed DSM, it was first used to evaluate the traditional economic dispatch problem of the IEEE 14-Bus and 30-Bus test systems, and the cost coefficients of the generators in this test system are shown in
Table 3.
Table 3.
The generator cost coefficient of the IEEE 14-bus and 30-bus test systems.
Table 3.
The generator cost coefficient of the IEEE 14-bus and 30-bus test systems.
| Cost coefficient | IEEE 14-bus | IEEE 30-bus |
|---|
| Bus 1 | Bus 2 | Bus 6 | Bus 1 | Bus 2 | Bus 5 | Bus 8 | Bus11 | Bus13 |
|---|
| ai | 105 | 245 | 50 | 40 | 45 | 40 | 50 | 60 | 45 |
| bi | 44 | 351 | 50 | 340 | 350 | 330 | 360 | 350 | 340 |
| ci | 40 | 389 | 50 | 40 | 50 | 45 | 40 | 45 | 45 |
The numerical results are listed in
Table 4. In order to check the convergence condition, two predetermined resolution (e.g.,
PD = 0.1 MW,
PD = 1 MW) are used to choose the fixed calculation step for every unit. The simulation results demonstrated that the
PD is sensitive to the performance of DSM. If the
PD is too large, then it may end up with divergence. On the contrary, the smaller
PD will result in more central processing unit (CPU) execution time. Based on our simulation experience, a proper predetermined resolution is about 1–10 MW in transmission system level and is about 1–10 kW in distribution system level. Besides, the generation cost is not very sensitive to
PD; in other words, the solutions are close to the optimal solution during the rough convergence level. In
Table 4, the simulation results of the proposed approach are nearly the same as those derived using the Lagrange multiplier. Thus, the developed DMS program is valid. The optimal dispatch problem of the medium-voltage MG was then solved using the DSM program.
Table 4.
Comparison of the simulation results of the Lagrange multiplier method and the DSM for the economic dispatch of the IEEE test systems. CPU: central processing unit.
Table 4.
Comparison of the simulation results of the Lagrange multiplier method and the DSM for the economic dispatch of the IEEE test systems. CPU: central processing unit.
| Method | IEEE 14-bus test system | Method | IEEE 30-bus test system |
|---|
| Lagrange multiplier | DSM | Lagrange multiplier | DSM |
|---|
| Bus 1 | 134.2 MW | 134.2 MW | Bus 1 | 73.2 MW | 73.2 MW |
| Bus 2 | 58.5 MW | 58.5 MW |
| Bus 2 | 133.1 MW | 133.1 MW | Bus 5 | 65.2 MW | 65.2 MW |
| Bus 8 | 73.0 MW | 73.0 MW |
| Bus 6 | 132.7 MW | 132.7 MW | Bus 11 | 65.0 MW | 65.0 MW |
| Bus 13 | 65.1 MW | 65.1 MW |
| Load demand | 400 MW | 400 MW | Load demand | 400 MW | 400 MW |
| Total cost | 2,798.13 $/h | 2,798.13 $/h | Total cost | 1,309.06 $/h | 1,309.06 $/h |
| CPU execution time (s) | 0.020 | 0.010 (@PD = 0.1 MW) 0.009 (@PD = 1.0 MW) | CPU execution time (s) | 0.060 | 0.050 (@PD = 0.1 MW) 0.010 (@PD = 1.0 MW) |
4.1. Optimal Dispatch under Grid-Tied Operation of the F#1&2 Microgrid
On the basis of the daily load demand curve in
Figure 8 and the maximum available power generation of the renewable energy DG, we show the numerical results of the optimal dispatch under the grid-tied operation of the F#1&2 MG in
Figure 9,
Figure 10,
Figure 11 and
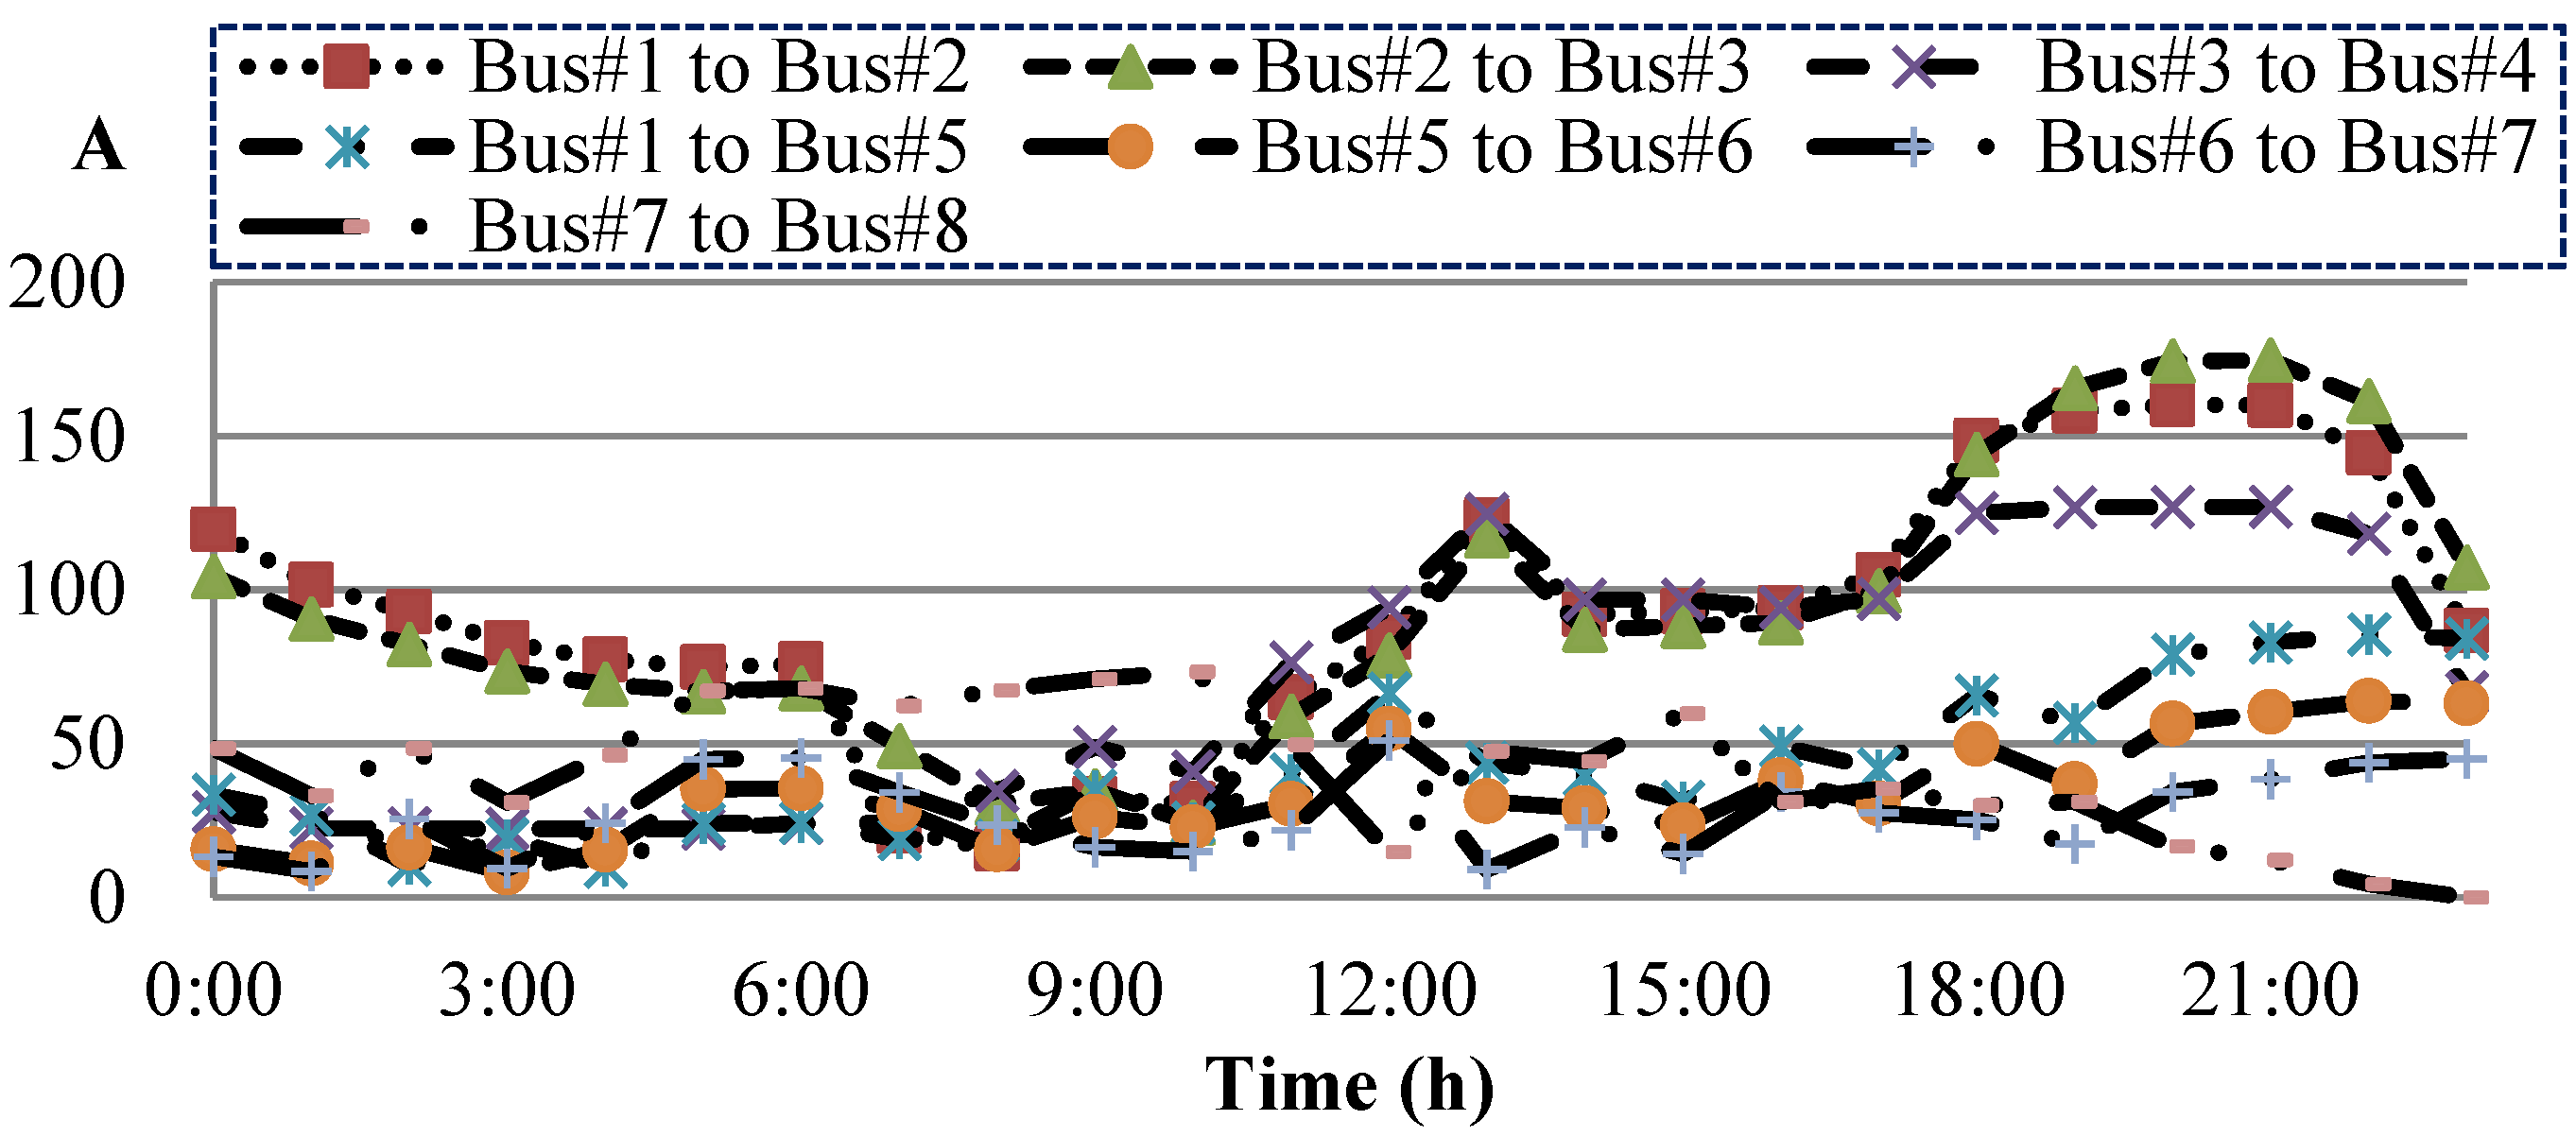
Figure 12, respectively. As shown in
Figure 9 and
Figure 10, the numerical results demonstrate that the bus voltage and current flow do not violate the constraints.
Figure 9.
Numerical results of bus voltage under grid-tied operation.
Figure 9.
Numerical results of bus voltage under grid-tied operation.
Figure 10.
Numerical results of current flow under grid-tied operation.
Figure 10.
Numerical results of current flow under grid-tied operation.
Figure 11 illustrates the optimal power generation of the utility power grid and DG units under various 24-h load demands.
Figure 11.
Numerical results for the optimal generation of each DG and utility power grid under grid-tied operation.
Figure 11.
Numerical results for the optimal generation of each DG and utility power grid under grid-tied operation.
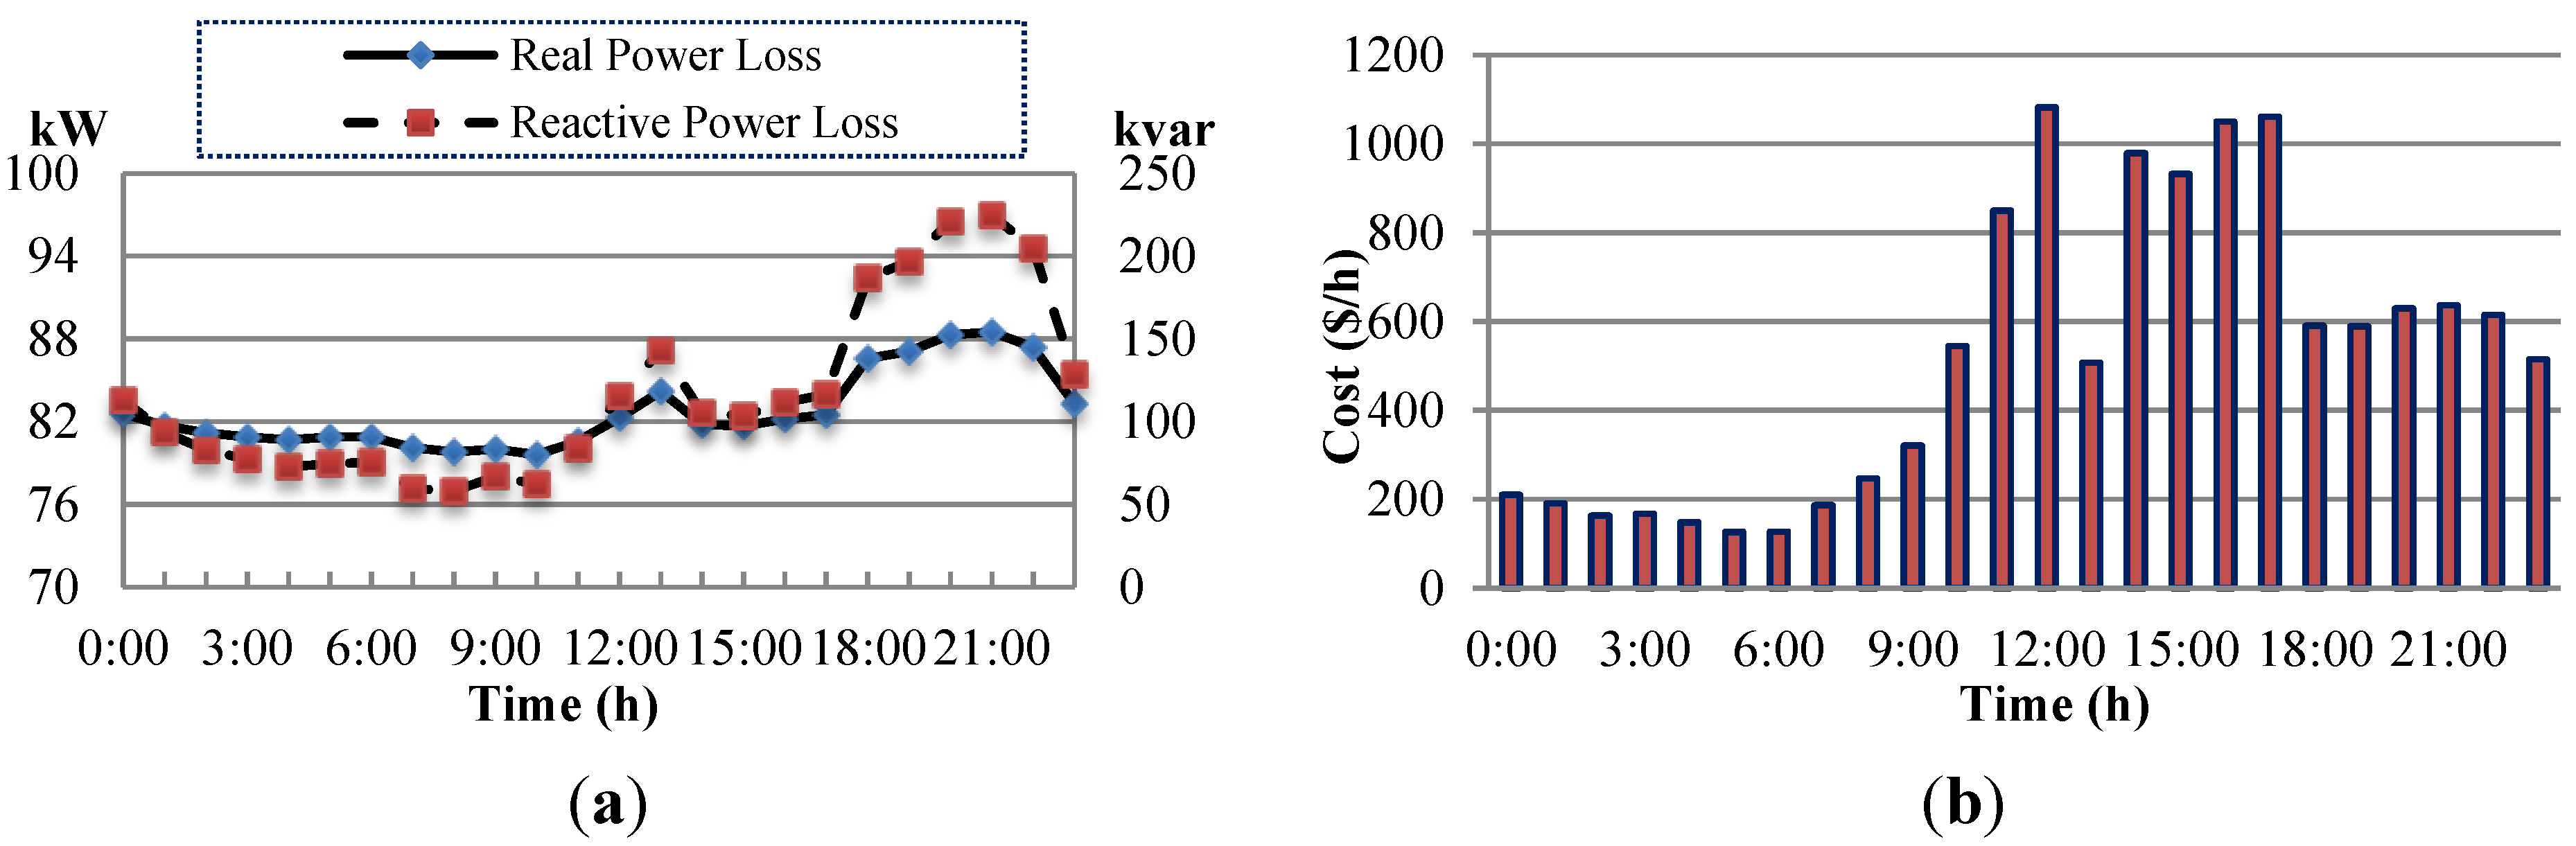
The power losses and total generation cost of the F#1&2 MG are shown in
Figure 12. Overall, because the electricity purchase cost from the utility power grid pertains primarily to the duration of high-voltage use in summer, the equivalent electricity purchased cost per kW·h is relatively lower than that of non-renewable energy DG. Consequently, the power output from the utility power grid is greater than those from the other DG units, except the non-fuel cost, renewable energy units. Therefore, the power generation of each unit is inversely proportional to its corresponding incremental cost; that is, as the DG incremental cost decreases, the power generated by the DG increases. Moreover, the computing time of the proposed DSM at
PD equals 1 kW is about 0.42 s.
Figure 12.
Numerical results of (a) power losses and (b) total generation cost under grid-tied operation.
Figure 12.
Numerical results of (a) power losses and (b) total generation cost under grid-tied operation.
4.2. Optimal Dispatch of the F#1&2 Microgrid under Autonomous Operation
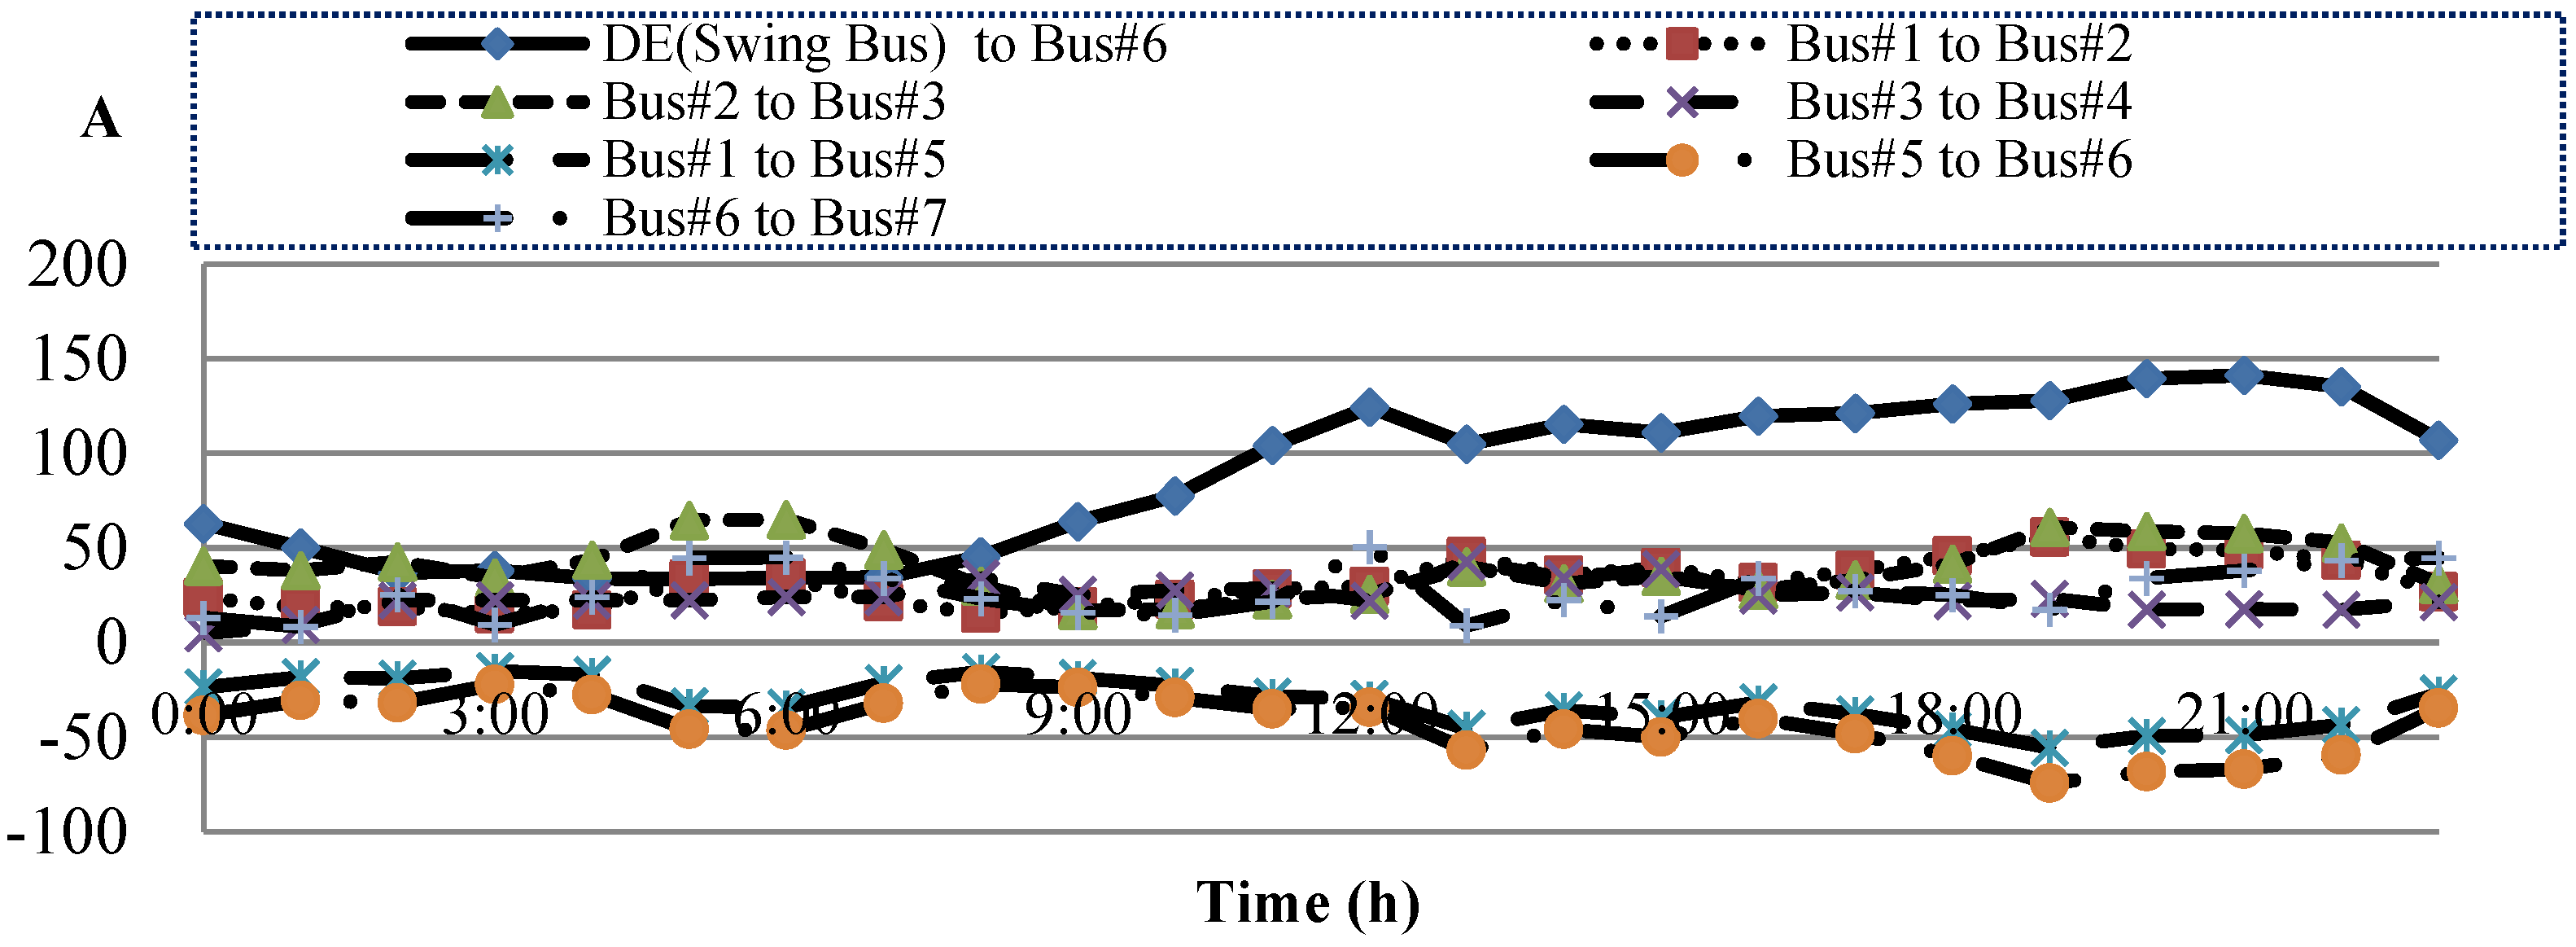
When a fault occurs in the upper power grid or during regular maintenance, the F#1&2 MG operates in autonomous mode after the static switch at the PCC is turned off. The numerical results for optimal dispatch are shown in
Figure 13,
Figure 14,
Figure 15 and
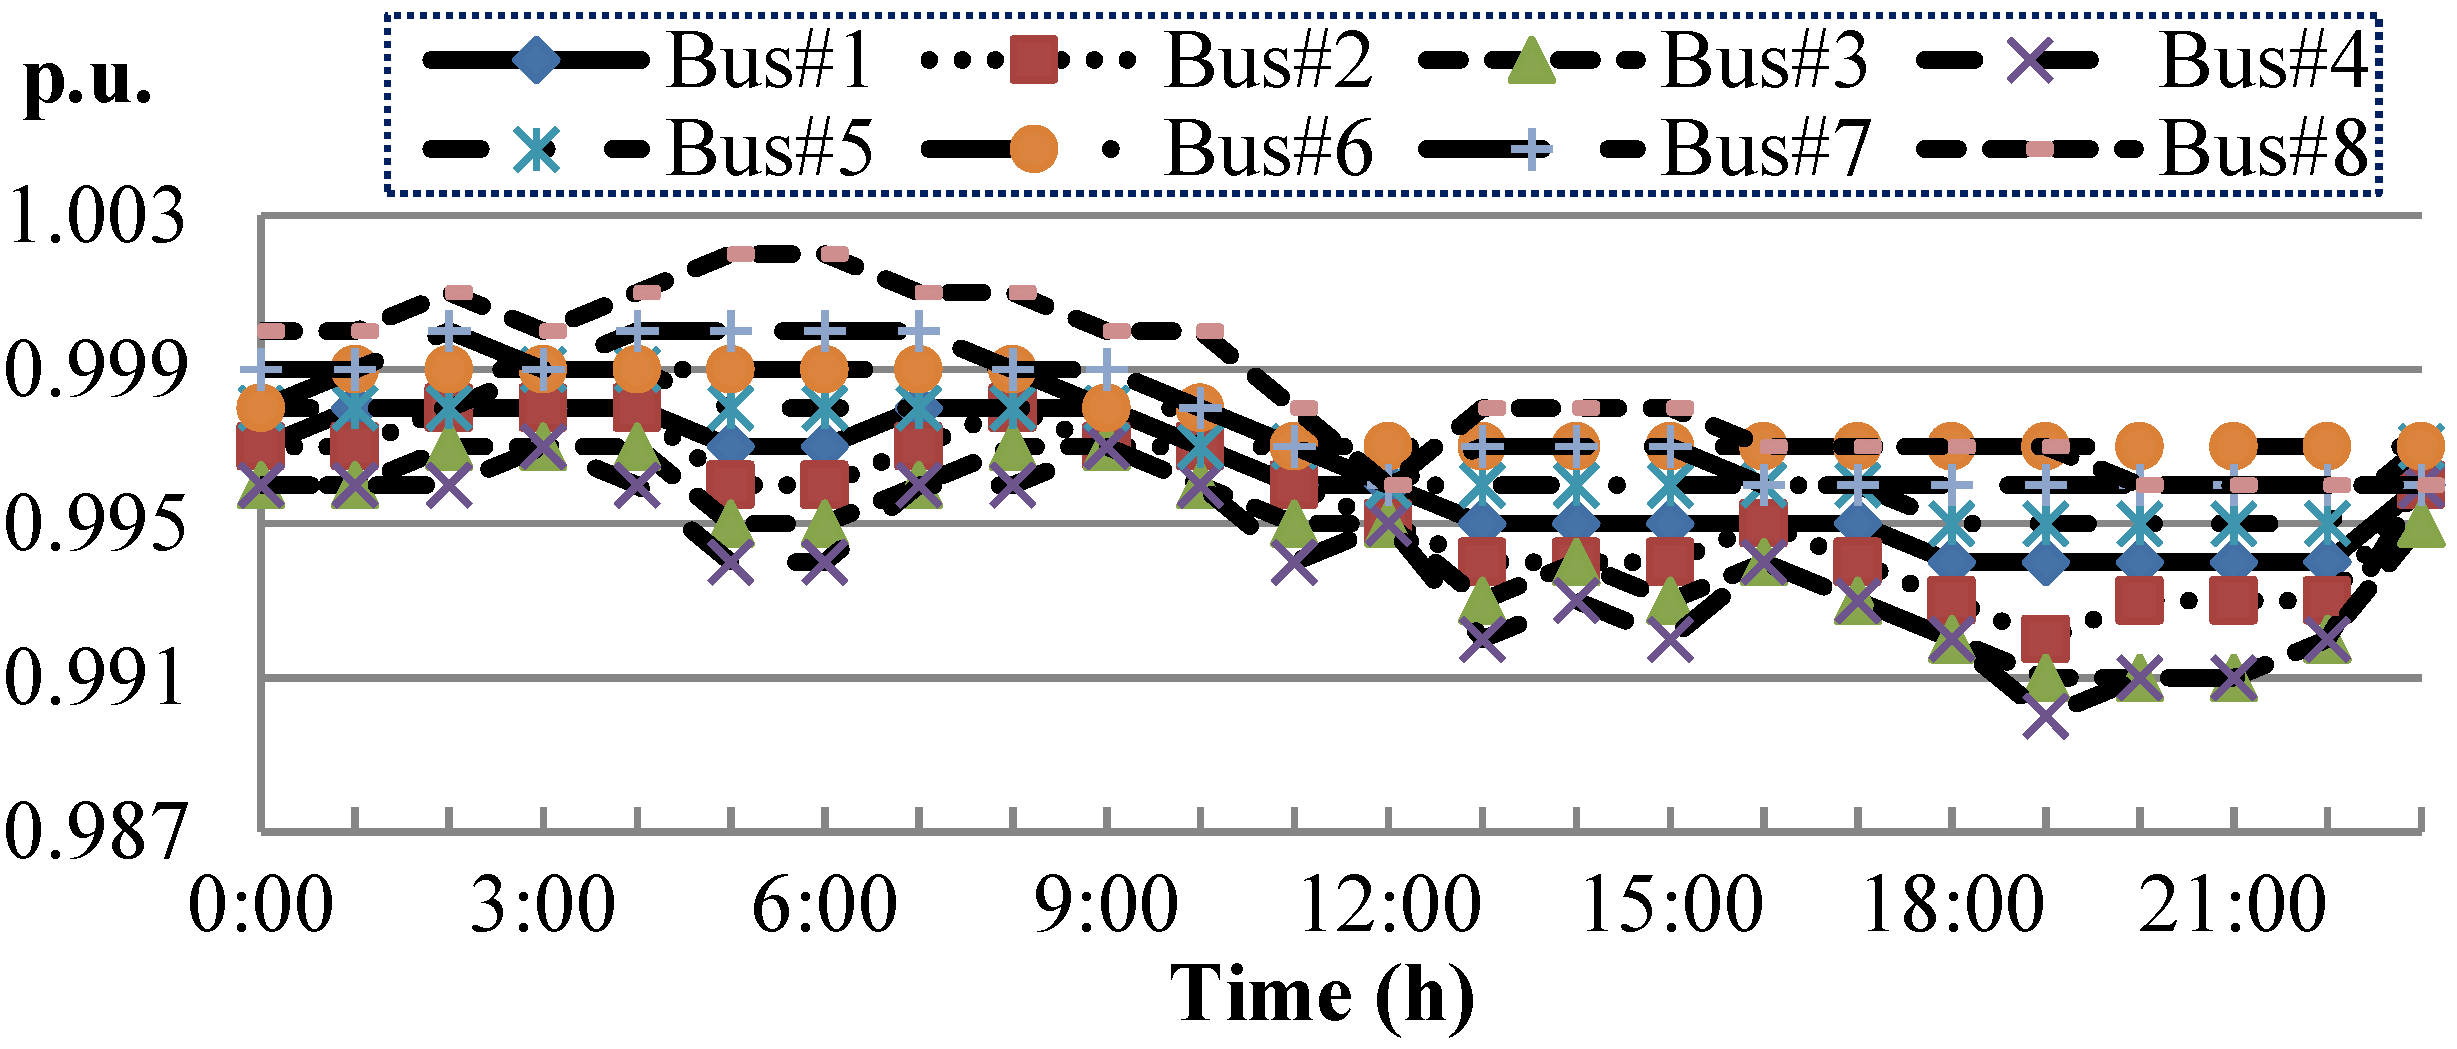
Figure 16. Because no utility power grid acts as a swing bus under this operation mode, the available power output of the DG units must be greater than the power demand of the F#1&2 MG to ensure stable system operation. System frequency and voltage magnitude are then maintained in accordance with the power balance principle. Otherwise, an optimal load shedding strategy should be used to maintain power balance, an issue that we will address in future research. The available power output of the DG units is greater than the load demand. In this paper, the diesel engine generators act as swing bus in this study. As shown in
Figure 13 and
Figure 14, the numerical results demonstrate that the bus voltage and current flow are not violate the constraints.
Figure 13.
Numerical results of bus voltage under autonomous operation.
Figure 13.
Numerical results of bus voltage under autonomous operation.
Figure 14.
Numerical results of current flow under autonomous operation.
Figure 14.
Numerical results of current flow under autonomous operation.
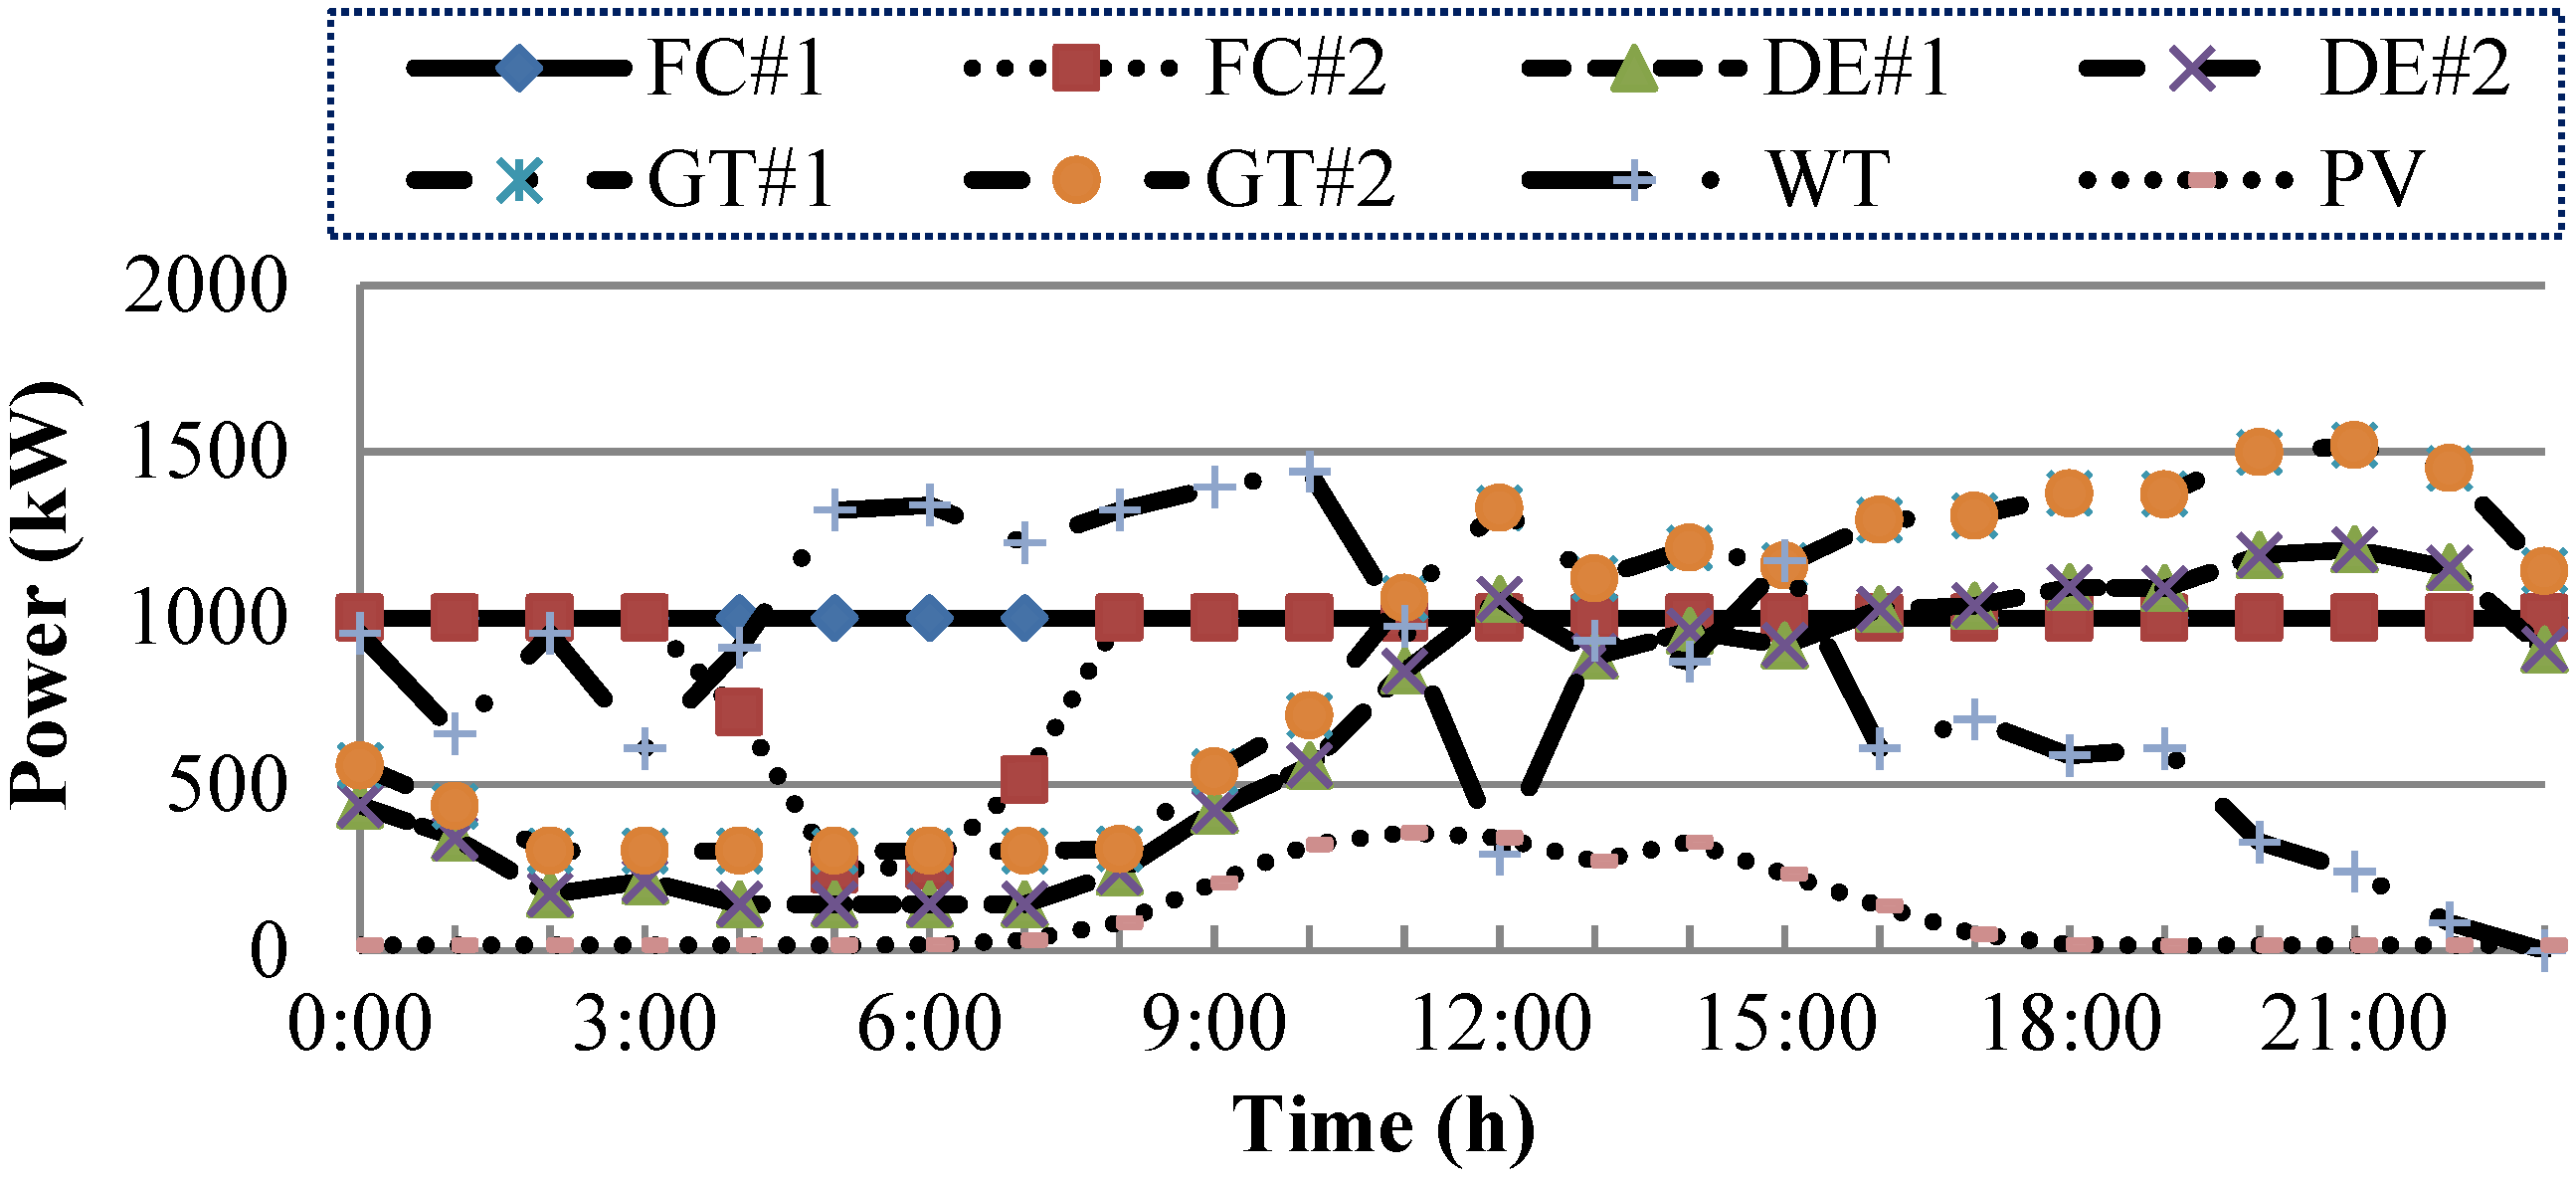
Figure 15 shows the optimal power generation of the DG units under various 24-h load demands.
Figure 15.
Numerical results for the optimal generation of each DG under autonomous operation.
Figure 15.
Numerical results for the optimal generation of each DG under autonomous operation.
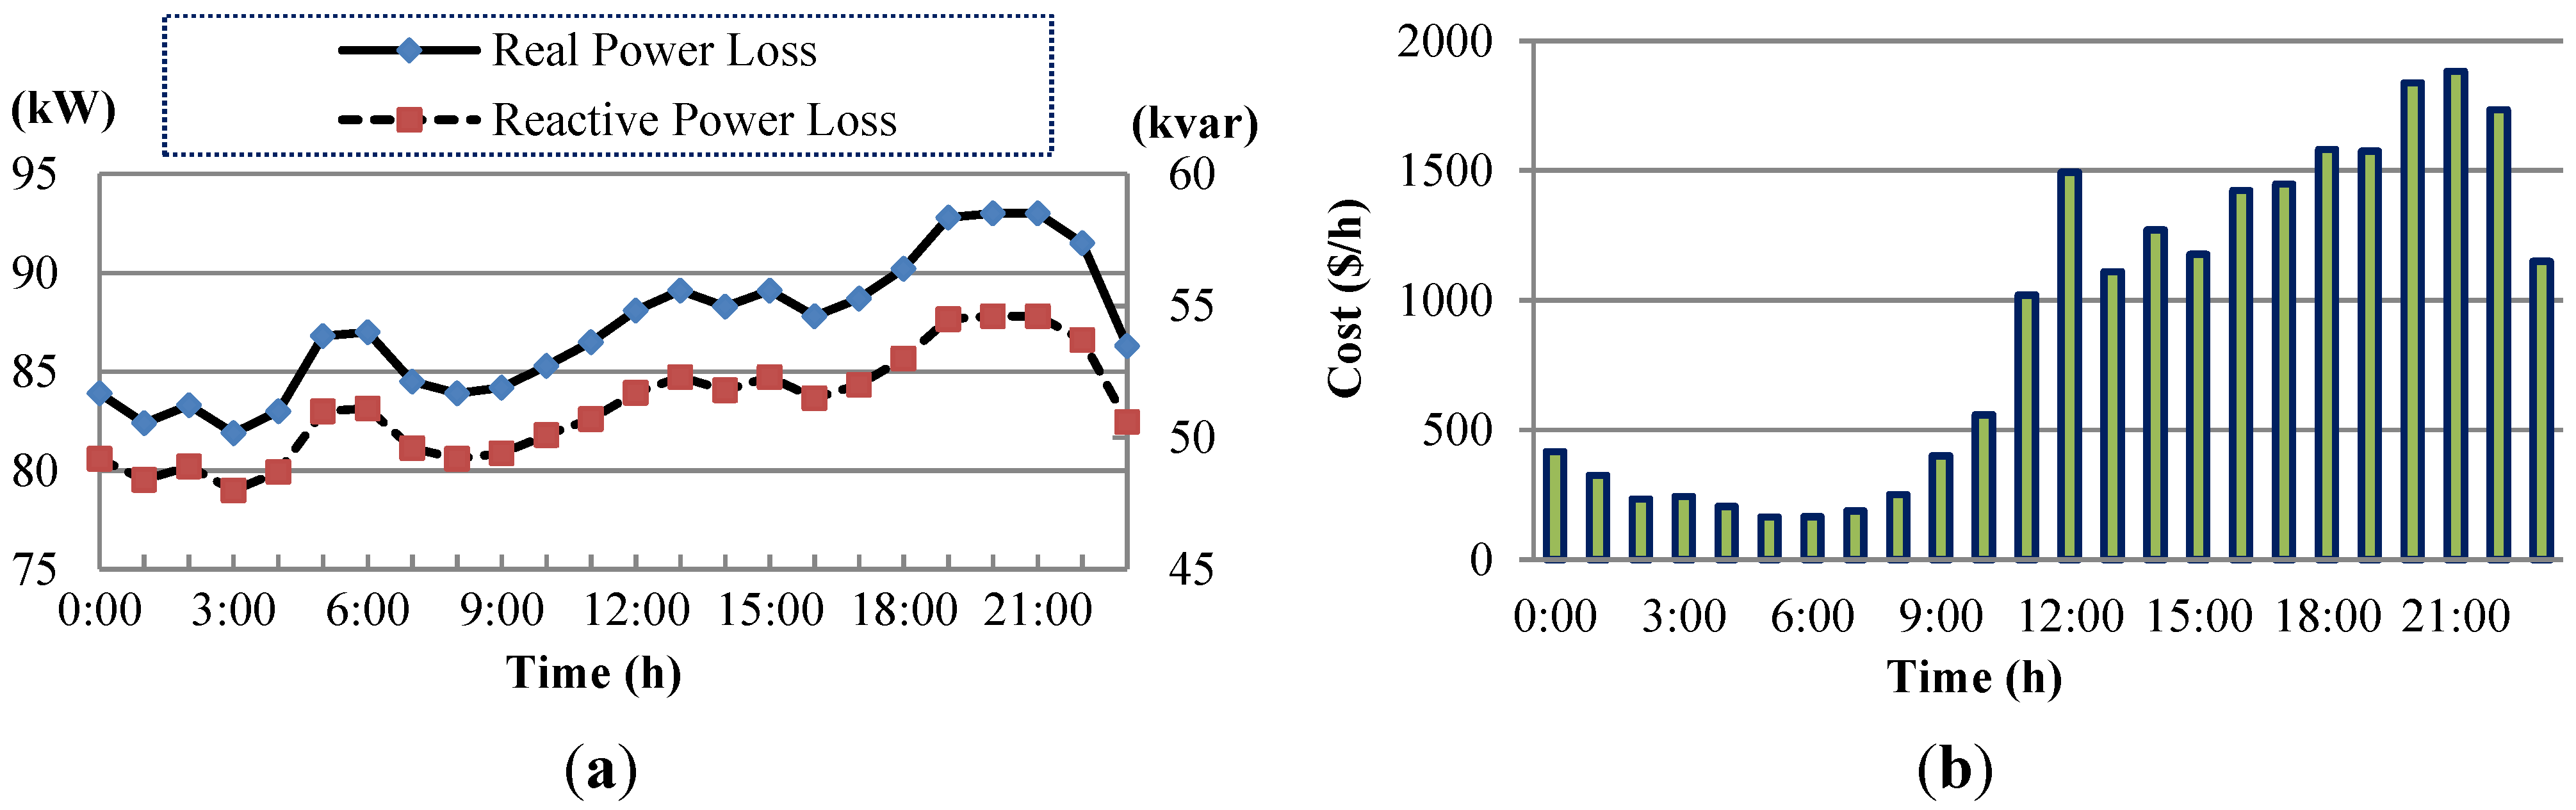
The power losses and total generation cost of the F#1&2 MG are shown in
Figure 16. Under the same load demands, the average incremental cost and generation cost of the F#1&2 MG that operates in autonomous mode are considerably greater than those of the F#1&2 MG that operates in grid-tied mode. The simulation results are attributed primarily to the MG loss from the power generated by the utility power grid, whose generation cost is lower than that of the other DG units. Furthermore, the computing time of the proposed DSM at
PD equals 1 kW is about 0.40 s.
Figure 16.
Numerical results of (a) power losses and (b) total generation cost under autonomous operation.
Figure 16.
Numerical results of (a) power losses and (b) total generation cost under autonomous operation.


