Applicability of Synthetic Aperture Radar Wind Retrievals on Offshore Wind Resources Assessment in Hangzhou Bay, China

 ,
,  ,
,
Abstract
: In view of the high cost and sparse spatial resolution of offshore meteorological observations, ocean winds retrieved from satellites are valuable in offshore wind resource assessment as a supplement to in situ measurements. This study examines satellite synthetic aperture radar (SAR) images from ENVISAT advanced SAR (ASAR) for mapping wind resources with high spatial resolution. Around 181 collected pairs of wind data from SAR wind maps and from 13 meteorological stations in Hangzhou Bay are compared. The statistical results comparing in situ wind speed and SAR-based wind speed show a standard deviation (SD) of 1.99 m/s and correlation coefficient of R = 0.67. The model wind directions, which are used as input for the SAR wind speed retrieval, show a high correlation coefficient (R = 0.89) but a large standard deviation (SD = 42.3°) compared to in situ observations. The Weibull probability density functions are compared at one meteorological station. The SAR-based results appear not to estimate the mean wind speed, Weibull scale and shape parameters and wind power density from the full in situ data set so well due to the lower number of satellite samples. Distributions calculated from the concurrent 81 SAR and in situ samples agree well.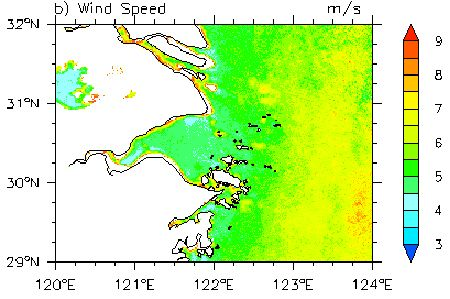
1. Introduction
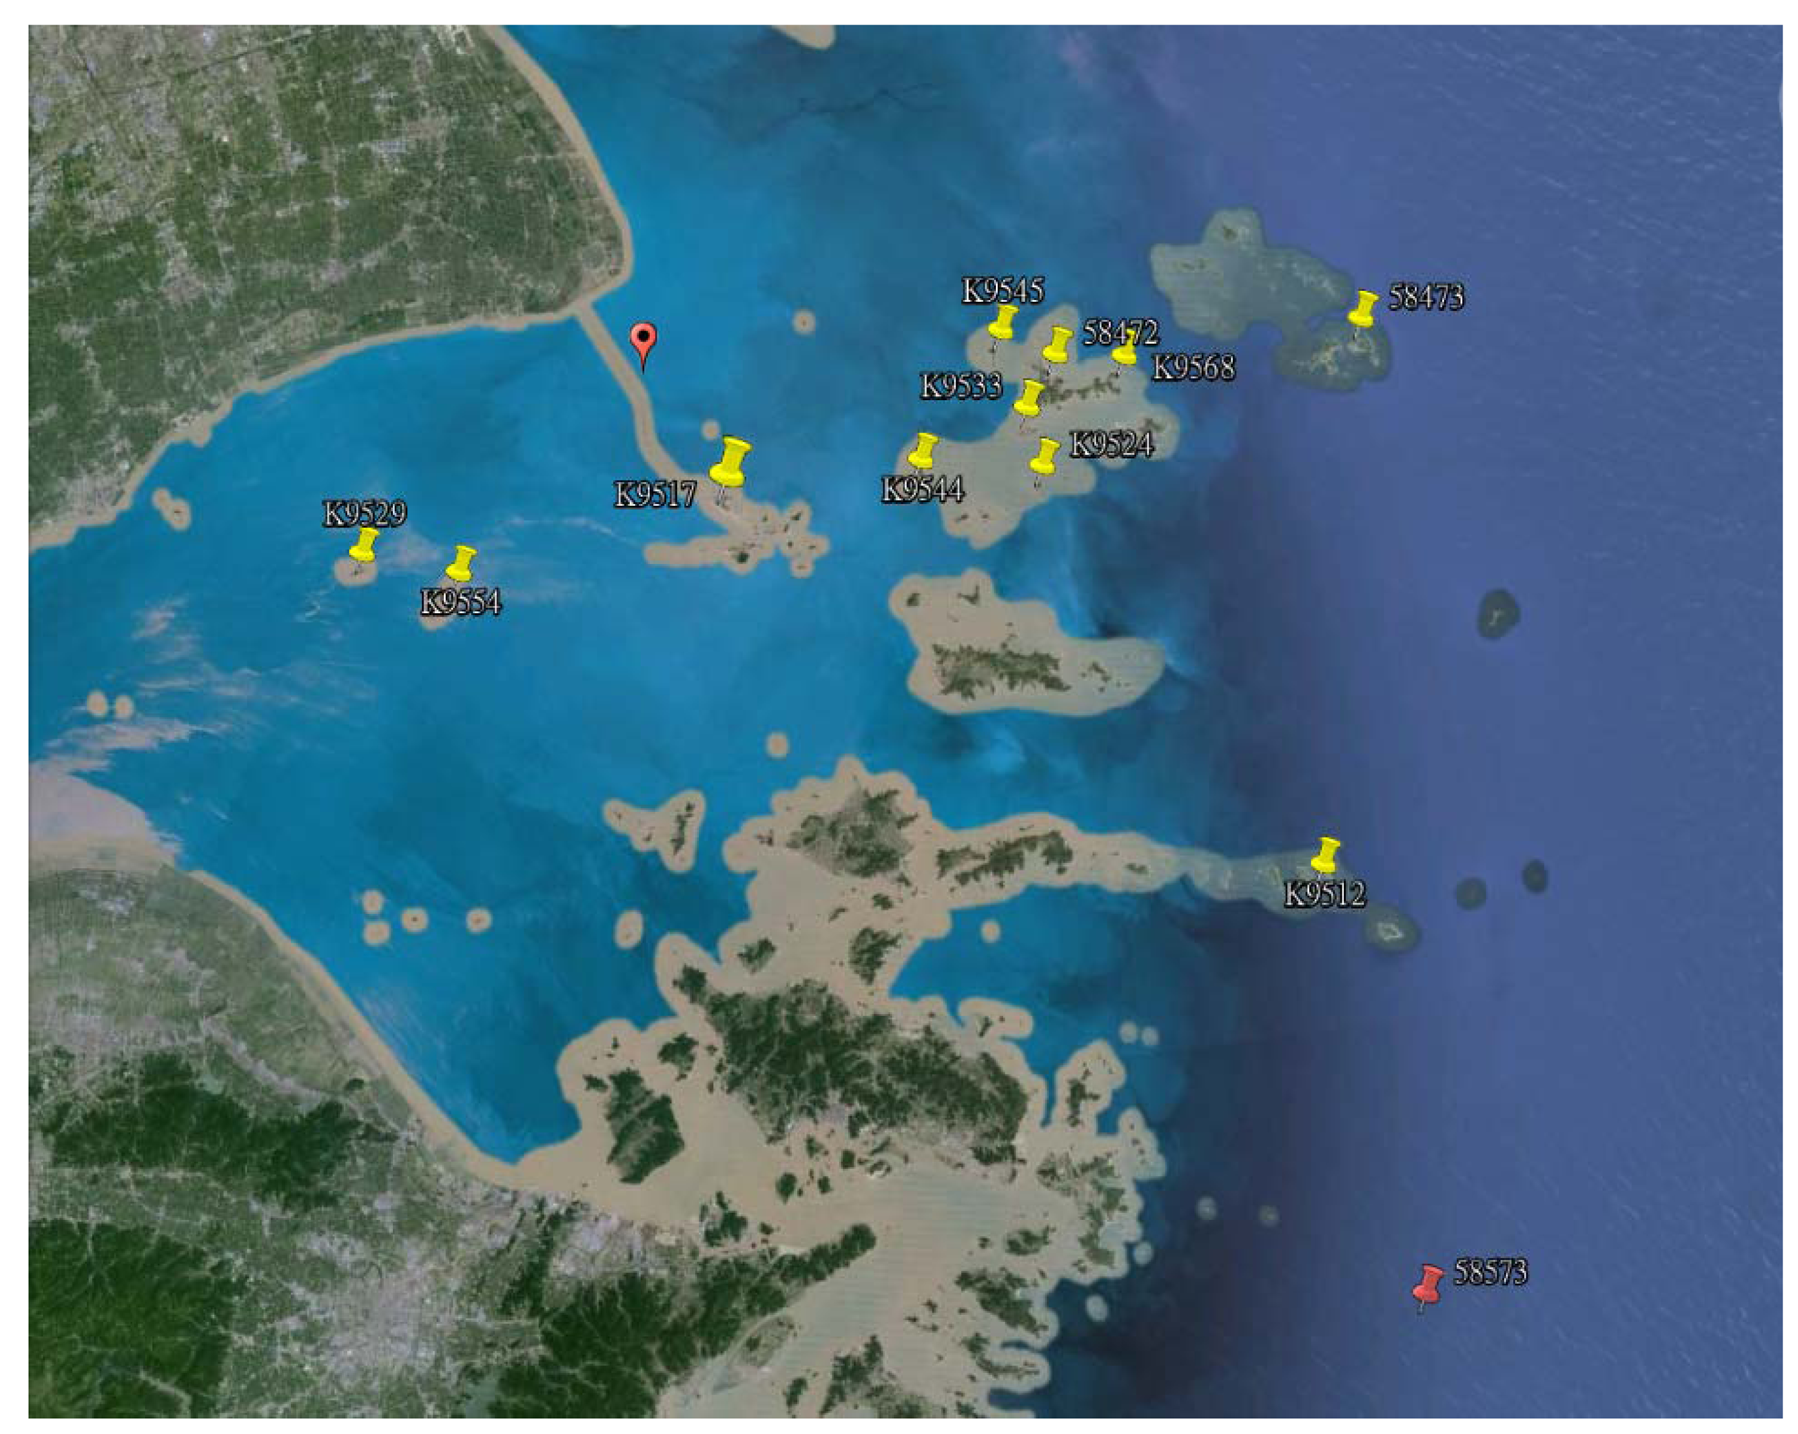
Wind power assessment is a fundamental work for offshore wind resources development, of which offshore wind power development presents a new growth point for renewable energy sources of the future [1], and the development of offshore wind power drives the urgent demand for offshore wind resources assessment. The study area in this paper, Hangzhou Bay, is a typical region with abundant offshore wind resources in China. It covers the area from 29 °N to 31.5 °N latitude and from 120 °E to 123 °E longitude, as shown in Figure 1.
As for the offshore wind resource assessment, wind observations are crucial. Currently, there are three methods for observing sea surface wind speeds: (1) in situ meteorological observation from vessels, oil platforms, buoys, observation towers and island stations; (2) Satellite remote sensing observation, such as wind retrieved from synthetic aperture radar (SAR) [2], radiometer data such as WindSAT [3] and wind scatterometer data [4,5]; (3) Reanalysis data, which is easily available in various forms, such as FNL data and NCEP Climate Forecast System Reanalysis [6]. In this paper, we only focus on the validation results of the satellite data from in situ measurements, therefore, the reanalysis data are not involved in. The in situ data is capable of continuously observing a local place for a long period, but has a limited spatial coverage, and high cost on human and material resources; the satellite observation is capable of obtaining the spatial distribution of the sea surface wind speed, but has a relatively low temporal resolution, with observations conducted only once or twice a day or several times every week [2].
Wind energy resource assessment is achieved by carrying out Weibull distribution fitting [7] based on at least one year's wind speed and direction observation data [2]. Due to the spatial range limits of offshore observation stations, in terms of selecting the location for offshore wind plants, it is very difficult to implement conventional meteorological observation over a wide spatial range all the year round. This defect can be compensated for by SARs. SAR-derived wind fields can have a higher spatial resolution than the ones from wind scatterometers. Furthermore, they have a better spatial coverage than in situ data. At the same time, in terms of the development cost estimation for offshore wind power, acquiring the free SAR data from ESA is much more economical than building a single offshore anemometer tower for targeted in situ observation. Because of the above advantages, SAR images taken from ENVISAT polar orbit satellite launched in March 2002 by European Space Agency (ESA), have been applied in offshore wind resources assessment in Europe [8,9].
Compared with in situ measurements, two types of uncertainty are introduced by SAR retrieval winds. Firstly, biases may be associated with the data sampling in that: (1) the sampling number of satellite data is less than that of in situ measurement in the same period; (2) the SAR data sampling occurs at relatively fixed scanning time, the diurnal meteorological variation cannot be acquired; and (3) The valid range of SAR wind retrieval is from 2 m/s to hurricane wind speeds. This uncertainty at the lower wind speeds would remain even if SAR retrieval wind were perfectly accurate with respect to in situ measurement. Sampling biases have previously been quantified through statistical analyses of a large number of in situ observations selected specifically to match the sampling criteria of satellite scenes [10,11]. Based on these analyses, a total of 60–70 randomly selected and perfectly accurate SAR scenes are required to characterize the mean wind speed and Weibull scale parameter (A). The second source of uncertainty is related to the accuracy of SAR wind retrievals.
Several studies demonstrate that satellite SAR can be used to extract wind speed or wind direction over the ocean at high spatial resolution ∼1 km by 1 km [12–14]. Satellite SAR wind maps have been compared to meteorological in situ measurement or meso-scale model results [9,15–17]. It is indicated that SAR wind retrievals was very consistent with in situ measurement in areas of open oceans [18,19], however, there is a lack of research into the working applicability of retrieval data for offshore wind resource assessment in China. As China has 18,000-km of long and narrow coastline, over 6500 islands and abundant marine resources, it is crucial to verify and apply SAR wind retrieval to offshore waters in this country. The Chinese seas were monitored routinely by the ENVISAT mission of the ESA from 2002 to 2012. Because the contact was lost in 2012, it cannot provide new data anymore from SAR.
Observing offshore winds with meteorological masts is costly, but 13 in situ measurements from coastal and offshore masts, have been conducted within the study area of Hangzhou Bay. The comparison is done case by case, on wind speed using a spatial averaging technique in the SAR-based wind maps and a time-average from the in situ measurements.
The aim of this paper is to describe the application of SAR data in offshore wind resource assessment in complex offshore waters in China. Firstly, we evaluate wind retrievals from a total of 181 images of SAR against in situ measurements at Hangzhou Bay, including the comparison results on wind speed, wind direction and wind energy parameters. Finally, wind statistics are computed from 181 SAR scenes to quantify the accuracy on SAR-based wind resource assessment. The findings could be valuable for those who wish to include satellite images in offshore wind resource assessment studies.
2. Data Analysis
2.1. Wind Retrieval from SAR
SAR images are derived from the ENVISAT satellite which carried an Advanced SAR (ASAR) sensor from 2002 to 2012. After that, it cannot provide new data anymore from ASAR because of the contact lost. Capillary and short-gravity waves at the ocean surface are generated by the instant wind. These waves interact with radar pulses through Bragg scattering; there is thus a relationship between the local wind strength and normalized radar cross section (NRCS).
The wind-to-backscatter relation has been empirically established and it generally takes the following form [20]:
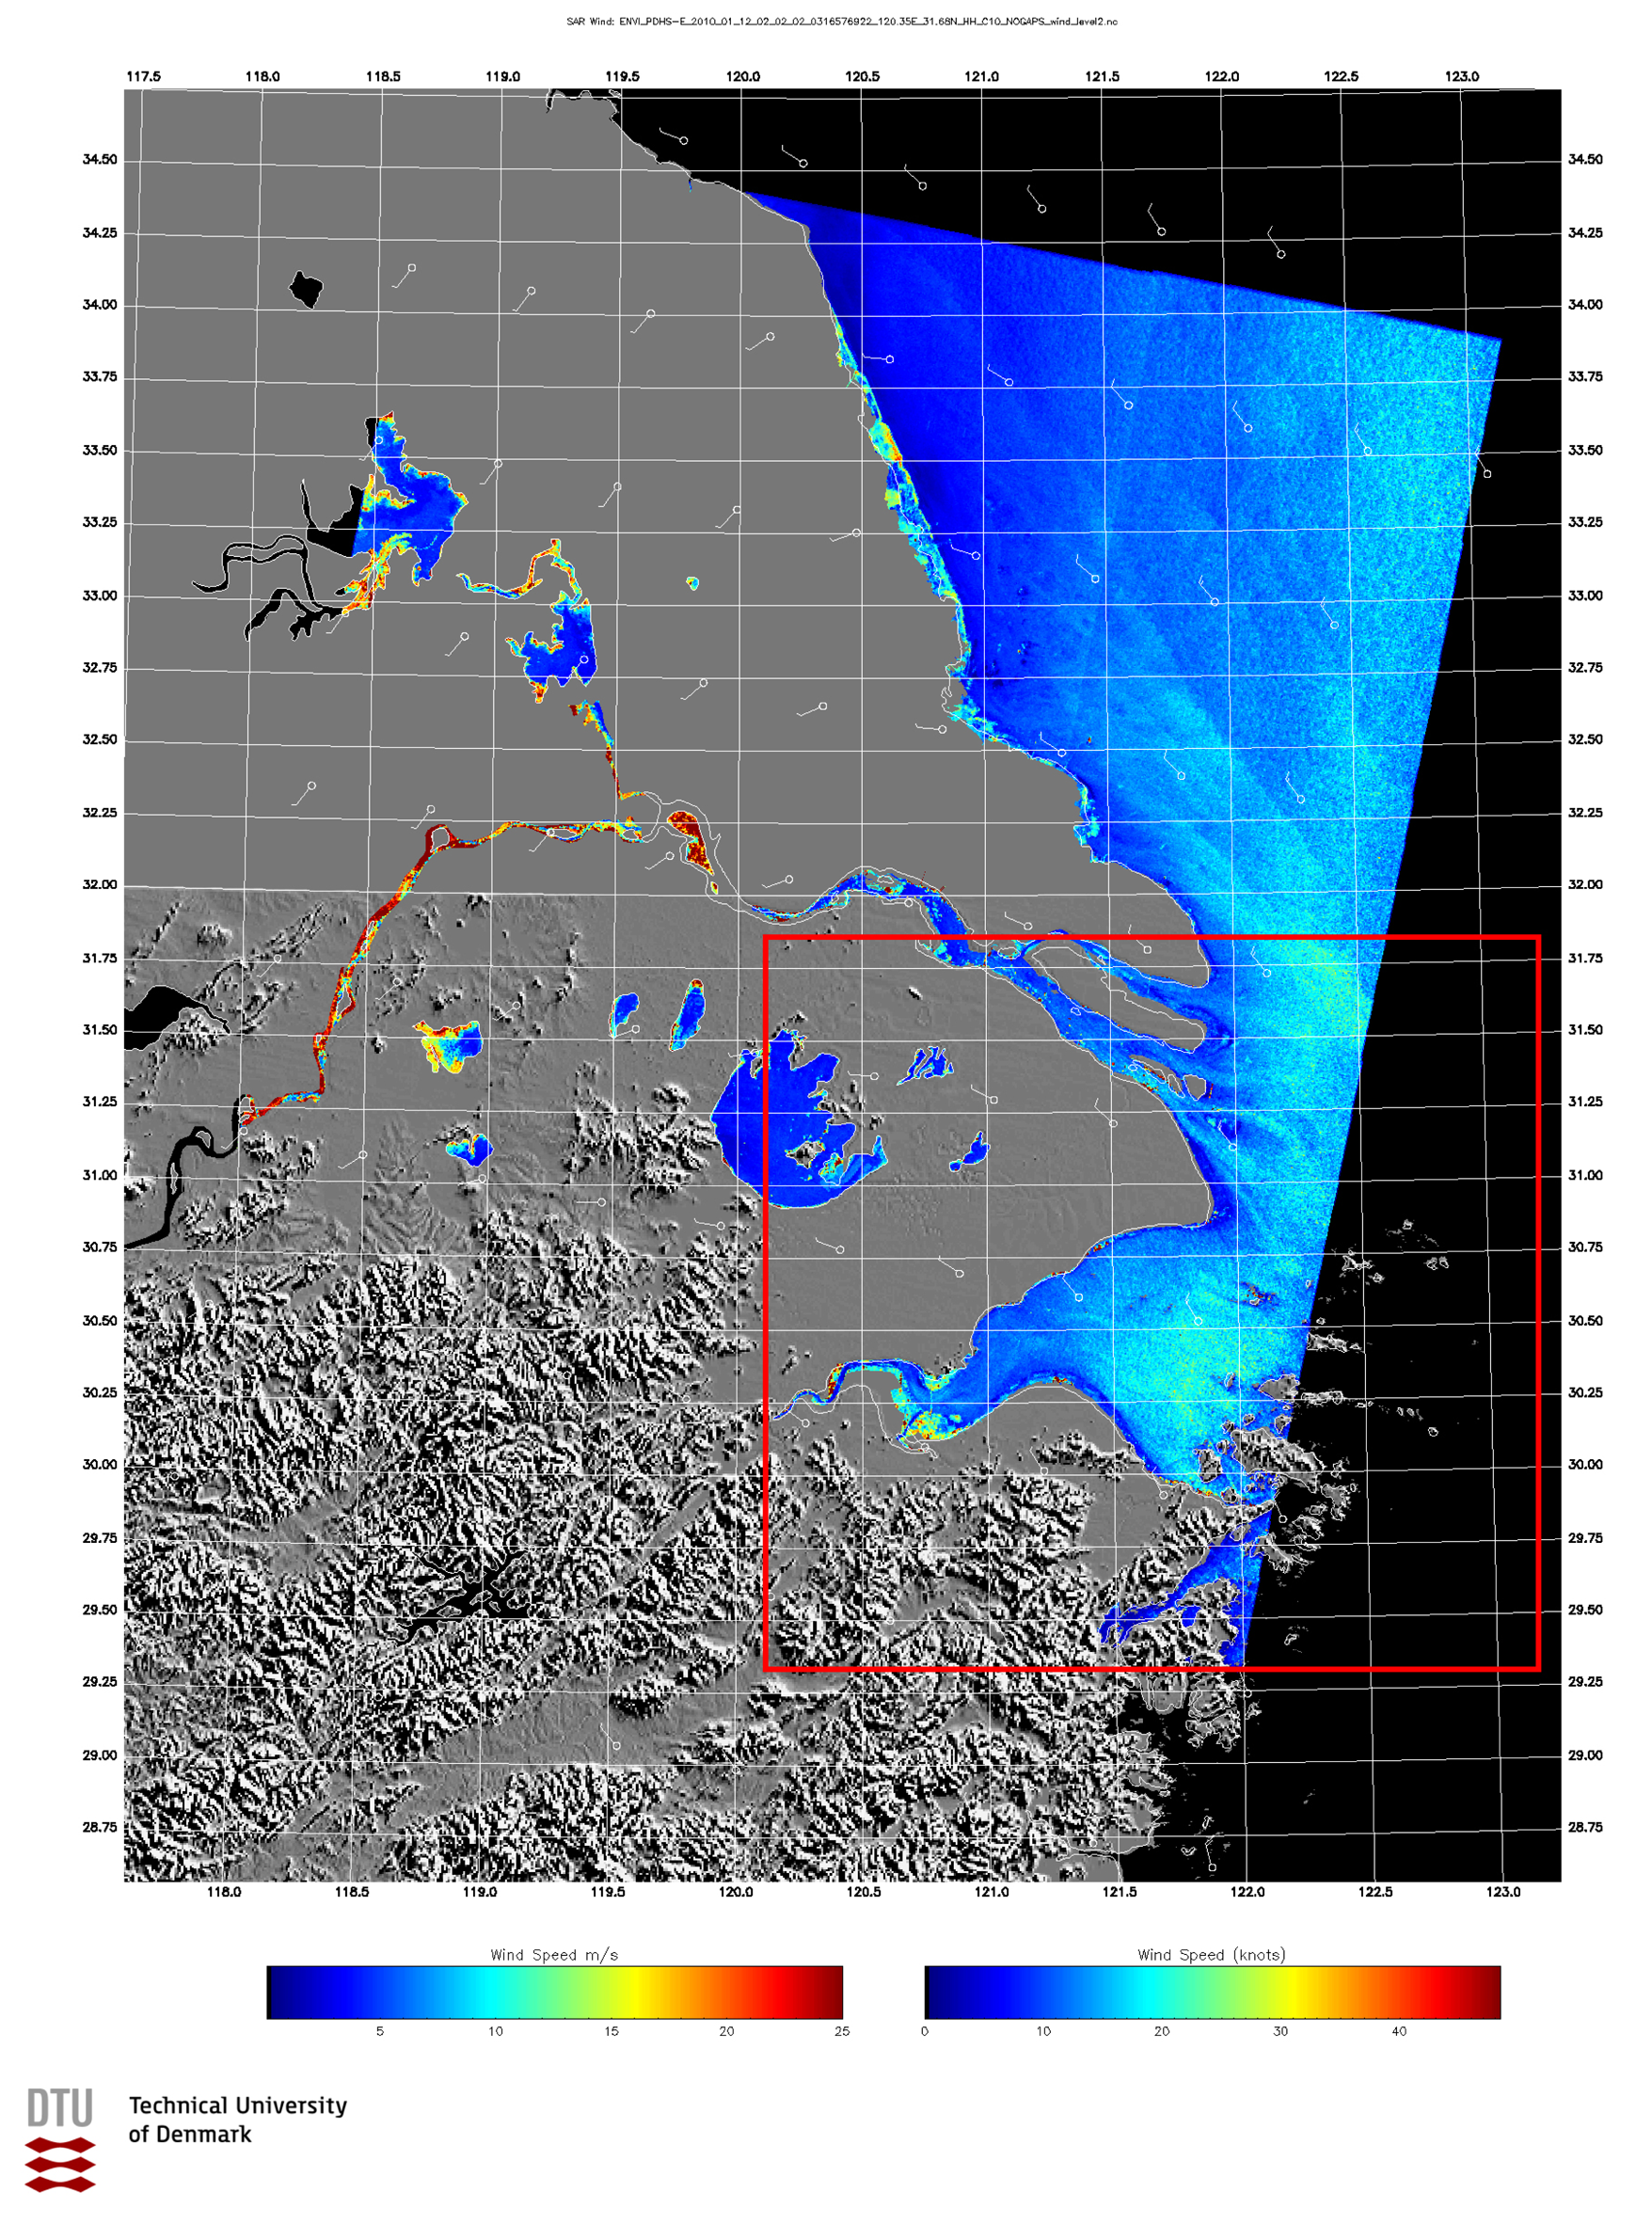
The ASAR scenes in this paper have been processed to 10-m wind fields using the GMF called CMOD5 initiated with wind direction inputs from the U.S. Navy Operational Global Atmospheric Prediction System (NOGAPS). The wind direction in NOGAPS is from the lowest model layer, around 10 m above the surface. An example wind field is shown in Figure 2 where the color coding shows the wind speed and the wind barbs give the input wind direction from NOGAPS. The wind direction is mostly from land to sea and wind speed gradients are seen near the coastline. The 181 satellite wind images, 173 images in Global Monitoring Mode (GM1) and 8 images in Wide Swath Mode (WSM), have been collected at Hangzhou Bay from May 2009 to December 2011 in this paper. The spatial resolution of the original SAR data is 1 km for GM1 and 150 m for WSM. The latter has been resampled to a grid cell size of 500 m before the wind retrieval in order to smooth out effects of random image noise and long-period waves [21].
The complex nature of the Hangzhou Bay area with its many islands makes it difficult to apply streak detection techniques for retrieval of wind directions from the SAR imagery [12]. Such detection would require manual inspection and correction for ambiguities which is not practical with a large number of SAR scenes. In addition, the detection requires that the NRCS is resolved at scales down to 200 m. This is impossible with ENVISAT ASAR data in GM1 mode.
At the Technical University of Denmark (DTU), 181 ENVISAT ASAR scenes covering the study area are processed to wind maps. Table 1 lists the number of scenes per year and per month. There are 93 morning passes observed between 01.57 and 02.06 UTC and 88 evening passes observed between 13.59 and 14.02 UTC.
2.2. Data from Meteorological Stations and Mast
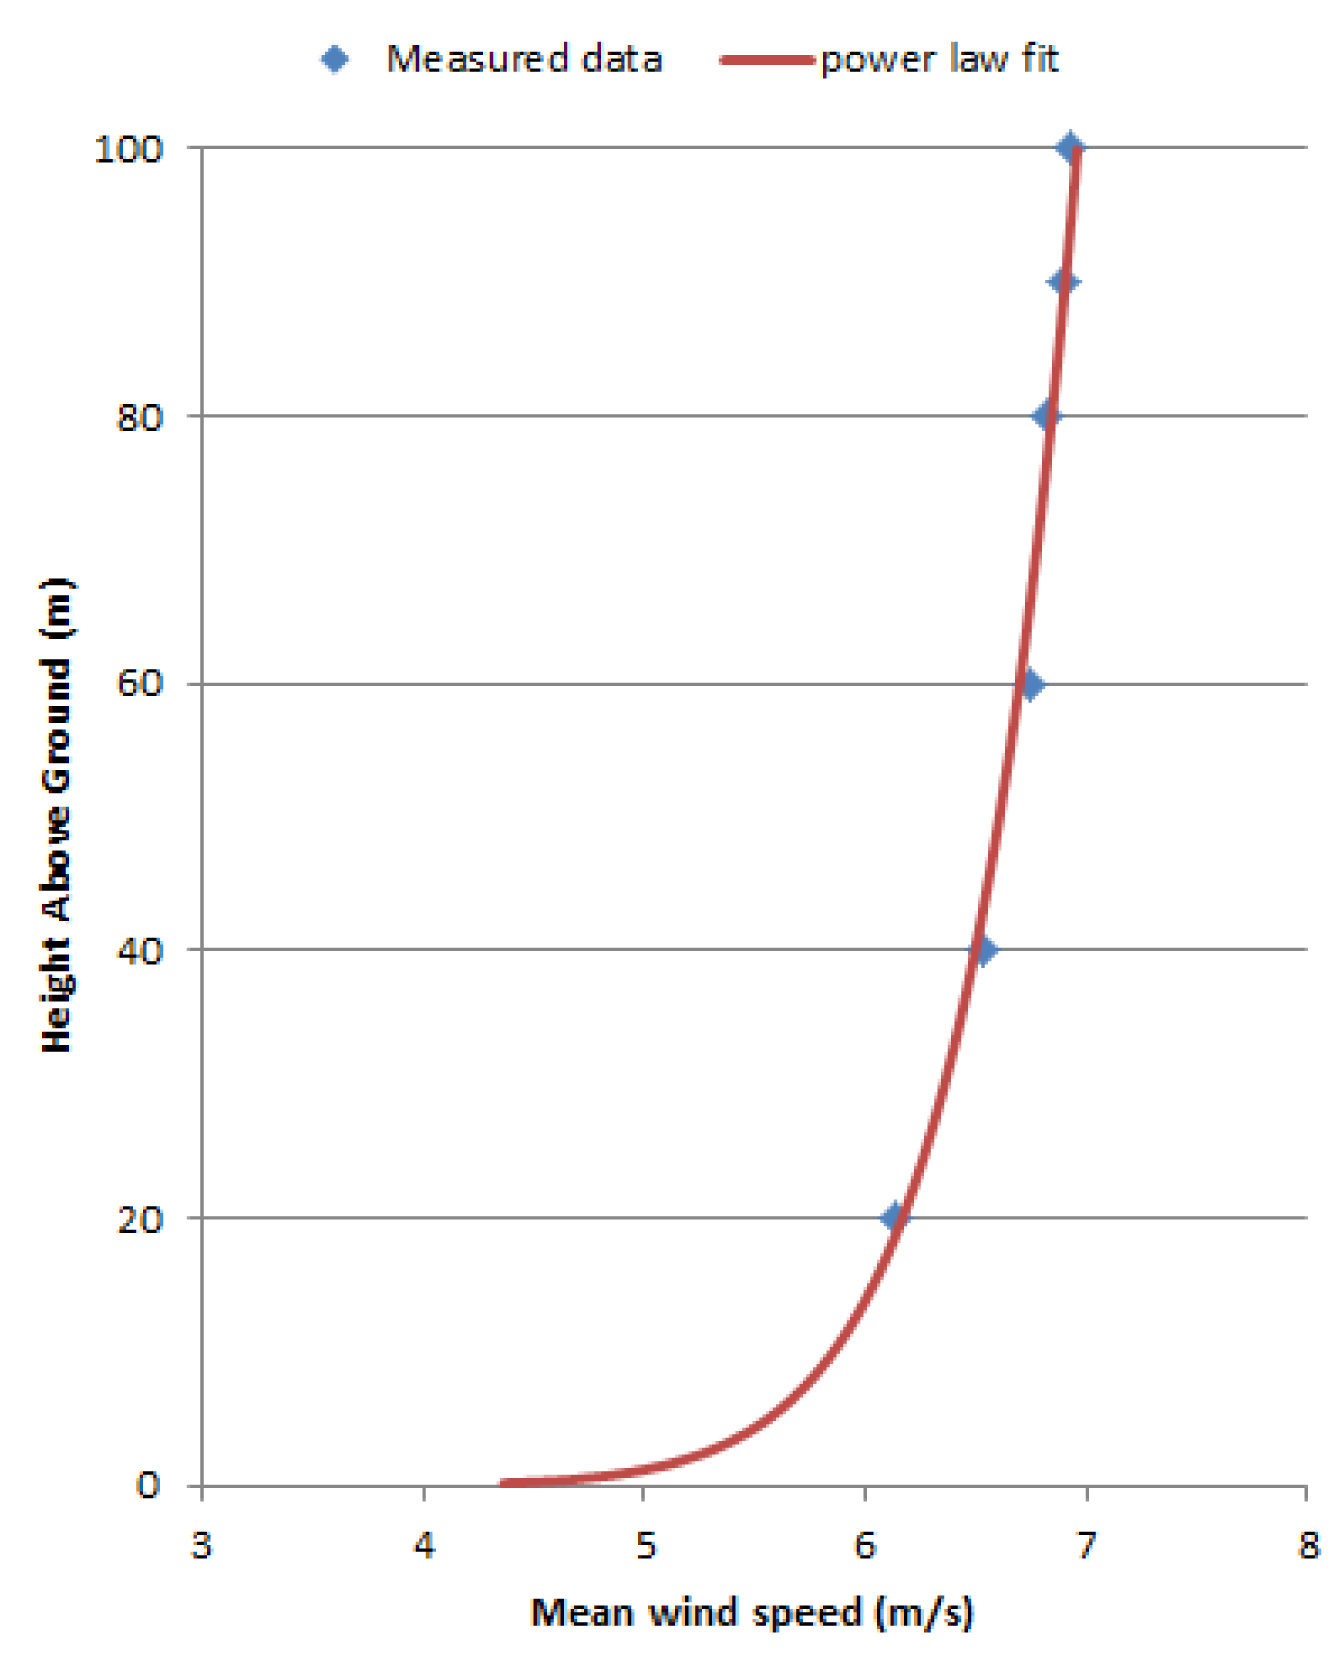
The observational data of Hangzhou Bay is provided by Climate Center of Zhejiang Meteorological Bureau (see Figure 1 for specific locations), including hourly wind speed and wind direction at height 10-m from 12 land based in situ measurement stations at Hangzhou Bay. Observations from an offshore mast are also included in this paper, and the data are observed at six different heights (100, 90, 80, 60, 40 and 20 m) every 10 min from April 2009 to December 2011. Table 2 lists the geographical coordinates of the met-masts. The data periods with the first and last observation from each of the 13 met-masts used in the comparison study and the observational heights are listed. The first two masts are in the open ocean and of relatively high data quality; the observational environments of the six masts from K9554 to K9568 are acceptable, large flat observing area and nearby place to the ocean; the quality of the data from other five masts is questionable because of the complex observational environments, adjacent to rocks or hills and long distance to the open ocean.
It is the wind speed at 10 m above sea level that is extracted from SAR, thus it has been chosen to extrapolate the offshore mast (E1004) wind speed to this height using the simple exponential law [22]:
2.3. Selection of Comparison Data Sequence
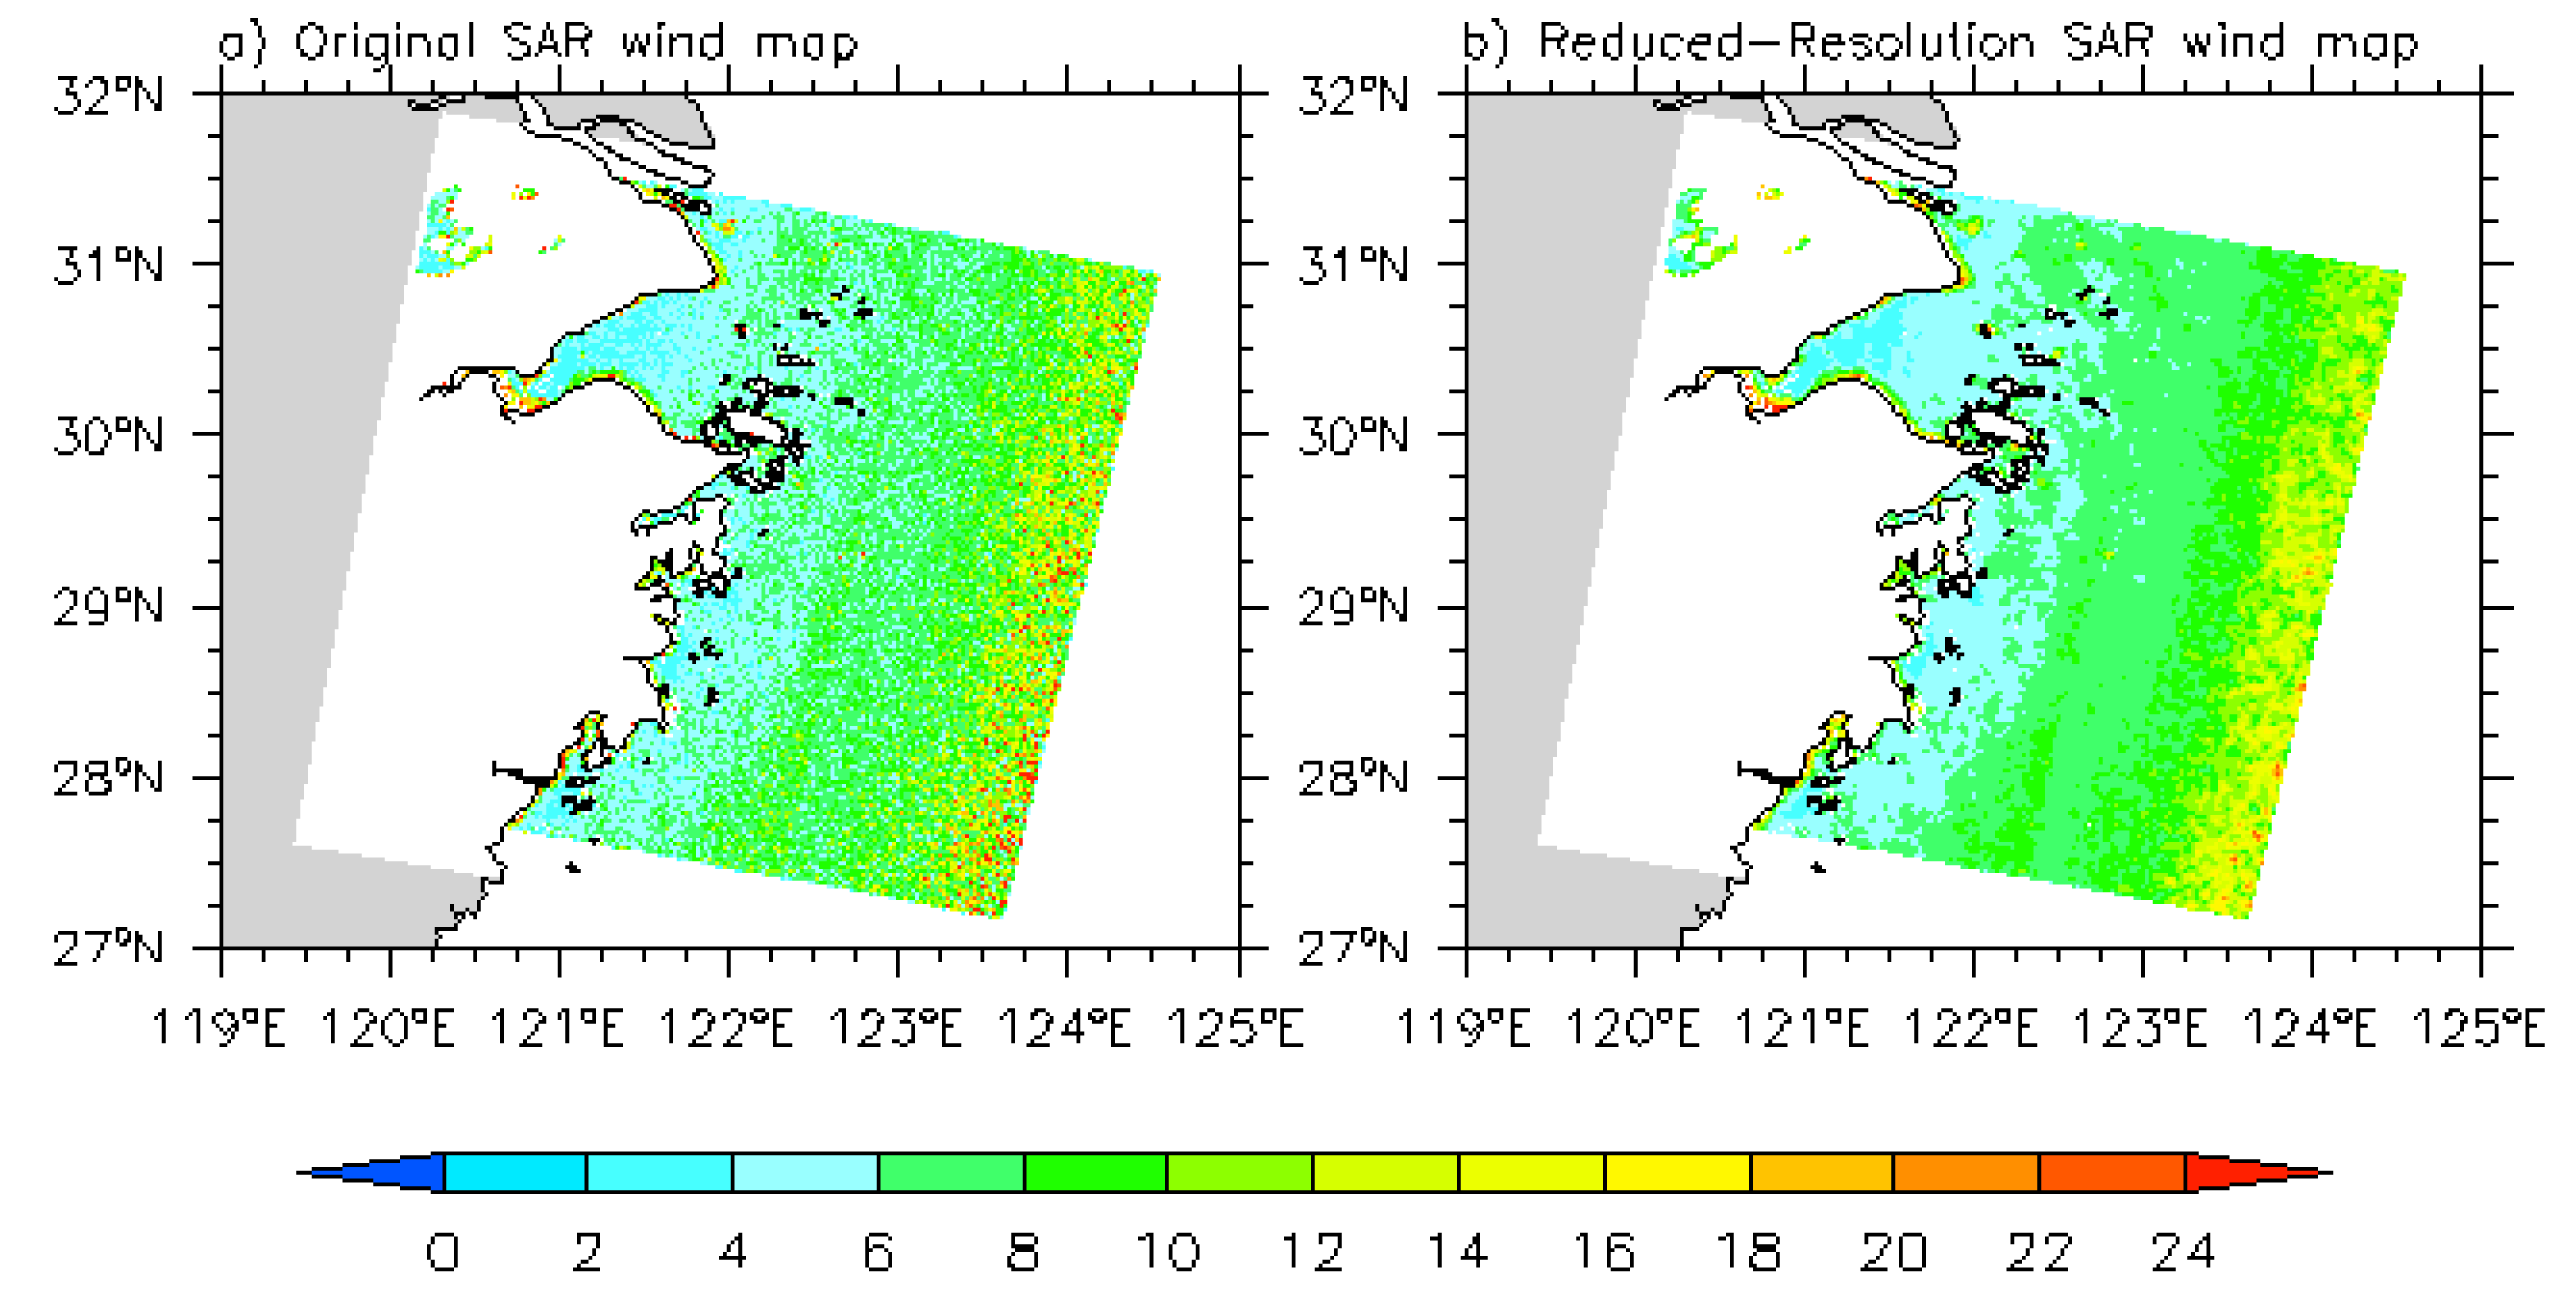
To verify SAR retrieval wind by in situ measurement, it is necessary to preprocess the data to make them comparable in space and time. Figure 4a shows that there are large jumps in the magnitude of the SAR wind speed at Hangzhou Bay, China. Some of this variation is caused by residual dependence of the SAR imaging geometry. The ENVISAT WSM and GM1 scenes consist of six sub-swaths and the highest variation of NRCS and wind speed is observed along the swath seams. The SAR processing scheme does not perform any correction for such effects. The relevant spatial scale for offshore wind resources assessment is meso-scale, thus it is necessary to eliminate the small-scale wind variability from the SAR wind maps. Averaging to the meso-scale is done through processing of the wind maps with spatial resolutions of 0.5–1 km to maps with 5 km pixel size. The spatial average centered at every 5 km × 5 km box is processed and the spatial averaging SAR-based wind map has been obtained (Figure 4b). After spatial averaging, the SAR wind speed at each spatial point represents the average wind speed value in 5 km × 5 km box around. The SAR wind speed at the nearest satellite spatial point to the in situ site, the distance between them is usually less than 1 km, is selected to compare against to the in situ measurement.
In order for the statistics from the in situ measurements to match well with the averaging technique, a 70 min-average included at the satellite recording time for the meteorological stations and a 40 min average centered at the satellite recording time for the mast (E1004) are used. After calculating and selecting, eight collocated data series of wind speed from SAR wind maps and in situ measurement in Hangzhou Bay are ready to be compared.
3. Results
3.1. Wind Speed
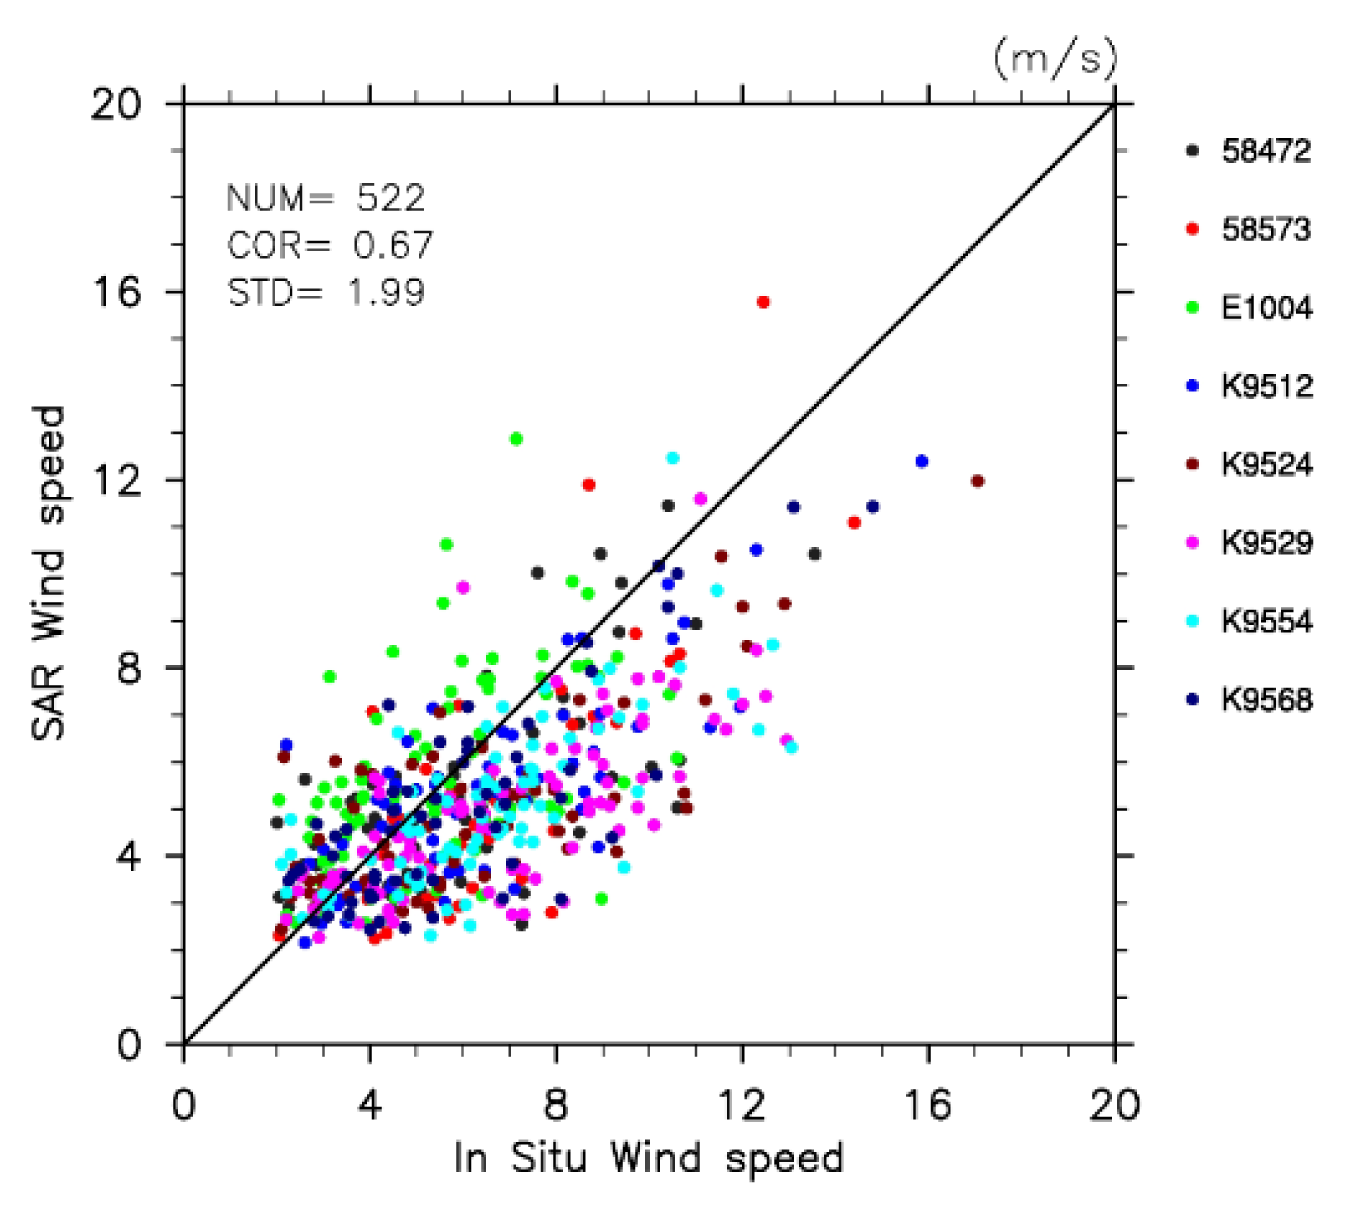
The comparison results on wind speed are calculated for each meteorological station. The overall data are included in the plot between in situ wind speed and SAR-based wind speed shown in Figure 5 and winds less than 2.0 m/s in SAR-wind maps are excluded. Because of the limitation of in situ observational technique over Hangzhou Bay, China, the quality of in-situ wind speed below 2.0 m/s is questionable, in situ data at this low end are also excluded in Figure 5.
When the linear regressions fit with SAR wind speed in the y axis and in situ wind speed in the x axis are made, the statistic results are shown in Table 3.
The correlation coefficients are smaller than 0.8 and SDs are larger than 1.8 m/s at most of the meteorological masts. The bias is positive for most masts. In all, it shows that regression using N = 522 samples of collocated wind speed observed at meteorological stations and SAR-based wind speed results in R = 0.67, SD = 1.99 m/s and RMSE = 2.23 m/s. The linear regression slope is 0.52 and the bias is 2.01 m/s.
3.2. Wind Direction
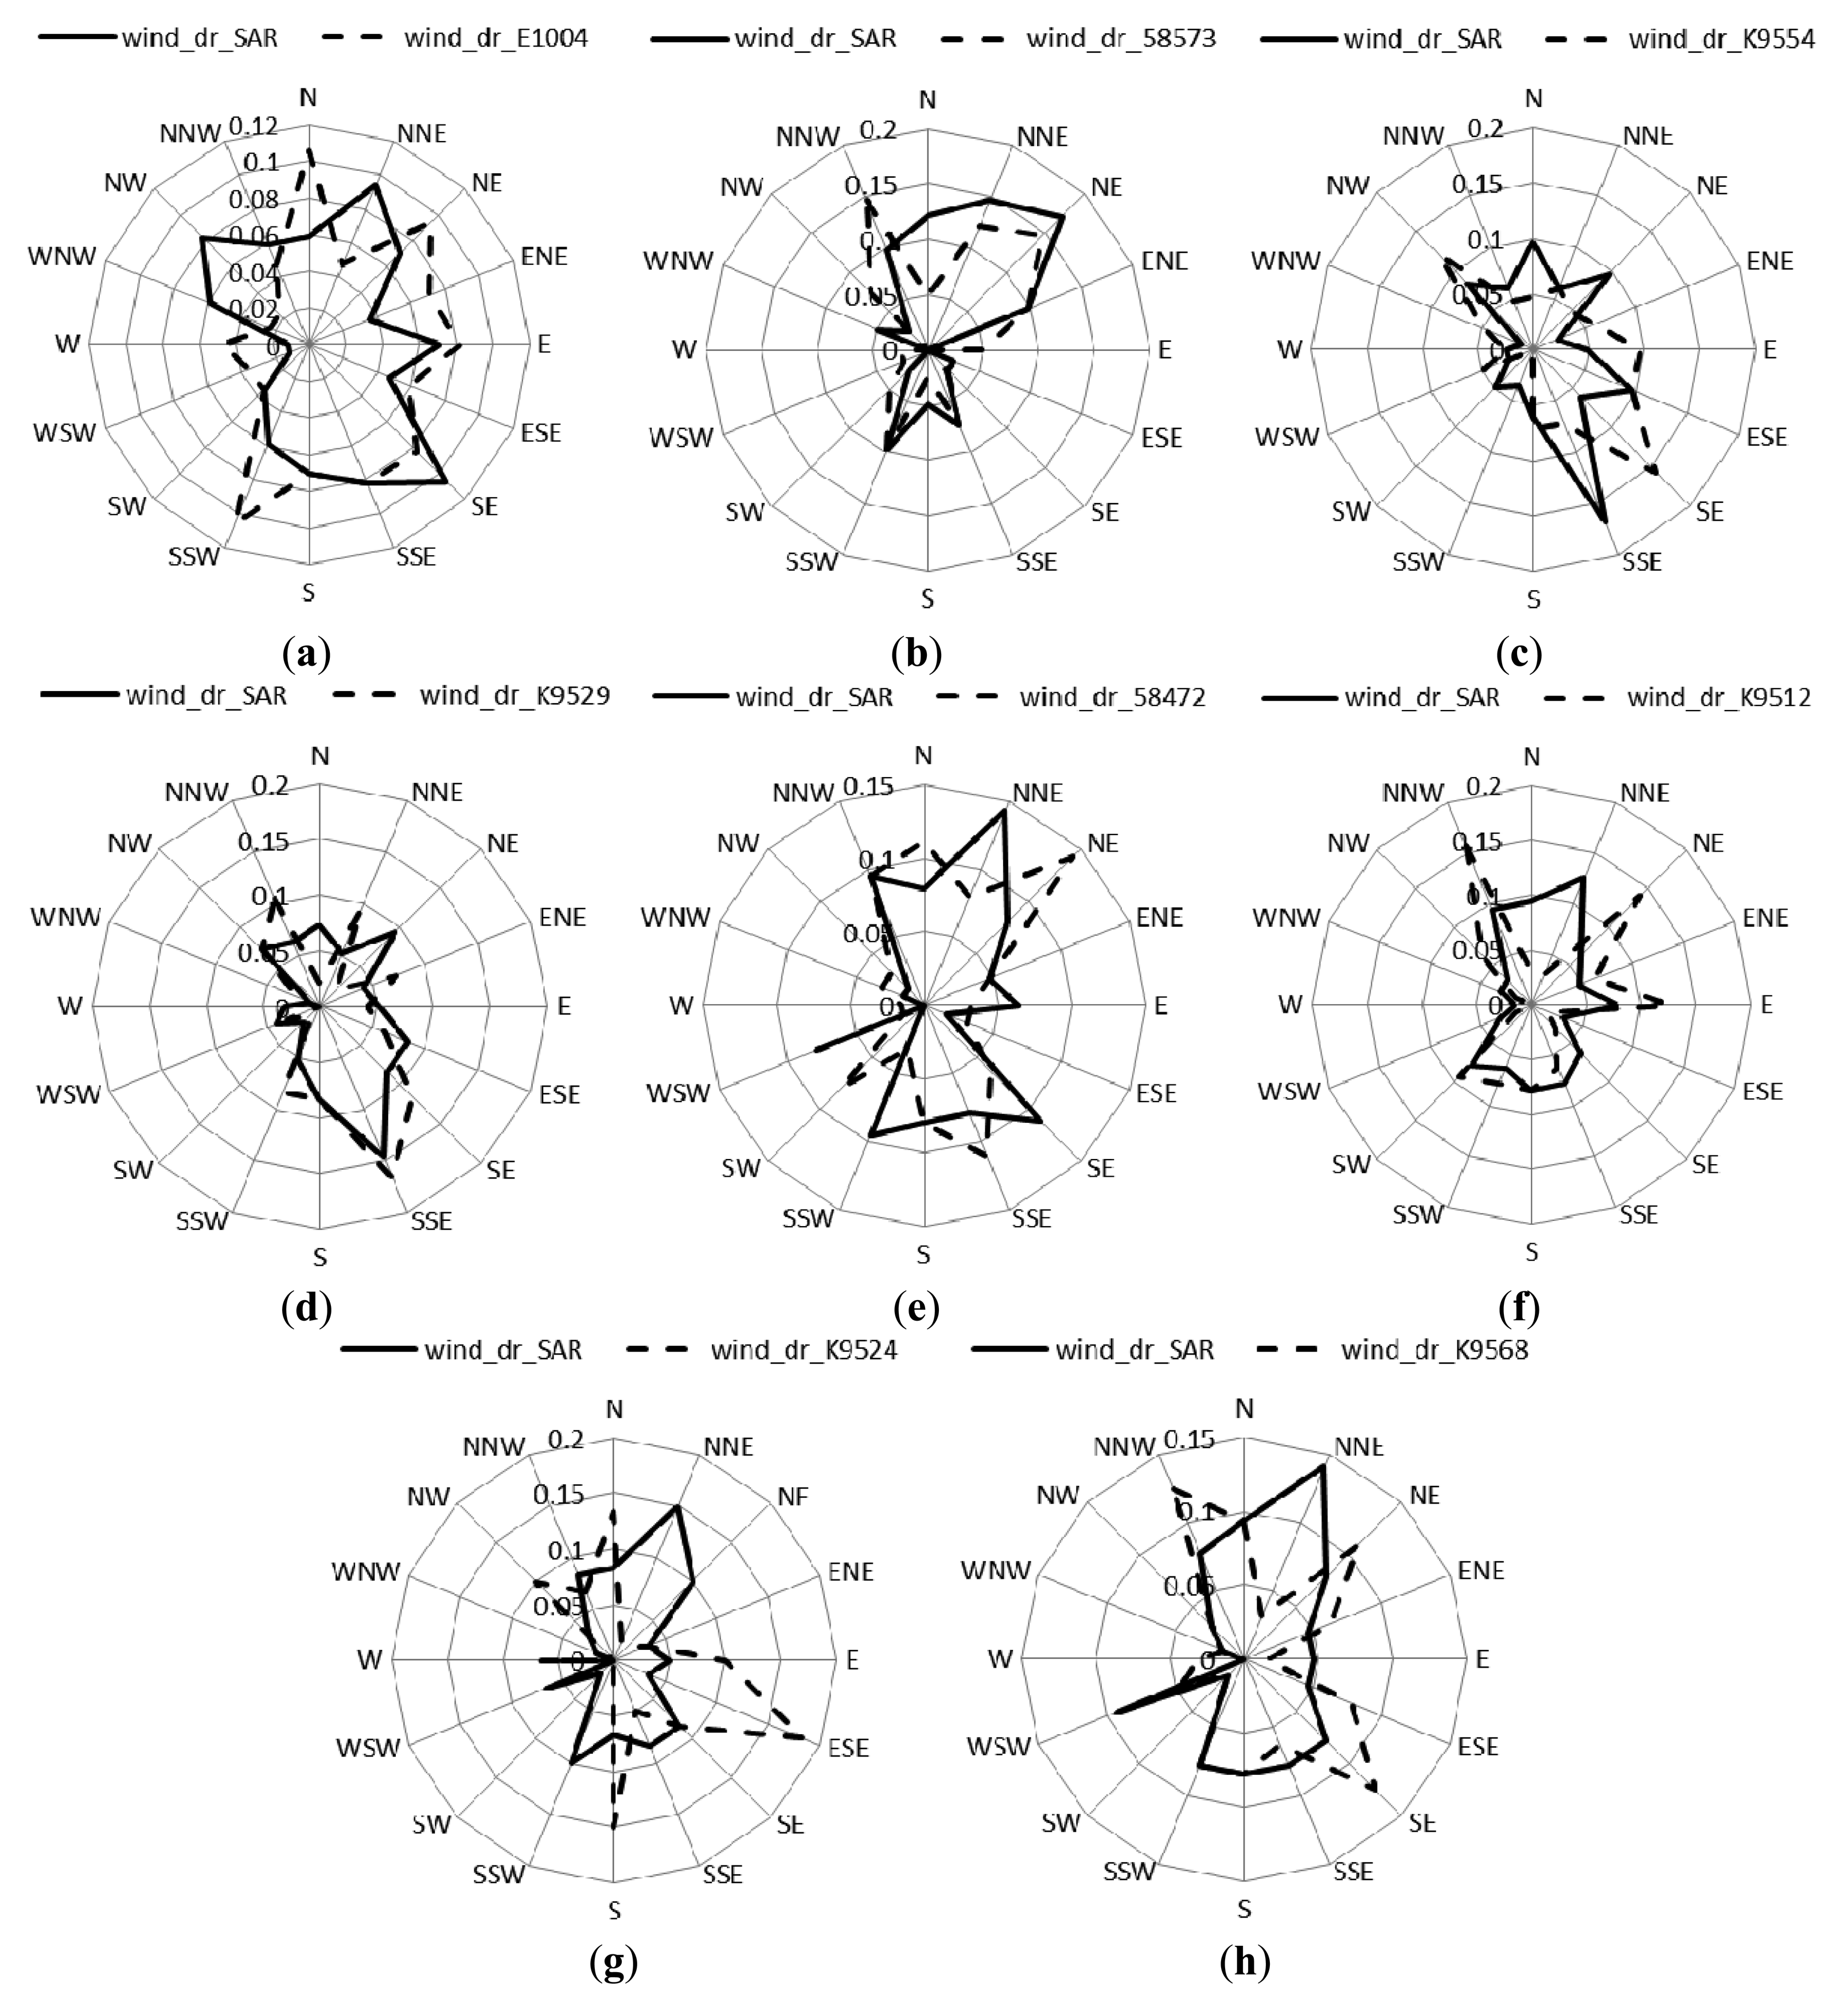
The comparison results on wind direction are presented here. The wind direction in SAR images are the NOGAPS wind directions interpolated in time and space to match the SAR data. The frequency of wind directions from in situ measurements versus NOGAPS are shown in Figure 6. The features of the wind roses from NOGAPS (solid lines) are very similar to these from in situ measurements (dashed lines), indicating a consistency in wind direction at most of the eight in situ sites but for K9524. In order to compare wind directions quantitatively, 47 observations from all in situ measurements (n = 511) near 0 and 360 are removed. Linear regression results are listed in Table 4. The correlation coefficients (R) exceed 0.86 at all met masts, but the SDs are larger than 30° at most of the met masts. The bias is positive for most masts. Table 4 shows that regression using N = 464 samples of collocated wind directions observed at meteorological stations and from NOGAPS results in R = 0.89, and SD = 42.31°, indicating a satisfactory correlation between the observed wind direction and the NOGAPS model wind direction in Hangzhou Bay. This uncertainty affects the accuracy of the SAR wind speed retrieval.
4. Calculation of the Wind Energy Parameters
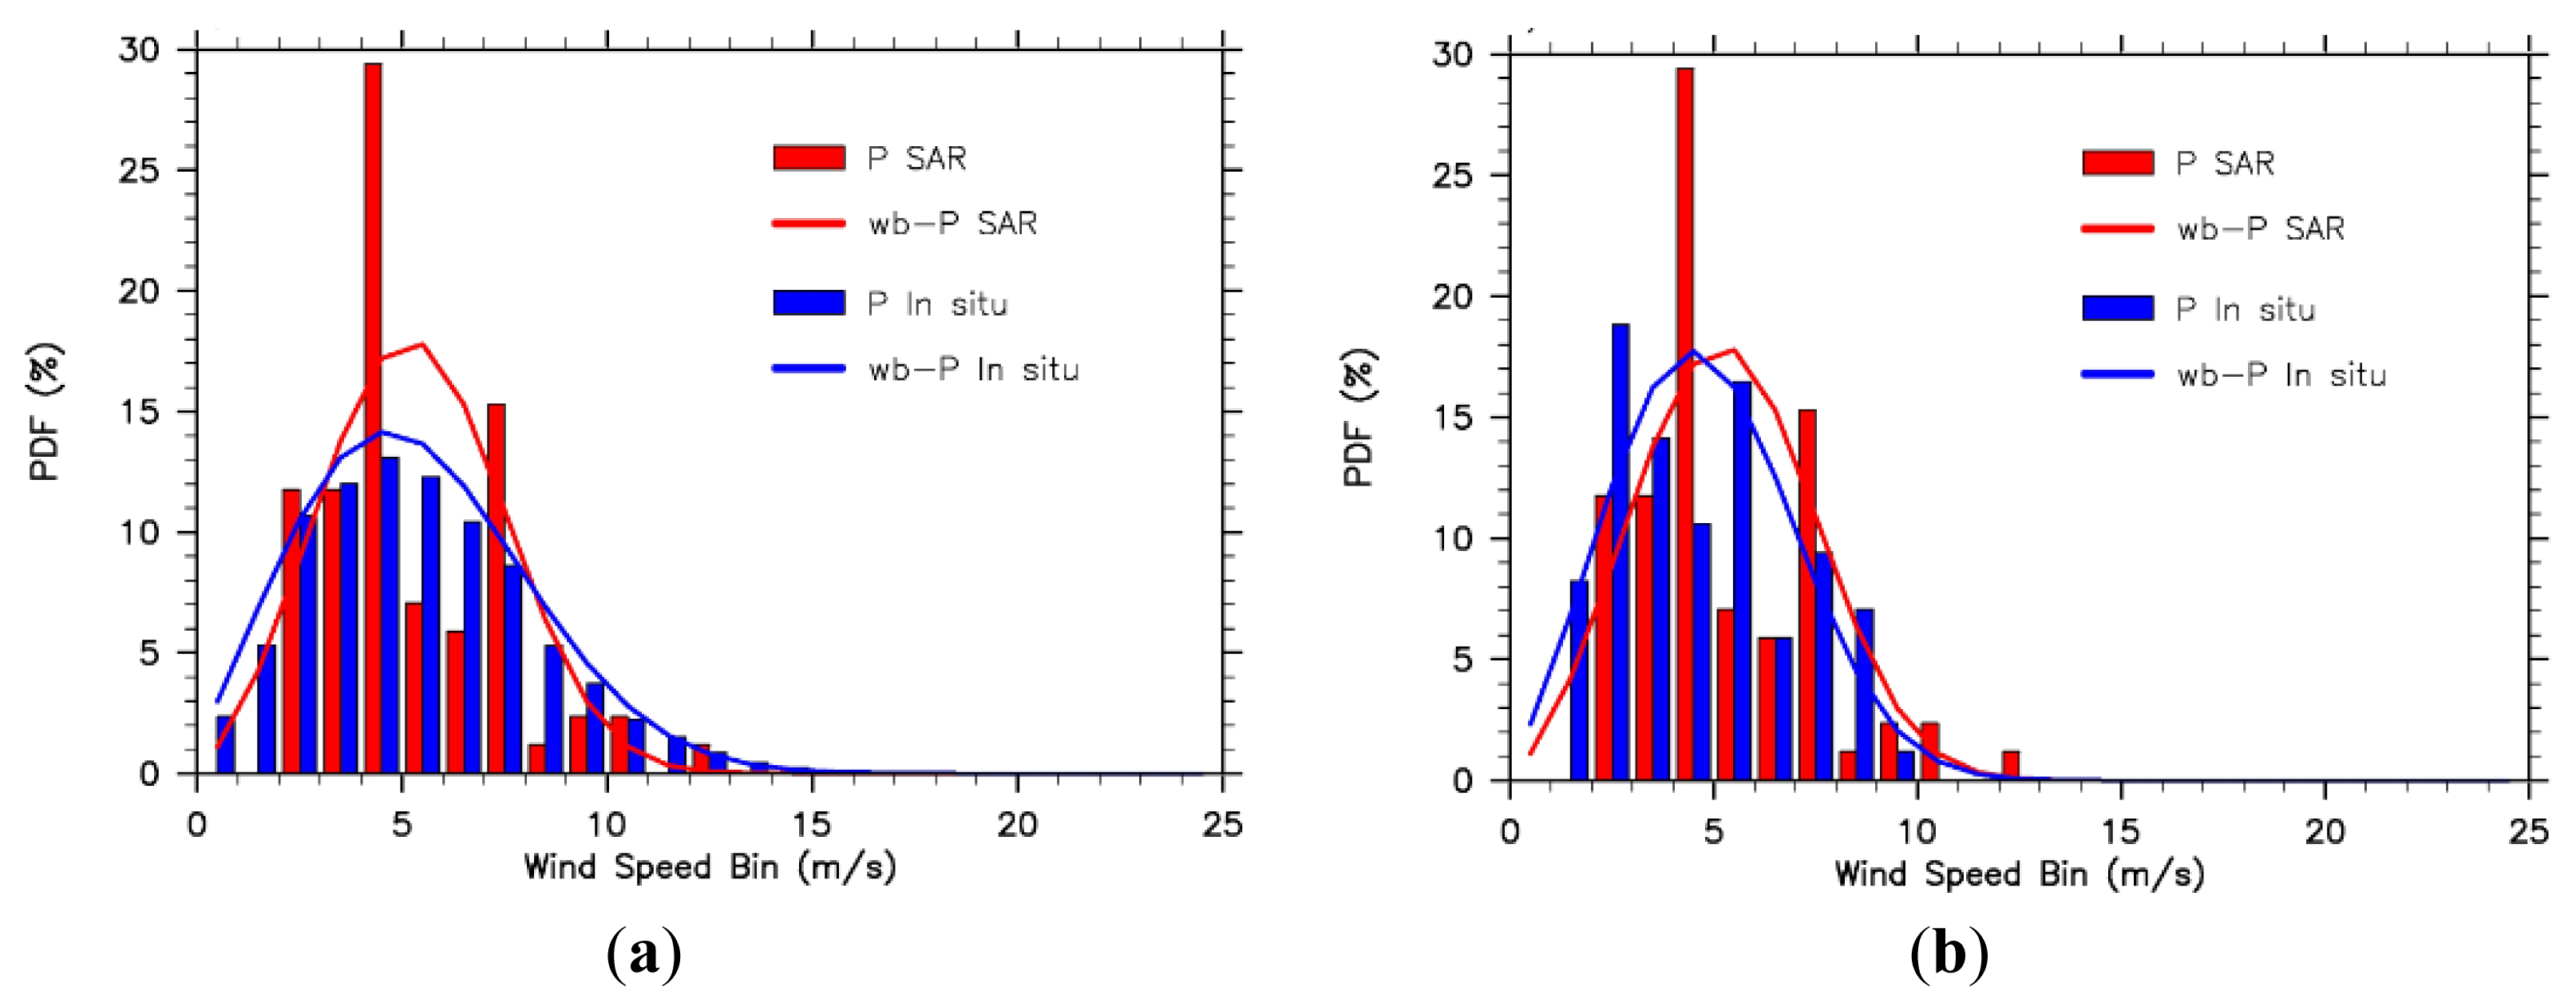
The wind energy parameters (mean wind speed, Weibull shape and scale parameters, and the wind power density) are calculated based on 81 ENVISAT ASAR wind maps and in situ measurements using two-parameter Weibull distribution function [7,23]. The former data represent twice-daily conditions (cf. Table 1). The mean μ of a sample is estimated by the average wind speed V, and the variance δ of a sample by standard deviation S is also estimated. Namely:
The wind power density, E, may be calculated from the two Weibull parameters, the scale parameter A and the shape parameter k, using the gamma function, and the air density ρ as:
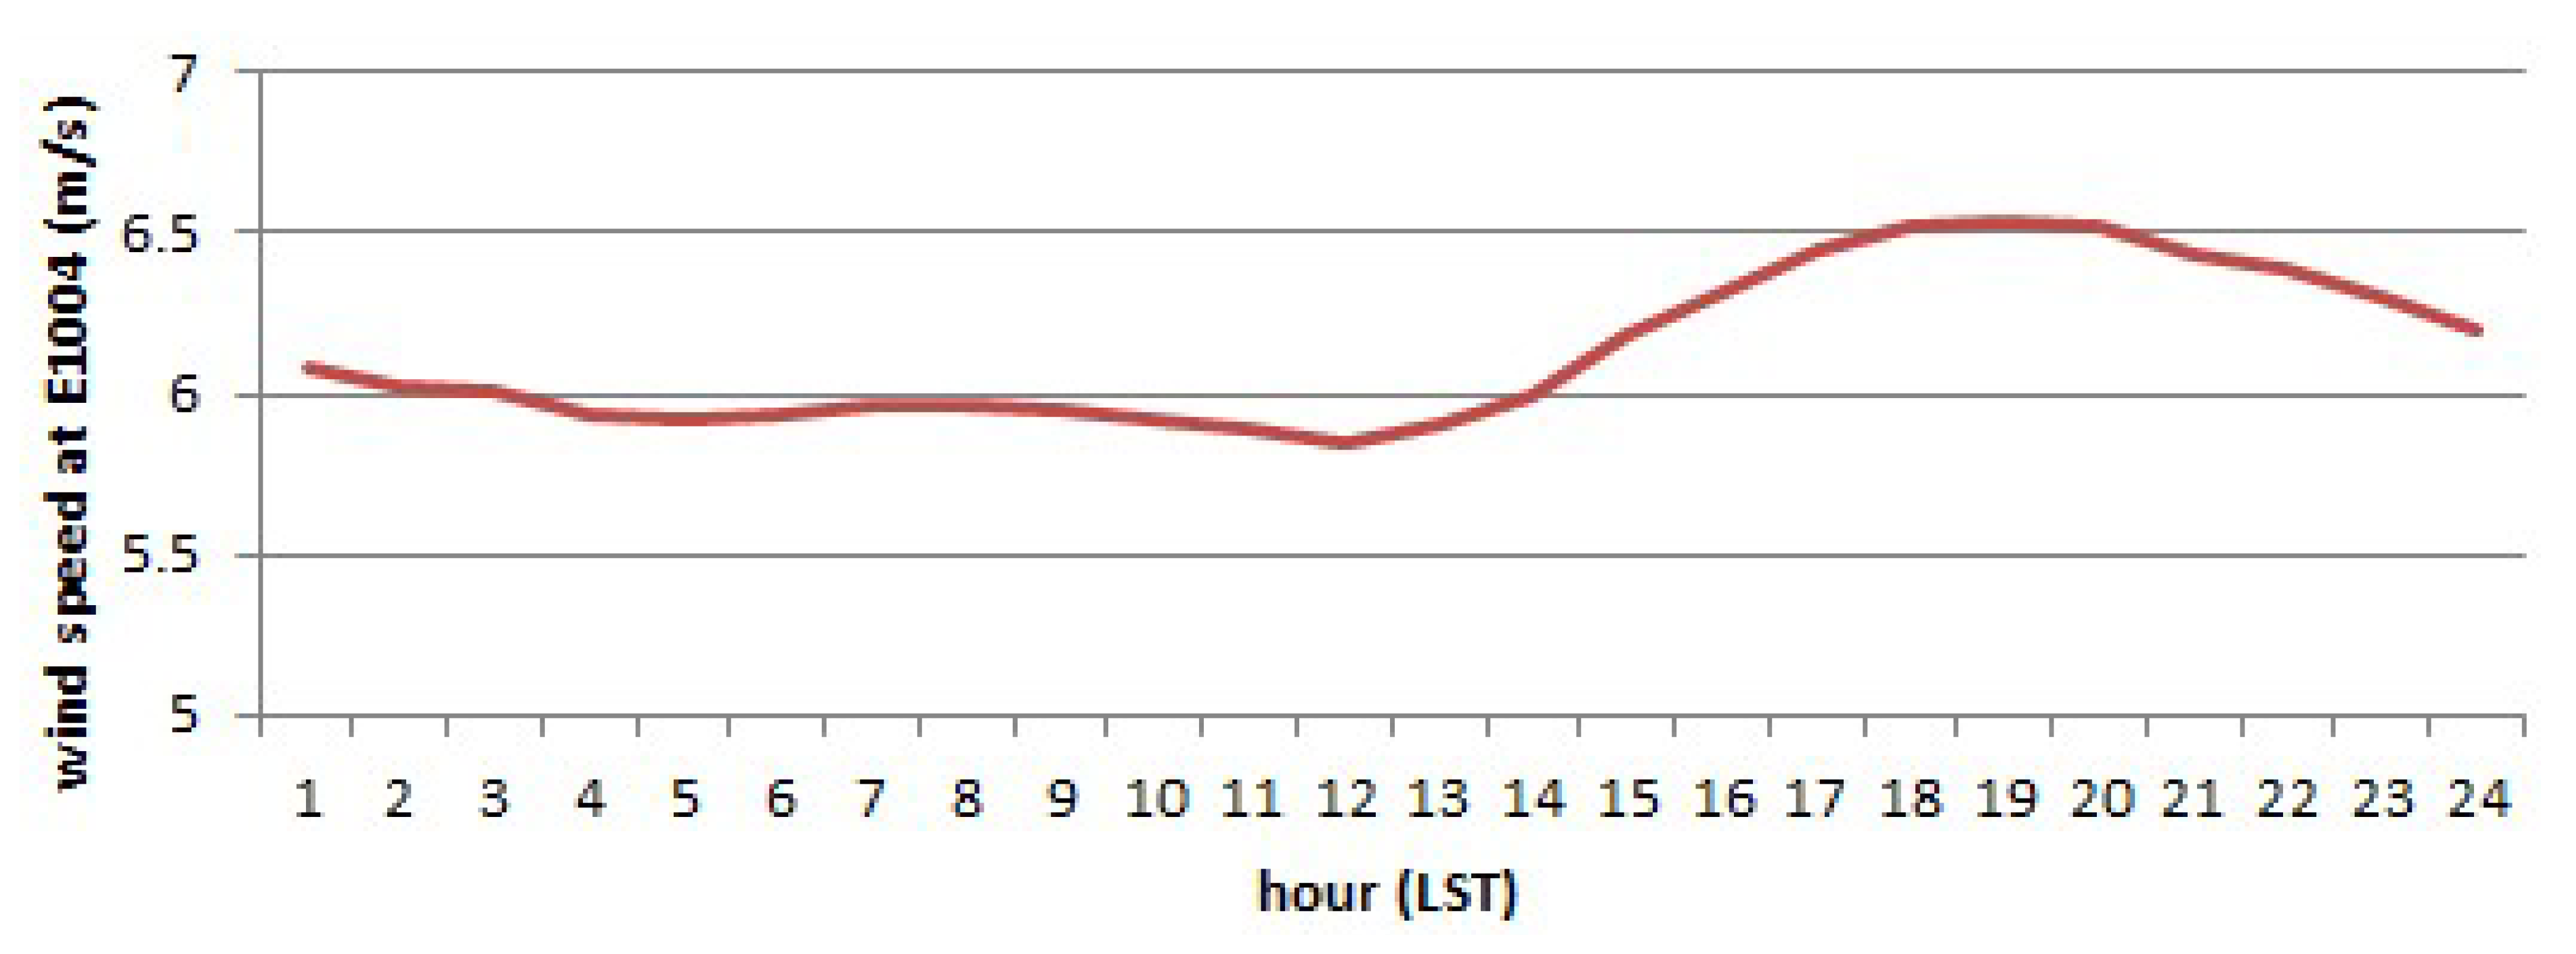
The Weibull distribution calculation, the wind speed distribution at E1004 and SAR-based data are shown in a histogram in Figure 7 and wind resource results are listed in Table 5. The comparison are processed using all met-data (n = 129,950) and data corresponding to the satellite recording times (n = 81), respectively. Since there is a pronounced diurnal cycle in the in situ data at E1004 (Figure 8) and the SAR measurements are always done in the morning and in the evening, the SAR samples appear not to estimate the true mean wind speed, Weibull A and k, and wind power density from the full in situ data set very well (Figure 7a). Likewise, the 81 concurrent samples selected from the in situ data set do not represent the full data series so well. Distributions from the 81 SAR and in situ samples show good agreement with each other (Figure 7b). As noted in Section 2, the number of SAR images collected in Hangzhou Bay are less than 200, and the data can only represent twice-daily conditions (cf. Table 1), the whole feature of the sea surface wind over this area may not be captured by these limited SAR data.
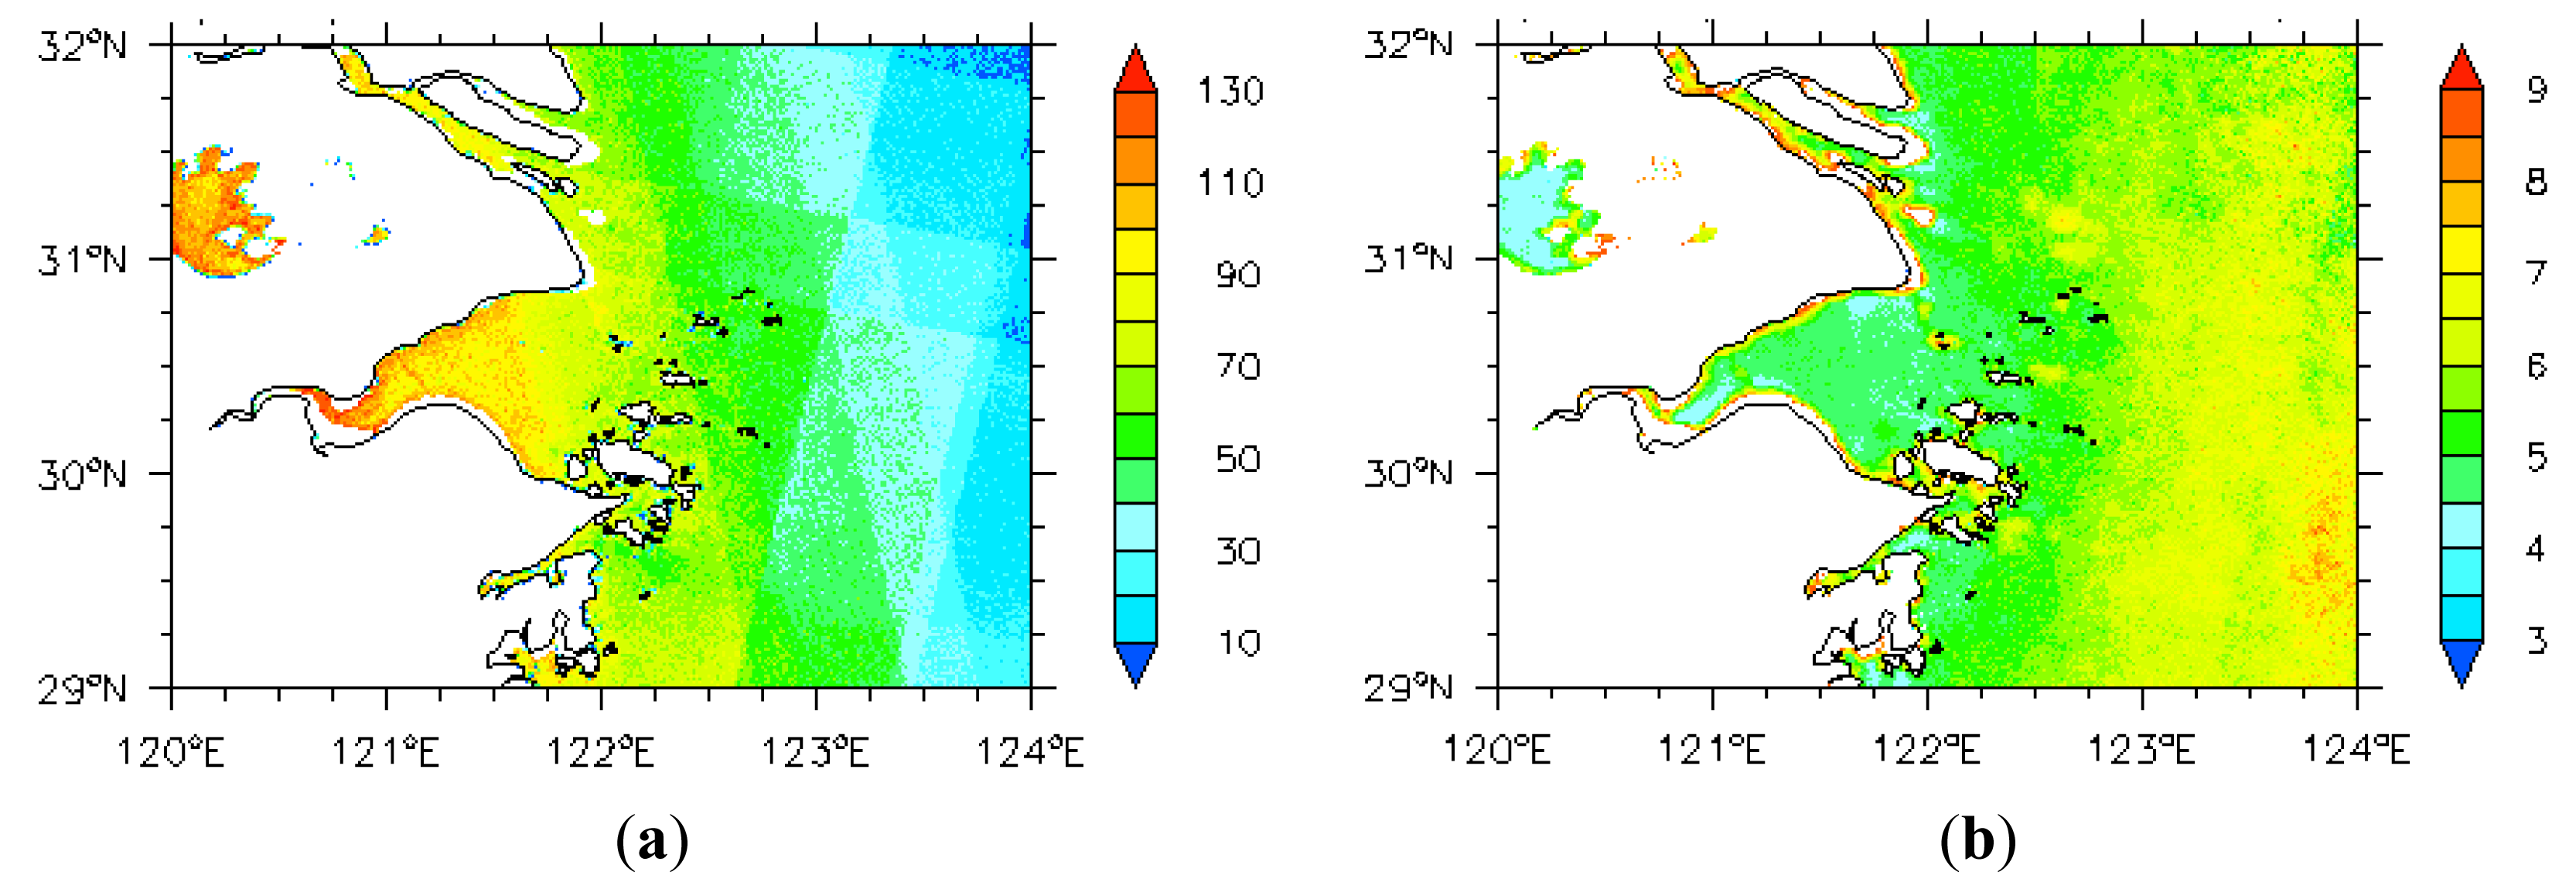
Finally, 181 satellite wind fields have been combined in a statistical analysis in order to map the offshore wind resource over the Hangzhou Bay. Figure 9a shows how the number of overlapping satellite scenes is variable but there are at least 70 samples everywhere in the offshore area. Figure 9b shows a map of the mean wind speed calculated from the SAR wind fields. The mean wind speed is mostly within the interval 5–8 m/s with significant gradients along the coastlines. This result is consistent with the variation features of Chinese offshore wind energy resource assessment completed in 2010 [24] at Hangzhou Bay. Again, if enough SAR images are available, the SAR-based wind maps will be more realistic and more credible. The 181 SAR images cannot describe the whole feature of offshore winds at Hangzhou Bay, they indeed capture one part of it.
5. Discussion
5.1. Complex Study Area
The concerned area, Hangzhou Bay, is located at the estuary of Yangtze River and dotted with many islands (cf. Figure 2). The sediment flow out from the Yangtze River and the mud flats occur frequently in this area, resulting changes in the sea level and offshore waves. These changes may introduce bias to the retrieval accuracy of the SAR wind in this area.
As noted in Section 2.2, most of the meteorological masts are not in the open ocean, but on the islands. They cannot reflect the real feature of the ocean exactly. Human activities from residents living in the islands maybe effect the observational environment of the meteorological masts as well as physical obstacles near the masts and the roughness of the terrain.
5.2. Characteristics of the Measurements
As noted in Section 1, there are peculiar differences between the in situ and SAR-based measurements: the former has a high temporal resolution but a limited spatial coverage, and the latter is just the opposite. Although the in situ measurements can be applied to assess the long-term change of offshore wind resource at a fixed site, the SAR-based measurements are much more applicable in the offshore wind resource over a large area.
The mean wind speed over Hangzhou Bay is about 5–8 m/s, which is not very high. The SAR wind retrieval is not optimal for wind speeds less than 2 m/s, so for these cases the winds may not be fully resolved from SAR. Thus with many samples of relatively low wind speed, the SAR mapping is not optimal.
6. Conclusions
The application method of the ENVISAT ASAR wind retrievals in the Chinese offshore seas for wind resources assessment has been studied. The in situ measurements from offshore masts at Hangzhou Bay are adopted to validate the SAR wind retrievals, and the results show imperfect consistency in wind speed, although comparison results in wind direction input is highly correlated with R of 0.89. The linear regression slope and bias in wind speed and wind direction are not so good than the comparable result in Baltic Sea done by Hasager et al. [9]. The poor correlation may be relative to the complex study area and limitation of the observational environment as mentioned in Section 5.
Comparison from the wind energy resource statistics shows that SAR images in Hangzhou Bay can capture only part of the whole offshore wind characteristic. Potentially, SAR-derived winds can be assimilated into numerical models to improve the accuracy of the offshore wind energy resource assessment, since the derived wind fields into a numerical model would be a better temporal sampling of the wind field in the test area and of its diurnal cycle. The comprehensive characteristics of the sea surface wind cannot be captured by a single satellite. Therefore, offshore wind resource assessments need to apply multiple wind data retrieved from different satellites if possible. With the development of satellite detection technology, the accuracy of the offshore wind energy resource assessment will continue to be improved.
Acknowledgments
This work was supported by the Sino-Danish Cooperation Project “Investigation on Key Techniques of Wind Power concerned with Complex Wind Resources in China (Grant No. 2010DFA62830)”.
Conflicts of Interest
The authors declare no conflict of interest.
References
- Zhang, X.Z.; Richard, B.; Zhu, R. Development Guide for Offshore Wind Farm in China; China Meteorological Press: Beijing, China, 2010; pp. 1–3. [Google Scholar]
- Christiansen, M.B.; Koch, K.; Horstmann, J.; Hasager, C.B.; Nielsen, M. Wind resource assessment from C-band SAR. Remote Sens. Environ. 2006, 105, 68–81. [Google Scholar]
- Bettenhausen, M.H.; Graig, K.S.; Richard, M.B.; Nai-Yu, W.; Gaiser, P.; Stephen, C. A nonlinear optimization algorithm for WindSat wind vector retrievals. IEEE Trans. Geosci. Remote Sens. 2006, 44, 597–610. [Google Scholar]
- Xu, J.W.; Yong, L.; Zhang, X.Z.; Zhu, R. China Offshore Wind Energy Resources Assessment with the QuickSCAT Data. Proceedings of the SPIE Remote Sensing of the Ocean, Sea Ice and Large Water Regions, Cardiff, UK, 13–15 September 2008; Volume 7105. [CrossRef]
- Chou, K.-H.; Wu, C.-C.; Lin, S.-Z. Assessment of the ASCAT wind error characteristics by global dropwindsonde observations. J. Geophys. Res. 2013, 118, 9011–9021. [Google Scholar]
- CISL Research Data Archive. Available online: http://rda.ucar.edu/ (accessed on 13 March 2014).
- Wang, B.X. Statistical inference for Weibull distribution. Chin. J. Appl. Probab. Stat. 1992, 8, 357–364, In Chinese. [Google Scholar]
- Badger, M.; Badger, J.; Nielsen, M.; Hasager, C.B.; Peña, P. Wind class sampling of satellite SAR imagery for offshore wind resource mapping. J. Appl. Meteorol. Clim. 2010, 49, 2474–2491. [Google Scholar]
- Hasager, C.B.; Christiansen, M.B.; Peña, A.; Larsén, X.G.; Bingöl, F. SAR-Based wind resource statistics in the Baltic Sea. Remote Sens. 2011, 3, 117–144. [Google Scholar]
- Barthelmie, R.J.; Pryor, S.C. Can satellite sampling of offshore wind speeds realistically represent wind speed distributions. J. Appl. Meteorol. 2003, 42, 83–94. [Google Scholar]
- Pryor, S.C.; Nielsen, M.; Barthelmie, R.J.; Mann, J. Can satellite sampling of offshore wind speeds realistically represent wind speed distributions? Part II: Quantifying uncertainties associated with sampling strategy and distribution fitting methods. J. Appl. Meteorol. 2004, 43, 739–750. [Google Scholar]
- Horstmann, J.; Koch, W.; Lehner, S. Ocean wind fields retrieved from the advanced synthetic aperture radar aboard ENVISAT. Ocean. Dyn. 2004, 54, 570–576. [Google Scholar]
- Kerbaol, V. Improved Bayesian Wind Vector Retrieval Scheme Using ENVISAT ASAR Data: Principles and Validation Results. Proceedings of the ENVISAT Symposium 2007, Montreux, Switzerland, 23–27 April 2007; pp. 1–6.
- Monaldo, F.; Kerbaol, V.; Clemente-Colón, P.; Furevik, B.; Horstmann, J.; Johannessen, J.; Li, X.; Pichel, W.; Sikora, T.D.; Thomson, D.J.; et al. The SAR Measurement of Ocean surface Winds: An Overview. Proceedings of the Second Workshop Coastal and Marine Applications of SAR, Svalbard, Norway, 2–12 September 2003; pp. 15–32.
- Hasager, C.B.; Nielsen, M.; Astrup, P.; Barthelmie, R.J.; Dellwik, E.; Jensen, N.O. Offshore wind resource estimation from satellite SAR wind field maps. Wind Energy 2005, 8, 403–419. [Google Scholar]
- Choisnard, J.; Lafrane, G.; Bernier, M. SAR-satellite for offshore and coastal wind resource analysis, with examples from St. Lawrence Gulf, Canada. Wind Eng. 2005, 28, 367–382. [Google Scholar]
- Schneiderhan, T.; Lehner, S.; Shulz-Stellenfleth, J.; Horstmann, J. Comparison of offshore wind park sites using SAR wind measurement techniques. Meteorol. Appl. 2005, 12, 101–110. [Google Scholar]
- Horstmann, J.; Schiller, H.; Schulz-Stellenfleth, J.; Lehner, S. Global wind speed retrieval form SAR. IEEE Trans. Geosci. Remote Sens. 2003, 41, 2277–2286. [Google Scholar]
- Monaldo, F.M.; Thompson, D.R.; Pichel, W.G.; Clemente-Colon, P. A systematic comparison of QuickSCAT and SAR ocean surface wind speeds. IEEE Trans. Geosci. Remote Sens. 2004, 42, 283–291. [Google Scholar]
- Hersbach, H.; Stoffelen, A.; de Haan, S. An improved C-band scatterometer ocean geophysical model function: CMOD5. J. Geophy. Res. Oceans (1978–2012) 2007, 112. [Google Scholar] [CrossRef]
- Dagestad, K.-F.; Horstmann, J.; Mouche, A.; Perrie, W.; Shen, H.; Zhang, B.; Li, X.; Monaldo, F.; Pichel, W.; Lehner, S.; et al. Wind Retrieval from Synthetic Aperture Radar—An Overview. Proceedings of the 4th SAR Oceanography Workshop (SEASAR 2012), Tromsø, Norway, 18–22 June 2012; pp. 1–24.
- Li, Z.K.; Pan, Y.X.; Sun, R.Q. Meteorology Principles and Applications for Air Pollution; China Meteorological Press: Beijing, China, 1985; pp. 81–84. [Google Scholar]
- Wei, G.H.; Shen, L.; He, Y.C. Applications of two-parameter Weibull distribution function in analysis of wind data of the Shinille reservoir. Desert Oasis Meteorol. 2008, 2, 38–40, In Chinese. [Google Scholar]
- Xiao, Z.N.; Zhu, R.; Song, L.L. Wind Energy Resources Assessment in China 2009; China Meteorological Press: Beijing, China, 2010; p. 35, In Chinese. [Google Scholar]


| Year | 2009 | 2010 | 2011 | - | - | - | - | - | - | - | - | - |
|---|---|---|---|---|---|---|---|---|---|---|---|---|
| Number of scenes | 16 | 70 | 95 | - | - | - | - | - | - | - | - | - |
| Month | 1 | 2 | 3 | 4 | 5 | 6 | 7 | 8 | 9 | 10 | 11 | 12 |
| Number of scenes | 15 | 12 | 17 | 14 | 20 | 20 | 14 | 17 | 25 | 10 | 10 | 7 |
| Met mast | Ocean, coastal | H | D | Period | Zu | Zdir | AC |
|---|---|---|---|---|---|---|---|
| E1004 | Ocean | 0 | −0.8 | April 2009–December 2012 | 20, 40, 60, 80, 90, 100 | 20, 100 | 0.1 |
| 58573 | Coastal | 0 | −34.8 | September 2010–December 2011 | 10 | 10 | 0.1 |
| K9554 | Coastal | 3.5 | 0.07 | December 2009–December 2011 | 10 | 10 | 0.1 |
| K9529 | Coastal | 7.7 | 0.10 | December 2009–December 2011 | 10 | 10 | 0.1 |
| 58472 | Coastal | 7.9 | 1.08 | December 2009–December 2011 | 10 | 10 | 0.1 |
| K9512 | Coastal | 8.1 | 0.08 | December 2009–December 2011 | 10 | 10 | 0.1 |
| K9524 | Coastal | 9.0 | 0.08 | December 2009–December 2011 | 10 | 10 | 0.1 |
| K9568 | Coastal | 9.8 | 0.08 | December 2009–December 2011 | 10 | 10 | 0.1 |
| K9533 | Coastal | 10.5 | 0.15 | December 2009–December 2011 | 10 | 10 | 0.1 |
| 58473 | Coastal | 12.4 | 0.21 | December 2009–December 2011 | 10 | 10 | 0.1 |
| K9517 | Coastal | 13.5 | 0.48 | December 2009–December 2011 | 10 | 10 | 0.1 |
| K9545 | Coastal | 14.4 | 0.2 | December 2009–December 2011 | 10 | 10 | 0.1 |
| K9544 | Coastal | 15.1 | 0.2 | December 2009–December 2011 | 10 | 10 | 0.1 |
| Station No. | N | R | RMSE | SD | Bias | Slope |
|---|---|---|---|---|---|---|
| E1004 | 81 | 0.48 | 2.10 | 2.10 | 3.13 | 0.47 |
| 58573 | 40 | 0.78 | 2.17 | 1.82 | −0.39 | 0.87 |
| K9554 | 77 | 0.72 | 0.24 | 1.71 | 1.72 | 0.52 |
| K9529 | 91 | 0.70 | 2.66 | 1.95 | 1.94 | 0.45 |
| 58472 | 56 | 0.69 | 2.05 | 1.96 | 2.06 | 0.55 |
| K9512 | 61 | 0.79 | 2.00 | 1.75 | 1.76 | 0.57 |
| K9524 | 58 | 0.75 | 2.48 | 2.14 | 2.10 | 0.47 |
| K9568 | 58 | 0.79 | 1.80 | 1.62 | 1.17 | 0.66 |
| All | 522 | 0.67 | 2.23 | 1.99 | 2.01 | 0.52 |
| Station No. | N | R | RMSE | SD | Bias | Slope |
|---|---|---|---|---|---|---|
| E1004 | 67 | 0.895 | 56.051 | 36.788 | −36.80 | 0.97 |
| 58573 | 31 | 0.975 | 22.187 | 22.544 | −0.61 | 1.01 |
| K9554 | 71 | 0.895 | 41.264 | 40.991 | 20.55 | 0.91 |
| K9529 | 86 | 0.898 | 41.578 | 39.852 | 4.08 | 0.90 |
| 58472 | 51 | 0.880 | 44.188 | 44.601 | 23.34 | 0.85 |
| K9512 | 55 | 0.930 | 36.317 | 36.536 | 11.36 | 0.95 |
| K9524 | 49 | 0.863 | 48.508 | 47.739 | −4.86 | 0.96 |
| K9568 | 54 | 0.915 | 38.084 | 38.358 | 6.27 | 0.94 |
| All | 464 | 0.890 | 43.079 | 42.310 | 5.26 | 0.92 |
| E1004 | Entire in situ data set | Subset of the in situ data set | SAR |
|---|---|---|---|
| Mean wind speed (m/s) | 5.89 | 5.30 | 5.82 |
| Weibull A (m/s) | 6.65 | 5.97 | 6.52 |
| Weibull K | 2.28 | 2.65 | 2.98 |
| Power density (W/m2) | 211.8 | 138.3 | 169.9 |
| N | 129,950 | 81 | 81 |
© 2014 by the authors; licensee MDPI, Basel, Switzerland. This article is an open access article distributed under the terms and conditions of the Creative Commons Attribution license ( http://creativecommons.org/licenses/by/3.0/).
Share and Cite
Chang, R.; Zhu, R.; Badger, M.; Hasager, C.B.; Zhou, R.; Ye, D.; Zhang, X. Applicability of Synthetic Aperture Radar Wind Retrievals on Offshore Wind Resources Assessment in Hangzhou Bay, China. Energies 2014, 7, 3339-3354. https://doi.org/10.3390/en7053339
Chang R, Zhu R, Badger M, Hasager CB, Zhou R, Ye D, Zhang X. Applicability of Synthetic Aperture Radar Wind Retrievals on Offshore Wind Resources Assessment in Hangzhou Bay, China. Energies. 2014; 7(5):3339-3354. https://doi.org/10.3390/en7053339
Chicago/Turabian StyleChang, Rui, Rong Zhu, Merete Badger, Charlotte Bay Hasager, Rongwei Zhou, Dong Ye, and Xiaowei Zhang. 2014. "Applicability of Synthetic Aperture Radar Wind Retrievals on Offshore Wind Resources Assessment in Hangzhou Bay, China" Energies 7, no. 5: 3339-3354. https://doi.org/10.3390/en7053339
APA StyleChang, R., Zhu, R., Badger, M., Hasager, C. B., Zhou, R., Ye, D., & Zhang, X. (2014). Applicability of Synthetic Aperture Radar Wind Retrievals on Offshore Wind Resources Assessment in Hangzhou Bay, China. Energies, 7(5), 3339-3354. https://doi.org/10.3390/en7053339