
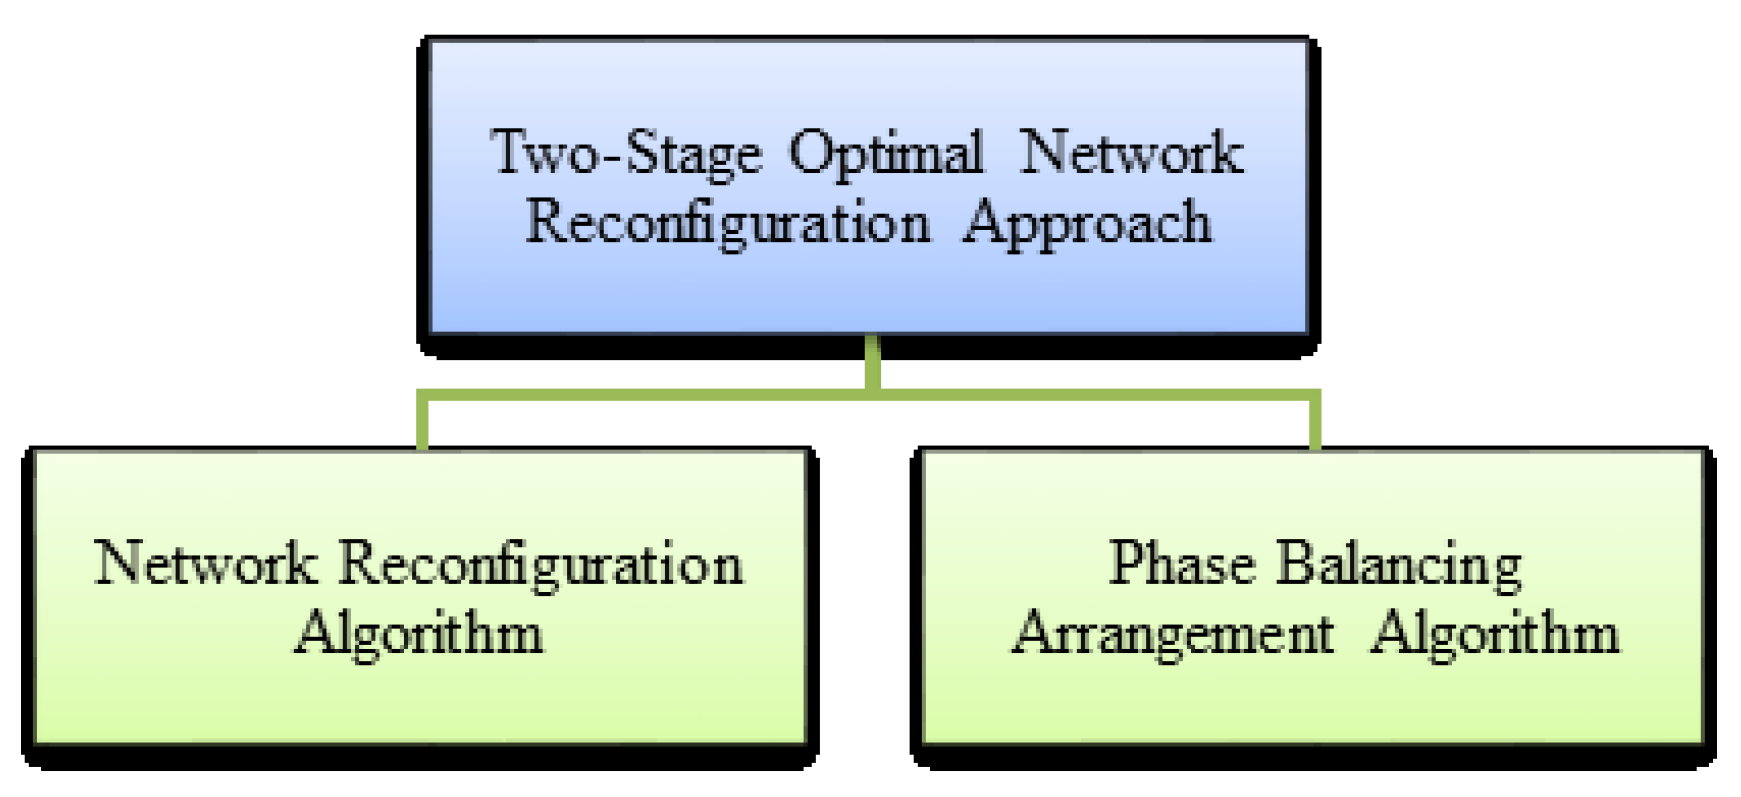
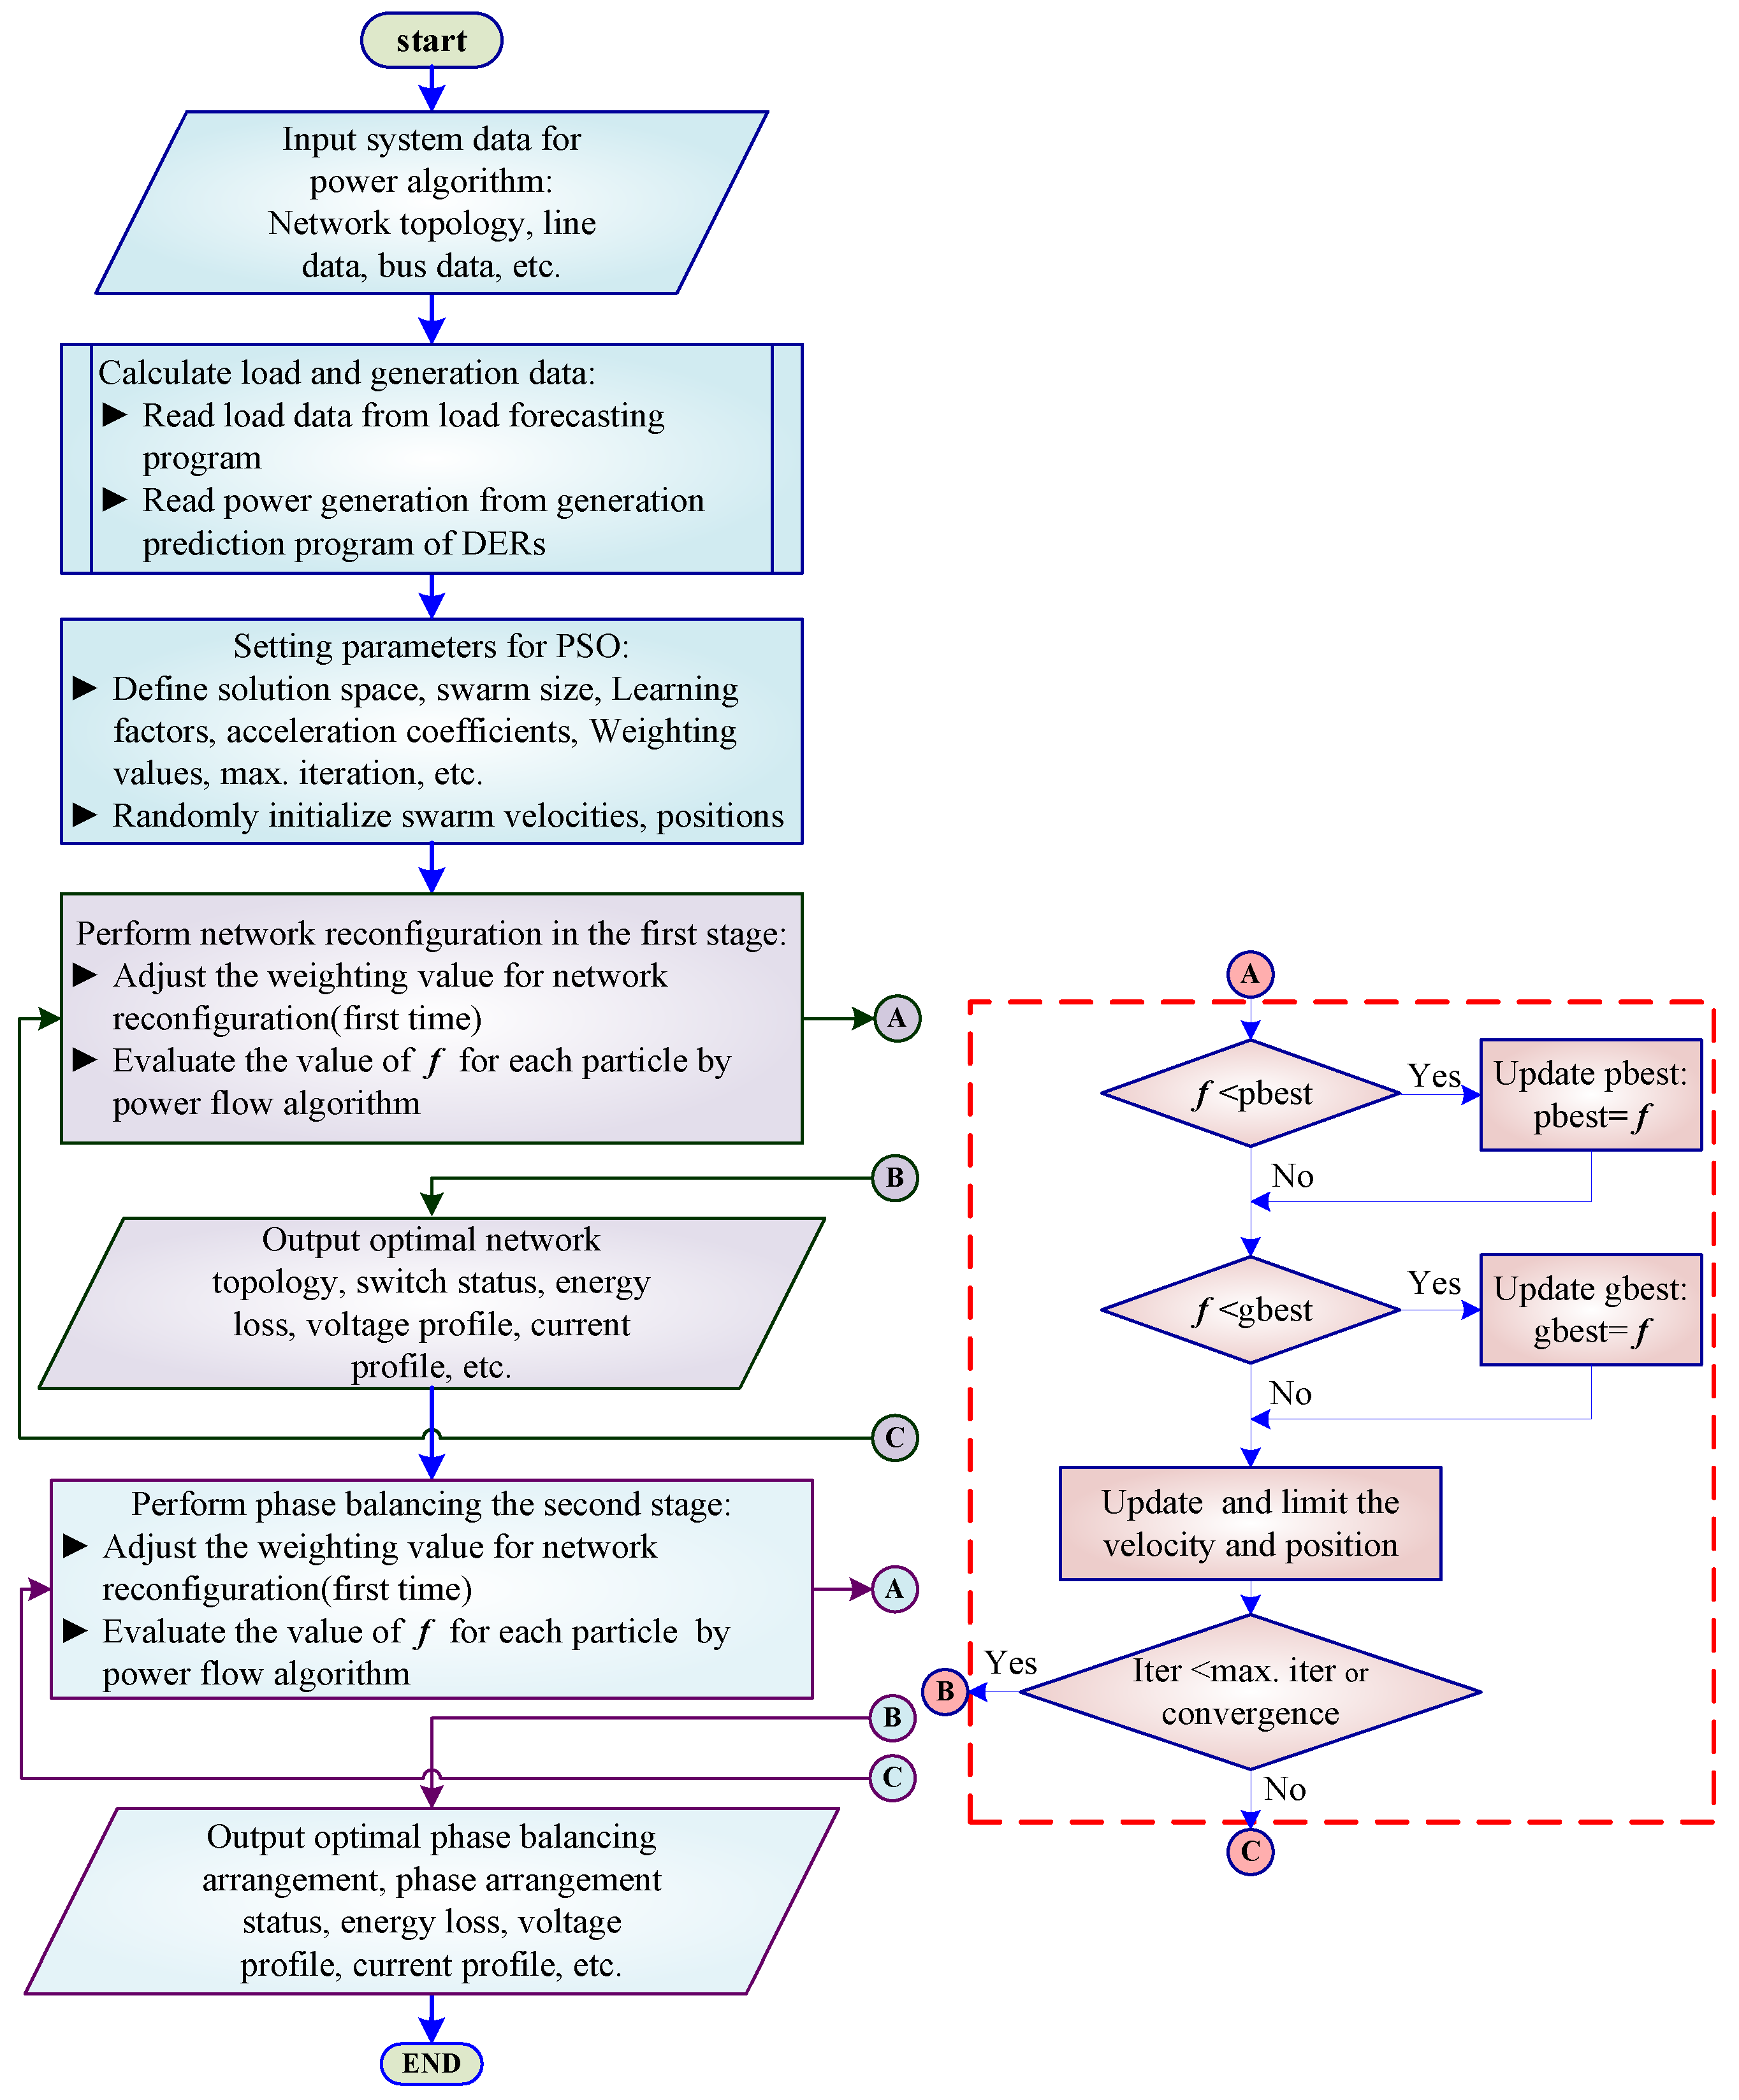
A Two-stage Optimal Network Reconfiguration Approach for Minimizing Energy Loss of Distribution Networks Using Particle Swarm Optimization Algorithm

 ,
, 
Abstract
:1. Introduction
2. Problem Formulation
2.1. Describes Network Reconfiguration Problem
- Mathematical optimization methods,
- Heuristic methods,
- Artificial intelligence methods.
2.2. Describes Phase Balancing Problem

2.3. Particle Swarm Optimization Algorithm
2.4. Power Flow Algorithm
2.5. Description of the Objective Function

2.5.1. Three-Phase Voltage Unbalance
2.5.2. Energy Loss
2.5.3. Multi-Objective Function

3. Numerical Results
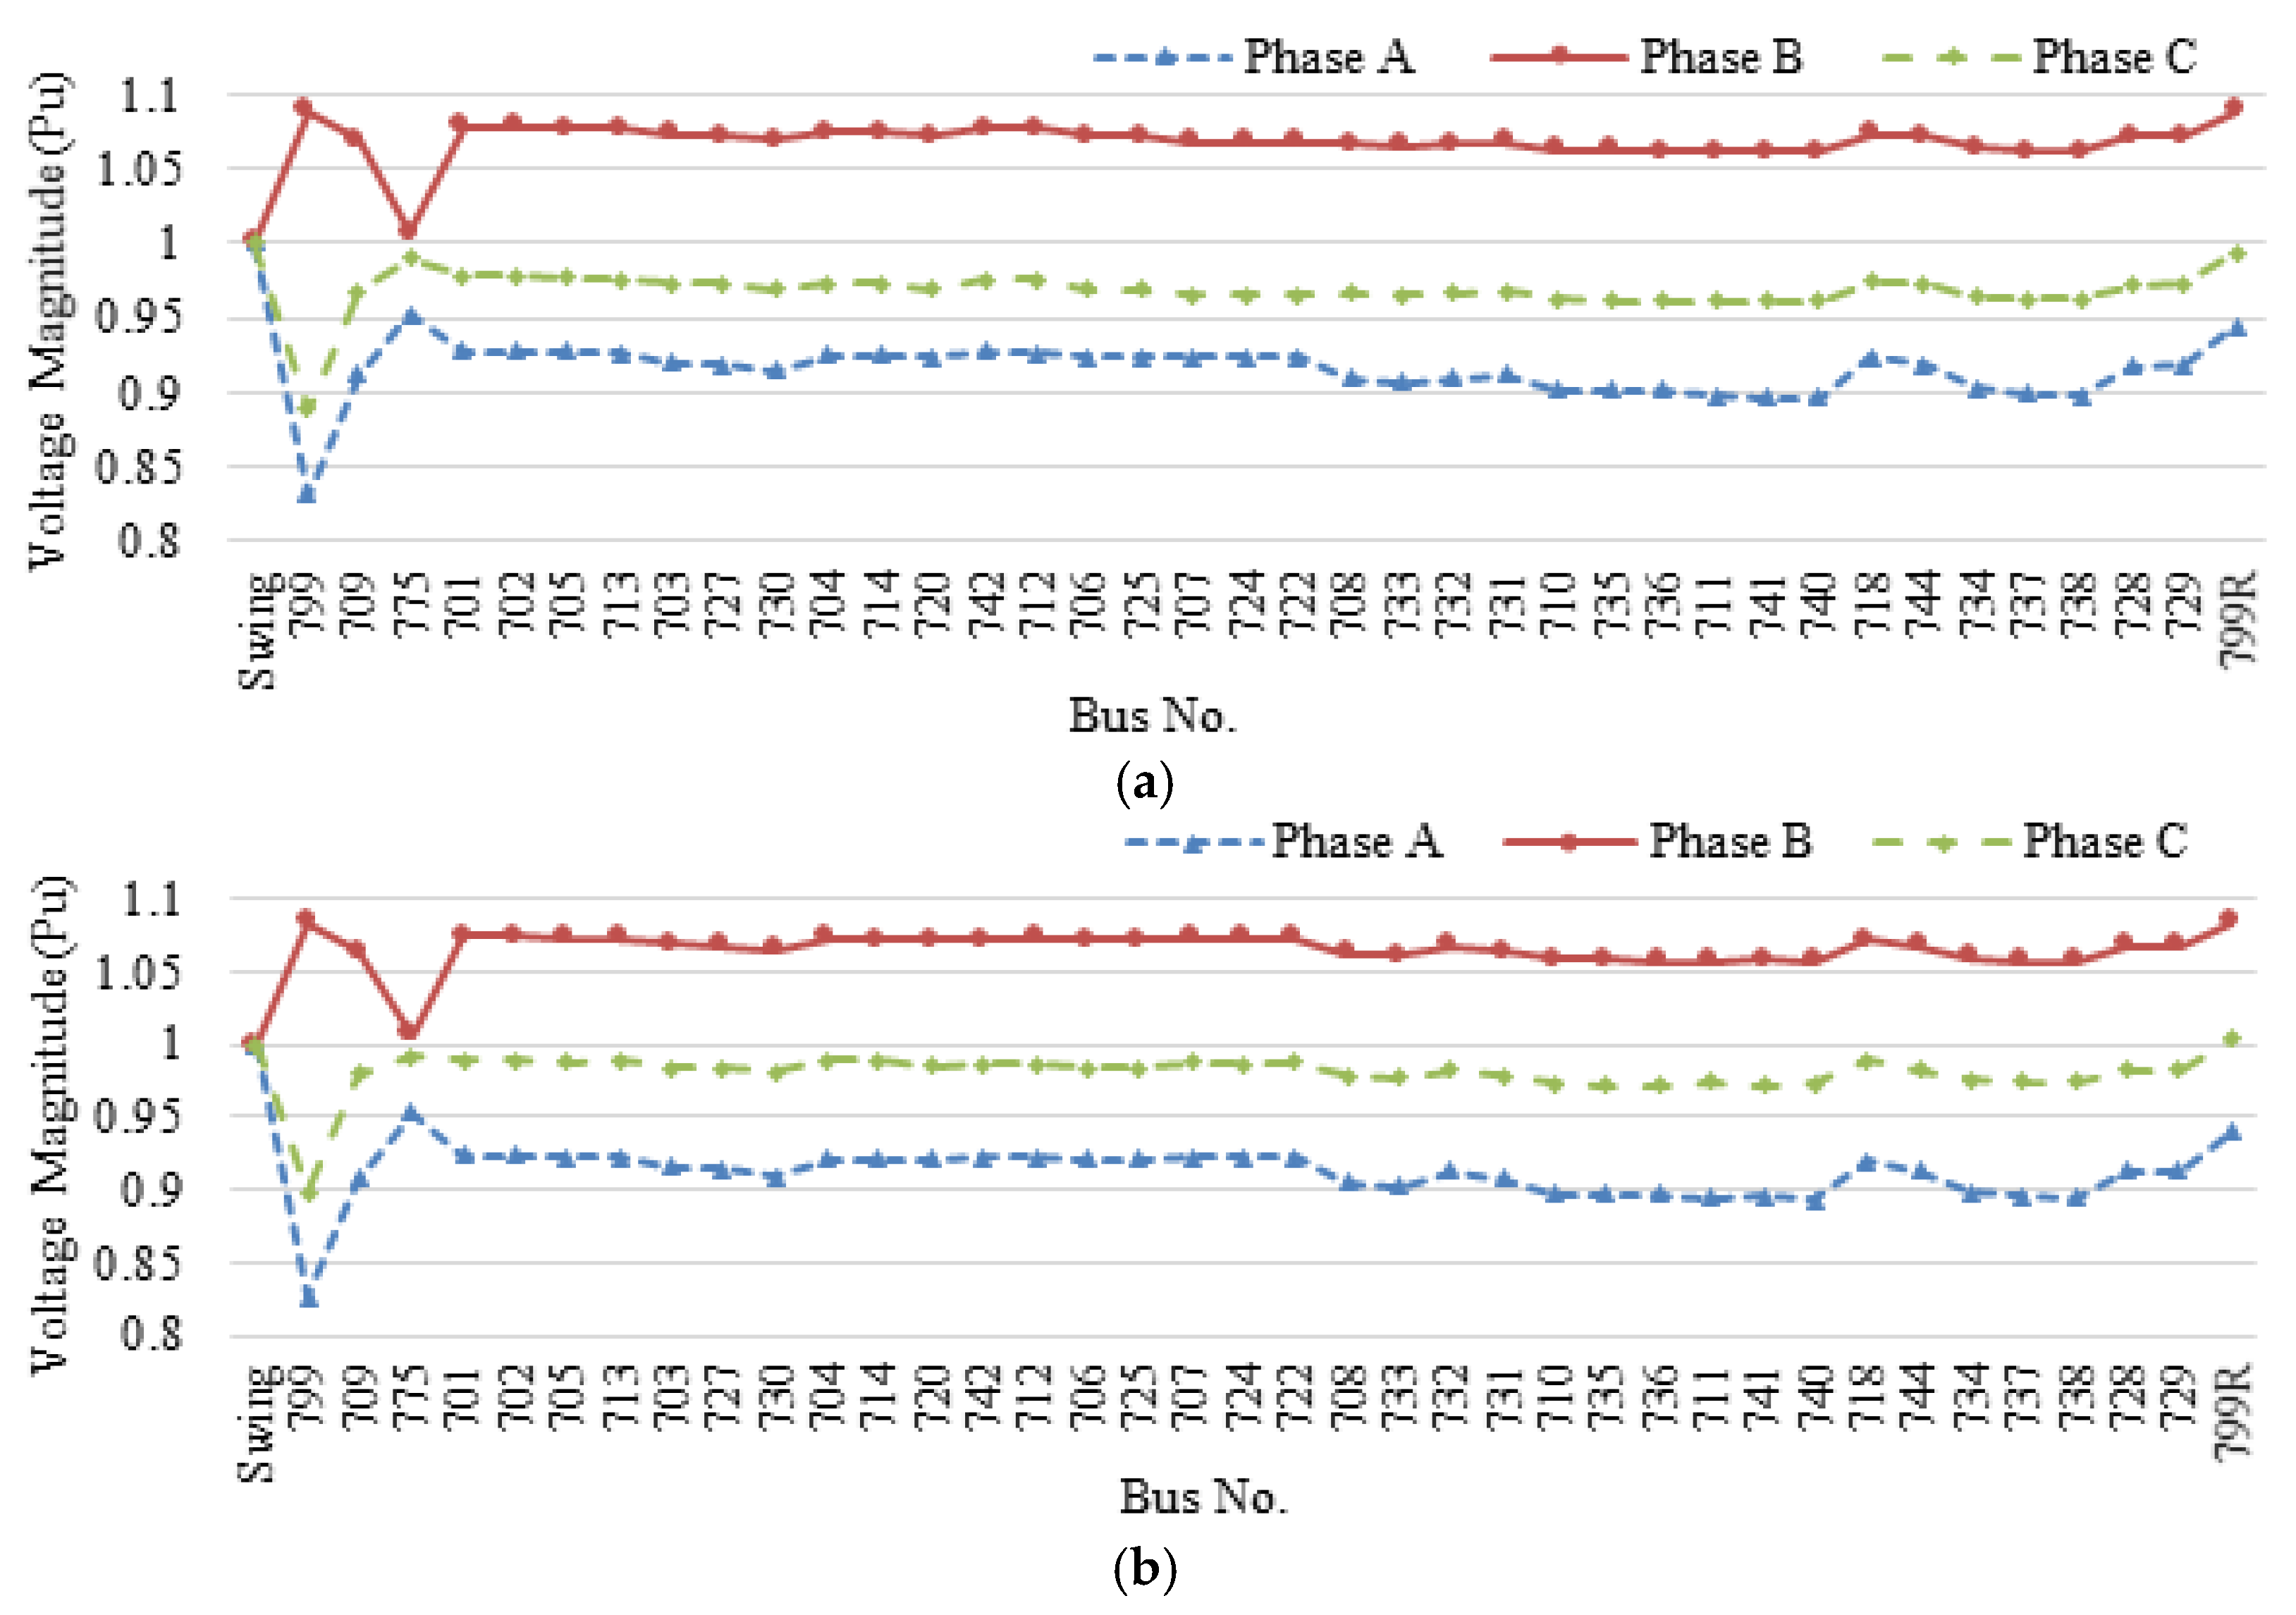
3.1. IEEE 37-Bus Test System

| Stage | Parameter | ||||||
|---|---|---|---|---|---|---|---|
| Particle | Max. iteration | c1 | c2 | w1 | w2 | w3 | |
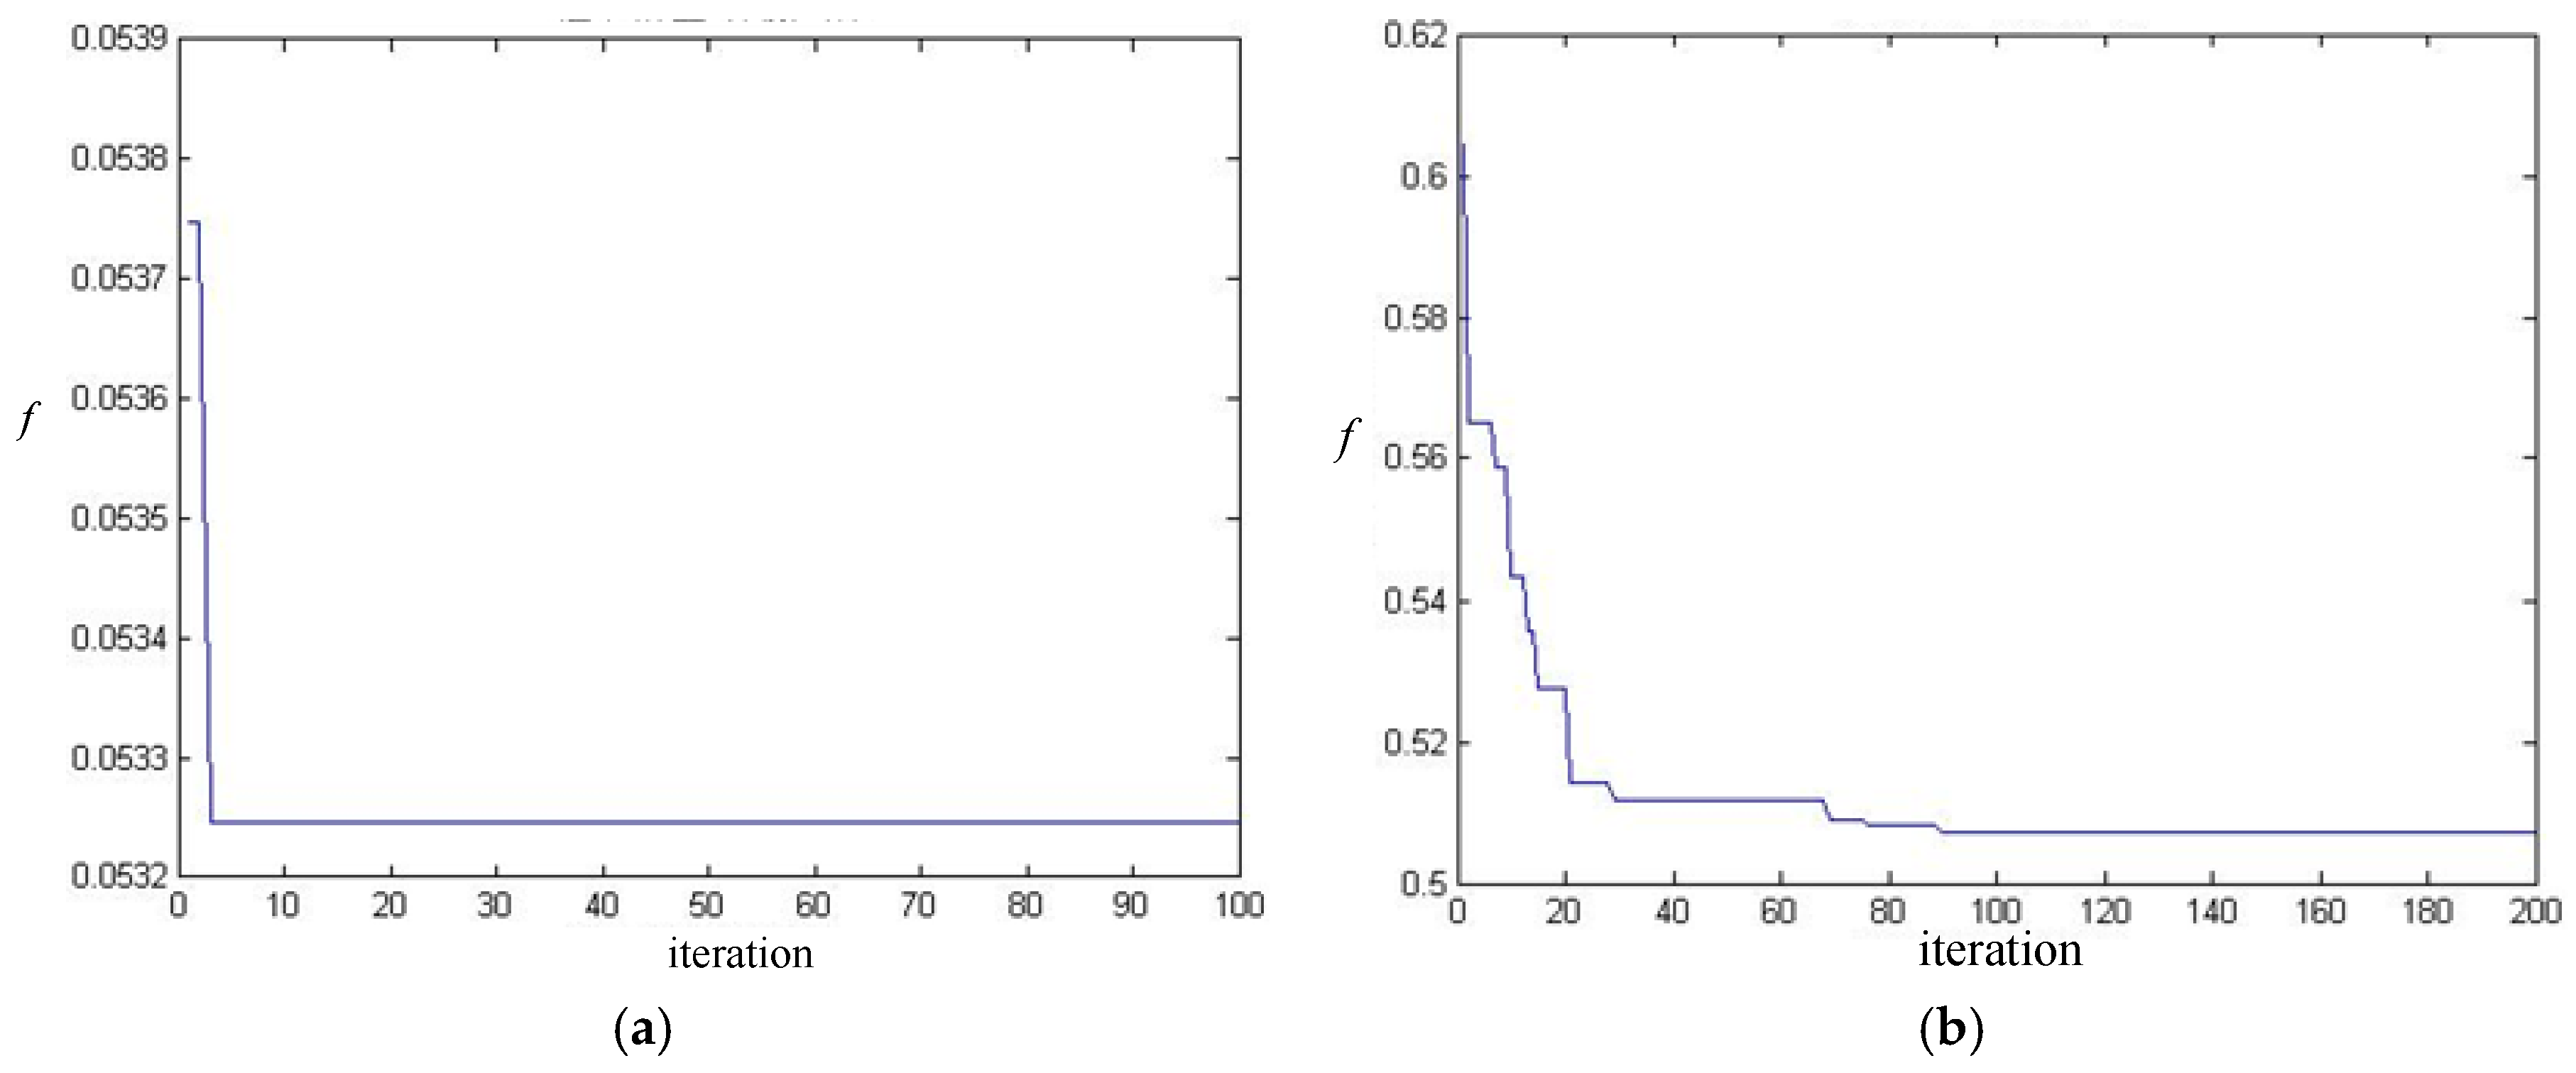
| First stage | 100 | 200 | 2 | 2 | 1 | 0 | 0 |
| Second stage | 500 | 200 | 2 | 2 | 0.7 | 0.15 | 0.15 |
| Bus | Loads | Before phase balancing | |||||
|---|---|---|---|---|---|---|---|
| Phase A | Phase B | Phase C | |||||
| Bus number | Phase type | P (kW) | Q (kvar) | P (kW) | Q (kvar) | P (kW) | Q (kvar) |
| 701 | ABC | 224.54 | 181.07 | 144.03 | 72.02 | 279.58 | 70.99 |
| 712 | AC | 33.24 | 42.85 | 0 | 0 | 54.21 | −1.7 |
| 713 | AC | 33.24 | 42.85 | 0 | 0 | 54.21 | −1.7 |
| 714 | ABC | 10.84 | −0.34 | 20.07 | 8.21 | 8.18 | 10.65 |
| 718 | AB | 54.21 | −1.7 | 33.24 | 42.85 | 0 | 0 |
| 720 | AC | 33.24 | 42.85 | 0 | 0 | 54.21 | −1.7 |
| 722 | ABC | 8.18 | 10.65 | 90.36 | −0.69 | 67.09 | 72.34 |
| 724 | BC | 0 | 0 | 27.11 | −0.21 | 16.1 | 21.81 |
| 725 | BC | 0 | 0 | 27.11 | −0.21 | 16.1 | 21.81 |
| 727 | AC | 16.1 | 21.81 | 0 | 0 | 27.11 | −0.21 |
| 728 | ABC | 42 | 21 | 42 | 21 | 42 | 21 |
| 729 | AB | 27.11 | −0.21 | 16.1 | 21.81 | 0 | 0 |
| 730 | AC | 33.24 | 42.85 | 0 | 0 | 54.21 | −1.7 |
| 731 | BC | 0 | 0 | 54.21 | −1.7 | 33.24 | 42.85 |
| 732 | AC | 16.1 | 21.81 | 0 | 0 | 27.11 | −0.21 |
| 733 | AB | 54.21 | −1.7 | 33.24 | 42.85 | 0 | 0 |
| 734 | AC | 16.1 | 21.81 | 0 | 0 | 27.11 | −0.21 |
| 735 | AC | 33.24 | 42.85 | 0 | 0 | 54.21 | −1.7 |
| 736 | BC | 0 | 0 | 27.11 | −0.21 | 16.1 | 21.81 |
| 737 | AB | 90.36 | −0.68 | 53.37 | 72.7 | 0 | 0 |
| 738 | AB | 81.06 | −1.13 | 42.56 | 64.92 | 0 | 0 |
| 740 | AC | 33.24 | 42.85 | 0 | 0 | 54.21 | −1.7 |
| 741 | AC | 16.1 | 21.81 | 0 | 0 | 27.11 | −0.21 |
| 742 | ABC | 5.16 | −0.04 | 57.27 | 2.45 | 33.24 | 42.85 |
| 744 | AB | 27.11 | −0.21 | 16.1 | 21.81 | 0 | 0 |
| Total | 888.62 | 551.05 | 683.88 | 367.6 | 945.33 | 315.07 | |
| Bus | Loads | After phase balancing | |||||
| Phase A | Phase B | Phase C | |||||
| Bus number | Phase type | P (kW) | Q (kvar) | P (kW) | Q (kvar) | P (kW) | Q (kvar) |
| 701 | ABC | 144.03 | 72.02 | 279.58 | 70.99 | 224.54 | 181.07 |
| 712 | AC | 33.24 | 42.85 | 0 | 0 | 54.21 | −1.7 |
| 713 | AC | 33.24 | 42.85 | 0 | 0 | 54.21 | −1.7 |
| 714 | ABC | 20.07 | 8.21 | 10.84 | −0.34 | 8.18 | 10.65 |
| 718 | AB | 54.21 | −1.7 | 33.24 | 42.85 | 0 | 0 |
| 720 | AC | 33.24 | 42.85 | 0 | 0 | 54.21 | −1.7 |
| 722 | ABC | 8.18 | 10.65 | 67.09 | 72.34 | 90.36 | −0.69 |
| 724 | BC | 0 | 0 | 16.1 | 21.81 | 27.11 | −0.21 |
| 725 | BC | 0 | 0 | 27.11 | −0.21 | 16.1 | 21.81 |
| 727 | AC | 16.1 | 21.81 | 0 | 0 | 27.11 | −0.21 |
| 728 | ABC | 42 | 21 | 42 | 21 | 42 | 21 |
| 729 | AB | 27.11 | −0.21 | 16.1 | 21.81 | 0 | 0 |
| 730 | AC | 33.24 | 42.85 | 0 | 0 | 54.21 | −1.7 |
| 731 | BC | 0 | 0 | 54.21 | −1.7 | 33.24 | 42.85 |
| 732 | AC | 27.11 | −0.21 | 0 | 0 | 16.1 | 21.81 |
| 733 | AB | 33.24 | 42.85 | 54.21 | −1.7 | 0 | 0 |
| 734 | AC | 16.1 | 21.81 | 0 | 0 | 27.11 | −0.21 |
| 735 | AC | 33.24 | 42.85 | 0 | 0 | 54.21 | −1.7 |
| 736 | BC | 0 | 0 | 27.11 | −0.21 | 16.1 | 21.81 |
| 737 | AB | 90.36 | −0.68 | 53.37 | 72.7 | 0 | 0 |
| 738 | AB | 81.06 | −1.13 | 42.56 | 64.92 | 0 | 0 |
| 740 | AC | 54.21 | −1.7 | 0 | 0 | 33.24 | 42.85 |
| 741 | AC | 16.1 | 21.81 | 0 | 0 | 27.11 | −0.21 |
| 742 | ABC | 57.27 | 2.45 | 33.24 | 42.85 | 5.16 | −0.04 |
| 744 | AB | 16.1 | 21.81 | 27.11 | −0.21 | 0 | 0 |
| Total | 869.45 | 453.04 | 783.87 | 426.9 | 864.51 | 353.78 | |


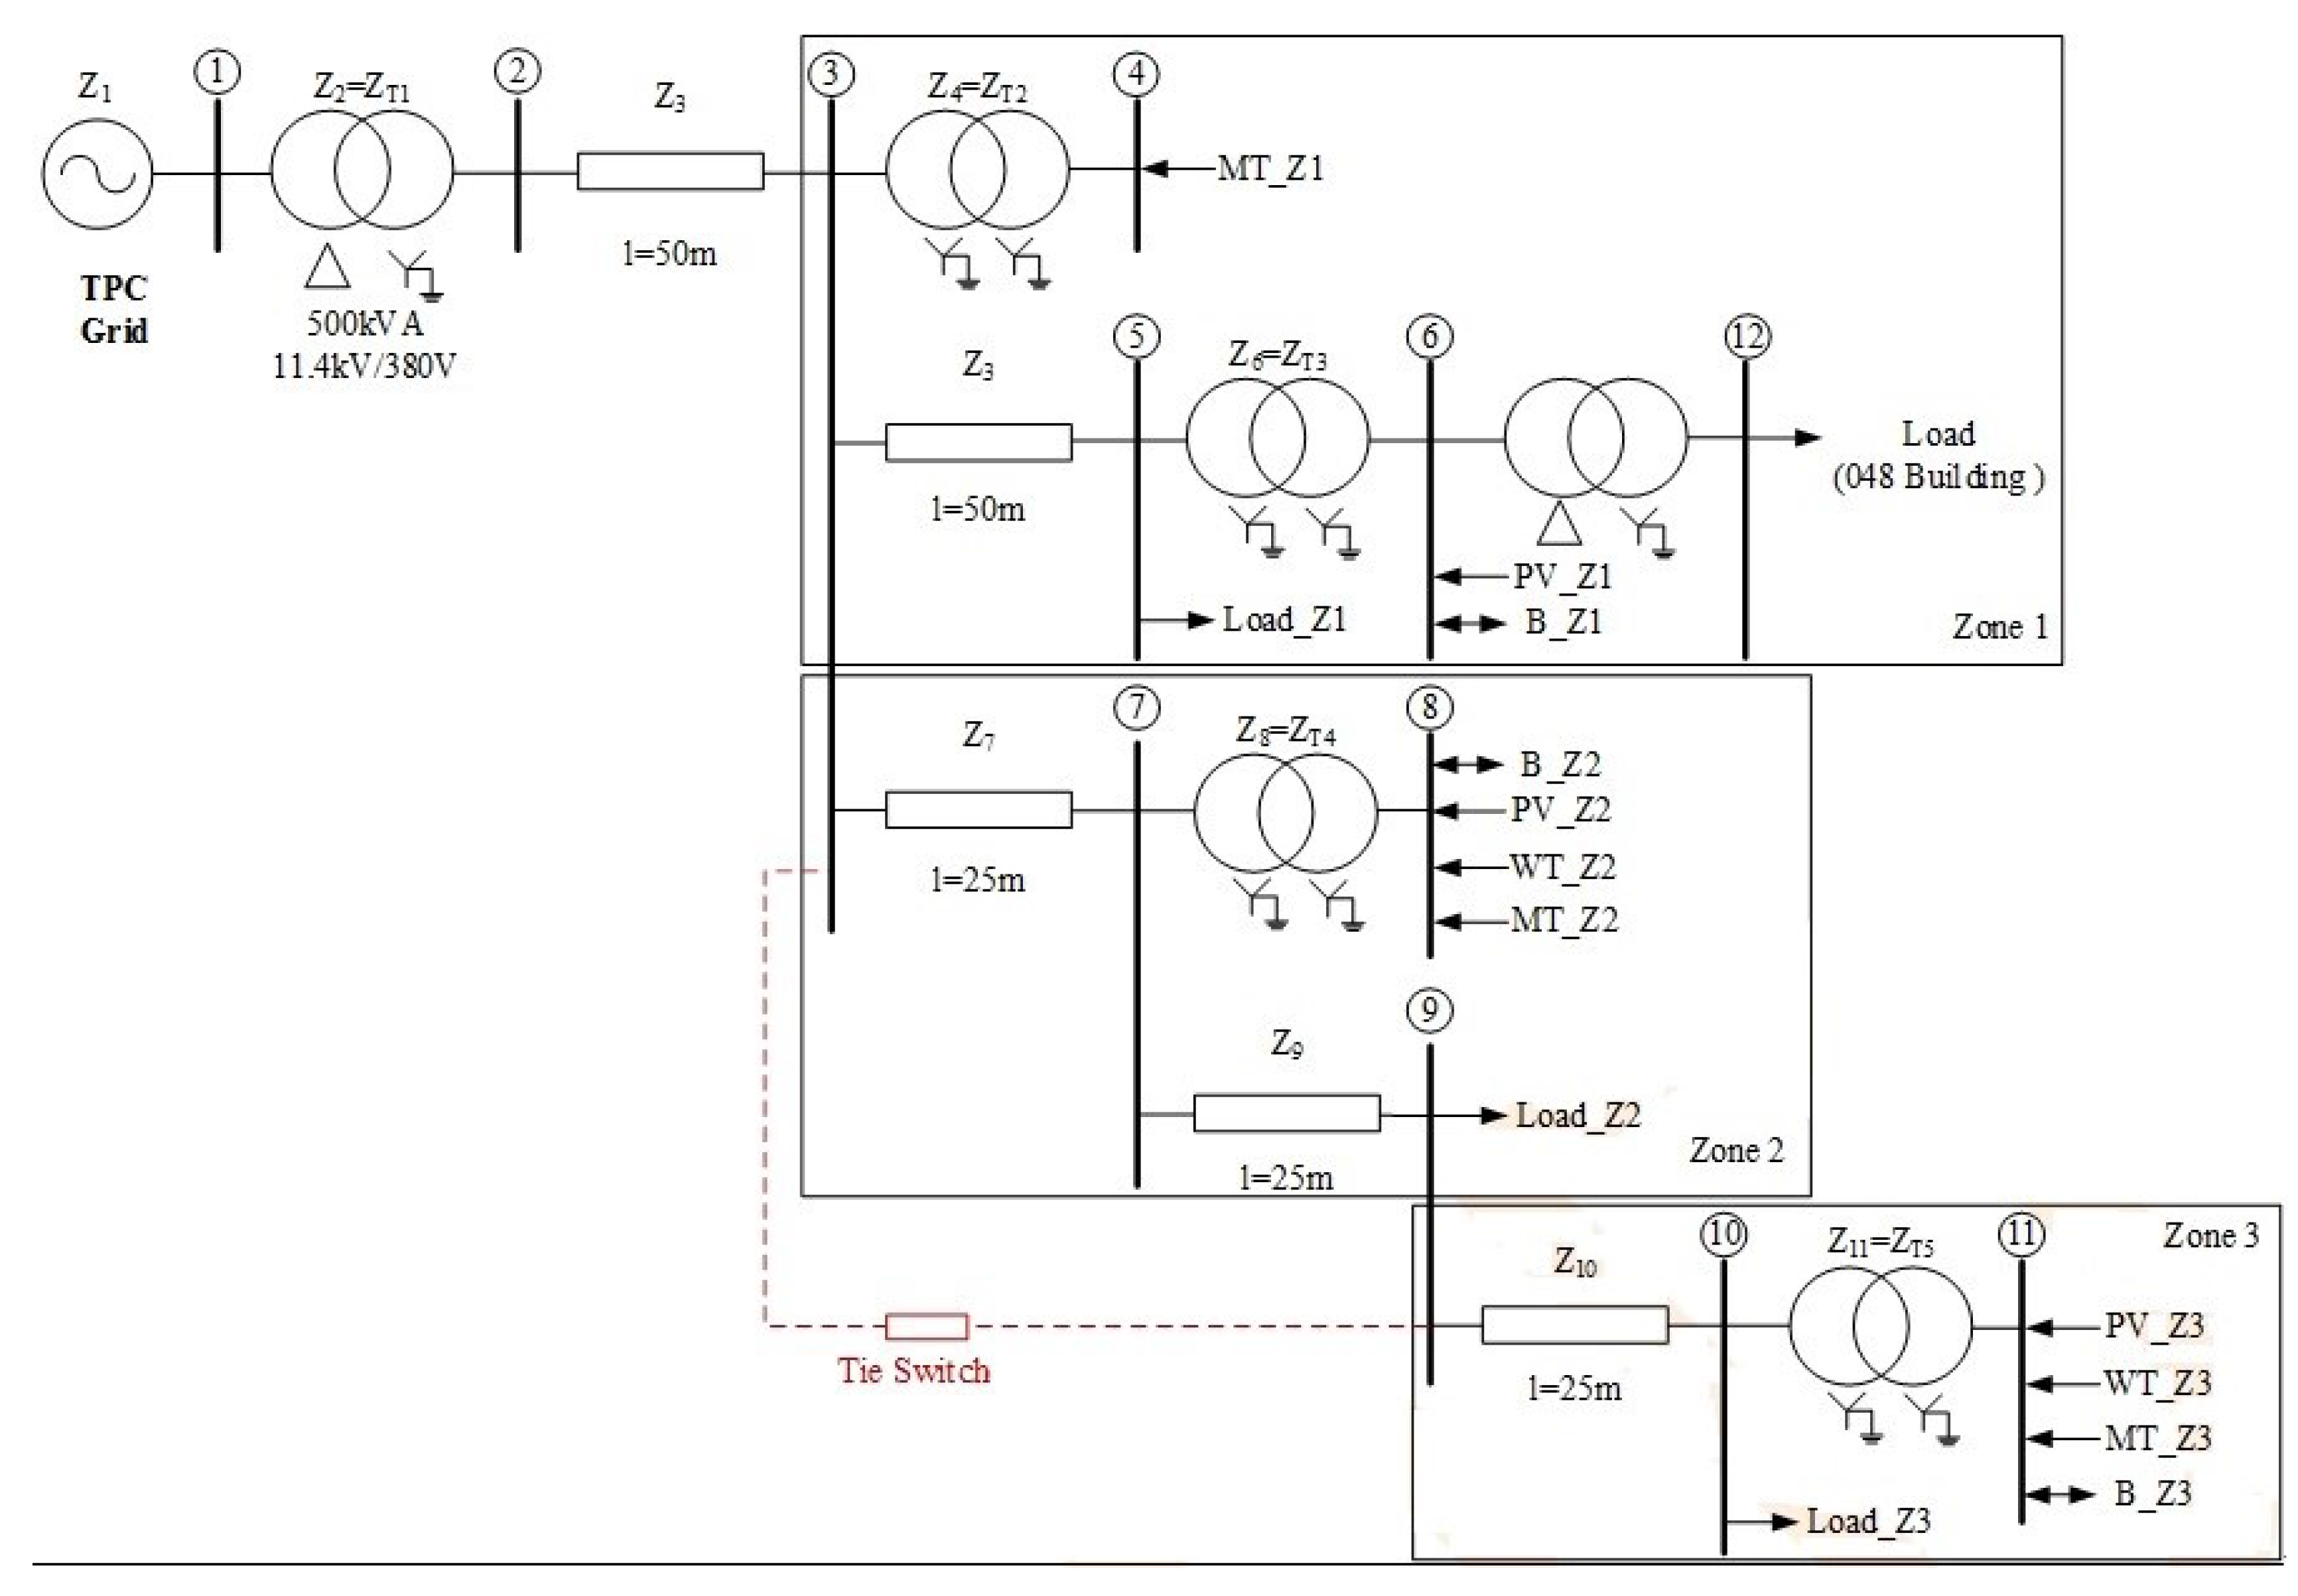
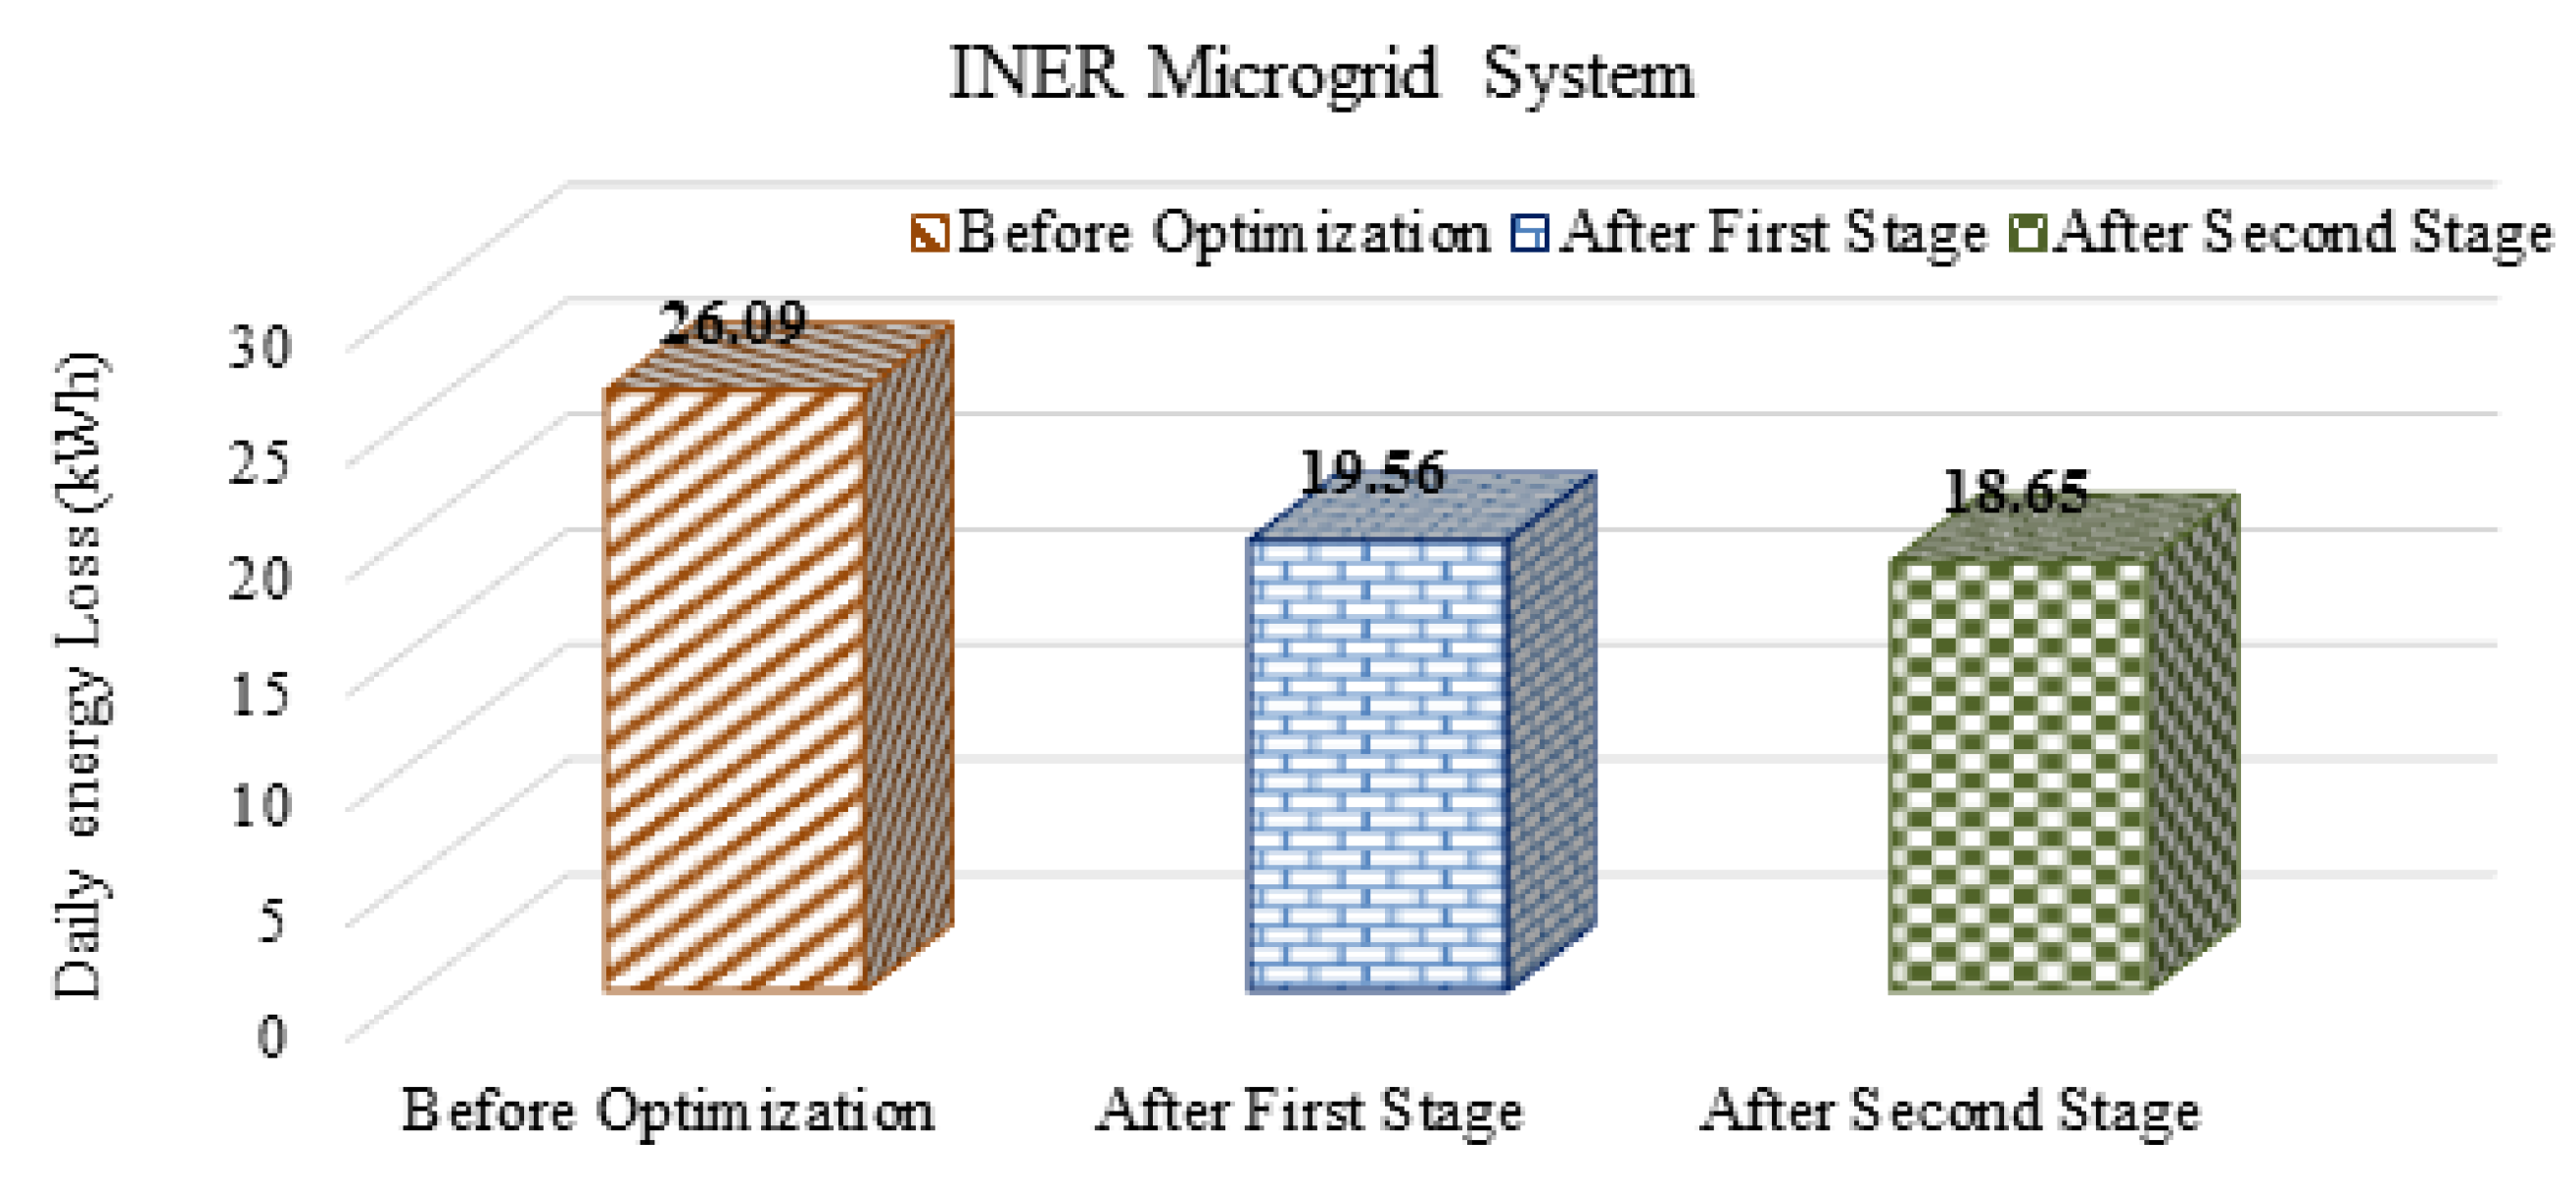
3.2. Institute of Nuclear Energy Research Microgrid

| From bus | To bus | Line resistance (pu) | Line reactance (pu) | Z (%) | Distance (m) | Transformer rating (kV) | Transformer capacity (kVA) | X/R |
|---|---|---|---|---|---|---|---|---|
| 1 | 2 | - | - | 3.85 | - | 11.4/0.38 | 500 | 8.02 |
| 2 | 3 | 0.2918 | 0.354 | - | 50 | - | - | - |
| 3 | 4 | - | - | 2 | - | 0.38/0.48 | 100 | 8 |
| 3 | 5 | 0.2918 | 0.354 | - | 50 | - | - | - |
| 5 | 6 | - | - | 4 | - | 0.38/0.38 | 150 | 8 |
| 3 | 7 | 0.2918 | 0.354 | - | 25 | - | - | - |
| 7 | 8 | - | - | 8 | - | 0.38/0.38 | 400 | 8 |
| 7 | 9 | 0.2918 | 0.354 | - | 25 | - | - | - |
| 9 | 10 | 0.2918 | 0.354 | - | 25 | - | - | - |
| 10 | 11 | - | - | - | - | 0.38/0.38 | 150 | 8 |
| 3 | 9 | 0.2918 | 0.354 | - | 25 | 0 | - | - |
| 6 | 12 | - | - | 4 | - | 0.38/0.208 | 150 | 8 |

| Bus | Loads | Before phase balancing | |||||
|---|---|---|---|---|---|---|---|
| Phase A | Phase B | Phase C | |||||
| Bus number | Phase type | P (kW) | Q (kvar) | P (kW) | Q (kvar) | P (kW) | Q (kvar) |
| 2 | ABC | 0.5342 | 0.3106 | 0.5342 | 0.3106 | 0.5342 | 0.3106 |
| 3 | ABC | 0.0694 | 0.0404 | 0.0694 | 0.0404 | 0.0694 | 0.0404 |
| 5 | ABC | 24 | 4 | 19.8 | 3.3 | 16.2 | 2.7 |
| 6 | ABC | −18.5647 | 0.0932 | −18.5647 | 0.0932 | −18.5647 | 0.0932 |
| 7 | ABC | 0.4274 | 0.2485 | 0.4274 | 0.2485 | 0.4274 | 0.2485 |
| 8 | ABC | −6.5333 | 0 | −6.5333 | 0 | −6.5333 | 0 |
| 9 | ABC | 24 | 0 | 19.8 | 0 | 16.2 | 0 |
| 10 | ABC | 12.1603 | 2.0932 | 10.0603 | 1.7432 | 8.2603 | 1.4432 |
| 11 | ABC | −3.2667 | 0 | −3.2667 | 0 | −3.2667 | 0 |
| 12 | ABC | 14.5001 | 0.1118 | 11.9626 | 0.0922 | 9.7876 | 0.0755 |
| Total | 47.3267 | 6.8977 | 34.2892 | 5.8281 | 23.1142 | 4.9114 | |
| Bus | Loads | After phase balancing | |||||
| Phase A | Phase B | Phase C | |||||
| Bus number | Phase type | P (kW) | Q (kvar) | P (kW) | Q (kvar) | P (kW) | Q (kvar) |
| 2 | ABC | 0.5342 | 0.3106 | 0.5342 | 0.3106 | 0.5342 | 0.3106 |
| 3 | ABC | 0.0694 | 0.0404 | 0.0694 | 0.0404 | 0.0694 | 0.0404 |
| 5 | ABC | 19.8 | 3.3 | 24 | 4 | 16.2 | 2.7 |
| 6 | ABC | −18.5647 | 0.0932 | −18.5647 | 0.0932 | −18.5647 | 0.0932 |
| 7 | ABC | 0.4274 | 0.2485 | 0.4274 | 0.2485 | 0.4274 | 0.2485 |
| 8 | ABC | −6.5333 | 0 | −6.5333 | 0 | −6.5333 | 0 |
| 9 | ABC | 19.8 | 0 | 16.2 | 0 | 24 | 0 |
| 10 | ABC | 10.0603 | 1.7432 | 12.1603 | 2.0932 | 8.2603 | 1.4432 |
| 11 | ABC | −3.2667 | 0 | −3.2667 | 0 | −3.2667 | 0 |
| 12 | ABC | 14.5001 | 0.1118 | 9.7876 | 0.0755 | 11.9626 | 0.0922 |
| Total | 36.8267 | 5.8477 | 34.8142 | 6.8614 | 33.0892 | 4.9281 | |


4. Conclusions
Acknowledgments
Author Contributions
Conflicts of Interest
References
- Lasseter, R.H.; Asano, H.; Iravani, R.; Marnay, C. Microgrids. IEEE Power Energy Mag. 2007, 5, 78–94. [Google Scholar]
- Lasseter, R.H. Smart distribution: Coupled microgrids. IEEE Power Energy Mag. 2011, 99, 1074–1082. [Google Scholar] [CrossRef]
- Hong, Y.-Y.; Lai, Y.-M.; Chang, Y.-R.; Lee, Y.-D.; Liu, P.-W. Optimizing Capacities of Distributed Generation and Energy Storage in a Small Autonomous Power System Considering Uncertainty in Renewables. Energies 2015, 8, 2473–2492. [Google Scholar] [CrossRef]
- Huang, W.-T.; Yao, K.-C.; Wu, C.-C. Using the Direct Search Method for Optimal Dispatch of Distributed Generation in a Medium-Voltage Microgrid. Energies 2014, 7, 8355–8373. [Google Scholar] [CrossRef]
- Kim, H.-M.; Lim, Y.; Kinoshita, T. An intelligent multiagent system for autonomous microgrid operation. Energies 2012, 5, 3347–3362. [Google Scholar] [CrossRef]
- Kim, H.-M.; Kinoshita, T.; Shin, M.-C. A multiagent system for autonomous operation of islanded microgrids based on a power market environment. Energies 2010, 3, 1972–1990. [Google Scholar] [CrossRef]
- Yoo, C.-H.; Chung, I.-Y.; Lee, H.-J.; Hong, S.-S. Intelligent control of battery energy storage for multi-agent based microgrid energy management. Energies 2013, 6, 4956–4979. [Google Scholar] [CrossRef]
- Merlin, A.; Back, H. Search for a minimal-loss operating spanning tree configuration in an urban power distribution system. In Proceedings of the 5th Power System Computation Conference (PSCC), Cambridge, UK, 1–5 September 1975; pp. 1–18.
- Civanlar, S.; Grainger, J.J.; Yin, H.; Lee, S.S.H. Distribution reconfiguration for loss reduction. IEEE Trans. Power Deliv. 1988, 3, 1217–1223. [Google Scholar] [CrossRef]
- Jeon, Y.J.; Kim, J.C.; Kim, J.O.; Shin, J.R.; Lee, K.Y. An efficient simulated annealing algorithm for network reconfiguration in large-scale distribution systems. IEEE Trans. Power Deliv. 2002, 17, 1070–1078. [Google Scholar] [CrossRef]
- Venkatesh, B.; Ranjan, R. Optimal radial distribution system reconfiguration using fuzzy adaptation of evolutionary programming. Int. J. Electr. Power Energy Syst. 2003, 25, 775–780. [Google Scholar] [CrossRef]
- Hamdoui, H.; Hadjeri, S.; Zeblah, A. A new constructive method for electric power system reconfiguration using ant colony. Leonardo Electron. J. Pract. Tech. 2008, 12, 49–60. [Google Scholar]
- Chen, T.H.; Chang, Y.L. Integrated Models of Distribution Transformers and Their Loads for Three-phase Power Flow Analyses. IEEE Trans. Power Deliv. 1996, 11, 507–513. [Google Scholar] [CrossRef]
- Zhu, J.; Chow, M.Y.; Zhang, G.F. Phase balancing using mixed-integer programming. IEEE Trans. Power Syst. 1998, 13, 1487–1492. [Google Scholar]
- Chen, T.H.; Cherng, J.T. Optimal phase arrangement of distribution transformers connected a primary feeder for system unbalance improvement and loss reduction using a genetic algorithm. IEEE Trans. Power Syst. 2000, 15, 994–1000. [Google Scholar] [CrossRef]
- Murat, D.; Robot, P.B.; Jeferey, C.T.; Richard, S. Simultaneous Phase Balancing at Substations and Switches with Time-Varying Load Patterns. IEEE Trans. Power Syst. 2001, 16, 922–928. [Google Scholar]
- Lin, C.H.; Chen, C.S.; Chuang, H.J. An Expert System for Three-Phase Balancing of Distribution Feeders. IEEE Trans. Power Syst. 2008, 23, 1488–1496. [Google Scholar]
- Kennedy, J.; Eberhart, R.C. Particle swarm optimization. In Proceedings of the IEEE International Conference on Neural Networks, Perth, Australia, 27 November–1 December 1995; Volume 4, pp. 1942–1948.
- Eberhart, R.C.; Kennedy, J. A new optimizer using particle swarm theory. In Proceedings of the IEEE International Symposium on Micro Machine and Human Science, Nagoya, Japan, 4–6 October 1995; pp. 39–43.
- Chen, T.H.; Chen, M.S.; Inoue, T.; Kotas, P.; Chebli, E.A. Three-phase cogenerator and transformer models for distribution system analysis. IEEE Trans. Power Deliv. 1991, 6, 1671–1681. [Google Scholar] [CrossRef]
- Vieira, J.C.M.; Freitas, W.; Morelato, A. Phase-decoupled method for three-phase power-flow analysis of unbalanced distribution systems. IEE Proc. Gener. Transm. Distrib. 2004, 151, 568–574. [Google Scholar] [CrossRef]
- Marinho, J.M.T.; Taranto, G. A Hybrid Three-Phase Single-Phase Power Flow Formulation. IEEE Trans. Power Syst. 2008, 23, 1063–1070. [Google Scholar] [CrossRef]
- Kersting, W.H. Radial distribution test feeders. IEEE Trans. Power Syst. 1991, 6, 975–985. [Google Scholar] [CrossRef]
- Dugan, R.C.; Santoso, S. An example of 3-phase transformer modeling for distribution system analysis. In Proceedings of the IEEE PES Transmission Distribution Conference and Exposition, Dallas, TX, USA, 7–12 September 2003; Volume 3, pp. 1028–1032.
- Chen, T.H.; Yang, N.C. Three-phase power-flow by direct ZBR method for unbalanced radial distribution systems. IET Gener. Transm. Distrib. 2009, 3, 903–910. [Google Scholar] [CrossRef]
- Teng, J.H. A network-topology based three: Phase load flow for distribution systems. Proc. Natl. Sci. Counc. ROC A Phys. Sci. Eng. 2000, 24, 259–264. [Google Scholar]
- Teng, J.H. A direct approach for distribution system load flow solution. IEEE Trans. Power Deliv. 2003, 18, 882–887. [Google Scholar] [CrossRef]
- Elsaiah, S.; Benidris, M.; Mitra, J. A three-phase power flow solution method for unbalanced distribution networks. In Proceedings of the North American Power Symposium, Boston, MA, USA, 4–6 August 2011; pp. 1–8.
- Oliveira, M.E.; Boson, D.F.A.; Padilha-Feltrin, A. A statistical analysis of loss factor to determine the energy losses. In Proceedings of the IEEE/PES Transmission and Distribution Conference and Exposition, Bogota, Colombia, 13–15 August 2008; pp. 1–6.
- Distribution Test Feeders. Available online: http://ewh.ieee.org/soc/pes/dsacom/testfeeders/index.html (accessed on 5 October 2015).
© 2015 by the authors; licensee MDPI, Basel, Switzerland. This article is an open access article distributed under the terms and conditions of the Creative Commons by Attribution (CC-BY) license (http://creativecommons.org/licenses/by/4.0/).
Share and Cite
Huang, W.-T.; Chen, T.-H.; Chen, H.-T.; Yang, J.-S.; Lian, K.-L.; Chang, Y.-R.; Lee, Y.-D.; Ho, Y.-H. A Two-stage Optimal Network Reconfiguration Approach for Minimizing Energy Loss of Distribution Networks Using Particle Swarm Optimization Algorithm. Energies 2015, 8, 13894-13910. https://doi.org/10.3390/en81212402
Huang W-T, Chen T-H, Chen H-T, Yang J-S, Lian K-L, Chang Y-R, Lee Y-D, Ho Y-H. A Two-stage Optimal Network Reconfiguration Approach for Minimizing Energy Loss of Distribution Networks Using Particle Swarm Optimization Algorithm. Energies. 2015; 8(12):13894-13910. https://doi.org/10.3390/en81212402
Chicago/Turabian StyleHuang, Wei-Tzer, Tsai-Hsiang Chen, Hong-Ting Chen, Jhih-Siang Yang, Kuo-Lung Lian, Yung-Ruei Chang, Yih-Der Lee, and Yuan-Hsiang Ho. 2015. "A Two-stage Optimal Network Reconfiguration Approach for Minimizing Energy Loss of Distribution Networks Using Particle Swarm Optimization Algorithm" Energies 8, no. 12: 13894-13910. https://doi.org/10.3390/en81212402