
Assessing the Environmental Sustainability of Electricity Generation in Turkey on a Life Cycle Basis

Abstract
:1. Introduction

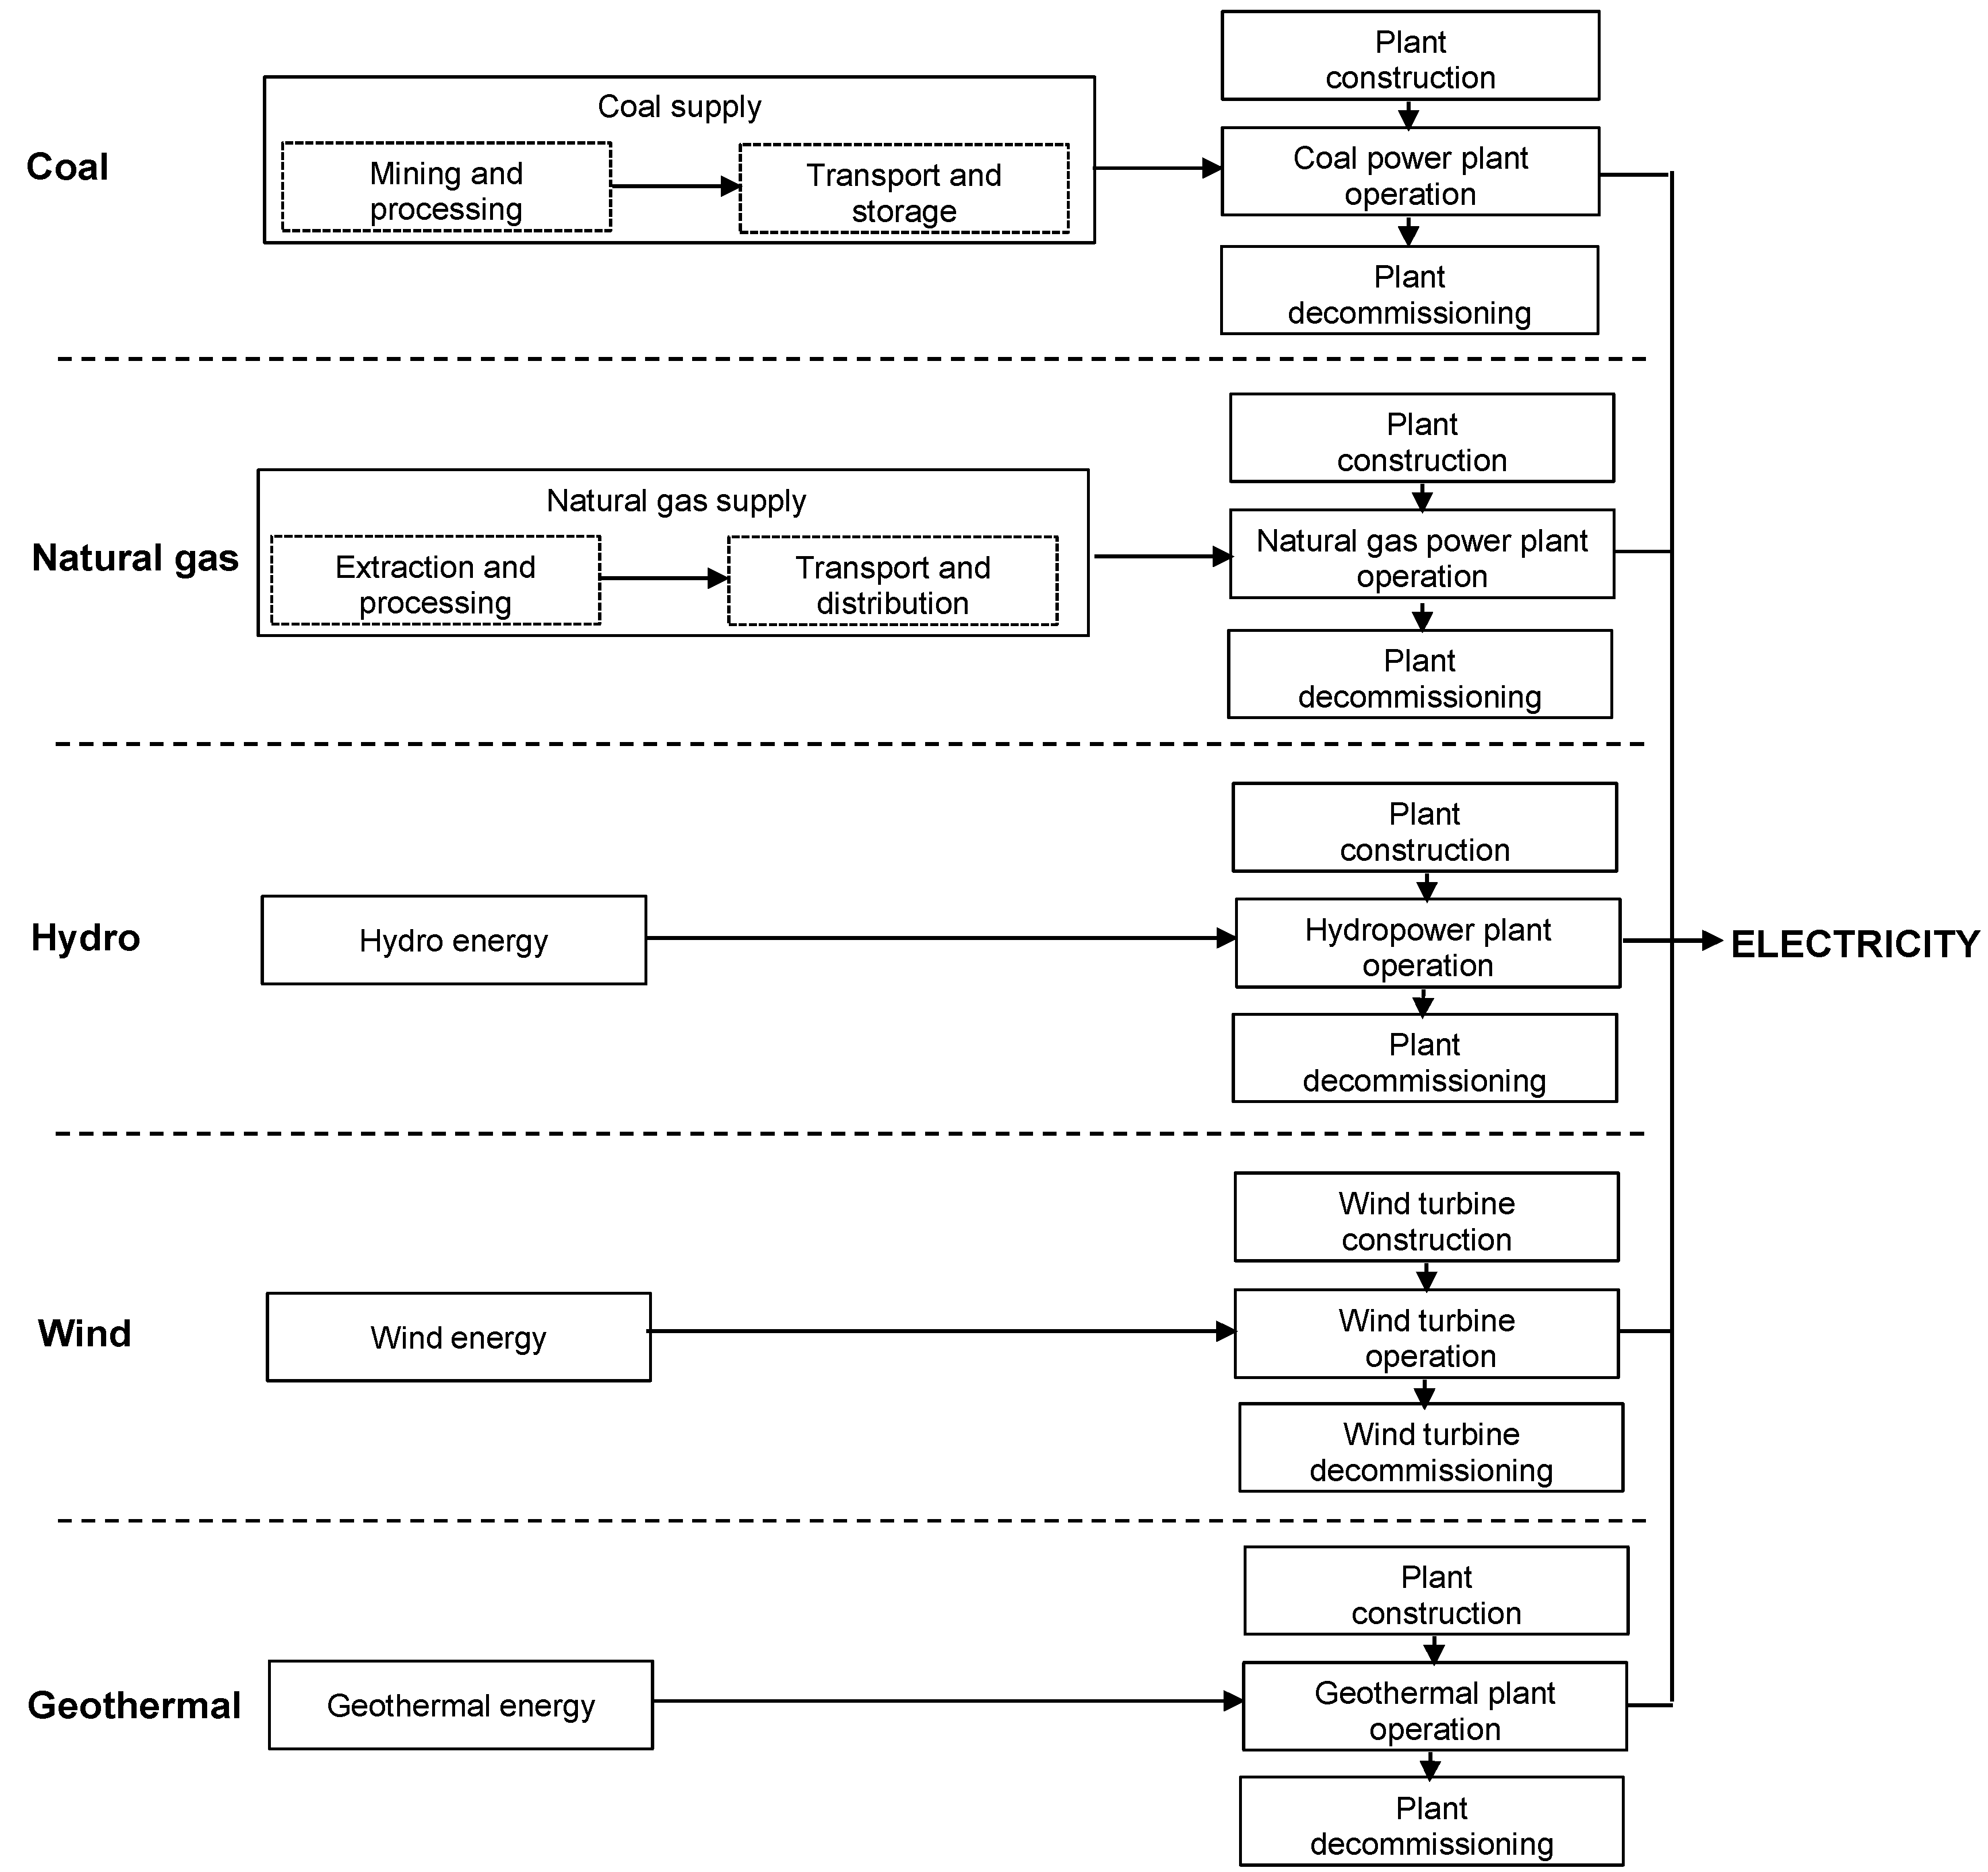
2. Methods

| Aim and Scope of the Study | Technologies | Country | Environmental Impacts | Reference |
|---|---|---|---|---|
| Life cycle energy use, GWP and cost assessment of gas fired combined cycle plant | Natural gas | Singapore | Global warming, energy use | [14] |
| Life cycle greenhouse gas emissions from electric supply technologies | Lignite, hard coal, oil, natural gas, nuclear, CCS, hydro, wind, solar PV, biomass, energy storage | Not specified | Global warming | [15] |
| Setting up life cycle models for the environmental analysis of hydropower generation, considering technical and climatic boundary conditions | Run-of-river, storage and pumped storage hydro | Germany | Global warming, acidification, eutrophication, photochemical smog, energy demand | [20] |
| LCA of carbon dioxide capture and storage from lignite power plants | Pulverised coal (PC), PC with CO2 capture, Integrated gasification combined cycle (IGCC), IGCC with CO2 capture, oxyfuel plant with CO2 capture | Germany | Global warming, energy demand, photochemical smog, eutrophication, acidification | [21] |
| LCA of a 2 MW rated power wind turbine | Onshore wind | Spain | Global warming, resource depletion, ecotoxicity, ozone layer depletion, acidification, eutrophication, photochemical smog, human toxicity | [22] |
| LCA of mini-hydropower plants | Run-of-river hydro | Thailand | Global warming, resource depletion, acidification, human toxicity, photochemical smog, water ecotoxicity | [23] |
| LCA of electricity generation | Nuclear, coal, natural gas, oil, renewables | Mexico | Global warming, ecotoxicity, ozone layer depletion, acidification, eutrophication, photochemical smog, human toxicity, resource depletion | [24] |
| LCA of the wind turbines | Onshore wind | Spain | Global warming, ecotoxicity, ozone layer depletion, acidification, eutrophication, photochemical smog, human toxicity, resource depletion | [25] |
| LCA of a hydroelectric power | Run-of-river hydro | Thailand | Global warming, ecotoxicity, ozone layer depletion, acidification, eutrophication, photochemical smog, resource depletion | [26] |
| Life cycle sustainability assessment of electricity generation | Nuclear, coal, natural gas, offshore wind, solar PV | UK | Global warming, ozone layer depletion, acidification, eutrophication, photochemical smog, land use, ecotoxicity, human toxicity, resource depletion | [27] |
| LCA of 1 kWh generated by a Gamesa onshore wind farm | Onshore wind | Europe | Cumulative energy demand, global warming, summer smog, ecotoxicity, eutrophication, acidification, human toxicity, land use | [28] |
| Life cycle data for hydroelectric generation at Embretsfoss 4 power station | Run-of-river hydro | Norway | Global warming, acidification, eutrophication, photochemical smog, ozone layer depletion, waste | [29] |
| Life cycle data for hydroelectricity from Trollheim power station | Reservoir hydro | Norway | Global warming, acidification, eutrophication, photochemical smog, ozone layer depletion, waste | [30] |
| Life cycle assessment of electricity from an onshore V90-3.0 MW wind plant | Onshore wind | Not specified | Global warming, ecotoxicity, ozone layer depletion, acidification, eutrophication, photochemical smog, human toxicity, resource depletion | [31] |
| Life cycle assessment of wind power | Onshore wind | Not specified | Global warming, ecotoxicity, ozone layer depletion, acidification, eutrophication, photochemical smog, human toxicity, resource depletion | [32] |
| LCA of a wind plant | Onshore wind | France | Resource depletion, acidification, eutrophication, global warming, photochemical smog | [33] |
2.1. Goal and Scope Definition

2.2. Inventory Data
| Type of Power Plant | Number of Plants | Installed Capacity (MW) | Annual Generation (GWh/yr) |
|---|---|---|---|
| Lignite | 16 | 8140 | 35,942 |
| Hard coal a | 8 | 3751 | 19,104 |
| Natural gas | 187 | 18,213 | 98,144 |
| Large-reservoir hydropower (capacity > 500 MW) | 8 | 8459 | 30,583 |
| Small-reservoir hydropower (capacity < 500 MW) | 47 | 4608 | 13,885 |
| Run-of-river hydropower | 205 | 2764 | 7327 |
| Onshore wind | 39 | 1320 | 2916 |
| Geothermal | 6 | 94 | 668 |
| Total | 516 | 47,349 | 208,569 |
| (49,524) b | (211,208) c |
| Natural Gas (million m3) | Hard Coal (million tonnes) | Lignite (million tonnes) | Transport Distances (km) Gas a Hard Coal b | ||
|---|---|---|---|---|---|
| Domestic fuel | - | 0.20 | 55.89 | - | - |
| Imported fuel | |||||
| Russia | 9921 | 4.45 c | - | 5750 | 5000 |
| Iran | 4383 | - | - | 2700 | - |
| Azerbaijan | 2551 | - | - | 1150 | - |
| Algeria | 2205 | - | - | 4000 | - |
| Nigeria | 671 | - | - | 4500 | - |
| USA | - | 1.48 | - | - | 10,500 |
| South Africa | - | 1.48 | - | - | 13,000 |
| Other | 1738 | - | - | 1750 | - |
| Total | 21,469 | 7.61 | 55.89 | 19,850 | 28,500 |
2.2.1. Electricity from Fossil Fuels
2.2.2. Electricity from Renewables
- E1: environmental impacts of the larger plant
- E2: environmental impacts of the smaller plant
- C1: capacity of the larger plant
- C2: capacity of the smaller plant
- 0.6: the “six-tenths” scaling factor.
- the contribution of the liquid-fuel power plants to the total generation of electricity is small and for simplicity has been substituted with the equivalent amount of electricity generated by the gas power plants;
- the data on the specific technologies for other renewables and waste have not been available. As their contribution to the total electricity generation is small, they have been substituted by small-reservoir hydropower.
3. Results and Discussion
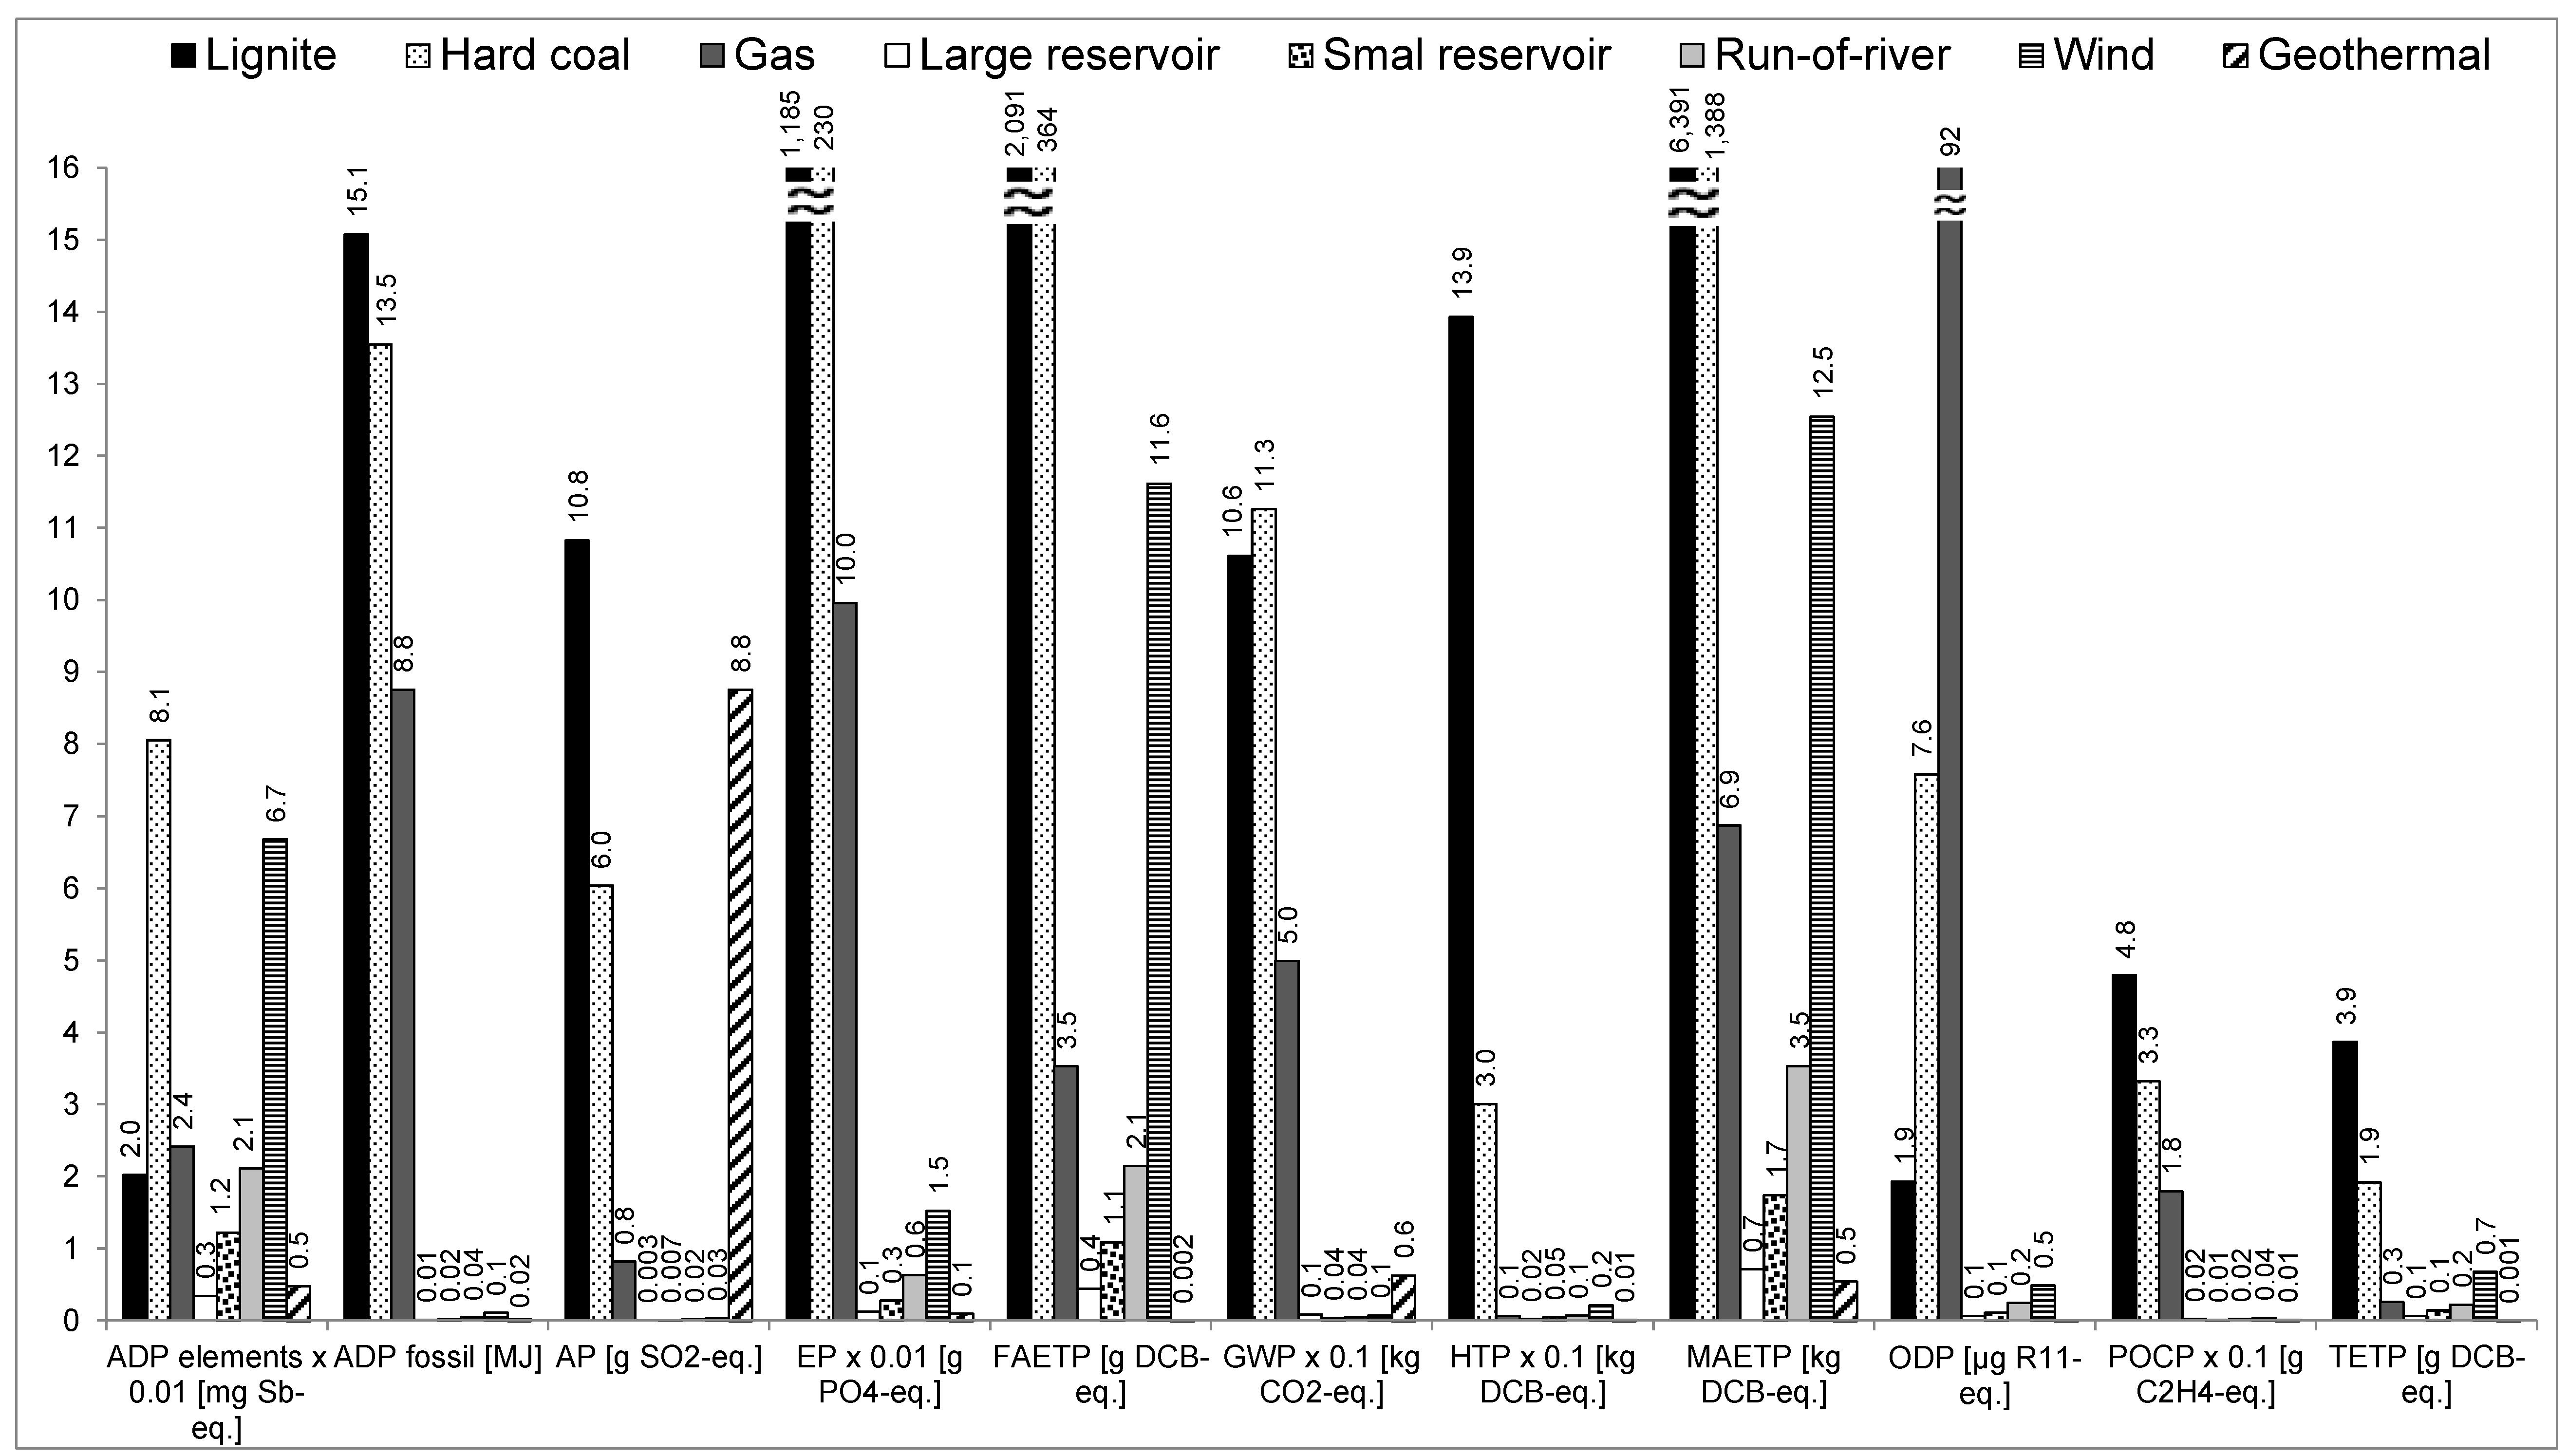
3.1. Environmental Impacts of Different Electricity Technologies
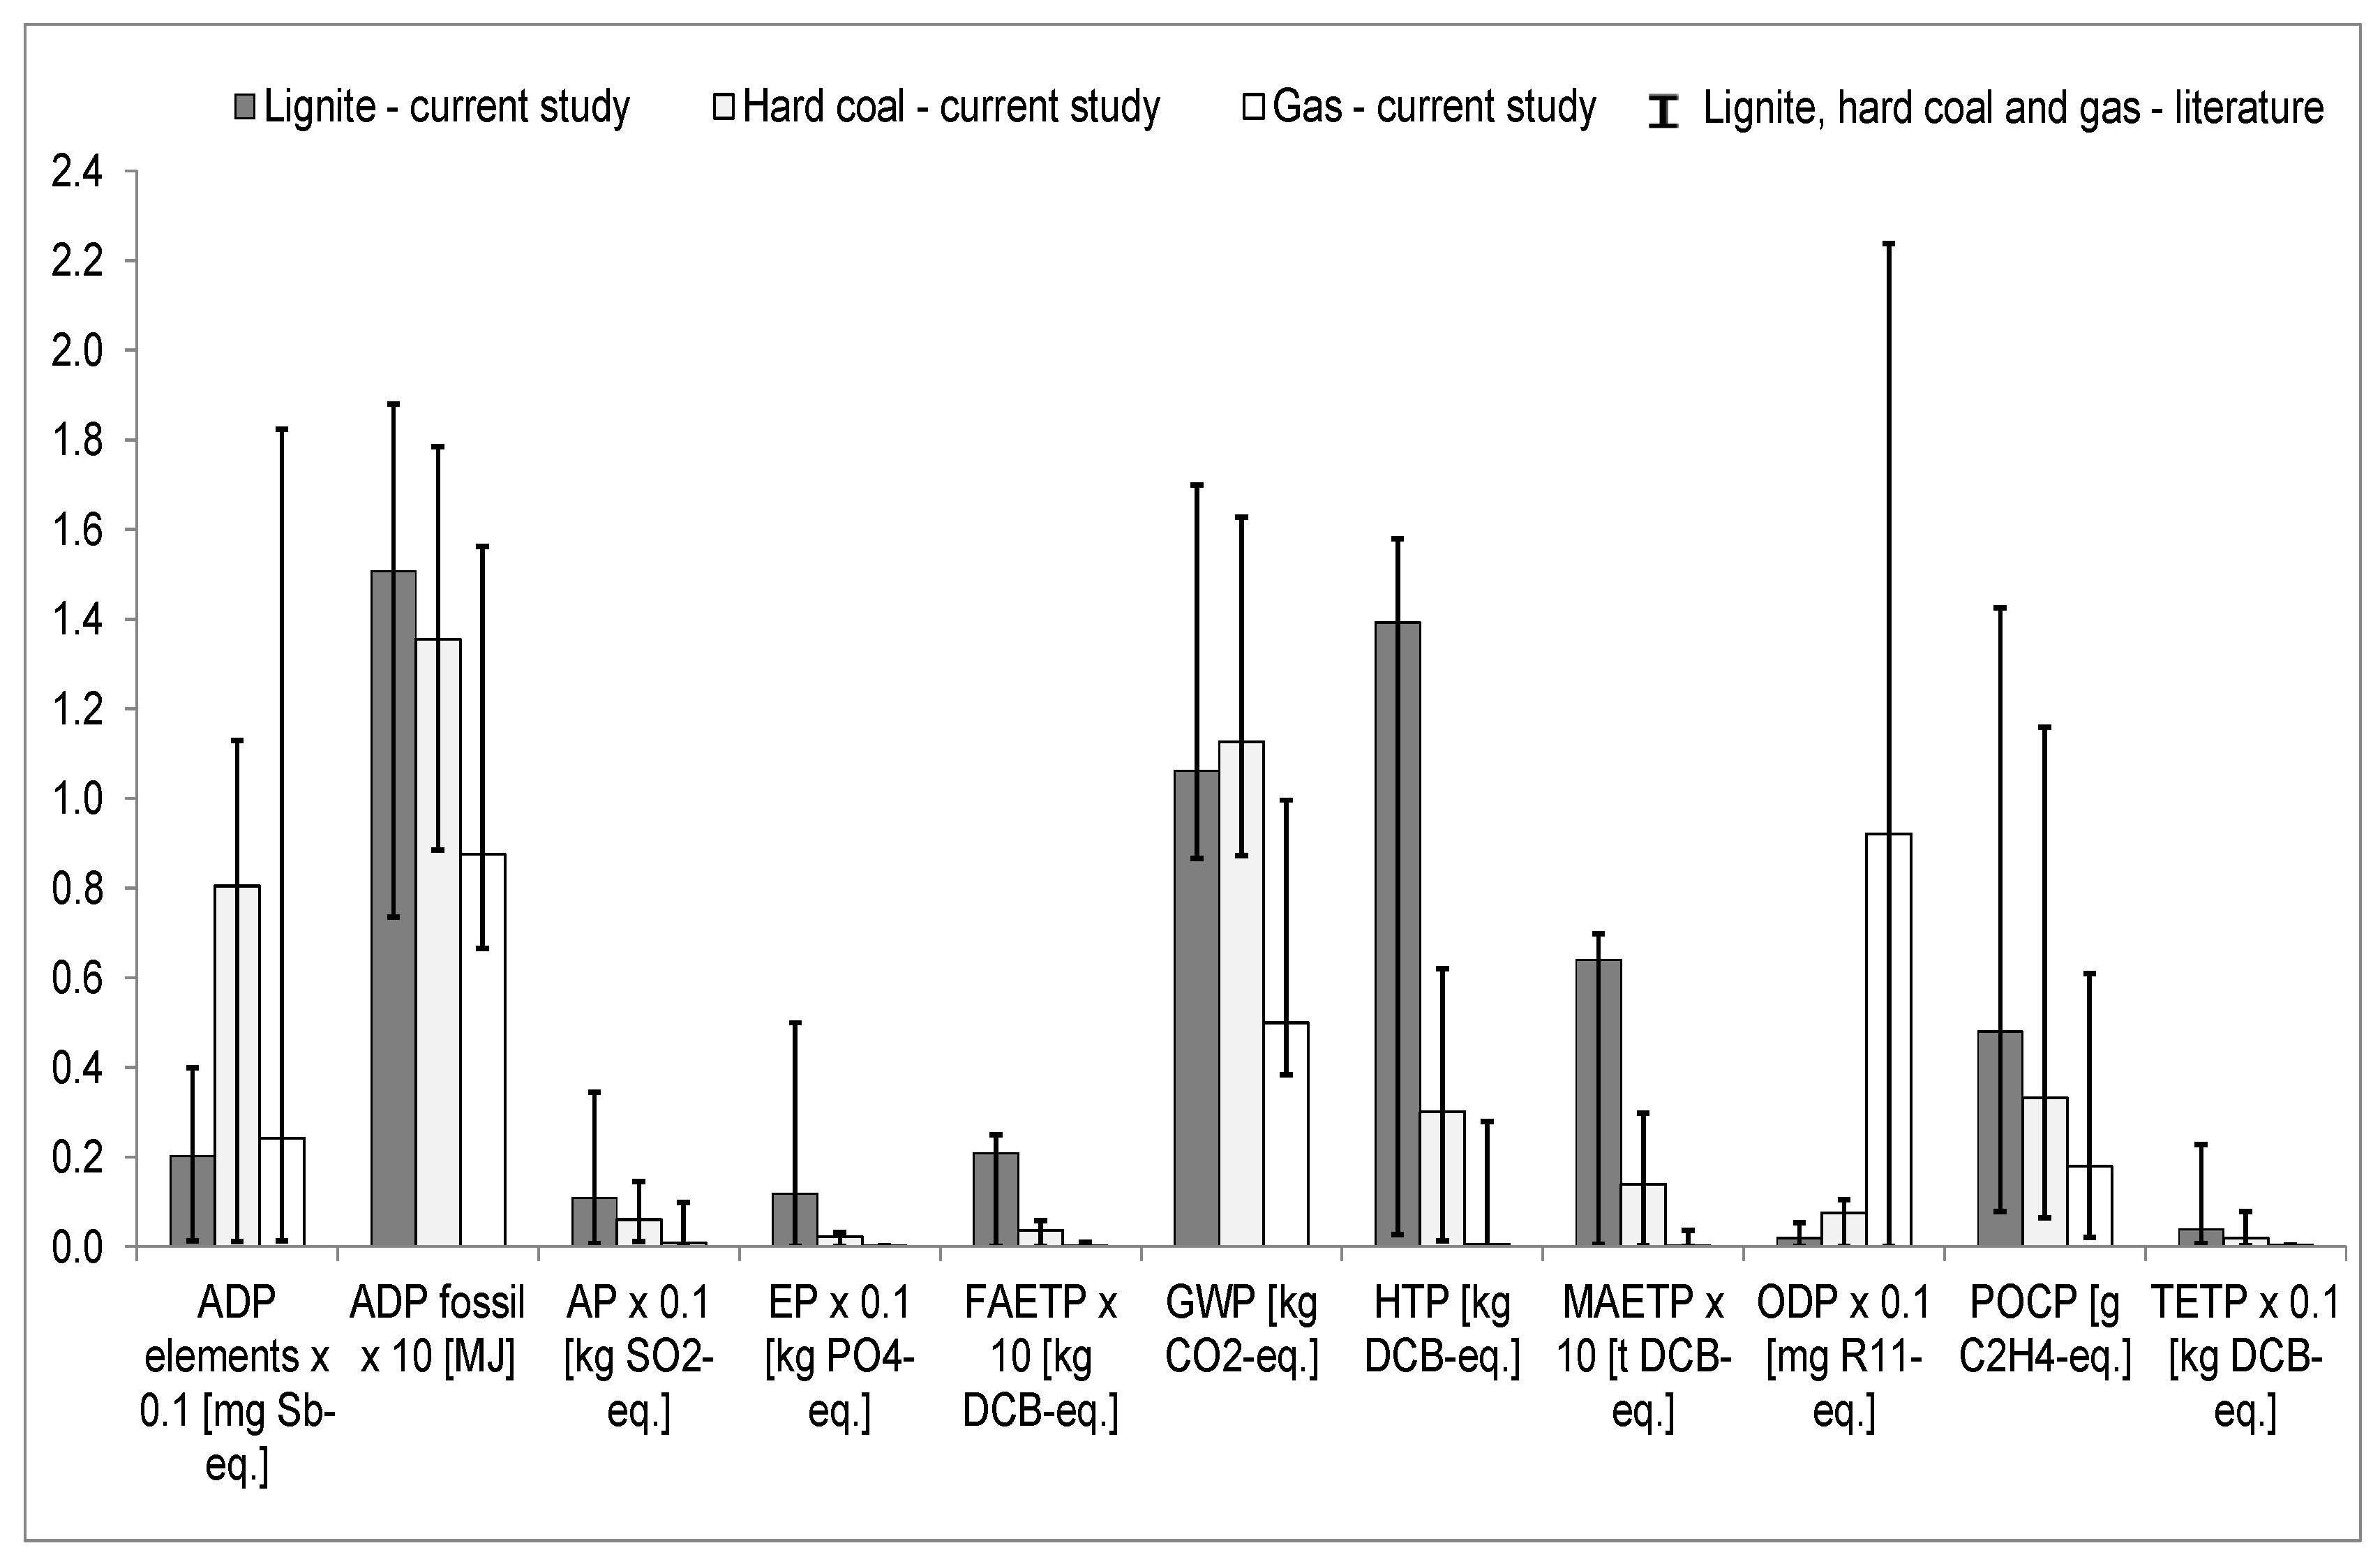
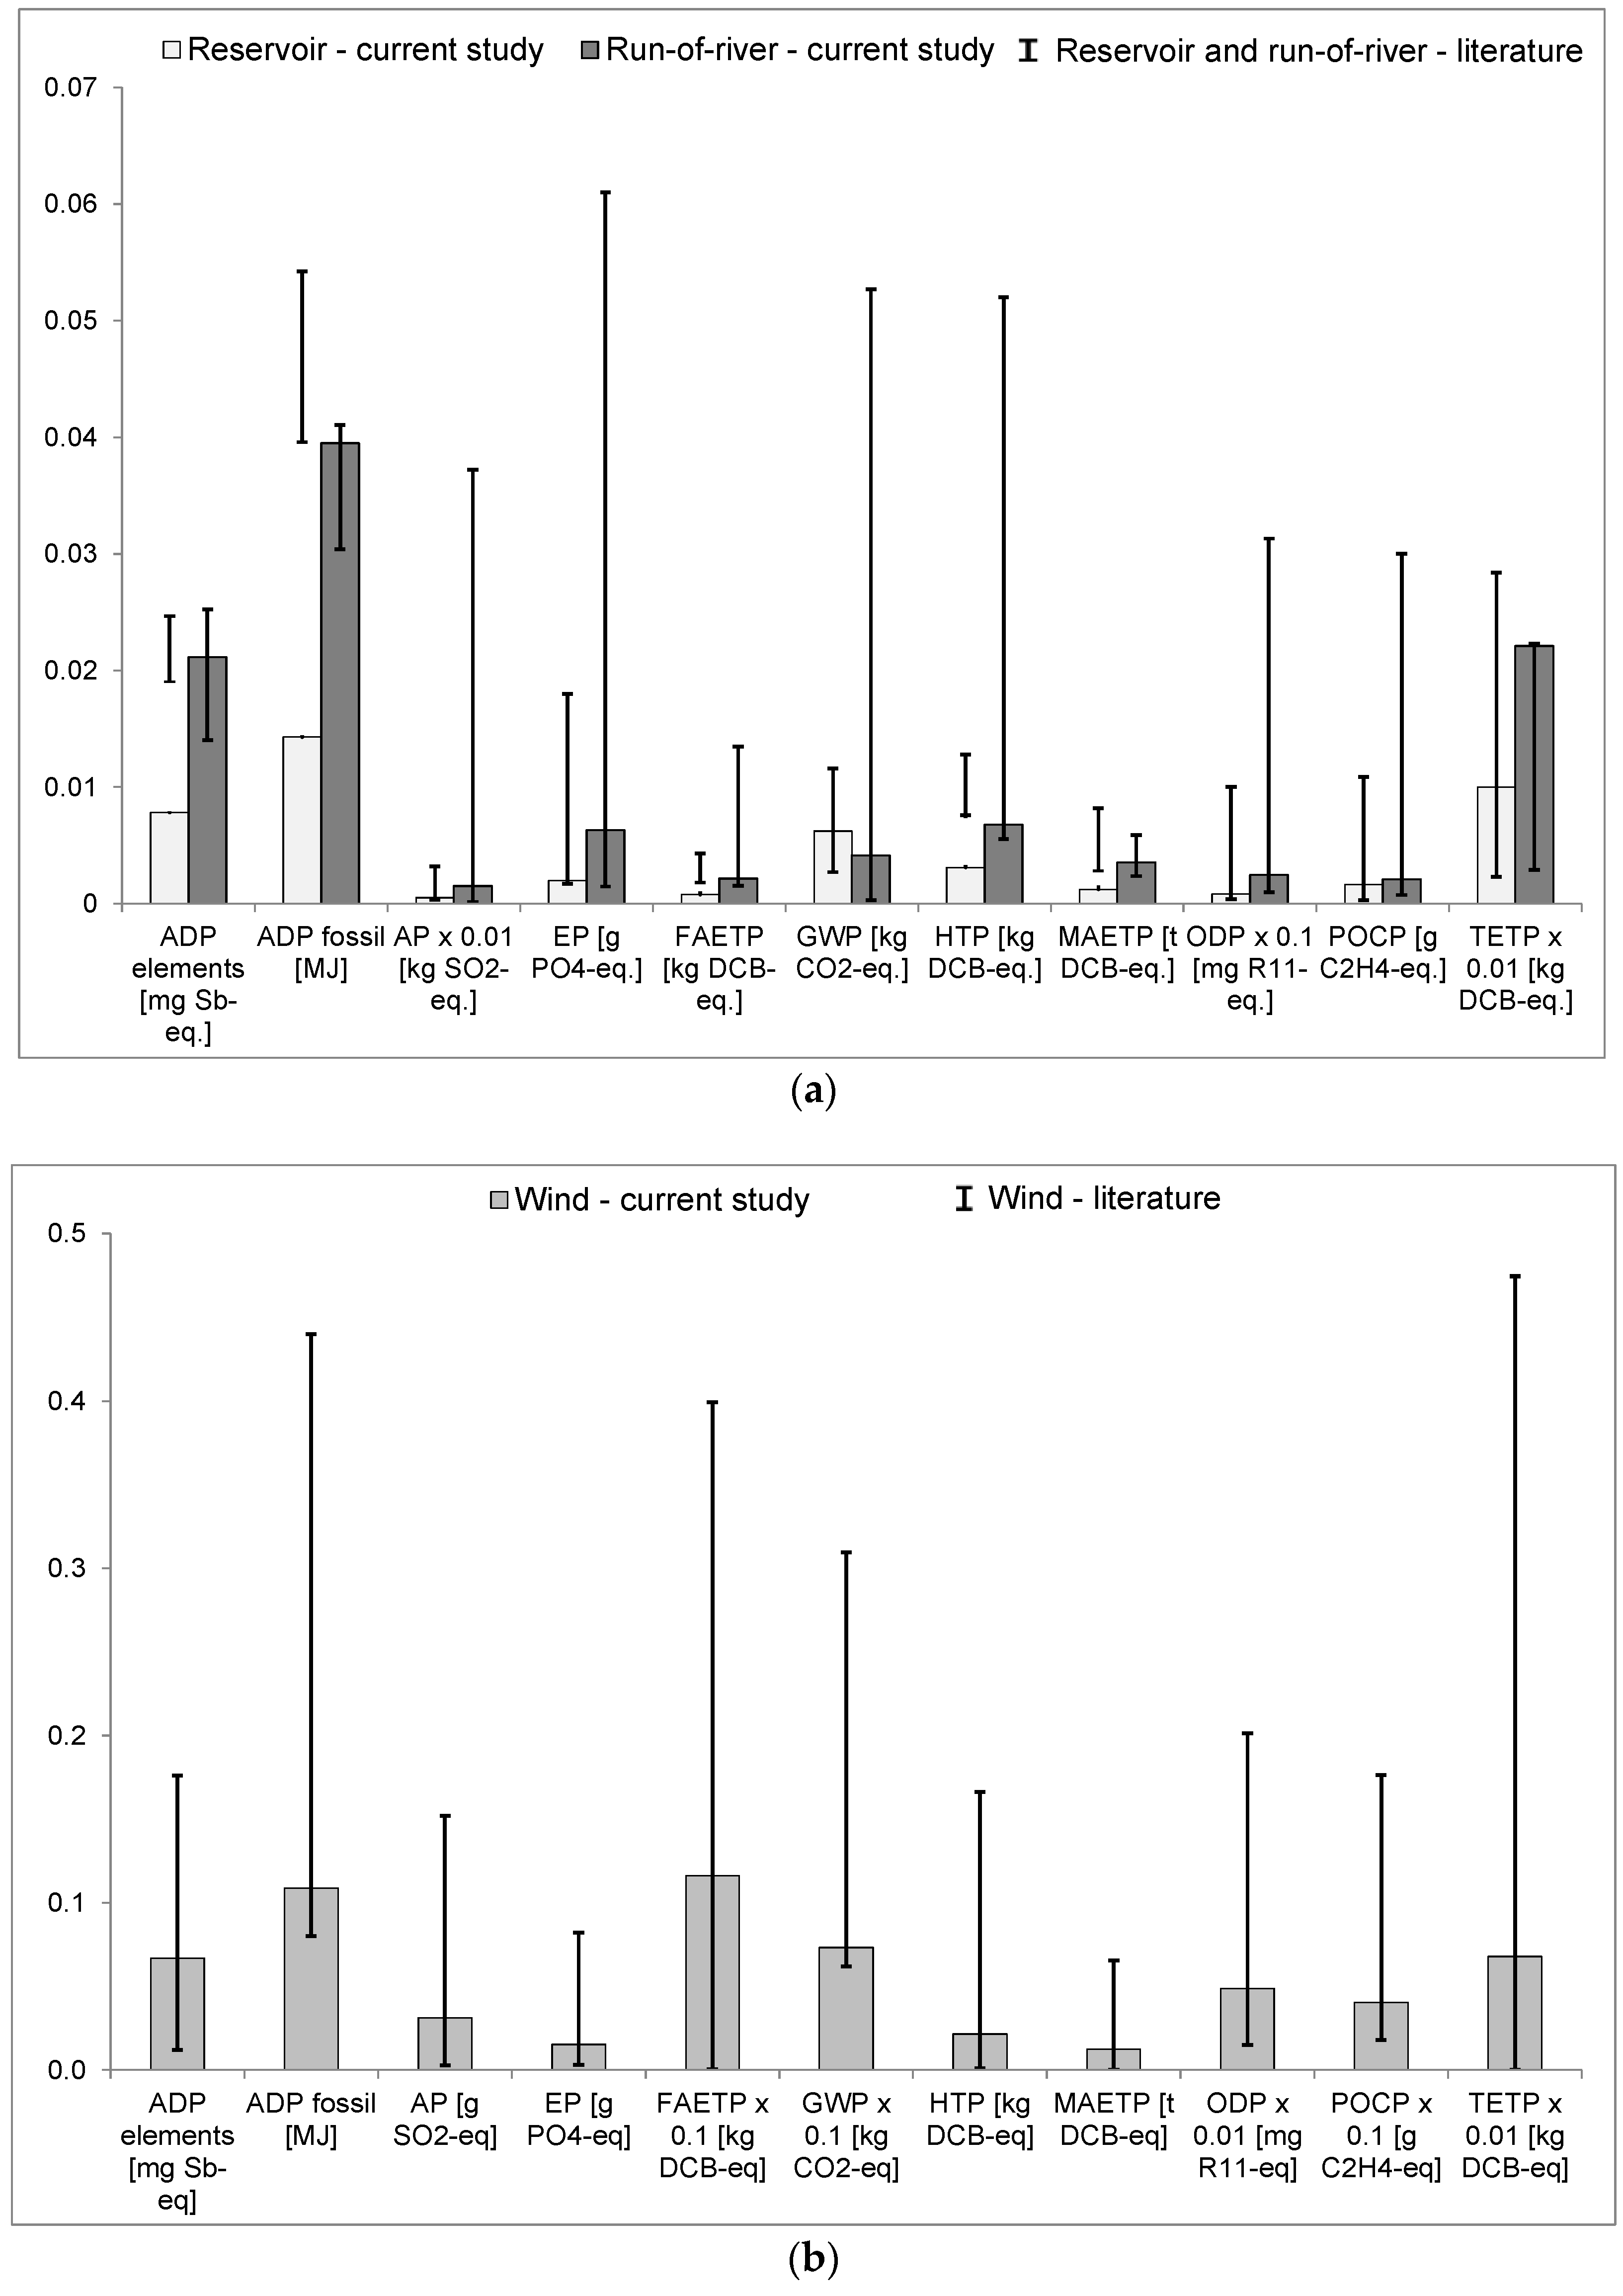
Comparison of Results with the Literature
| Coal | Gas | Hydropower | Wind | |
|---|---|---|---|---|
| Mining and Processing | ||||
| Lignite: |
| |||
| ||||
| Transport b | ||||
Lignite:
|
|
|
| |
| Plant Construction | ||||
|
| Large reservoir: |
| |
| ||||
| Plant Operation | ||||
|
| Large reservoir:
|
| |
| Plant Decommissioning i | ||||
|
|
|
| |


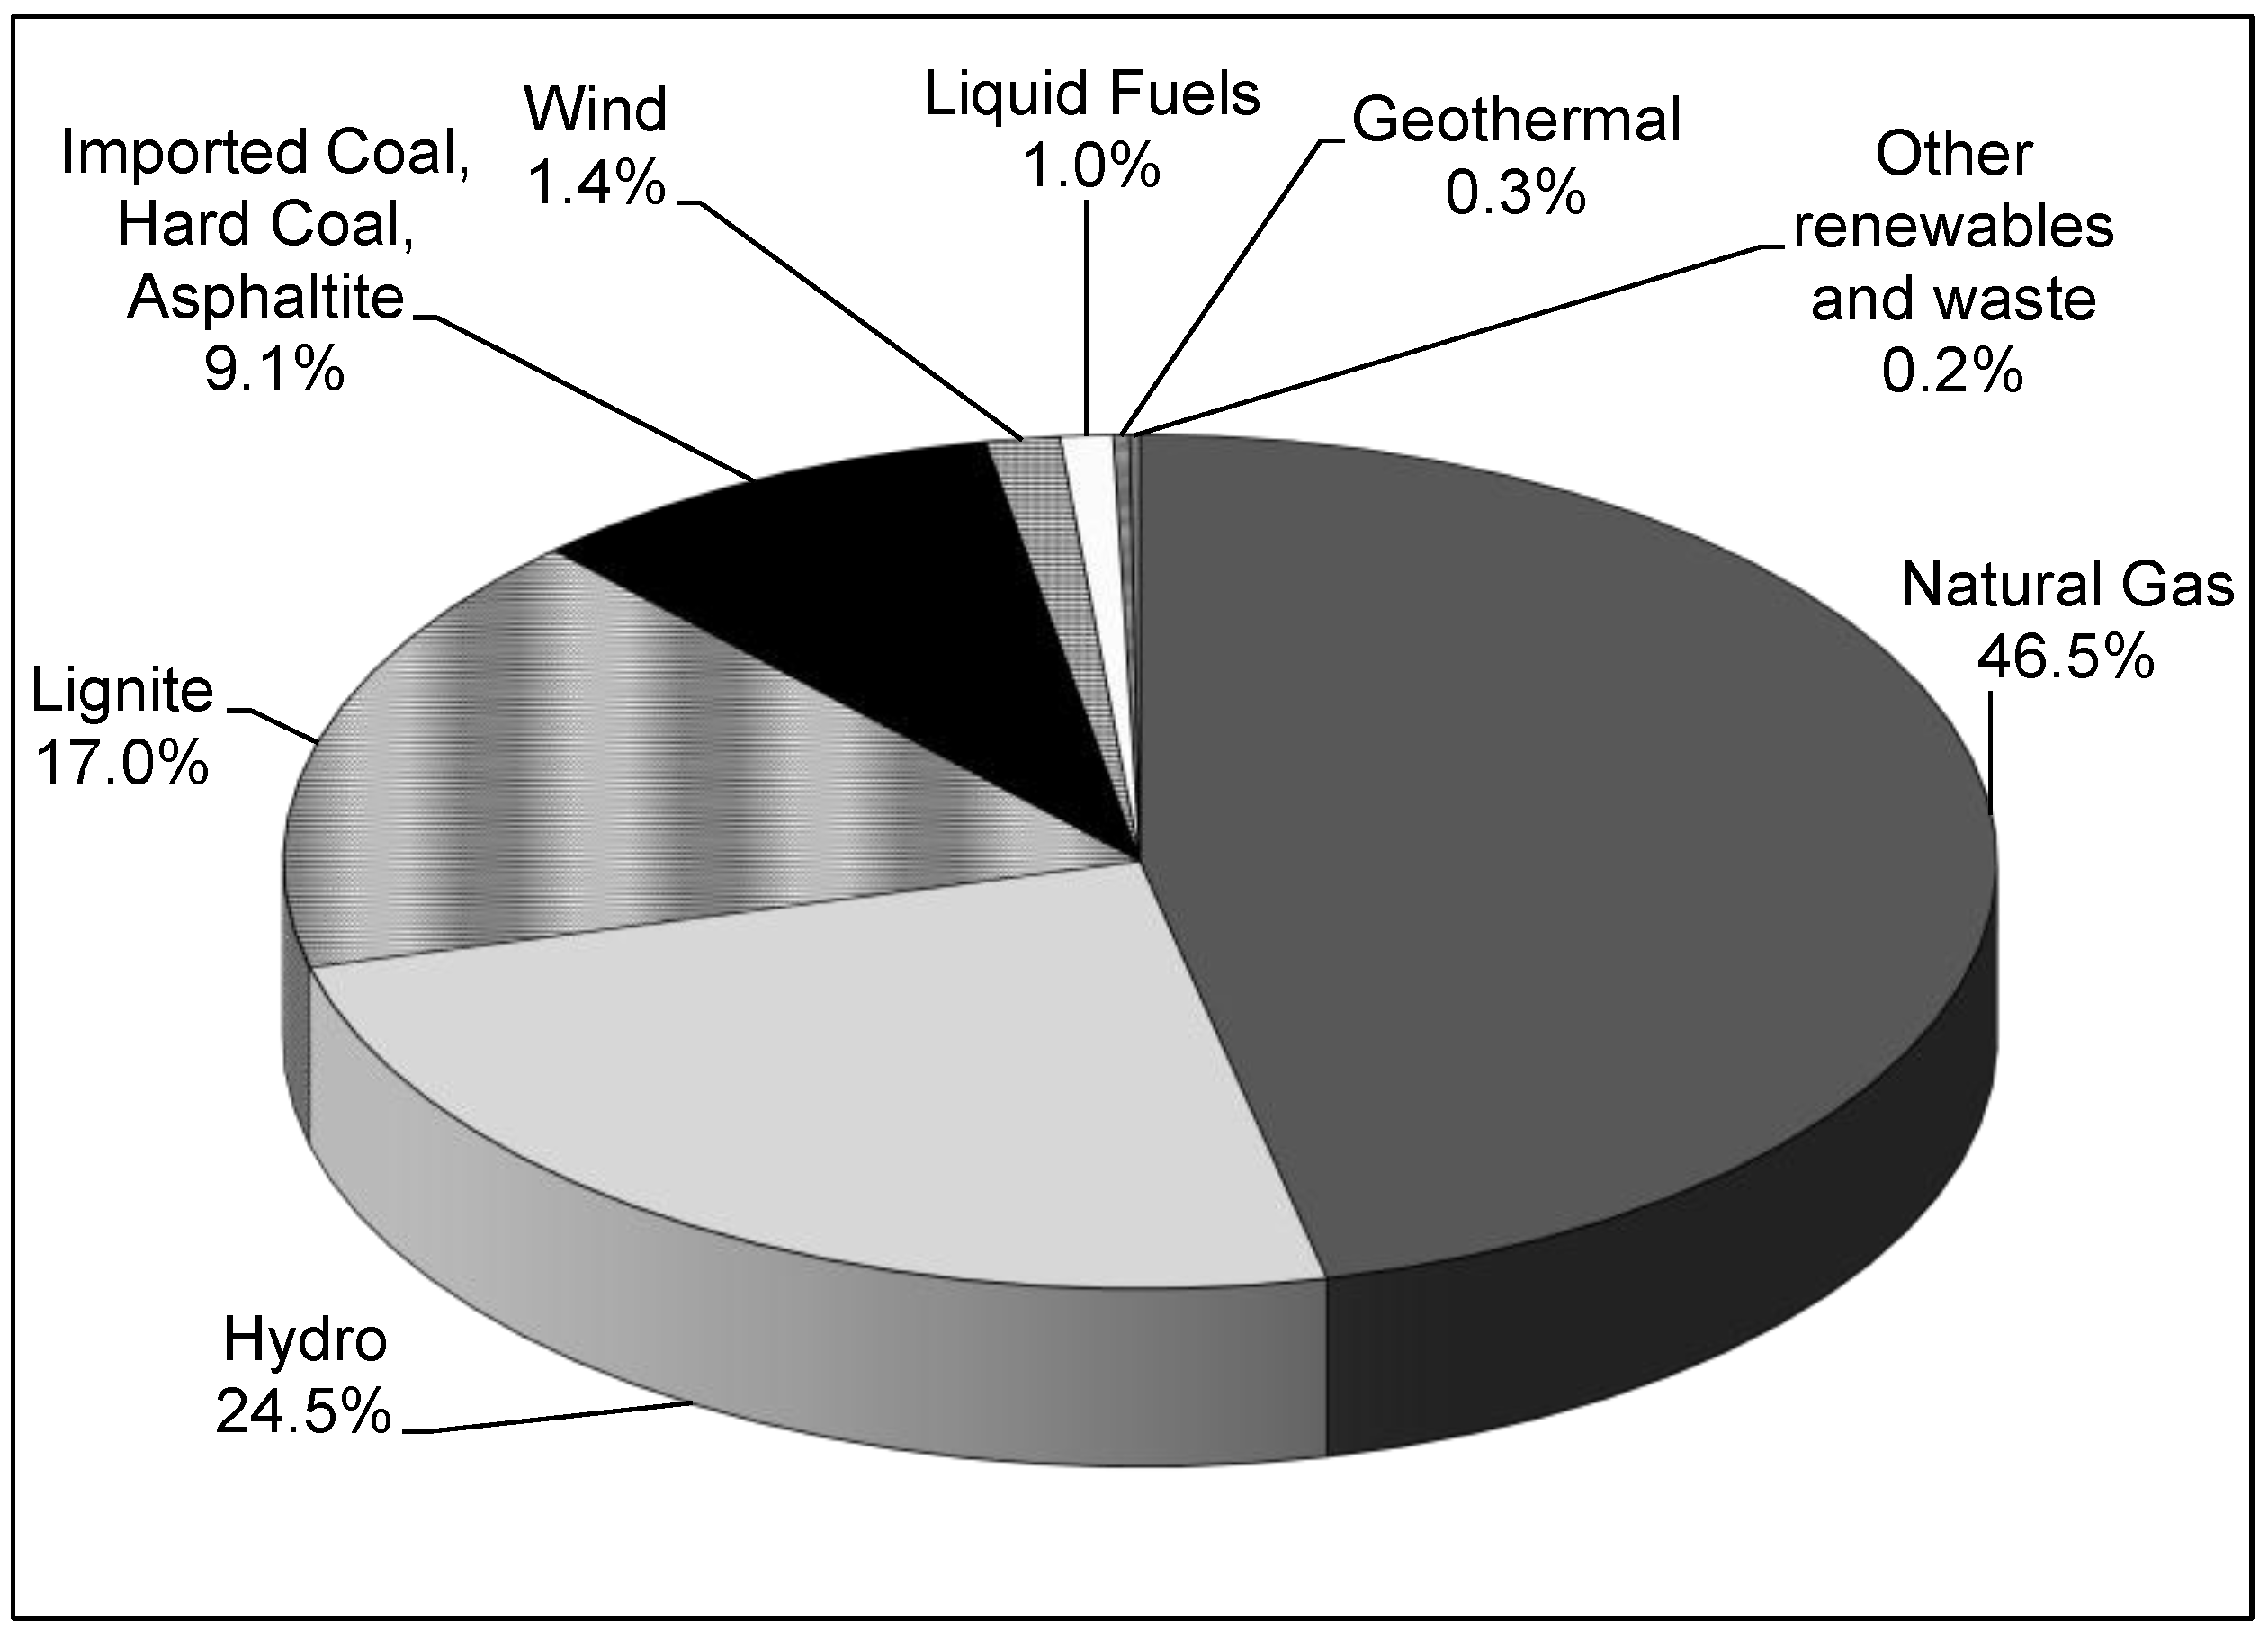
3.2. Environmental Impacts of Electricity Generated in the Base Year
3.2.1. Impacts per kWh

Abiotic Depletion Potential
Acidification and Eutrophication Potential
Ecotoxicity Potential
Global Warming Potential
Human Toxicity Potential
Ozone Layer Depletion Potential
Photochemical Oxidants Creation Potential
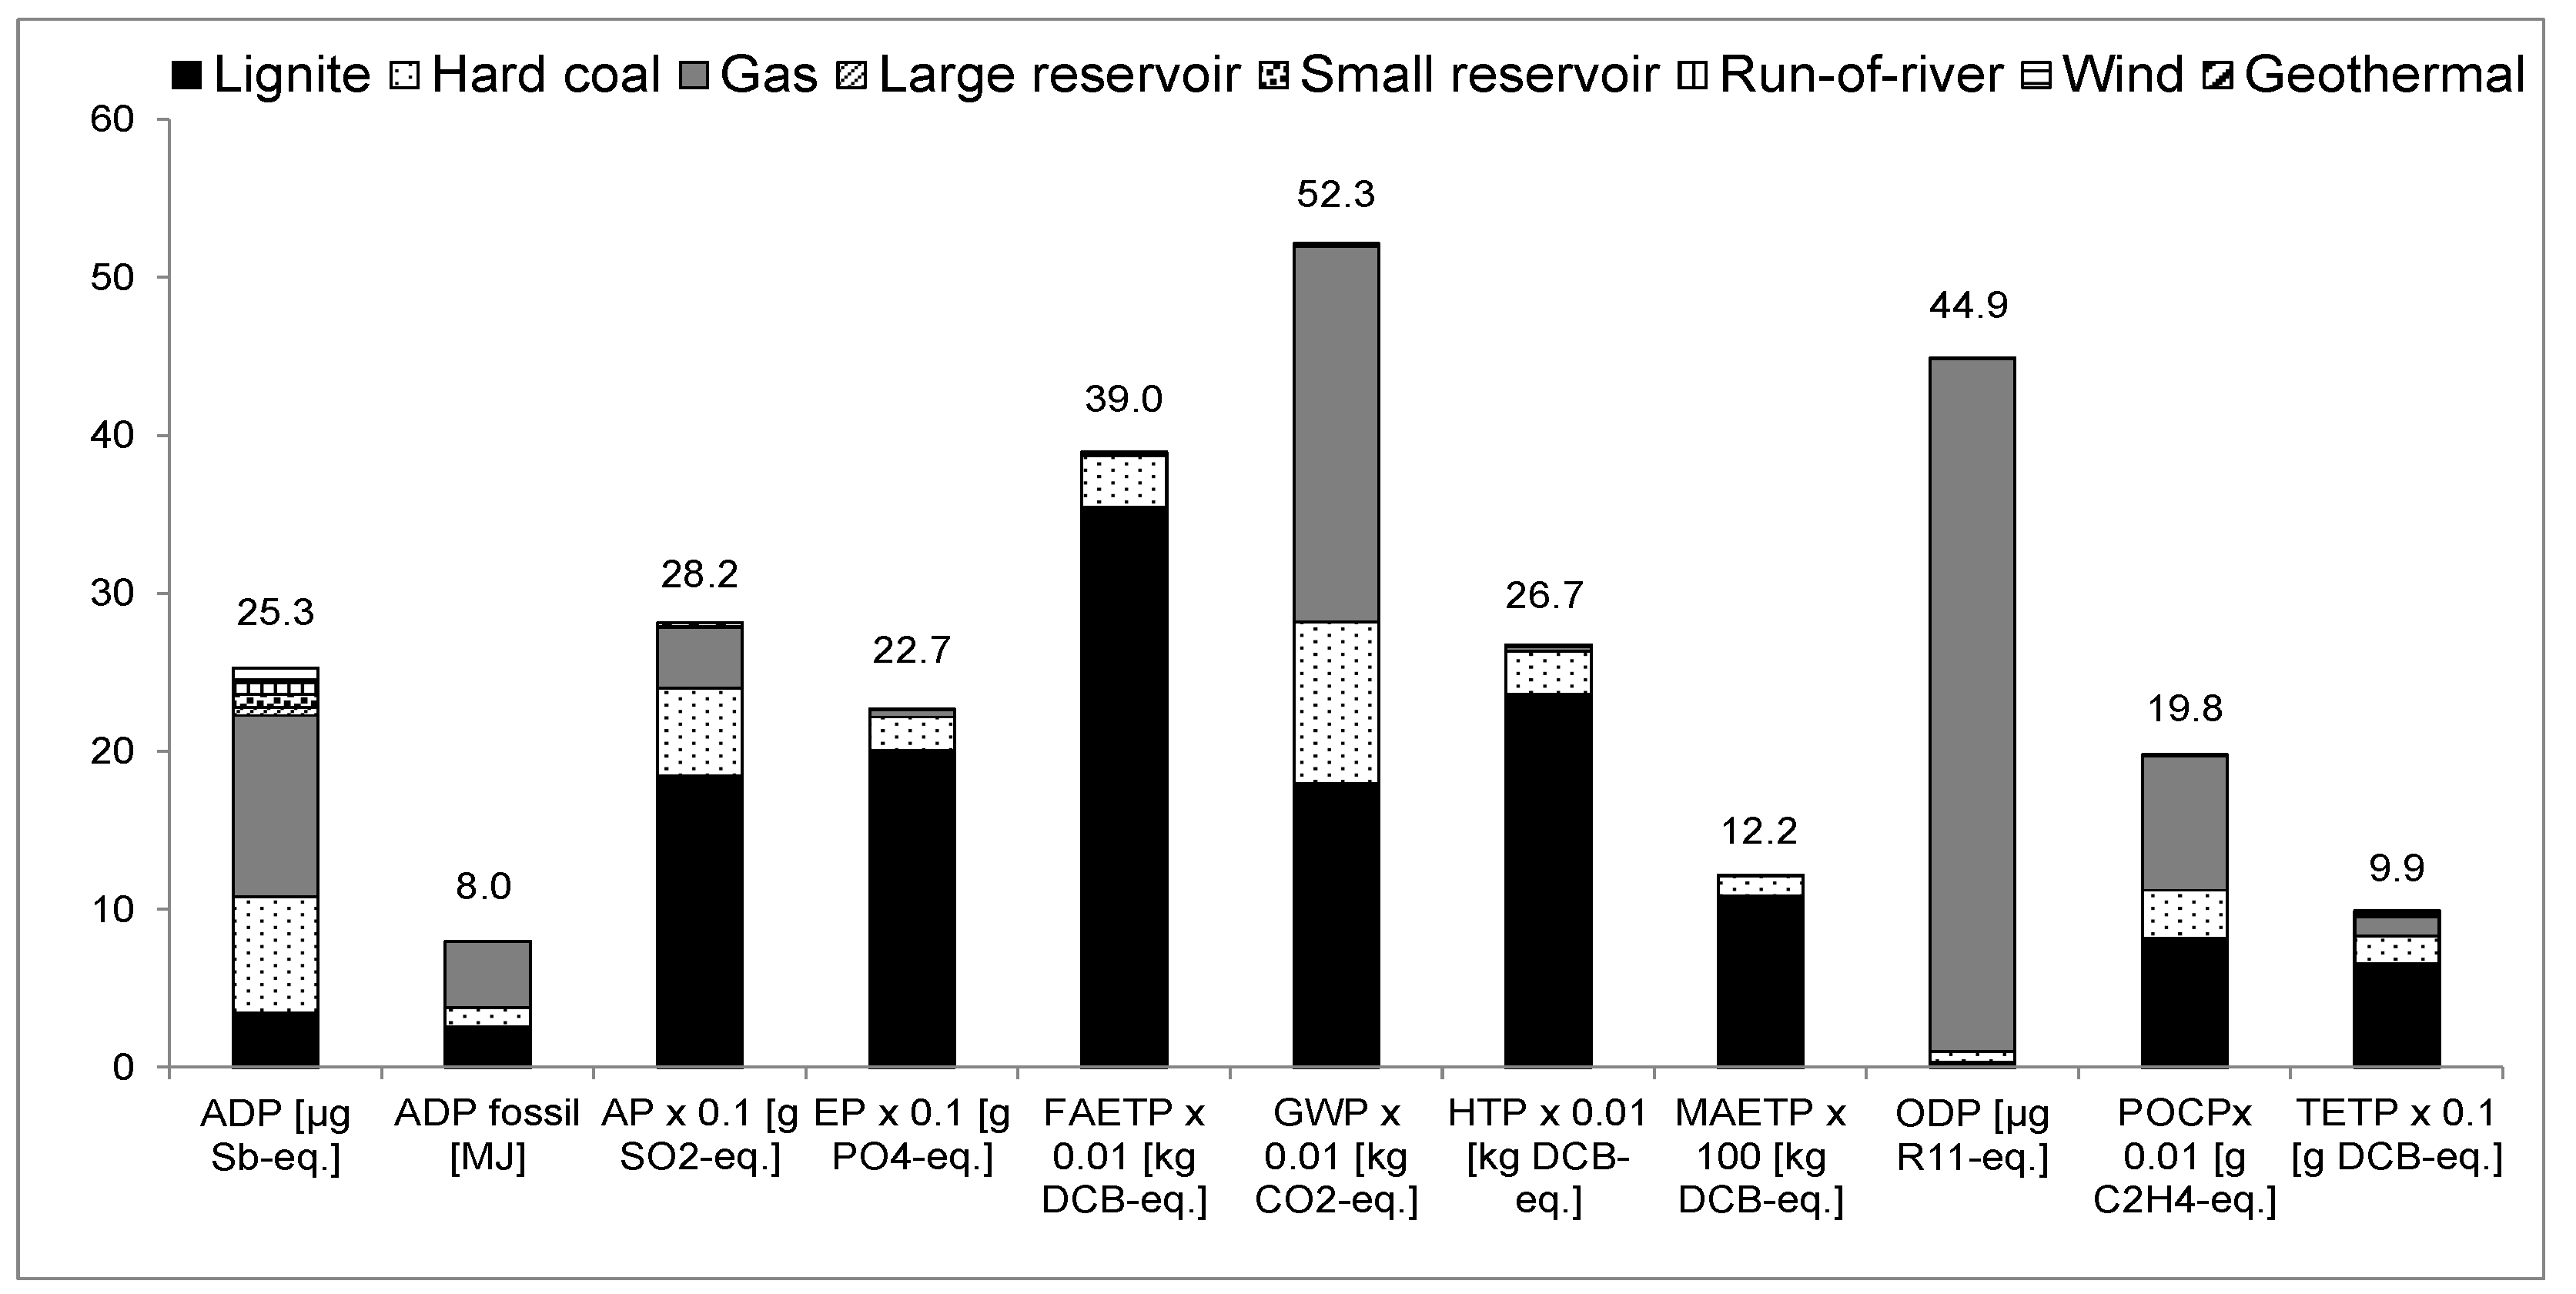
3.2.2. Total Annual Impacts


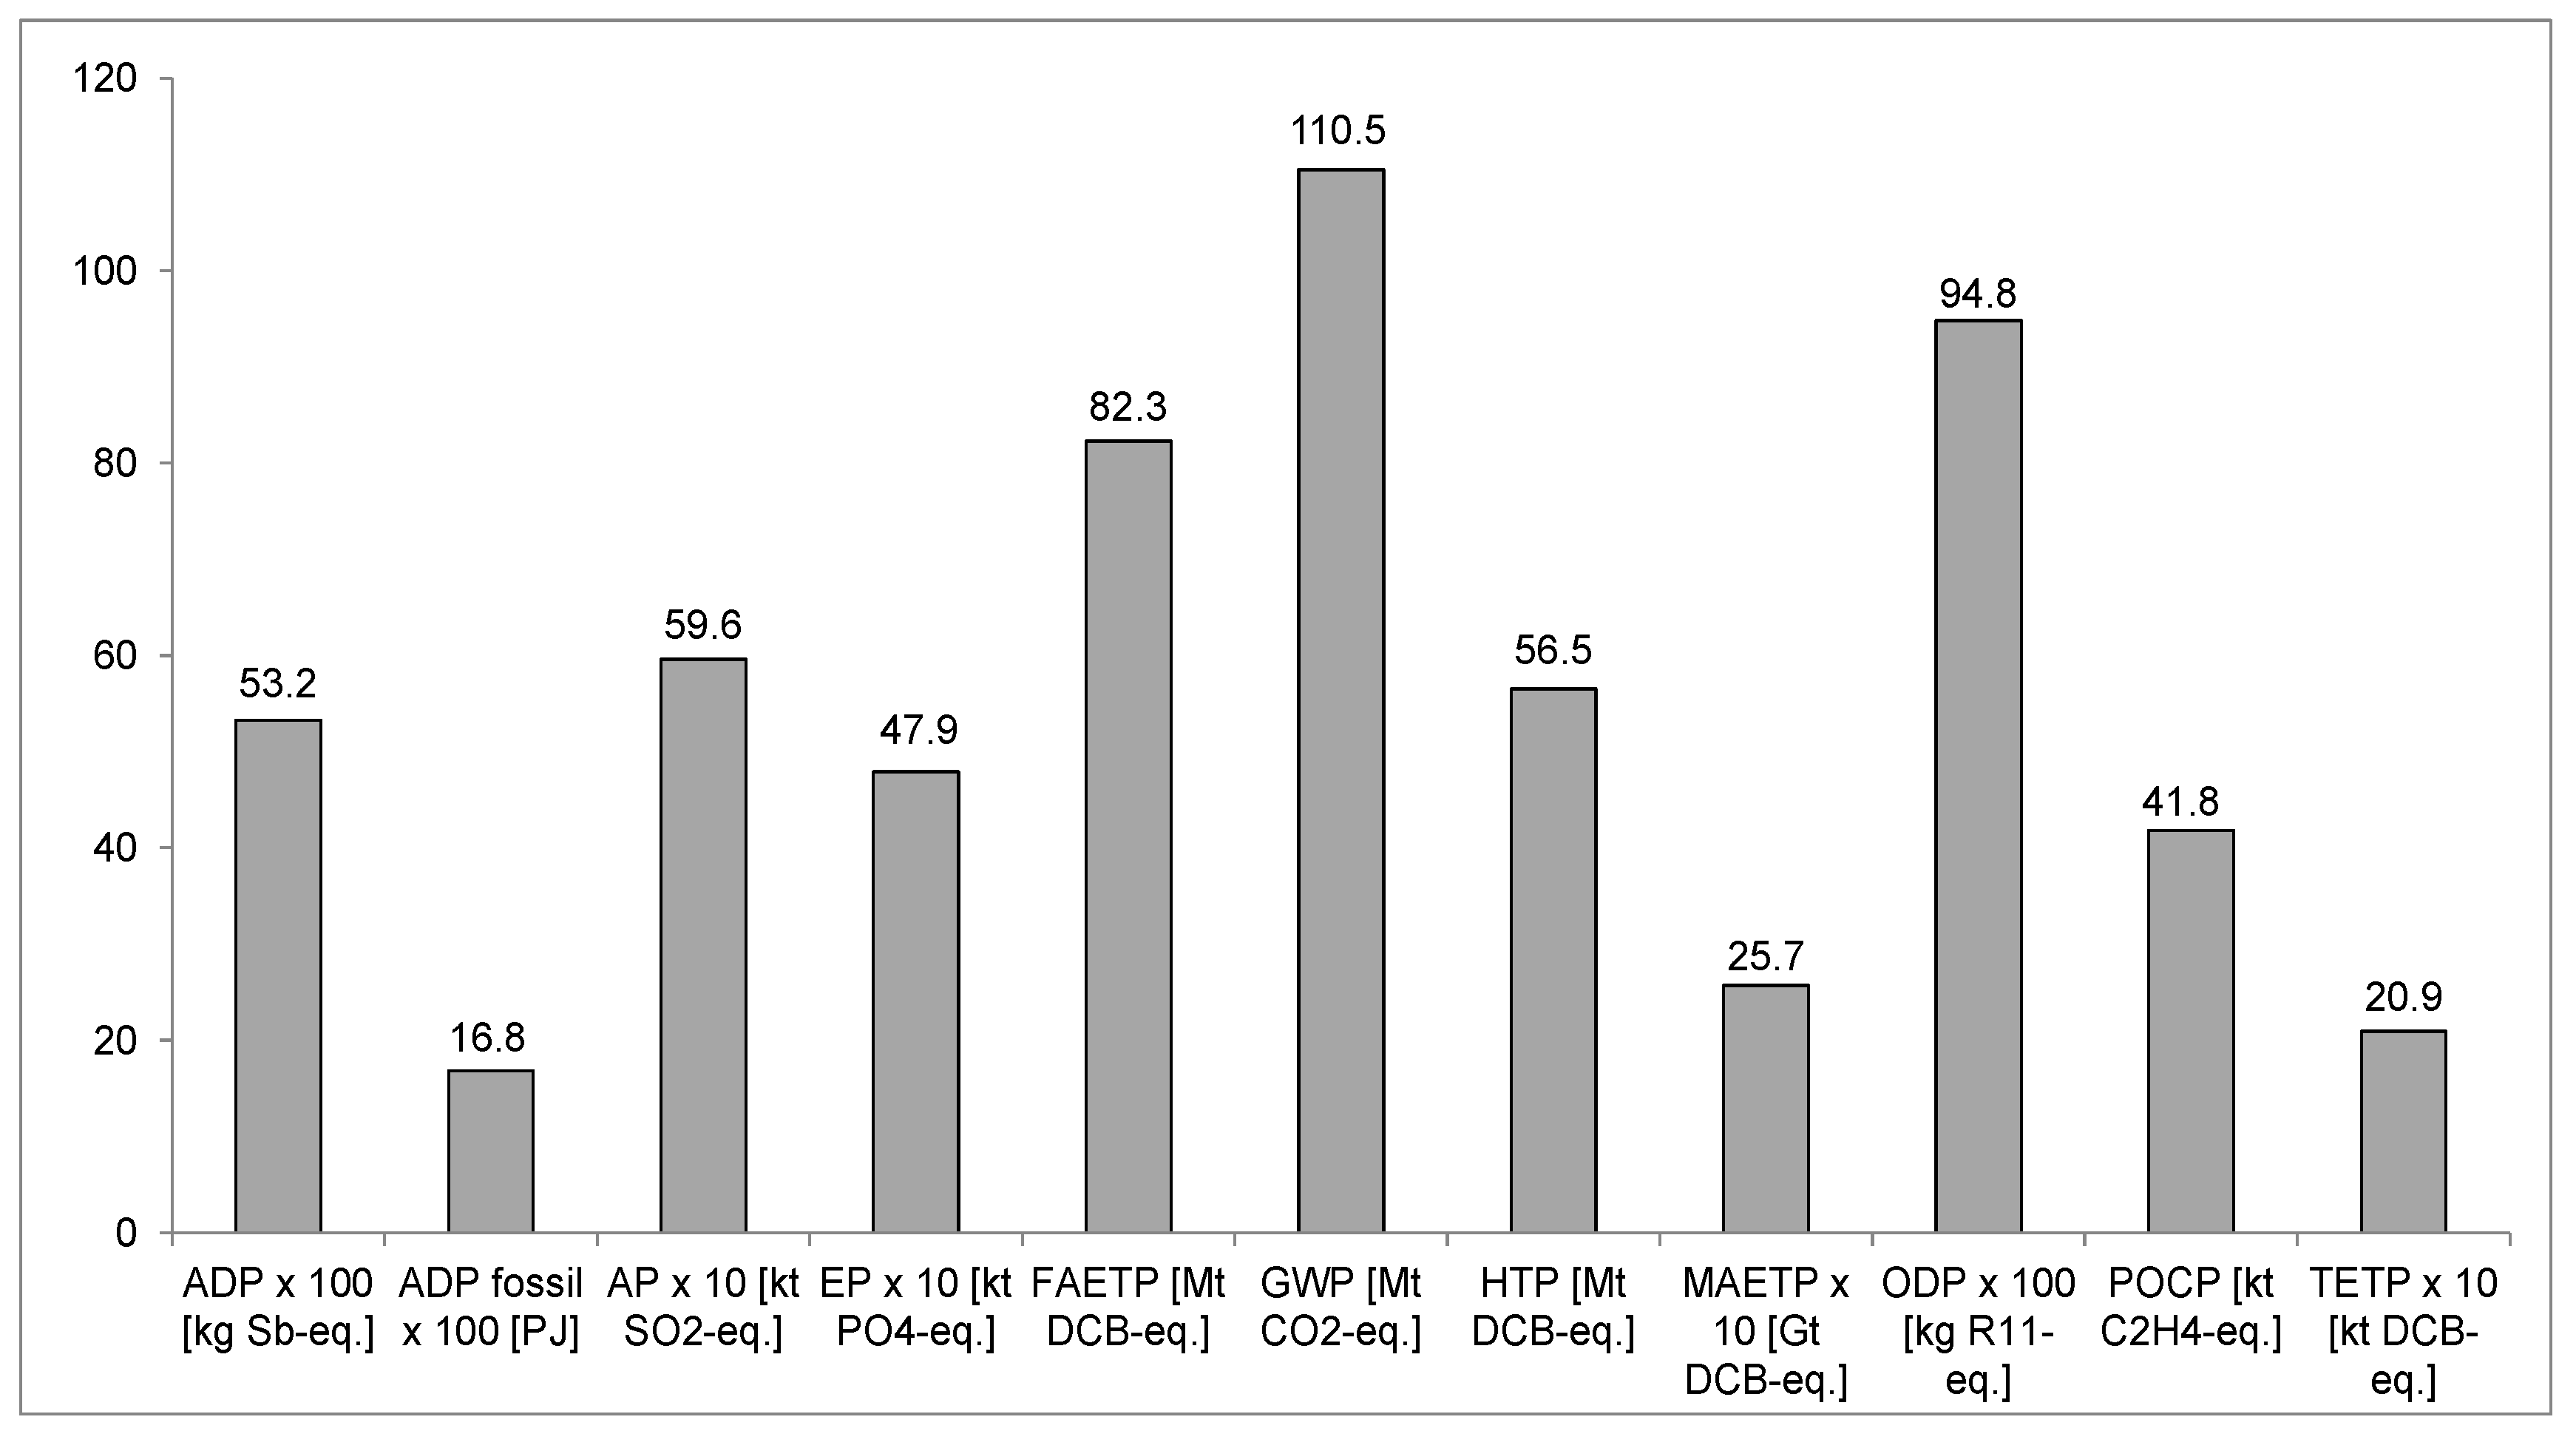
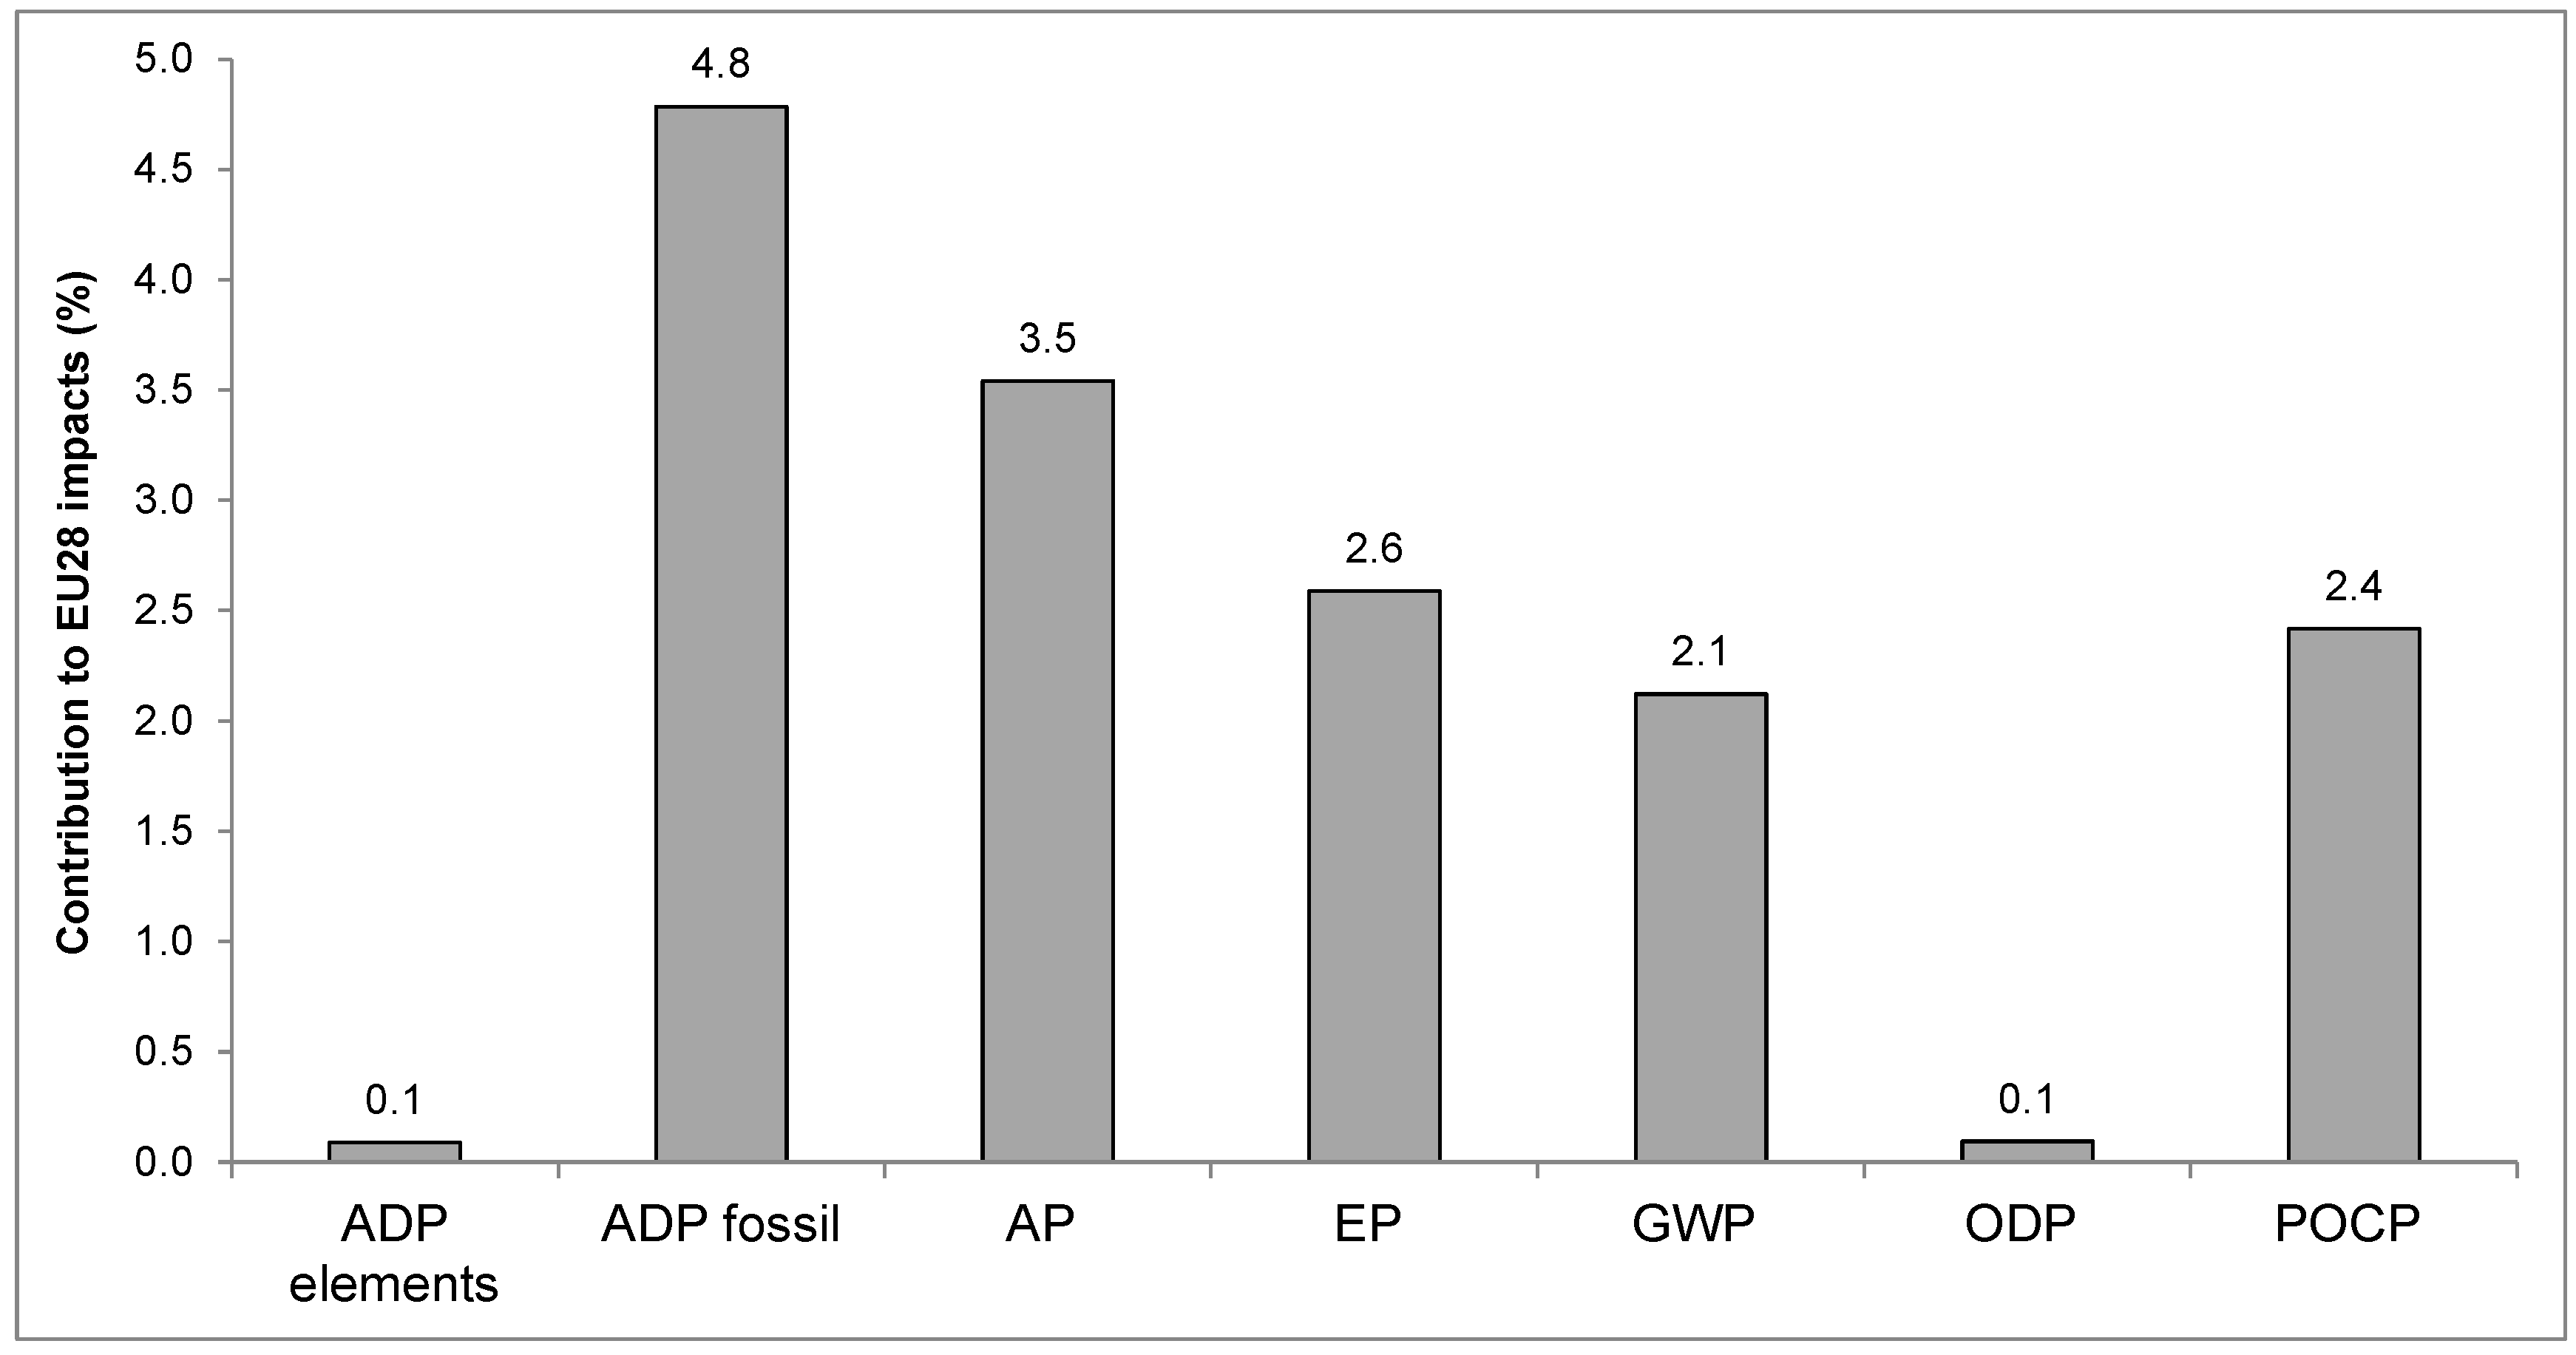
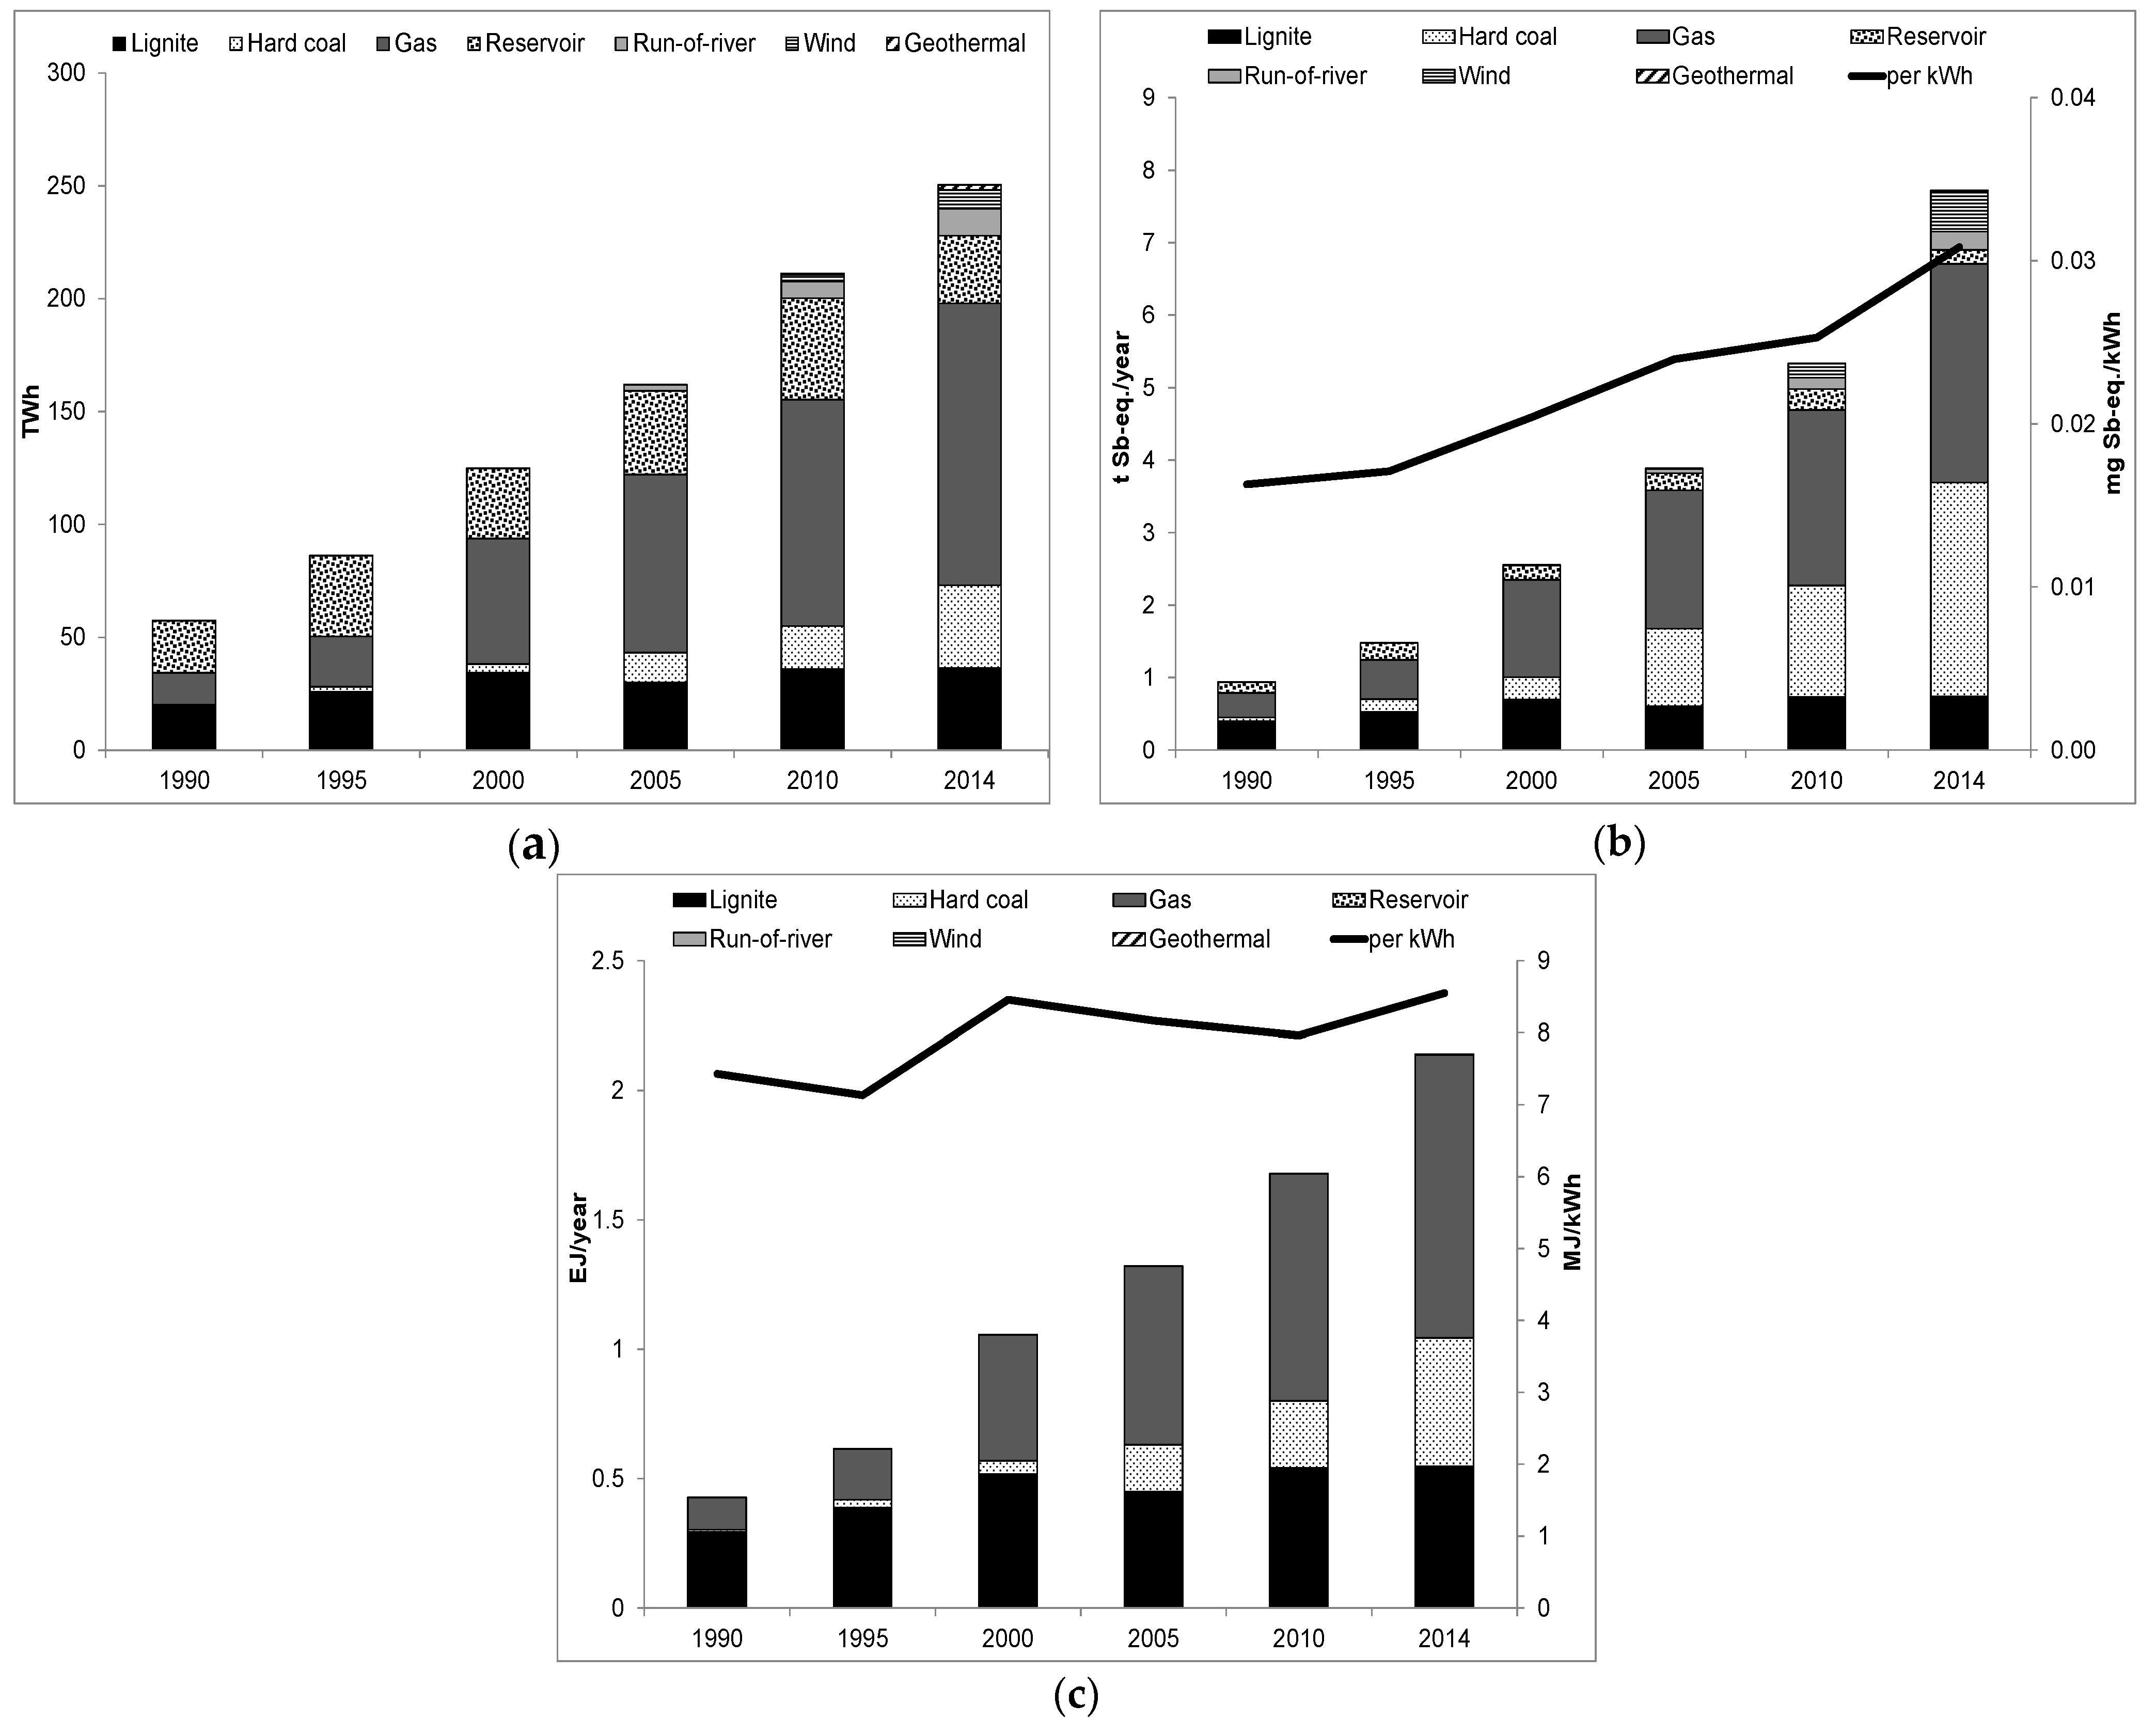
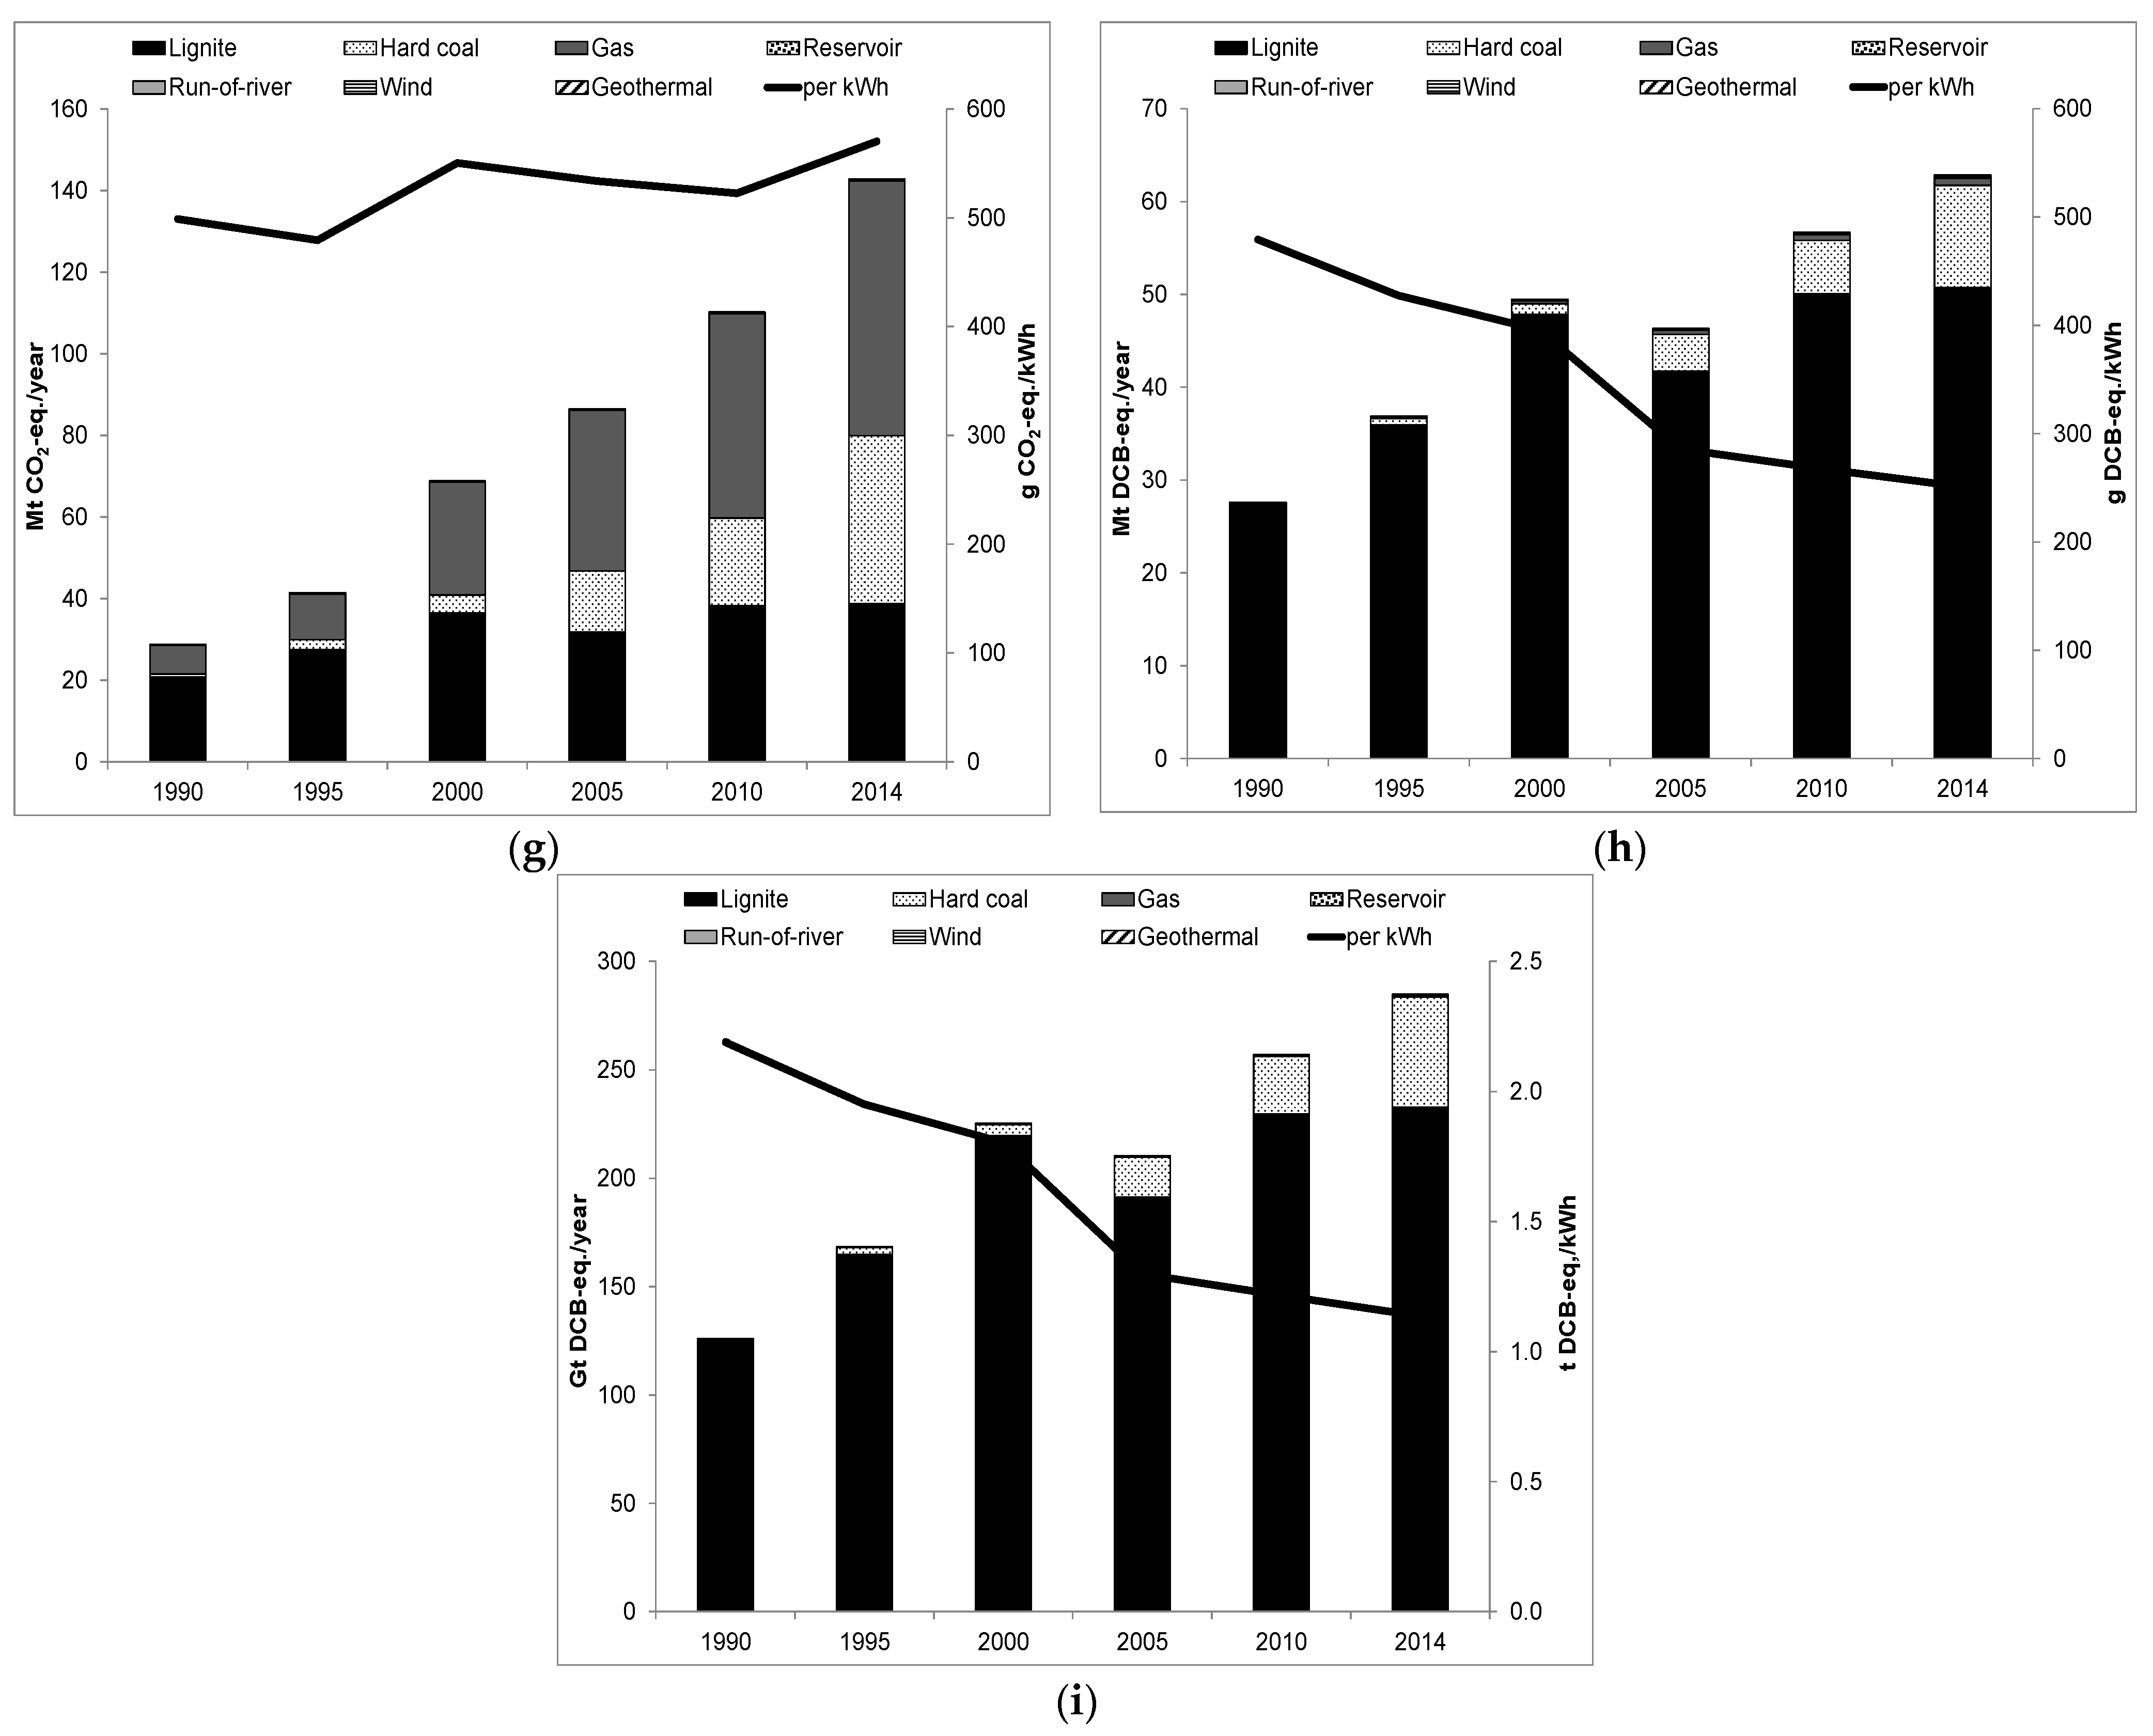
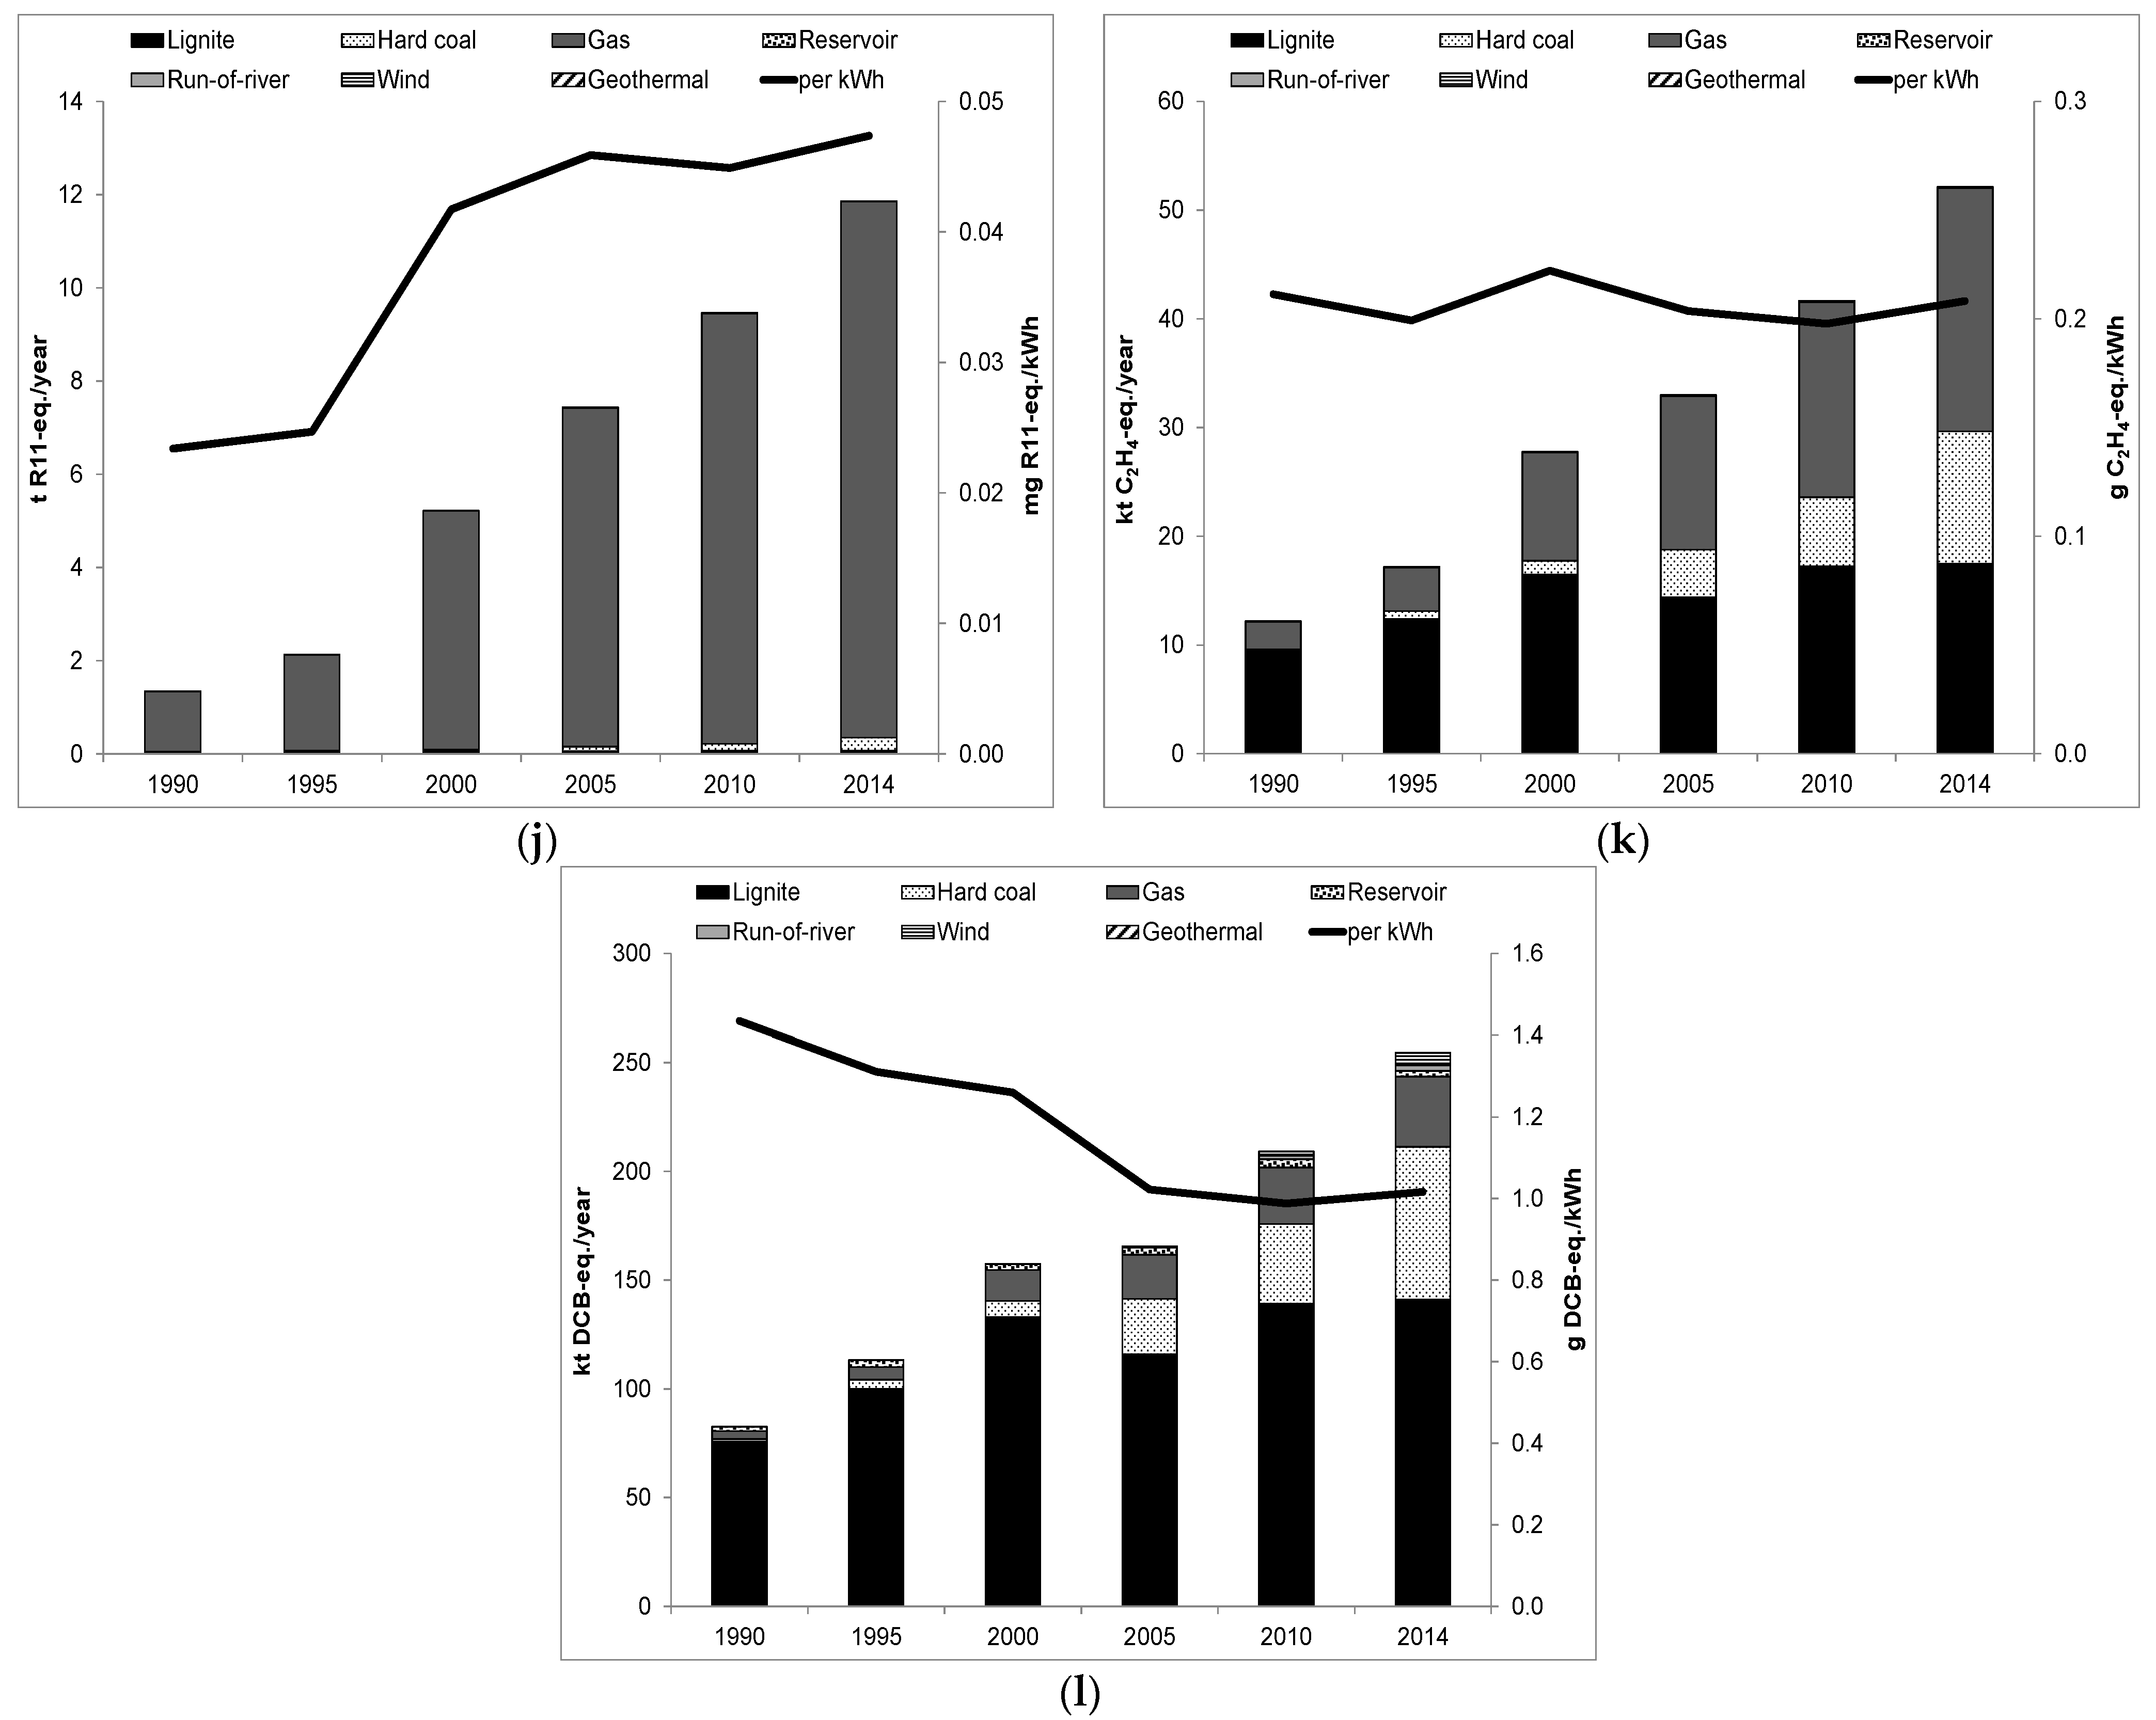
3.3. Environmental Impacts from Electricity Generation from 1990–2014


4. Conclusions
Supplementary Materials
Acknowledgments
Author Contributions
Conflicts of Interest
References
- MENR. Mavi Kitap (Blue Book); Ministry of Energy and Natural Resources: Ankara, Turkey, 2012; pp. 20–69.
- WEC. Turkey Energy Balance Table (1970–2004). Available online: http://www.dektmk.org.tr/incele.php?id=MTQ3 (accessed on 13 April 2014).
- TEIAS. Electricity Generation & Transmission Statistics of Turkey. Available online: http://www.teias.gov.tr/TurkiyeElektrikIstatistikleri.aspx (accessed on 2 June 2014).
- EUAS. Annual Report; Turkish Electricity Generation Company (EUAS): Ankara, Turkey, 2011. [Google Scholar]
- TPAO. The Oil and Gas Sector Report of Turkey; Turkish Petroleum Corporation (TPAO): Ankara, Turkey, 2011; pp. 1–26. [Google Scholar]
- MMO. Turkiye'de Termik Santraller; Makina Muhendisleri Odasi: Ankara, Turkey, 2010; pp. 1–81. [Google Scholar]
- TKI. Lignite Sector Report of Turkey; General Directorate of Turkish Coal Enterprises (TKI): Ankara, Turkey, 2012; pp. 1–61. [Google Scholar]
- DSI, Turkey Water Report 2009. Available online: http://www2.dsi.gov.tr/english/pdf_files/TurkeyWaterReport.pdf (accessed on 20 March 2012).
- EMRA. Data on Energy Potential of Turkey; Personel communication, 15.06.2014; Republic of Turkey Energy Market Regulatory Authority: Ankara, Turkey, 2014. [Google Scholar]
- Komurcu, M.I.; Akpinar, A. Importance of geothermal energy and its environmental effects in Turkey. Renew. Energy 2009, 34, 1611–1615. [Google Scholar] [CrossRef]
- FutureCamp. Baseline Emission Calculations, Verified Carbon Standard (VCS); Version 3; FutureCamp: Ankara, Turkey, 2011. [Google Scholar]
- Atilgan, B.; Azapagic, A. Life cycle environmental impacts of electricity from fossil fuels in Turkey. J. Clean. Prod. 2015, 106, 555–564. [Google Scholar] [CrossRef]
- Atilgan, B.; Azapagic, A. Renewable electricity in Turkey: Life cycle environmental impacts. Renew. Energy 2015, in press. [Google Scholar] [CrossRef]
- Kannan, R.; Leong, K.C.; Osman, R.; Ho, H.K.; Tso, C.P. Gas fired combined cycle plant in Singapore: Energy use, GWP and cost and Life cycle approach. Energy Convers. Manag. 2005, 46, 2145–2157. [Google Scholar] [CrossRef]
- Weisser, D. A guide to life-cycle greenhouse gas (GHG) emissions from electric supply technologies. Energy 2007, 32, 1543–1559. [Google Scholar] [CrossRef]
- Guinée, J.B.; Gorrée, M.; Heijungs, R.; Huppes, G.; Kleijn, R.; Koning, A. Life Cycle Assessment: An Operational Guide to the ISO Standards: Part 2a; Ministry of Housing, Spatial Planning and Environment (VROM) and Centre of Environmental Science (CML): Den Haag and Leiden, The Netherlands, 2001. [Google Scholar]
- International Standard Organization (ISO). Life Cycle Assessment—Requirements and Guidelines; ISO: Geneva, Switzerland, 2006. [Google Scholar]
- International Standard Organization (ISO). Life Cycle Assessment—Principles and Framework; ISO: Geneva, Switzerland, 2006. [Google Scholar]
- PE International. GaBi version 6; PE International: Stuttgart, Echterdingen, Germany, 2013. [Google Scholar]
- Schuller, O.; Albrecht, S. Setting up Life Cycle Models for the Environmental Analysis of Hydropower Generation, Considering Technical and Climatic Boundary Conditions; Life Cycle Assessment VIII: Seattle, WA, USA, 2008. [Google Scholar]
- Pehnt, M.; Henkel, J. Life cycle assessment of carbondioxide capture and storage from lignite power plants. Int. J. Greenh. Gas Control 2009, 3, 49–66. [Google Scholar] [CrossRef]
- Martínez, E.; Sanz, F.; Pellegrini, S.; Jiménez, E.; Blanco, J. Life-cycle assessment of a 2 MW rated power wind turbine: CML method. Int. J. Life Cycle Assess. 2009, 14, 52–63. [Google Scholar] [CrossRef]
- Suwanit, W.; Gheewala, S. Life cycle assessment of mini-hydropower plants in Thailand. Int. J. Life Cycle Assess. 2011, 16, 849–858. [Google Scholar] [CrossRef]
- Santoyo-Castelazo, E.; Gujba, H.; Azapagic, A. Life cycle assessment of electricity generation in Mexico. Energy 2011, 36, 1488–1499. [Google Scholar] [CrossRef]
- Lahuerta, F.; Saenz, E. Life cycle assessment of the wind turbines installed in Spain until 2008. In Proceedings of the Europe’s Premier Wind Energy Conference and Exhibition, Brussels, Belgium, 14–17 March 2011.
- Pascale, A.; Urmee, T.; Moore, A. Life cycle assessment of a community hydroelectric power system in rural Thailand. Renew. Energy 2011, 36, 2799–2808. [Google Scholar] [CrossRef]
- Stamford, L.; Azapagic, A. Life cycle sustainability assessment of electricity options for the UK. Int. J. Energy Res. 2012, 36, 1263–1290. [Google Scholar] [CrossRef]
- Pereg, J.R.M.; Hoz, J.F. Life Cycle Assessment of 1 kWh Generated by a Gamesa Onshore Windfarm G90 2.0 MW; Gamesa: Zamudio (Vizcaya), Spain, 2013. [Google Scholar]
- Arnøy, S.; Modahl, I.S. Life Cycle data for Hydroelectric Generation at Embretsfoss 4 (E4) Power Station: Background Data for Life Cycle Assessment (LCA) and Environmental Product Declaration (EPD); Ostfold Research: Kråkerøy, Norway, 2013. [Google Scholar]
- Arnøy, S. Hydroelectricity from Trollheim Power Station; Østfoldforskning AS: Oslo, Norway, 2013. [Google Scholar]
- Garrett, P.; Rønde, K. Life Cycle Assessment of Electricity Production from an Onshore V90–3.0 MW Wind Plant; Vestas Wind Systems A/S: Aarhus, Denmark, 2013. [Google Scholar]
- Garrett, P.; Rønde, K. Life cycle assessment of wind power: Comprehensive results from a state-of-the-art approach. Int. J. Life Cycle Assess. 2013, 18, 37–48. [Google Scholar] [CrossRef]
- Palomo, B.; Gaillardon, B. Life Cycle Assessment of a French Wind Plant; Europe’s Premier Wind Energy Event: Barcelona, Spain, 2014. [Google Scholar]
- IEA/NEA. Projected Costs of Generating Electricity, 2005 Update; International Energy Agency and Nuclear Energy Agency: Paris, France, 2005. [Google Scholar]
- Aslanoglu, S.Y.; Koksal, M.A. Elektrik uretimine bagli karbondioksit emisyonunun bolgesel olarak belirlenmesi ve uzun donem tahmini. Hava Kirliligi Arastirma Derg. (HKAD) 2012, 1, 19–29. [Google Scholar]
- Öko Institute Global Emission Model for Integrated Systems (GEMIS) v.4.8. Available online: http://www.oeko.de/service/gemis/en/index.htm (accessed on 10 September 2012).
- Dones, R.; Bauer, C.; Bolliger, R.; Burger, B.; Faist Emmenegger, M.; Frischknecht, R.; Heck, T.; Jungbluth, N.; Röder, A.; Tuchschmid, M.; et al. Ecoinvent Report: Life Cycle Inventories of Energy Systems: Results for Current Systems in Switzerland and Other UCTE Countries; Swiss Centre for Life Cycle Inventories: Dübendorf, Switzerland, 2007. [Google Scholar]
- Bauer, C.; Bolliger, R. Ecoinvent Report: Wasserkraft; Swiss Centre for Life Cycle Inventories: Dübendorf, Switzerland, 2007. [Google Scholar]
- Flury, K.; Frischknecht, R. Life Cycle Inventories of Hydroelectric Power Generation, ESU Database; Öko-Institute e.V.: Uster, Switzerland, 2012. [Google Scholar]
- Coulson, J.M.; Sinnott, R.K.; Richardson, J.F. Coulson & Richardson's Chemical Engineering; Butterworth Heinemann Ltd.: Oxford, UK; Boston, MA, USA, 1993. [Google Scholar]
- Kouloumpis, V.; Stamford, L.; Azapagic, A. Decarbonising electricity supply: Is climate change mitigation going to be carried out at the expense of other environmental impacts? Sustain. Prod. Consum. 2015, 1, 1–21. [Google Scholar] [CrossRef]
- TEIAS. Turkiye Elektrik Enerjisi Uretim Planlama Calismasi (2012–2030); Turkish Electricity Transmission Corporation (TEIAS), Research Planning and Coordination Department: Ankara, Turkey, 2013. [Google Scholar]
- Swiss Centre for Life Cycle Inventories. Ecoinvent, Ecoinvent Database v2.2; Swiss Centre for Life Cycle Inventories: St. Gallen, Switzerland, 2010. [Google Scholar]
- ESU. ESU Database; Öko-Institute e.V., ESU-services Ltd.: Uster, Switzerland, 2012. [Google Scholar]
- Raadal, H.L.; Gagnon, L.; Modahl, I.S.; Hanssen, O.J. Life cycle greenhouse gas (GHG) emissions from the generation of wind and hydro power. Renew. Sustain. Energy Rev. 2011, 15, 3417–3422. [Google Scholar] [CrossRef]
- Benini, L.; Mancini, L.; Sala, S.; Manfredi, S.; Schau, E.M.; Pant, R. Normalisation Method and Data for Environmental Footprints; European Commission, Joint Research Centre, Institute for Environment and Sustainability: Ispra, Italy, 2014. [Google Scholar]
- Heijungs, R.; de Koning, A.; Lightart, T.; Korenromp, R. Improvement of LCA Characterisation Factors and LCA Practice for Metals; TNO Environment, Energy and Process Innovation, Netherlands Organisation for Applied Scientific Research: Apeldoorn, The Nertherland, 2004. [Google Scholar]
© 2016 by the authors; licensee MDPI, Basel, Switzerland. This article is an open access article distributed under the terms and conditions of the Creative Commons by Attribution (CC-BY) license (http://creativecommons.org/licenses/by/4.0/).
Share and Cite
Atilgan, B.; Azapagic, A. Assessing the Environmental Sustainability of Electricity Generation in Turkey on a Life Cycle Basis. Energies 2016, 9, 31. https://doi.org/10.3390/en9010031
Atilgan B, Azapagic A. Assessing the Environmental Sustainability of Electricity Generation in Turkey on a Life Cycle Basis. Energies. 2016; 9(1):31. https://doi.org/10.3390/en9010031
Chicago/Turabian StyleAtilgan, Burcin, and Adisa Azapagic. 2016. "Assessing the Environmental Sustainability of Electricity Generation in Turkey on a Life Cycle Basis" Energies 9, no. 1: 31. https://doi.org/10.3390/en9010031