Article

Droop Control Design of Multi-VSC Systems for Offshore Networks to Integrate Wind Energy

by
Muhammad Raza
1,*,
Kevin Schönleber
2 and
Oriol Gomis-Bellmunt
1
1
Departament d’Enginyeria Electrica, Centre d’Innovacio Tecnologica en Convertidors Estatics i Accionaments (CITCEA-UPC), Universitat Politecnica de Catalunya, BarcelonaTECH. ETS d’Enginyeria Industrial de Barcelona, Barcelona 08028, Spain
2
Electrical Systems, GE Renewable Energy, Barcelona 08005, Spain
*
Author to whom correspondence should be addressed.
Energies 2016, 9(10), 826; https://doi.org/10.3390/en9100826
Submission received: 12 August 2016 / Revised: 14 September 2016 / Accepted: 10 October 2016 / Published: 14 October 2016
(This article belongs to the Special Issue Advances in Power System Operations and Planning)

Abstract

:
This research envisages the droop control design of multi voltage source converter systems for offshore networks to integrate wind power plant with the grids. An offshore AC network is formulated by connecting several nearby wind power plants together with AC cables. The net energy in the network is transferred to onshore using voltage source high voltage direct current (VSC-HVDC) transmissionsystems. In the proposed configuration, an offshore network is energized by more than one VSC-HVDC system, hereby providing redundancy to continue operation in case of failure in one of the HVDC transmission lines. The power distribution between VSC-HVDC systems is done using a droop control scheme. Frequency droop is implemented to share active power, and voltage droop is implemented to share reactive power. Furthermore, a method of calculating droop gains according to the contribution factor of each converter is presented. The system has been analyzed to evaluate the voltage profile of the network affected by the droop control. Nonlinear dynamic simulation has been performed for the verification of the control principle.

1. Introduction

An offshore wind farm has the potential to impact the environment. In 2015, 419 new offshore wind turbines were installed in Europe having 3.019 GW total installed capacity. At the end of 2015, a total of 11.017 GW cumulative offshore wind energy injected into the European grid [1]. This statistic shows the ambition of European Union (EU) states to achieve the threshold of 40 GW of offshore wind power by the end of 2020. In order to manage this enormous amount of offshore energy into the grid, the European Wind Energy Association (EWEA) proposed a 20 year offshore network development plan that provides a gradual approach to plan an offshore grid in the North and Baltic Seas [2].
A voltage source converter (VSC) based high voltage direct current (HVDC) transmission system is one of the most prominent types of technology to transfer large power from offshore substations to onshore grids [3,4]. A modular multi-level converter (MMC) based voltage source converter compared to the line commutated converter (LCC) have the benefit of flowing bi-directional power flow with ease, has a reduced footprint, and posses the ability to create an electrical network. In [5], the concept of an offshore AC hub is proposed in which several offshore wind power plants are connected that are close to each other but far from shore, and accumulated energy is then transmitted to the shore via an HVDC system. An AC transmission system is still suitable if the wind power plant is located up to 50 km from shore. The prospective future integrated European offshore grid will consist of both multi-terminal HVDC, and multi VSC offshore AC networks in which energy can be transferred from offshore AC hubs to several onshore destinations.
The control principle of offshore networks having multiple converters can be designed analogue to the control principle of island grids with parallel converters [6,7,8]. The nature of offshore network is more capacitive in comparison to island network that is typically a low voltage distribution system, and predominated by the resistance of the cables. There are several key aspects to be addressed in the operation of a network having multiple converters imposing frequency, such as principle of power scheduling, ability to maintain the network stability without fast communication in case of failure, and the effects on network stability due to lack of natural system inertia. To cater some of these issues, control principles similar to the governor droop characteristic of the synchronous machine can be employed at the offshore side converter [9,10,11]. Droop principle introduces the concept of operating the offshore network at variable frequency, hereby allowing frequency to be used as a signal of power sharing. Furthermore, network frequency can be raised by the offshore converters of the HVDC system to activate frequency support control of wind generation units during large transient disturbances such as the tripping of one transmission line. In [12,13,14], wind turbine control for frequency support is addressed. In [10], a study has been presented on the principle of reducing active power of wind turbines having variable frequency in the network, and at fixed reference bus voltage imposed by the converters. By having fixed reference bus voltage, reactive power through converters flows according to the impedance of the network, and, consequently, reactive power sharing between converters cannot be controlled.
In this article, a droop control scheme is presented for a Multi-VSC offshore AC network. Section 2 contains the description of the system configuration. Section 3 presents the control of a voltage source converter and mathematical background of a droop principle to share power among the transmission system. Furthermore, analysis has been done to demonstrate the effect of droop gains on active and reactive power flows, and a method was presented to determine the frequency and voltage droop gains according to constraints. In Section 4, the presented method has been proven using nonlinear dynamic simulation. Conclusions of the paper have been provided in Section 5.

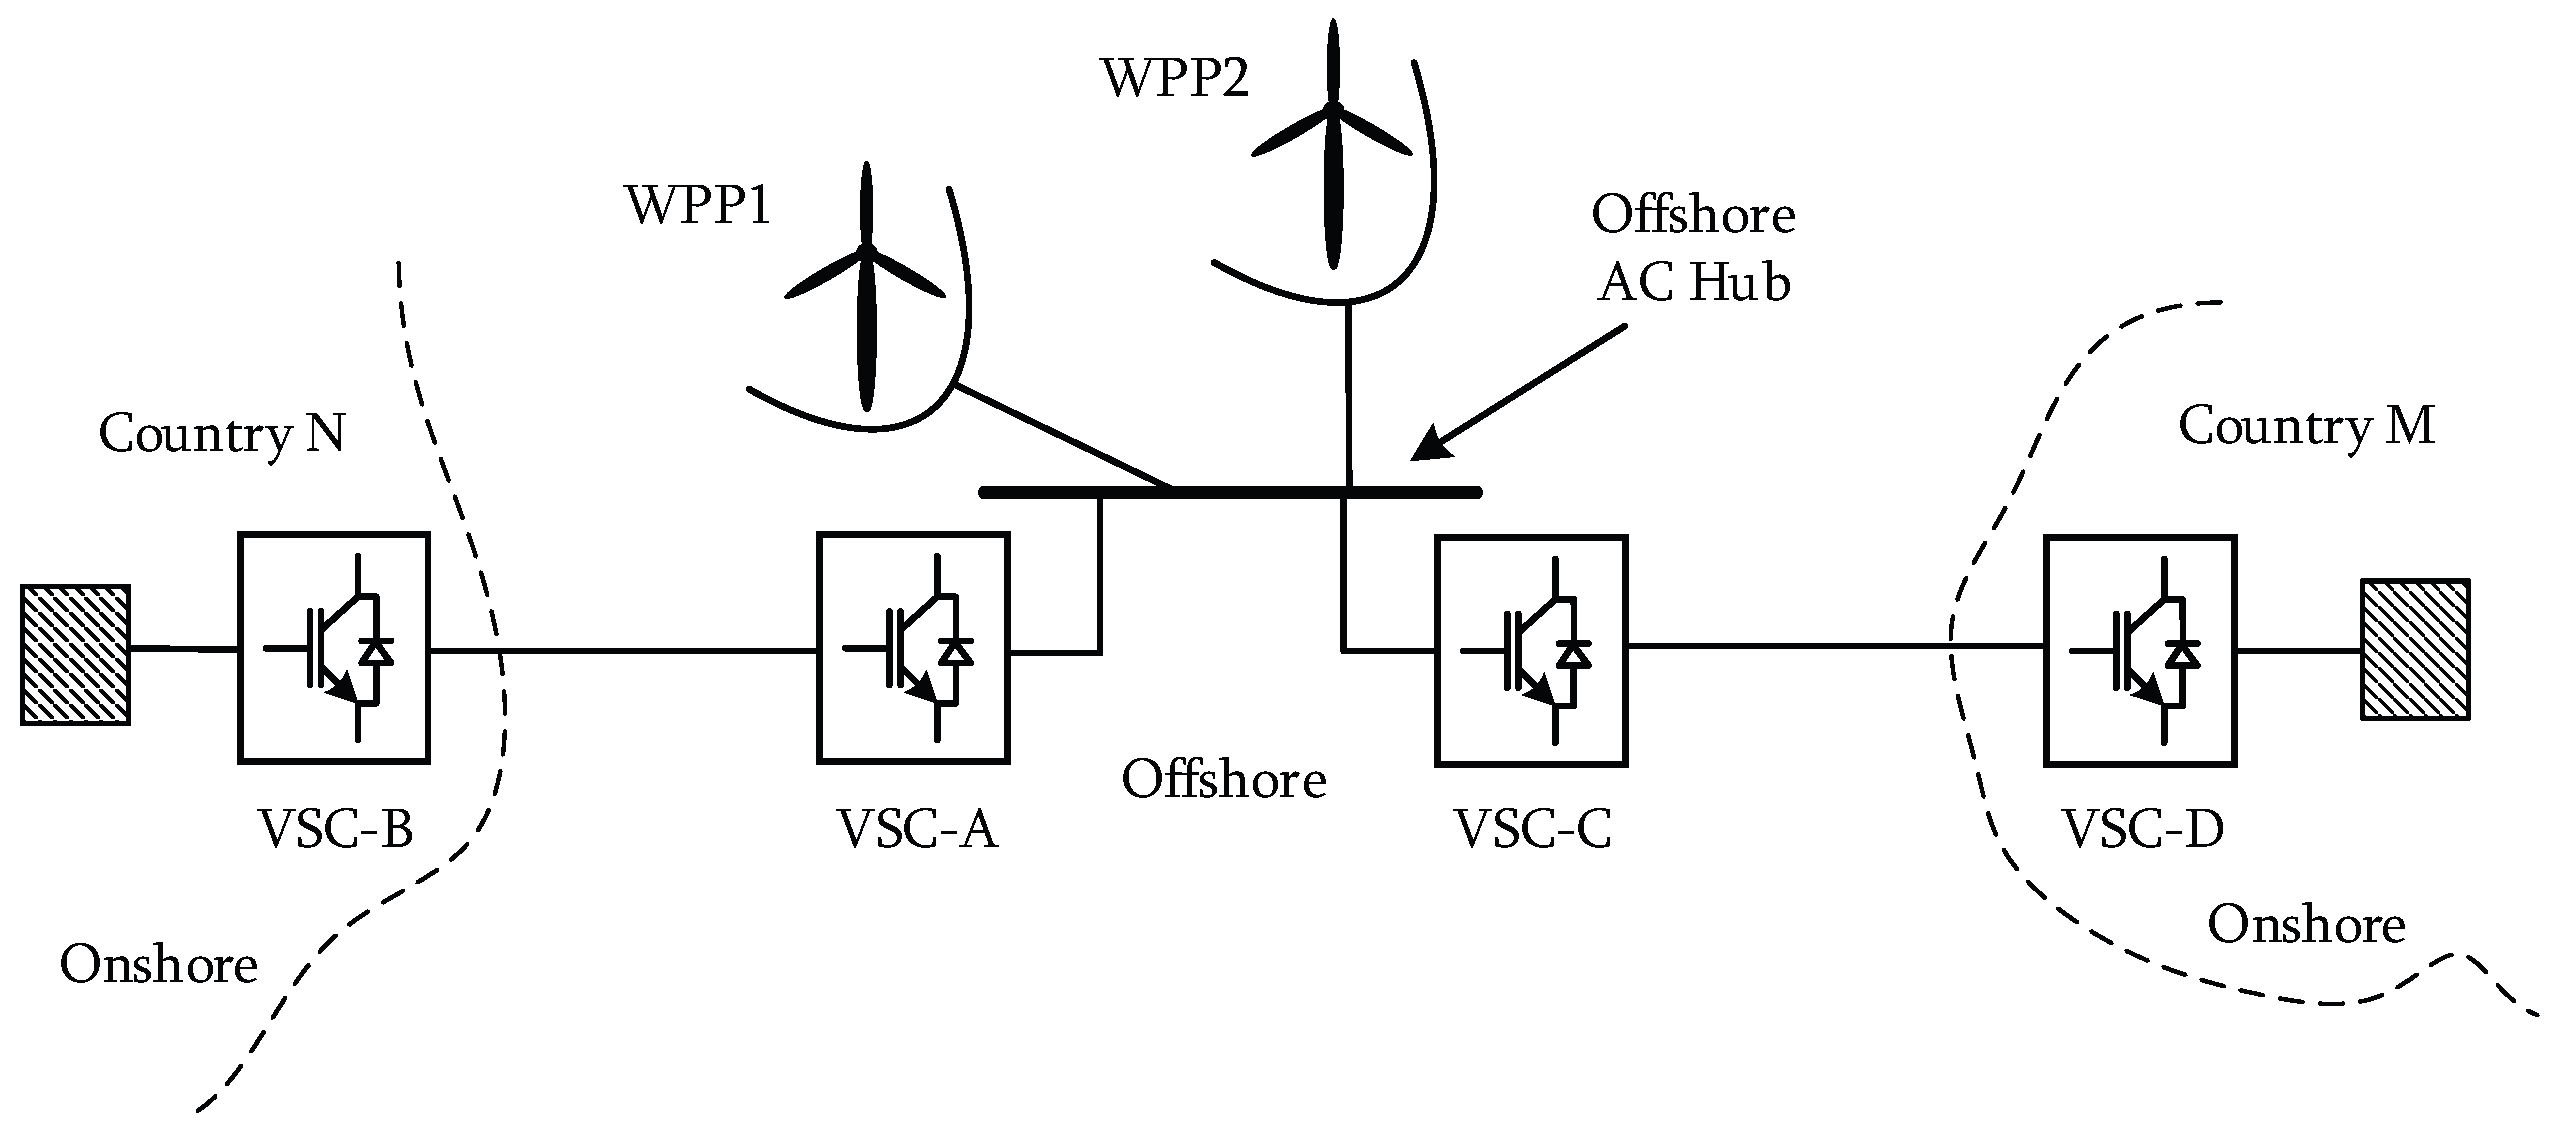
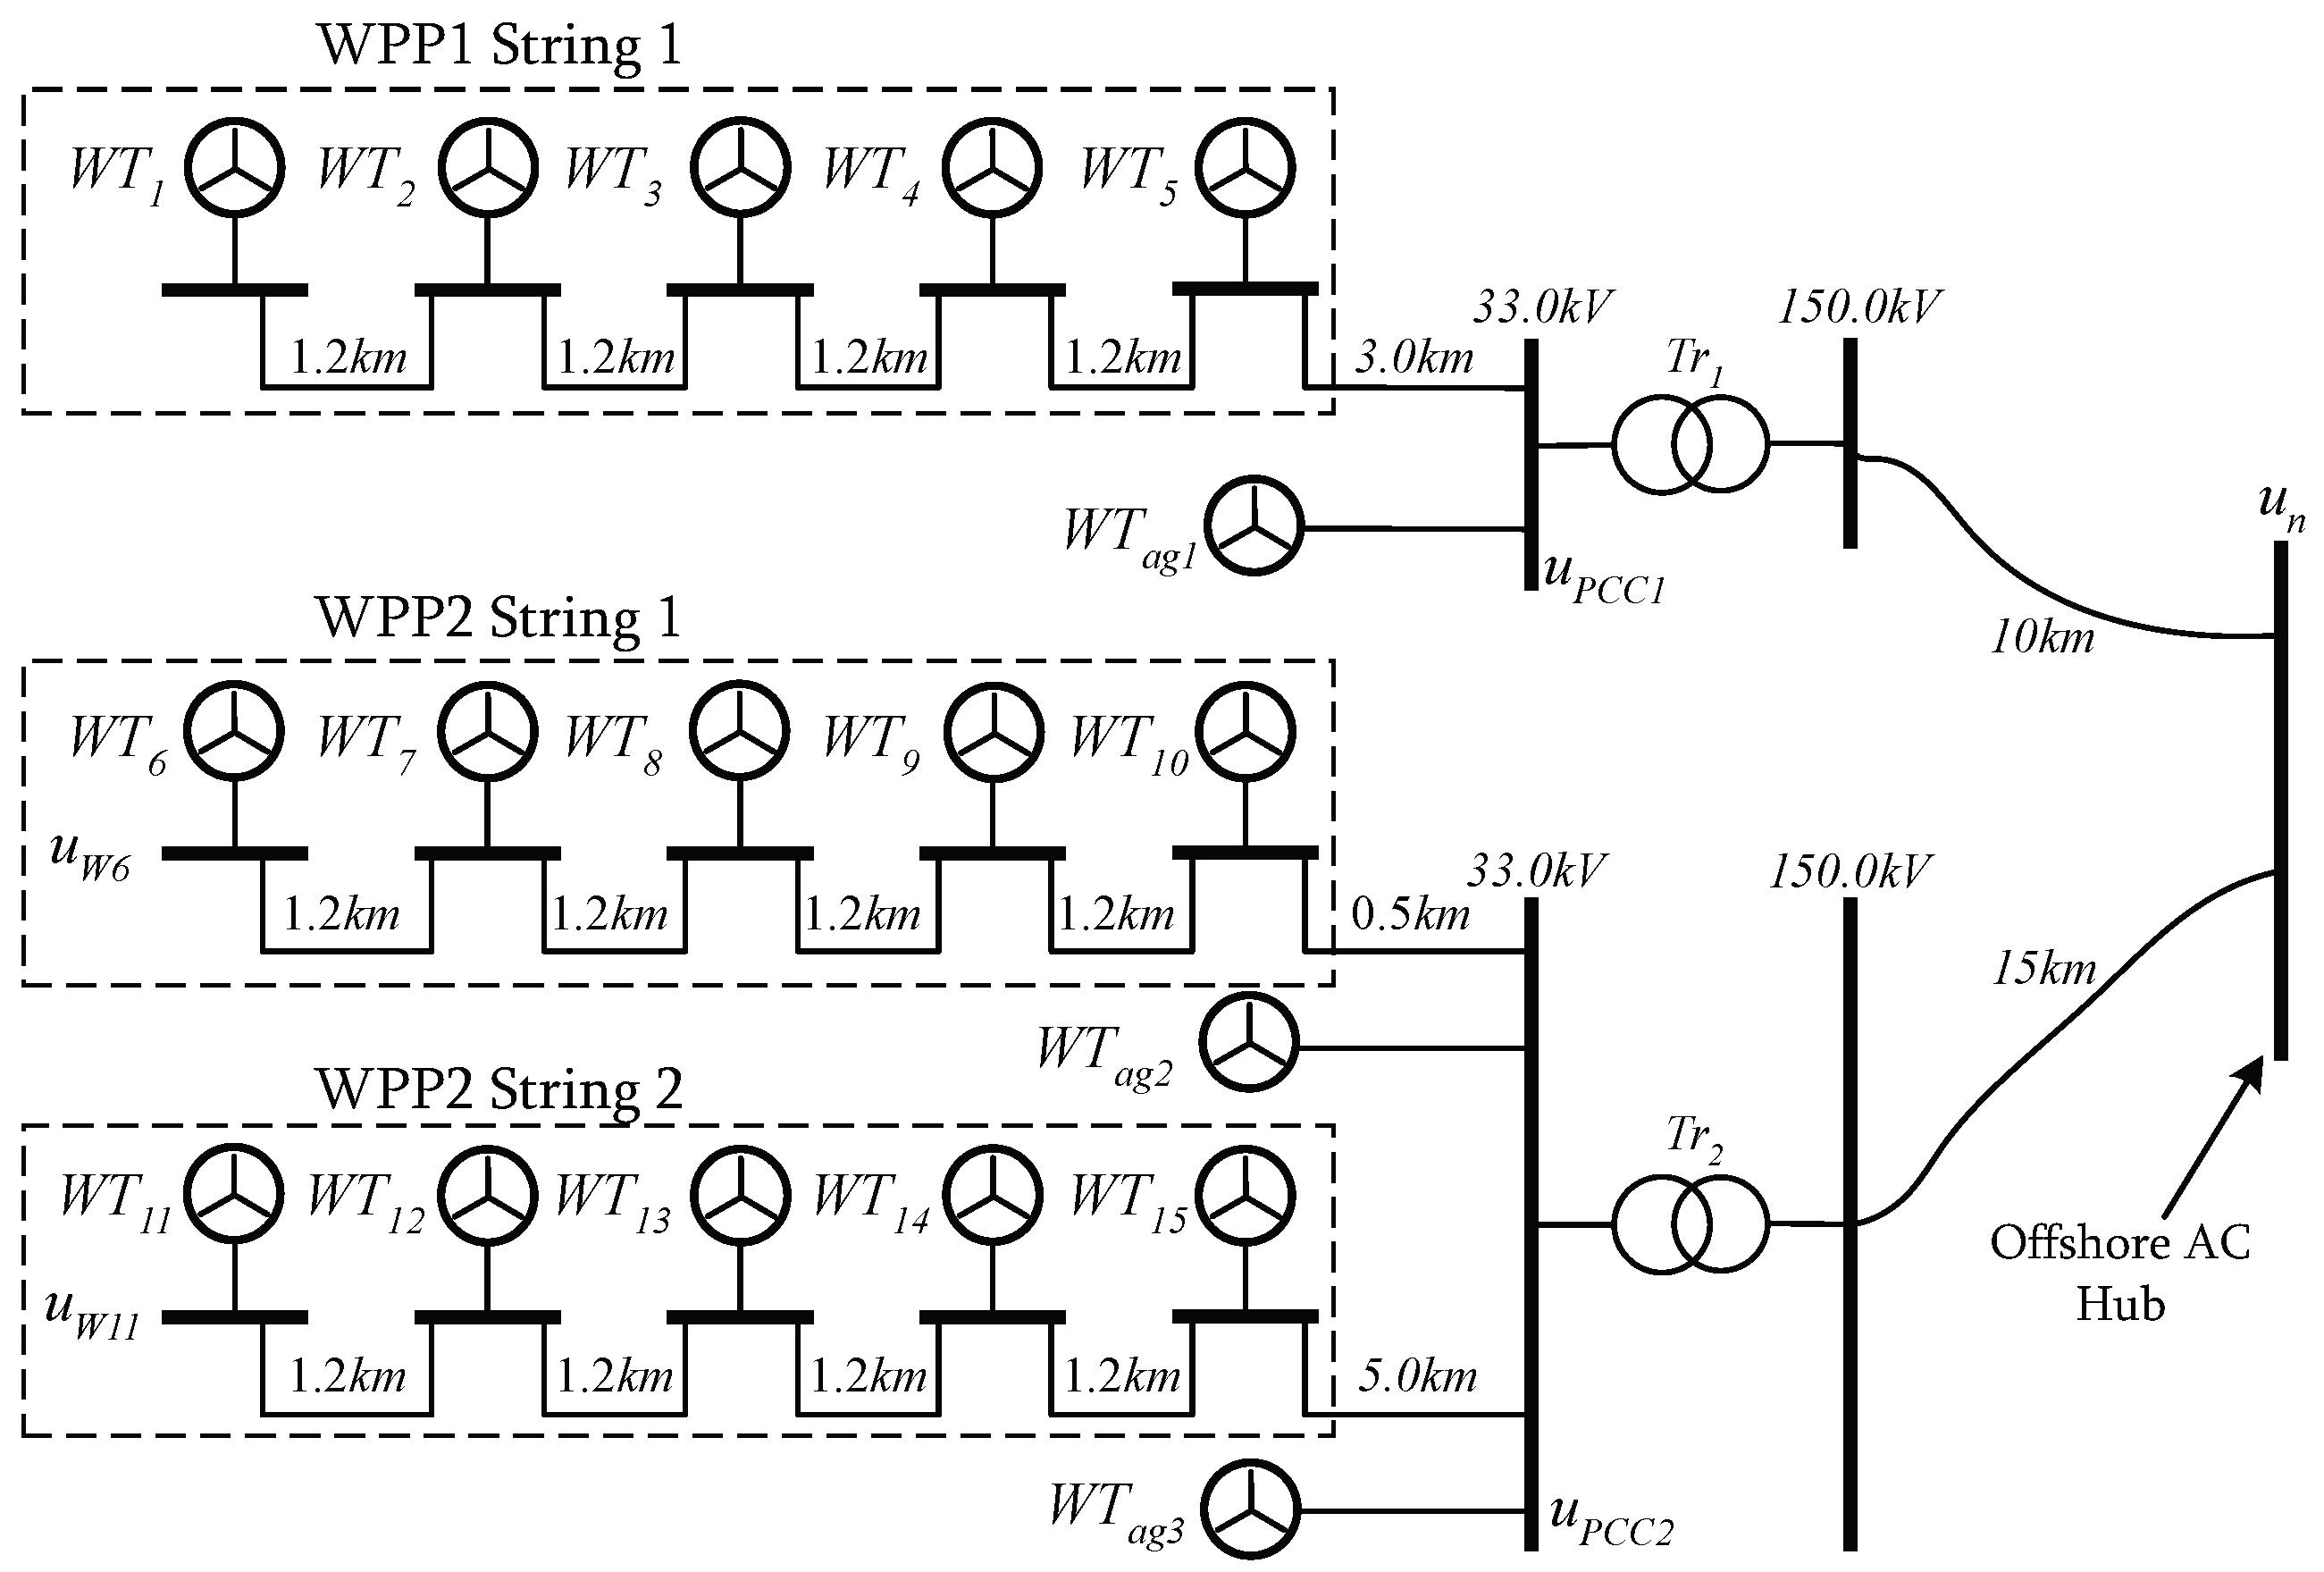
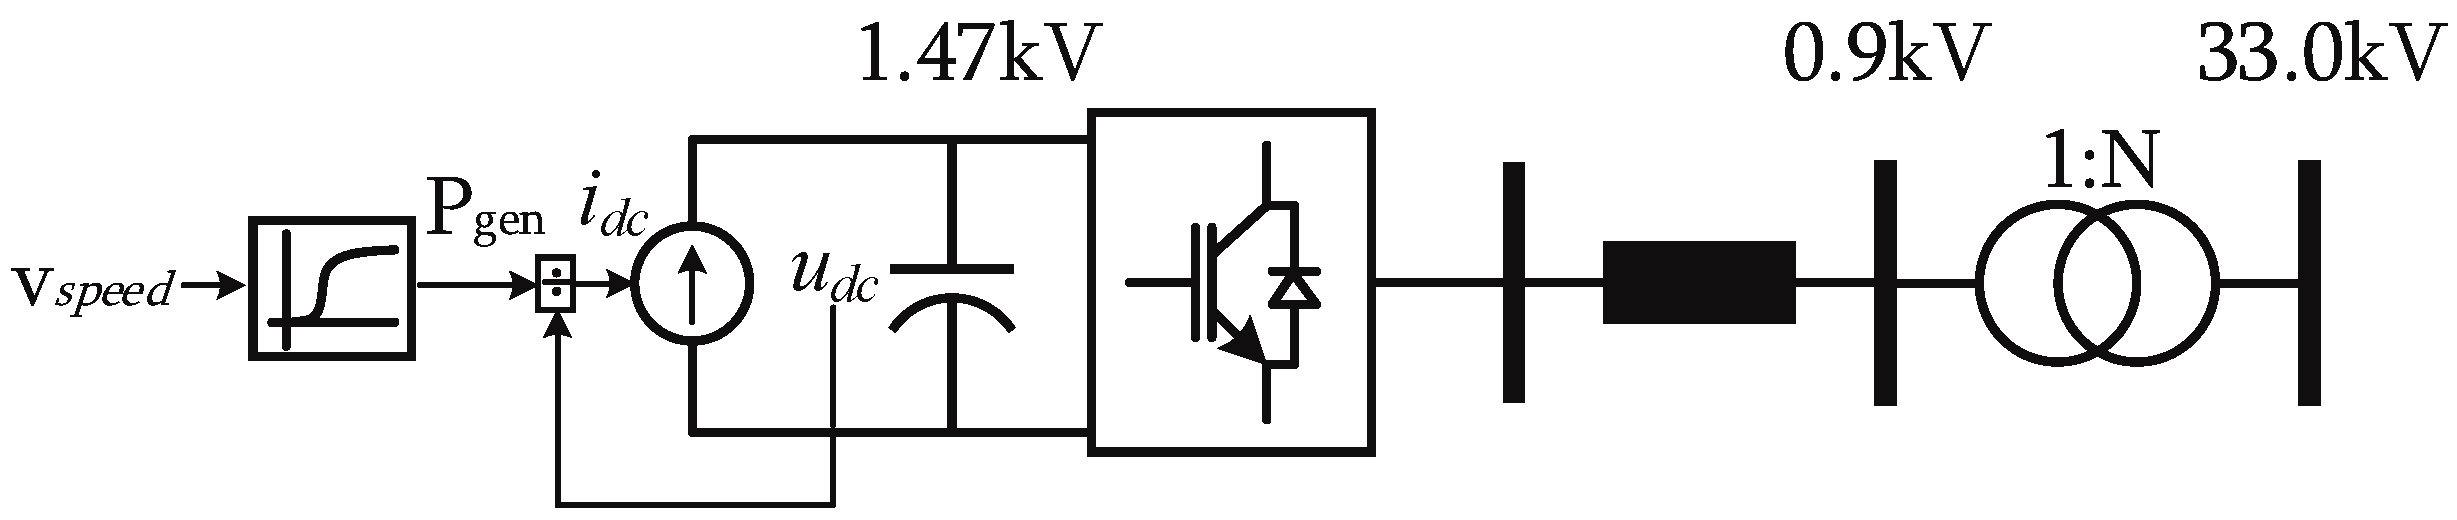
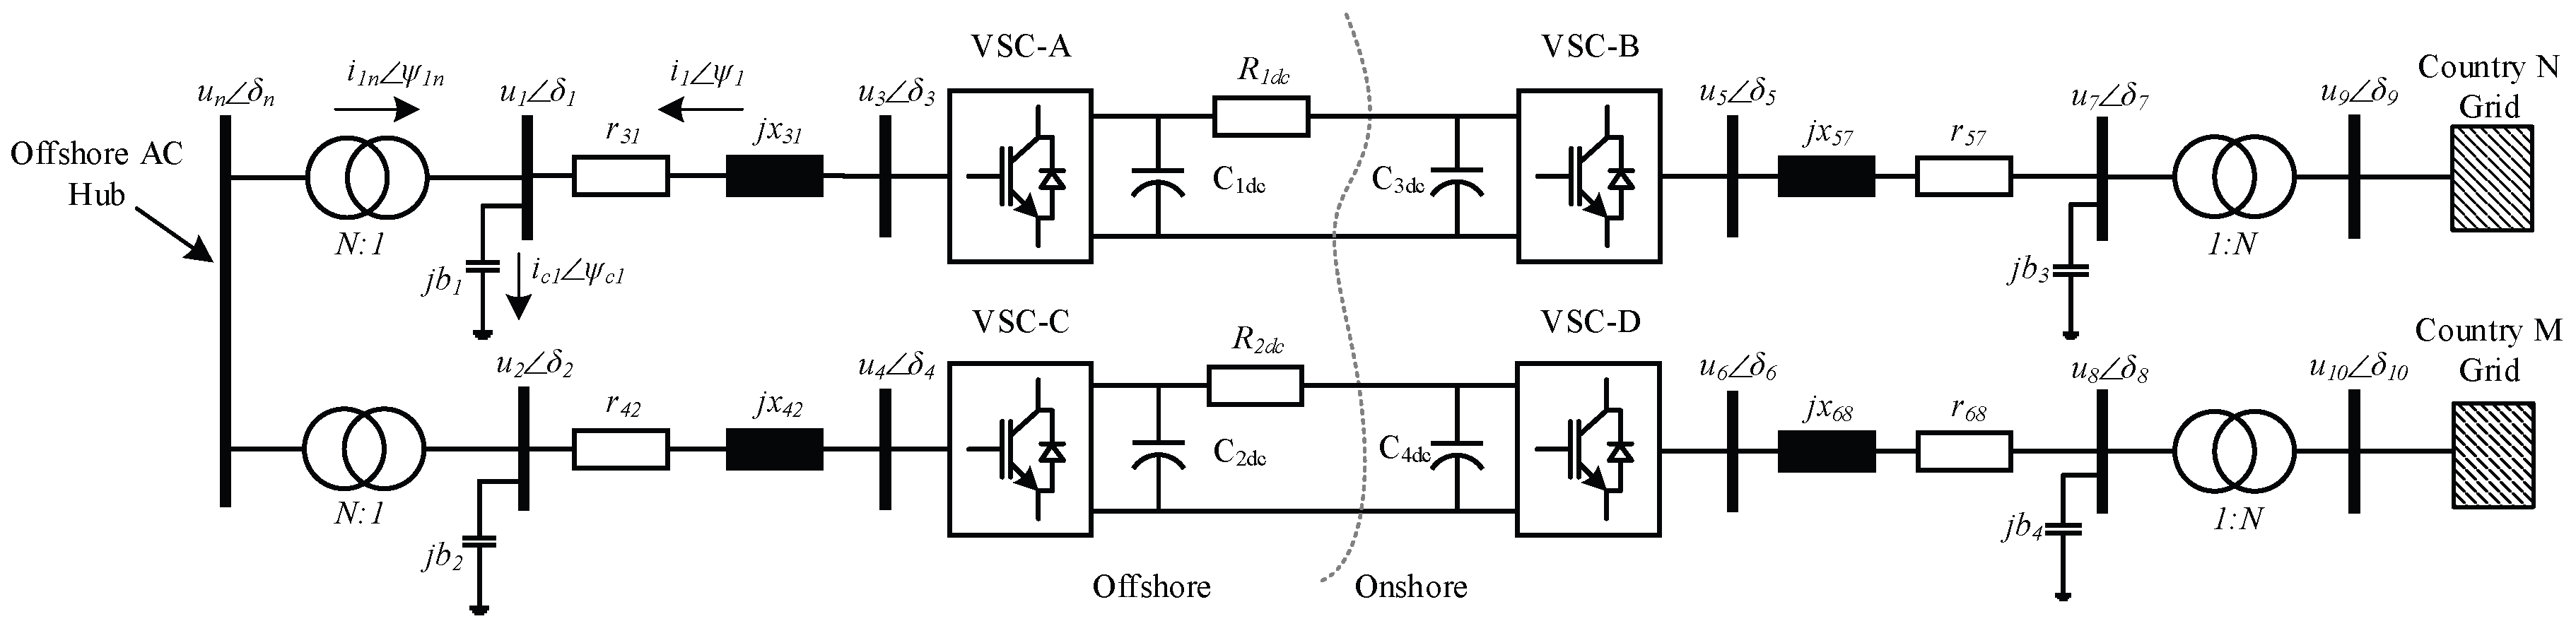
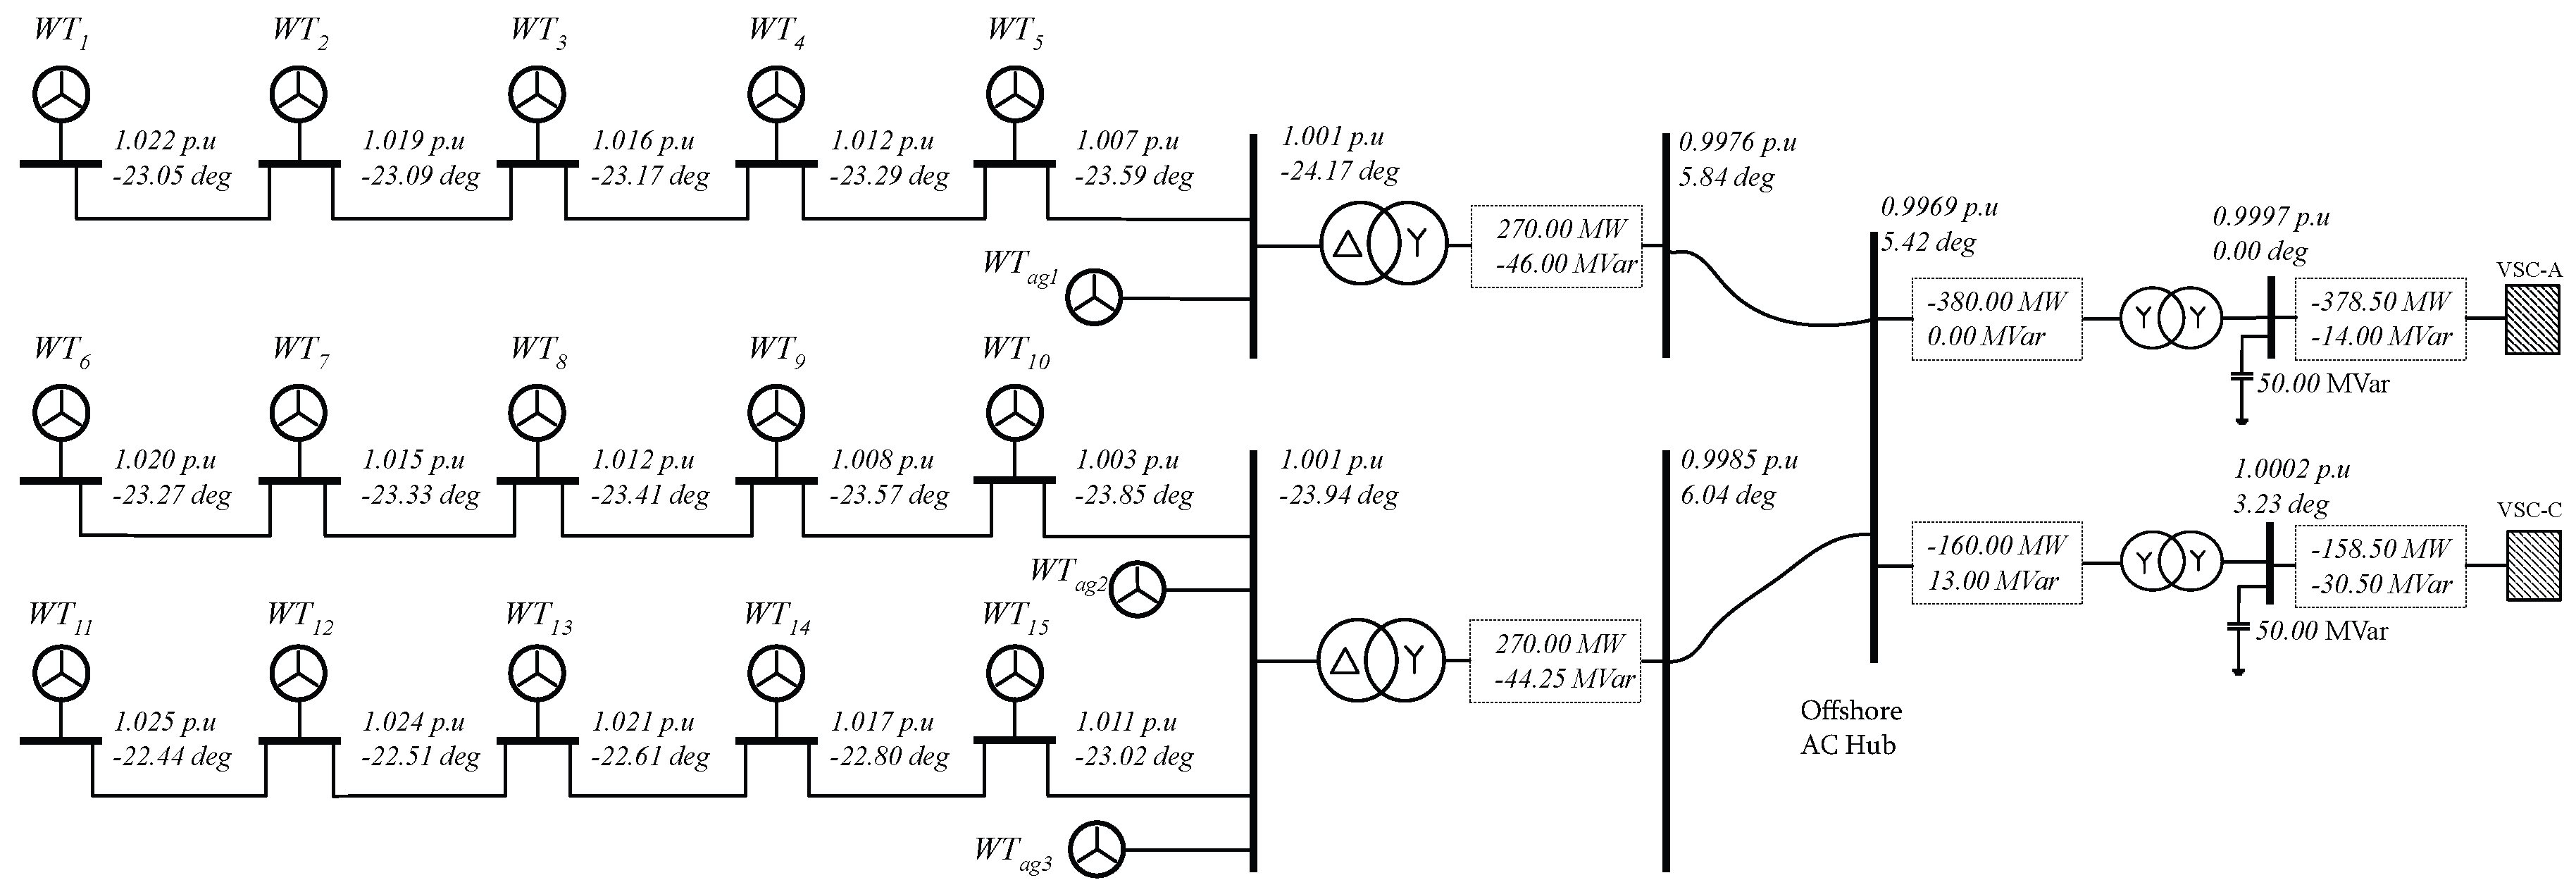
2. System Configuration

An overview of the developed network is illustrated in Figure 1. In the network, two offshore wind power plants (WPP1 and WPP2) are injecting energy at a common offshore busbar. The net wind energy collected at that busbar is then delivered to onshore grids via VSC-HVDC transmission systems. The common busbar is referred to as an offshore AC hub. The layout of offshore wind power plants and their connection with the offshore AC hub is illustrated in Figure 2. WPP1 and WPP2 are connected together in star configuration at offshore AC hub with 10 km and 15 km AC cables, respectively. The capacity of each wind power plant is 300 MVA.
The first wind power plant (WPP1) has one string that consists of five wind turbines (type 4) that are connected in radial configuration. The capacity of each wind turbine is 6 MVA, and the net capacity of a string is 30 MVA. To reduce the computation time, an aggregated wind turbine (WTag1) model is developed to have net power capacity of 300 MVA [15]. In this article, mechanical behavior of the wind turbine is not part of the research. Therefore, the wind turbine is modeled as an equivalent grid side converter, as shown in Figure 3.
The second wind power plant (WPP2) is developed in a similar manner. Two full strings are constructed for WPP2, each having a separate aggregate model. The aggregated model (WTag2) for the first string of WPP2 is equivalent to three strings and the second aggregated model (WTag3) is equivalent to five strings, hereby forming WPP2 net capacity equal to 300 MVA. The interconnection between onshore grids with the offshore AC hub is illustrated in Figure 4. Two onshore grids are located in two different countries. The distance of the offshore AC hub to both grids is 250 km. Network parameters of both VSC-HVDC transmission systems are given in Table 1.

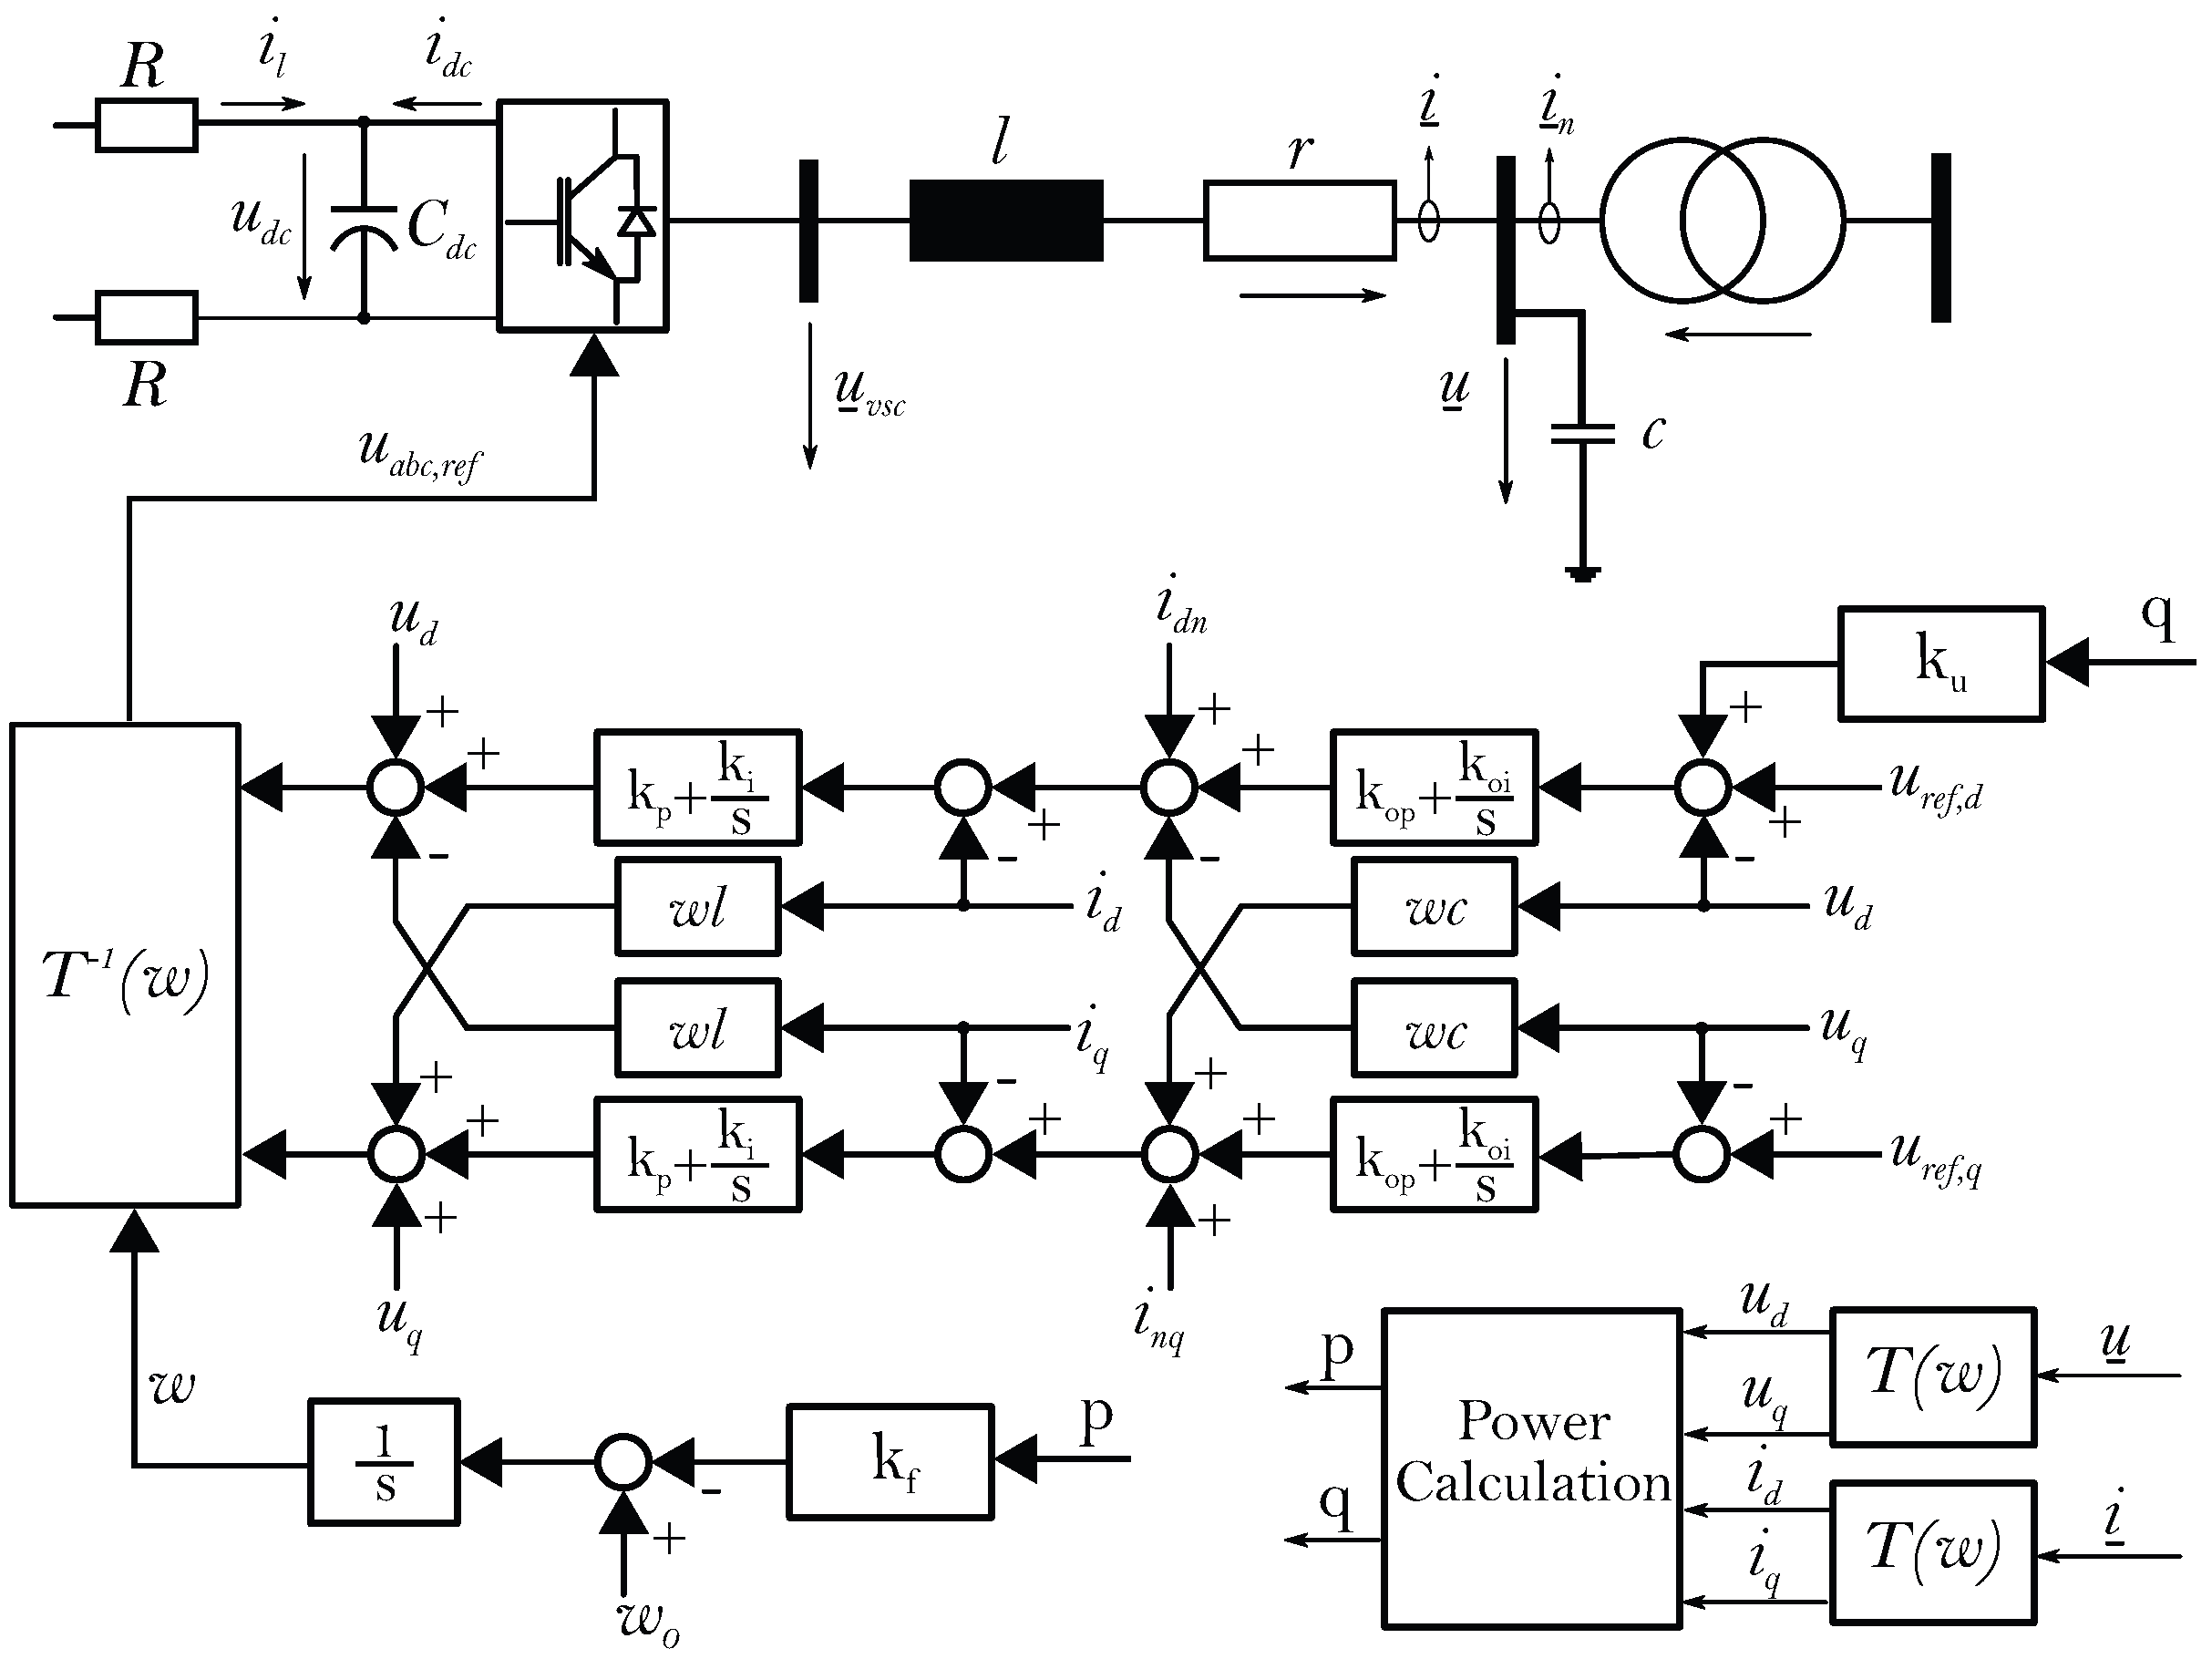
3. Mathematical Modeling

The control system of onshore side converter is based on the principle of grid synchronized current controlled voltage source. The operational mode for VSC-B and VSC-D are DC voltage ( u d c ), and AC voltage ( u a c ) control [16]. The control system of offshore side converters is based on the principle of frequency imposed voltage controlled sources. VSC-A and VSC-C controls the frequency and reference voltage of the offshore AC network. The control block diagram of offshore converters is illustrated in Figure 5. Mathematical modeling of VSCs and designing of inner and outer control systems are explained in [9,17]. In this section, the mathematical model of the droop control system is presented. Droop characteristics are implemented as a secondary controller at offshore side converters for active and reactive power sharing between transmission systems.

3.1. Active Power Sharing Using Frequency Droop

In the multi-machine system, imbalance in active power proportionally influences the network frequency. Thus, ω p droop characteristic can be defined to share the active power between VSC-A and VSC-C. For a balanced system, the reference frequencies of both converters should converge at the same value in steady-state, i.e.,
ω = ω 1 = ω 2 ,
where ω 1 and ω 2 are the reference frequency of VSC-A and VSC-C, respectively, and are calculated using (2),
ω 1 = ω 01 k f 1 · p 1 , ω 2 = ω 02 k f 2 · p 2 .
here, ω 01 and ω 02 are the initial reference frequency imposed by VSC-A and VSC-C. p 1 is the amount of active power flow through VSC-A, and p 2 is the active power through VSC-C.
Without a droop scheme, initial reference frequency of both converters must be equal to not to cause frequency instability in the network. The net power ( p n ) injected by WPP1 and WPP2 at the offshore AC hub is equal to the sum of the converter’s active power ( p 1 , p 2 ). By neglecting active losses in the offshore transformer, it can be stated that
p n = p 1 + p 2 .
Solving (1)–(3) for ω yields,
ω = k f 2 k f 1 + k f 2 ω 01 + k f 1 k f 1 + k f 2 ω 02 k f 1 · k f 2 k f 1 + k f 2 p n .
The amount of active power of VSC-C ( p 2 ) in terms of net active power is calculated by substituting (2) in (1):
p 2 = ( k f 1 k f 1 + k f 2 ) · p n ( Δ ω 0 k f 1 + k f 2 ) ,
where Δ ω 0 = ω 01 ω 02 . The steady state network frequency, and VSC-C active power can be written as (6) and (7) by assuming the same initial reference frequency i.e. ω 0 = ω 01 = ω 02 .
ω = ω 0 ( k f 1 · k f 2 k f 1 + k f 2 ) · p n ,
p 2 = ( k f 1 k f 1 + k f 2 ) · p n .
At Δ ω 0 = 0 , active power will not be exchanged from country N to country M or vice versa. Furthermore, the maximum frequency deviation ( Δ ω m a x ) at maximum active power can be calculated using (8),
Δ ω m a x p m a x k f 1 · k f 2 k f 1 + k f 2 .
For z converters in the system that provide reference frequencies to the network, the steady state network frequency, and active power of the i converter can be calculated using (9) and (10). Here, p n is the total power in the network:
ω = ω 0 1 j = 1 z 1 k f j · p n ,
p i = 1 k f i · 1 j = 1 z 1 k f j · p n .

3.2. Reactive Power Sharing Using Voltage Droop

Reactive power flow in the network is proportionally influenced by the change in bus voltage. Thus, u q droop characteristic can be defined using (11) to share reactive power, where, u 1 and u 2 are the reference bus voltages of VSC-A and VSC-C, respectively. Furthermore, q 1 is the amount of reactive power flow through VSC-A, and q 2 is the amount of the reactive power through VSC-C:
u 1 = u 0 + k u 1 · q 1 , u 2 = u 0 + k u 2 · q 2 .
Unlike frequency, converter reference voltages are not directly linked with the common bus. Converters act as a reference machine (slack source) in the network and control voltage at the individual bus. Without voltage droop characteristics (i.e., k u 1 = k u 2 = 0 ), converters maintain the respective reference bus voltage level at the predefined value, and reactive power flows through them according to the impedance of the network. With voltage droop characteristic, reactive power contribution at several sharing factors can be achieved by introducing differences in VSC-A and VSC-C voltage reference set-points. Moreover, active power flow through each converters also influences the reactive power sharing.
A power flow algorithm is required to be applied to find the steady state operating points of the network. System function f(x) for calculating steady-state results at a given frequency and voltage droop gain is given in (12). The equivalent network diagram of an offshore AC hub including only transformer impedance and shunt filter is constructed for steady-state analysis, as shown in Figure 6:
f ( x ) = [ p 1 g 1 n u 1 2 + u 1 u n g 1 n cos ( Δ δ 1 n ) + b 1 n sin ( Δ δ 1 n ) p 2 g 2 n u 2 2 + u 2 u n g 2 n cos ( Δ δ 2 n ) + b 2 n sin ( Δ δ 2 n ) q 1 u 1 u n b 1 n cos ( Δ δ 1 n ) g 1 n sin ( Δ δ 1 n ) + ( b 1 + b 1 n ) u 1 2 q 2 u 2 u n b 2 n cos ( Δ δ 2 n ) g 2 n sin ( Δ δ 2 n ) + ( b 2 + b 2 n ) u 2 2 q n u n u 1 g 1 n sin ( Δ δ 1 n ) + b 1 n cos ( Δ δ 1 n ) + h 1 u 1 u 0 k u 1 q 1 u 2 u 0 k u 2 q 2 ω ω 0 + k f 1 p 1 ω ω 0 + k f 2 p 2 p n u n u 1 b 1 n sin ( Δ δ 1 n ) g 1 n cos ( Δ δ 1 n ) h 2 ] ,
where:
h 1 = ( b 1 n + b 2 n ) u n 2 u n u 2 g 2 n sin ( Δ δ 2 n ) + b 2 n cos ( Δ δ 2 n ) , h 2 = ( g 1 n + g 2 n ) u n 2 u n u 2 b 2 n sin ( Δ δ 2 n ) g 2 n cos ( Δ δ 2 n ) .
Converters control the voltage and angle (frequency control) at their respective reference bus; therefore, they are defined as reference machines (SL). The net power of the offshore network that is collected at the offshore hub can be defined as a constant power source p n , q n . The voltage and frequency droop characteristic are applied at converter’s buses. Converters provides the reference voltage angle for the network. This reference angle is constant with respect to the load or the generation bus in the network; however, in a multiple VSC system, the reference angles vary with respect to each other depending upon the droop gains. In addition, active power through branches flows due to the difference in the voltage angle of the connected busbars (e.g., δ 1 δ n ). Thus, instead of having bus voltage angles in the state variables, the difference of the voltage angles are defined using (13),
Δ δ 1 n = δ 1 δ n , Δ δ 2 n = δ 2 δ n .

3.3. Method of Selecting Voltage and Frequency Droop Gain

The solution of the network shown in Figure 6 can be found by solving f ( x ) = 0 for the following variables:
x = p 1 p 2 q 1 q 2 u n u 1 u 2 Δ δ 1 n Δ δ 2 n ω T ,
The response of active and reactive power of converters are shown in Figure 7 with respect to active power ( p n ) keeping inductive reactive power ( q n ) constant at 0.15 p.u. Here, k f 1 = 0.004 , k f 2 = 0.002 , k u 1 = 0.2 , and k u 2 = 0.2 . The active power ( p n ) scale is considered from 1.0 p.u to 1.0 p.u to analyze the operation of the converters in consumption and generation mode.
It can be noticed that active power is shared by assigning different frequency droop gains, and no circulating active power occurs from one converter to another. On the other hand, reactive power is equally shared by converters using the same voltage droop gains, when p n is near zero. The parabolic nature of the reactive power can be understood by computing an active and reactive power relationship as expressed by (14) for VSC-A. The expression shows the influence of active power on reactive power flow:
q 1 = u 1 · u n · b 1 n 1 p 1 u 1 · u n · b 1 n 2 u 1 2 · ( b 1 + b 1 n ) .
The desired value of droop gains to share power among converters can be calculated by defining reactive power compensation criteria and percentage of power contribution. Let α be the per unit contribution of active power of VSC-C, i.e., p 2 = α · p n , then (7) can be rewritten as
α · ( k f 1 + k f 2 ) k f 1 = 0 ,
p 2 · ( 1 α ) α · p 1 = 0 .
Total reactive power q t supply by the converters depends on the network component and steady-state operating points. Let β be the per unit reactive power contribution of VSC-C. Then, at the given wind power infeed, it can be stated that:
q 1 + q 2 = q t , q 2 = β · q t .
Thus, the equation of reactive power contribution can be written as (18):
q 2 · ( 1 β ) β · q 1 = 0 ,
where 0 α 1.0 and 0 β 1.0 .
The effect of voltage droops on the reactive power flow at an offshore AC hub ( u n ) can be understood from (19). For small voltage angle Δ δ i j 0.0 , cos ( Δ δ i j ) 1.0 and sin ( Δ δ i j ) Δ δ 1 n , reactive power at offshore ac hub would be (19),
q n = u n u 0 ( b 1 n + b 2 n ) u n 2 ( b 1 n + b 2 n ) + u n b 1 n k u 1 q 1 + u n b 2 n k u 2 q 2 .
The first two right-hand side terms in (19) are the amount of reactive power flowing toward VSCs without a voltage droop scheme, which will be equal to q n at a steady state for a balance system. However, a voltage droop scheme changes the reference voltage, which consequently generates the additional reactive power at offshore AC hubs that is defined by the last two terms on the right-hand side of (19). Since an offshore AC hub bus is like a load bus and q n is constant, offshore hub bus voltage will rise or decrease according to direction of reactive power flow in the system. Furthermore, it is demonstrated in Figure 7 that the reactive power also varies significantly with active power and consequently produces circulating reactive power flow from one VSC-HVDC system to another:
u n b 1 n k u 1 q 1 + u n b 2 n k u 2 q 2 = 0 , b 1 n · q 1 b 2 n · q 2 = k u 2 k u 1 .
The voltage droop gains calculation according to condition expressed in (20) implies that the droop influence on hub bus voltage ( u n ) will be minimal and the additional reactive power generation is eliminated. The optimum value of frequency and droop gain can be determined considering the above constraints by solving g(x), i.e.,
x = p 1 p 2 q 1 q 2 u n u 1 u 2 Δ δ 1 n Δ δ 2 n ω k f 1 k f 2 k u 1 k u 2 T ,
g ( x ) = 0 ,
g ( x ) = [ p 1 g 1 n u 1 2 + u 1 u n g 1 n cos ( Δ δ 1 n ) + b 1 n sin ( Δ δ 1 n ) p 2 g 2 n u 2 2 + u 2 u n g 2 n cos ( Δ δ 2 n ) + b 2 n sin ( Δ δ 2 n ) q 1 u 1 u n b 1 n cos ( Δ δ 1 n ) g 1 n sin ( Δ δ 1 n ) + ( b 1 + b 1 n ) u 1 2 q 2 u 2 u n b 2 n cos ( Δ δ 2 n ) g 2 n sin ( Δ δ 2 n ) + ( b 2 + b 2 n ) u 2 2 q n u n u 1 g 1 n sin ( Δ δ 1 n ) + b 1 n cos ( Δ δ 1 n ) + h 1 u 1 u 0 k u 1 q 1 u 2 u 0 k u 2 q 2 ω ω 0 + k f 1 p 1 ω ω 0 + k f 2 p 2 p n u n u 1 b 1 n sin ( Δ δ 1 n ) g 1 n cos ( Δ δ 1 n ) h 2 α ( k f 1 + k f 2 ) k f 1 p 2 ( 1 α ) α p 1 q 2 ( 1 β ) β q 1 u n b 1 n k u 1 q 1 + u n b 2 n k u 2 q 2 ] ,
where:
h 1 = ( b 1 n + b 2 n ) u n 2 u n u 2 g 2 n sin ( Δ δ 2 n ) + b 2 n cos ( Δ δ 2 n ) , h 2 = ( g 1 n + g 2 n ) u n 2 u n u 2 b 2 n sin ( Δ δ 2 n ) g 2 n cos ( Δ δ 2 n ) .
The presented method can be extended for z converters in the network using the following equations:
α i = 1 k f i · 1 j = 1 z 1 k f j ,
p l · i = 1 z 1 α i 1 i = 1 z 1 α i i = 1 i l z p i = 0 ,
1 β i q i β i j = 1 j i z q j = 0 ,
i = 1 z b i m u m k u i q i = 0 .
It is to be noticed that l is the index of a converter in (23) at which a contribution variable does not need to be defined. Thus, z 1 contribution variables (α, and β) are required to define z converters in the system. In (25), m is the adjacent bus of the i converter bus.

4. System Analysis and Dynamic Simulation

Control system design and droop selection method is evaluated through steady-state analysis and time domain simulation. Results presented are mainly focused on offshore network response, and simulation shows that the onshore network behaves as a stable system. In plots, values are normalized to converter base value, i.e., S b = 500 MVA, U b = 220 kV, and f b = 50 Hz.

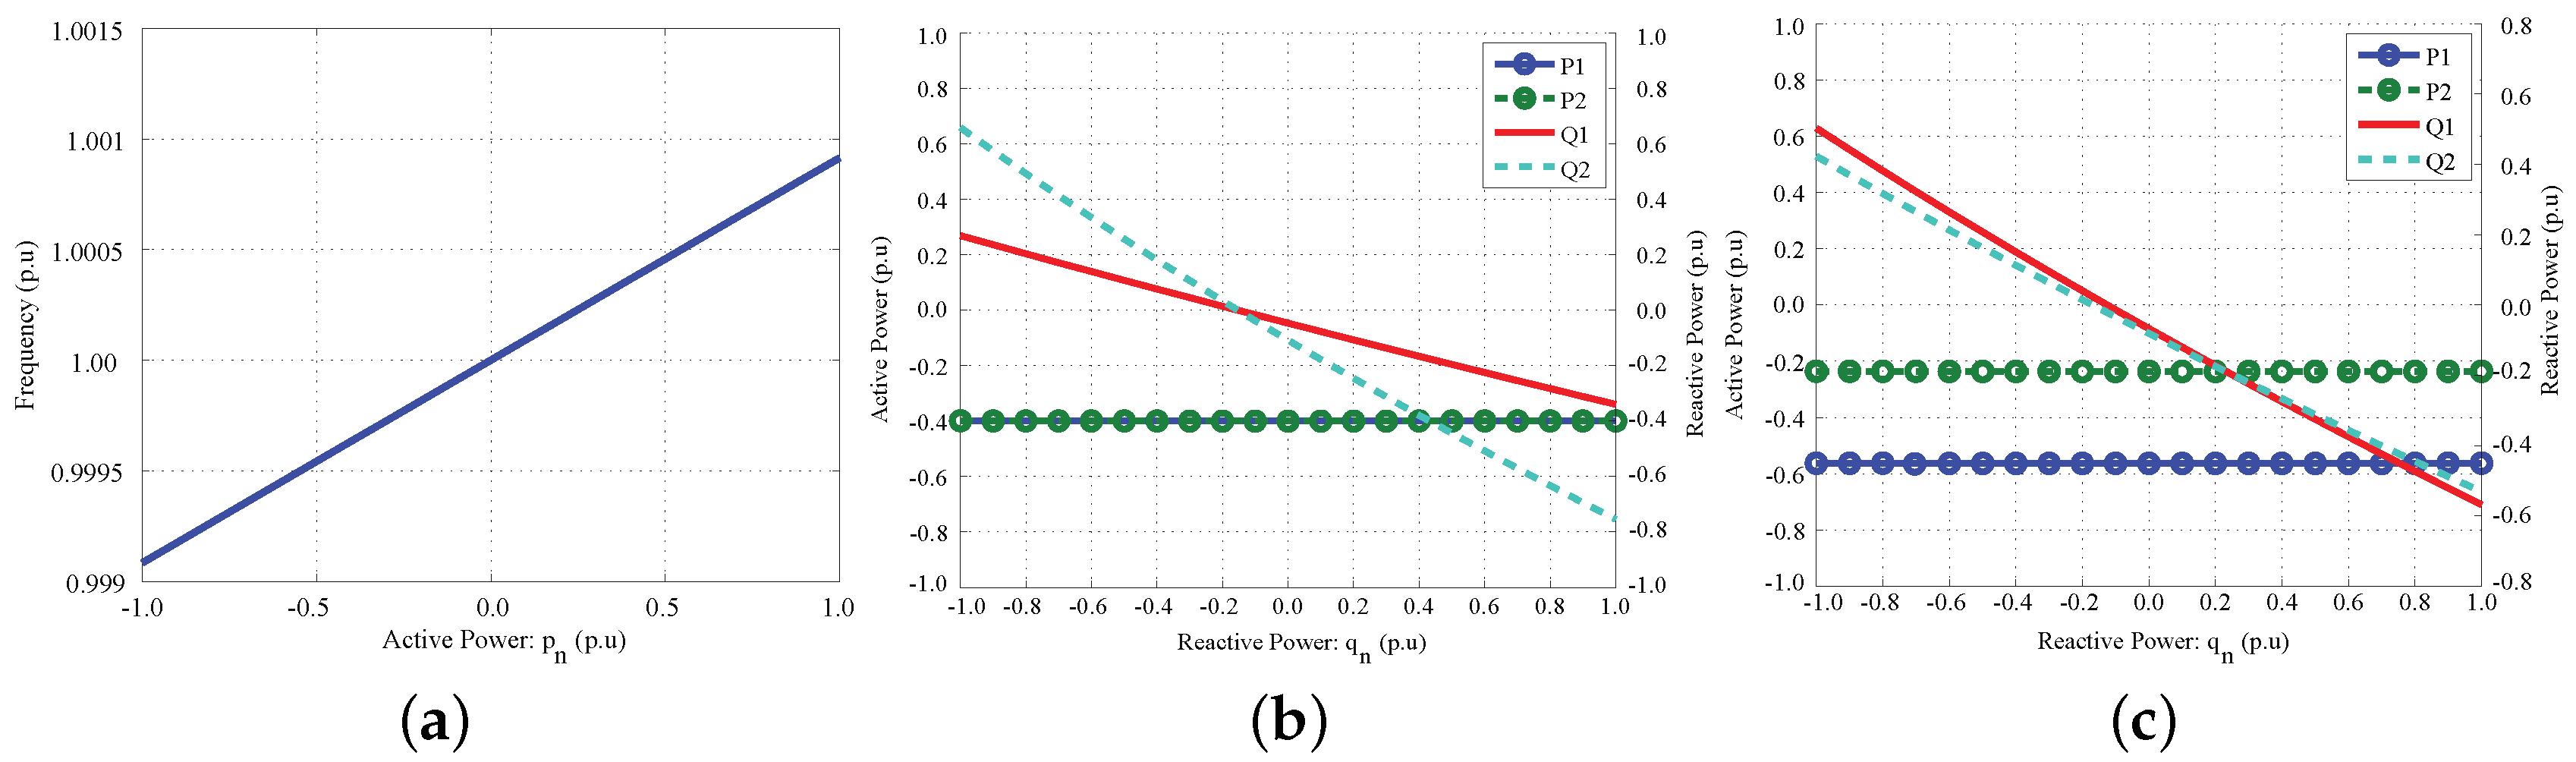
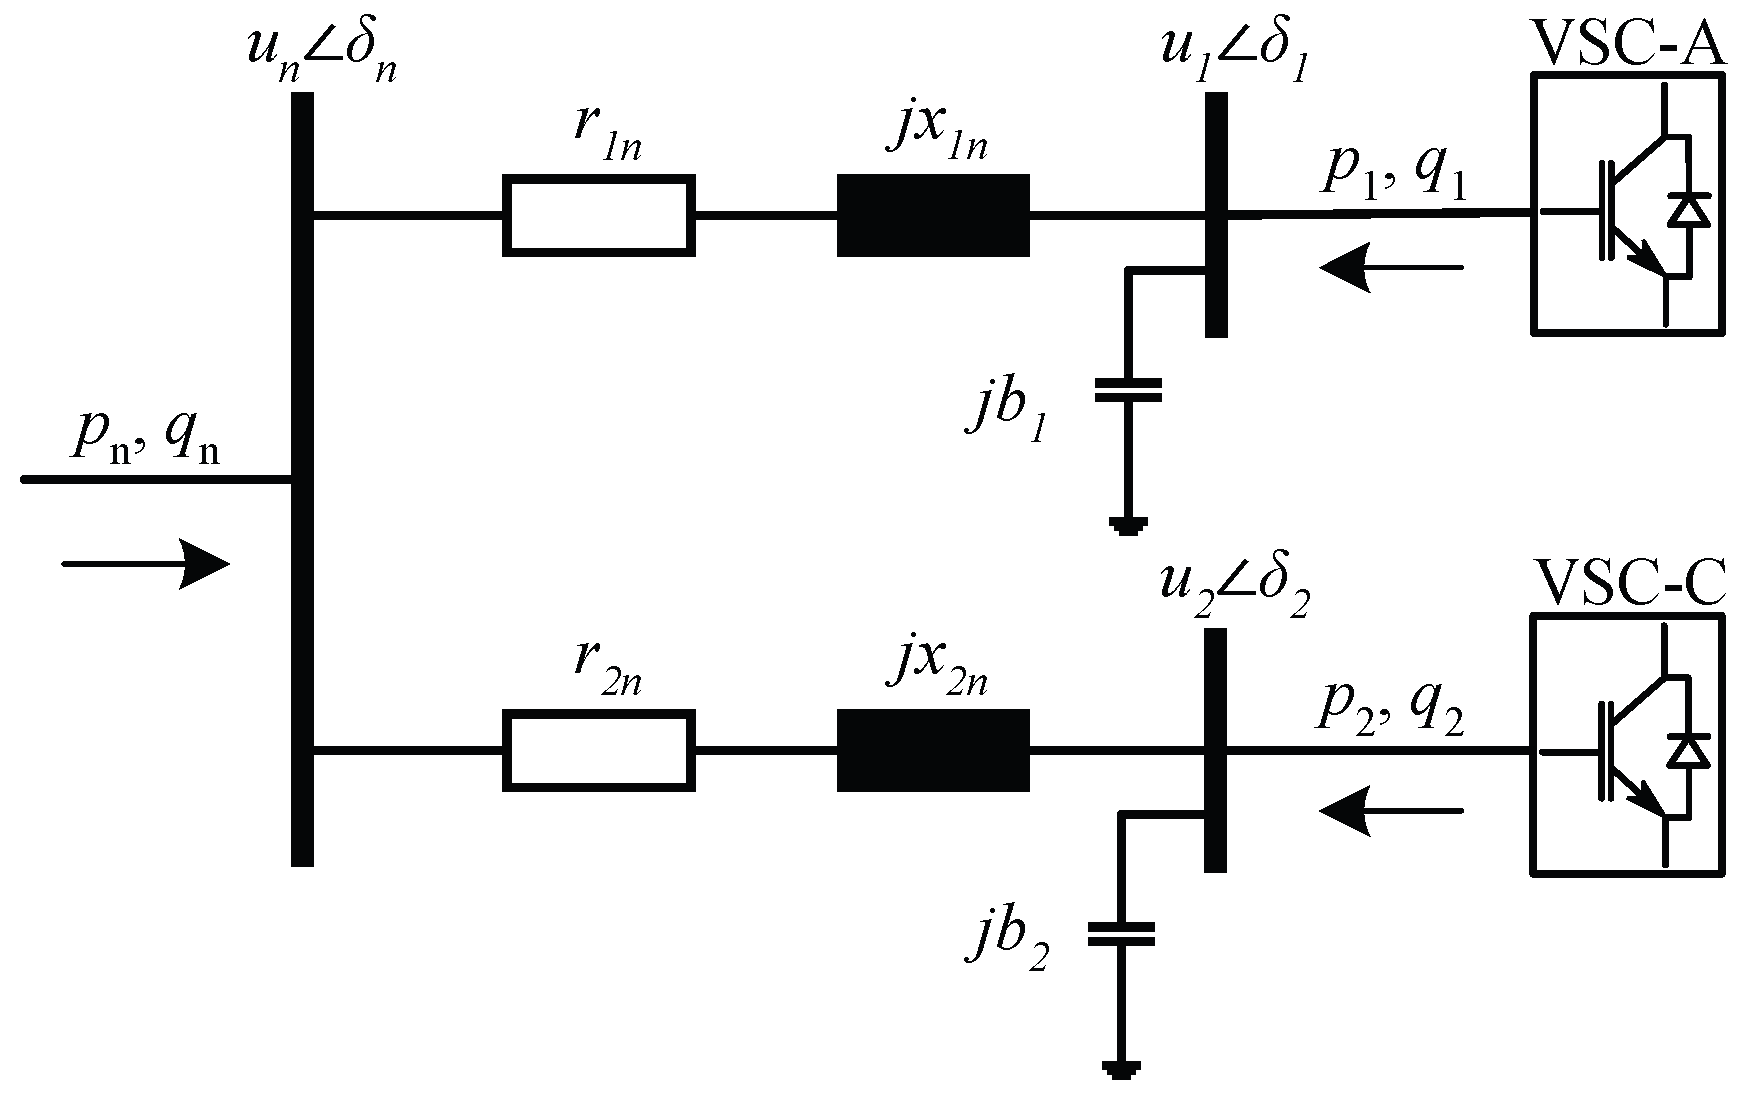
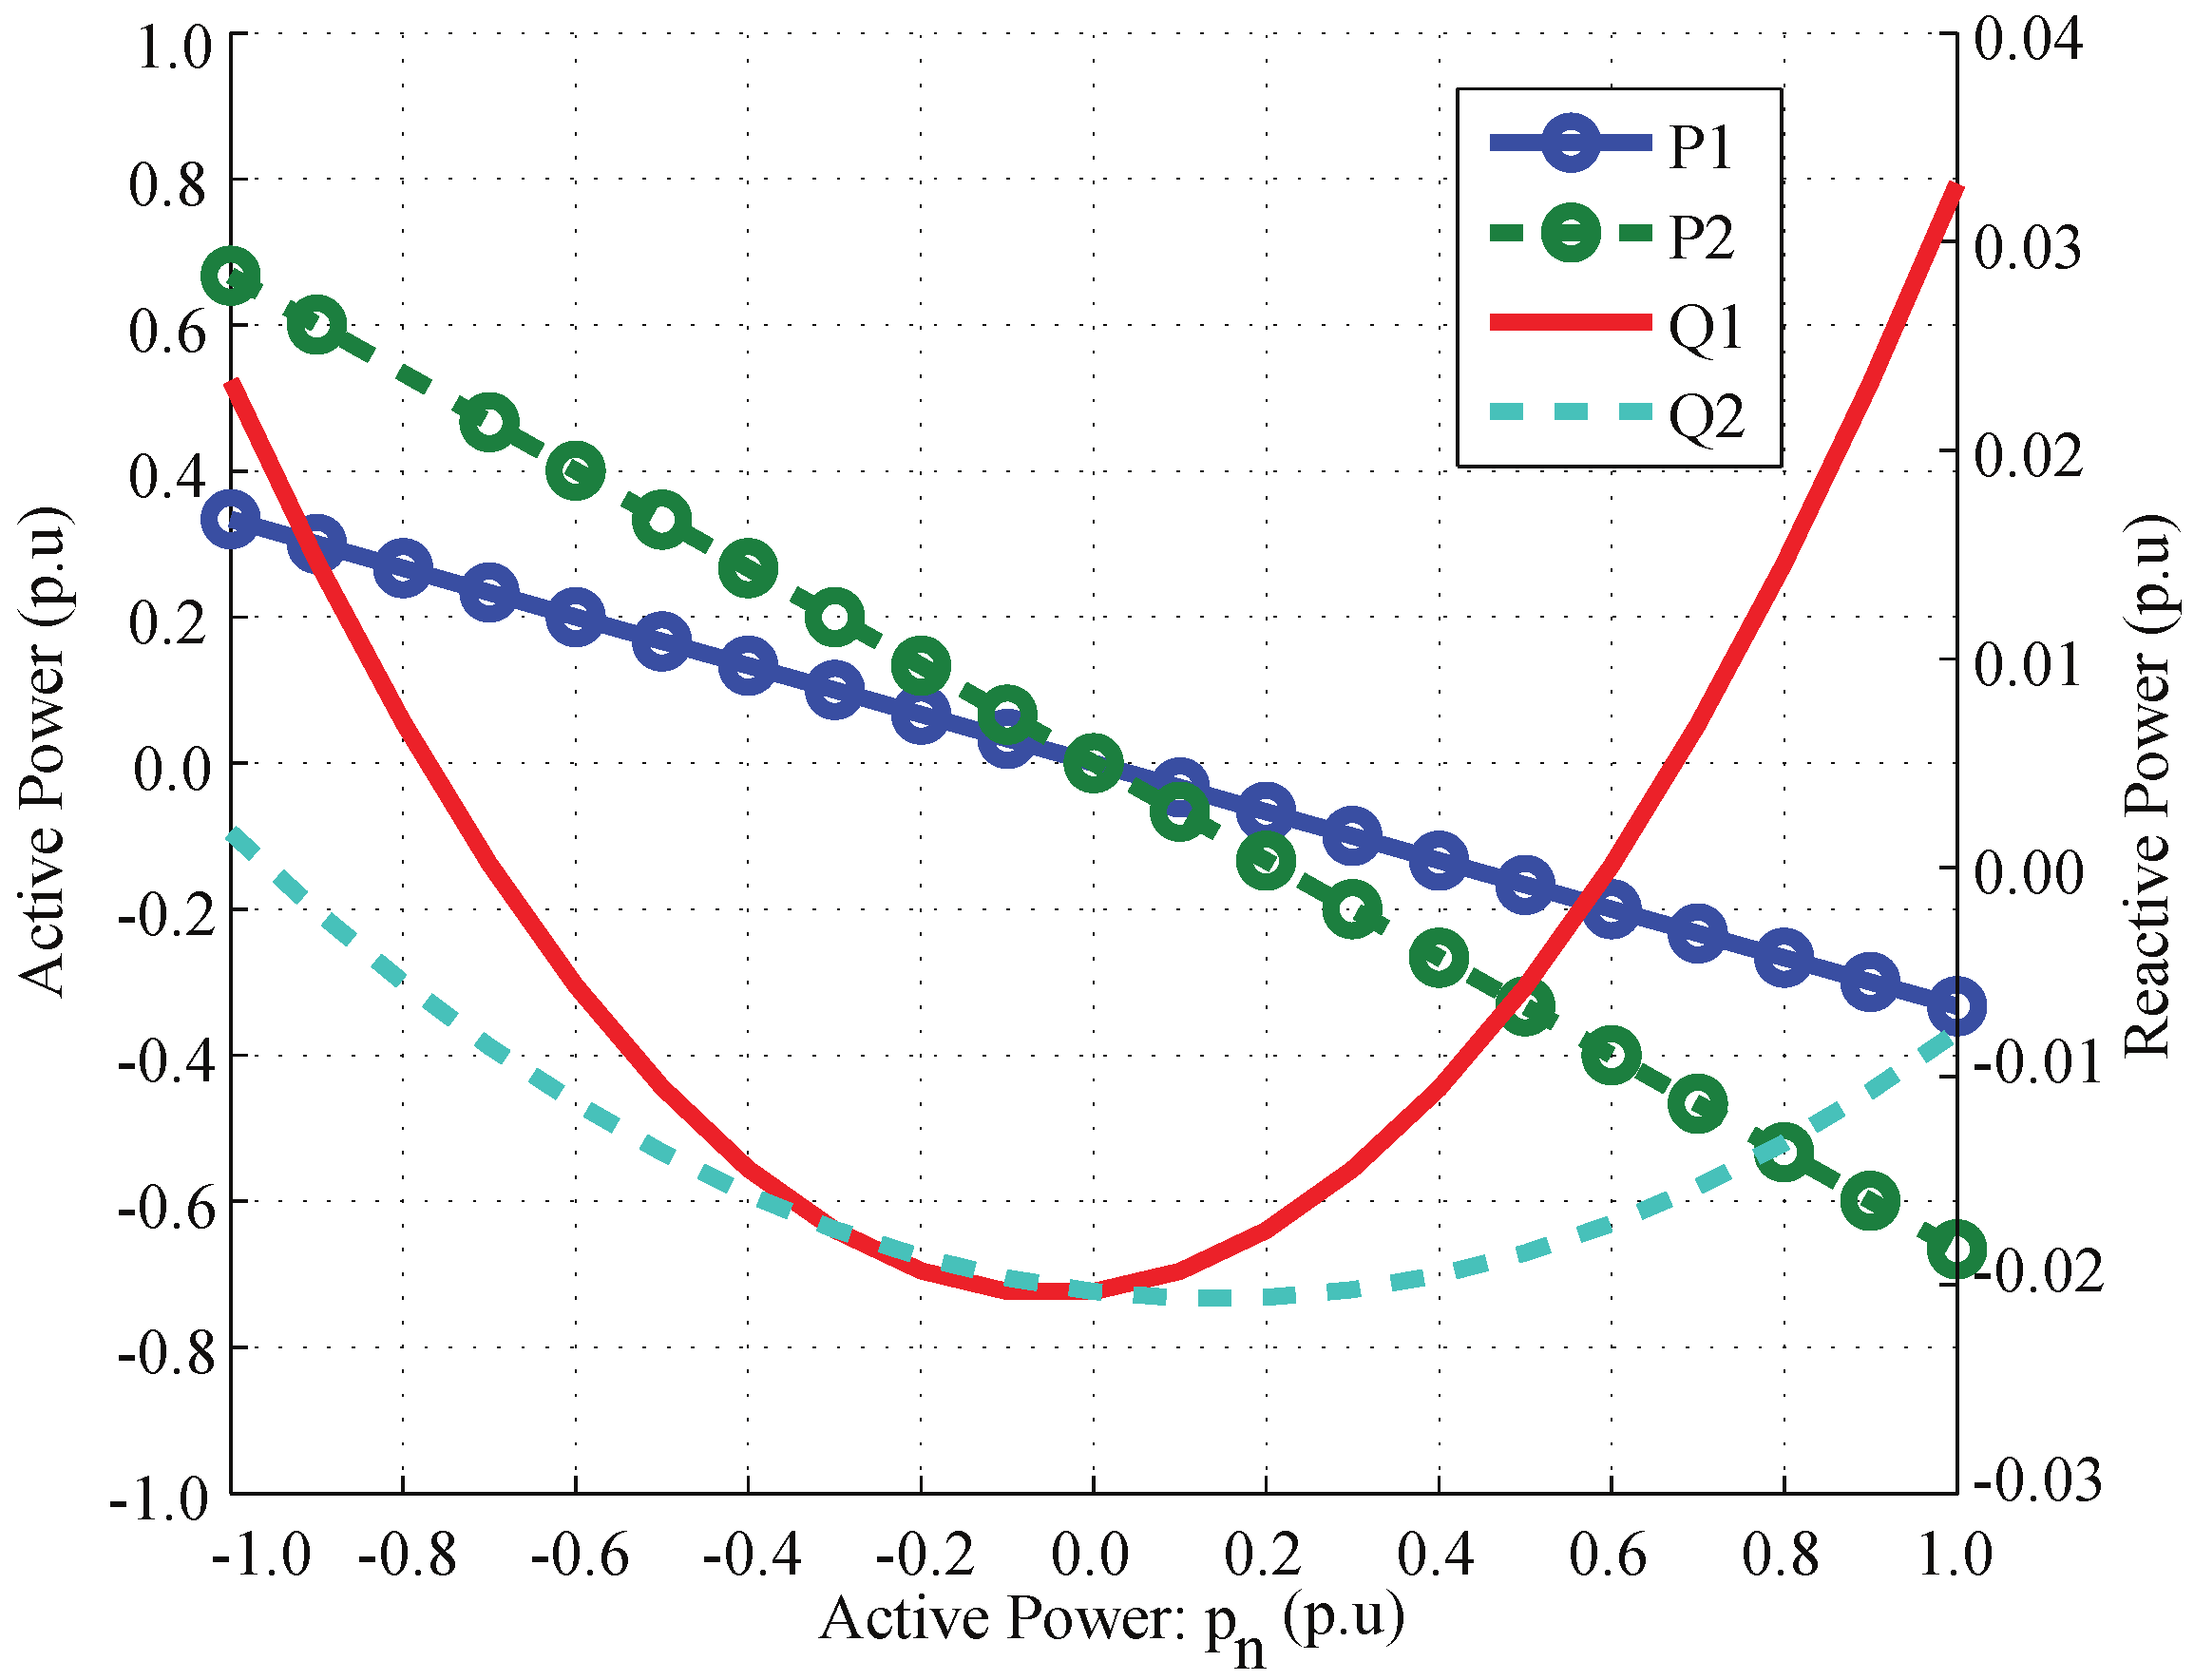
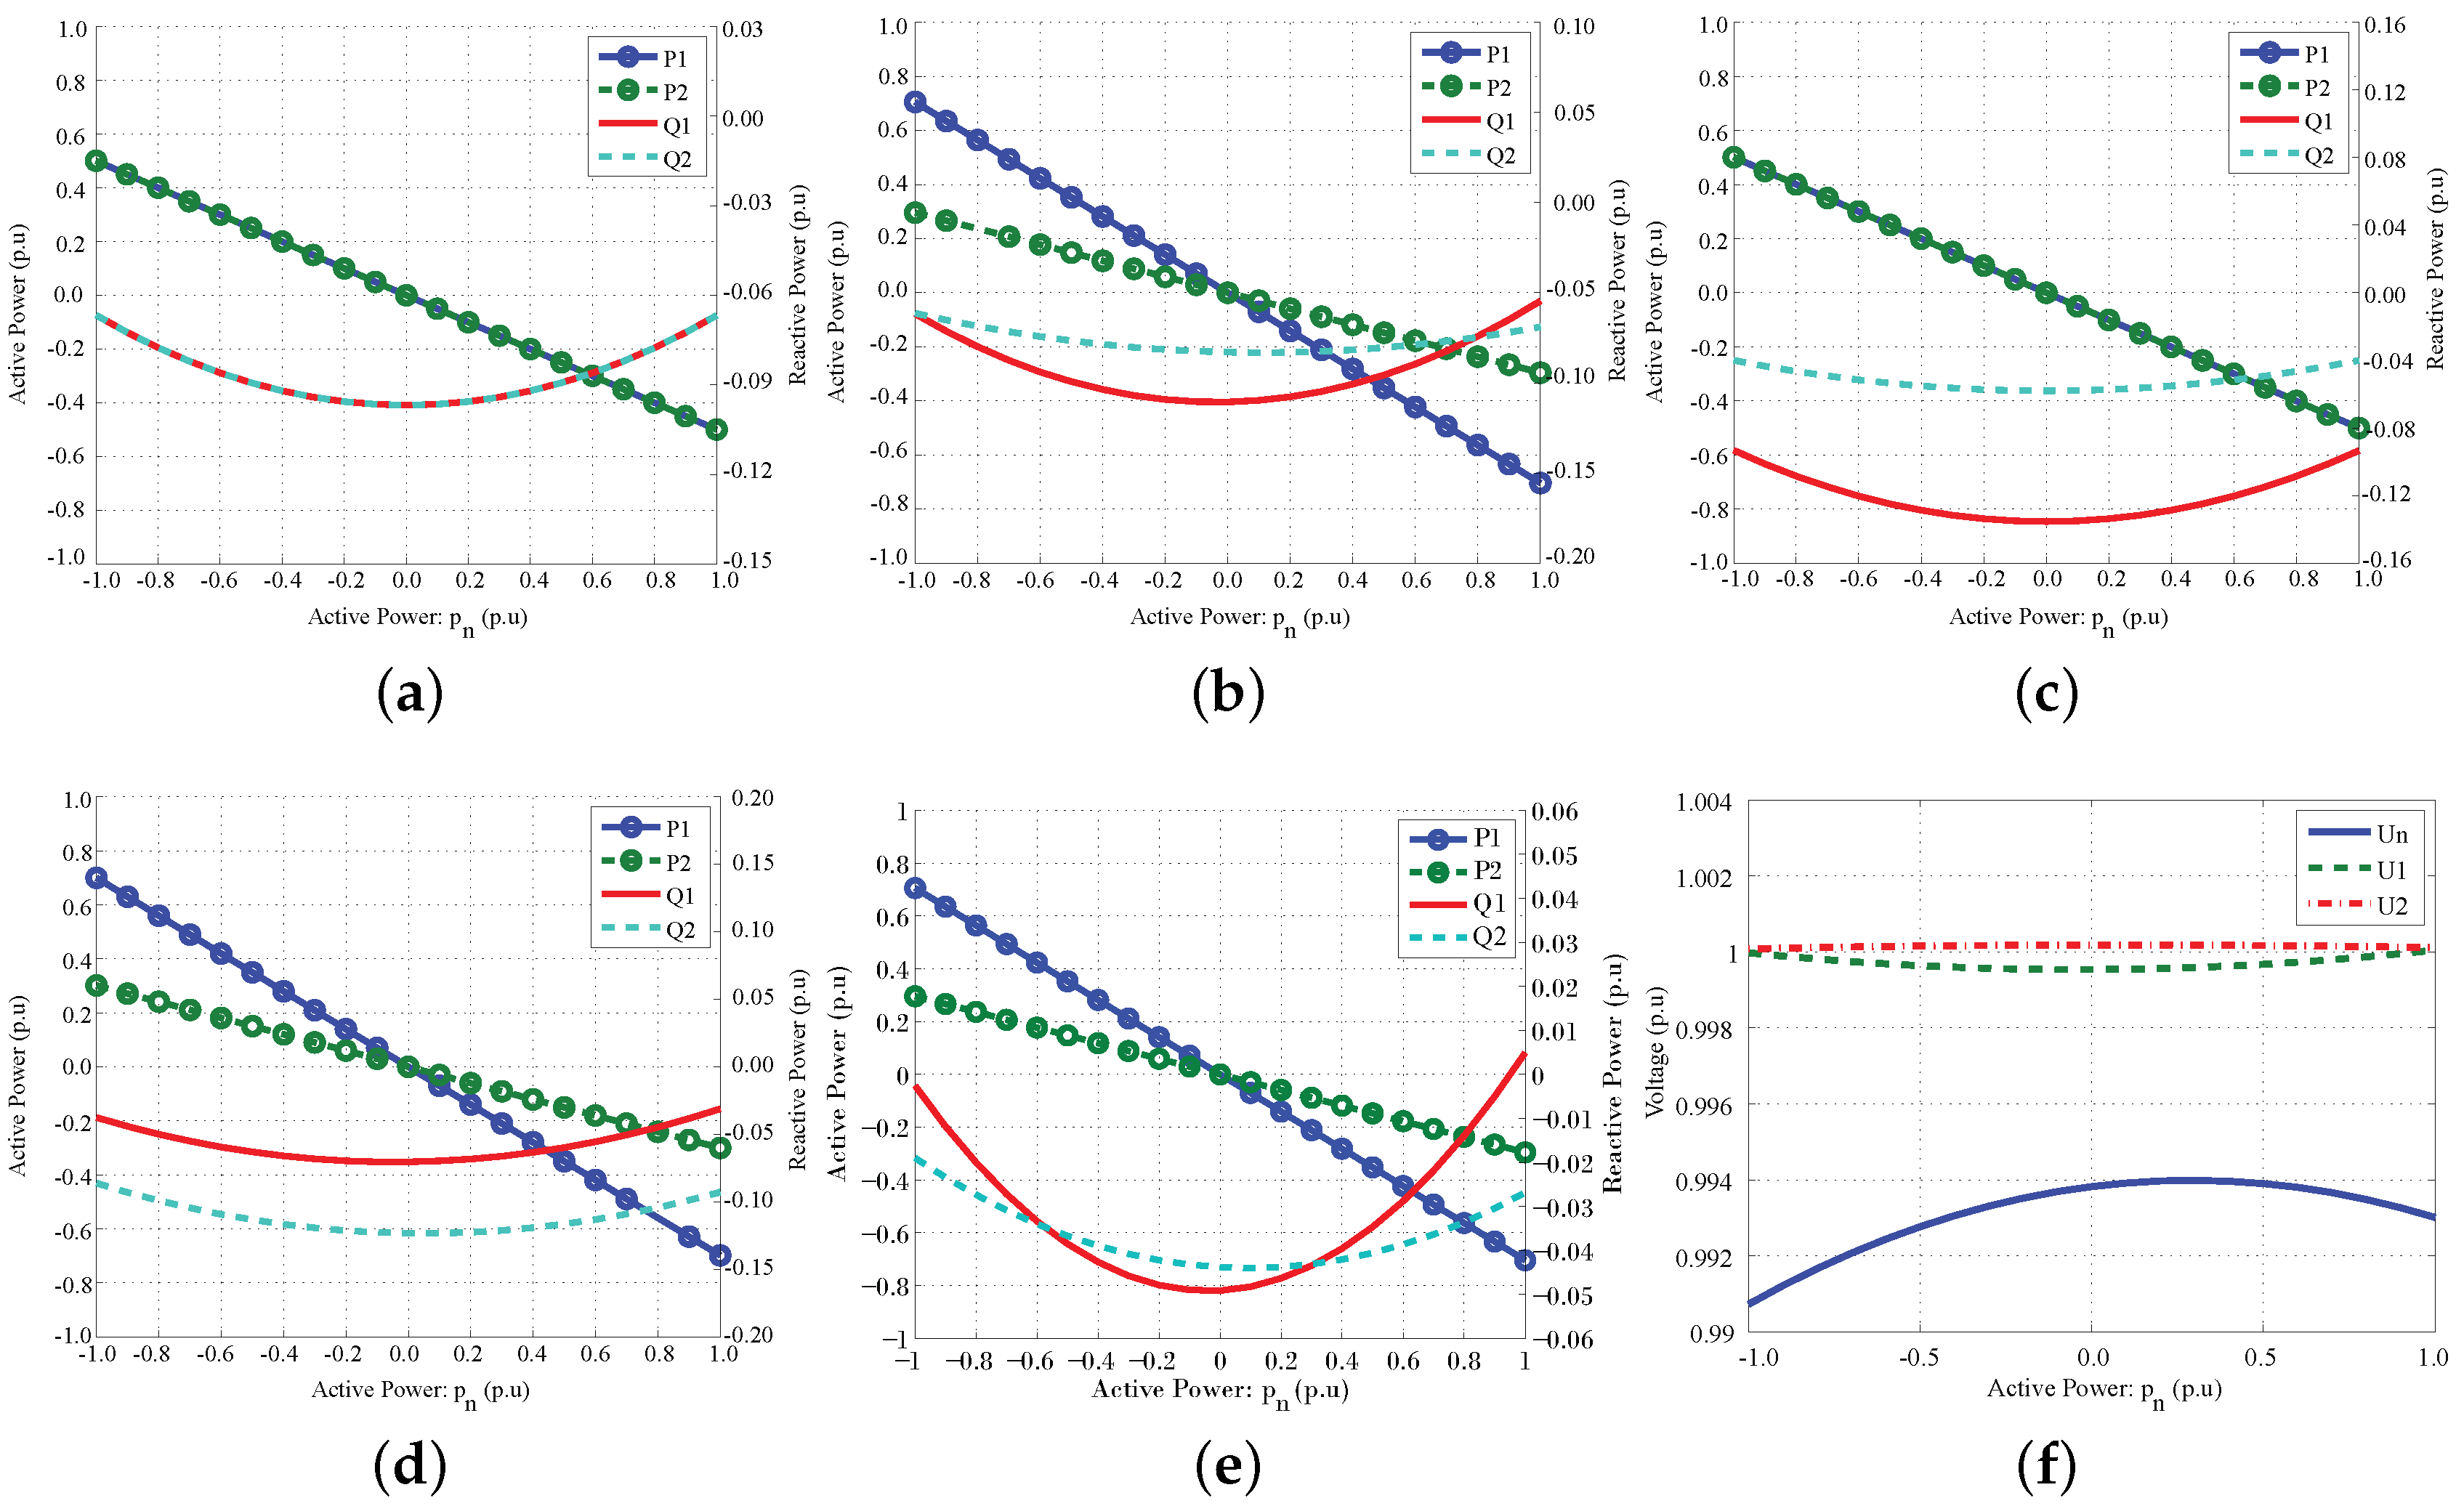
4.1. Steady-State Analysis

Steady-state operating points are analyzed by calculating droop gains at the given power ( p n , q n ) and a series of power flow solutions are plotted with respect to p n , as shown in Figure 8. Power sharing factors ( α , β ) of 30%, 50%, and 70% for VSC-C are considered for analysis. Frequency and voltage constraints are ± 0.02 f n o m and ± 0.05 u n o m , respectively. In Table 2, converter droop values are given for all cases.
Firstly, droop gains are determined to have equal active and reactive power flow in both offshore converters, i.e., α = β = 0.5 . Droop gains are calculated at p n = 0.8 p.u, and q n = 0.0 p.u. Then, using calculated droop gains, power response of converters with respect to active power ( p n ) variation from 1.0 to 1.0 p.u is analyzed by keeping reactive power constant at q n = 0.0 p.u, as shown in Figure 8a. It can be noticed that half of the total active power flows from each converter. However, reactive power demand of the network varies with respect to active power according to (14), but both converters contribute power equally.
Secondly, power sharing ability of the converters at different contribution factors, and the effects of active power contribution on reactive power sharing is evaluated. Power response at α = 0.3 is shown in Figure 8b. At every active power scale, 70% of the p n flows through VSC-A, and 30% through VSC-C. However, despite having equal reactive power sharing criteria i.e., β = 0.5 , both converters do not provide the same reactive power except at which droop gains are calculated, i.e., p n = 0.8 p.u and q n = 0.0 p.u. The result shows that the influence of active power on reactive power must be taken into account while selecting droop gains. Similarly, the response of the system at equal active power but different reactive power contribution is plotted in Figure 8c. Here, reactive power contribution is constant throughout p n variation. Power response at different active and reactive power contribution is shown in Figure 8d. Furthermore, influence of q n at which droop gains are calculated on the reactive power flow can be seen from Figure 8e. It is evident that in all the cases where α 0.5 , the reactive power flow will be according to the required sharing factor only at p n and q n values for which droop gains are calculated. From Figure 8f and Figure 9a, it is clear that the network frequency and busbar voltage level are within the operating limits.
Thirdly, converter power response with respect to q n is presented in Figure 9b,c. In practice, it is not common to have more than 0.92 leading and lagging power factor [17]. However, analysis here has been done to visualize the effect of reactive power contributions on active power sharing with respect to q n variation. It is evident that active power flow is constant, and it is not influenced by the network reactive power demand.

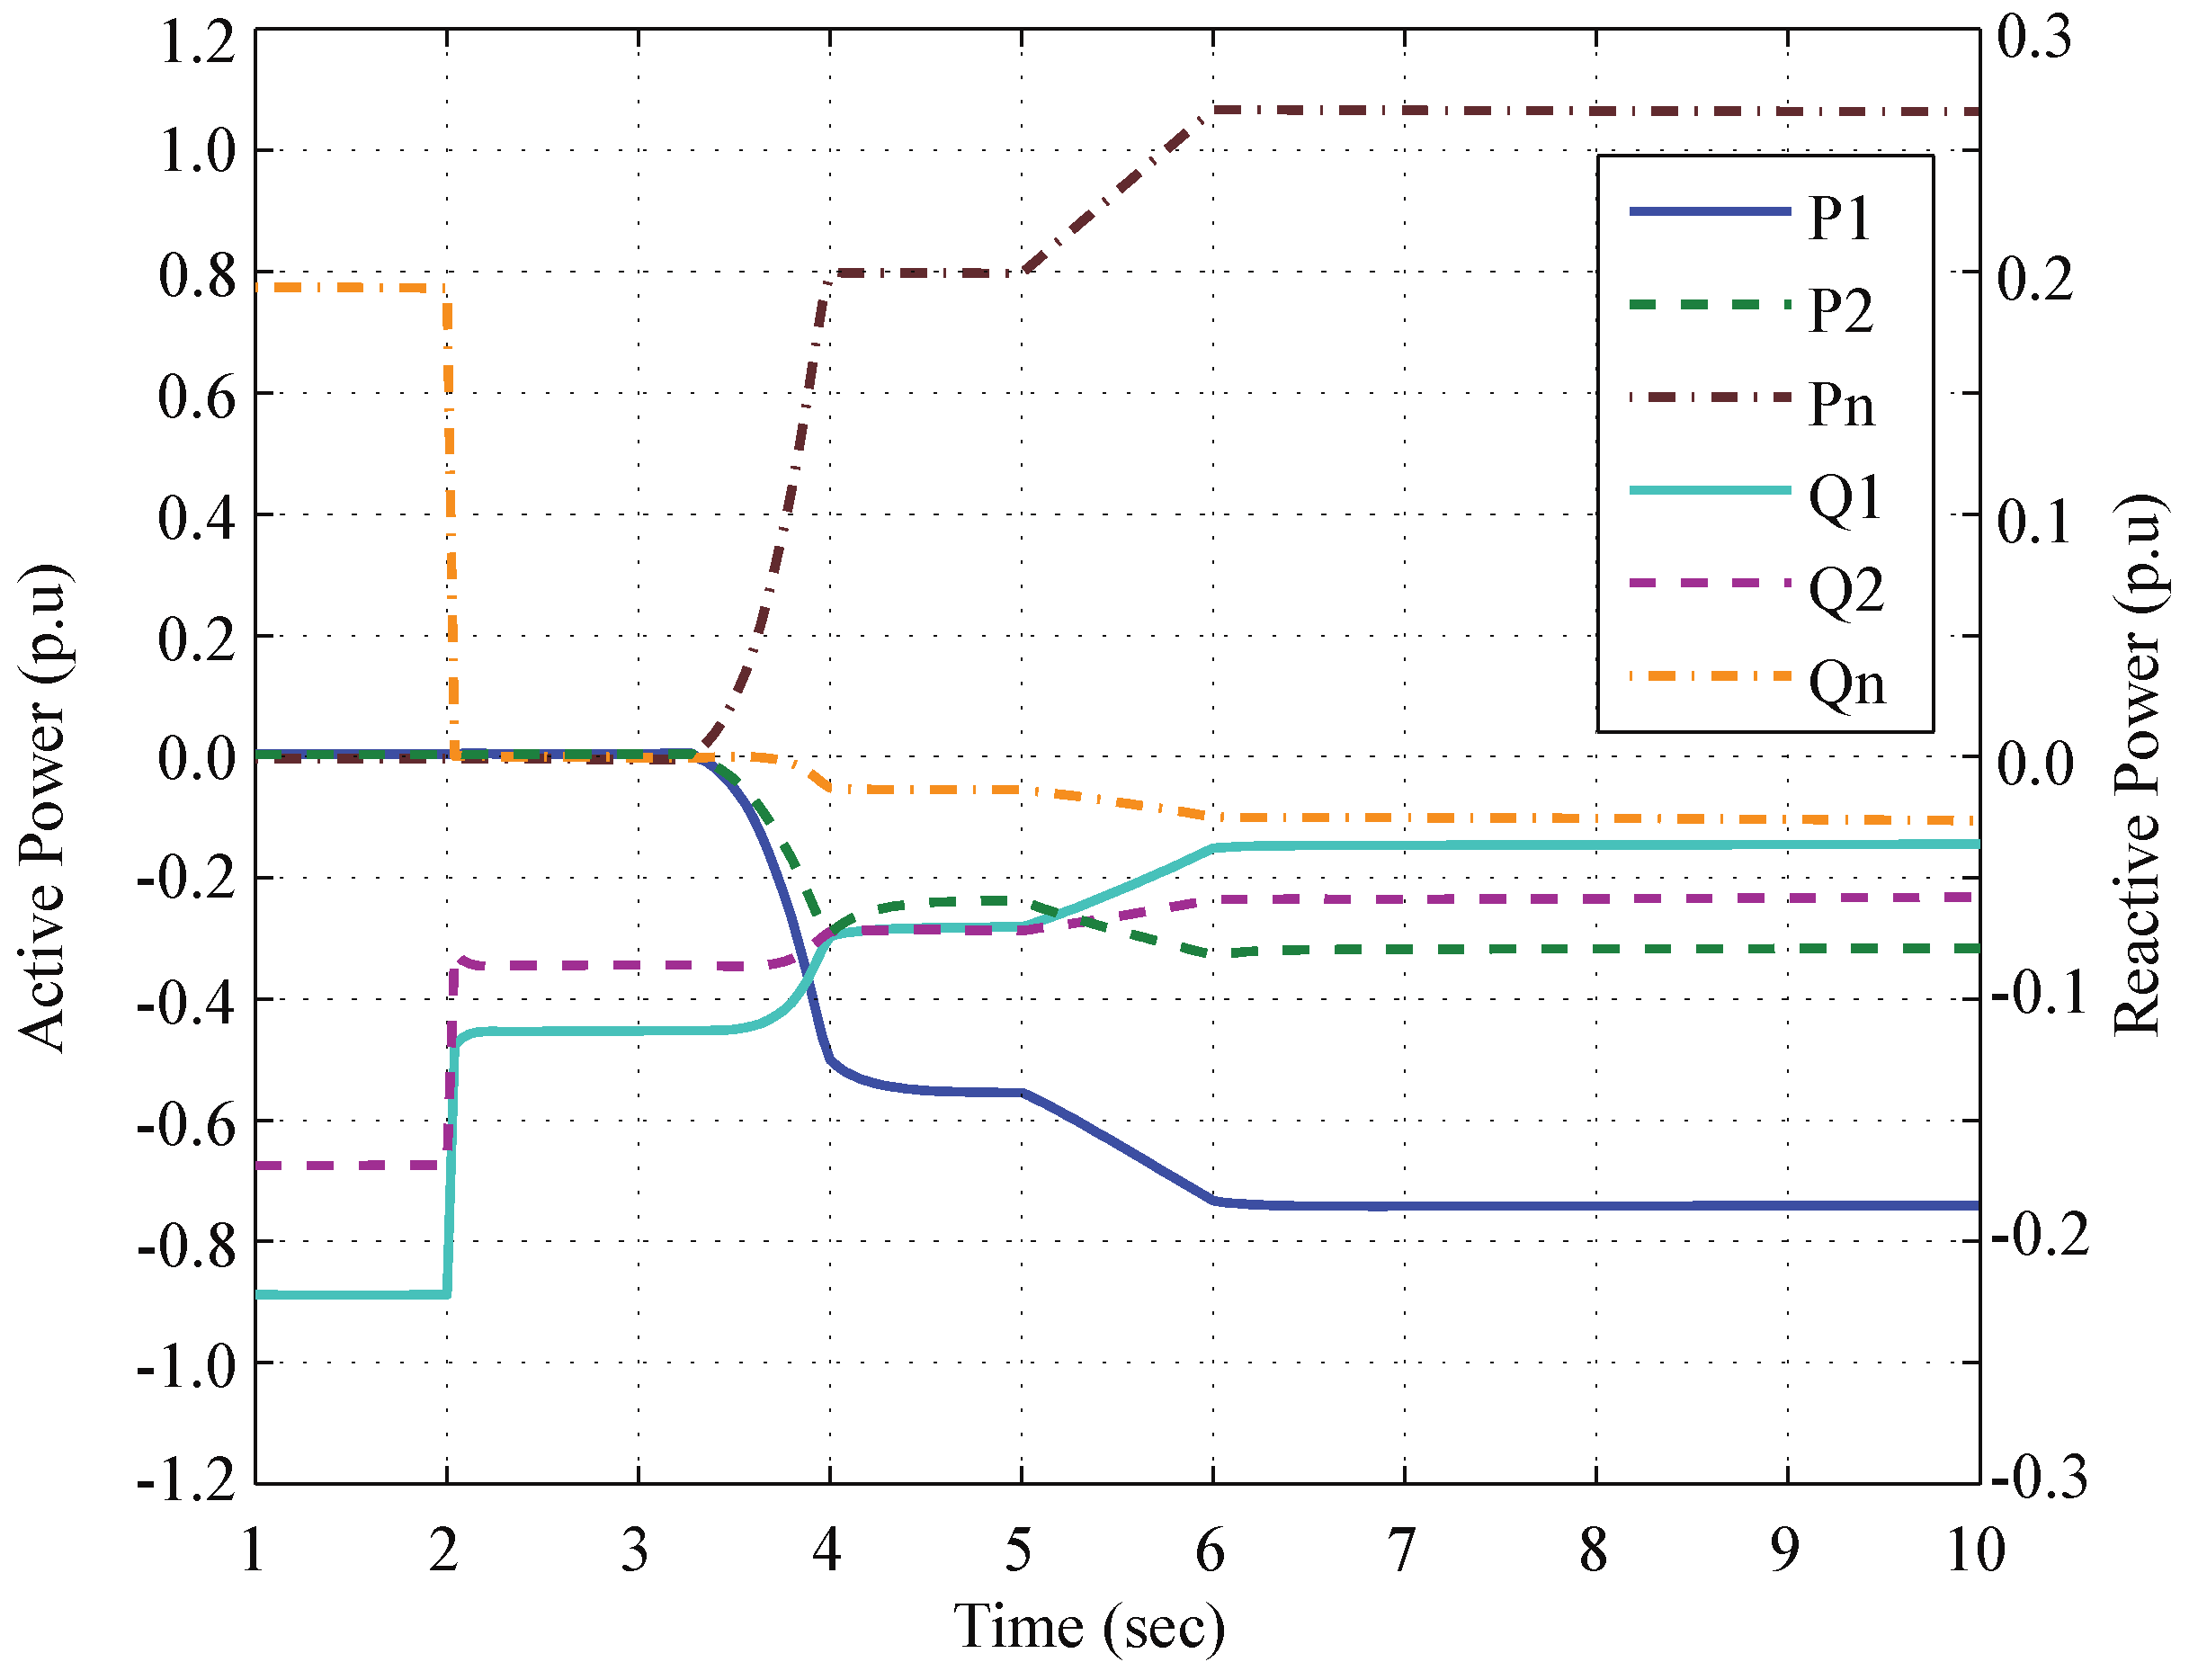
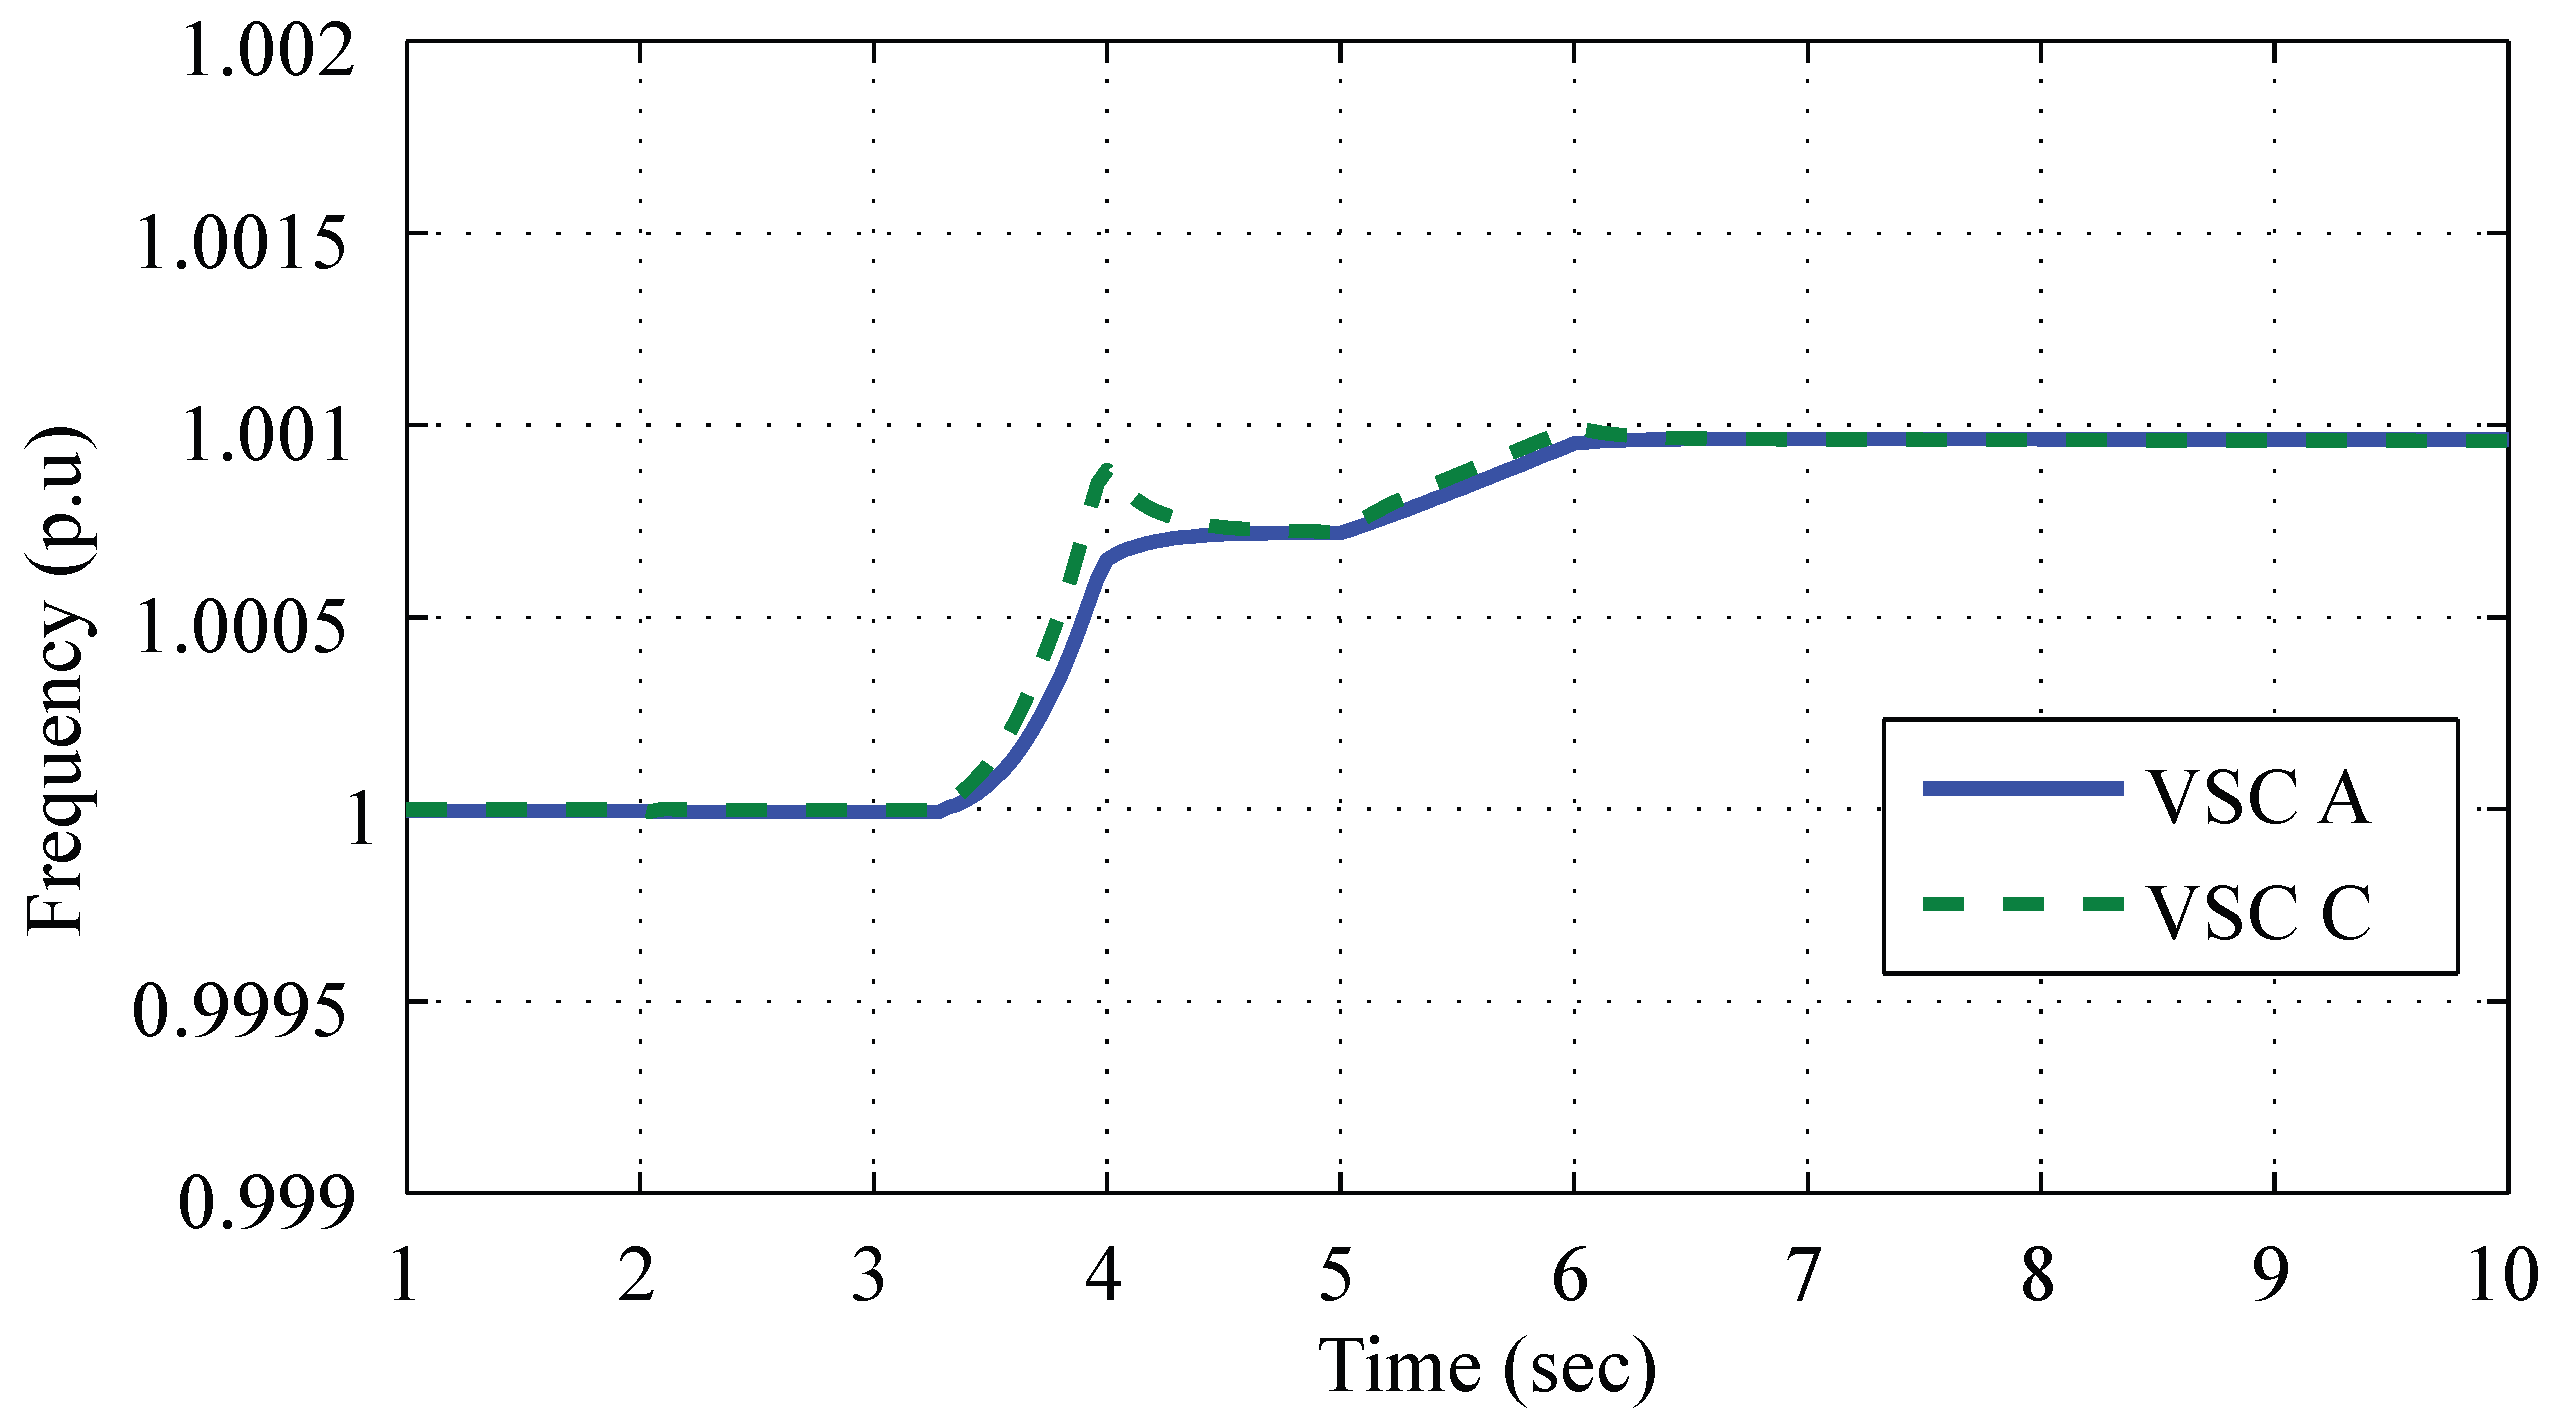
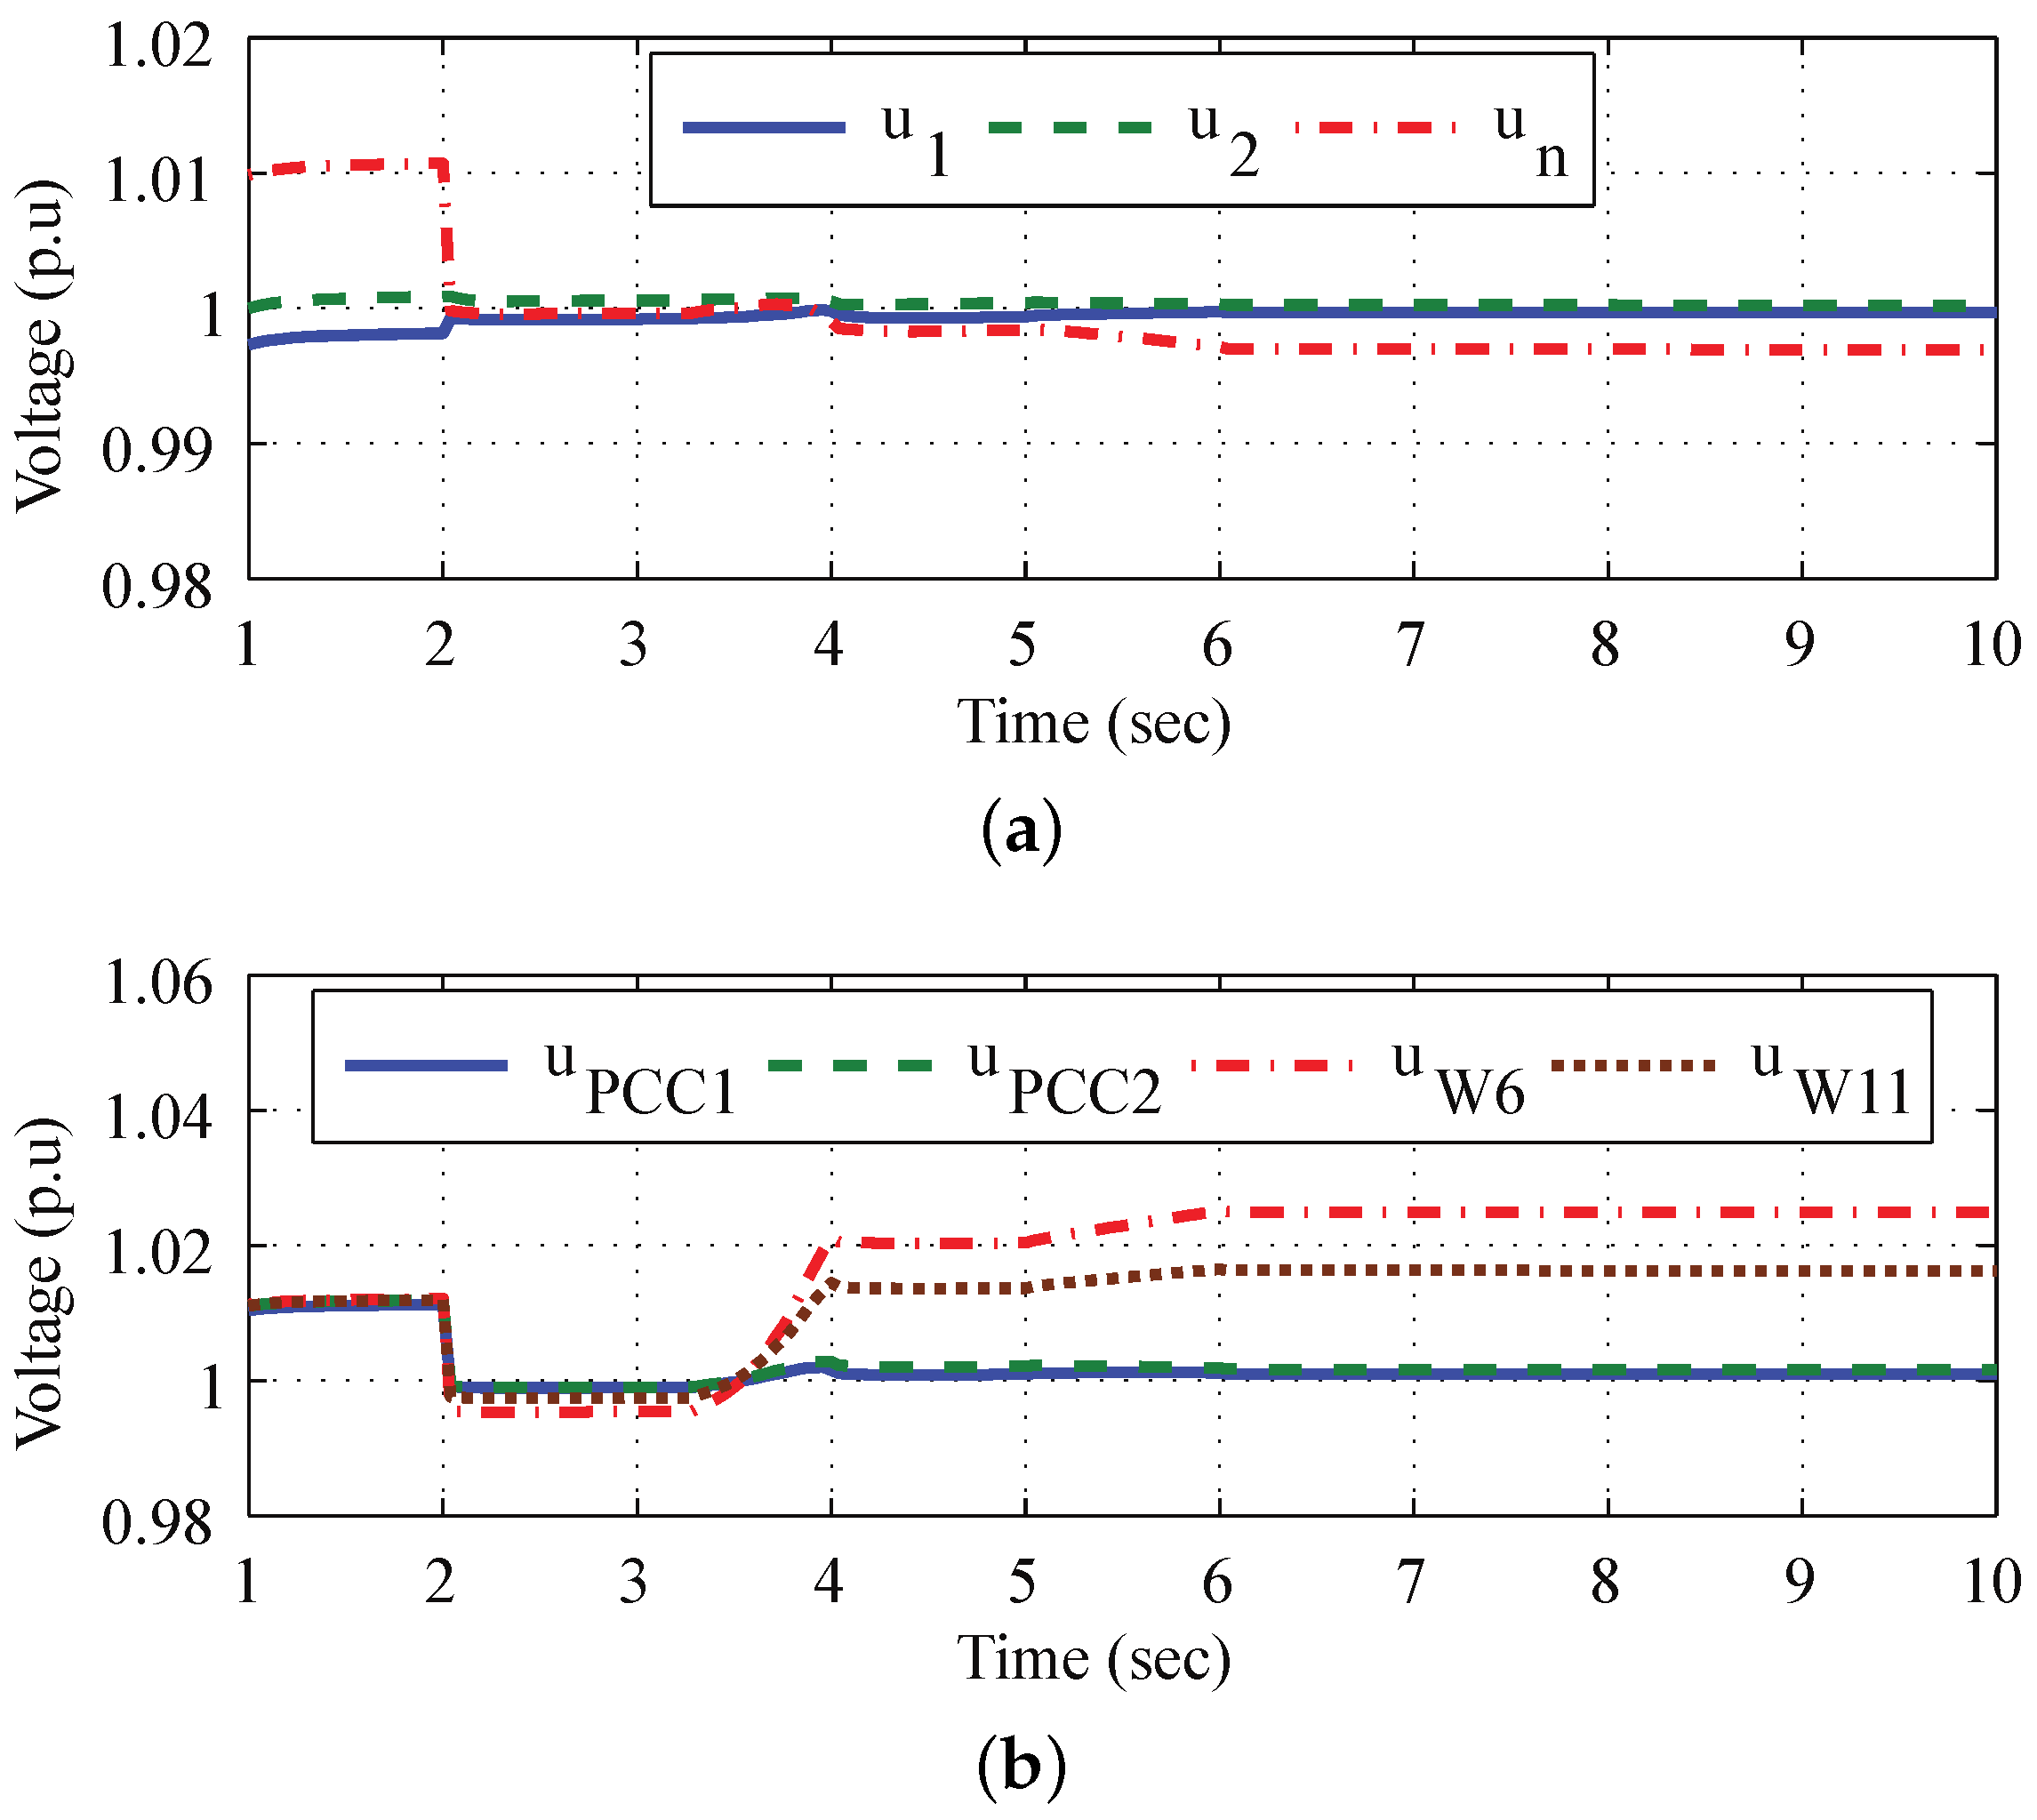
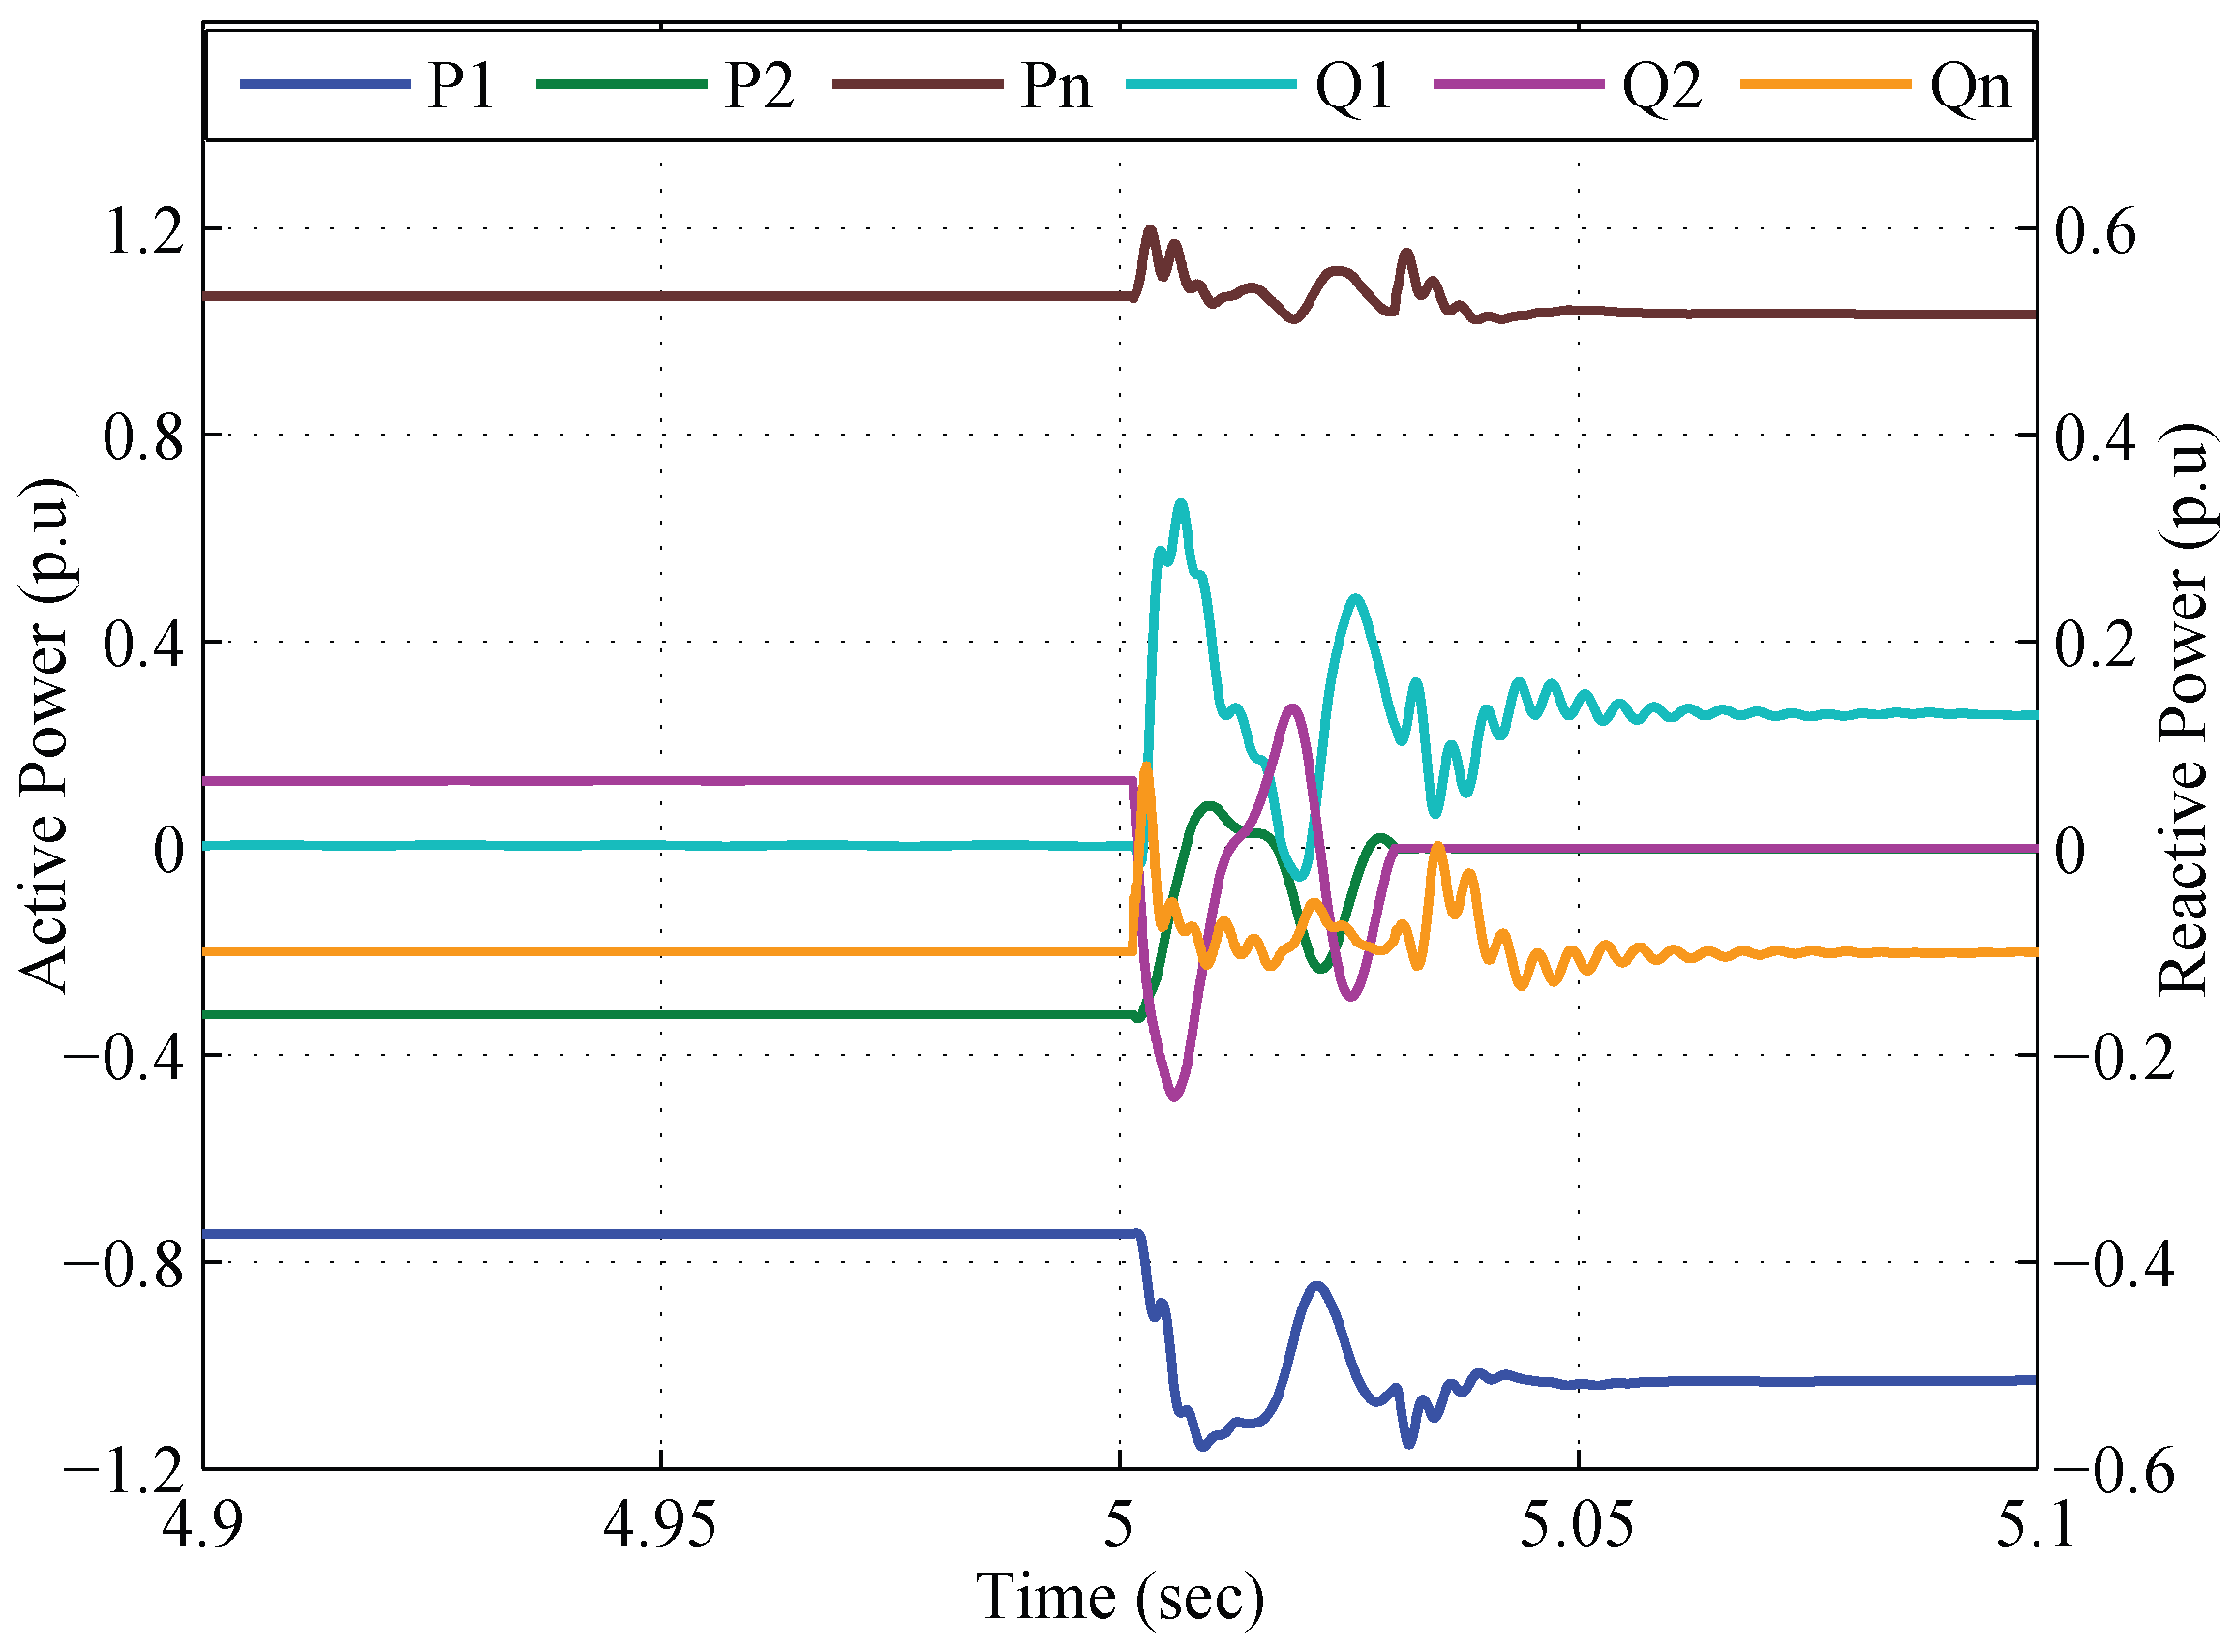
4.2. Time Domain Simulation

The system has been modeled in the Simulink environment (R2013b, MathWorks, Natick, MA, USA) to validate the VSC control scheme. Each transmission system has a total capacity of 500 MVA, and the combined capacity of both wind power plants is 600 MVA. It is clear that at the maximum wind power, power sharing factor that can be set is α = 0.17 minimum or α = 0.83 maximum. Dynamic simulation has been carried out for the second case in which β = 0.5 and α = 0.3 , as shown in Figure 8b.
Initially, wind speed is considered as 0 m/s. In Figure 10, it can be seen that at no wind power, due to submarine cable capacitance, approximately 0.2 p.u capacitive reactive power is injected at an offshore AC hub by the offshore network. A wind turbine with a fully rated converter enables individual active and reactive power control, thus to support the offshore hub voltage, each wind generator unit of both wind power plants are set to supply 0.00168 p.u inductive reactive power. Step change is applied at 2 s in all wind generation units’ reactive power commands to have q n = 0.0 p.u. In the time duration between 2 and 3 s, reactive power sharing is not equal, i.e., q 1 = 0.1133 p.u and q 2 = 0.0862 p.u inductive reactive power. Unequal reactive power sharing is due to different active power sharing factors, and the results can be compared with the steady-state analysis.
At 3 s, step change in wind speed from 0 to 9.3 m/s in WPP1 and from 0 to 10 m/s in WPP2 is applied. Each turbine of WPP1 and WPP2 is now generating 3.78 MW and 4.2 MW, respectively. The net wind energy infeed at an offshore AC hub is 400 MW, i.e., p n = 0.8 p.u. Both converters are now sharing reactive power equally, i.e., 0.0714 p.u. In addition, VSC-A is consuming approximately 0.553 p.u and VSC-C 0.24 p.u active power, which is according to the design criteria. Next, at 5 s, wind speed is changed to 11 m/s for all wind turbines. Each wind turbine is now generating 5.5 MW. The net wind power infeed at the offshore hub is 540 MW, which is greater than a single HVDC transmission system’s capacity. However, all of the wind energy can be transferred onshore if 0.07 α 0.93 . In the simulation at p n = 1.08 p.u, VSC-A is transferring 0.757 p.u and VSC-C 0.317 p.u active power to the grids.
The response of frequencies imposed by the offshore converters is shown in Figure 11. It is clear that the system response is stable and both converter frequencies converge at the same value. The steady-state frequency is then required to bring it back at the nominal value through tertiary control. It can be seen from dynamic voltage response of converter substations shown in Figure 12a that the difference in the voltage of both converter reference signals is small, which enables the sharing of reactive power between converters according to designed criteria. In addition, the dynamic responses of wind turbine WT6 and WT11 busbar voltages, and point-of-common-coupling (PCC) busbar voltages are shown in Figure 12b.
The steady-state voltage levels within the wind power plant are shown in Figure 13, which are within the designed limits. Power flow direction is considered positive if it injects power into the bus.
Furthermore, a study has been performed for the case in which a VSC-C HVDC transmission line is disconnected from the offshore AC hub. In such a situation, if total wind energy at the moment of disconnection of a transmission line is less than the maximum capacity of an in-operation (i.e., VSC-A) transmission system, then all power will be transferred by a VSC-A transmission system. However, if the wind power generation exceeds transmission capacity, then it is necessary for the wind turbine to reduce its generation to restrict it to maximum capacity of the in-operational transmission system. This behavior is demonstrated in Figure 14. This analysis has been carried out at α = 0.3 , and β = 0.7 . The steady-state analysis of this case study is shown in Figure 8e. The net wind power infeed at the instant when both transmission systems are in-operation is equal to 1.08 p.u ( p n ), At 5 sec, VSC-C is disconnected from the offshore AC hub at the transformer end. It can be seen that the VSC-A stabilizes the system by transferring all of the received power onshore. However, the net power is more than VSC-A capacity; therefore, wind turbines have to reduce generation up to VSC-A maximum capacity limits.

5. Conclusions

In this article, a voltage source converter control system is proposed to interconnect an offshore AC hub with two onshore grids. Offshore network frequency and reference voltage is controlled by both offshore side converters. Controlling offshore network frequency and reference voltage with more than one converter provides redundancy in having reference machines in the network. An alternative configuration to transfer net energy from the offshore AC hub to two grids is by formulating a three terminal DC network. However, in a three terminal DC network, the capacity of the offshore converter should be equal to or higher than the net energy in the network, and it also does not provide any redundancy to operate an offshore network in case of a fault in the main converter. Furthermore, the advantage of the proposed configuration is not to have a DC circuit breaker, and the protection scheme can be done via conventional AC protection methods. Furthermore, the net energy in the offshore network can be higher than a single HVDC transmission capacity.
Voltage and frequency droop control enables the power sharing between two transmission systems. However, changing VSC frequency reference can deviate network steady-state operating frequency from its nominal value. A tertiary control system is required to bring network steady-state frequency to its nominal value.
Moreover, a method of selecting droop gains at a desired power contribution factor considering frequency and voltage limits have been presented and discussed. Droop control introduces an additional closed loop path of active and reactive power, thereby introducing additional stability issues. Higher droop gain could cause voltage instability. Unoptimized droop gain selection could cause reactive power flow from one VSC-HVDC system to another, which could lead to high voltages in the network. The proposed method provides the optimized droop gains while keeping the network voltage profile within operational limits.
Results of the time domain simulation validate the developed control scheme. The presented method can be extended for reactive power management in the offshore wind power plants.

Acknowledgments

The research leading to these results has received funding from the People Programme (Marie Curie Actions) of the European Union’s Seventh Framework Programme (FP7/2007–2013) under Research Executive Agency (REA) grant agreement n317221.

Author Contributions

All authors contribute equally in the presented research.

Conflicts of Interest

The authors declare no conflict of interest.

Abbreviations

The following abbreviations are used in this manuscript:
ACAlternating Current
DCDirect Current
EUEuropean Union
EWEAEuropean Wind Energy Association
HVDCHigh Voltage Direct Current
LCCLine Commutated Converter
MMCModular Multi-level Converters
PCCPoint of Common Coupling
VSCVoltage Source Converter
WPPWind Power Plant
WTWind Turbine
WTagWind Turbine Aggregated Model

References

  1. Pineda, I.; Ruby, K.; Ho, A.; Mbistrova, A.; Corbetta, G. The European Offshore Wind Inductry: Key Trends and Statistics 2015; Technical Report; European Wind Energy Association: Brussels, Belgium, 2016. [Google Scholar]
  2. Fichaux, N.; Wilkes, J. Oceans of Opportunity. Harnessing Europe’s Largest Domestic Energy Resource; Technical Report; European Wind Energy Association: Brussels, Belgium, 2009. [Google Scholar]
  3. Sellick, R.; Åkerberg, M. Comparison of HVDC light (VSC) and HVDC classic (LCC) site aspects, for a 500 MW 400 kV HVDC transmission scheme. In Proceedings of the 10th IET International Conference on AC and DC Power Transmission (ACDC 2012), Birmingham, UK, 4–5 December 2012; Institution of Engineering and Technology: Stevenage, UK, 2012. [Google Scholar]
  4. Glasdam, J.; Hjerrild, J.; Kocewiak, L.H.; Bak, C.L. Review on multi-level voltage source converter based HVDC technologies for grid connection of large offshore wind farms. In Proceedings of the 2012 IEEE International Conference on Power System Technology (POWERCON), Auckland, New Zealand, 30 October–2 November 2012.
  5. De Decker, J.; Kreutzkamp, P.; Woyte, A.; Dierckxsens, C. The impact of large scale offshore electricity transmission: The European project offshore grid. In Proceedings of the 2012 9th International Conference on the European Energy Market, Florence, Italy, 10–12 May 2012.
  6. Rokrok, E.; Golshan, M. Adaptive voltage droop scheme for voltage source converters in an islanded multibus microgrid. IET Gener. Transm. Distrib. 2010, 4, 562–578. [Google Scholar] [CrossRef]
  7. Zhang, L.; Harnefors, L.; Nee, H.P. Modeling and control of VSC HVDC links connected to island systems. IEEE Trans. Power Syst. 2011, 26, 783–793. [Google Scholar] [CrossRef]
  8. Karlsson, P.; Bjornstedt, J.; Strom, M. Stability of voltage and frequency control in distributed generation based on parallel-connected converters feeding constant power loads. In Proceedings of the IEEE 2005 European Conference on Power Electronics and Applications, Dresden, Germany, 11–14 September 2005.
  9. Raza, M.; Gomis-Bellmunt, O. Multi infeed control of VSC HVDC transmission system for offshore wind power plant integration. In Proceedings of the 13th International Workshop on Large-Scale Integration of Wind Power into Power Systems as well as on Transmission Networks for Offshore Wind Plants, Berlin, Germany, 11–13 November 2014.
  10. Hu, X.; Liang, J.; Rogers, D.J.; Li, Y. Power flow and power reduction control using variable frequency of offshore AC grids. IEEE Trans. Power Syst. 2013, 28, 3897–3905. [Google Scholar] [CrossRef]
  11. Hassanzahraee, M.; Bakhshai, A. Transient droop control strategy for parallel operation of voltage source converters in an islanded mode microgrid. In Proceedings of the 2011 IEEE 33rd International Telecommunications Energy Conference (INTELEC), Amsterdam, The Netherlands, 9–13 October 2011.
  12. Liu, H.; Chen, Z. Contribution of VSC-HVDC to Frequency Regulation of Power Systems with Offshore Wind Generation. IEEE Trans. Energy Convers. 2015, 30, 918–926. [Google Scholar] [CrossRef]
  13. Morren, J.; de Haan, S.W.H.; Kling, W.L.; Ferreira, J.A. Wind turbines emulating inertia and supporting primary frequency control. IEEE Trans. Power Syst. 2006, 21, 433–434. [Google Scholar] [CrossRef]
  14. Liu, Y.; Lin, J.; Wu, Q.H.; Zhou, X. Frequency Control of DFIG based Wind Power Penetrated Power Systems Using Switching Angle Controller and AGC. IEEE Trans. Power Syst. 2016. [Google Scholar] [CrossRef]
  15. Conroy, J.; Watson, R. Aggregate modelling of wind farms containing full-converter wind turbine generators with permanent magnet synchronous machines: Transient stability studies. IET Renew. Power Gener. 2009, 3, 39–52. [Google Scholar] [CrossRef]
  16. Raza, M.; Gomis-Bellmunt, O. Control design strategy to enhance fault right through capability of vsc hvdc transmission system interconnecting offshore wind power plant. In Proceedings of the European Wind Energy Association Annual Conference (EWEA), Paris, France, 17–20 November 2015.
  17. Raza, M.; Gomis-Bellmunt, O. Dynamic modelling and implementation of vsc hvdc system: The grid connected large offshore wind power plant application. In Proceedings of the 3rd International Conference on Smart Grids and Green IT Systems, Barcelona, Spain, 3–4 April 2014.
Figure 1. Network configuration to transfer offshore wind energy to different countries using VSC-HVDC.
Energies 09 00826 g001
Figure 2. Offshore wind power plant layout and connection with the offshore AC hub.
Energies 09 00826 g002
Figure 3. Equivalent wind turbine model.
Energies 09 00826 g003
Figure 4. Configuration of VSC-HVDC transmission system to interconnect the offshore AC hub with the grid.
Energies 09 00826 g004
Figure 5. Control block diagram of an offshore side converter.
Energies 09 00826 g005
Figure 6. Offshore AC hub equivalent diagram for droop gain calculation.
Energies 09 00826 g006
Figure 7. Power response of VSC with droop characteristics.
Energies 09 00826 g007
Figure 8. Steady-state response of the network power and voltage level with respect to the p n at several power contribution factors: (a) p n = 0 . 8 p.u, q n = 0 . 0 p.u, α = β = 0 . 5 ; (b) p n = 0 . 8 p.u, q n = 0 . 0 p.u, α = 0 . 3 , β = 0 . 5 ; (c) p n = 0 . 8 p.u, q n = 0 . 0 p.u, α = 0 . 5 , β = 0 . 3 ; (d) p n = 0 . 8 p.u, q n = 0 . 0 p.u, α = 0 . 3 , β = 0 . 7 ; (e) p n = 0 . 8 p.u, q n = 0 . 1 p.u, α = 0 . 3 , β = 0 . 7 ; (f) p n = 0 . 8 p.u, q n = 0 . 1 p.u, α = 0 . 3 , β = 0 . 7 .
Energies 09 00826 g008
Figure 9. Steady-state response of the converter power with respect to q n (b,c), and frequency variation with respect to p n (a). (a) p n = 0 . 8 p . u , q n = 0 . 1 p . u , α = 0 . 3 , β = 0 . 7 ; (b) p n = 0 . 8 p . u , q n = 0 . 1 p . u , α = 0 . 5 , β = 0 . 7 ; (c) p n = 0 . 8 p . u , q n = 0 . 1 p . u , α = 0 . 3 , β = 0 . 7 .
Energies 09 00826 g009
Figure 10. Response of power flow in an offshore network subjected to varying wind speeds.
Energies 09 00826 g010
Figure 11. Frequency response of offshore side converters.
Energies 09 00826 g011
Figure 12. Voltage responses of (a) converter substation busbars and (b) wind power plant busbars.
Energies 09 00826 g012
Figure 13. Steady-state voltage level within the wind power plant.
Energies 09 00826 g013
Figure 14. Power response of converter substations when the VSC-C transmission system is disconnected.
Energies 09 00826 g014
Table 1. Voltage source converter based high voltage direct current transmission system parameters.
Network ParametersValueUnit
Converter rated power500MVA
Offshore ac hub rated voltage150kV
Onshore grid rated voltage400kV
Converter station rated voltage220kV
DC rated voltage level ± 200 kV
DC filter capacitance33 μ F
DC cable resistance19mΩ/km
DC cable length250km
Series inductance55mH
Series resistance 0 . 5
Shunt capacitance 3 . 29 μ F
Transformer impedance u k 12%
Transformer copper losses1100kW
Table 2. Steady-state analysis: droop gains.
Figure No. k f 1 k f 2 k u 1 k u 2
8a 0 . 0010 0 . 0010 0 . 0000 0 . 0000
8b 0 . 0021 0 . 0050 0 . 0175 0 . 0175
8c 0 . 0010 0 . 0010 0 . 0351 0 . 0819
8d 0 . 0068 0 . 0158 0 . 0527 0 . 0226
8e,f, 9a 0 . 0013 0 . 0031 0 . 0095 0 . 0041
9b 0 . 0010 0 . 0010 0 . 0814 0 . 0349
9c 0 . 0013 0 . 0031 0 . 0095 0 . 0041

